Embed Size (px)
Citation preview
. . . . . . . . . . . . . . . . . . . . . . . . .
. . . . . . . . . . . . . . . . . . . . . . . . .
. . . . . . . . . . . . . . . . . . . . . . . . .
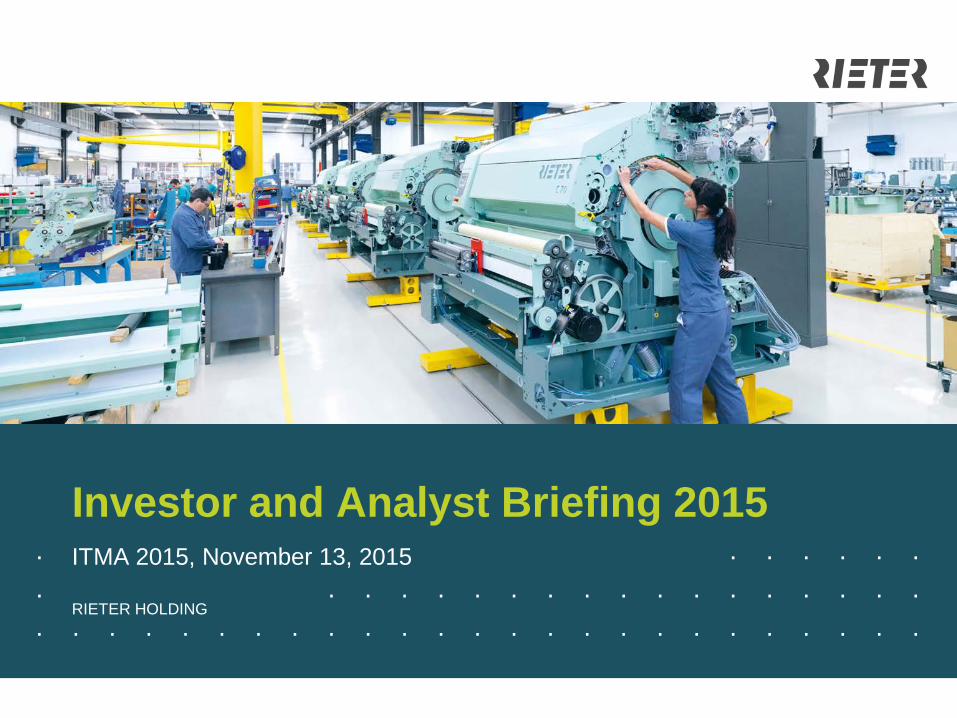
Investor and Analyst Briefing 2015 ITMA 2015, November 13, 2015
RIETER HOLDING
Investor & Analyst Briefing November 2015 2
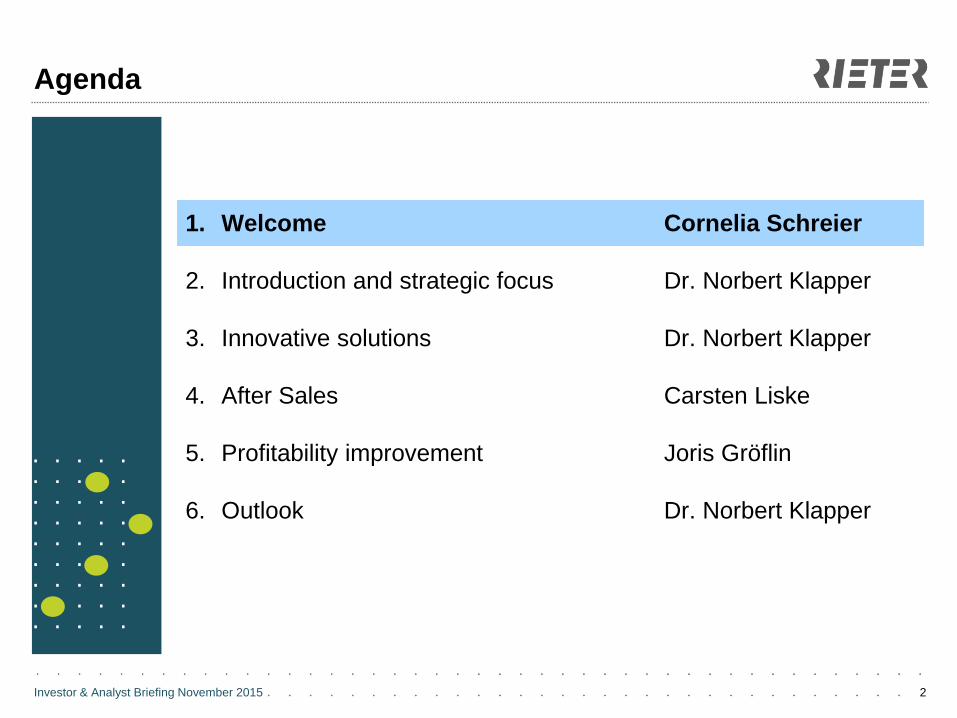
Agenda
1. Welcome Cornelia Schreier
2. Introduction and strategic focus Dr. Norbert Klapper
3. Innovative solutions Dr. Norbert Klapper
4. After Sales Carsten Liske
5. Profitability improvement Joris Gröflin
6. Outlook Dr. Norbert Klapper
. . . . .
. . . . .
. . . . .
. . . . .
. . . . .
. . . . .
. . . . .
. . . . .
. . . . .
Investor & Analyst Briefing November 2015 3
Welcome and schedule
• 13.10 – 13.15 Welcome
• 13.15 – 13.45 Presentation
• 13.45 – 14.15 Q&A
• 14.15 – 15.00 Booth tour
Investor & Analyst Briefing November 2015 4
Agenda
1. Welcome Cornelia Schreier
2. Introduction and strategic focus Dr. Norbert Klapper
3. Innovative solutions Dr. Norbert Klapper
4. After Sales Carsten Liske
5. Profitability improvement Joris Gröflin
6. Outlook Dr. Norbert Klapper
. . . . .
. . . . .
. . . . .
. . . . .
. . . . .
. . . . .
. . . . .
. . . . .
. . . . .
Investor & Analyst Briefing November 2015
14
5
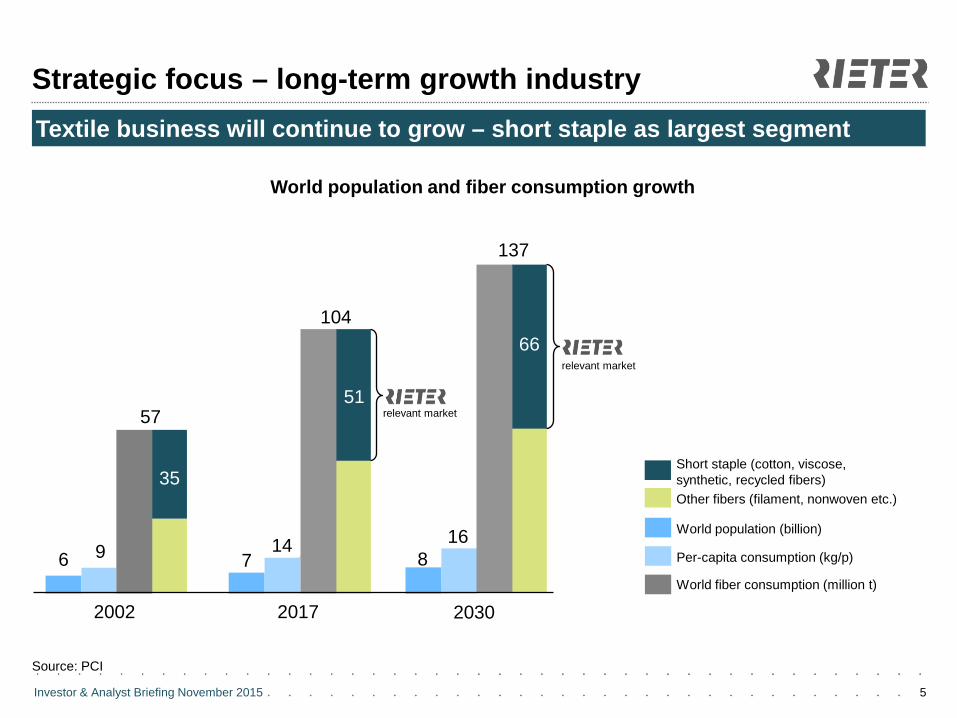
Strategic focus – long-term growth industry
Source: PCI
Short staple (cotton, viscose, synthetic, recycled fibers) Other fibers (filament, nonwoven etc.)
6 7
World population (billion)
9 Per-capita consumption (kg/p)
104
57
World fiber consumption (million t)
2002 2017
World population and fiber consumption growth
Textile business will continue to grow – short staple as largest segment
8 16
137
2030
51
66
relevant market
relevant market
35
Investor & Analyst Briefing November 2015
Strategic focus
6
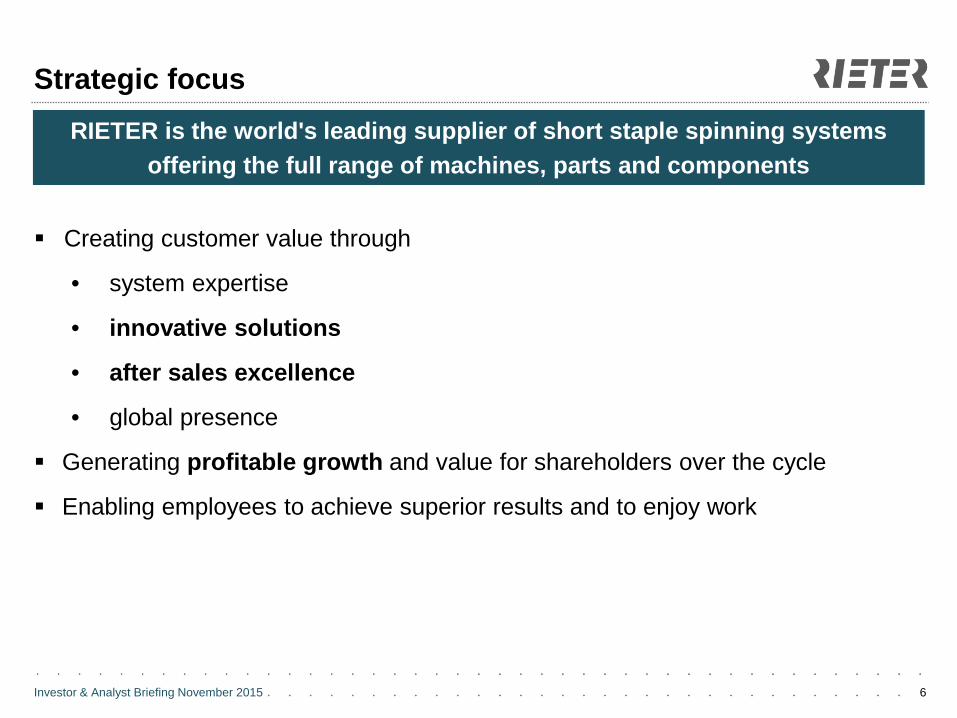
RIETER is the world's leading supplier of short staple spinning systems offering the full range of machines, parts and components
Creating customer value through
• system expertise
• innovative solutions
• after sales excellence
• global presence
Generating profitable growth and value for shareholders over the cycle
Enabling employees to achieve superior results and to enjoy work
Investor & Analyst Briefing November 2015 7
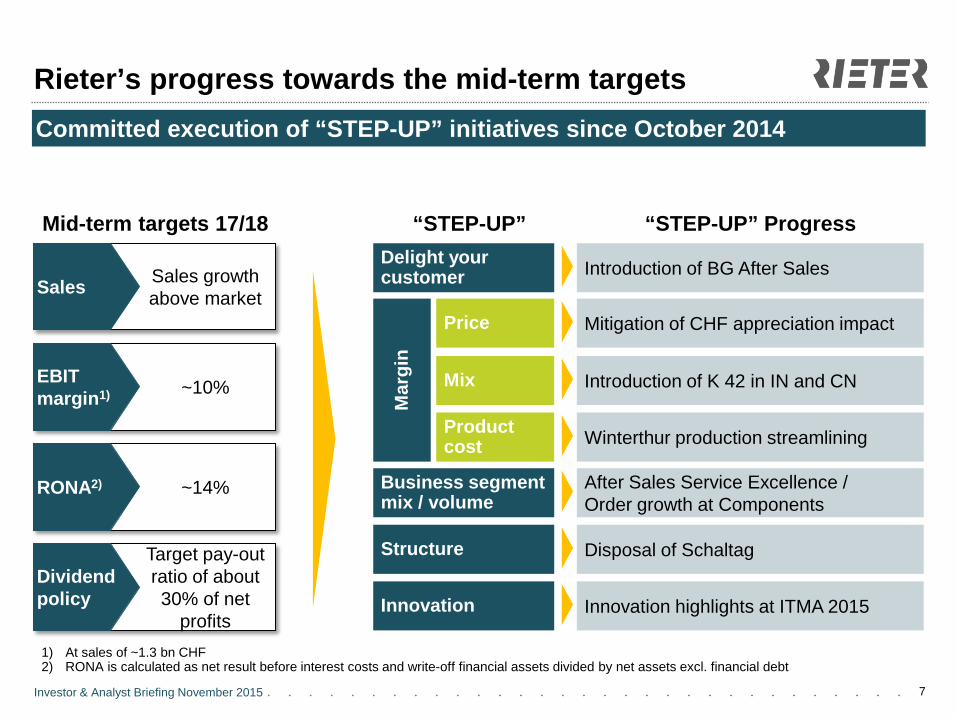
Rieter’s progress towards the mid-term targets
1) At sales of ~1.3 bn CHF 2) RONA is calculated as net result before interest costs and write-off financial assets divided by net assets excl. financial debt
Sales growth above market Sales
~10% EBIT margin1)
~14% RONA2)
Target pay-out ratio of about 30% of net
profits
Dividend policy
Mid-term targets 17/18 Introduction of BG After Sales Delight your
customer
Price
Mar
gin
Mix
Product cost
Structure
Business segment mix / volume
After Sales Service Excellence / Order growth at Components
Disposal of Schaltag
Mitigation of CHF appreciation impact
Introduction of K 42 in IN and CN
Winterthur production streamlining
Innovation Innovation highlights at ITMA 2015
Committed execution of “STEP-UP” initiatives since October 2014
“STEP-UP” “STEP-UP” Progress
Investor & Analyst Briefing November 2015 8
Agenda
1. Welcome Cornelia Schreier
2. Introduction and strategic focus Dr. Norbert Klapper
3. Innovative solutions Dr. Norbert Klapper
4. After Sales Carsten Liske
5. Profitability improvement Joris Gröflin
6. Outlook Dr. Norbert Klapper
. . . . .
. . . . .
. . . . .
. . . . .
. . . . .
. . . . .
. . . . .
. . . . .
. . . . .
Investor & Analyst Briefing November 2015
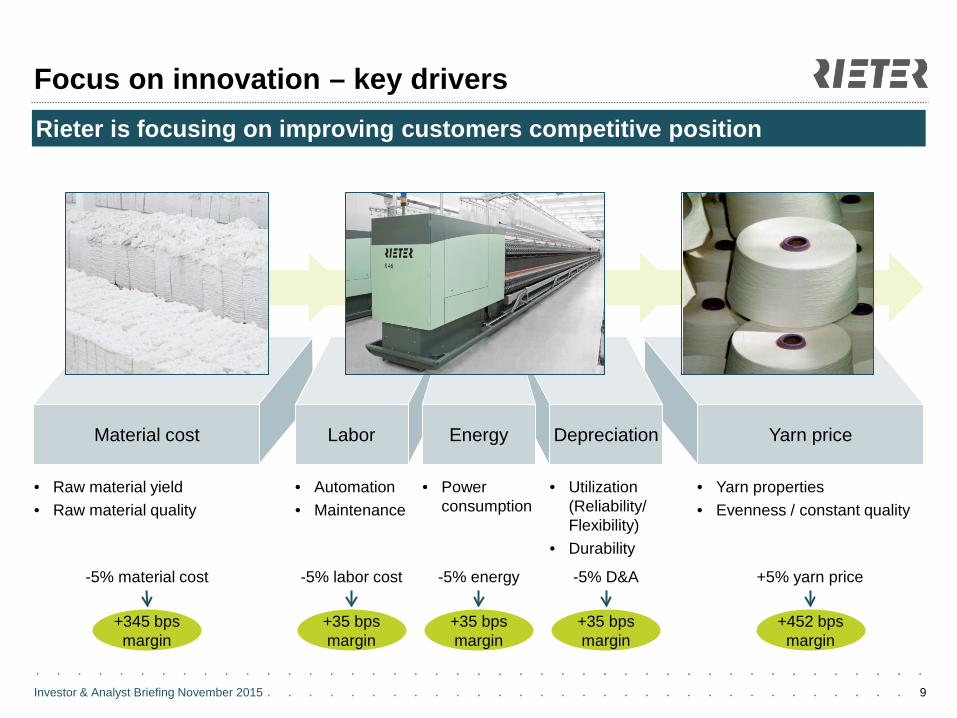
Focus on innovation – key drivers
9
Rieter is focusing on improving customers competitive position
Material cost Yarn price
• Raw material yield • Raw material quality
• Automation • Maintenance
• Power consumption
• Utilization (Reliability/ Flexibility)
• Durability
• Yarn properties • Evenness / constant quality
-5% material cost -5% labor cost -5% energy -5% D&A +5% yarn price
+345 bps margin
+35 bps margin
+35 bps margin
+35 bps margin
+452 bps margin
Labor Depreciation Energy
Investor & Analyst Briefing November 2015
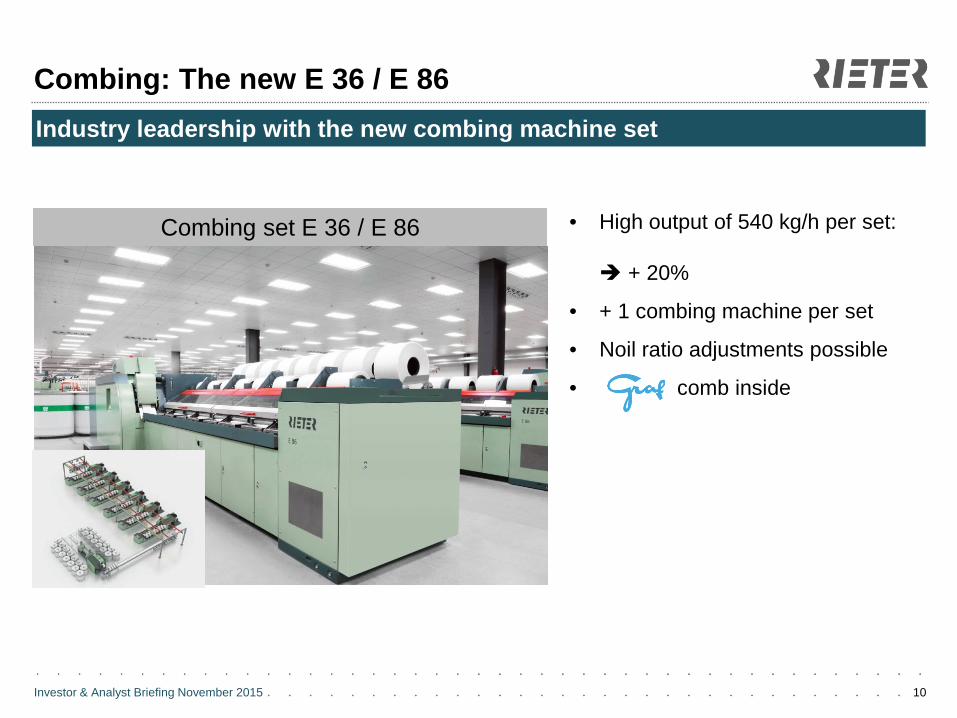
Combing: The new E 36 / E 86
10
Industry leadership with the new combing machine set
• High output of 540 kg/h per set: + 20%
• + 1 combing machine per set
• Noil ratio adjustments possible
• comb inside
Combing set E 36 / E 86
Investor & Analyst Briefing November 2015
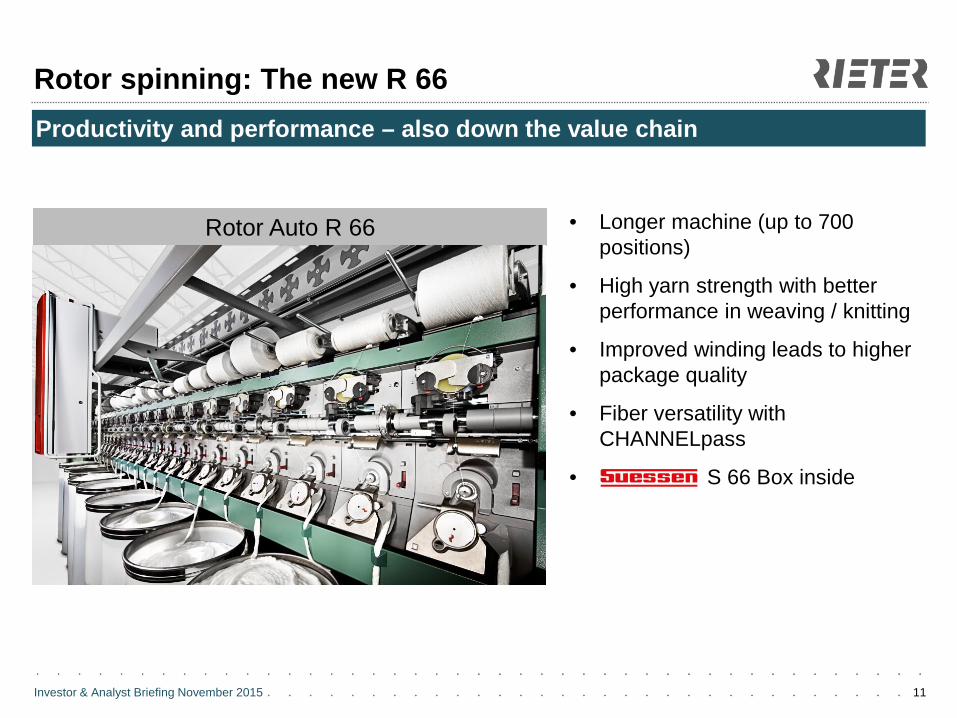
Rotor spinning: The new R 66
11
Productivity and performance – also down the value chain
• Longer machine (up to 700 positions)
• High yarn strength with better performance in weaving / knitting
• Improved winding leads to higher package quality
• Fiber versatility with CHANNELpass
• S 66 Box inside
R 66 Picture
Rotor Auto R 66
Investor & Analyst Briefing November 2015
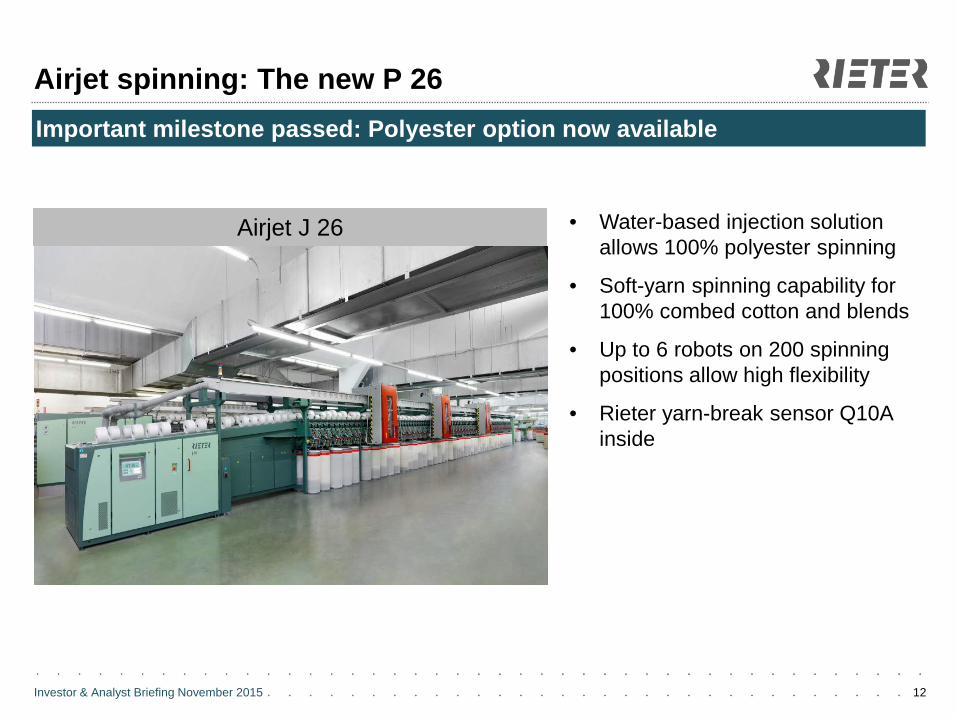
Airjet spinning: The new P 26
12
Important milestone passed: Polyester option now available
• Water-based injection solution allows 100% polyester spinning
• Soft-yarn spinning capability for 100% combed cotton and blends
• Up to 6 robots on 200 spinning positions allow high flexibility
• Rieter yarn-break sensor Q10A inside
J 26 Picture
Airjet J 26
Investor & Analyst Briefing November 2015
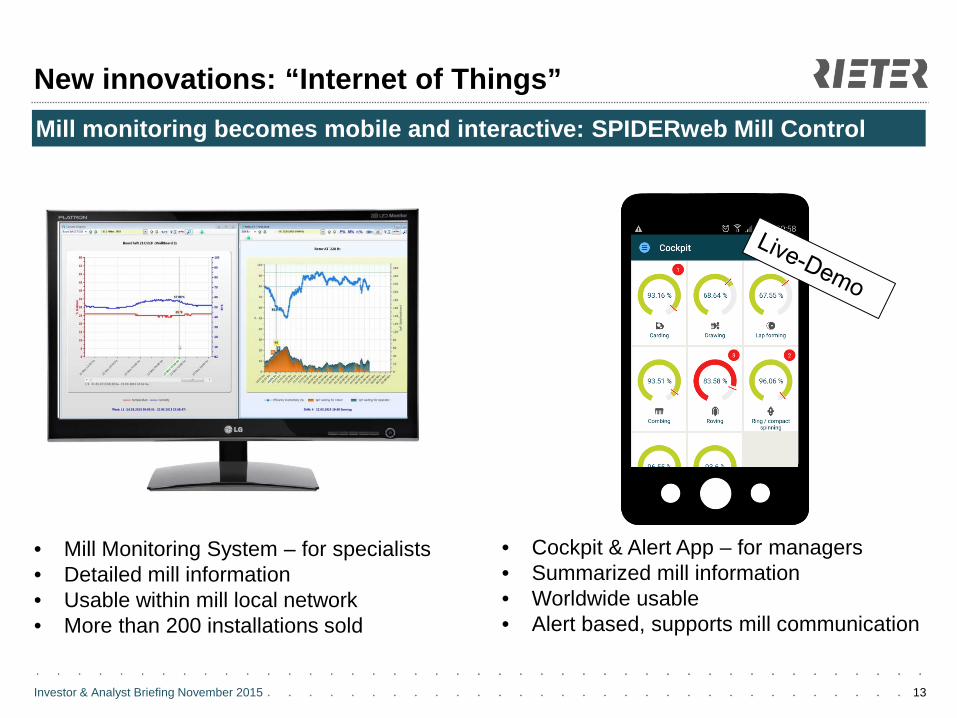
New innovations: “Internet of Things”
13
Mill monitoring becomes mobile and interactive: SPIDERweb Mill Control
• Mill Monitoring System – for specialists • Detailed mill information • Usable within mill local network • More than 200 installations sold
• Cockpit & Alert App – for managers • Summarized mill information • Worldwide usable • Alert based, supports mill communication
Investor & Analyst Briefing November 2015 14
Agenda
1. Welcome Cornelia Schreier
2. Introduction and strategic focus Dr. Norbert Klapper
3. Innovative solutions Dr. Norbert Klapper
4. After Sales Carsten Liske
5. Profitability improvement Joris Gröflin
6. Outlook Dr. Norbert Klapper
. . . . .
. . . . .
. . . . .
. . . . .
. . . . .
. . . . .
. . . . .
. . . . .
. . . . .
Investor & Analyst Briefing November 2015
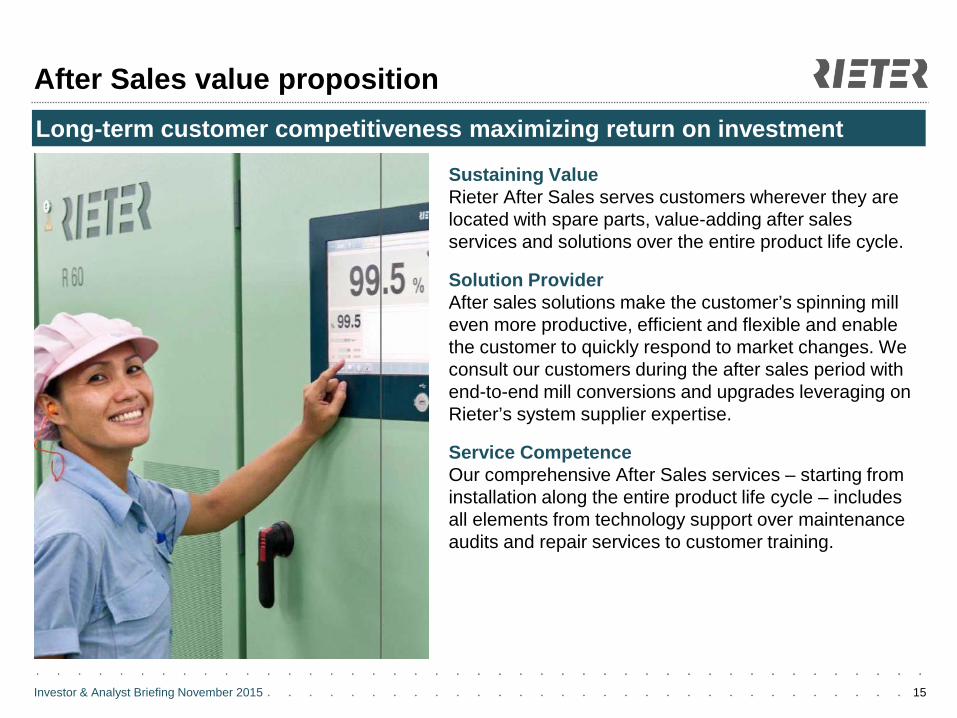
Sustaining Value Rieter After Sales serves customers wherever they are located with spare parts, value-adding after sales services and solutions over the entire product life cycle.
Solution Provider After sales solutions make the customer’s spinning mill even more productive, efficient and flexible and enable the customer to quickly respond to market changes. We consult our customers during the after sales period with end-to-end mill conversions and upgrades leveraging on Rieter’s system supplier expertise.
Service Competence Our comprehensive After Sales services – starting from installation along the entire product life cycle – includes all elements from technology support over maintenance audits and repair services to customer training.
15
After Sales value proposition Long-term customer competitiveness maximizing return on investment
Investor & Analyst Briefing November 2015
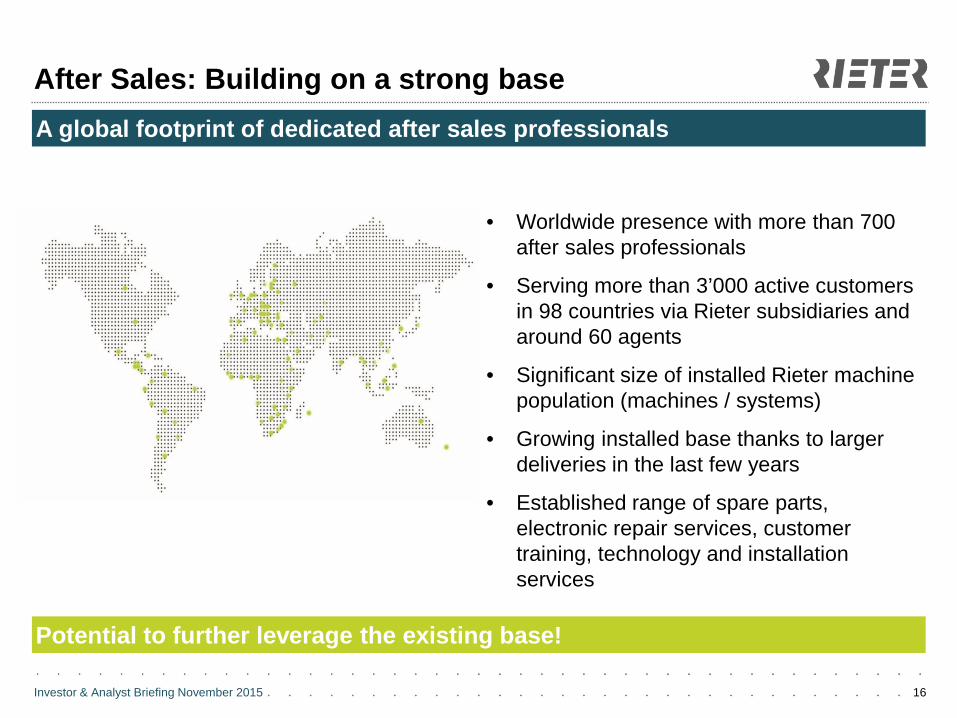
After Sales: Building on a strong base
16
A global footprint of dedicated after sales professionals
• Worldwide presence with more than 700 after sales professionals
• Serving more than 3’000 active customers in 98 countries via Rieter subsidiaries and around 60 agents
• Significant size of installed Rieter machine population (machines / systems)
• Growing installed base thanks to larger deliveries in the last few years
• Established range of spare parts, electronic repair services, customer training, technology and installation services
Potential to further leverage the existing base!
Investor & Analyst Briefing November 2015
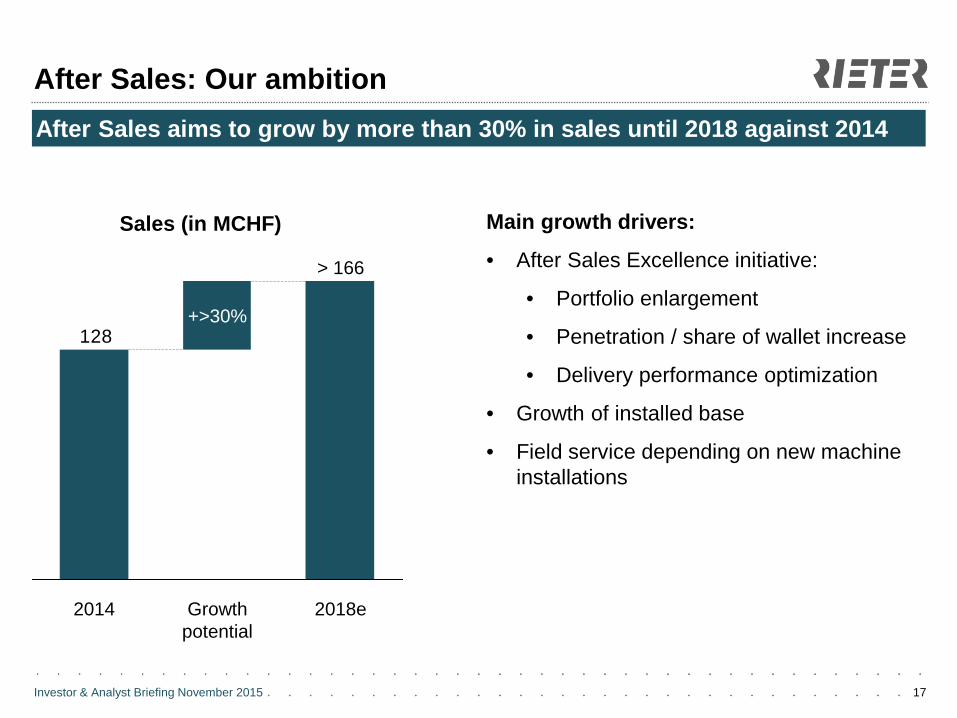
After Sales: Our ambition
17
After Sales aims to grow by more than 30% in sales until 2018 against 2014
128
2014 Growth potential
+>30%
2018e
> 166
Main growth drivers:
• After Sales Excellence initiative:
• Portfolio enlargement
• Penetration / share of wallet increase
• Delivery performance optimization
• Growth of installed base
• Field service depending on new machine installations
Sales (in MCHF)
Investor & Analyst Briefing November 2015
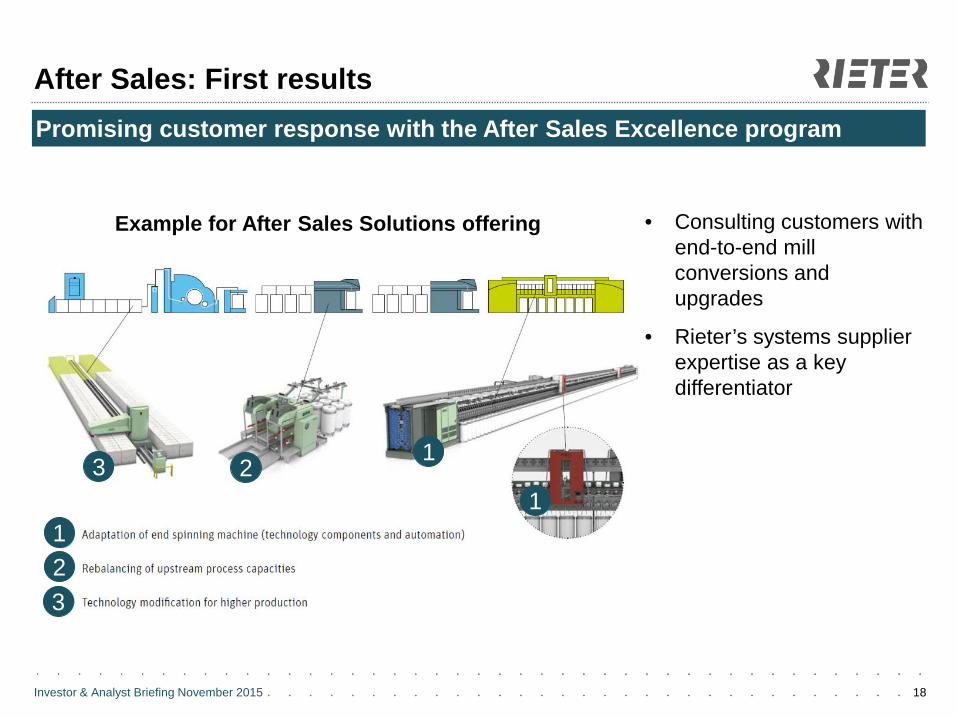
After Sales: First results
18
Promising customer response with the After Sales Excellence program
• Consulting customers with end-to-end mill conversions and upgrades
• Rieter’s systems supplier expertise as a key differentiator
Example for After Sales Solutions offering
3 2 1
1 1
3 2
Investor & Analyst Briefing November 2015
After Sales: The way forward
19
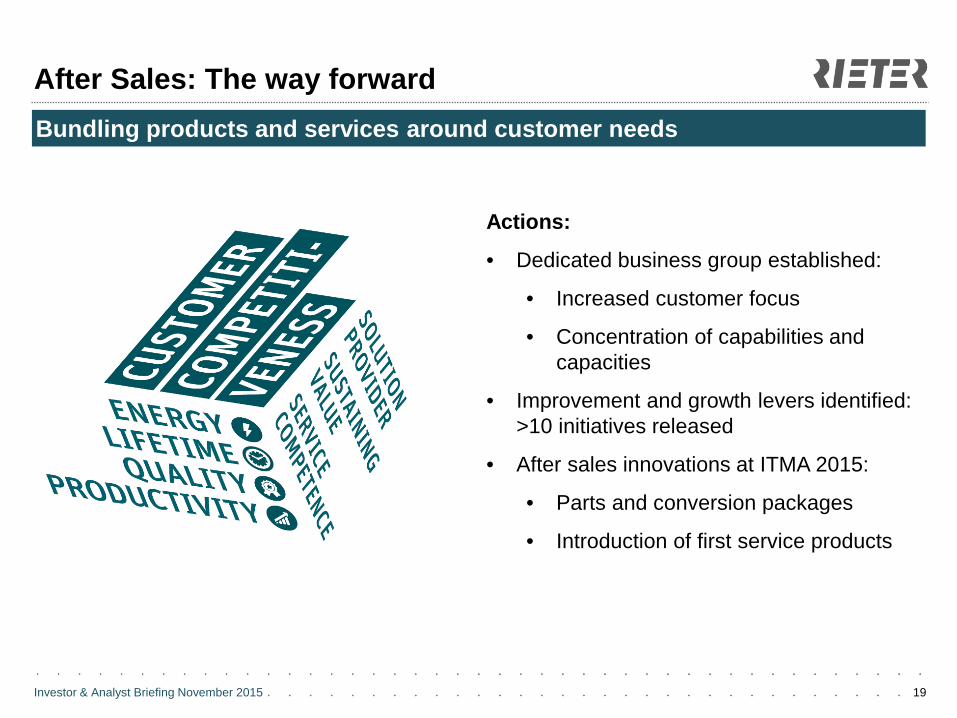
Bundling products and services around customer needs
Actions:
• Dedicated business group established:
• Increased customer focus
• Concentration of capabilities and capacities
• Improvement and growth levers identified: >10 initiatives released
• After sales innovations at ITMA 2015:
• Parts and conversion packages
• Introduction of first service products
Investor & Analyst Briefing November 2015 20
Agenda
1. Welcome Cornelia Schreier
2. Introduction and strategic focus Dr. Norbert Klapper
3. Innovative solutions Dr. Norbert Klapper
4. After Sales Carsten Liske
5. Profitability improvement Joris Gröflin
6. Outlook Dr. Norbert Klapper
. . . . .
. . . . .
. . . . .
. . . . .
. . . . .
. . . . .
. . . . .
. . . . .
. . . . .
Investor & Analyst Briefing November 2015
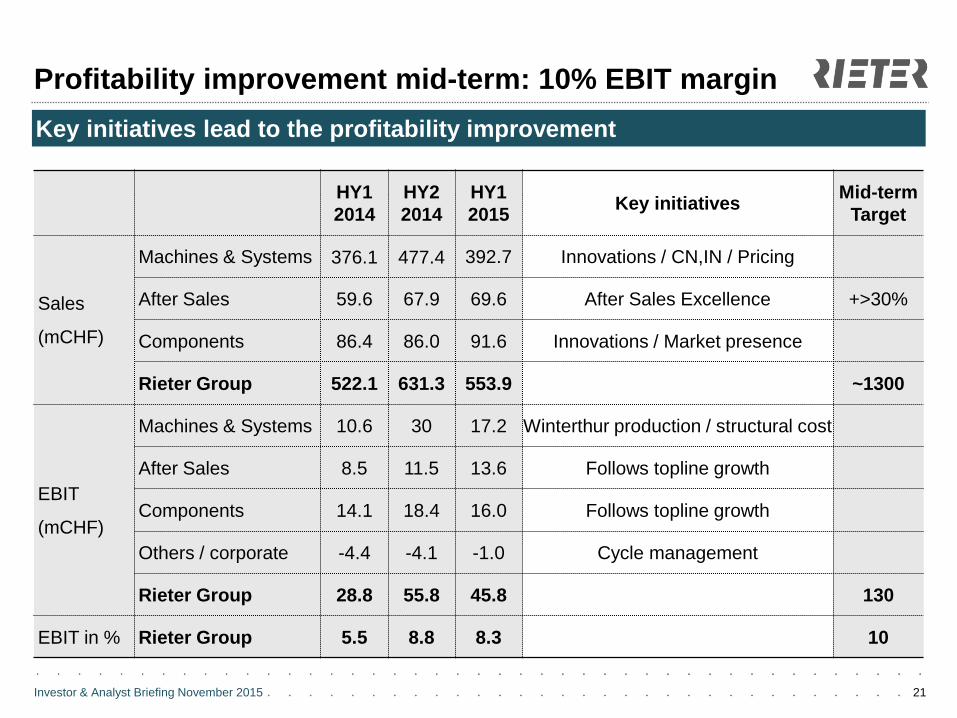
Profitability improvement mid-term: 10% EBIT margin
21
13.1%
Key initiatives lead to the profitability improvement
HY1 2014
HY2 2014
HY1 2015 Key initiatives Mid-term
Target
Sales
(mCHF)
Machines & Systems 376.1 477.4 392.7 Innovations / CN,IN / Pricing
After Sales 59.6 67.9 69.6 After Sales Excellence +>30%
Components 86.4 86.0 91.6 Innovations / Market presence
Rieter Group 522.1 631.3 553.9 ~1300
EBIT
(mCHF)
Machines & Systems 10.6 30 17.2 Winterthur production / structural cost
After Sales 8.5 11.5 13.6 Follows topline growth
Components 14.1 18.4 16.0 Follows topline growth
Others / corporate -4.4 -4.1 -1.0 Cycle management
Rieter Group 28.8 55.8 45.8 130
EBIT in % Rieter Group 5.5 8.8 8.3 10
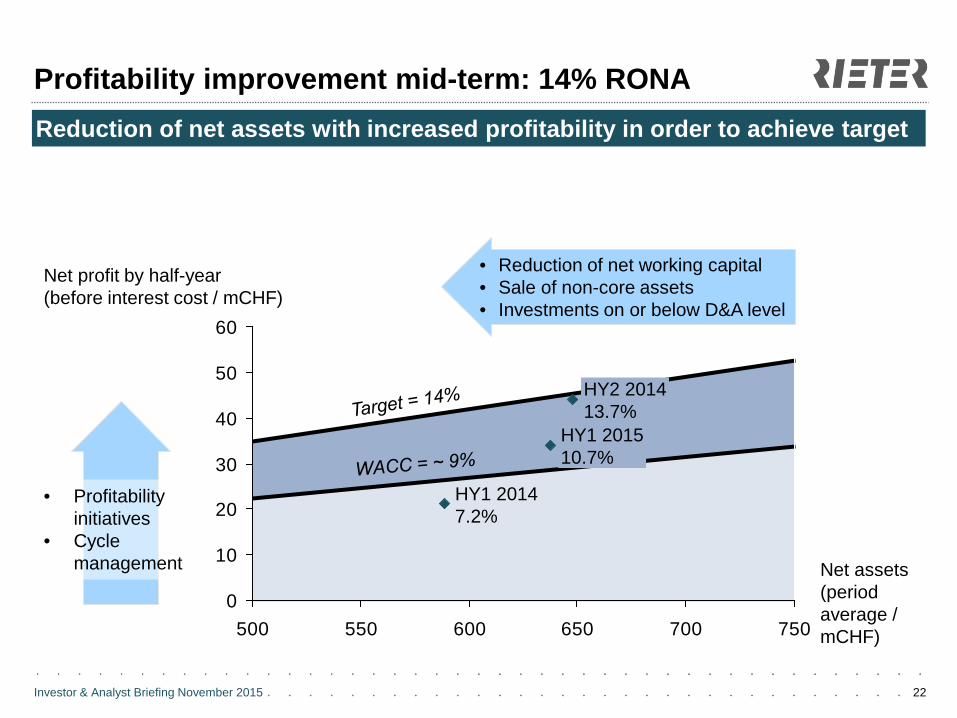
Investor & Analyst Briefing November 2015 22
Profitability improvement mid-term: 14% RONA Reduction of net assets with increased profitability in order to achieve target
Net profit by half-year (before interest cost / mCHF)
Net assets (period average / mCHF)
0
10
20
30
40
50
60
500 550 600 650 700 750
HY1 2015 10.7%
HY2 2014 13.7%
HY1 2014 7.2%
• Reduction of net working capital • Sale of non-core assets • Investments on or below D&A level
• Profitability initiatives
• Cycle management
Investor & Analyst Briefing November 2015 23
Agenda
1. Welcome Cornelia Schreier
2. Introduction and strategic focus Dr. Norbert Klapper
3. Innovative solutions Dr. Norbert Klapper
4. After Sales Carsten Liske
5. Profitability improvement Joris Gröflin
6. Outlook Dr. Norbert Klapper
. . . . .
. . . . .
. . . . .
. . . . .
. . . . .
. . . . .
. . . . .
. . . . .
. . . . .
Investor & Analyst Briefing November 2015
Outlook
24
• While the order intake trend for both business groups Components and After Sales is pleasing, the market for new machinery at the business group Machines & Systems is at a low level. This trend is due to spinning mills’ low margins as well as uncertainty in the individual sales markets.
• Owing to the positive dynamics in the business groups Components and After Sales and an order book delivery according to schedule in the business group Machines & Systems, Rieter is expecting for the whole of 2015 sales of around 1 billion CHF, operative profitability (EBIT) of around 7 percent and a net profit of between 4 and 5 percent of sales.
Investor & Analyst Briefing November 2015
Disclaimer
25
Rieter is making great efforts to include accurate and up-to-date information in this document,
however we make no representations or warranties, expressed or implied, as to the accuracy or
completeness of the information provided in this document and we disclaim any liability
whatsoever for the use of it.
The information provided in this document is not intended nor may be construed as an offer or
solicitation for the purchase or disposal, trading or any transaction in any Rieter securities.
Investors must not rely on this information for investment decisions.
All statements in this report which do not reflect historical facts are forecasts for the future which
offer no guarantee whatsoever with respect to future performance; they are embody risks and
uncertainties which include – but are not confined to – future global economic conditions,
exchange rates, legal provisions, market conditions, activities by competitors and other factors
outside the company's control.
Investor & Analyst Briefing November 2015 26
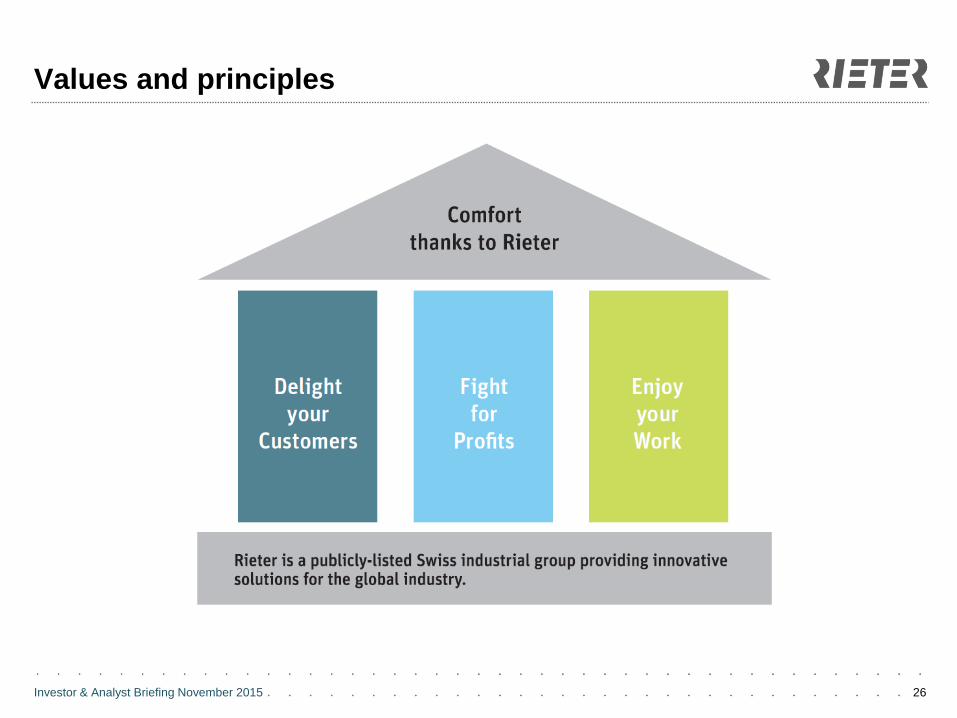
Values and principles
Investor & Analyst Briefing November 2015 27
Appendix
. . . . .
. . . . .
. . . . .
. . . . .
. . . . .
. . . . .
. . . . .
. . . . .
. . . . .
Investor & Analyst Briefing November 2015 28
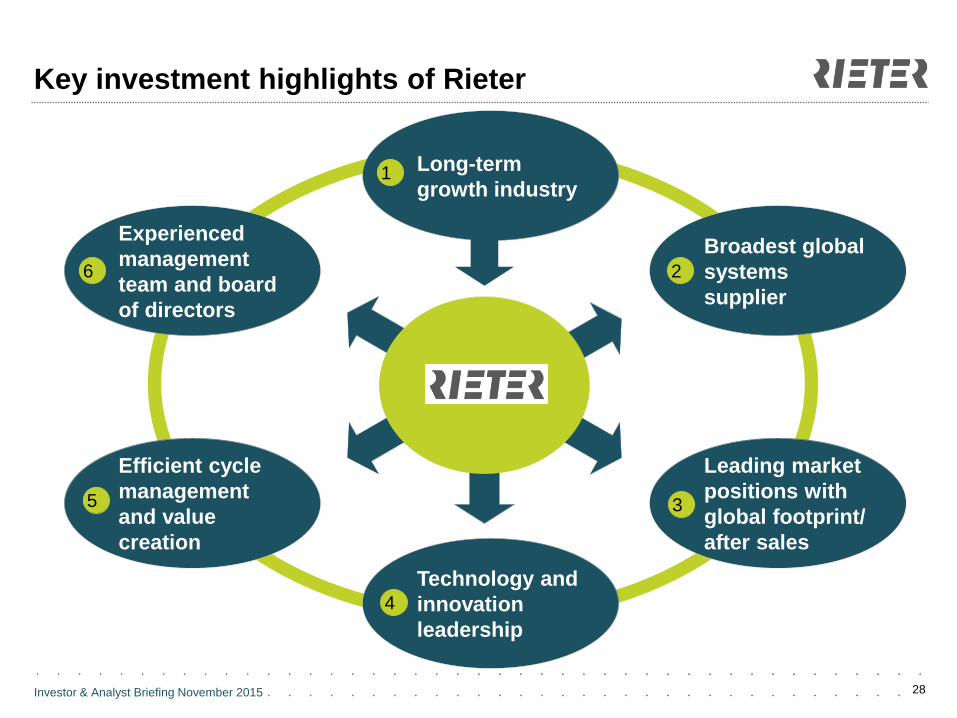
Key investment highlights of Rieter
Broadest global systems supplier
2
Efficient cycle management and value creation
5
Experienced management team and board of directors
6
Leading market positions with global footprint/ after sales
3
Long-term growth industry
1
Technology and innovation leadership
4
Rieter
Investor & Analyst Briefing November 2015
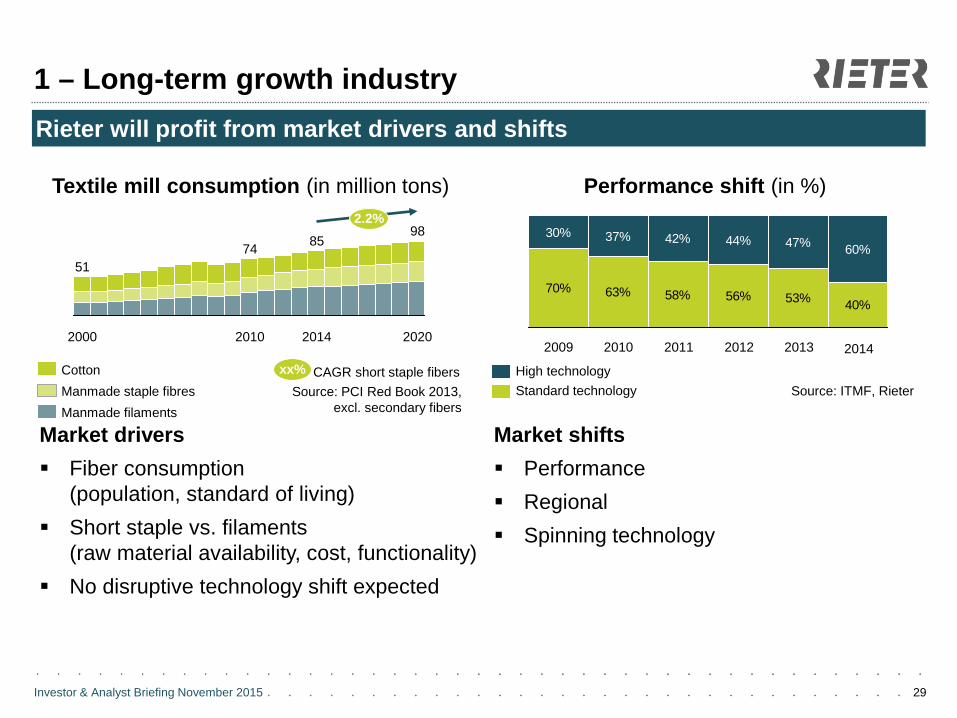
1 – Long-term growth industry
29
Rieter will profit from market drivers and shifts
Market drivers Fiber consumption
(population, standard of living) Short staple vs. filaments
(raw material availability, cost, functionality) No disruptive technology shift expected
Market shifts Performance Regional Spinning technology
Textile mill consumption (in million tons) Performance shift (in %)
70% 63% 58% 56% 53% 40%
30% 37% 42% 44% 47% 60%
2014 2013 2012 2011 2010 2009
Standard technology High technology
Source: ITMF, Rieter
2020
98
2014
85
2010
74
2000
51
Manmade filaments Manmade staple fibres Cotton
Source: PCI Red Book 2013, excl. secondary fibers
2.2%
CAGR short staple fibers xx%
Investor & Analyst Briefing November 2015
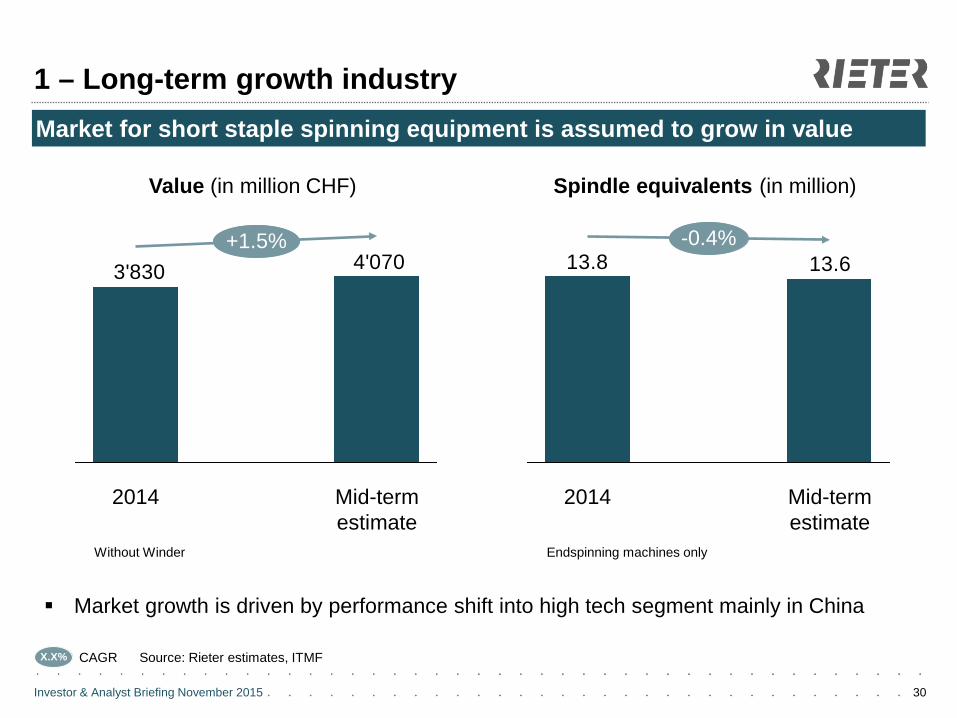
1 – Long-term growth industry
30
Market for short staple spinning equipment is assumed to grow in value
Value (in million CHF) Spindle equivalents (in million)
4'0703'830
2014
+1.5%
Mid-term estimate
13.8 13.6-0.4%
Mid-term estimate
2014
X.X% CAGR
Market growth is driven by performance shift into high tech segment mainly in China
Without Winder Endspinning machines only
Source: Rieter estimates, ITMF
Investor & Analyst Briefing November 2015 31
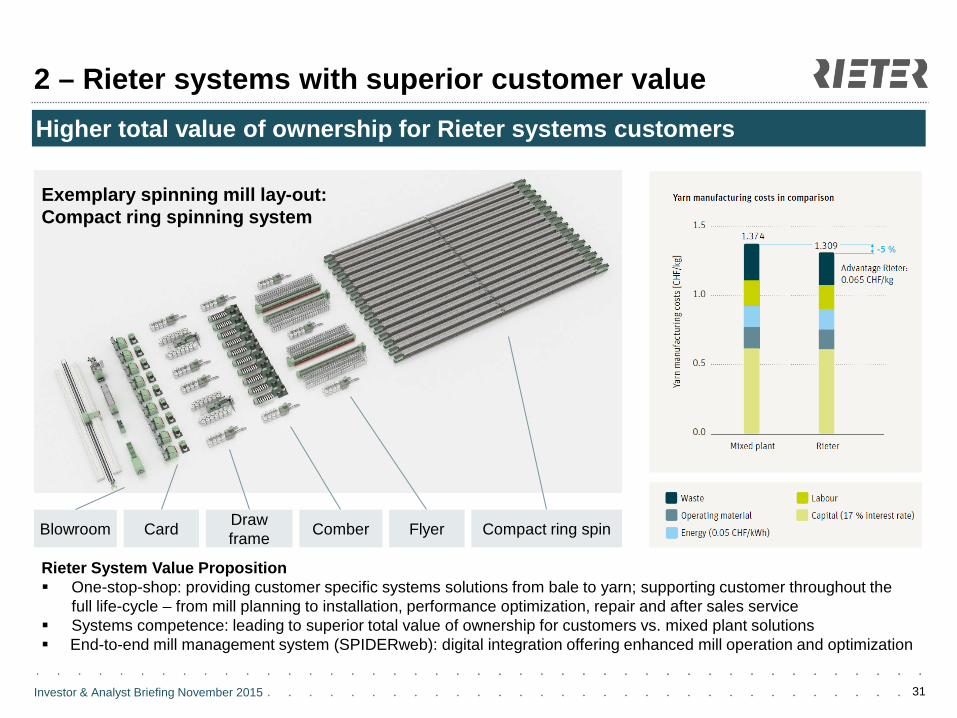
Higher total value of ownership for Rieter systems customers
2 – Rieter systems with superior customer value
Exemplary spinning mill lay-out: Compact ring spinning system
Rieter System Value Proposition One-stop-shop: providing customer specific systems solutions from bale to yarn; supporting customer throughout the
full life-cycle – from mill planning to installation, performance optimization, repair and after sales service Systems competence: leading to superior total value of ownership for customers vs. mixed plant solutions End-to-end mill management system (SPIDERweb): digital integration offering enhanced mill operation and optimization
Blowroom Card Comber Draw frame Compact ring spin Flyer
Investor & Analyst Briefing November 2015
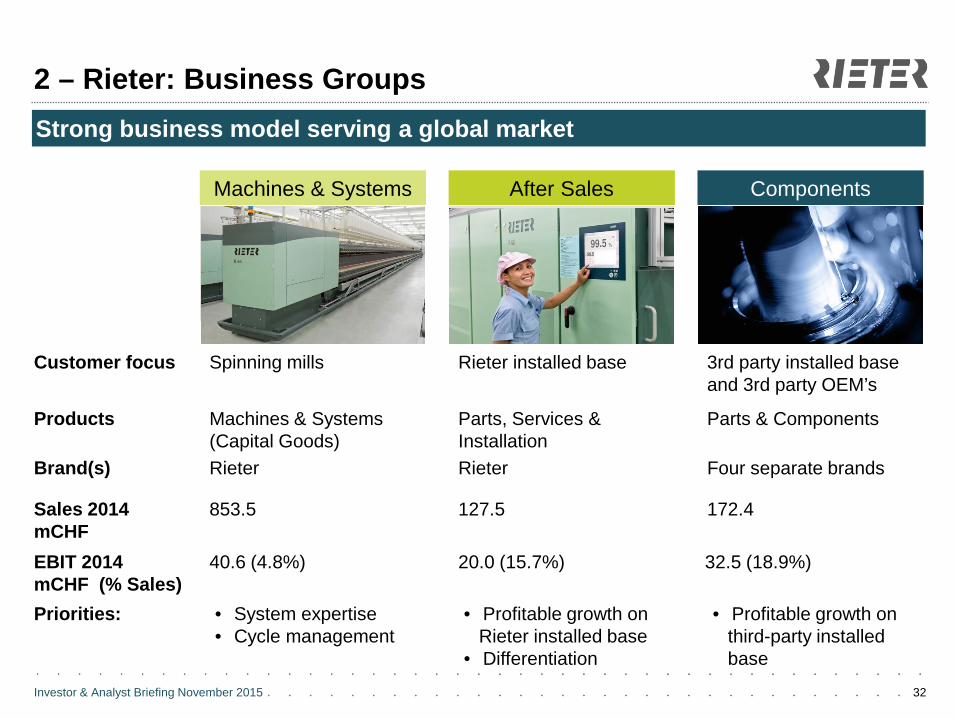
2 – Rieter: Business Groups
32
Machines & Systems After Sales Components
Customer focus
Products
Brand(s)
Sales 2014 mCHF EBIT 2014 mCHF (% Sales) Priorities: • System expertise
• Cycle management • Profitable growth on
Rieter installed base • Differentiation
Spinning mills Rieter installed base 3rd party installed base and 3rd party OEM’s
Machines & Systems (Capital Goods)
Parts, Services & Installation
Parts & Components
Rieter Rieter Four separate brands
853.5
40.6 (4.8%)
127.5
20.0 (15.7%)
172.4
32.5 (18.9%)
• Profitable growth on third-party installed base
Strong business model serving a global market
Investor & Analyst Briefing November 2015
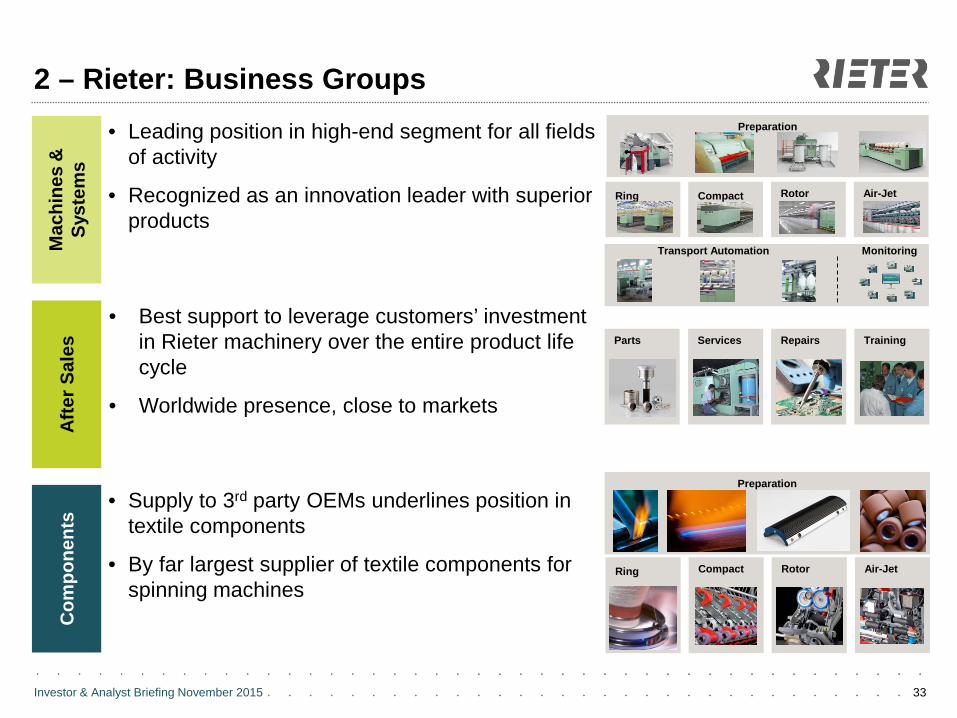
Parts
33
Mac
hine
s &
Sy
stem
s
• Supply to 3rd party OEMs underlines position in textile components
• By far largest supplier of textile components for spinning machines
• Leading position in high-end segment for all fields of activity
• Recognized as an innovation leader with superior products
Ring
Compact Rotor
Air-Jet
Preparation
Monitoring Transport Automation
Preparation
Ring
Compact Rotor
Air-Jet
Com
pone
nts
Afte
r Sal
es • Best support to leverage customers’ investment
in Rieter machinery over the entire product life cycle
• Worldwide presence, close to markets
Services Repairs
Training
2 – Rieter: Business Groups
Investor & Analyst Briefing November 2015 34
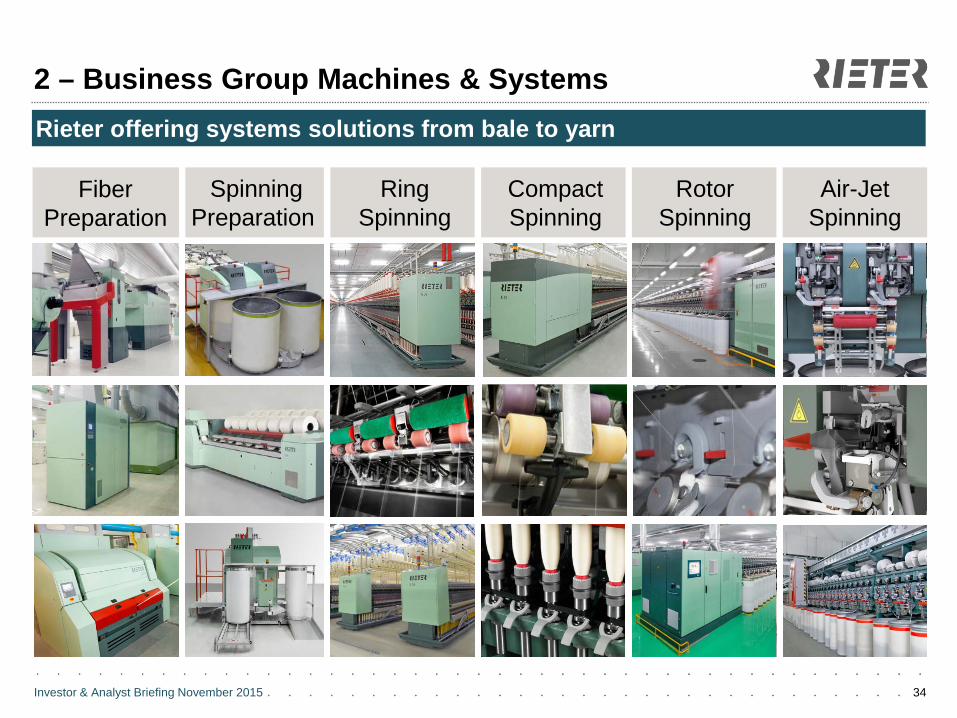
2 – Business Group Machines & Systems Rieter offering systems solutions from bale to yarn
Air-Jet Spinning
Rotor Spinning
Spinning Preparation
Fiber Preparation
Ring Spinning
Compact Spinning Compact Spinning
Investor & Analyst Briefing November 2015
2 – Business Group Components
35
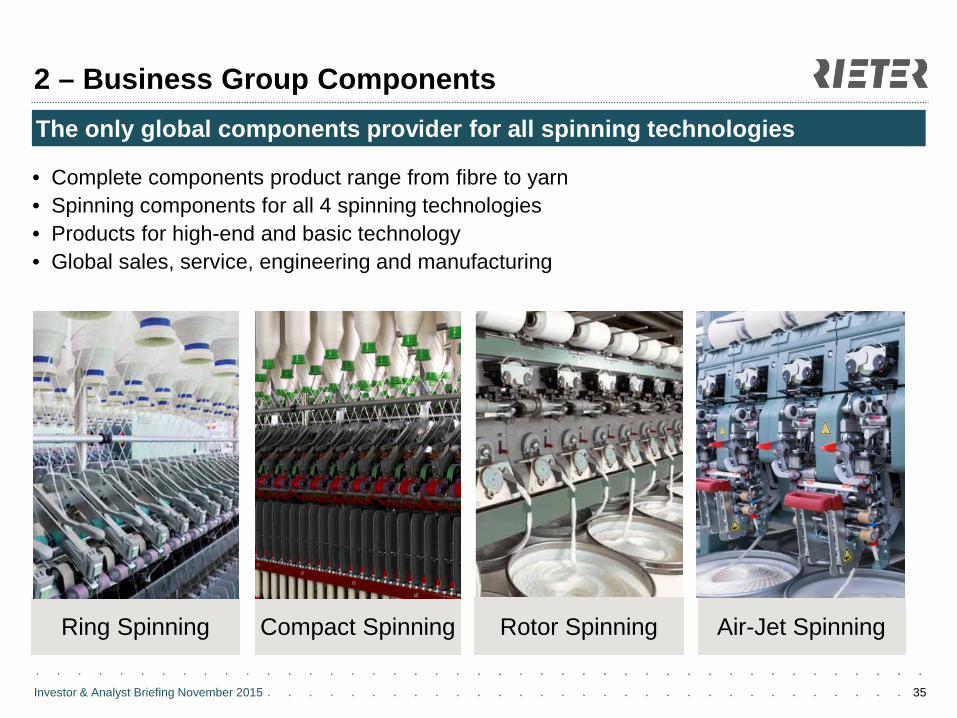
• Complete components product range from fibre to yarn • Spinning components for all 4 spinning technologies • Products for high-end and basic technology • Global sales, service, engineering and manufacturing
Ring Spinning Rotor Spinning Air-Jet Spinning Compact Spinning
The only global components provider for all spinning technologies
Investor & Analyst Briefing November 2015
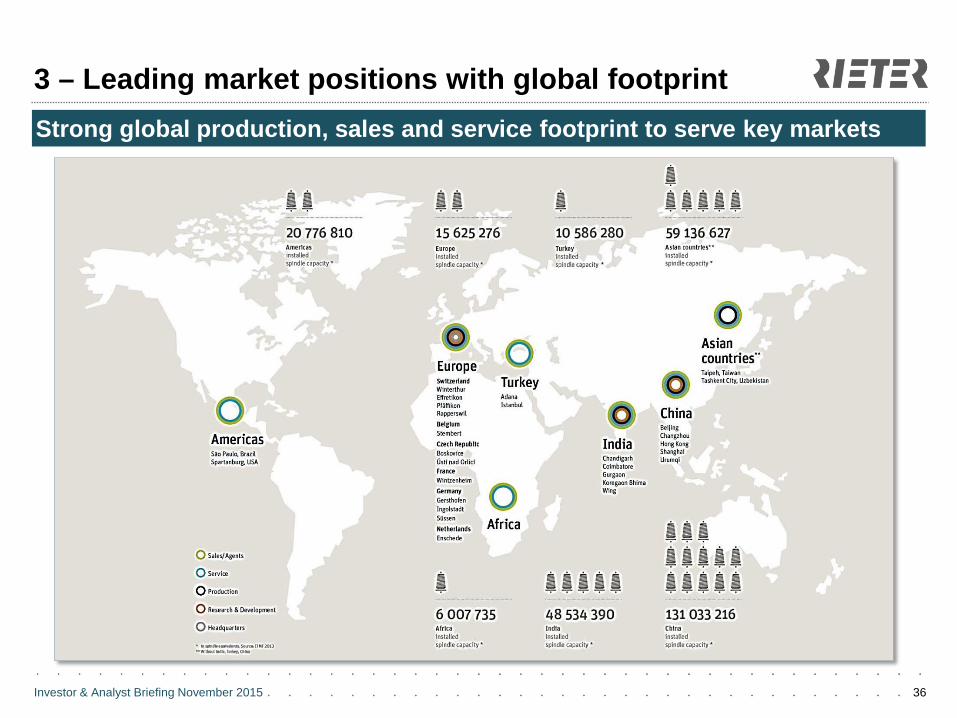
3 – Leading market positions with global footprint
36
Strong global production, sales and service footprint to serve key markets
Investor & Analyst Briefing November 2015
3 – Leading market positions with global footprint
37
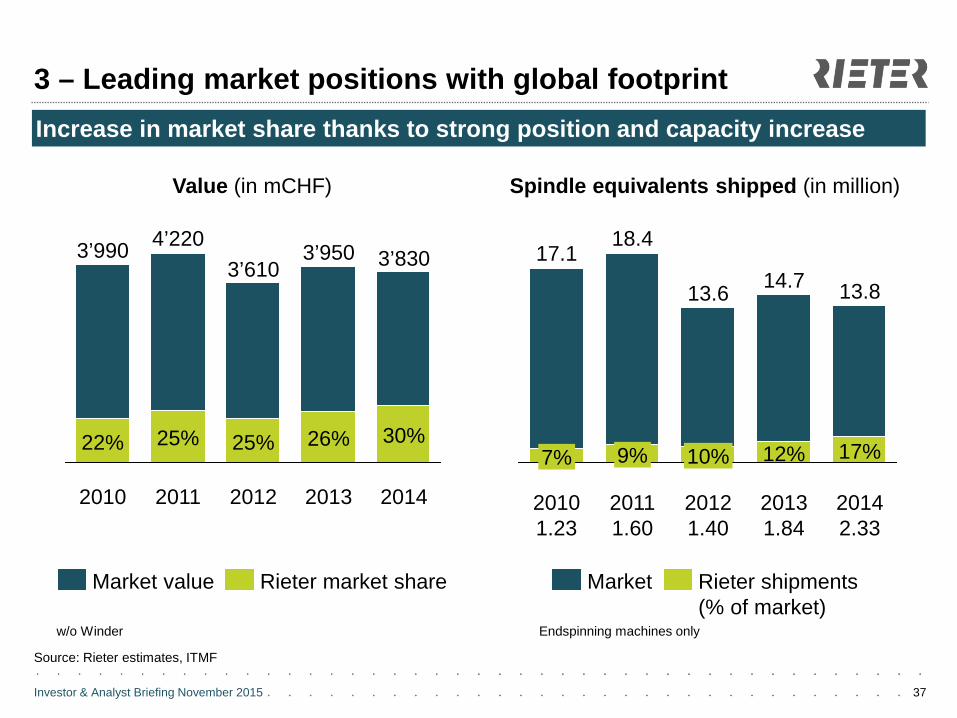
Increase in market share thanks to strong position and capacity increase
Value (in mCHF) Spindle equivalents shipped (in million)
2014 2013
30%
3’950
26%
2012
3’610
25%
2011
4’220
25%
2010
3’990
22%
3’830 13.8
17%
2013 1.84
14.7
12%
2012 1.40
13.6
10%
2011 1.60
18.4
9%
2010 1.23
17.1
7%
2014 2.33
w/o Winder Endspinning machines only
Rieter market share Market value Market Rieter shipments (% of market)
Source: Rieter estimates, ITMF
Investor & Analyst Briefing November 2015
3 – Leading market positions with global footprint
38
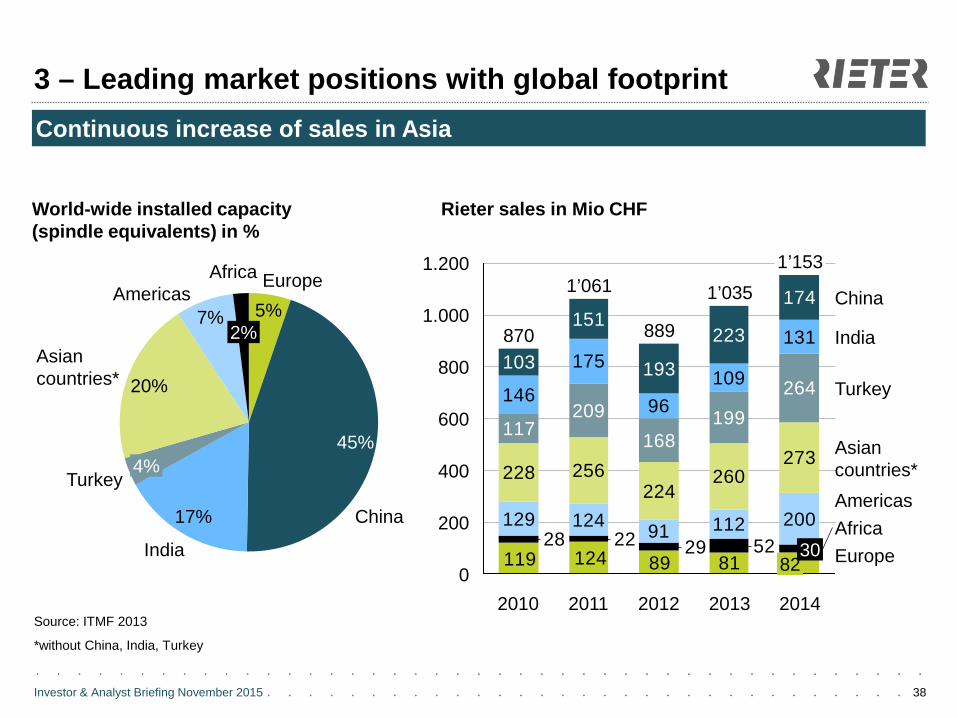
Continuous increase of sales in Asia
Rieter sales in Mio CHF
Source: ITMF 2013
*without China, India, Turkey
129 124 91 112 200
228 256224
260273
117209
168199
264146
175
96109
131103
151
193
223
174
818912411952292228
0
200
400
600
800
1.000
1.200
Europe Africa
India
China
2014
1’153
82 30
2013 2012
889
2011
870
2010
Americas
1’061 1’035
Turkey
Asian countries*
World-wide installed capacity (spindle equivalents) in %
7% 2%
20%
Africa Americas
Asian countries*
4% Turkey
17%
India
45%
China
5% Europe
Investor & Analyst Briefing November 2015
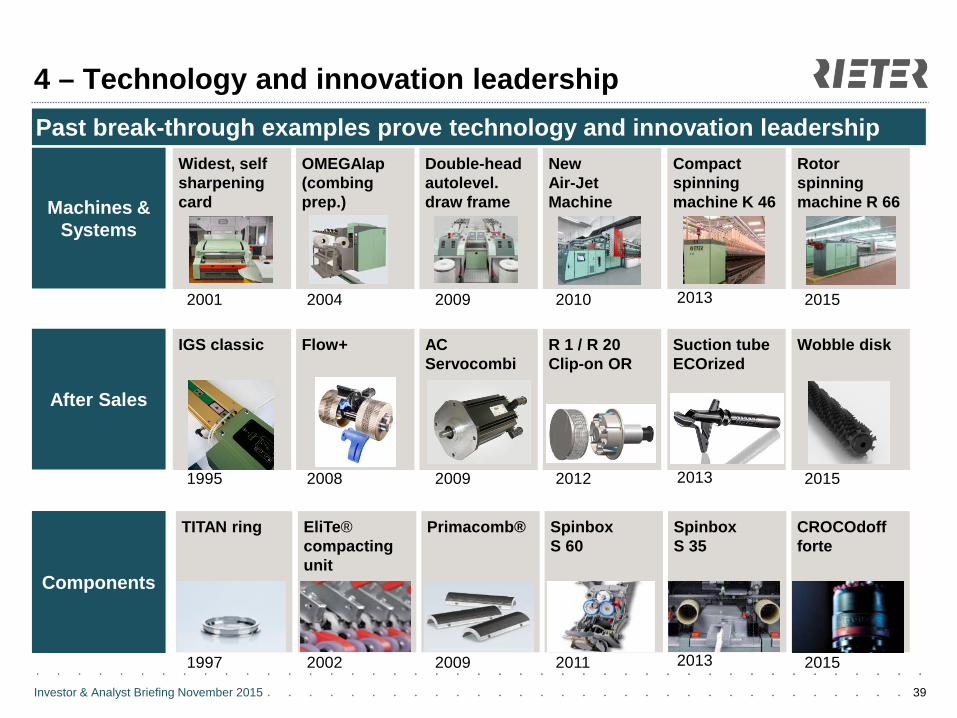
4 – Technology and innovation leadership
39
New Air-Jet Machine
Widest, self sharpening card
Double-head autolevel. draw frame
OMEGAlap (combing prep.) Machines &
Systems
Compact spinning machine K 46
Past break-through examples prove technology and innovation leadership Rotor spinning machine R 66
Components
CROCOdoff forte
TITAN ring Primacomb®
Spinbox S 35
Spinbox S 60
EliTe® compacting unit
1997 2002 2009 2011 2013 2015
2001 2004 2009 2010 2013 2015
R 1 / R 20 Clip-on OR
IGS classic AC Servocombi
Flow+
After Sales
Suction tube ECOrized
Wobble disk
1995 2008 2009 2012 2013 2015
Investor & Analyst Briefing November 2015 40
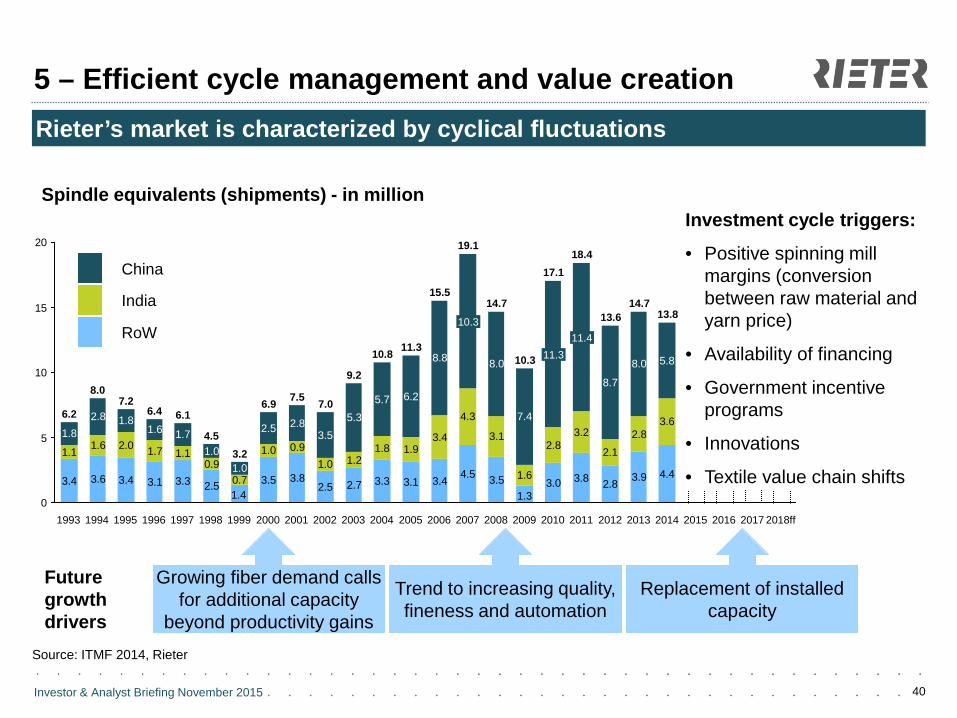
5 – Efficient cycle management and value creation Rieter’s market is characterized by cyclical fluctuations
Source: ITMF 2014, Rieter
Spindle equivalents (shipments) - in million
3.4 3.6 3.4 3.1 3.3 2.5 3.5 3.82.5 2.7 3.3 3.1 3.4 4.5 3.5 3.0 3.8 2.8 3.9 4.4
1.1 1.6 2.0 1.7 1.10.9
0.7
1.0 0.91.0 1.2
1.8 1.93.4
4.3
3.1
1.6
2.83.2
2.12.8
3.61.8
2.8 1.81.6 1.7
1.01.0
2.5 2.83.5
5.35.7 6.2
8.8 8.0
7.4
8.7
8.0 5.8
1.31.40
5
10
15
20
2018ff 2017 2016 2015 2013 2014
14.7
2012
13.6
2011
18.4
11.4
2010
17.1
11.3
2009
10.3
2008
14.7
2007
19.1
10.3
2006
15.5
2005
11.3
2004
10.8
2003
9.2
2002
7.0
2001
7.5
2000
6.9
1999
3.2
1998
4.5
1997
6.1
1996
6.4
1995
7.2
1994
8.0
1993
6.2
13.8
Growing fiber demand calls for additional capacity
beyond productivity gains
Future growth drivers
Trend to increasing quality, fineness and automation
Replacement of installed capacity
Investment cycle triggers:
• Positive spinning mill margins (conversion between raw material and yarn price)
• Availability of financing
• Government incentive programs
• Innovations
• Textile value chain shifts
China
India
RoW
Investor & Analyst Briefing November 2015
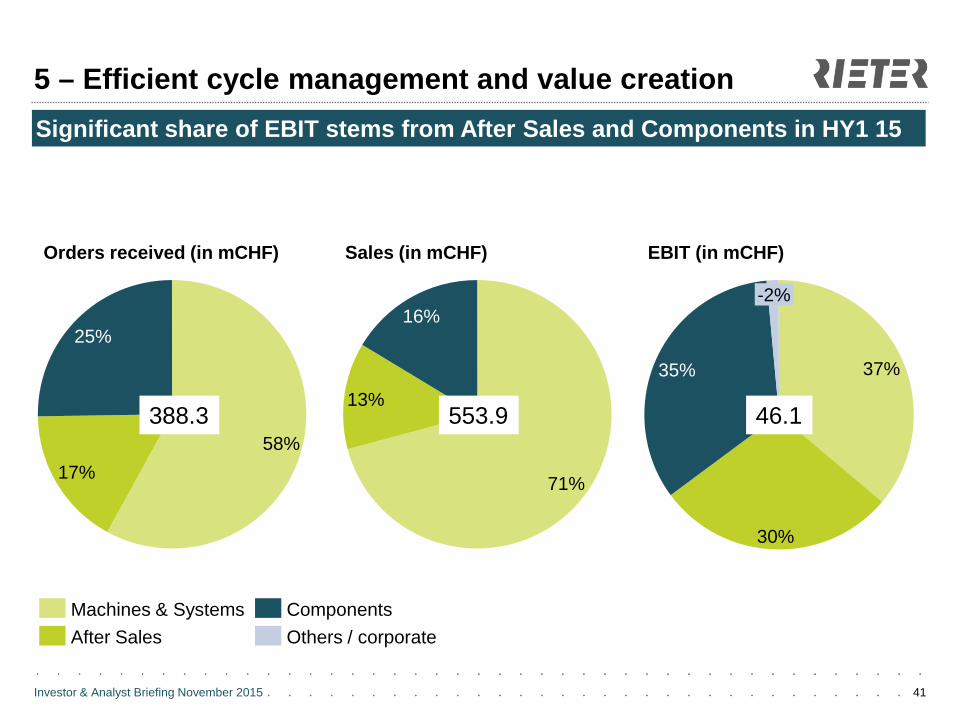
5 – Efficient cycle management and value creation
41
Significant share of EBIT stems from After Sales and Components in HY1 15
58% 17%
25%
13%
16%
71%
-2%
35%
30%
37%
Orders received (in mCHF) Sales (in mCHF) EBIT (in mCHF)
388.3 553.9 46.1
Others / corporate Components
After Sales Machines & Systems
Investor & Analyst Briefing November 2015 42
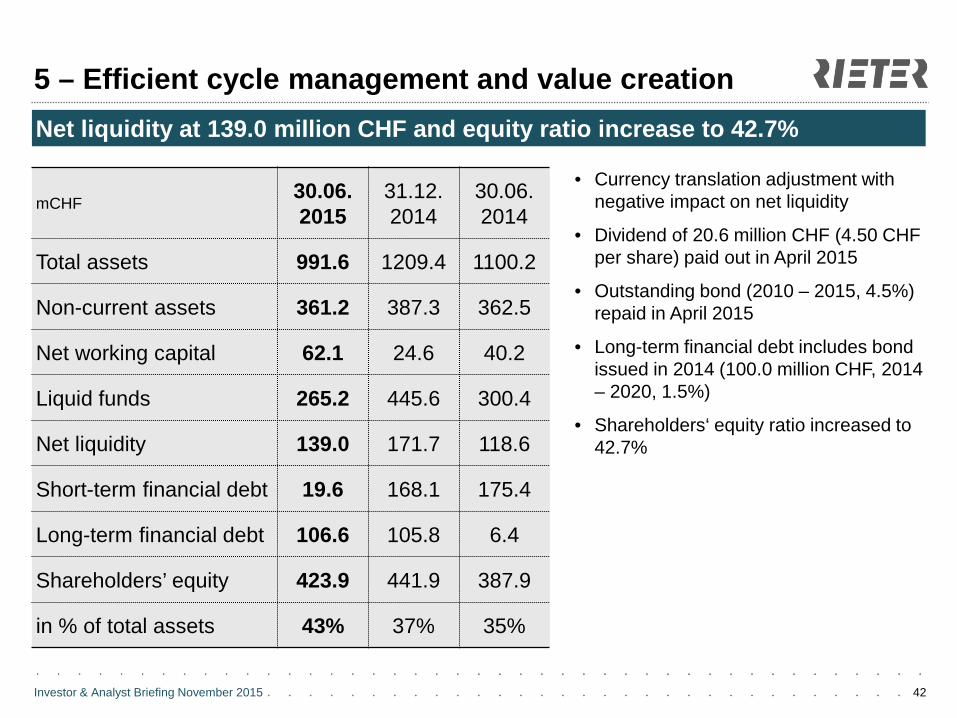
5 – Efficient cycle management and value creation
mCHF 30.06. 2015
31.12. 2014
30.06. 2014
Total assets 991.6 1209.4 1100.2
Non-current assets 361.2 387.3 362.5
Net working capital 62.1 24.6 40.2
Liquid funds 265.2 445.6 300.4
Net liquidity 139.0 171.7 118.6
Short-term financial debt 19.6 168.1 175.4
Long-term financial debt 106.6 105.8 6.4
Shareholders’ equity 423.9 441.9 387.9
in % of total assets 43% 37% 35%
• Currency translation adjustment with negative impact on net liquidity
• Dividend of 20.6 million CHF (4.50 CHF per share) paid out in April 2015
• Outstanding bond (2010 – 2015, 4.5%) repaid in April 2015
• Long-term financial debt includes bond issued in 2014 (100.0 million CHF, 2014 – 2020, 1.5%)
• Shareholders‘ equity ratio increased to 42.7%
Net liquidity at 139.0 million CHF and equity ratio increase to 42.7%
Investor & Analyst Briefing November 2015 43
5 – Efficient cycle management and value creation
mCHF 30.06. 2015
31.12. 2014
30.06. 2014
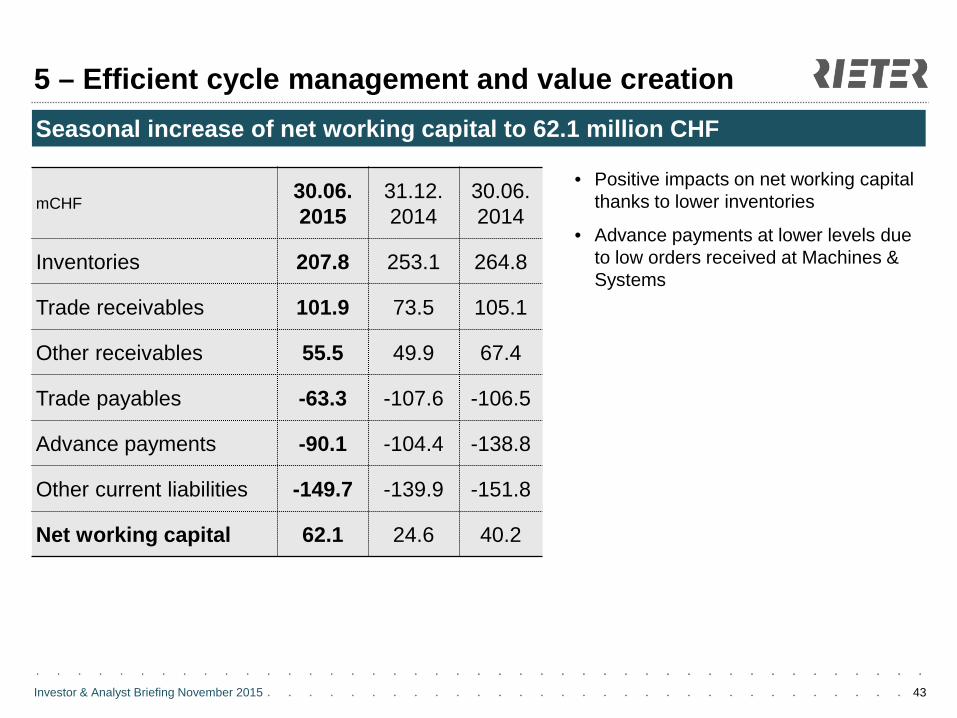
Inventories 207.8 253.1 264.8
Trade receivables 101.9 73.5 105.1
Other receivables 55.5 49.9 67.4
Trade payables -63.3 -107.6 -106.5
Advance payments -90.1 -104.4 -138.8
Other current liabilities -149.7 -139.9 -151.8
Net working capital 62.1 24.6 40.2
• Positive impacts on net working capital thanks to lower inventories
• Advance payments at lower levels due to low orders received at Machines & Systems
Seasonal increase of net working capital to 62.1 million CHF
Investor & Analyst Briefing November 2015 44
5 – Efficient cycle management and value creation
mCHF HY1 2015
HY1 2014
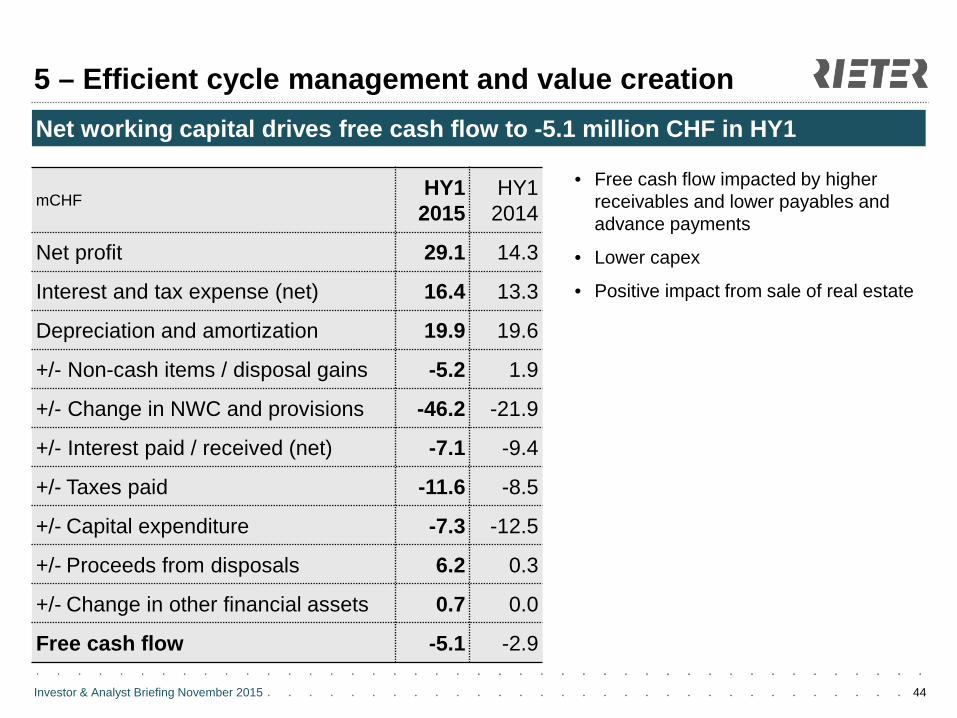
Net profit 29.1 14.3
Interest and tax expense (net) 16.4 13.3
Depreciation and amortization 19.9 19.6
+/- Non-cash items / disposal gains -5.2 1.9
+/- Change in NWC and provisions -46.2 -21.9
+/- Interest paid / received (net) -7.1 -9.4
+/- Taxes paid -11.6 -8.5
+/- Capital expenditure -7.3 -12.5
+/- Proceeds from disposals 6.2 0.3
+/- Change in other financial assets 0.7 0.0
Free cash flow -5.1 -2.9
• Free cash flow impacted by higher receivables and lower payables and advance payments
• Lower capex
• Positive impact from sale of real estate
Net working capital drives free cash flow to -5.1 million CHF in HY1
Investor & Analyst Briefing November 2015 45
5 – Efficient cycle management and value creation
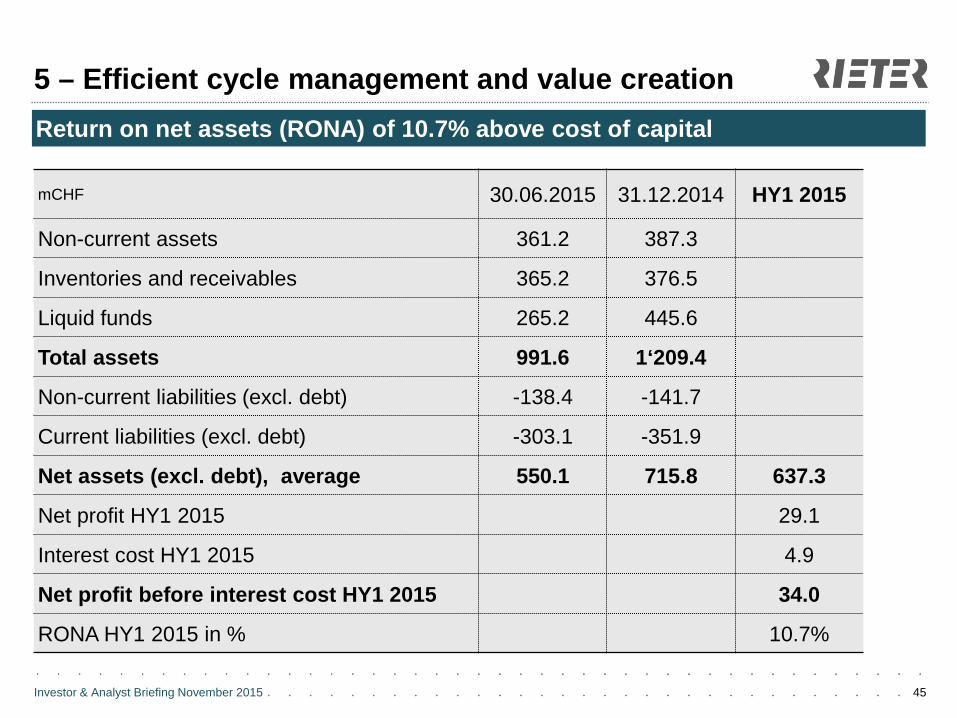
mCHF 30.06.2015 31.12.2014 HY1 2015
Non-current assets 361.2 387.3
Inventories and receivables 365.2 376.5
Liquid funds 265.2 445.6
Total assets 991.6 1‘209.4
Non-current liabilities (excl. debt) -138.4 -141.7
Current liabilities (excl. debt) -303.1 -351.9
Net assets (excl. debt), average 550.1 715.8 637.3
Net profit HY1 2015 29.1
Interest cost HY1 2015 4.9
Net profit before interest cost HY1 2015 34.0
RONA HY1 2015 in % 10.7%
Return on net assets (RONA) of 10.7% above cost of capital
Investor & Analyst Briefing November 2015
5 – Efficient cycle management and value creation
46
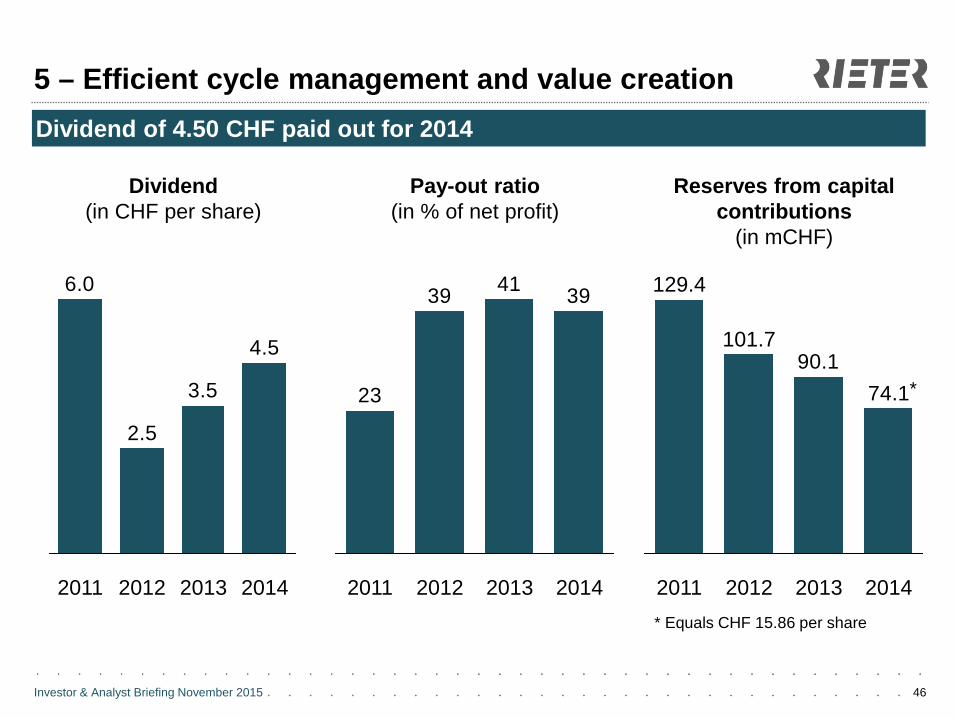
Dividend of 4.50 CHF paid out for 2014
Dividend (in CHF per share)
4.5
3.5
2.5
6.0
2014 2013 2012 2011
Reserves from capital contributions
(in mCHF)
74.190.1
2014 2013 2012
101.7
2011
129.4
Pay-out ratio (in % of net profit)
394139
23
2013 2012 2011 2014
*
* Equals CHF 15.86 per share
Investor & Analyst Briefing November 2015
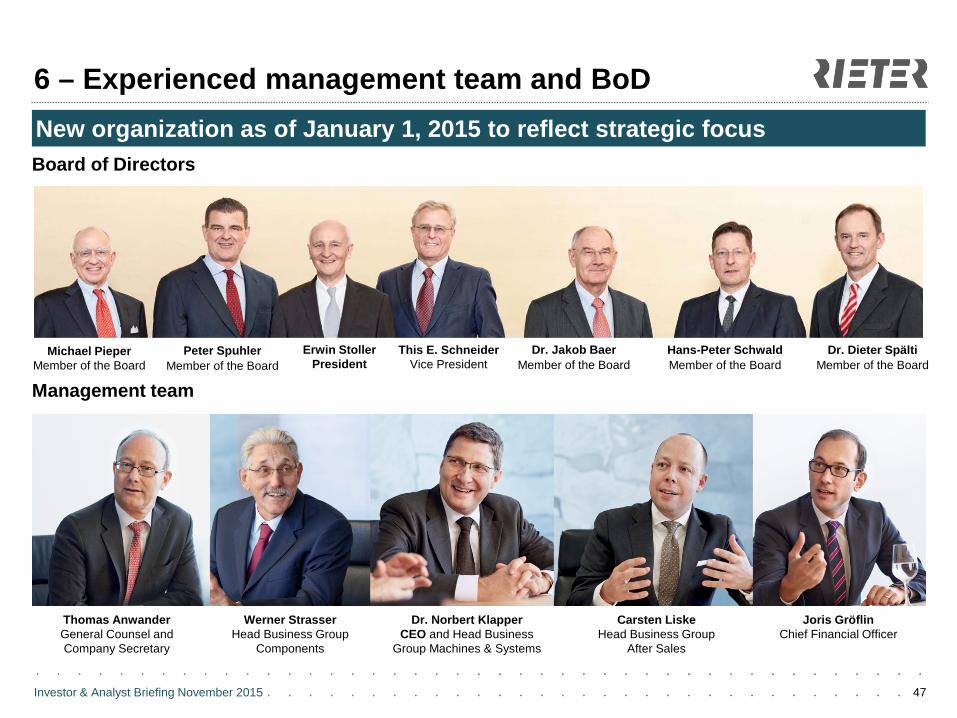
6 – Experienced management team and BoD
47
New organization as of January 1, 2015 to reflect strategic focus
Thomas Anwander General Counsel and Company Secretary
Werner Strasser Head Business Group
Components
Dr. Norbert Klapper CEO and Head Business
Group Machines & Systems
Carsten Liske Head Business Group
After Sales
Joris Gröflin Chief Financial Officer
Michael Pieper Member of the Board
Peter Spuhler Member of the Board
Erwin Stoller President
This E. Schneider Vice President
Dr. Jakob Baer Member of the Board
Hans-Peter Schwald Member of the Board
Dr. Dieter Spälti Member of the Board
Board of Directors
Management team
Investor & Analyst Briefing November 2015 48
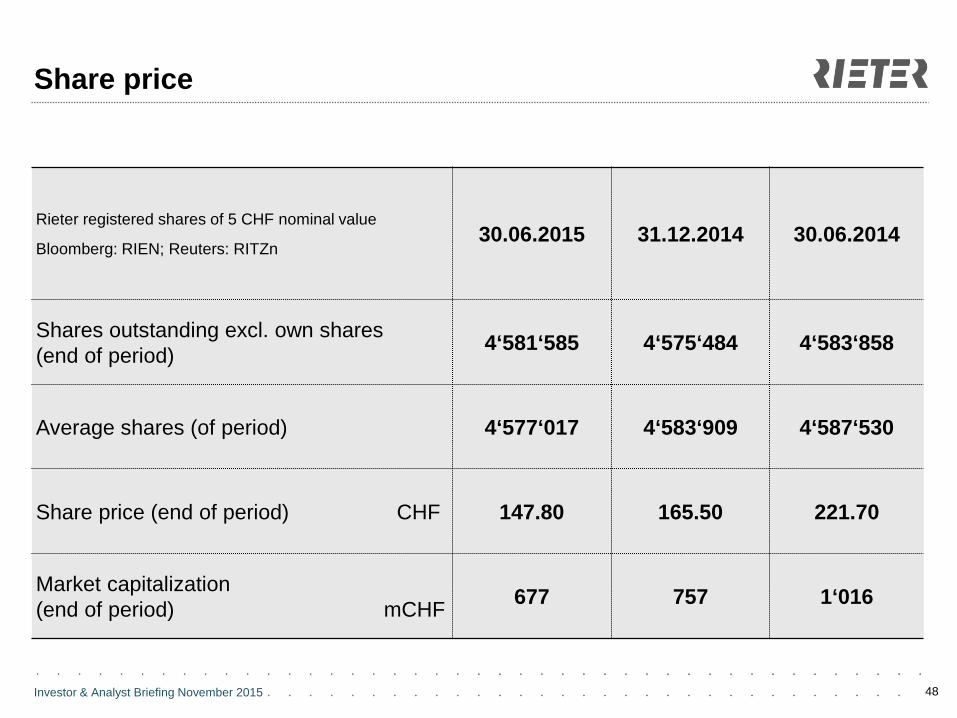
Share price
Rieter registered shares of 5 CHF nominal value
Bloomberg: RIEN; Reuters: RITZn 30.06.2015 31.12.2014 30.06.2014
Shares outstanding excl. own shares (end of period) 4‘581‘585 4‘575‘484 4‘583‘858
Average shares (of period) 4‘577‘017 4‘583‘909 4‘587‘530
Share price (end of period) CHF 147.80 165.50 221.70
Market capitalization (end of period) mCHF 677 757 1‘016