Embed Size (px)
Citation preview

8/11/2019 Investments - Lecture Notes Intro 2013-08
http://slidepdf.com/reader/full/investments-lecture-notes-intro-2013-08 1/30
INVESTMENTS
Lecture Notes
Sean M. Davis, Ph.D.
© Sean M. Davis 2010-2013, all rights reserved
Any material used in class and/or these notes that is not the work of the author is for non-commercial,
educational use, and it remains the sole property of the copyright holder(s).

8/11/2019 Investments - Lecture Notes Intro 2013-08
http://slidepdf.com/reader/full/investments-lecture-notes-intro-2013-08 2/30
“Admission of ignoranceis often the first step in our education”
– Stephen R. Covey
“If the only tool you have is a hammer,
you tend to see every problem as a nail.”
– Abraham Maslow
“Great intellects are skeptical”
– Friedrich Nietzsche

8/11/2019 Investments - Lecture Notes Intro 2013-08
http://slidepdf.com/reader/full/investments-lecture-notes-intro-2013-08 3/30
Ch 1 ‐ Understanding Investments ‐ Jones
‐ Background and Issues ‐ BKM
An INVESTMENT is ‐‐
the commitment of money or other resources now and over a period of time in the expectation
of reaping future benefit
1 Background
‐‐
you
sacrifice
something
of
value
now
expecting
to
benefit
later
Definitions:
REAL ASSETS
Used to produce goods and services
Examples: land, building, equipment, knowledge, etc
FINANCIAL ASSETS
Claims on real assets or the income generated by them
Previously they were merely pieces of paper, now they are usually electronic
Financial Asset
Types
FIXED INCOME (DEBT)
‐‐ defined cash flow over a specified period
EQUITY
‐‐ ownership share in a corporation (no promise of payment)
DERIVATIVES
‐‐ securities that derive their value from other securities
Financial Markets
Play an informational role
Allow for "consumption timing"
Invest during earning years so one can retire
Financial assets can "store" wealth
Allocate risk
Provide a vehicle or system to separate ownership from management
Investors cannot actively manage large corporations
Managers become the "agents" of the owners
Creates a well known and researched ___________ problem
AGENCY
Corporate governance is used to oversee shareholder interests
Board of directors, Sarbanes‐Oxley, etc
1 Background 1

8/11/2019 Investments - Lecture Notes Intro 2013-08
http://slidepdf.com/reader/full/investments-lecture-notes-intro-2013-08 4/30
"INVESTMENTS" is the study of the investment process
PASSIVE Management
‐‐ buying and holding without detailed analysis
ACTIVE Management
Portfolios are a collection of assets, two general approaches are to use …
1 Background
‐‐
ac ve y
ry ng
o
en y
m spr c ng
an or
ren s
Examples of ACTIVE management …
TOP‐DOWN ‐‐ Asset allocation
BOTTOM‐UP ‐‐ Focuses on securities that are attractively priced
Markets are competitive
This creates relatively fair pricing and a TRADEOFF of ______________________
RISK & RETURN
The relationship
between
RISK
and
RETURN,
and
being
paid
appropriately
for
the
risk undertaken, is an ongoing and essential part of investment analysis.
NOTE: Bond prices and yields are inversely related (negatively correlated).
Risk and return are ______________________
POSITIVELY CORRELATED
Returns and Risk
EXPECTED RETURN ‐ the ex ante return expected by investors over some future holding
period
E(rp) = the expected return for a portfolio
E(ri ) = the expected return for individual securities "i "
E(rM) the expected return of "the market" usually proxied by the S&P500
REALIZED RETURN ‐ the actual return realized over the holding period
RISK ‐ the chance that the realized or actual return on an investment differs from the
expected return
" "The "risk
free"
rate
of
return
is
usually
our
benchmark
lowest
expected
return
It is proxied by the US rate of return on Treasuries (usually the 3 month T‐bill)
While investors are usuall risk averse ‐ referrin lower risk investments ‐ the
can also be risk tolerant in that they will accept risk for which they are being
reasonably well compensated.
1 Background 2

8/11/2019 Investments - Lecture Notes Intro 2013-08
http://slidepdf.com/reader/full/investments-lecture-notes-intro-2013-08 5/30
This whole course is largely focused on this risk and return relationship ‐‐ how we measure
risk, how we estimate returns, how we can expect certain returns based on risk, how prices
today are affected by changes to risk.
1 Background
"You have to understand that being wrong is part of the process," Peter Bernstein
"At best, estimates are imprecise; at worst, they are completely wrong. The best
one can do is make the most informed return and risk estimates possible," Jones
Ethics in Investing
(refer to the Jones text and the Martha Stewart case)
1 Background 3
8/11/2019 Investments - Lecture Notes Intro 2013-08
http://slidepdf.com/reader/full/investments-lecture-notes-intro-2013-08 6/30
Ch 2 ‐ Investment Alternatives ‐ Jones
‐ Asset Classes and Financial Instruments ‐ BKM
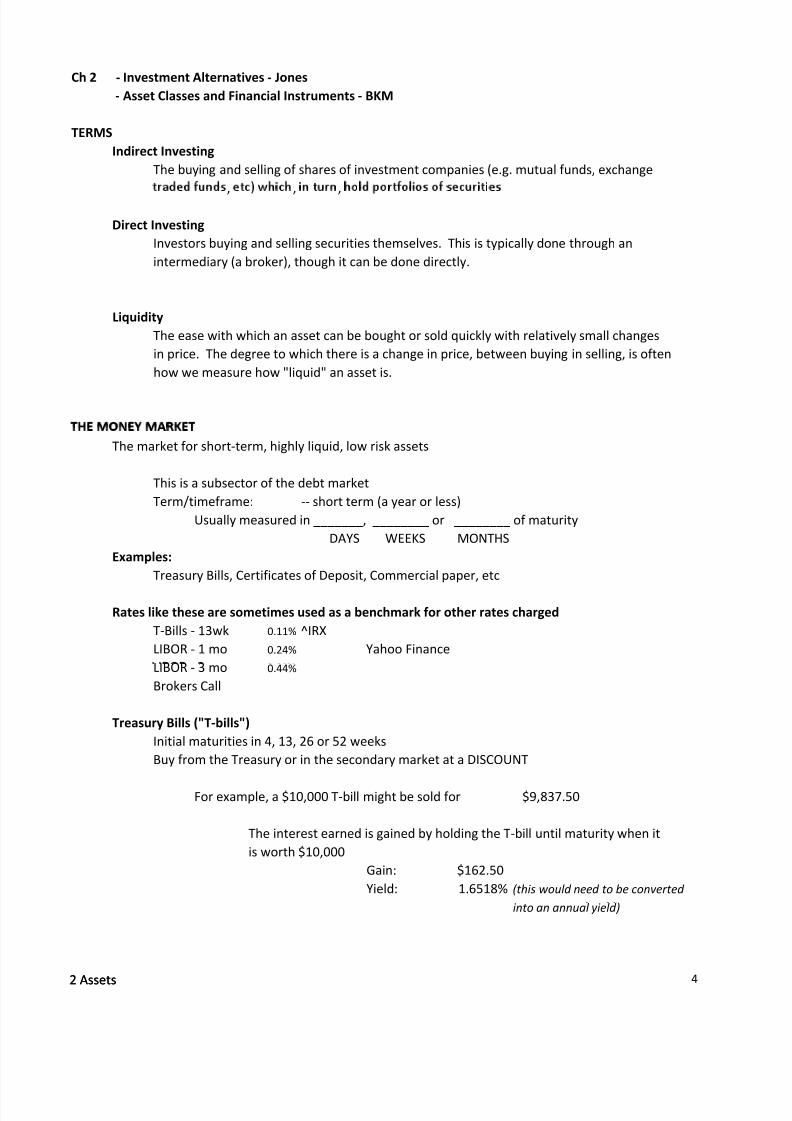
TERMS
Indirect Investing
The buying and selling of shares of investment companies (e.g. mutual funds, exchange
2 Assets
, , ,
Direct Investing
Investors buying and selling securities themselves. This is typically done through an
intermediary (a broker), though it can be done directly.
Liquidity
The ease with which an asset can be bought or sold quickly with relatively small changes
in price. The degree to which there is a change in price, between buying in selling, is often
how we measure how "liquid" an asset is.
The market for short‐term, highly liquid, low risk assets
This is a subsector of the debt market
Term/timeframe: ‐‐ short term (a year or less)
Usually measured in _______, ________ or ________ of maturity
DAYS WEEKS MONTHS
Examples:
Treasury Bills, Certificates of Deposit, Commercial paper, etc
Rates like these are sometimes used as a benchmark for other rates charged
T‐Bills ‐ 13wk 0.11% ^IRX
LIBOR ‐ 1 mo 0.24% Yahoo Finance
LIBOR ‐ 3 mo 0.44%
Brokers Call
Treasury Bills ("T‐bills")
Initial maturities in 4, 13, 26 or 52 weeks
Buy from the Treasury or in the secondary market at a DISCOUNT
For example, a $10,000 T‐bill might be sold for $9,837.50
The interest earned is gained by holding the T‐bill until maturity when it
is worth $10,000
Gain: $162.50
Yield: 1.6518% (this would need to be converted
into an annual yield)
2 Assets 4
8/11/2019 Investments - Lecture Notes Intro 2013-08
http://slidepdf.com/reader/full/investments-lecture-notes-intro-2013-08 7/30
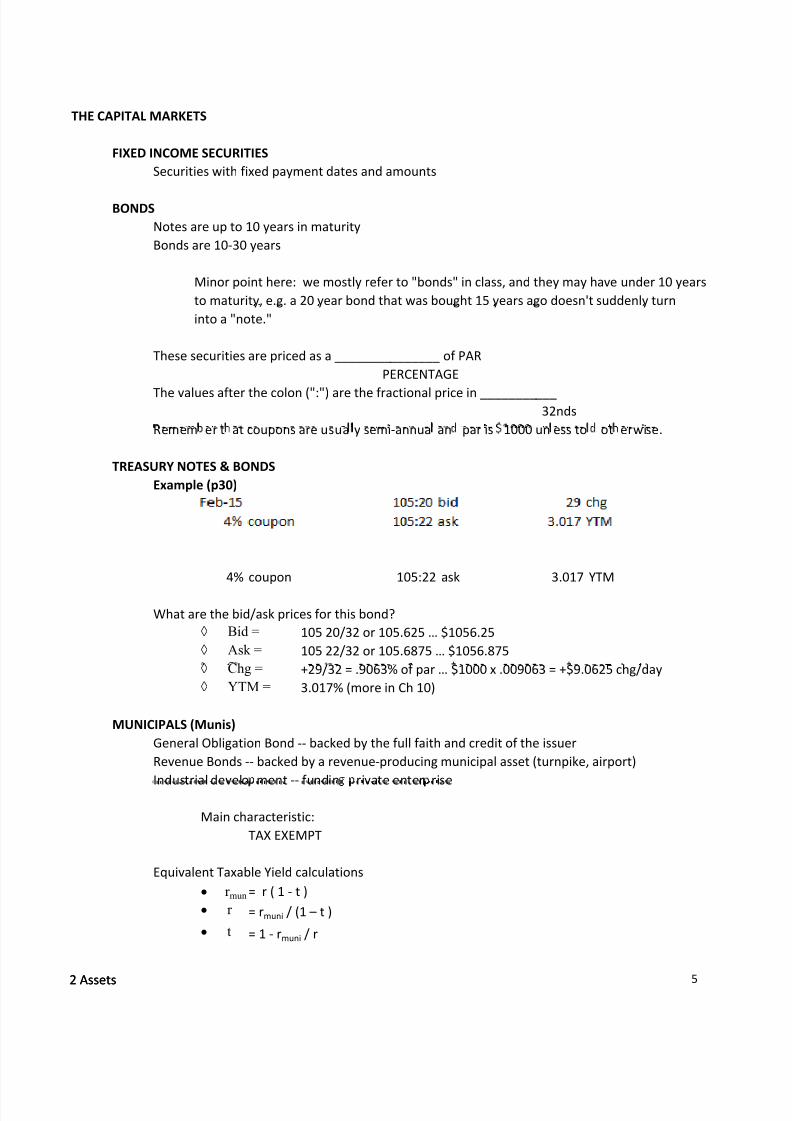
THE CAPITAL MARKETS
FIXED INCOME SECURITIES
Securities with fixed payment dates and amounts
2 Assets
BONDS
Notes are up to 10 years in maturity
Bonds are 10‐30 years
Minor point here: we mostly refer to "bonds" in class, and they may have under 10 years
to maturity, e.g. a 20 year bond that was bought 15 years ago doesn't suddenly turn
into a "note."
These securities are priced as a _______________ of PAR
PERCENTAGE
The values
after
the
colon
(":")
are
the
fractional
price
in
___________
32nds
Remem er t at coupons are usua y semi‐annua an par is 1000 un ess to ot erwise.
TREASURY NOTES & BONDS
Example (p30)
Feb‐15 105:20 bid 29 chg
4% coupon 105:22 ask 3.017 YTM
What are the bid/ask prices for this bond?
Bid = 105 20/32 or 105.625 … $1056.25
Ask = 105 22/32 or 105.6875 … $1056.875
Chg = +29/32 = .9063% of par … $1000 x .009063 = +$9.0625 chg/day
YTM = 3.017% (more in Ch 10)
MUNICIPALS (Munis)
General Obligation Bond ‐‐ backed by the full faith and credit of the issuer
Revenue Bonds ‐‐ backed by a revenue‐producing municipal asset (turnpike, airport)
Industrial develo ment ‐‐
fundin rivate enter rise
Main characteristic:
TAX EXEMPT
Equivalent Taxable Yield calculations
r mun = r ( 1 ‐ t )
r = rmuni / (1 – t )
t = 1 ‐ rmuni / r
2 Assets 5

8/11/2019 Investments - Lecture Notes Intro 2013-08
http://slidepdf.com/reader/full/investments-lecture-notes-intro-2013-08 8/30
What is the Equiv. Taxable Yield of a corporate bond relative to a municipal with a 6% yield
where the investor has a 25% tax rate?
= 6% / ( 1 ‐ .25 ) = 8%
What would you expect a municipal bond to yield that is comparable to a 7.5% corporate
2 Assets
on
n
ra ng
an
r s
w ere
nves ors
ave
an
e ec ve
ax
ra e
o
= 7.5% * ( 1 ‐ .30 ) = 5.25%
The market is pricing the yield for two bonds, one corporate and one municipal, at 9.0% and 7.0%
respectively. What assumption is the market pricing into these yields for an expected tax rate
= 1 ‐ 7.0% / 9.0% = 22.2%
CORPORATE
Secured, Unsecured (debentures), Subordinated debentures, Callable, Convertible
MORTGAGE BACKED
SECURITIES
EQUITIES more on t is ater
INDEXES
There are indexes (or indeces) that are formed to track all manner of investments
… stocks, bonds, materials, market sectors, countries, etc. Anything of interest to a large
enough group of people is being tracked in some form of index.
The ones of interest to us in this class are typically the major stock indexes:
Dow Jones
Industrial
Average 30
large,
"blue
chip"
stocks
(originally
20)
It only represents ~25% of the "market" as measured by market capitalization
Gets a disproportionate amount of media coverage relative to its significance
S&P Indexes* % of market Russell Wilshire
500 Large cap ~80% 1000 Large 5000
400 Mid cap ~7%
600 Small cap ~3%
2000 Small
"Russell 1000"
"Russell 2000"
Actually contains
* together these three indeces represent roughly 90% well over 6000 stocks
of the investable US equities and combine to be the
Russell 3000
are these combined
S&P Composite 1500
2 Assets 6

8/11/2019 Investments - Lecture Notes Intro 2013-08
http://slidepdf.com/reader/full/investments-lecture-notes-intro-2013-08 9/30
DERIVATIVE SECURITIES (also more on this later)
Options
Futures
2 Assets2 Assets 7

8/11/2019 Investments - Lecture Notes Intro 2013-08
http://slidepdf.com/reader/full/investments-lecture-notes-intro-2013-08 10/30
Ch 3 ‐ Indirect Investing ‐ Jones
Ch 4 ‐ Mutual Funds ‐ BKM
Investment companies are financial intermediaries that invest the funds of investors in securities or
other assets. They provide the opportunity for:
Record keeping
Diversification and divisibilityProfessional management
Lower transaction costs*
*Note that the overall expense ratios vary widely from fund to fund. Actively managed funds tend to
have the highest overall costs.
John Bogle, a major critic of mutual fund practices and founder of Vanguard ‐‐a leader in
low cost and "index" investing, states that the actual costs of actively managed funds
is 2.5% to as much as 3.0% annually.
Funds report a "NET ASSET VALUE" of the securities under management
NAV = ( Market value of assets minus Liabilities ) / Shares outstanding
Ex: A fund has a portfolio of 150 million
pays its managers/advisors 4 million
owes rent and admin costs of 1 million
has share outstanding of 5 million
3 Funds
[ 150.0 ‐ ( 4.0 + 1.0 ) ] / 5
= 29.00$ NAV per share
Types of funds
Trusts, REITS, Hedge funds, and Managed Investment Companies (which will be our focus)
Managed Investment Companies
Closed end funds
∙ Trade like stock – cash in or out by buying shares
Open end funds
∙ Cash in at NAV, redeem shares or cash out at NAV
Load
∙ sales charge or commission
NAVOffering price =
3 Funds 8

8/11/2019 Investments - Lecture Notes Intro 2013-08
http://slidepdf.com/reader/full/investments-lecture-notes-intro-2013-08 11/30
Mutual fund – an open‐end investment company
Money market, equity, sectors, bonds, international, balanced, index
∙ “value” or “growth”
∙ Large cap or small cap
Costs ‐Fee Structure
∙ Operating expenses – usually between 0.2% and 2.0%, i.e. 20 basis and 200 basis
∙ Front end load ∙ Back end load
· “Exit” fee or “contingent deferred sales charges”
∙ 12b-1 charges
· Fees paid for marketing and distribution costs
Returns calculations
Closed‐end funds (including Exchange Traded Funds or ETFs)
Like mutual funds but trade like stock
Are usually tracking an index but the may be actively managed
ETFs tend to have much lower expense ratios than actively managed mutual funds
Rate of return = Δ(NAV) + Distributions
Start of year NAV
Price ‐NAV
NAV=Premium or discount to NAV
3 Funds
Mutual fund companies may discontinue certain funds within their "family" of funds. This creates bias
in the reported results.
If you were to look at ACME Capital Management's family of funds and they all appear to have
performed well relative to the market, ACME may have merely shut down the losing funds. Those
fund managers were fired or transferred, and the assets were merged into the "successful" funds.
3 Funds 9

8/11/2019 Investments - Lecture Notes Intro 2013-08
http://slidepdf.com/reader/full/investments-lecture-notes-intro-2013-08 12/30
Ch 4 ‐ Securities Market and Market Indices ‐ Jones
Ch 5 ‐ How Securities are Traded ‐ Jones
Ch 3 ‐ Securities Markets ‐ BKM
HOW FIRMS ISSUE SECURITIES
Primary market
IPO's, SEO's ‐‐ stocks, bonds, private placements
Using an investment banker
Secondary market
NYSE, NASDAQ, AMEX
Using a broker/dealer
HOW SECURITIES ARE TRADED
BROKER
DEALER
Ex:
Stocks & bonds Stocks & bonds
(primary or (secondary market
secondary market) only)
"Specialist" "Specialist" or "market maker"
(a specialist can be both)
4‐5 Markets & Trading
Also: Real Estate Also: Cars
FeesCharge a commission Bid/Ask spread
percentage or flat fee
Key distinction
Brokers do not "own" the Dealers own or take title
product they are selling to what they sell … this entitles
them to any reasonable profit
they can make
Legal limitation: Broker/dealers cannot act as both on the same transaction
How
do
they
get
around
this
limitation?
A separate, legal entity (often a subsidiary) that acts as a dealer is sent (i.e. sold)
the "order flow" by the broker. The "dealer" then fills the order earning the
bid/ask spread.
Why might the move from spreads of an 1/8th or 1/4 of a dollar (i.e. 12.5 to 25 cents) to "decimalization,"
i.e. where spreads are only .01 to .05 or a dollar, or 1 to 5 cents, minimize this issue as a concern?
4‐5 Markets & Trading 10

8/11/2019 Investments - Lecture Notes Intro 2013-08
http://slidepdf.com/reader/full/investments-lecture-notes-intro-2013-08 13/30
Types of Orders
Market order ‐ execute immediately at the market price
Time is of the essence ‐ "I want it now"
Limit order (price contingent in the text) ‐ the order executes only if the price is met
Price is what matters ‐ "I only want to buy it if it drops to the price I specify"
Stop order ‐ an order with a price trigger, in effect it is a sort of "limit‐market" order
Stop Loss ‐if a stock drops below a certain price, a holder of the stock can put in a stop loss
to prevent further losses.
Stop Buy ‐ if a stock rises above a certain price, the limit is reached and the stock is purchased
We can think of stop orders as a sort of "limit‐market" order because once the trigger is
reached, we want to buy or sell the stock immediately. Therefore, once triggered, the
stop order becomes a market order.
INTC BA
4‐5 Markets & Trading4‐5 Markets & Trading 11

8/11/2019 Investments - Lecture Notes Intro 2013-08
http://slidepdf.com/reader/full/investments-lecture-notes-intro-2013-08 14/30
BUYING ON MARGIN
Securities, like other assets (cars, homes), can be purchased with borrowed money
"Broker's Call Loans" are easily made to investors who want to LEVERAGE their position
in a stock. Leverage increases ________ which also increases potential ___________.
RISK RETURNS
INITIAL MARGIN required ‐‐ the initial equity percentage ‐‐ is almost always _____________
50%
This intial margin requirement may be satisfied with cash or other stock. We also
can refer to a margin transaction like this as having 2 to 1 leverage …
Example:
ASSETS LIABILITIES & OWNER EQ.
200 shares at 50.00$ Broker Loan $5,000
position value is $10,000 Equity (your cash) $5,000
Equity % 50.0% Position Gain(Loss) $0 0.0%Investor Gain(Loss) $0 0.0%
Equity in the account
Note that this 2:1 leverage ratio applies to retail investors for equity transactions.
You will hear of many examples of much higher leverage ‐‐4:1 (daytraders), 7:1 for
Margin = Value of the stock
4‐5 Markets & Trading
certain institutional investors, even 30:1 (or more) for banks.
Maintenance
marginThe broker who loaned money against the position requires that a minimum level of equity
be "maintained" in the account. If the equity margin percentage falls below a certain
threshold ‐‐ the maintenance margin percentage, this triggers a _____________.
MARGIN CALL
Once a margin call is triggered, the investor will be required to increase the account's equity
level to a pre‐defined level.
To find the price below which a margin call will be triggered:
Shares * Price ‐ Broker Loan
200P ‐ 5000
200P
Shares * Price = Maintenance Margin %
= 30% $35.714P =
4‐5 Markets & Trading 12
8/11/2019 Investments - Lecture Notes Intro 2013-08
http://slidepdf.com/reader/full/investments-lecture-notes-intro-2013-08 15/30
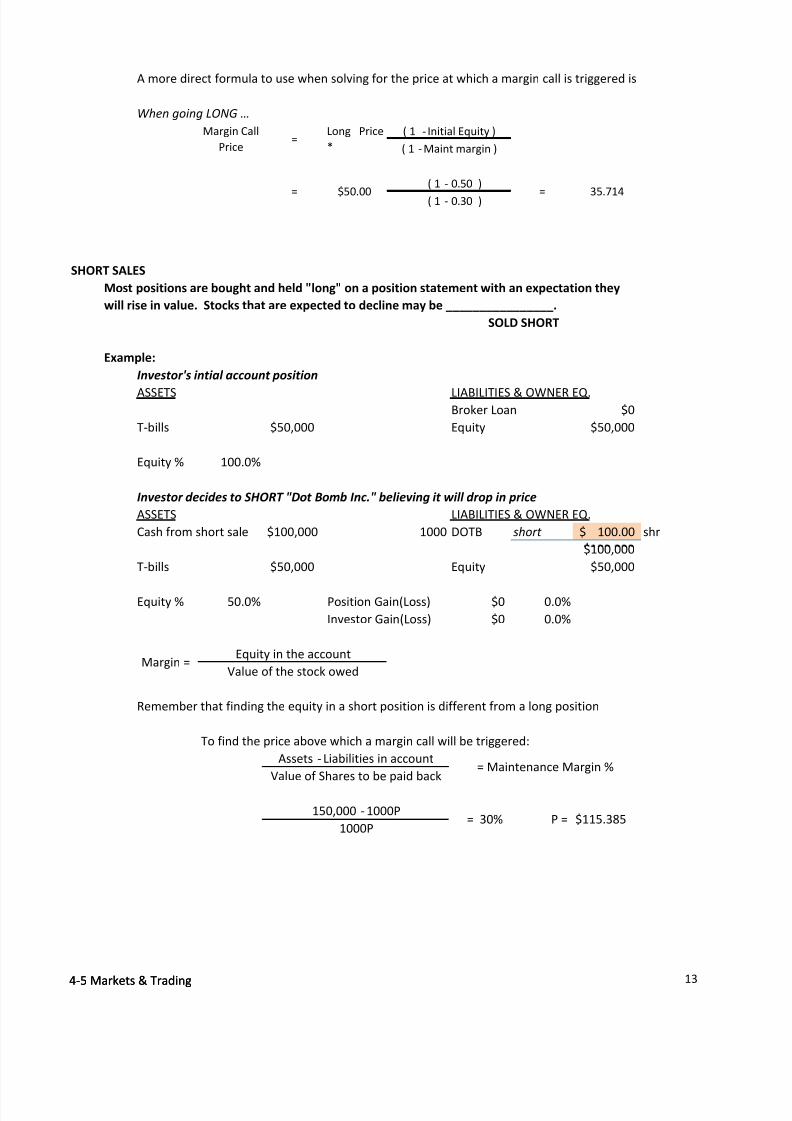
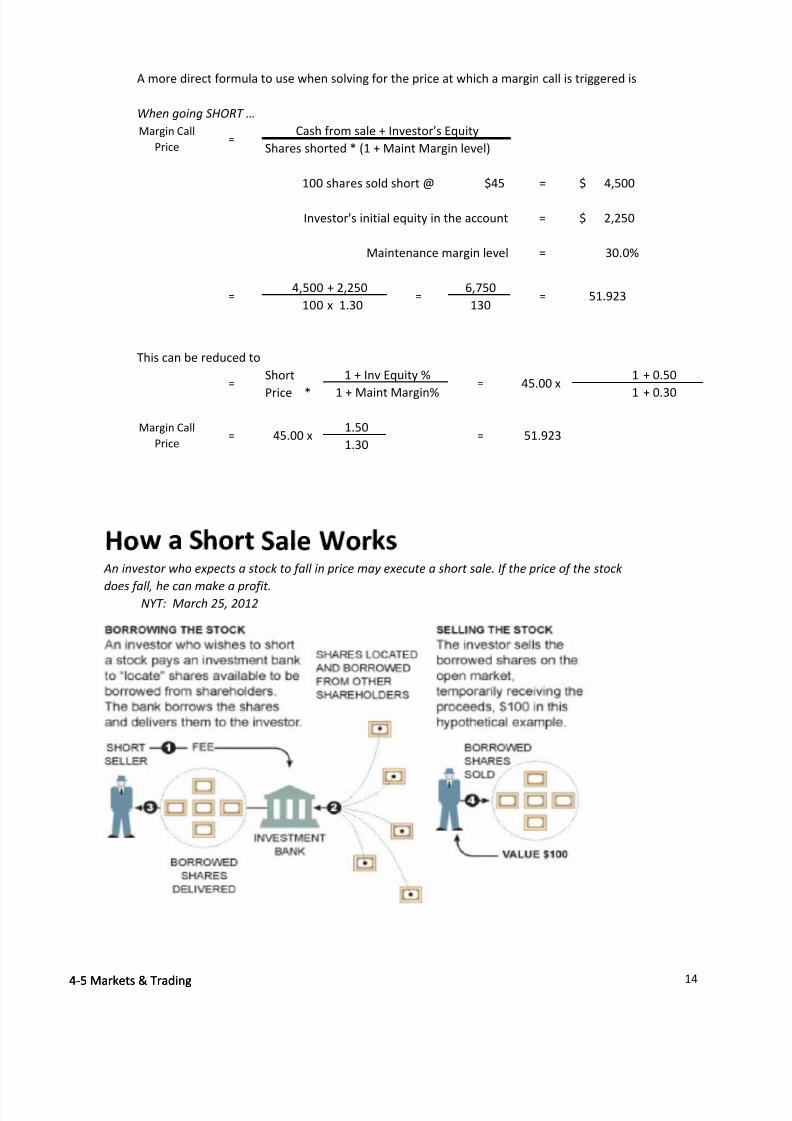
A more direct formula to use when solving for the price at which a margin call is triggered is
When going LONG …
( 1 ‐ 0.50 )
( 1 ‐ 0.30 )
SHORT SALES
Most positions are bought and held "long" on a position statement with an expectation they
will rise in value. Stocks that are expected to decline may be ________________.
SOLD SHORT
Example:
Investor's intial account position
ASSETS LIABILITIES & OWNER EQ.Broker Loan $0
T‐bills $50,000 Equity $50,000
Equity % 100.0%
Investor decides to SHORT "Dot Bomb Inc." believing it will drop in price
ASSETS LIABILITIES & OWNER EQ.
Cash from short sale $100,000 1000 DOTB short 100.00$ shr
Margin Call
Price =
Long Price
*
( 1 ‐ Initial Equity )
( 1 ‐Maint margin )
= $50.00 = 35.714
4‐5 Markets & Trading
$100,000
T‐bills $50,000 Equity $50,000
Equity % 50.0% Position Gain(Loss) $0 0.0%
Investor Gain(Loss) $0 0.0%
Remember that finding the equity in a short position is different from a long position
To find the price above which a margin call will be triggered:
1000P P = $115.385
Assets ‐ Liabilities in account
150,000 ‐ 1000P = 30%
Value of the stock owed
Equity in the accountMargin =
= Maintenance Margin %Value of Shares to be paid back
4‐5 Markets & Trading 13
8/11/2019 Investments - Lecture Notes Intro 2013-08
http://slidepdf.com/reader/full/investments-lecture-notes-intro-2013-08 16/30
A more direct formula to use when solving for the price at which a margin call is triggered is
When going SHORT …
Shares shorted * (1 + Maint Margin level)
100 shares sold short @ $45 = 4,500$
Investor's initial equity in the account = 2,250$
Maintenance margin level = 30.0%
4,500 + 2,250 6,750
100 x 1.30 130
This can be reduced to
1 + 0.50
1 + 0.30
1.50
1.30
Margin Call
Price =
Cash from sale + Investor's Equity
= = = 51.923
= 1 + Inv Equity %
1 + Maint Margin%
Margin Call
Price = = 51.923
Short
Price *
= 45.00 x
45.00 x
4‐5 Markets & Trading
An investor who expects a stock to fall in price may execute a short sale. If the price of the stock
does
fall,
he
can
make
a
profit.NYT: March 25, 2012
4‐5 Markets & Trading 14

8/11/2019 Investments - Lecture Notes Intro 2013-08
http://slidepdf.com/reader/full/investments-lecture-notes-intro-2013-08 17/30
4‐5 Markets & Trading4‐5 Markets & Trading 15

8/11/2019 Investments - Lecture Notes Intro 2013-08
http://slidepdf.com/reader/full/investments-lecture-notes-intro-2013-08 18/30
Ch 13 ‐ Economy/Market Analysis ‐ Jones
Ch 14 ‐ Sector/Industry Analysis ‐ Jones
Ch 12 ‐ Macroeconomic and Industry Analysis ‐ BKM
A great deal of time and effort is spent in investment analysis focusing on the firm alone.
13‐14
Industry
Analysis
or
examp e,
one
approac
s
,
w c
nc u es
u
s
no
m e
o:
Balance sheet analysis
Comparisons of ratios with industry norms
Estimates of current and future cash flows
The strength and track record of the management team
The existing and new product pipeline
Barriers to entry in new or current markets
These are all elements of a business under which the company, through management and its
employees, is largely under control.
Some people focus all their time and effort looking for individual companies that are
UNDERVALUED this way, and we consider this a BOTTOM UP approach.
However, there are things well BEYOND the control of the firm, such as:
The Global Economy
The Domestic Macroeconomy
GDP, Employment, Inflation, Interest Rates, etc
Business Cycles
Now, we will still hold the management team of a firm responsible for properly navigating through
a recession or even an expansionary period.
A rising tide lifts all boats, and a falling one tends to lower all boats, but do all tides affect
all irms the same wa ?
13‐14
Industry
Analysis 16

8/11/2019 Investments - Lecture Notes Intro 2013-08
http://slidepdf.com/reader/full/investments-lecture-notes-intro-2013-08 19/30
Step 1. Analyze the Economy and/or Market
Step 2. Focus on Sectors/Industries that appear attractive
Step 3. Analyze and value individual companies (using the fundamentals above)
13‐14
Industry
Analysis
…
us
uy
more
o
e
sec ors n us r es
you
e eve
w
o
e er
n
e
near
u ure
We won't be spending a great deal of time on how to analyze the economy (I'll leave that to the
macro‐economics folks), but information is often readily available ‐‐ analysts do specialize in it
and their research is often readily available, plus inferences can be drawn from something as
simple as a yield curve … (see the Jones text for more)
What can we infer from these yield curves? (OK, what's a picture worth?)
How are industries defined? [Important: this can significantly vary by who is doing the defining]
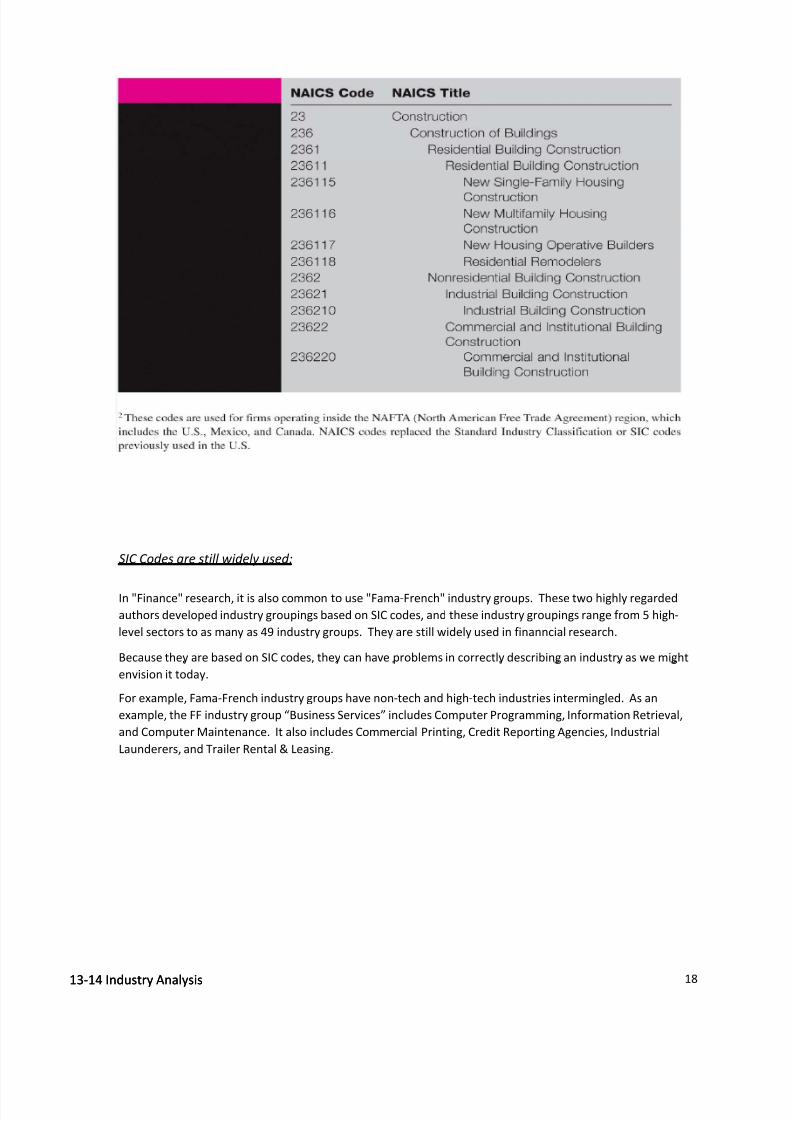
Standard Industrical Classification (SIC) System ‐ still in use, but SIC codes are dated
North American Industry Classification System (NAICS) ‐ allows for more precise classifications
Newer industries that didn't exist in the WW2‐SIC era can be properly classified
Global Industry Classification Standard (GICS) ‐ a global standard from Standard & Poors
13‐14
Industry
Analysis 17
8/11/2019 Investments - Lecture Notes Intro 2013-08
http://slidepdf.com/reader/full/investments-lecture-notes-intro-2013-08 20/30
13‐14
Industry
Analysis
SIC Codes are still widely used:
Because they are based on SIC codes, they can have problems in correctly describing an industry as we might
In "Finance" research, it is also common to use "Fama‐French" industry groups. These two highly regarded
authors developed industry groupings based on SIC codes, and these industry groupings range from 5 high‐
level sectors to as many as 49 industry groups. They are still widely used in finanncial research.
envision it today.
For example, Fama‐French industry groups have non‐tech and high‐tech industries intermingled. As an
example, the FF industry group “Business Services” includes Computer Programming, Information Retrieval,
and Computer Maintenance. It also includes Commercial Printing, Credit Reporting Agencies, Industrial
Launderers, and Trailer Rental & Leasing.
13‐14
Industry
Analysis 18

8/11/2019 Investments - Lecture Notes Intro 2013-08
http://slidepdf.com/reader/full/investments-lecture-notes-intro-2013-08 21/30
While not always easy to predict, different industries follow different business cycles
First, economic activity tends to follow a cyclical pattern
13‐14
Industry
Analysis
Some in ustries respon very i erent y to economic cyc es
Just like individual companies, some industries are at different stages in their growth cycle
13‐14
Industry
Analysis 19

8/11/2019 Investments - Lecture Notes Intro 2013-08
http://slidepdf.com/reader/full/investments-lecture-notes-intro-2013-08 22/30
This leads us to consider SECTOR ROTATION as a potential investment strategy
this is just one potential approach
13‐14
Industry
Analysis
This does NOT mean you would necessarily rotate your entire portfolio from energy
and into HEALTH CARE if you believed the economy was heading into recession.
What does it mean? What are ways to use this type of information
% of % Price Change For
Standard &
Poors
Indeces Index
Value S&P
1500
* 1
Wk 13
Wks YTD '12 5
Yrs
S&P 500 1402.43 88.21 ‐1.9 ‐2.7 11.5 0 ‐0.9
S&P MidCap 400 1004.33 8.23 ‐1.8 1.6 14.2 ‐3.1 3.2
S&P SmallCap 600 467.41 3.56 ‐1.8 ‐0.1 12.6 ‐0.2 3.4
S&P Composite 1500 324.28 100.00 ‐1.9 ‐2.2 11.8 ‐0.3 ‐0.4
Data as o Dec 28 2012
,
Source: S&P Capital IQ, NetAdvantage, Stovall's Sector Card * the S&P1500 represents approximately 90% of all US stock value
Where can you get information like this for class? The UNF Library
http://www.unf.edu/library/research/subjects/Business,_Finance,_Investment.aspx
Then "S&P Net Advantage"
Then "Industries"
Then "Stovall's Sector Card"
13‐14
Industry
Analysis 20

8/11/2019 Investments - Lecture Notes Intro 2013-08
http://slidepdf.com/reader/full/investments-lecture-notes-intro-2013-08 23/30
Sectors by Global Industry Classification Relative Recommended
System (GICS) Strength
Consumer Discretionary Sector Summary 3.6 4 Overweight
Consumer Staples Sector Summary 3.9 2 Marketweight
STARS Weighting
Rankings
13‐14
Industry
Analysis
nergy
ec or
ummary
. ar e we gFinancials Sector Summary 3.5 5 Marketweight
Health Care Sector Summary 3.9 4 Overweight
Industrials Sector Summary 3.5 3 Overweight
Information Technology Sector Summary 3.6 3 Marketweight
Materials Sector Summary 3 3 Underweight
Telecommunication Services Sector Summary 3.2 3 Marketweight
Utilities Sector Summary 3.3 1 Underweight
Rankings: 5 (best) to 1 (worst)
Weighting: Overweight= Increased exposure to sector.
Marketweight= No change
in
exposure.
Underweight= Decreased exposure to sector.
% of Relative
S&P 1500 1 Wk 13 Wks YTD '12 5 Yrs Strength
Consumer Discretionary (S 348.75 11.73 ‐1.6 ‐0.5 19.5 3.7 7.3 3.6 4
STARS
% Price Change For
GICS Sub‐Industries for:
Index
Value
Rankings
Consumer Staples (Sector) 372.83 9.87 ‐2.1 ‐3.2 6.6 10.8 3.8 3.9 2
Energy (Sector) 551.82 10.29 ‐3 ‐5 0 2.1 ‐2.7 4.2 2
Financials (Sector) 242.11 16.37 ‐1.4 3.3 22.6 ‐16.6 ‐10 3.5 5
Health Care (Sector) 469.44 11.79 ‐1.9 ‐1.9 14.5 9.6 2.8 3.9 4
Industrials (Sector) 341.88 10.91 ‐1.8 2.1 11.7 ‐3 ‐1 3.5 3
Information Technology (S 468.93 18.65 ‐2.2 ‐7.3 10.9 0.1 2.2 3.6 3
Materials (Sector) 247.23 4.01 ‐0.7 0.8 11.8 ‐10.1 ‐1.2 3 3
Telecommunication Servic 143.33 2.77 ‐1.2 ‐8.1 11.2 0.5 ‐3.2 3.2 3
Utilities (Sector) 197.27 3.58 ‐2.5 ‐5 ‐3.8 14.6 ‐3 3.3 1
Data as of Dec 28, 2012
13‐14
Industry
Analysis 21

8/11/2019 Investments - Lecture Notes Intro 2013-08
http://slidepdf.com/reader/full/investments-lecture-notes-intro-2013-08 24/30
Ch 6 ‐ Risk and Return ‐ Jones (Ch 5 in BKM)
Total Return or Holding Period Returns
TR or
HPR =
nding Price ‐ Beginning Price + Cash Dividen
Beginning Price
Put another
way:
Or …
P1 ‐P0 +
Income
(if
any)
P0
P1 + Income
P0
‐ 1
We purchased shares in a fund for
30.00$ and later sold them for
37.50$ being paid dividends of
5.00$ along the way.
What's the HPR? 37.50$ ‐ 30.00$ + 5.00$
= 41.7%.
37.50$ + 5.00$
30.00$
IMPORTANT: don't forget to subtract the "1"
if you use this method
= 1.417 Alt:
Note that there is no measurement of __________ in an HPR calculation.
TIME
"Return Relative" is used in the Jones text and refers to the TR or HPR plus 1.
therefore RR = HPR in decimal form + 1.0
HPR in decimal form = RR ‐ 1
Cumulative Wealth Index is another way to measure a Total or Holding Period
Return, but
1) an index value is used, i.e. we assume a starting investment of $1
2) we multiply this value times each period's return plus 1 (or the RR)
3) because we started with $1, our ending value will be in monetary
terms, not in a return. Therefore, the CWI is a measure of wealth
or the money in hand at the end of the holding period. To convert
this to a percentage return, multiply by 100.
If I had an investment with the following returns:
1 2 3 4
HPR 10.0% 25.0% ‐20.0% 25.0%
The CWI would be
1.10 x 1.25 x .80 x 1.25 = 1.375
6 Risk‐Return 22

8/11/2019 Investments - Lecture Notes Intro 2013-08
http://slidepdf.com/reader/full/investments-lecture-notes-intro-2013-08 25/30
This means if we started with $1, we would have $1.375 in our account at the end
of year 4
We can use the index to determine how much we'd have no matter how
much with which we started: Starting Ending
10,000 13,750
=Starting * CWI
6 Risk‐Return
MULTI‐PERIOD RETURNS
Arithmetic Average
Period HPR This is merely a simple mean of the returns:
.
2 25.0% 10.0% + 25.0% + ‐20.0% + 25.0%
3 ‐20.0%
4 25.0%
(sum of HPR's) / #Periods … or in Excel "=Average( HPRs )
10.0% … but this value ignores ________________
4
Geometric Average
= ( 1 + GeoAvg ) N
= ( 1 + HPR1 ) * ( 1 + HPR2 ) * ( 1 + HPR3 ) * ... ( 1 + HPRN )
1.10 x 1.25 x .80 x 1.25 = 1.375
Now you need to adjust for the 4 periods of growth.
1.375 1/4 = 1 + the GeoMean
TI BAII: 1.375 "yx" key, ".25", "= 1.0829 ‐ 1 8.29%
HP12c: 1.375 "enter", ".25", "yx"
How can you easily check your result (to make sure you did it right)?
1.0829 4
= 1.375
How could you calculate a geometric average using the TVM functions of your calculator?
TVM: N i PV PMT FV
4 (1.0) 1.375 remember to have one of the
8.29% solve for "I" CFs be negative
6 Risk‐Return 23

8/11/2019 Investments - Lecture Notes Intro 2013-08
http://slidepdf.com/reader/full/investments-lecture-notes-intro-2013-08 26/30
Other examples:
Someone offers you an investment claiming to triple your money in 3 years? What
compound annual growth rate (CAGR) is assumed by this investment "opportunity?"
N i PV PMT FV
3 44.2% (1.0) 0 3.0 remember that "0" is assumed if
you don't enter the value, i.e. PMT
6 Risk‐Return
How many years would it take to double your money if it grew at a rate of 15%/year?
N i PV PMT FV
4.96 15.0% (1.0) 0 2.0 remember to clear the TVM registers
between problems
You bought a stock 10 years ago for $12.50 which is now worth $100. The company
re nves e a earn ngs an never pa a v en .
What is the stock's HPR and its CAGR?
HPR = 700% = $100 / $12.50 ‐1
N i PV PMT FV10 23.1% (12.5) 0 100.0
CAGR = 23.1%
Dollar Weighted Returns
Analogous to an investment's IRR. It captures the varying amounts under management.
We won't be spending much time with it.
RISK
Return and risk are opposite sides of the same coin
They are positively correlated. They may not be directly correlated, as in 1 to 1, but
they will always go up and down together. Higher returns come with higher risks.
Lower risks mean you should expect lower returns.
If you take anything away from this class in your future investment lives, make
sure you don't forget this. Anyone who tries to sell you a low risk investment
that has an abnormally high return: is probably underinformed, not telling you
about all the true risks involved, or may be actually trying to cheat you (or all 3).
Interest rate risk
Market risk
Inflation risk
Business risk
Financial risk
Liquidity risk
Currency risk
Country risk
6 Risk‐Return 24

8/11/2019 Investments - Lecture Notes Intro 2013-08
http://slidepdf.com/reader/full/investments-lecture-notes-intro-2013-08 27/30
Measuring Risk
If a stock or a mutual fund had the following annual historical returns
1 2 3 4
10% 10% 10% 10%
6 Risk‐Return
We would be very likely to "expect" this investment to return how much
in the following year? 10% of course.
If some investments returned
1 2 3 4 E(ri ) σ
A 10% 10% 10% 10% 10.0% 0.00%
B 10% 8% 12% 10% 10.0% 1.63%
C 7% 9% 11% 13% 10.0% 2.58%
‐‐ . .
What would we expect them to return in the next period?
How would be choose from between them?
Risk is often associated with the dispersion of the likely outcomes.
This means the variability of the outcomes
Variability ≈ Variance = (Standard Deviation)2
Therefore we will use the standard definition ‐‐ σ ‐‐ as one of
our measures of the riskiness of an investment.
This does not mean that high StDev investments are bad and should be
avoided. We use this measure to compare different investments and
select which ones return the most relative to their risk.
Expected Returns and Standard Deviation of a Portfolio ‐Scenario Analysis
Some texts use a robabilit distribution at this oint to estimate an "ex ected return" ‐‐
"E R ".
.
There are many ways to estimate an expected return as shown above. For Project 1, USE
THE ARITHMETIC MEAN. We will use probabilities in calculating E(R) later.
NOTE: Your practice problems will ask you to calculate many expected returns and st.dev.
for portfolios by combining assets (stocks, bonds, funds) with known returns or risk.
These are usually nothing more than simple weighted average calculations.
6 Risk‐Return 25

8/11/2019 Investments - Lecture Notes Intro 2013-08
http://slidepdf.com/reader/full/investments-lecture-notes-intro-2013-08 28/30
A portfolio is made by combining the two assets:
Secu E(R ) σ % of each Expected value for portfolio
A 14.0% 20.0% 30% E(Rp) σp
B 7.0% 30.0% 70% 9.1% 27.0%
That is, the sum of the weights of each security times the value (return or st. dev.).
* *
6 Risk‐Return
e.g.
P =
A
A +
B
B9.1% .30 x 14.0% + .70 x 7.0%
σp =
27.0% .30 x 20.0% + .70 x 30.0%
RISK PREMIUM
Because we expect to be paid for taking on extra risk ‐ in the form of higher returns,
higher risk investments have "premium" we expect them to pay us for the extra risk,
the risk premium.
Risk Premium
or
RP
=
The
nominal
return
of
the
security
minus
the
T‐
bill
rate
OR = The nominal return usuall e uities minus US Gov't "Lon bond" rate
We can use the arithmetic mean or the geometric mean to estimate the
nominal return. For simplicity in this class, we'll use the arithmetic mean for
expected returns unless told otherwise, and use the T‐bill for your risk free.
A few terms: The real rate on any security is after adjusting for inflation
The nominal rate
is the "named" or stated rate, i.e. not adjusted for i
Long bonds usually refer to the 10 year Treasury bonds, a benchmark
The risk free rate is usually proxied by the T‐bill (the 3 month or 13 week
bill), however the Long Bond may be used in the Risk Premium calculation.
This does not mean we refer to the Long Bond as the "risk free" rate.
In actuality, the "risk free" rate still has risks. (You should be able to
name a couple.) All textbooks tend to use the term ‐‐
Risk free = r f
A more proper term to use would be the "minimal risk" asset
but
r is
not
et
in
wide
use
Reward to Volatility ‐‐The Sharpe Ratio
E(r p ) ‐r f
σ p
S =
Portfolio risk premium
St Dev of the portfolio excess return=
9.1% ‐ 5.0% =
27.0% 15.2%
6 Risk‐Return 26

8/11/2019 Investments - Lecture Notes Intro 2013-08
http://slidepdf.com/reader/full/investments-lecture-notes-intro-2013-08 29/30
Interest Rates
Nominal Rate (R) ‐ The rate that has not been adjusted for _____________
INFLATION (i)
Real Rate (r) ‐ Inflation adjusted rate ‐ "the excess of the interest rate over the inflation rate"
Also: The rate that captures the increase in purchasing power
6 Risk‐Return
1 + R R - i
1 + i 1 + i
Asset Allocation and the Capital Allocation Line (CAL)
r ≈ R - i 1 + r = r =
We typically refer to the portfolio we formed above as a ________________ portfolio.
RISKY
When we combine this with a RISK‐FREE ASSET, we call it a ______________ portfolio.
COMPLETE
Secur. E(R ) σ S % of each Expected value for portfolio
R s y 15.5 27.0 15.2 50 p σp
rf 5.0% 0.0% 50% 10.25% 13.50%
Note that as we introduce risk‐free assets into our complete portfolio, the
_________________ declines and _________________ declines
expected return standard deviaion
Calculate the Sharpe ratio for the complete portfolio:
10.25% ‐ 5%
13.50%38.89%=
6 Risk‐Return 27

8/11/2019 Investments - Lecture Notes Intro 2013-08
http://slidepdf.com/reader/full/investments-lecture-notes-intro-2013-08 30/30
Key concept regarding the Sharpe ratio and the CAL:
Recall that a straight line can be expressed as y = mx + b
y = m x + b
E(rp) = Sharpe σp + rf
14.72% 38.89% 25.00% + 5.0%
The Sharpe ratio is the slope of the CAL, and any portfolio formed along
the Capital Allocation Line has the same reward to variability ratio.