Embed Size (px)
Citation preview
Karine Fourneron, Stéphane Ciriani - September 2015
07/09/15
Investments in Telecommunications Services higher in the US than in the EU: a robust,
enduring and increasing gap observed whatever the source
Main findings
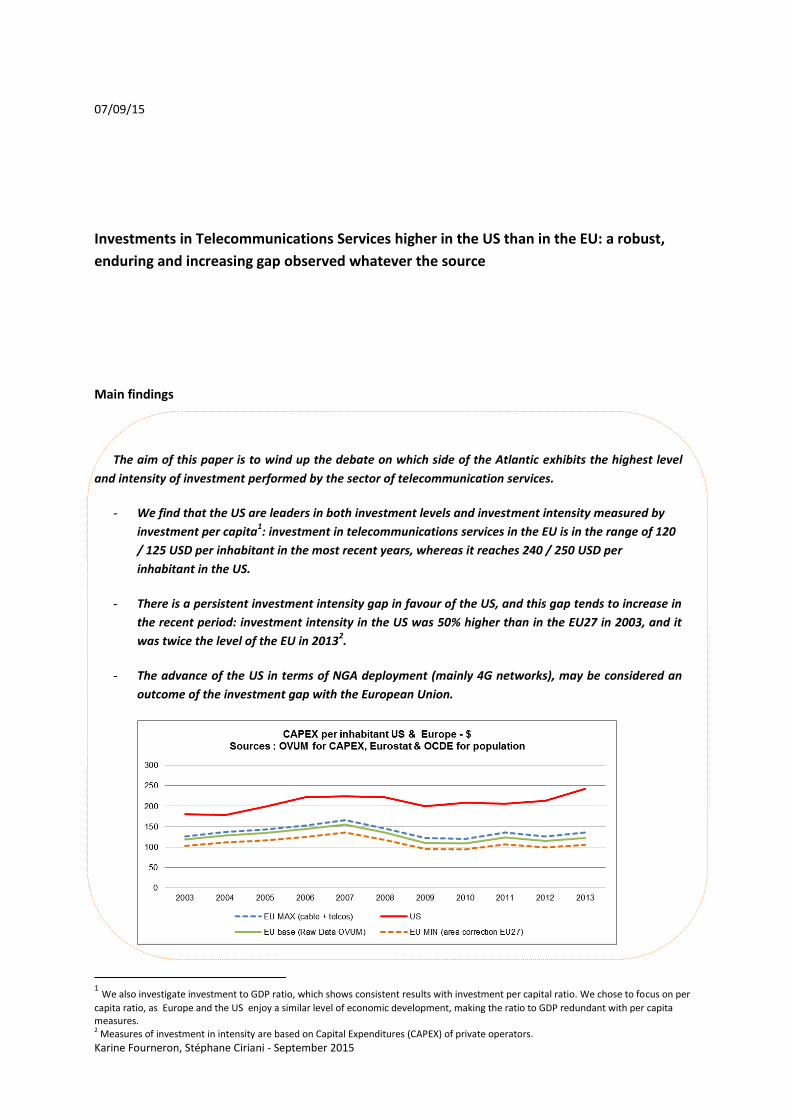
The aim of this paper is to wind up the debate on which side of the Atlantic exhibits the highest level
and intensity of investment performed by the sector of telecommunication services.
- We find that the US are leaders in both investment levels and investment intensity measured by
investment per capita1: investment in telecommunications services in the EU is in the range of 120
/ 125 USD per inhabitant in the most recent years, whereas it reaches 240 / 250 USD per
inhabitant in the US.
- There is a persistent investment intensity gap in favour of the US, and this gap tends to increase in
the recent period: investment intensity in the US was 50% higher than in the EU27 in 2003, and it
was twice the level of the EU in 20132.
- The advance of the US in terms of NGA deployment (mainly 4G networks), may be considered an
outcome of the investment gap with the European Union.
1 We also investigate investment to GDP ratio, which shows consistent results with investment per capital ratio. We chose to focus on per
capita ratio, as Europe and the US enjoy a similar level of economic development, making the ratio to GDP redundant with per capita measures. 2 Measures of investment in intensity are based on Capital Expenditures (CAPEX) of private operators.
Karine Fourneron, Stéphane Ciriani - September 2015
Summary
This paper is a contribution to the ongoing debate on the gap between the US and the EU in terms of
investment by the sector of telecommunications services. On the basis of a research on all available sources of
investment data, we derive a robust assessment of investment levels and investment intensities in each area,
and draw a comparison that controls for the identified measurement inaccuracies. We compare investment
trends in both areas by analysing capital expenditures provided by industry sources and Gross Fixed Capital
Formation (GFCF) provided by National Accounts. In an appendix section, we assess for the robustness of each
measure by identifying the factors that explain the discrepancies between industrial and institutional sources.
Comparison based on aggregate CAPEX by continent: US are above the EU over 2000-2013
Comparison in terms of aggregate private operators’ CAPEX levels and CAPEX per capita shows a persistent
gap between the EU-273 and the US, which does increase over the recent period: the United-States are above
the European Union throughout the period and the gap has increased since the macroeconomic downturn in
2009. Inconsistencies between sources and possible measurement inaccuracies (particularly for EU-27) are
unlikely to affect significantly the estimated gap of CAPEX per capita between EU-27 and US. We find that
CAPEX per capita reached USD 118 in 2003 and USD 122 in 2013 in Europe (with a +/- 10% uncertainty),
whereas it reached respectively USD 180 and USD 242 in the US.
Comparison based on GFCF by continent: US are above the EU over 2000-2013
The United-States are above the European Union in terms of investment levels and investment intensities
over the period and the gap has increased since 2009. Between 2000 and 2002, after the internet bubble, the
gap has been decreasing due to a sharp relative decline of investment in the US, but it has not led Europe to
catch-up. After 2002, investment recovered in the US and the gap with the EU-27 persisted over the period and
increased after 2009. We find that GFCF per capita reached USD 103 in 2003 and USD 126 in 2012 in Europe
(2013 not available), whereas it reached respectively USD 215 and USD 251 in the US (TV programme
excluded).
Conclusion: the US are above the EU in terms of investment, irrespective of the indicators and the sources
The comparison based on capital expenditures from industry sources as well as the comparison based on
gross fixed capital formation from National Accounts allow to affirm that there is a clear investment gap in
favour of the US. The inaccuracies related to the measures of aggregate telecommunications services
investment in the EU and the US can be controlled to a significant extent. It is therefore possible to derive
robust estimates of both investment level and investment intensity indicators, either based on capital
expenditures from Industry sources or gross fixed assets accumulation from National Accounts. It appears that
the US are well above the EU over the whole period 2000-2013, and that the gap tends to increase in the
recent period (after the 2009 macroeconomic downturn).
The differences between CAPEX and GFCF in the EU result from several identified factors, notably related to
the inclusion of investments from government agencies in the National Accounts. Thought their exact value by
year cannot be perfectly assessed, their general magnitude is known, which leads to the statement that those
differences do not change the analysis and the conclusion of the investment gap.
3 The geographic perimeter for the European Union is EU-27 and not EU-28 as the accession of Croatia has been registered on 1st July 2013 which is not relevant given our period of observation.

Karine Fourneron, Stéphane Ciriani - September 2015
Contents Introduction ............................................................................................................................................. 4
1. Bias impacting measure for investment in EU and US telecommunications services. ................... 5
1.1. Bias related to sectorial perimeter .......................................................................................... 5
1.2. Bias related to geographical perimeter affecting Europe ....................................................... 5
1.3. Bias related to accounting and other issues ........................................................................... 6
1.3.1. Infrastructure financed through public funds .................................................................. 6
1.3.2. Bias related to sector specific issue of access infrastructure ........................................... 7
1.4. How bias are affecting each continent investment figures .................................................... 7
2. Analysis of European and US Capital expenditures from industry sources .................................... 8
2.1. Analysis of US Capital expenditures from industry sources .................................................... 8
2.2. The uncertainty interval in the case of European CAPEX time series from industry sources 10
2.2.1. Inclusion of cable companies in the European statistics ............................................... 10
2.2.2. Geographical perimeter bias ......................................................................................... 12
2.3. Comparison of CAPEX per inhabitants in Europe and in the US ........................................... 12
2.4. Conclusion of a comparison based on aggregate CAPEX by continent ................................. 13
3. Measurement of investments based on national accounts .......................................................... 14
3.1. US telecommunications services investment according to National Accounts .................... 14
3.2. EU Investment in telecommunications services according to National Accounts ................ 15
3.3. Comparison of GFCF in Europe and in the US ....................................................................... 16
3.4. Conclusion of a comparison based on GFCF by continent .................................................... 18
4. Conclusion ..................................................................................................................................... 18
Appendix 1 ............................................................................................................................................. 21
A.1. Investment in the EU from Industry and National Accounts ................................................ 21
A.2. Investment in the US from Industry and National Accounts................................................. 22
A.3. Conclusion of comparisons between sources from Industry and National Accounts .......... 23
Karine Fourneron, Stéphane Ciriani - September 2015
Introduction
Investment is the main driver of productivity and economic growth. Investments of the digital industries, and
notably of telecommunications, incorporate the technological progress that is displayed in other industries of
the economy which adopt digital assets and services. Telecommunications assets are not just regular
intermediate consumption good amongst others for industries and services, as they induce structural process
changes when adopted.
Investment of telecommunication industries supports the deployment of infrastructures and services on
which the whole digital ecosystem is built. The investment dynamics of the telecommunications are crucial to
the development of the digital ecosystem, hence to the efficiency and competitiveness of adopting industries.
The intensity of telecommunications investment in a given geographical area is a relevant indicator of the
expected technological evolutions of the whole digital ecosystem, especially when investments are measured at
a country level or at a continental scale.
There is an ongoing controversy around the comparison between US and EU investment by the
telecommunications services sectors, both in terms of investment levels and investment effort or intensity.
The objective of this work is to tackle usual inaccuracies affecting the assessment of investment in both
areas, and to derive robust estimations in order to conclude on the comparison of investment by EU and US
sectors of telecommunications services.
Investment can be either measured by Capital Expenditures (CAPEX) as an aggregation of gross fixed assets
from private operator’s financial accounts, or by Gross Fixed Capital Formation (GFCF) from National Accounts.
The computation of those aggregates induces specific methodological choices to control for bias which explains
discrepancies in the produced figures according to which source is used.
Before exploring available sources and commenting on each of them to derive the most accurate measure of
investment, we propose (1) to examine the different bias that affect measures of investment by
telecommunications services in the EU and in the US. We then turn (2) to the analysis of investment based on
sources from telecommunications industry (that measure investment by CAPEX), and (3) from National
Accounts (that measures investment by GFCF). We concludes (4) on the comparison between investments levels
and investment efforts between EU and the US. We also present in Appendix 1 the sources of discrepancies
between investment measured by capital expenditures from industry sources and investment measured by fixed
assets investment from National Accounts.
Karine Fourneron, Stéphane Ciriani - September 2015
1. Bias impacting measure for investment in EU and US telecommunications services
In this section, we identify the reasons why we can find such different figures under the same heading of
“investment of the telecommunication sector” according to the different available sources; this gives us a
reading grid for our forthcoming analysis.
1.1. Bias related to sectorial perimeter
The Telecommunications sector covers mobile services and fixed telecom services as well. On the mobile
services side, there might be a minor ambiguity due to the possible inclusion of satellite services, that are
sometimes (not systematically) included in investment statistics of telecommunications services. On the fixed
telecommunication side, the major potential discrepancy is related to uncertainties about the inclusion of cable
services providers in the perimeter of telecommunications services. The weight of cable industry in terms of
revenues and investment levels is though so important that the potential gap would be immediately
noticeable.
The most problematic perimeter bias relates to the integration of broadcasting activities in the field of
telecommunications services: the integration of comprehensive programs for TV channels in bunches of
programs or channels and their distribution are included in national investment data, in conformity with the
international accounting nomenclature for the industry of telecommunications services. The production of
original TV program or audio-visual content are not taken into account in telecommunications services in
national investment data, as they are reported in the section J60 "Programming and Broadcasting activities" of
the National Accounts system. This differentiation between the two broadcasting activities can hardly be made
with industry statistics, as companies do not provide the split in their capex reports. At this stage, we cannot
therefore formally exclude the possibility that investments of telecommunications operators and cable
operators in the creation or production of audio-visual content are part of the reported investment,
particularly in statistics provided by industrial analysts. This amount can be significant in the US, as cable
operators are taking an active part of content production.
1.2. Bias related to geographical perimeter affecting Europe
The bias related to the geographical perimeter concerns the European area. In the investment sources from
industry analysts4, statistics for the European area are provided at a country level and are then aggregated at
the continent level. The European Area is considered in the industry data sources, independently from
countries’ adhesion to the European Union. It is however doubtful that the European region exactly matches
the advertised EU-273 in the statistics by countries and national operators.
-With data provided by industry analysts, the lists of countries and corresponding national operators
are neither exhaustive nor totally explicit, and a "Rest of Europe" label might include countries that are
not members of the EU-27, or might ignore some member countries considered as “minor”.
-With data from National Accounts systems (provided by Eurostat annual accounts database), the
geographic sample corresponds to the EU-27 area, with the following restrictions: for Romania, the
Eurostat National Accounts do not provide Gross Fixed Capital Formation, but only gross tangible
investment over 2000-2012 (investment in fixed tangible assets); and the same goes for Ireland from
2007, Estonia from 2003, Latvia from 2003, and Malta from 2003. This is a downward bias because
investment in such cases does not include intangible fixed assets. However, it allows to take account
of at least the accumulation of fixed tangible assets.
4 Industry data sources and national Accounts sources are described and analysed in the section 2.
Karine Fourneron, Stéphane Ciriani - September 2015
1.3. Bias related to accounting and other issues
1.3.1. Infrastructure financed through public funds
A major source of uncertainty in the accuracy of investment assessment relates to the fact that in both the
US and the EU-27, only private investment (private fixed assets accumulated by private companies) is
considered. Both industry sources (where investment is measured by CAPEX) and National Accounts (where
investment is measured by GFCF) report investment as it is published by corporations in their financial
accounts. Industry sources do not account for public investment in telecommunications services (investment
from government agencies) and National Accounts do not fully account for those public investments. For this
reason, there might be significant difference across industry and National Accounts statistics (which are
supposed to account for at least a part of public investment in telecommunications services).
Public spending allocated to the development of telecommunications network coverage is of particular
importance in the US: public access has been provided by local authorities from second half of the 1990s’ in
some rural areas5, dependent upon the absence of private initiative (access has been provided for voice
services in this case, mainly on a narrow band basis). In 2008, it was acknowledged that access to broadband
services (measured by subscription’s rate) in underserved or poorly served areas was negligible6.
In February 2009, the United States adopted the American Recovery and Reinvestment Act7, a $789 billion
program for economic recovery. This program has led to the allocation of $6.7 billion to the upgrade of US
Broadband infrastructure, of which $4.4 billion administered by the Department of Commerce’s National
Telecommunications and Information Administration (NTIA), to deploy Broadband and encourage adoption,
and $2.5 billion to expand Broadband access in rural areas8.
In the European Union, the Treaty on the Functioning of the EU establishes a general prohibition of State
aid except for some limited circumstances. For instance, it leaves room for a number of policy objectives,
including both broadband access provision through copper legacy networks and next generation access
networks (NGA), with which State aid can be considered compatible.
5 The magnitude of local authorities’ investments remains unclear at this stage. While state and local governments can intervene in matters involving telecommunications, regulations vary from state to state. With insufficient private initiatives in less profitable areas, local public interventions have multiplied to various degrees according to the applicable legislation in each state: (1) Direct intervention funds for the deployment of private networks, such as in California, Connecticut, Illinois, or Louisiana; (2) Public networks operated by public or private entities that connect public services for users, such as universities or schools. This type of intervention can specifically be found in less densely populated towns. (3) Public-private partnerships for network deployment, specifically in West Virginia and Tennessee. In this case, a private company, most often a cooperative, commercially operates the network and public intervention takes the form of grants that may be subject to public service requirements. A local government can intervene on the network on several levels, from the backbone to the last mile. In the majority of cases, local governments deployed or participated in the deployment of collecting networks, leaving interconnection and the servicing of the final user to small private rural operators. 6 According to Pew Research Center, Home broadband adoption stood at 55% of adult Americans in May, 2008 nationwide, but only 38% for Adults living in rural America. 7 Out of the total $789 billion for the American Recovery and Reinvestment Act, Congress allocated $7.2 billion to the NTIA and the
Department of Agriculture as follows: 1/ A budget of $2.5 billion was allocated to the Department of Agriculture for loans and loan guarantees to facilitate broadband infrastructure deployment projects in rural areas. These funds, shared between the NTIA and the Department of Agriculture, are available for grants, loans, or loan guarantees for local projects promoting broadband coverage of unserved and underserved areas. A grant cannot exceed 80% of the project's total cost. The exist three categories of eligible projects: - Building broadband network infrastructures for the distribution of services to residential clients; - Broadband connection for administrative buildings and public equipment; - To equip computer centres, schools, universities, and libraries. 2/ The NTIA will utilize $4.7 billion to finance projects to improve broadband coverage in the US. In July 2009, $250 million was made available for implementation of the State Broadband Data and Development Grant Program of the American Recovery and Reinvestment Act and the Broadband Data Improvement Act (BDIA) in the form of grants spread out between states to develop specific data on the deployment level and the rates for access to broadband services. 8 As mentioned by the US government, “Under the RUS’s Broadband Initiatives Program, over $1.4 billion has been awarded to 105 broadband projects in 37 states and one territory. NTIA’s Broadband Technology Opportunities Program (BTOP) received more than 2,800 applications requesting more than $36billion in support for potential projects in all 50 states and territories. Grant recipients were required to show that for these Federal grant funds, there would not be a business case to serve these communities. As of the end of May 2013, NTIA had invested over $2.8 billion in over 220 projects that have already built and improved over 90,000 miles of broadband infrastructure and made high-speed connections available to about 14,000 community institutions across the country”. https://www.whitehouse.gov/sites/default/files/broadband_report_final.pdf
Karine Fourneron, Stéphane Ciriani - September 2015
Between 2003 and 2009, a total of €1.6 billion of State aid has been approved by the Commission for
telecom infrastructure projects. From 2010 until 2013, the total amount of the aid regarding Member State
public funding schemes supporting broadband rollout approved by the Commission has reached more than €11
billion, showing a recent change of pace. The amounts of funds invested per year after those approvals remain
unclear. Mirror to the US Recovery and Reinvestment Act, the EU Connecting Europe Facility (CEF), as adopted
by the European Parliament and the Council in December 2013, allocates a total fund of €1.14billion to digital
infrastructure telecoms projects over the period 2014- 2020.
It is yet unclear how those funds, both in the US from the local authorities since 1996 and the Recovery Act
Investment plan of 2009, and in the European Union from approved State aids or CEF are taken into account in
reported investment. They could be partially included when they are operated by a Public-Private-Partnership
(PPP) structure. In such case, the repartition of investment between government agencies sector and private
telecommunications services sector is determined by the allocation of financial risk between public and private
partners.
1.3.2. Bias related to sector specific issue of access infrastructure
In the telecommunications sectors of the European Union’s member States, the introduction of
competition has led the incumbents to provide access to their historical access network on a
wholesale ex-ante regulated price (access to local loop). As a result, alternative operators are granted
access to the legacy network to provide their services, even if no new access infrastructures is
deployed when these investments are made. A part of this spending (corresponding amongst other to
activation fees, or non-recurring fees) is activated by alternative operators, and as a result, a share of
total capital expenditures reported by usual sources does not involve actual deployments of physical
infrastructure. As both National Accounts and industry sources perform aggregation of companies’
investments, the more open networks there are, the more “artificial” investment (investment that
does not lead to access infrastructure deployment) is accounted for in the statistics. However, it is not
possible to assess the wholesale costs that are included in the capital expenditures of the alternative
operators.
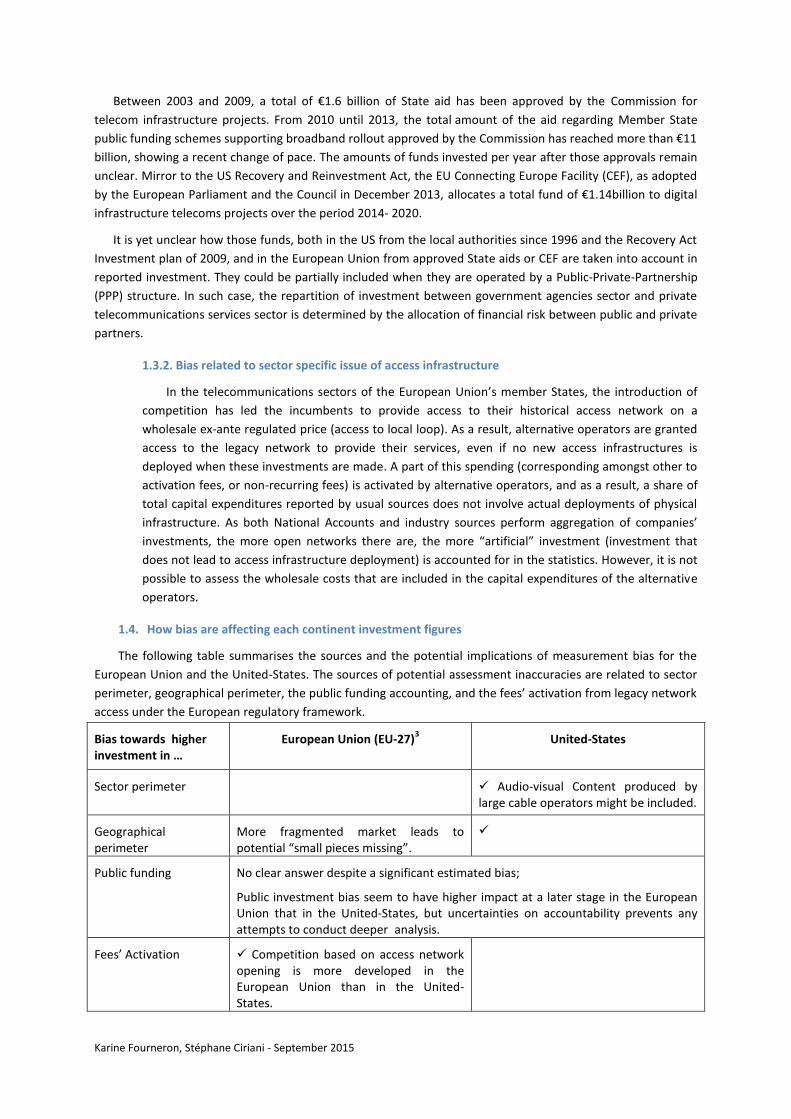
1.4. How bias are affecting each continent investment figures
The following table summarises the sources and the potential implications of measurement bias for the
European Union and the United-States. The sources of potential assessment inaccuracies are related to sector
perimeter, geographical perimeter, the public funding accounting, and the fees’ activation from legacy network
access under the European regulatory framework.
Bias towards higher investment in …
European Union (EU-27)3 United-States
Sector perimeter Audio-visual Content produced by large cable operators might be included.
Geographical perimeter
More fragmented market leads to potential “small pieces missing”.
Public funding No clear answer despite a significant estimated bias;
Public investment bias seem to have higher impact at a later stage in the European Union that in the United-States, but uncertainties on accountability prevents any attempts to conduct deeper analysis.
Fees’ Activation Competition based on access network opening is more developed in the European Union than in the United-States.
Karine Fourneron, Stéphane Ciriani - September 2015
2. Analysis of European and US Capital expenditures from industry sources
This section is devoted to the analysis of US and EU investment of telecommunications services on the basis
of industry sources. The objective of this section is to tackle issues related to potential inaccuracies in the
statistical assessment of investment at the continental scale, in order to provide a reliable comparison of
investment between the US and the EU.
Statistical data for the US do not raise particular issues, but this is not the case for the European Union,
which necessitate a specific investigation on the sources of assessment inaccuracies. A comparison between
the European Union and the United-States would only be reliable if these issues were at least partially tackled.
Sources from the telecommunications industry provide private operators’ CAPEX ("Capital Expenditures" or
fixed capital expenditures) aggregated by country and by regions or continents.
The CAPEX of private operators include expenditures in tangible assets (equipment, materials and
machinery) and intangible assets (software, patents, brand or databases). Fixed capital expenditures of
government agencies are only partly taken into account, when they are included in companies’ financial
accounts as part of a Public-Private-Partnership (PPP). These sources do not include the acquisition of licenses
for the use of frequencies. The main sources are from OVUM (2014)9. CAPEX not reported to Ovum in US$ are
calculated using average quarterly exchange rates.
2.1. Analysis of US Capital expenditures from industry sources
The data for United States investments do not raise any measurement issues (all cable operators are
included in the calculations of CAPEX, and there is no uncertainty related to the geographical perimeter),
except for the possible inclusion of investment in original content production by cable operators in the
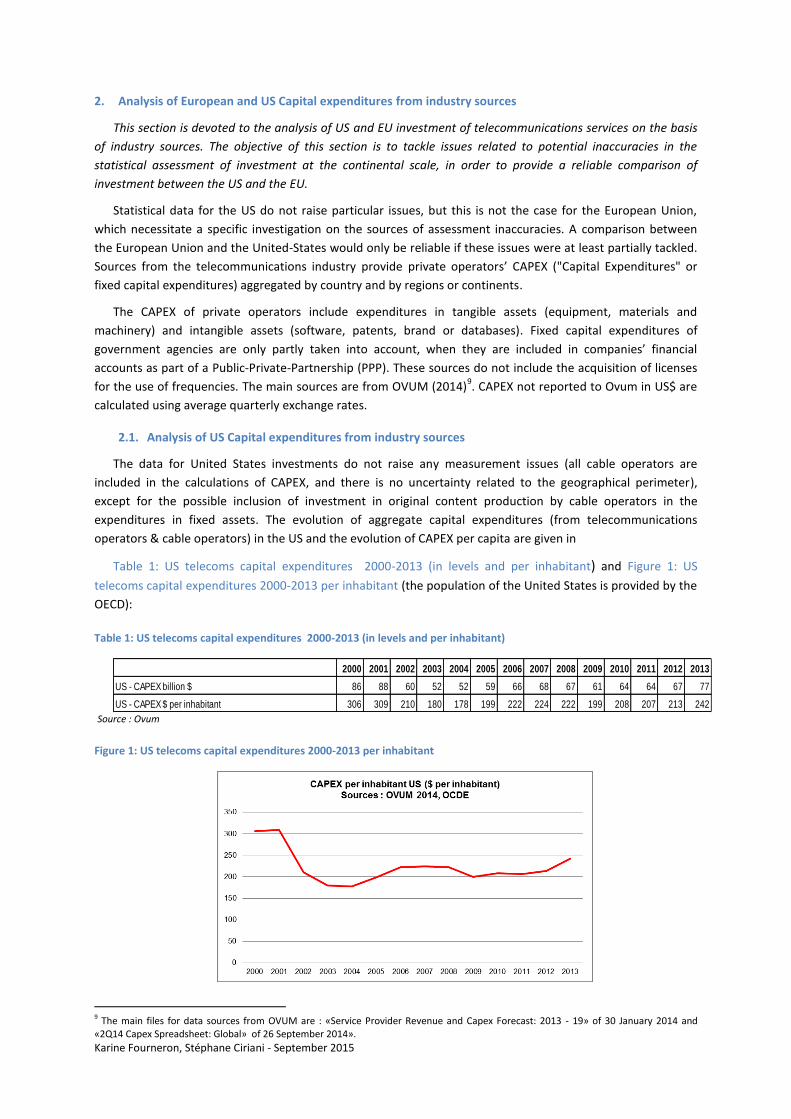
expenditures in fixed assets. The evolution of aggregate capital expenditures (from telecommunications
operators & cable operators) in the US and the evolution of CAPEX per capita are given in
Table 1: US telecoms capital expenditures 2000-2013 (in levels and per inhabitant) and Figure 1: US
telecoms capital expenditures 2000-2013 per inhabitant (the population of the United States is provided by the
OECD):
Table 1: US telecoms capital expenditures 2000-2013 (in levels and per inhabitant)
Source : Ovum
Figure 1: US telecoms capital expenditures 2000-2013 per inhabitant
9 The main files for data sources from OVUM are : «Service Provider Revenue and Capex Forecast: 2013 - 19» of 30 January 2014 and «2Q14 Capex Spreadsheet: Global» of 26 September 2014».
2000 2001 2002 2003 2004 2005 2006 2007 2008 2009 2010 2011 2012 2013
US - CAPEX billion $ 86 88 60 52 52 59 66 68 67 61 64 64 67 77
US - CAPEX $ per inhabitant 306 309 210 180 178 199 222 224 222 199 208 207 213 242
Karine Fourneron, Stéphane Ciriani - September 2015
Between the Internet bubble burst and the macroeconomic downturn caused by the global recession, US
CAPEX have been increasing steadily. They exhibit an increasing trend after the 2009 low. In the United-States,
the investments from telecommunications operators and cable operators have increased at a 4% annual
average rate between 2003 and 2013. CAPEX data from OVUM sources are similar to CAPEX data provided by
the US Telecom - Broadband Association (which are established from the Associations’ internal sources). These
sources take into account all the cable operators and include all non-financial fixed assets. The CAPEX levels
measured by OVUM and by the US Telecom-Broadband Association include tangible assets ("property, plant
and equipment") and intangible assets (including capitalized software and capitalized interest during
construction10
). Both OVUM and US Telecom-Broadband Association sources exclude satellite providers,
telecommunications resellers, and electric utilities (the local infrastructure providers issued from the 1996
Telecom Act).
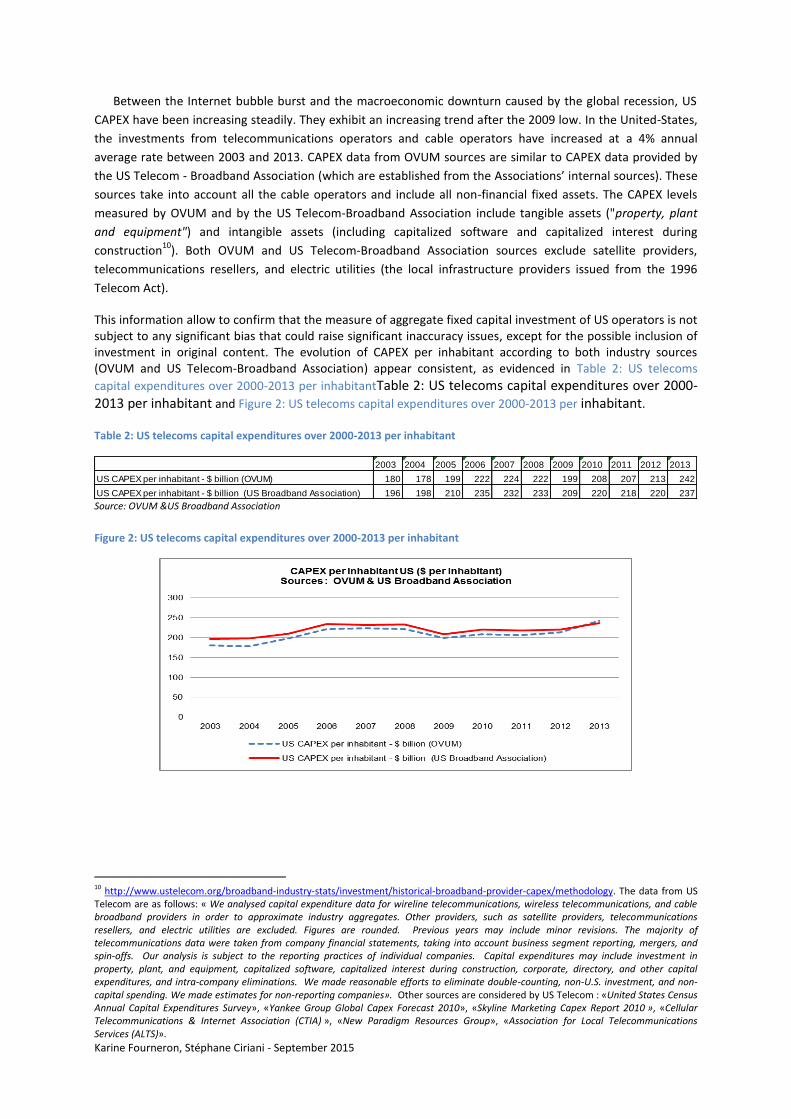
This information allow to confirm that the measure of aggregate fixed capital investment of US operators is not subject to any significant bias that could raise significant inaccuracy issues, except for the possible inclusion of investment in original content. The evolution of CAPEX per inhabitant according to both industry sources (OVUM and US Telecom-Broadband Association) appear consistent, as evidenced in Table 2: US telecoms
capital expenditures over 2000-2013 per inhabitantTable 2: US telecoms capital expenditures over 2000-2013 per inhabitant and Figure 2: US telecoms capital expenditures over 2000-2013 per inhabitant.
Table 2: US telecoms capital expenditures over 2000-2013 per inhabitant
Source: OVUM &US Broadband Association
Figure 2: US telecoms capital expenditures over 2000-2013 per inhabitant
10 http://www.ustelecom.org/broadband-industry-stats/investment/historical-broadband-provider-capex/methodology. The data from US Telecom are as follows: « We analysed capital expenditure data for wireline telecommunications, wireless telecommunications, and cable broadband providers in order to approximate industry aggregates. Other providers, such as satellite providers, telecommunications resellers, and electric utilities are excluded. Figures are rounded. Previous years may include minor revisions. The majority of telecommunications data were taken from company financial statements, taking into account business segment reporting, mergers, and spin-offs. Our analysis is subject to the reporting practices of individual companies. Capital expenditures may include investment in property, plant, and equipment, capitalized software, capitalized interest during construction, corporate, directory, and other capital expenditures, and intra-company eliminations. We made reasonable efforts to eliminate double-counting, non-U.S. investment, and non-capital spending. We made estimates for non-reporting companies». Other sources are considered by US Telecom : «United States Census Annual Capital Expenditures Survey», «Yankee Group Global Capex Forecast 2010», «Skyline Marketing Capex Report 2010 », «Cellular Telecommunications & Internet Association (CTIA) », «New Paradigm Resources Group», «Association for Local Telecommunications Services (ALTS)».
2003 2004 2005 2006 2007 2008 2009 2010 2011 2012 2013
US CAPEX per inhabitant - $ billion (OVUM) 180 178 199 222 224 222 199 208 207 213 242
US CAPEX per inhabitant - $ billion (US Broadband Association) 196 198 210 235 232 233 209 220 218 220 237
Karine Fourneron, Stéphane Ciriani - September 2015
2.2. The uncertainty interval in the case of European CAPEX time series from industry sources
Unlike in the US, data for Europe differ according to sources from industry.
The statistical data for European Union CAPEX are subject to potential measurement errors. Nevertheless,
OVUM allows for time series comparisons over long period within the same data source. OVUM provides raw
CAPEX data by regions that are available over the period 2000-2013. In order to provide reliable international
comparison it is necessary to explain the causes and the impacts of potential measurement error in the case of
the European Union, and to tackle at least part of potential measurement inaccuracies.
This section presents a methodology to control for potential assessment bias for investment in European
area. A base-case path for CAPEX per capita is defined on statistical data from OVUM, then an uncertainty
interval is built around this base-case line, which supposes to calculate an upper and a lower bound for CAPEX
per capita11
. The measurement of CAPEX per capita for the European telecommunications industry is affected
by two types of potential errors. The first type of error concerns cable operators coverage and the second type
of error concerns geographical area coverage. The base-case CAPEX per capita trajectory (the green curve in
the graph), which is the OVUM data for CAPEX of the European Union (EU-27), is prone to two different bias: 1)
The incomplete inclusion of cable operators; and 2) The possible inclusion of non-EU-27 countries in the
aggregate labelled "Rest of Europe" in OVUM source files. These biases can be addressed by building an
uncertainty interval. The upper bound of the uncertainty interval is the CAPEX per capita path that includes all
cable operators which might have been omitted in the base-case CAPEX series; the lower bound of the
uncertainty interval is the CAPEX per capita path that controls for area coverage12
.
2.2.1. Inclusion of cable companies in the European statistics
The first potential error stems from cable operators’ coverage, about which OVUM sources files are
unclear13
. We consider that the CAPEX series for the EU-27 are biased downwards due to incomplete cable
coverage. We propose to estimate what would be the EU-27 CAPEX aggregate if all cable operators were
included in the original OVUM sample: we assume that the base-case CAPEX include no cable operators, then
we calculate the maximum gap (the maximum error that we would commit if OVUM had not taken into account
any cable operator in the original sample)14
. We find that if OVUM had not included any cable operators in its
sample for EU-27 aggregate CAPEX calculation, it would have underestimated EU-27 CAPEX by $6.81 billion in
2013, as shown in the Table 3: EU Cable revenues and CAPEX estimates, which reports the estimate of the
upper bound based on estimations of revenues and capital expenditures from European cable operators. The
upper bound of the uncertainty interval is derived from an estimation of European cable operators’ capital
expenditures based on their annual revenues and capital intensity provided by industry sources Cable Europe
and Solon. The upper bound of the uncertainty interval is the sum of the cable operators' CAPEX per capita and
of the base-case CAPEX per capita. This upper bound is represented by the dashed blue line in the Figure 3: EU
Cable revenues and CAPEX estimates, where the green curve represents the base-case CAPEX time series.
11 The base-case and the uncertainty interval are derived in terms of CAPEX per capita rather than in terms of CAPEX levels because a potential bias is linked to the geographical perimeter, which imply to control for the size of population. 12This error leads to a downward bias as countries potentially taken into account have a higher population relatively to their CAPEX levels, which increases the denominator of the CAPEX per capita ratio. 13 In one source file, OVUM indicates that it does only include cable operators that are large enough (those that are "of significant size") in the regions other than North America, while in the other source file it indicates that cable operators are only included fort North America. 14 To do this, we estimate the total EU cable CAPEX using information from Cable-Europe and Solon. These sources indicate that EU cable operators’ turnover was €11.41 billion in 2003 and €21.16 billion in 2013; capital intensity was 20% in 2012 and 22% in 2014. We also have data for capital intensity between 2004 and 2012. From the turnover data for 2003 and 2013, an AAGR is calculated in order to derive annual time series, to which we apply the ratio CAPEX/Revenue.
Karine Fourneron, Stéphane Ciriani - September 2015
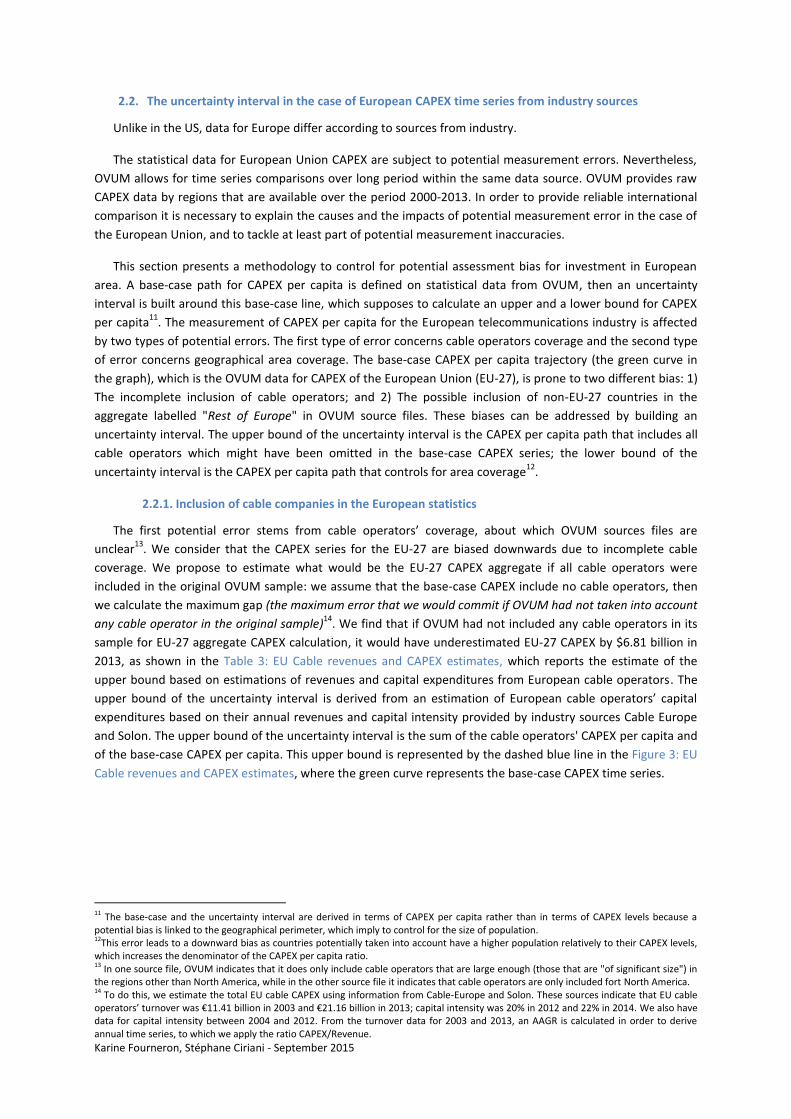
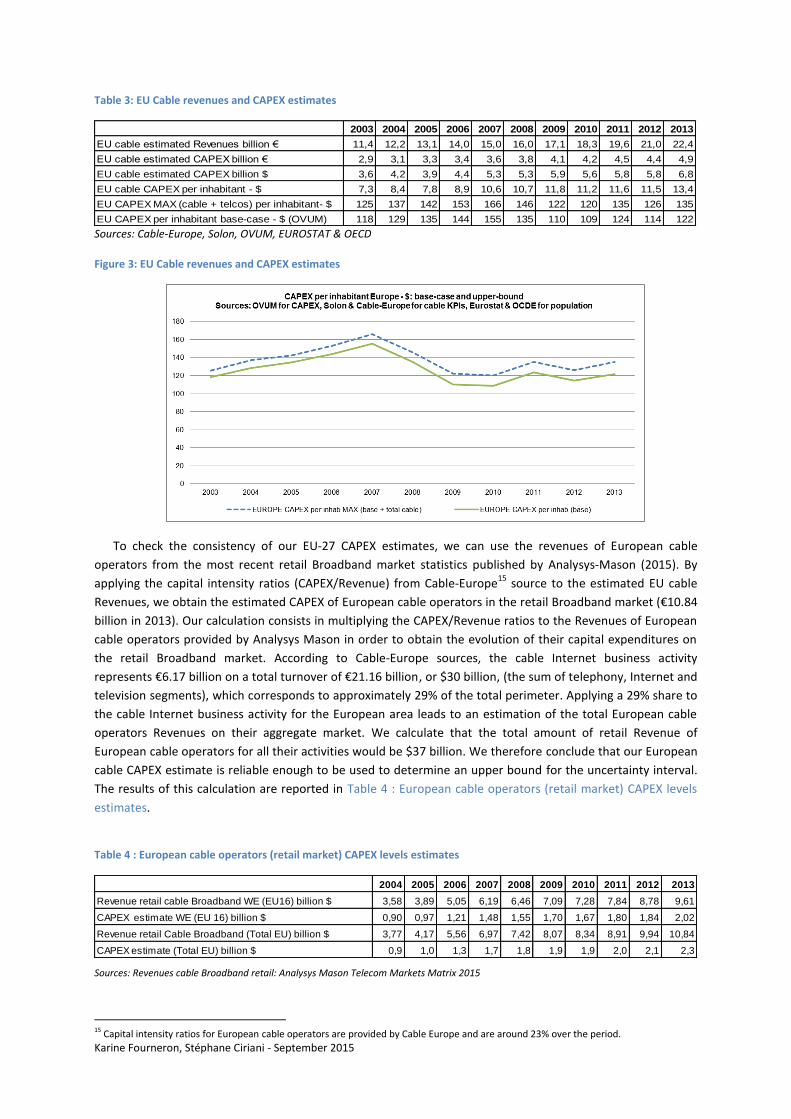
Table 3: EU Cable revenues and CAPEX estimates
Sources: Cable-Europe, Solon, OVUM, EUROSTAT & OECD
Figure 3: EU Cable revenues and CAPEX estimates
To check the consistency of our EU-27 CAPEX estimates, we can use the revenues of European cable
operators from the most recent retail Broadband market statistics published by Analysys-Mason (2015). By
applying the capital intensity ratios (CAPEX/Revenue) from Cable-Europe15
source to the estimated EU cable
Revenues, we obtain the estimated CAPEX of European cable operators in the retail Broadband market (€10.84
billion in 2013). Our calculation consists in multiplying the CAPEX/Revenue ratios to the Revenues of European
cable operators provided by Analysys Mason in order to obtain the evolution of their capital expenditures on
the retail Broadband market. According to Cable-Europe sources, the cable Internet business activity
represents €6.17 billion on a total turnover of €21.16 billion, or $30 billion, (the sum of telephony, Internet and
television segments), which corresponds to approximately 29% of the total perimeter. Applying a 29% share to
the cable Internet business activity for the European area leads to an estimation of the total European cable
operators Revenues on their aggregate market. We calculate that the total amount of retail Revenue of
European cable operators for all their activities would be $37 billion. We therefore conclude that our European
cable CAPEX estimate is reliable enough to be used to determine an upper bound for the uncertainty interval.
The results of this calculation are reported in Table 4 : European cable operators (retail market) CAPEX levels
estimates.
Table 4 : European cable operators (retail market) CAPEX levels estimates
Sources: Revenues cable Broadband retail: Analysys Mason Telecom Markets Matrix 2015
15 Capital intensity ratios for European cable operators are provided by Cable Europe and are around 23% over the period.
2003 2004 2005 2006 2007 2008 2009 2010 2011 2012 2013
EU cable estimated Revenues billion € 11,4 12,2 13,1 14,0 15,0 16,0 17,1 18,3 19,6 21,0 22,4
EU cable estimated CAPEX billion € 2,9 3,1 3,3 3,4 3,6 3,8 4,1 4,2 4,5 4,4 4,9
EU cable estimated CAPEX billion $ 3,6 4,2 3,9 4,4 5,3 5,3 5,9 5,6 5,8 5,8 6,8
EU cable CAPEX per inhabitant - $ 7,3 8,4 7,8 8,9 10,6 10,7 11,8 11,2 11,6 11,5 13,4
EU CAPEX MAX (cable + telcos) per inhabitant- $ 125 137 142 153 166 146 122 120 135 126 135
EU CAPEX per inhabitant base-case - $ (OVUM) 118 129 135 144 155 135 110 109 124 114 122
2004 2005 2006 2007 2008 2009 2010 2011 2012 2013
Revenue retail cable Broadband WE (EU16) billion $ 3,58 3,89 5,05 6,19 6,46 7,09 7,28 7,84 8,78 9,61
CAPEX estimate WE (EU 16) billion $ 0,90 0,97 1,21 1,48 1,55 1,70 1,67 1,80 1,84 2,02
Revenue retail Cable Broadband (Total EU) billion $ 3,77 4,17 5,56 6,97 7,42 8,07 8,34 8,91 9,94 10,84
CAPEX estimate (Total EU) billion $ 0,9 1,0 1,3 1,7 1,8 1,9 1,9 2,0 2,1 2,3
Karine Fourneron, Stéphane Ciriani - September 2015
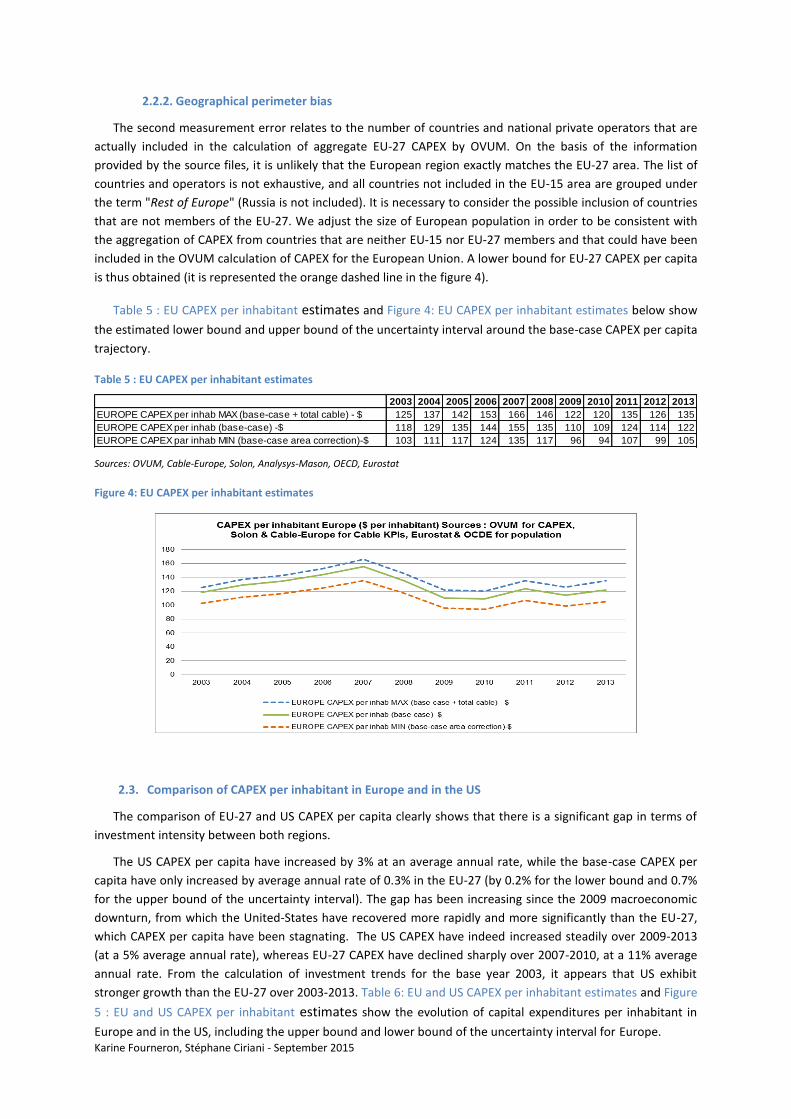
2.2.2. Geographical perimeter bias
The second measurement error relates to the number of countries and national private operators that are
actually included in the calculation of aggregate EU-27 CAPEX by OVUM. On the basis of the information
provided by the source files, it is unlikely that the European region exactly matches the EU-27 area. The list of
countries and operators is not exhaustive, and all countries not included in the EU-15 area are grouped under
the term "Rest of Europe" (Russia is not included). It is necessary to consider the possible inclusion of countries
that are not members of the EU-27. We adjust the size of European population in order to be consistent with
the aggregation of CAPEX from countries that are neither EU-15 nor EU-27 members and that could have been
included in the OVUM calculation of CAPEX for the European Union. A lower bound for EU-27 CAPEX per capita
is thus obtained (it is represented the orange dashed line in the figure 4).
Table 5 : EU CAPEX per inhabitant estimates and Figure 4: EU CAPEX per inhabitant estimates below show
the estimated lower bound and upper bound of the uncertainty interval around the base-case CAPEX per capita
trajectory.
Table 5 : EU CAPEX per inhabitant estimates
Sources: OVUM, Cable-Europe, Solon, Analysys-Mason, OECD, Eurostat
Figure 4: EU CAPEX per inhabitant estimates
2.3. Comparison of CAPEX per inhabitant in Europe and in the US
The comparison of EU-27 and US CAPEX per capita clearly shows that there is a significant gap in terms of
investment intensity between both regions.
The US CAPEX per capita have increased by 3% at an average annual rate, while the base-case CAPEX per
capita have only increased by average annual rate of 0.3% in the EU-27 (by 0.2% for the lower bound and 0.7%
for the upper bound of the uncertainty interval). The gap has been increasing since the 2009 macroeconomic
downturn, from which the United-States have recovered more rapidly and more significantly than the EU-27,
which CAPEX per capita have been stagnating. The US CAPEX have indeed increased steadily over 2009-2013
(at a 5% average annual rate), whereas EU-27 CAPEX have declined sharply over 2007-2010, at a 11% average
annual rate. From the calculation of investment trends for the base year 2003, it appears that US exhibit
stronger growth than the EU-27 over 2003-2013. Table 6: EU and US CAPEX per inhabitant estimates and Figure
5 : EU and US CAPEX per inhabitant estimates show the evolution of capital expenditures per inhabitant in
Europe and in the US, including the upper bound and lower bound of the uncertainty interval for Europe.
2003 2004 2005 2006 2007 2008 2009 2010 2011 2012 2013
EUROPE CAPEX per inhab MAX (base-case + total cable) - $ 125 137 142 153 166 146 122 120 135 126 135
EUROPE CAPEX per inhab (base-case) -$ 118 129 135 144 155 135 110 109 124 114 122
EUROPE CAPEX par inhab MIN (base-case area correction)-$ 103 111 117 124 135 117 96 94 107 99 105
Karine Fourneron, Stéphane Ciriani - September 2015
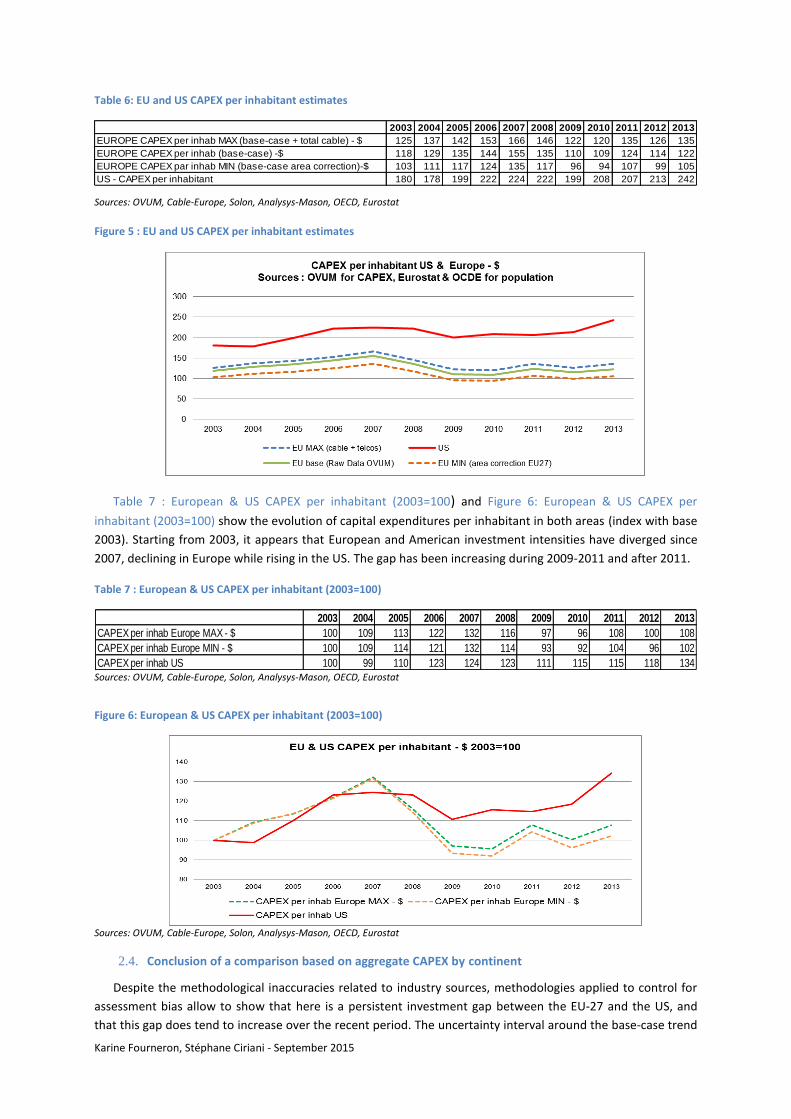
Table 6: EU and US CAPEX per inhabitant estimates
Sources: OVUM, Cable-Europe, Solon, Analysys-Mason, OECD, Eurostat
Figure 5 : EU and US CAPEX per inhabitant estimates
Table 7 : European & US CAPEX per inhabitant (2003=100) and Figure 6: European & US CAPEX per
inhabitant (2003=100) show the evolution of capital expenditures per inhabitant in both areas (index with base
2003). Starting from 2003, it appears that European and American investment intensities have diverged since
2007, declining in Europe while rising in the US. The gap has been increasing during 2009-2011 and after 2011.
Table 7 : European & US CAPEX per inhabitant (2003=100)
Sources: OVUM, Cable-Europe, Solon, Analysys-Mason, OECD, Eurostat
Figure 6: European & US CAPEX per inhabitant (2003=100)
Sources: OVUM, Cable-Europe, Solon, Analysys-Mason, OECD, Eurostat
2.4. Conclusion of a comparison based on aggregate CAPEX by continent
Despite the methodological inaccuracies related to industry sources, methodologies applied to control for
assessment bias allow to show that here is a persistent investment gap between the EU-27 and the US, and
that this gap does tend to increase over the recent period. The uncertainty interval around the base-case trend
2003 2004 2005 2006 2007 2008 2009 2010 2011 2012 2013
EUROPE CAPEX per inhab MAX (base-case + total cable) - $ 125 137 142 153 166 146 122 120 135 126 135
EUROPE CAPEX per inhab (base-case) -$ 118 129 135 144 155 135 110 109 124 114 122
EUROPE CAPEX par inhab MIN (base-case area correction)-$ 103 111 117 124 135 117 96 94 107 99 105
US - CAPEX per inhabitant 180 178 199 222 224 222 199 208 207 213 242
2003 2004 2005 2006 2007 2008 2009 2010 2011 2012 2013
CAPEX per inhab Europe MAX - $ 100 109 113 122 132 116 97 96 108 100 108
CAPEX per inhab Europe MIN - $ 100 109 114 121 132 114 93 92 104 96 102
CAPEX per inhab US 100 99 110 123 124 123 111 115 115 118 134
Karine Fourneron, Stéphane Ciriani - September 2015
for EU-27 CAPEX per capita shows that the measurement errors are unlikely to affect significantly the
assessment of the gap between EU-27 and US CAPEX per capita (as well as CAPEX levels) trends.
The United-States are above the European Union in terms of CAPEX per capita (and CAPEX levels as well)
throughout the period and the gap has increased over the recent period (since the macroeconomic downturn
in 2009), as shown by the calculation of CAPEX per capita trends for the base year 2003.
3. Measurement of investments based on national accounts
This section is devoted to a comparison of telecommunications services investment levels and investment
intensity based on data from National Accounts. US and European National Accounts system use the same
indicator to measure investment, which allows for a direct international comparison.
National Accounts systems use Gross Fixed Capital Formation (GFCF) as a measure of investment. GFCF is
the accumulation of non-residential fixed assets used in a production process for at least one year. GFCF
includes fixed tangible assets (equipment, machinery, buildings) and some fixed intangible assets (software,
literary & artistic originals, intellectual property rights). Expenditures on R&D have been included in GFCF since
2014, (they were previously recorded in the Gross Domestic Expenditure on R&D (GERD)). GFCF does not
include training costs, advertising and promotion, relocation and reorganization expenditures, and do not
include investments in financial assets and land, and foreign direct investment as well. Spectrum acquisition
cost is considered as a non-produced asset and is therefore not taken in account in GFCF.
3.1. US telecommunications services investment according to National Accounts
This section analyses the telecommunications services’ investment trends on the basis of US national
accounts.
The US National Accounts (provided by the Bureau of Economic Analysis-BEA16
), telecommunications
services’ branch of industry corresponds to "Broadcasting and Telecommunications” industry. Its investment is
measured by GFCF that is presented as the sum of gross tangible investments (equipment, materials and
machines) and gross intangible investments ("Intellectual property rights products", including software and
television programs). Over 2000-2011, US investment of telecommunications services measured by the BEA is
equivalent to US investment measured by the OECD for the “D61-JB” branch in the STAN database for
structural analysis17
. The OECD classification for telecommunications services is similar to that of national
accounts provided for the European Union by Eurostat. This classification includes the integration of
comprehensive programs for TV channels18
in bunches of programs or channels and their distribution. It does
not include the production of radio and television programs19
(that are accounted for in the “J60” section of the
international National Account system). OECD and Eurostat classifications are in conformity with the
International Nomenclature “ISIC Rev 4” of the United Nations, in which the “J61” branch includes content
transmission activities and excludes activities of content creation20
. The GFCF of telecommunications services
in the US exhibits similar trends than capital expenditures, with a 4.1% average annual growth rate over the
period 2003-2013. The calculations for investment intensity (GFCF per capita presented in the table are
16 http://www.bea.gov/iTable/index_FA.cfm 17 http://www.oecd.org/fr/std/industrie.pdf ; http://www.keepeek.com/Digital-Asset-Management/oecd/industry-and-services/stan-oecd-structural-analysis-statistics-2014_stan-2014-en#page46 ; http://www.oecd.org/sti/ind/2stan-indlist.pdf 18 The TV channels programs are produced in the division J60: "Programming and Diffusion" of the National Account system. 19 Radio and Television Programs are also produced in the J60 of the National Account System. 20 The account system defined by the United Nations indicates for division J61 : “This division includes the activities of providing telecommunications and related service activities, i.e. transmitting voice, data, text, sound and video. The transmission facilities that carry out these activities may be based on a single technology or a combination of technologies. The commonality of activities classified in this division is the transmission of content, without being involved in its creation. The breakdown in this division is based on the type of infrastructure operated. In the case of transmission of television signals this may include the bundling of complete programming channels (produced in division 60) in to programme packages for distribution”. http://unstats.un.org/unsd/cr/registry/regcs.asp?Cl=27&Lg=1&Co=61
Karine Fourneron, Stéphane Ciriani - September 2015
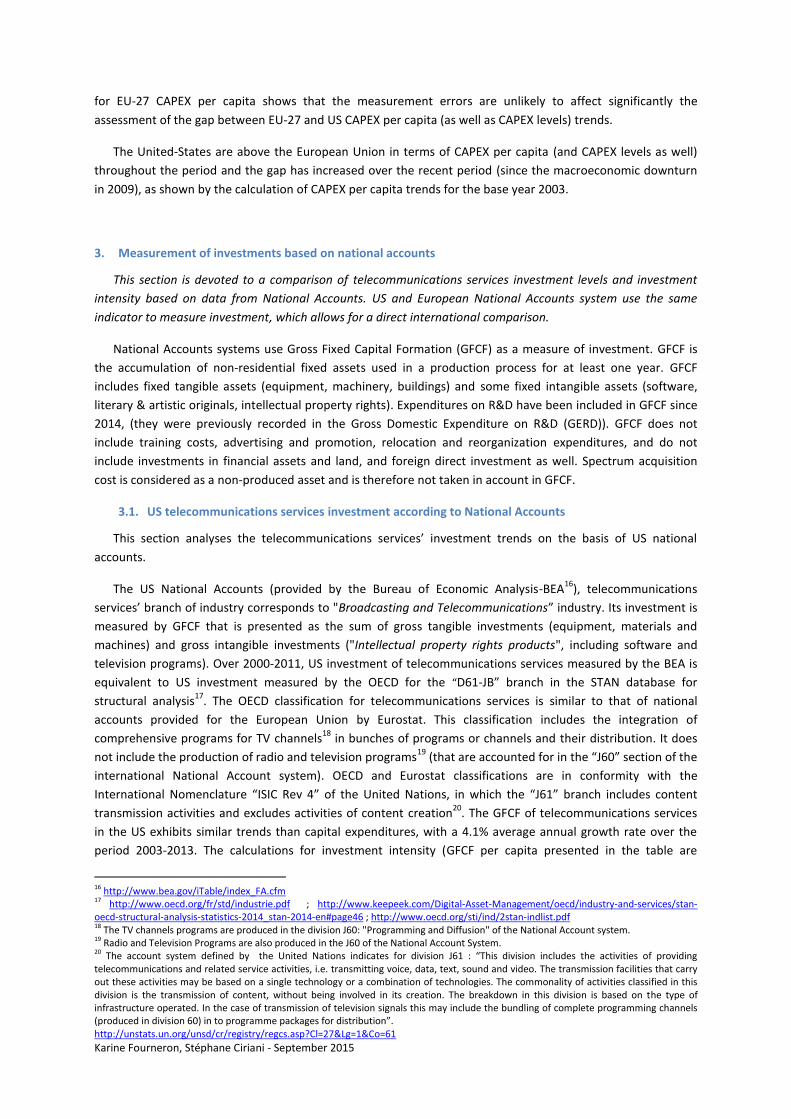
computed using OECD data for population). The table presents both investments in fixed tangible assets and in
fixed intangible assets as reported by the US BEA. The evolution of investment by US telecommunications
services’ sector according to National Accounts (either BEA and OECD) are reported in Table 8: Investment of
US telecommunications services and presented in Figure 7: Investment of US telecommunications services.
Both National Account sources appear to be consistent.
Table 8: Investment of US telecommunications services
Sources: US Bureau of Economic Analysis-BEA
Figure 7: Investment of US telecommunications services
The BEA has revised its National Accounts System in 2013 to include TV programs as intangible assets21
. The
intangible assets include three separate sections: Software acquisitions, exploitation of TV programs-"Long-
lived television programs", and all other intangible assets, which are included in the "All-other non-
manufacturing category”. In the US, cable operators ("cable networks") are participating in the creation of
original TV program "Long-lived television programs" that can be broadcasted several times during a long
period. Since the GFCF time series by OECD and US BEA are similar, it is unlikely that US BEA includes the
creation of TV programs in intangible fixed assets. It does only include the diffusion of these programs (in
conformity with the international nomenclature for the industry of telecommunications services).
Nevertheless, we cannot formally exclude that investments from large cable operators in the creation or
production of audio-visual contents are accounted for in the US BEA National accounts (and OECD as well).
3.2. EU Investment in telecommunications services according to National Accounts
This section studies the investment trends for the EU-27 area, based on the European annual National
Accounts from Eurostat. The Eurostat database provides GFCF of the branch “Telecommunications services”
(with the code “J61”) on a country basis. The measure of GCFC includes non-financial fixed tangible assets (civil
engineering buildings and structures, machinery and equipment, transport equipment, ICT equipment), and
non-financial fixed intangible assets (intellectual property rights). It includes content transmission activities and
excludes activities of content creation.
GFCG data from Eurostat annual National Accounts database have been updated in May 2015. The
database now provides data for the 27 countries of the European Union. The sample corresponds to the EU-27,
with the following restrictions: for Romania, the National Accounts do not provide GFCF, they nevertheless
21 https://www.bea.gov/papers/pdf/Television%20Programs%20as%20a%20Capital%20Asset.pdf
2000 2001 2002 2003 2004 2005 2006 2007 2008 2009 2010 2011 2012 2013
US GFCF Tangible Assets (Equipement) - billion $ 94 79 48 44 48 49 60 66 62 53 59 58 62 65
US GFCF Intangible Assets (PPI) - billion $ 36 35 29 28 29 32 34 35 35 35 35 37 41 42
US GFCF (BEA) - billion $ 130 114 77 72 77 82 94 101 98 88 94 95 102 107
US GFCF(except TV progams) (BEA) - billion $ 117 100 62 55 60 62 74 81 78 68 74 74 79 83
US GFCF (OCDE) - billion $ 142 125 81 70 74 79 94 104 103 88 89 90
Karine Fourneron, Stéphane Ciriani - September 2015
provide gross tangible investment over 2000-2012; And the same goes for Ireland (from 2007), Estonia (from
2003), Latvia (from 2003), and Malta (from 2003). The Eurostat database does not allow to report the
aggregate EU-27 GFCF for the year 2013 because a significant number of countries have not yet reported
national data. GFCF time series by country are given in millions of current euros, and are converted into US
dollars using the average exchange rate of the OECD (the average period exchange rates). The evolution of
GFCF is presented in Table 9 : EU GFCF in telecommunications services industry.
Table 9 : EU GFCF in telecommunications services industry
Sources: National Accounts & Eurostat
3.3. Comparison of GFCF in Europe and in the US
We can now provide a reliable comparison between investment trends of EU-27 and US, and of the levels of
GFCF per capita as well.
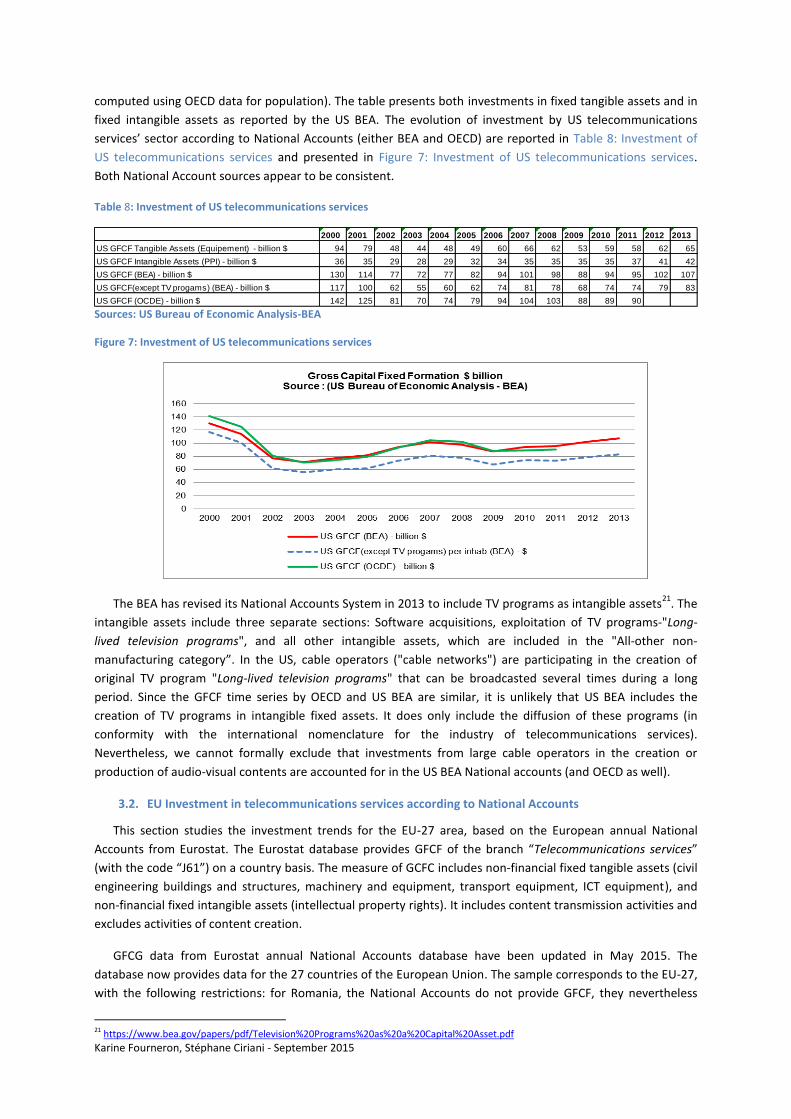
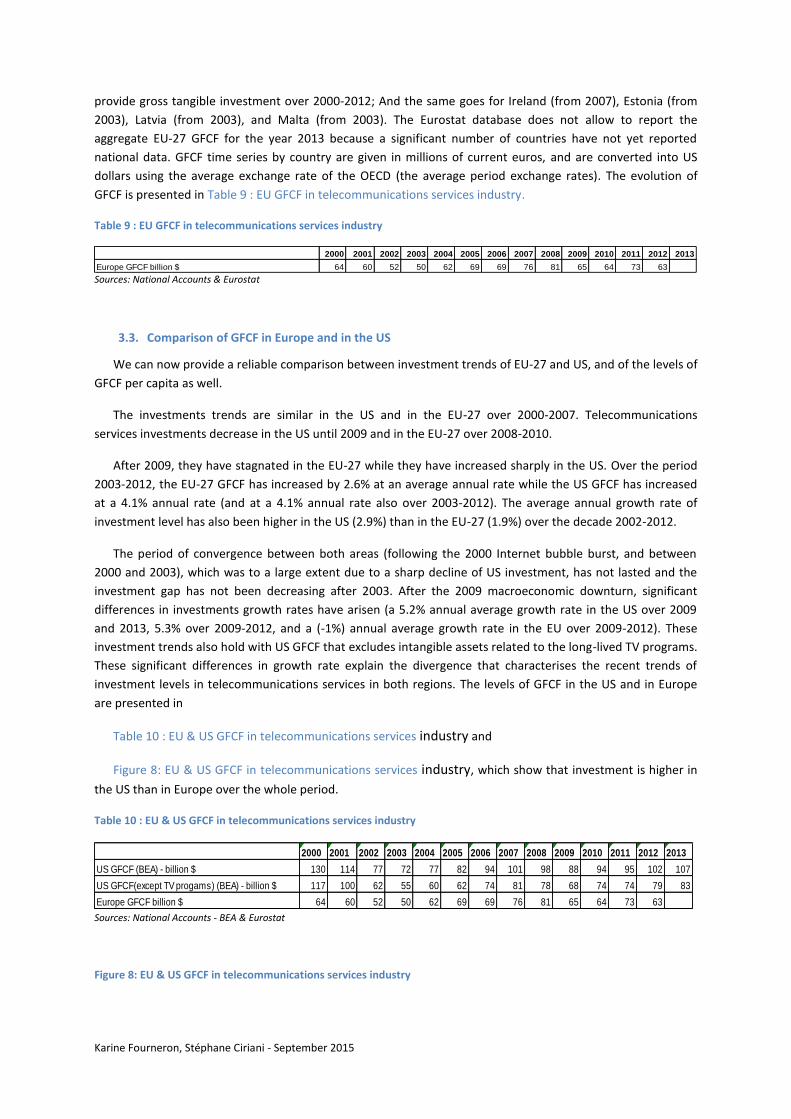
The investments trends are similar in the US and in the EU-27 over 2000-2007. Telecommunications
services investments decrease in the US until 2009 and in the EU-27 over 2008-2010.
After 2009, they have stagnated in the EU-27 while they have increased sharply in the US. Over the period
2003-2012, the EU-27 GFCF has increased by 2.6% at an average annual rate while the US GFCF has increased
at a 4.1% annual rate (and at a 4.1% annual rate also over 2003-2012). The average annual growth rate of
investment level has also been higher in the US (2.9%) than in the EU-27 (1.9%) over the decade 2002-2012.
The period of convergence between both areas (following the 2000 Internet bubble burst, and between
2000 and 2003), which was to a large extent due to a sharp decline of US investment, has not lasted and the
investment gap has not been decreasing after 2003. After the 2009 macroeconomic downturn, significant
differences in investments growth rates have arisen (a 5.2% annual average growth rate in the US over 2009
and 2013, 5.3% over 2009-2012, and a (-1%) annual average growth rate in the EU over 2009-2012). These
investment trends also hold with US GFCF that excludes intangible assets related to the long-lived TV programs.
These significant differences in growth rate explain the divergence that characterises the recent trends of
investment levels in telecommunications services in both regions. The levels of GFCF in the US and in Europe
are presented in
Table 10 : EU & US GFCF in telecommunications services industry and
Figure 8: EU & US GFCF in telecommunications services industry, which show that investment is higher in
the US than in Europe over the whole period.
Table 10 : EU & US GFCF in telecommunications services industry
Sources: National Accounts - BEA & Eurostat
Figure 8: EU & US GFCF in telecommunications services industry
2000 2001 2002 2003 2004 2005 2006 2007 2008 2009 2010 2011 2012 2013
Europe GFCF billion $ 64 60 52 50 62 69 69 76 81 65 64 73 63
2000 2001 2002 2003 2004 2005 2006 2007 2008 2009 2010 2011 2012 2013
US GFCF (BEA) - billion $ 130 114 77 72 77 82 94 101 98 88 94 95 102 107
US GFCF(except TV progams) (BEA) - billion $ 117 100 62 55 60 62 74 81 78 68 74 74 79 83
Europe GFCF billion $ 64 60 52 50 62 69 69 76 81 65 64 73 63
Karine Fourneron, Stéphane Ciriani - September 2015
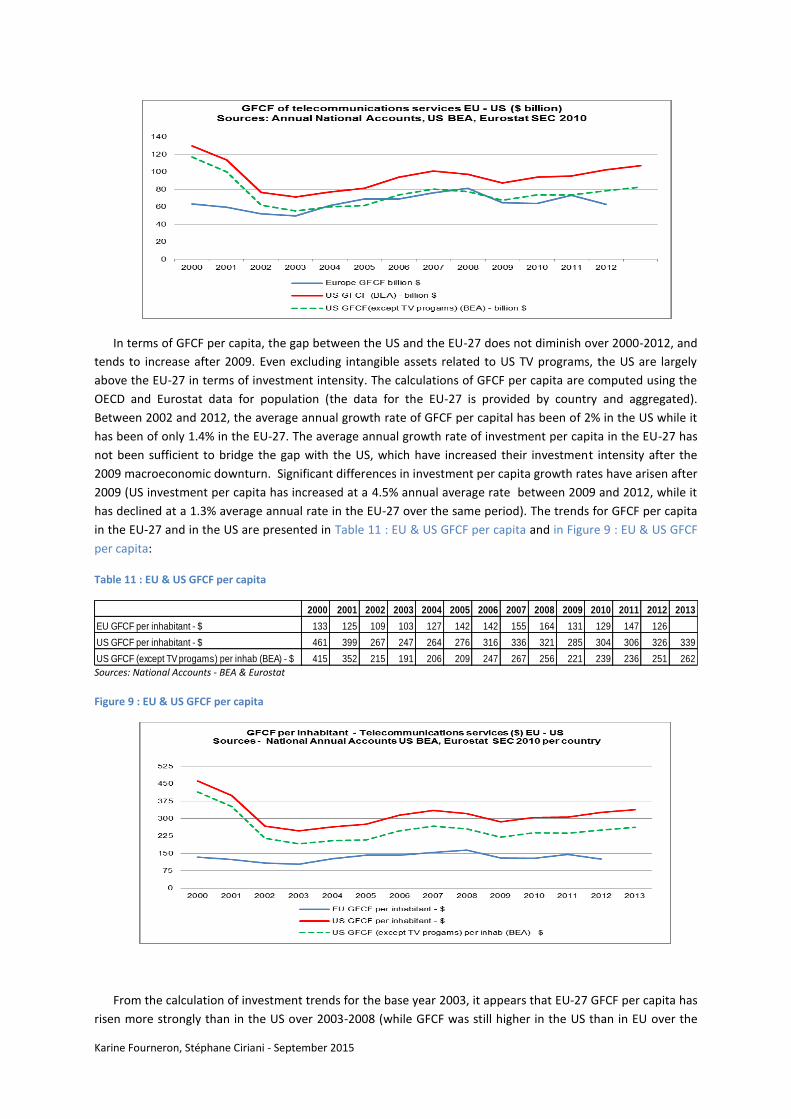
In terms of GFCF per capita, the gap between the US and the EU-27 does not diminish over 2000-2012, and
tends to increase after 2009. Even excluding intangible assets related to US TV programs, the US are largely
above the EU-27 in terms of investment intensity. The calculations of GFCF per capita are computed using the
OECD and Eurostat data for population (the data for the EU-27 is provided by country and aggregated).
Between 2002 and 2012, the average annual growth rate of GFCF per capital has been of 2% in the US while it
has been of only 1.4% in the EU-27. The average annual growth rate of investment per capita in the EU-27 has
not been sufficient to bridge the gap with the US, which have increased their investment intensity after the
2009 macroeconomic downturn. Significant differences in investment per capita growth rates have arisen after
2009 (US investment per capita has increased at a 4.5% annual average rate between 2009 and 2012, while it
has declined at a 1.3% average annual rate in the EU-27 over the same period). The trends for GFCF per capita
in the EU-27 and in the US are presented in Table 11 : EU & US GFCF per capita and in Figure 9 : EU & US GFCF
per capita:
Table 11 : EU & US GFCF per capita
Sources: National Accounts - BEA & Eurostat
Figure 9 : EU & US GFCF per capita
From the calculation of investment trends for the base year 2003, it appears that EU-27 GFCF per capita has
risen more strongly than in the US over 2003-2008 (while GFCF was still higher in the US than in EU over the
2000 2001 2002 2003 2004 2005 2006 2007 2008 2009 2010 2011 2012 2013
EU GFCF per inhabitant - $ 133 125 109 103 127 142 142 155 164 131 129 147 126
US GFCF per inhabitant - $ 461 399 267 247 264 276 316 336 321 285 304 306 326 339
US GFCF (except TV progams) per inhab (BEA) - $ 415 352 215 191 206 209 247 267 256 221 239 236 251 262
Karine Fourneron, Stéphane Ciriani - September 2015
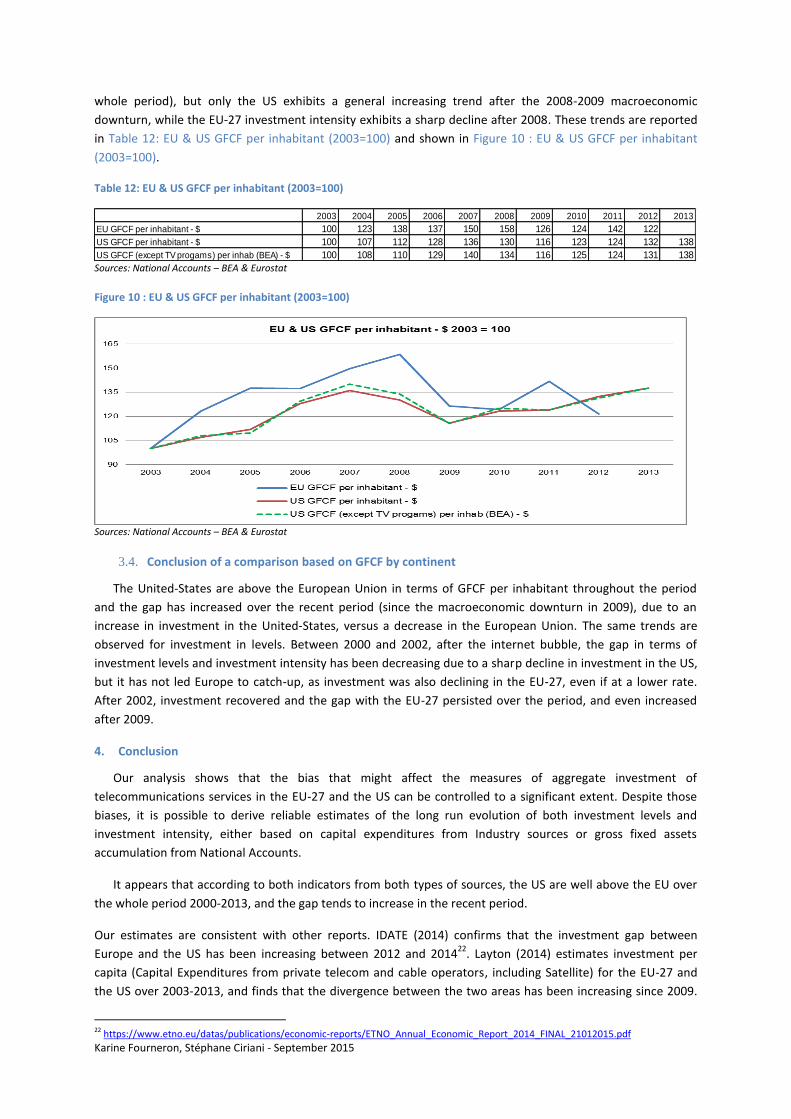
whole period), but only the US exhibits a general increasing trend after the 2008-2009 macroeconomic
downturn, while the EU-27 investment intensity exhibits a sharp decline after 2008. These trends are reported
in Table 12: EU & US GFCF per inhabitant (2003=100) and shown in Figure 10 : EU & US GFCF per inhabitant
(2003=100).
Table 12: EU & US GFCF per inhabitant (2003=100)
Sources: National Accounts – BEA & Eurostat
Figure 10 : EU & US GFCF per inhabitant (2003=100)
Sources: National Accounts – BEA & Eurostat
3.4. Conclusion of a comparison based on GFCF by continent
The United-States are above the European Union in terms of GFCF per inhabitant throughout the period
and the gap has increased over the recent period (since the macroeconomic downturn in 2009), due to an
increase in investment in the United-States, versus a decrease in the European Union. The same trends are
observed for investment in levels. Between 2000 and 2002, after the internet bubble, the gap in terms of
investment levels and investment intensity has been decreasing due to a sharp decline in investment in the US,
but it has not led Europe to catch-up, as investment was also declining in the EU-27, even if at a lower rate.
After 2002, investment recovered and the gap with the EU-27 persisted over the period, and even increased
after 2009.
4. Conclusion
Our analysis shows that the bias that might affect the measures of aggregate investment of
telecommunications services in the EU-27 and the US can be controlled to a significant extent. Despite those
biases, it is possible to derive reliable estimates of the long run evolution of both investment levels and
investment intensity, either based on capital expenditures from Industry sources or gross fixed assets
accumulation from National Accounts.
It appears that according to both indicators from both types of sources, the US are well above the EU over
the whole period 2000-2013, and the gap tends to increase in the recent period.
Our estimates are consistent with other reports. IDATE (2014) confirms that the investment gap between
Europe and the US has been increasing between 2012 and 201422
. Layton (2014) estimates investment per
capita (Capital Expenditures from private telecom and cable operators, including Satellite) for the EU-27 and
the US over 2003-2013, and finds that the divergence between the two areas has been increasing since 2009.
22 https://www.etno.eu/datas/publications/economic-reports/ETNO_Annual_Economic_Report_2014_FINAL_21012015.pdf
2003 2004 2005 2006 2007 2008 2009 2010 2011 2012 2013
EU GFCF per inhabitant - $ 100 123 138 137 150 158 126 124 142 122
US GFCF per inhabitant - $ 100 107 112 128 136 130 116 123 124 132 138
US GFCF (except TV progams) per inhab (BEA) - $ 100 108 110 129 140 134 116 125 124 131 138
Karine Fourneron, Stéphane Ciriani - September 2015
In 2009, US CAPEX were 25% higher in the US, while in 2013, US CAPEX were twice the EU-27 level. Moreover,
a recent study from Mazars (2015) shows that investment in the US (a panel of top 4 operators accounting for
95% of US mobile investments) has risen by 39% over 2006-2013 while it has decreased by 5% in the EU (a
panel of 7 EU operators with more that 100 million subscribers). The study indicates that investment is the
differentiation factor between the two areas: weaker investment in the EU-27 is responsible for global revenue
stagnation (and ARPU decrease), and slower 4G development in the area.
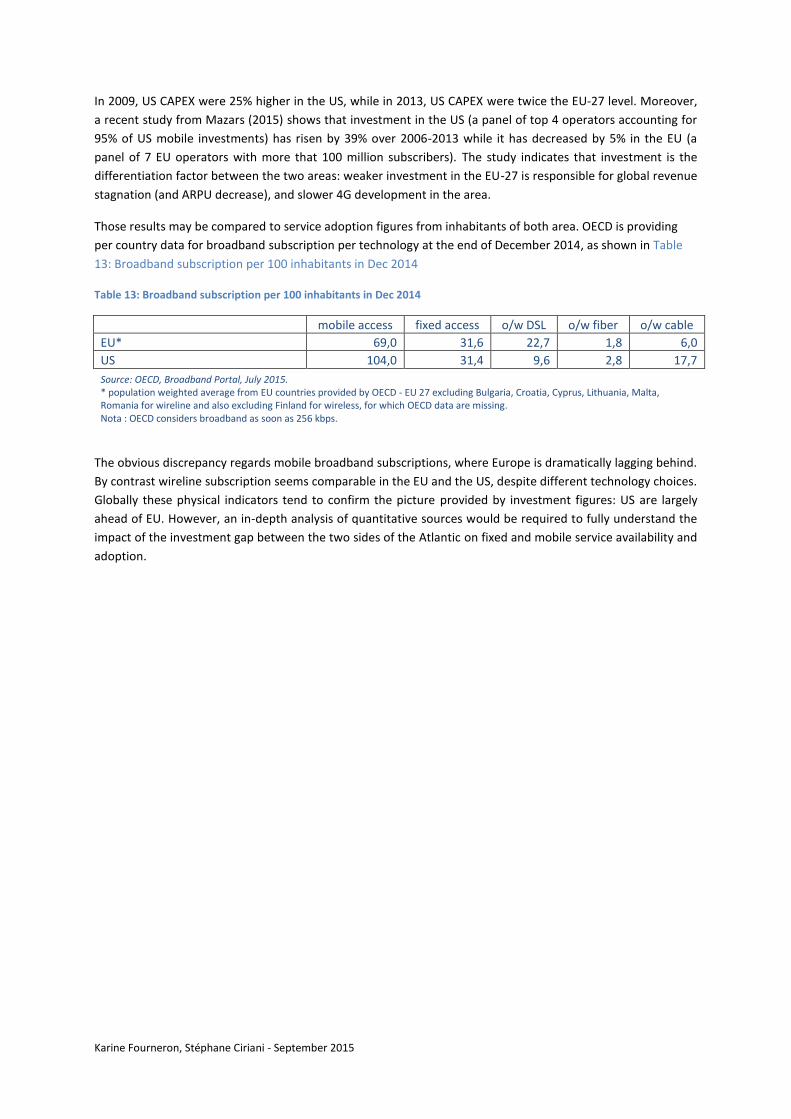
Those results may be compared to service adoption figures from inhabitants of both area. OECD is providing
per country data for broadband subscription per technology at the end of December 2014, as shown in Table
13: Broadband subscription per 100 inhabitants in Dec 2014
Table 13: Broadband subscription per 100 inhabitants in Dec 2014
mobile access fixed access o/w DSL o/w fiber o/w cable
EU* 69,0 31,6 22,7 1,8 6,0
US 104,0 31,4 9,6 2,8 17,7
Source: OECD, Broadband Portal, July 2015.
* population weighted average from EU countries provided by OECD - EU 27 excluding Bulgaria, Croatia, Cyprus, Lithuania, Malta, Romania for wireline and also excluding Finland for wireless, for which OECD data are missing. Nota : OECD considers broadband as soon as 256 kbps.
The obvious discrepancy regards mobile broadband subscriptions, where Europe is dramatically lagging behind.
By contrast wireline subscription seems comparable in the EU and the US, despite different technology choices.
Globally these physical indicators tend to confirm the picture provided by investment figures: US are largely
ahead of EU. However, an in-depth analysis of quantitative sources would be required to fully understand the
impact of the investment gap between the two sides of the Atlantic on fixed and mobile service availability and
adoption.
Karine Fourneron, Stéphane Ciriani - September 2015
List of Figures
Figure 1: US telecoms capital expenditures 2000-2013 per inhabitant ................................................. 8
Figure 2:US telecoms capital expenditures over 2000-2013 per inhabitant .......................................... 9
Figure 3: EU Cable revenues and CAPEX estimates ............................................................................... 11
Figure 4: EU CAPEX per inhabitant estimates ....................................................................................... 12
Figure 5 : EU and US CAPEX per inhabitant estimates .......................................................................... 13
Figure 6 : European & US CAPEX per inhabitant (2003=100) ................................................................ 13
Figure 7 : Investment of US telecommunications services ................................................................... 15
Figure 8: EU & US GFCF in telecommunications services industry ....................................................... 16
Figure 9 : EU & US GFCF per capita ....................................................................................................... 17
Figure 10 : EU & US GFCF per inhabitant (2003=100) ........................................................................... 18
Figure 11 : GFCF & CAPEX of EU telecommunications services ............................................................ 21
Figure 12 : GFCF & CAPEX of EU telecommunications services per capita ........................................... 22
Figure 13: US GFCF & CAPEX telecommunications services ................................................................. 23
List of tables
Table 1: US telecoms capital expenditures 2000-2013 (in levels and per inhabitant) ........................... 8
Table 2: US telecoms capital expenditures over 2000-2013 per inhabitant ........................................... 9
Table 3: EU Cable revenues and CAPEX estimates ................................................................................ 11
Table 4 : European cable operators (retail market) CAPEX levels estimates ........................................ 11
Table 5 : EU CAPEX per inhabitant estimates ........................................................................................ 12
Table 6: EU and US CAPEX per inhabitant estimates ............................................................................ 13
Table 7 : European & US CAPEX per inhabitant (2003=100) ................................................................. 13
Table 8 : Investment of US telecommunications services ..................................................................... 15
Table 9 : EU GFCF in telecommunications services industry ................................................................. 16
Table 10 : EU & US GFCF in telecommunications services industry ...................................................... 16
Table 11 : EU & US GFCF per capita ...................................................................................................... 17
Table 12: EU & US GFCF per inhabitant (2003=100) ............................................................................. 18
Table 13: Broadband subscription per 100 inhabitants in Dec 2014 .................................................... 19
Table 14 : GFCF & CAPEX of EU telecommunications services ............................................................. 21
Table 15: GFCF & CAPEX of EU telecommunications services per capita ............................................. 22
Table 16 : US GFCF & CAPEX telecommunications services .................................................................. 23
Karine Fourneron, Stéphane Ciriani - September 2015
Appendix 1
This appendix section analyses the discrepancies between industry sources and National Accounts sources
for each region, as presented in this note. The comparison between investments from institutional sources (US
BEA, OECD and Eurostat Annual National Accounts) and industrial sources (OVUM and US Telecom-Broadband
Association) reveals discrepancies that might be significant, for both the US and the EU-27 areas. The reasons
for those differences can be to a large extent identified even if the magnitude of the differences cannot be
systematically measured.
The National Accounts include economic agents that produce an homogeneous set of services (which
belong to the same classification) and include those investments in telecommunications by government
agencies (that are not included in the business industries and not reported in the CAPEX calculations of industry
sources, which take only account of private fixed assets investments from private companies).
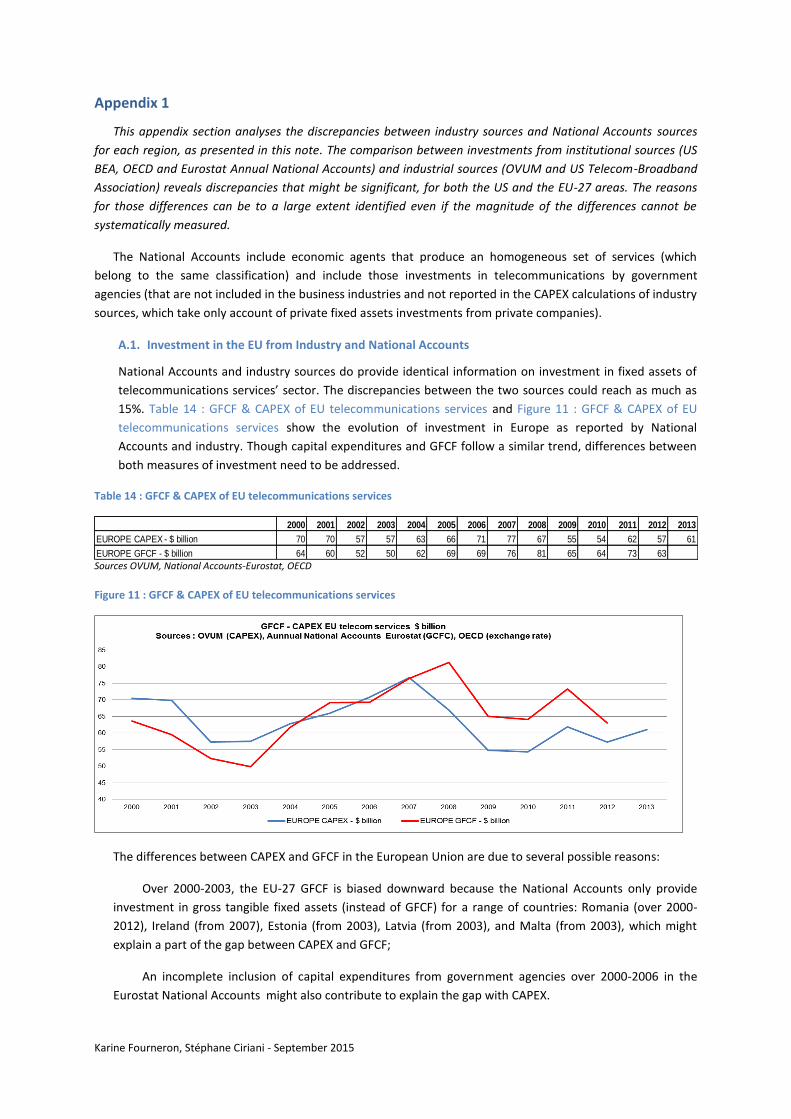
A.1. Investment in the EU from Industry and National Accounts
National Accounts and industry sources do provide identical information on investment in fixed assets of
telecommunications services’ sector. The discrepancies between the two sources could reach as much as
15%. Table 14 : GFCF & CAPEX of EU telecommunications services and Figure 11 : GFCF & CAPEX of EU
telecommunications services show the evolution of investment in Europe as reported by National
Accounts and industry. Though capital expenditures and GFCF follow a similar trend, differences between
both measures of investment need to be addressed.
Table 14 : GFCF & CAPEX of EU telecommunications services
Sources OVUM, National Accounts-Eurostat, OECD
Figure 11 : GFCF & CAPEX of EU telecommunications services
The differences between CAPEX and GFCF in the European Union are due to several possible reasons:
Over 2000-2003, the EU-27 GFCF is biased downward because the National Accounts only provide
investment in gross tangible fixed assets (instead of GFCF) for a range of countries: Romania (over 2000-
2012), Ireland (from 2007), Estonia (from 2003), Latvia (from 2003), and Malta (from 2003), which might
explain a part of the gap between CAPEX and GFCF;
An incomplete inclusion of capital expenditures from government agencies over 2000-2006 in the
Eurostat National Accounts might also contribute to explain the gap with CAPEX.
2000 2001 2002 2003 2004 2005 2006 2007 2008 2009 2010 2011 2012 2013
EUROPE CAPEX - $ billion 70 70 57 57 63 66 71 77 67 55 54 62 57 61
EUROPE GFCF - $ billion 64 60 52 50 62 69 69 76 81 65 64 73 63
EUROPE GFCF- $ billion (EXEP) 64 59 58 56 68 66 73 82 77 67 65 68 65
Karine Fourneron, Stéphane Ciriani - September 2015
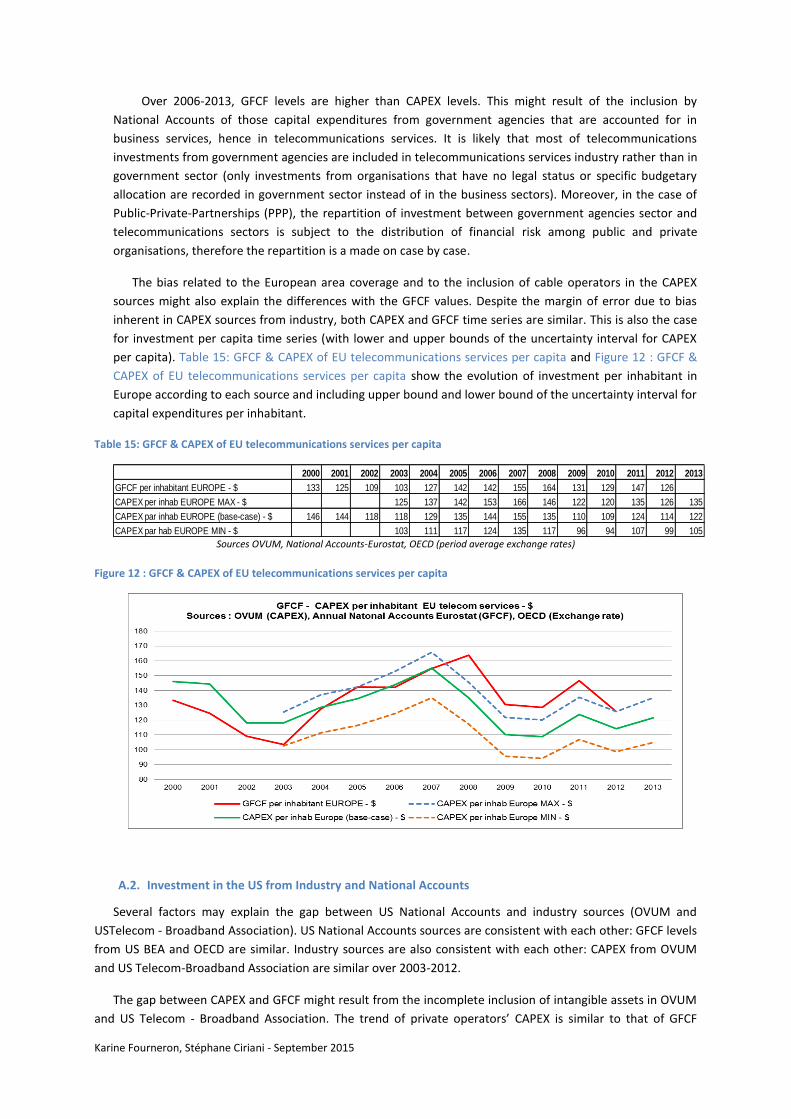
Over 2006-2013, GFCF levels are higher than CAPEX levels. This might result of the inclusion by
National Accounts of those capital expenditures from government agencies that are accounted for in
business services, hence in telecommunications services. It is likely that most of telecommunications
investments from government agencies are included in telecommunications services industry rather than in
government sector (only investments from organisations that have no legal status or specific budgetary
allocation are recorded in government sector instead of in the business sectors). Moreover, in the case of
Public-Private-Partnerships (PPP), the repartition of investment between government agencies sector and
telecommunications sectors is subject to the distribution of financial risk among public and private
organisations, therefore the repartition is a made on case by case.
The bias related to the European area coverage and to the inclusion of cable operators in the CAPEX
sources might also explain the differences with the GFCF values. Despite the margin of error due to bias
inherent in CAPEX sources from industry, both CAPEX and GFCF time series are similar. This is also the case
for investment per capita time series (with lower and upper bounds of the uncertainty interval for CAPEX
per capita). Table 15: GFCF & CAPEX of EU telecommunications services per capita and Figure 12 : GFCF &
CAPEX of EU telecommunications services per capita show the evolution of investment per inhabitant in
Europe according to each source and including upper bound and lower bound of the uncertainty interval for
capital expenditures per inhabitant.
Table 15: GFCF & CAPEX of EU telecommunications services per capita
Sources OVUM, National Accounts-Eurostat, OECD (period average exchange rates)
Figure 12 : GFCF & CAPEX of EU telecommunications services per capita
A.2. Investment in the US from Industry and National Accounts
Several factors may explain the gap between US National Accounts and industry sources (OVUM and
USTelecom - Broadband Association). US National Accounts sources are consistent with each other: GFCF levels
from US BEA and OECD are similar. Industry sources are also consistent with each other: CAPEX from OVUM
and US Telecom-Broadband Association are similar over 2003-2012.
The gap between CAPEX and GFCF might result from the incomplete inclusion of intangible assets in OVUM
and US Telecom - Broadband Association. The trend of private operators’ CAPEX is similar to that of GFCF
2000 2001 2002 2003 2004 2005 2006 2007 2008 2009 2010 2011 2012 2013
GFCF per inhabitant EUROPE - $ 133 125 109 103 127 142 142 155 164 131 129 147 126
CAPEX per inhab EUROPE MAX - $ 125 137 142 153 166 146 122 120 135 126 135
CAPEX par inhab EUROPE (base-case) - $ 146 144 118 118 129 135 144 155 135 110 109 124 114 122
CAPEX par hab EUROPE MIN - $ 103 111 117 124 135 117 96 94 107 99 105
Karine Fourneron, Stéphane Ciriani - September 2015
without intangibles related to audio-visual content. It is likely that industry sources do not include such
intangible assets.
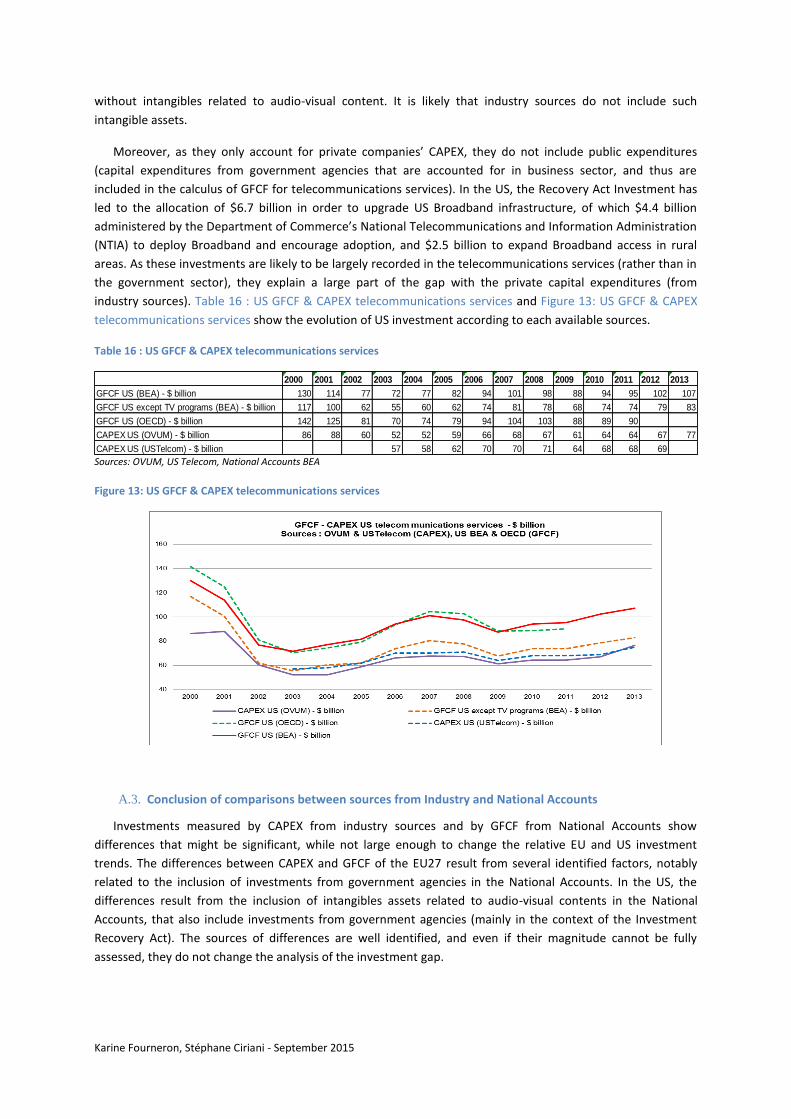
Moreover, as they only account for private companies’ CAPEX, they do not include public expenditures
(capital expenditures from government agencies that are accounted for in business sector, and thus are
included in the calculus of GFCF for telecommunications services). In the US, the Recovery Act Investment has
led to the allocation of $6.7 billion in order to upgrade US Broadband infrastructure, of which $4.4 billion
administered by the Department of Commerce’s National Telecommunications and Information Administration
(NTIA) to deploy Broadband and encourage adoption, and $2.5 billion to expand Broadband access in rural
areas. As these investments are likely to be largely recorded in the telecommunications services (rather than in
the government sector), they explain a large part of the gap with the private capital expenditures (from
industry sources). Table 16 : US GFCF & CAPEX telecommunications services and Figure 13: US GFCF & CAPEX
telecommunications services show the evolution of US investment according to each available sources.
Table 16 : US GFCF & CAPEX telecommunications services
Sources: OVUM, US Telecom, National Accounts BEA
Figure 13: US GFCF & CAPEX telecommunications services
A.3. Conclusion of comparisons between sources from Industry and National Accounts
Investments measured by CAPEX from industry sources and by GFCF from National Accounts show
differences that might be significant, while not large enough to change the relative EU and US investment
trends. The differences between CAPEX and GFCF of the EU27 result from several identified factors, notably
related to the inclusion of investments from government agencies in the National Accounts. In the US, the
differences result from the inclusion of intangibles assets related to audio-visual contents in the National
Accounts, that also include investments from government agencies (mainly in the context of the Investment
Recovery Act). The sources of differences are well identified, and even if their magnitude cannot be fully
assessed, they do not change the analysis of the investment gap.
2000 2001 2002 2003 2004 2005 2006 2007 2008 2009 2010 2011 2012 2013
GFCF US (BEA) - $ billion 130 114 77 72 77 82 94 101 98 88 94 95 102 107
GFCF US except TV programs (BEA) - $ billion 117 100 62 55 60 62 74 81 78 68 74 74 79 83
GFCF US (OECD) - $ billion 142 125 81 70 74 79 94 104 103 88 89 90
CAPEX US (OVUM) - $ billion 86 88 60 52 52 59 66 68 67 61 64 64 67 77
CAPEX US (USTelcom) - $ billion 57 58 62 70 70 71 64 68 68 69