Embed Size (px)
Citation preview
Development Initiatives exists to end extreme poverty by 2030
2015Investments to End Poverty
www.devinit.org
Meeting the challenge:
reducing poverty to zero

Copyright © 2015 Development Initiatives Ltd
North Quay House, Quay side, Temple Back,
Bristol BS1 6FL, United Kingdom
We encourage dissemination of our work providing
a reference is included.
While the authors have made every effort to ensure that the
information in this report was correct at time of print, Development
Initiatives does not assume liability for the accuracy of the data, or
any consequence of its use.
You can also download ‘Investments to End Poverty 2015’ from:
devinit.org/investments-to-end-poverty-2015
Email us for a hard copy of the report
Please share your feedback by email, on our website or on Twitter at
@devinitorg
INVESTMENTS TO END POVERTY 2015
ii
Many people have contributed to the Investments to End Poverty programme and even more to the thinking behind it. We would particularly like to thank the Bill & Melinda Gates Foundation for their generous support, without which Investments to End Poverty would not have been possible.
Investments to End Poverty 2015 was authored by a team at Development Initiatives, led by Tim Strawson, managed by Jenny Claydon, and guided by Harpinder Collacott (Executive Director), Dan Coppard (Director of Research, Analysis and Evidence), Tony German (Strategic Advisor), Martin Horwood (Director of Engagement and Impact), Marcus Manuel (Associate Director) and Judith Randel (Strategic Advisor). Our team of analysts responsible for developing research, analysis and writing were: Bill Anderson, Vasileios Antonopoulos, Jordan Beecher, Nelson Bunani, Cecilia Caio, Rosanna Collins, Mariella Di Ciommo, Sarah Hénon (Chapter 5 lead), Guto Ifan, Vremudia Irikefe, Hannah Kalanguka, Duncan Knox (Data Manager), Gertrude Nandyona-Ssebuufu, Wilbrod Ntawiha, Rory Scott, Manon Simeon, Rob Tew (chapter 4 and country profiles lead), Ian Townsend (Chapter 1 co-author), Luminita Tuchel, Dan Walton and Richard Watts (Chapter 3 lead). Communication and engagement on Investments to End Poverty has been led by Andrew Palmer and our team including Anna Abuhelal, Becky Carley, Rebecca Hills and Cat Langdon.
Investments to End Poverty is an independent report. The analysis presented and views expressed are the responsibility of Development Initiatives and do not necessarily reflect those of the contributors or their organisations.
Acknowledgements
i i i
ContentsAcknowledgements iiPreface ivOverview 1
Chapter 1 – Ending extreme poverty by 2030 9Ending poverty will be more challenging than halving it 10Security and environmental issues will become far more prominent and need to be addressed to get poverty to zero 11Ending poverty needs a focus on people as well as countries 12Poverty data is insufficient to support the effective targeting of the poorest people 13
Chapter 2 – The mix of all resources 15The scale of resources available 16The unequal distribution of domestic resources 17The differing mix of international resources 18Data poverty 21
Chapter 3 – Domestic public resources 25Domestic resource mobilisation 26Domestic public resource allocations 29Sub-national domestic public resources 32Sub-national spending 32Sub-national revenue 32
Chapter 4 – International official finance 37Unbundling international official finance 38 How is international official finance targeted? 40ODA allocated by donor agencies 41How climate adaptation finance is allocated 42ODA – a vital resource for the future 45ODA as a catalyst for mobilising other resources and reducing risk 46The role of ODA in mobilising domestic resources 47ODA and the private sector 47Development cooperation from other government providers 48Defining climate finance 51Data poverty 52
Chapter 5 – Data for decision-making 53The data provides an incomplete picture 54Using different types of data to monitor progress 54An agenda for better data: making data fit for purpose 56Developing a culture of data use, led by national institutions 58
Annex 61 Notes 63Development Data Hub 70
iv
Welcome to the Investments to End Poverty report 2015, our second edition to date. It is an honour to be writing this as Development Initiatives’ new Executive Director. For the past 20 years Development Initiatives has sought to help end extreme poverty by making data and information on poverty and resource flows transparent, accessible and useable. I hope this report forms another valuable contribution in the journey to achieving the end of poverty.
This year has brought with it an unprecedented moment of political will to end poverty. Specifically the new Sustainable Development Goal target to end extreme poverty over the next 15 years will be a much more difficult task than halving it has been. The data shows that many of the world’s poorest countries need a significant change in policies and approach, along with accelerated growth, if they are to see an end to poverty. This is no easy task, especially against a complicated backdrop of exploitation, inequality and political and environmental insecurity that affects different people in different ways; this has to be considered and navigated to ensure that we genuinely leave no one behind.
This report, and our online Development Data Hub, pick up from our first edition in looking at the impact of all resources on poverty reduction. In this edition, you will find the latest overview of the mix of all resources – including new details of governments’ spending in developing countries; commercial flows such as foreign direct investment and lending; private giving through non-governmental organisations and remittances; and official development assistance and other official investments in developing countries; and global public goods. We hope the report will contribute to productive discussion about how all resources, and particularly development cooperation, can be better targeted to ending poverty.
As ever, we have sought to gather the best available information on all resources and poverty. But at the core of the report is recognition of the urgent need to revolutionise data for development. Data is central to achieving an end to poverty – without it we cannot identify the most vulnerable, marginalised and poorest people; understand the services they have access to; know about the full mix of resources that could lift them sustainably out of poverty; or track their progress. Importantly, data is required at a local level. It needs to be available for use by district officials and community-based organisations so they can make the right decisions about where to spend money for greatest impact. Only then can we set ourselves firmly on the path to end global poverty and make sure no one is left behind.
I hope the report provides a detailed picture that will help inform people’s choices on how to allocate resources to end poverty. I very much value your feedback on insights that the report raises as we work together to make the end of poverty a reality.
Harpinder Collacott
Preface
OVERVIEW 1OVERVIEW 1
Overview
This report and the Development Data Hub
Much of the data presented in this report is available online in our Development Data Hub (devinit.org/data). Links to relevant parts of the Development Data Hub are included throughout the report and, while the data was aligned when the report was launched in September 2015, the Development Data Hub will be updated with new and updated data so as time passes there may be differences between the numbers printed here and in the live version online.
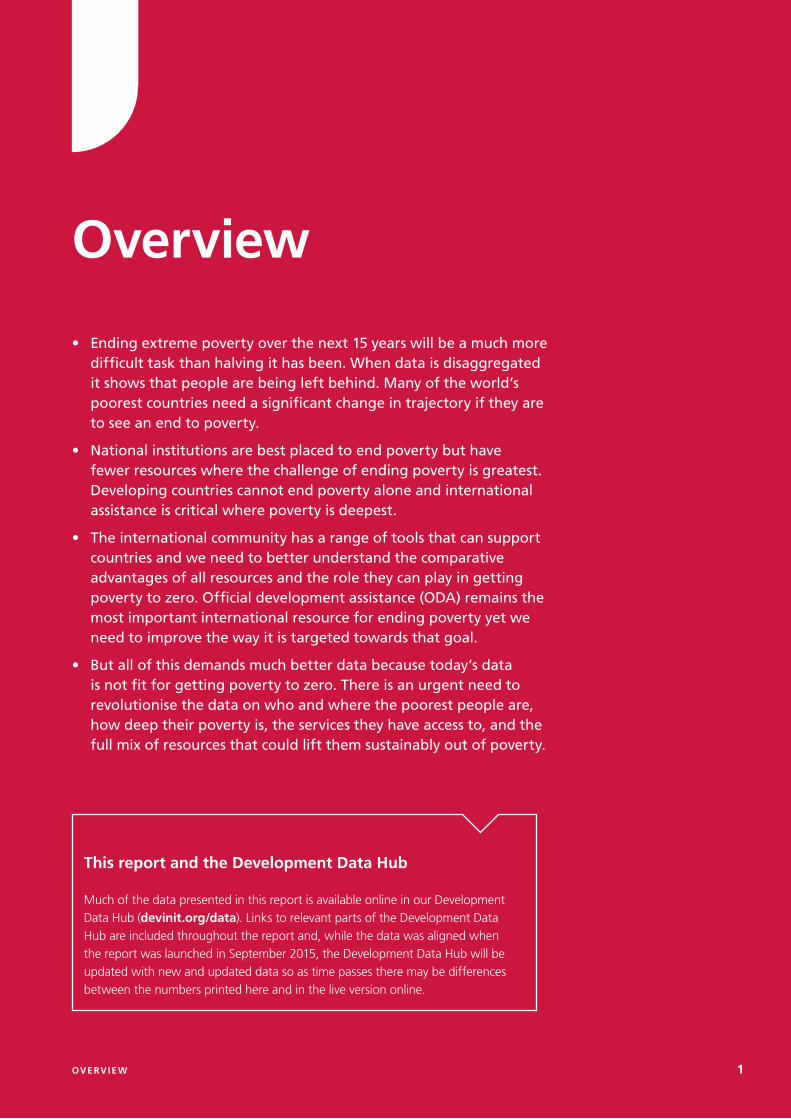
• Ending extreme poverty over the next 15 years will be a much more difficult task than halving it has been. When data is disaggregated it shows that people are being left behind. Many of the world’s poorest countries need a significant change in trajectory if they are to see an end to poverty.
• National institutions are best placed to end poverty but have fewer resources where the challenge of ending poverty is greatest. Developing countries cannot end poverty alone and international assistance is critical where poverty is deepest.
• The international community has a range of tools that can support countries and we need to better understand the comparative advantages of all resources and the role they can play in getting poverty to zero. Official development assistance (ODA) remains the most important international resource for ending poverty yet we need to improve the way it is targeted towards that goal.
• But all of this demands much better data because today’s data is not fit for getting poverty to zero. There is an urgent need to revolutionise the data on who and where the poorest people are, how deep their poverty is, the services they have access to, and the full mix of resources that could lift them sustainably out of poverty.
2 INVESTMENTS TO END POVERT Y 2015
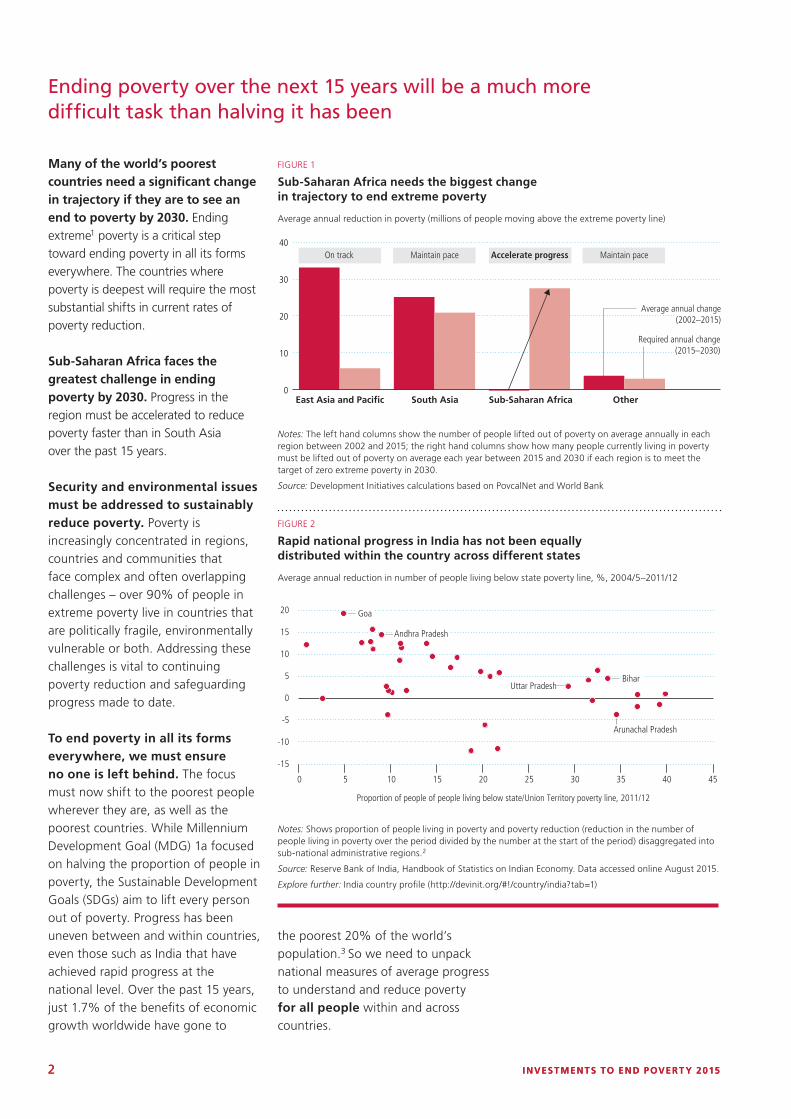
FIGURE 1
Sub-Saharan Africa needs the biggest change in trajectory to end extreme poverty
Average annual reduction in poverty (millions of people moving above the extreme poverty line)
Sub-Saharan Africa needs the biggest change in trajectory
Income per day (2005 PPP$)
On track Maintain pace Maintain paceAccelerate progress
South AsiaEast Asia and Paci�c Sub-Saharan Africa Other
Notes: The left hand columns show the number of people lifted out of poverty on average in each region between2002 and 2015; the right hand columns show how many people currently living in poverty must be lifted out ofpoverty on average each year between 2015 and 2030 if each region is to meet the target of zero extreme poverty in2030.
Source: Development Initiatives calculations based on Povcalnet and World Development Indicators
0
10
20
30
40
Average annual change (2002–2015)
Required annual change (2015–2030)
Notes: The left hand columns show the number of people lifted out of poverty on average annually in each region between 2002 and 2015; the right hand columns show how many people currently living in poverty must be lifted out of poverty on average each year between 2015 and 2030 if each region is to meet the target of zero extreme poverty in 2030.
Source: Development Initiatives calculations based on PovcalNet and World Bank
Many of the world’s poorest countries need a significant change in trajectory if they are to see an end to poverty by 2030. Ending extreme1 poverty is a critical step toward ending poverty in all its forms everywhere. The countries where poverty is deepest will require the most substantial shifts in current rates of poverty reduction.
Sub-Saharan Africa faces the greatest challenge in ending poverty by 2030. Progress in the region must be accelerated to reduce poverty faster than in South Asia over the past 15 years.
Security and environmental issues must be addressed to sustainably reduce poverty. Poverty is increasingly concentrated in regions, countries and communities that face complex and often overlapping challenges – over 90% of people in extreme poverty live in countries that are politically fragile, environmentally vulnerable or both. Addressing these challenges is vital to continuing poverty reduction and safeguarding progress made to date.
To end poverty in all its forms everywhere, we must ensure no one is left behind. The focus must now shift to the poorest people wherever they are, as well as the poorest countries. While Millennium Development Goal (MDG) 1a focused on halving the proportion of people in poverty, the Sustainable Development Goals (SDGs) aim to lift every person out of poverty. Progress has been uneven between and within countries, even those such as India that have achieved rapid progress at the national level. Over the past 15 years, just 1.7% of the benefits of economic growth worldwide have gone to
-15
-10
-5
0
5
10
15
20
0 5 10 15 20 25 30 35 40 45
Proportion of people of people living below state/Union Territory poverty line, 2011/12
Uttar Pradesh
Arunachal Pradesh
Average annual reduction in number of people living below provincial poverty line, 2004/5−2011/12
Andhra Pradesh
Goa
Bihar
FIGURE 2
Rapid national progress in India has not been equally distributed within the country across different states
Average annual reduction in number of people living below state poverty line, %, 2004/5–2011/12
Notes: Shows proportion of people living in poverty and poverty reduction (reduction in the number of people living in poverty over the period divided by the number at the start of the period) disaggregated into sub-national administrative regions.2
Source: Reserve Bank of India, Handbook of Statistics on Indian Economy. Data accessed online August 2015.
Explore further: India country profile (http://devinit.org/#!/country/india?tab=1)
Ending poverty over the next 15 years will be a much more difficult task than halving it has been
the poorest 20% of the world’s population.3 So we need to unpack national measures of average progress to understand and reduce poverty for all people within and across countries.
2 INVESTMENTS TO END POVERT Y 2015
OVERVIEW 3
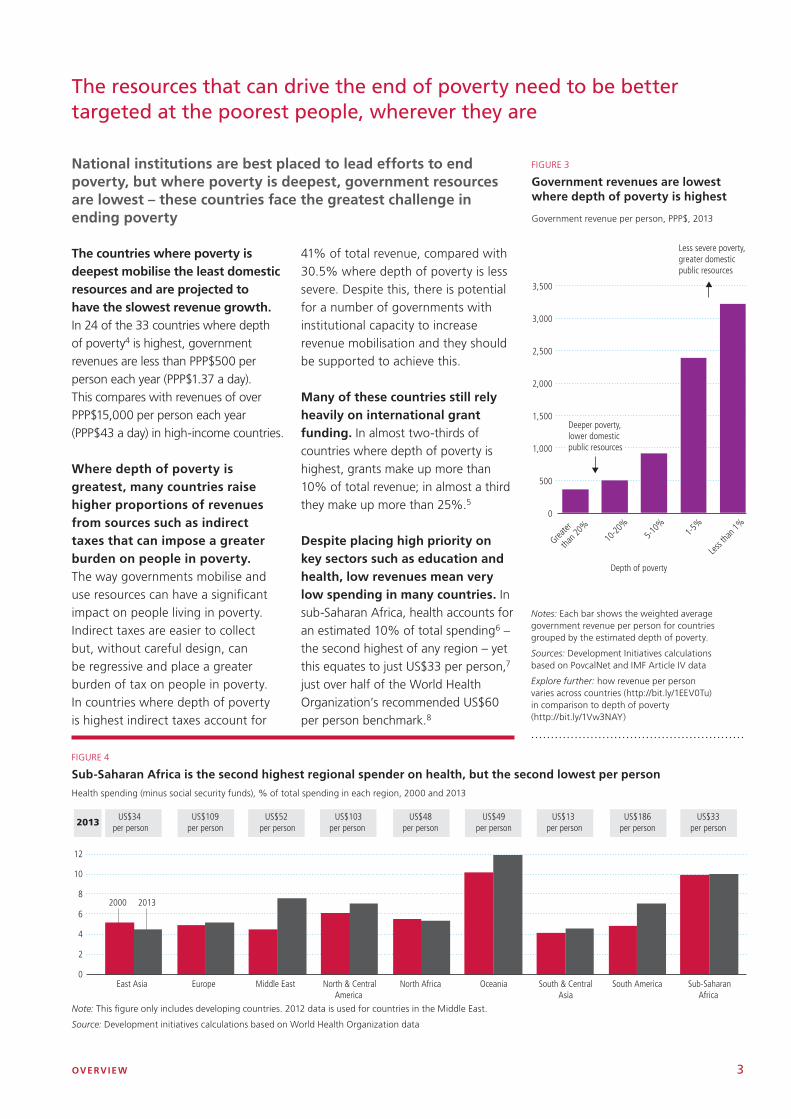
FIGURE 4
Sub-Saharan Africa is the second highest regional spender on health, but the second lowest per person
Health spending (minus social security funds), % of total spending in each region, 2000 and 2013
The resources that can drive the end of poverty need to be better targeted at the poorest people, wherever they are
The countries where poverty is deepest mobilise the least domestic resources and are projected to have the slowest revenue growth. In 24 of the 33 countries where depth of poverty4 is highest, government revenues are less than PPP$500 per person each year (PPP$1.37 a day). This compares with revenues of over PPP$15,000 per person each year (PPP$43 a day) in high-income countries.
Where depth of poverty is greatest, many countries raise higher proportions of revenues from sources such as indirect taxes that can impose a greater burden on people in poverty. The way governments mobilise and use resources can have a significant impact on people living in poverty. Indirect taxes are easier to collect but, without careful design, can be regressive and place a greater burden of tax on people in poverty. In countries where depth of poverty is highest indirect taxes account for
41% of total revenue, compared with 30.5% where depth of poverty is less severe. Despite this, there is potential for a number of governments with institutional capacity to increase revenue mobilisation and they should be supported to achieve this.
Many of these countries still rely heavily on international grant funding. In almost two-thirds of countries where depth of poverty is highest, grants make up more than 10% of total revenue; in almost a third they make up more than 25%.5
Despite placing high priority on key sectors such as education and health, low revenues mean very low spending in many countries. In sub-Saharan Africa, health accounts for an estimated 10% of total spending6 – the second highest of any region – yet this equates to just US$33 per person,7 just over half of the World Health Organization’s recommended US$60 per person benchmark.8
500
0
1,000
1,500
2,000
2,500
3,000
3,500
Greaterthan 20%
10-20% 5-10% 1-5% Less than 1% No data
Government revenue per person, PPP$, 2013
Depth of poverty
Less severe poverty, greater domestic public resources
Deeper poverty, lower domestic public resources
500
0
1,000
1,500
2,000
2,500
3,000
3,500
Greater
than
20%
10-20
%5-1
0% 1-5%
Less t
han 1
%
Government revenue per person, PPP$, 2013
Depth of poverty
Less severe poverty, greater domestic public resources
Deeper poverty, lower domestic public resources
0
2
4
6
8
10
12
East Asia Europe Middle East North & CentralAmerica
North Africa Oceania South & CentralAsia
South America Sub-SaharanAfrica
US$34 per person
US$109 per person
US$52 per person
US$103per person
US$48per person
US$49per person
US$13 per person
US$186per person
US$33per person
2000 2013
2013
FIGURE 3
Government revenues are lowest where depth of poverty is highest
Government revenue per person, PPP$, 2013
Notes: Each bar shows the weighted average government revenue per person for countries grouped by the estimated depth of poverty.
Sources: Development Initiatives calculations based on PovcalNet and IMF Article IV data
Explore further: how revenue per person varies across countries (http://bit.ly/1EEV0Tu) in comparison to depth of poverty (http://bit.ly/1Vw3NAY)
Note: This figure only includes developing countries. 2012 data is used for countries in the Middle East.
Source: Development initiatives calculations based on World Health Organization data
National institutions are best placed to lead efforts to end poverty, but where poverty is deepest, government resources are lowest – these countries face the greatest challenge in ending poverty
4 INVESTMENTS TO END POVERT Y 2015
Many developing countries cannot end poverty alone. International official finance is important and must be well targeted, with the appropriate mechanisms used in the right contexts
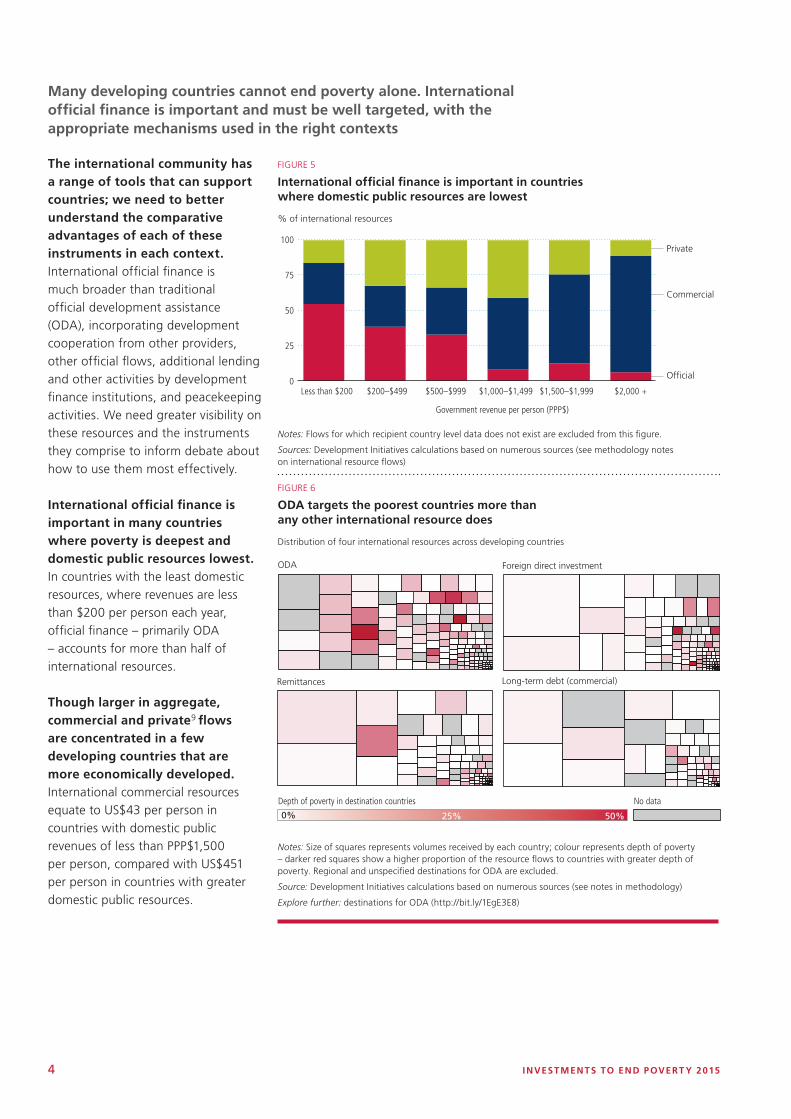
50%25%
Depth of poverty in destination countries No data
0%
Foreign direct investmentODA
Remittances Long-term debt (commercial)
FIGURE 6
ODA targets the poorest countries more than any other international resource does
Distribution of four international resources across developing countries
Notes: Size of squares represents volumes received by each country; colour represents depth of poverty – darker red squares show a higher proportion of the resource flows to countries with greater depth of poverty. Regional and unspecified destinations for ODA are excluded.
Source: Development Initiatives calculations based on numerous sources (see notes in methodology)
Explore further: destinations for ODA (http://bit.ly/1EgE3E8)
0
25
50
75
100
Less than $200 $200–$499 $500–$999 $1,000–$1,499 $1,500–$1,999 $2,000 +
Proportion of international resources
Government revenue per person (PPP$)
Private
Commercial
Of�cial
0%
25%
50%
75%
100%
Less t
han $
200
$200
–$49
9
$500
–$99
9
$1,00
0–$1
,499
$1,50
0–$1
,999
$2,00
0 +
Proportion of international resources
Government revenue per person (PPP$)
Private
Commercial
Of�cial
Less than $200 $200 - $499 $500 - $999 $1,000 - $1,499 $1,500 - $1,999 $2,000 +Government revenue per person (PPP$)
Private
Commercial
Official
The international community has a range of tools that can support countries; we need to better understand the comparative advantages of each of these instruments in each context. International official finance is much broader than traditional official development assistance (ODA), incorporating development cooperation from other providers, other official flows, additional lending and other activities by development finance institutions, and peacekeeping activities. We need greater visibility on these resources and the instruments they comprise to inform debate about how to use them most effectively.
International official finance is important in many countries where poverty is deepest and domestic public resources lowest. In countries with the least domestic resources, where revenues are less than $200 per person each year, official finance – primarily ODA – accounts for more than half of international resources.
Though larger in aggregate, commercial and private9 flows are concentrated in a few developing countries that are more economically developed. International commercial resources equate to US$43 per person in countries with domestic public revenues of less than PPP$1,500 per person, compared with US$451 per person in countries with greater domestic public resources.
FIGURE 5
International official finance is important in countries where domestic public resources are lowest
% of international resources
Notes: Flows for which recipient country level data does not exist are excluded from this figure.
Sources: Development Initiatives calculations based on numerous sources (see methodology notes on international resource flows)
OVERVIEW 5
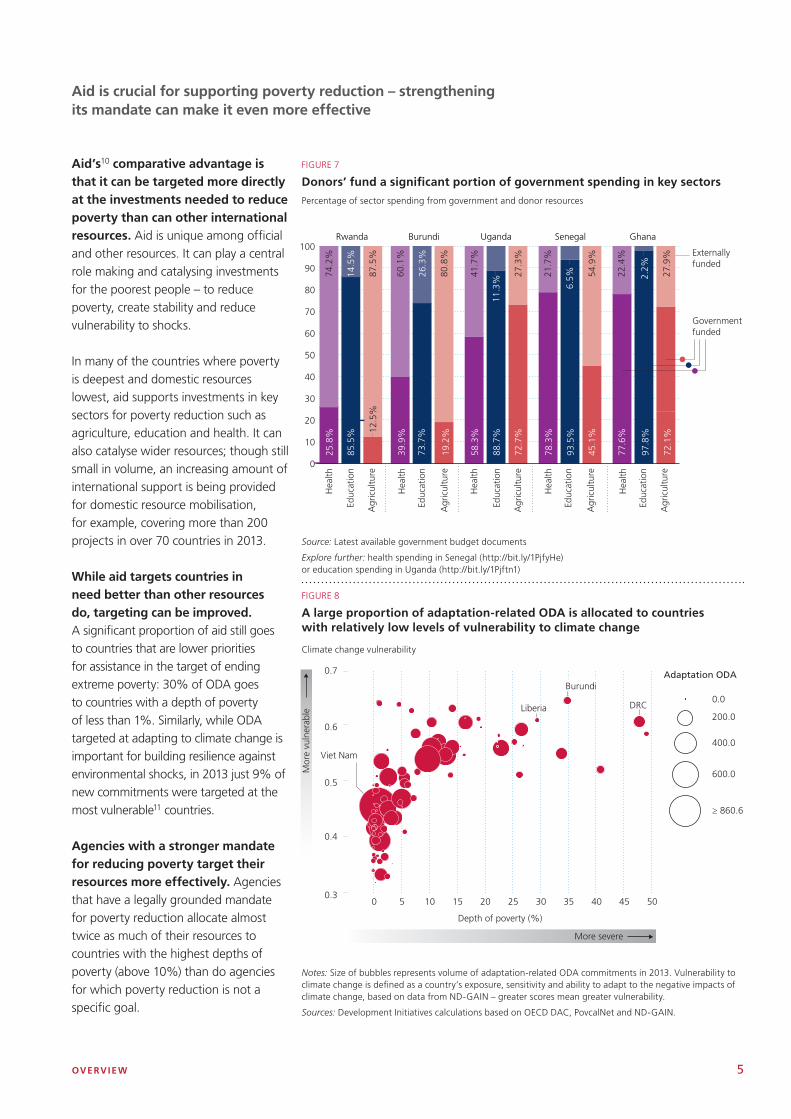
Aid’s10 comparative advantage is that it can be targeted more directly at the investments needed to reduce poverty than can other international resources. Aid is unique among official and other resources. It can play a central role making and catalysing investments for the poorest people – to reduce poverty, create stability and reduce vulnerability to shocks.
In many of the countries where poverty is deepest and domestic resources lowest, aid supports investments in key sectors for poverty reduction such as agriculture, education and health. It can also catalyse wider resources; though still small in volume, an increasing amount of international support is being provided for domestic resource mobilisation, for example, covering more than 200 projects in over 70 countries in 2013.
While aid targets countries in need better than other resources do, targeting can be improved. A significant proportion of aid still goes to countries that are lower priorities for assistance in the target of ending extreme poverty: 30% of ODA goes to countries with a depth of poverty of less than 1%. Similarly, while ODA targeted at adapting to climate change is important for building resilience against environmental shocks, in 2013 just 9% of new commitments were targeted at the most vulnerable11 countries.
Agencies with a stronger mandate for reducing poverty target their resources more effectively. Agencies that have a legally grounded mandate for poverty reduction allocate almost twice as much of their resources to countries with the highest depths of poverty (above 10%) than do agencies for which poverty reduction is not a specific goal.
0 5 10 15 20 25 30 35 40 50
Mor
e vu
lner
able
0.7
0.6
0.5
0.3
0.4
DRC
Burundi
Liberia
Viet Nam
Adaptation ODA
0.0
200.0
400.0
600.0
≥ 860.6
Depth of poverty (%)
More severe
45
0
10
20
30
40
50
60
70
80
90
100
39.9
%
73.7
%
19.2
%
60.1
%
26.3
%
80.8
%
Hea
lth
Educ
atio
n
Agr
icul
ture
Burundi
25.8
%
85.5
% 12.5
%
74.2
%
14.5
%
87.5
%
Hea
lth
Educ
atio
n
Agr
icul
ture
Rwanda
58.3
%
88.7
%
72.7
%
41.7
%
11.3
%
27.3
%
Hea
lth
Educ
atio
n
Agr
icul
ture
Uganda
78.3
%
93.5
%
45.1
%
21.7
%
6.5% 54
.9%
Hea
lth
Educ
atio
n
Agr
icul
ture
Senegal
77.6
%
97.8
%
72.1
%
22.4
%
2.2% 27.9
%
Hea
lth
Educ
atio
n
Agr
icul
ture
Ghana
Government funded
Externally funded
FIGURE 7
Donors’ fund a significant portion of government spending in key sectors
Percentage of sector spending from government and donor resources
FIGURE 8
A large proportion of adaptation-related ODA is allocated to countries with relatively low levels of vulnerability to climate change
Climate change vulnerability
Notes: Size of bubbles represents volume of adaptation-related ODA commitments in 2013. Vulnerability to climate change is defined as a country’s exposure, sensitivity and ability to adapt to the negative impacts of climate change, based on data from ND-GAIN – greater scores mean greater vulnerability.
Sources: Development Initiatives calculations based on OECD DAC, PovcalNet and ND-GAIN.
Source: Latest available government budget documents
Explore further: health spending in Senegal (http://bit.ly/1PjfyHe) or education spending in Uganda (http://bit.ly/1Pjftn1)
Aid is crucial for supporting poverty reduction – strengthening its mandate can make it even more effective

6 INVESTMENTS TO END POVERT Y 2015
Depth of poverty is more severe
Depth of poverty is more severe
0
1,000
2,000
3,000
Few
er d
omes
tic p
ublic
res
ourc
es p
er p
erso
n
4,000
5,000
0
1,000
2,000
3,000
4,000
5,000
0 5 10 15 20 25 30 35 40 45 50
Depth of poverty (%)
Few
er d
omes
tic p
ublic
res
ourc
es p
er p
erso
n
Depth of poverty (%)
0 5 10 15 20 25 30 35 40 45 50
South America
North of Sahara
Middle East
Europe
South & Central Asia
Far East Asia
North & Central America
Sub-Saharan Africa
88% of ODA goes to countries with government revenues less than PPP$1,000 per person
56% of ODA goes to countries with government revenues less than PPP$1,000 per person
Depth of poverty is more severe
Depth of poverty is more severe
0
1,000
2,000
3,000
Few
er d
omes
tic p
ublic
res
ourc
es p
er p
erso
n
4,000
5,000
0
1,000
2,000
3,000
4,000
5,000
0 5 10 15 20 25 30 35 40 45 50
Depth of poverty (%)
Few
er d
omes
tic p
ublic
res
ourc
es p
er p
erso
n
Depth of poverty (%)
0 5 10 15 20 25 30 35 40 45 50
South America
North of Sahara
Middle East
Europe
South & Central Asia
Far East Asia
North & Central America
Sub-Saharan Africa
88% of ODA goes to countries with government revenues less than PPP$1,000 per person
56% of ODA goes to countries with government revenues less than PPP$1,000 per person
FIGURE 9
Donor agencies with different mandates on poverty allocate their ODA very differently
Government revenue (excluding grants) per person, PPP$, 2013
Notes: Size of bubble represents 2013 gross ODA received. Bubbles represent countries receiving ODA; size of bubble represents 2013 gross ODA received. Colours indicate regions.
Sources: Development Initiatives calculations based on OECD DAC, PovcalNet,IMF WEO and data extracted from IMF Article IV publications
Explore further: how do different donors allocate their ODA? (http://devinit.org/staging/wp/#!/post/oda-donor)
ODA allocations from agencies for which poverty reduction is not a specific goal
ODA allocations from agencies with a legal mandate to target poverty reduction
OVERVIEW 7
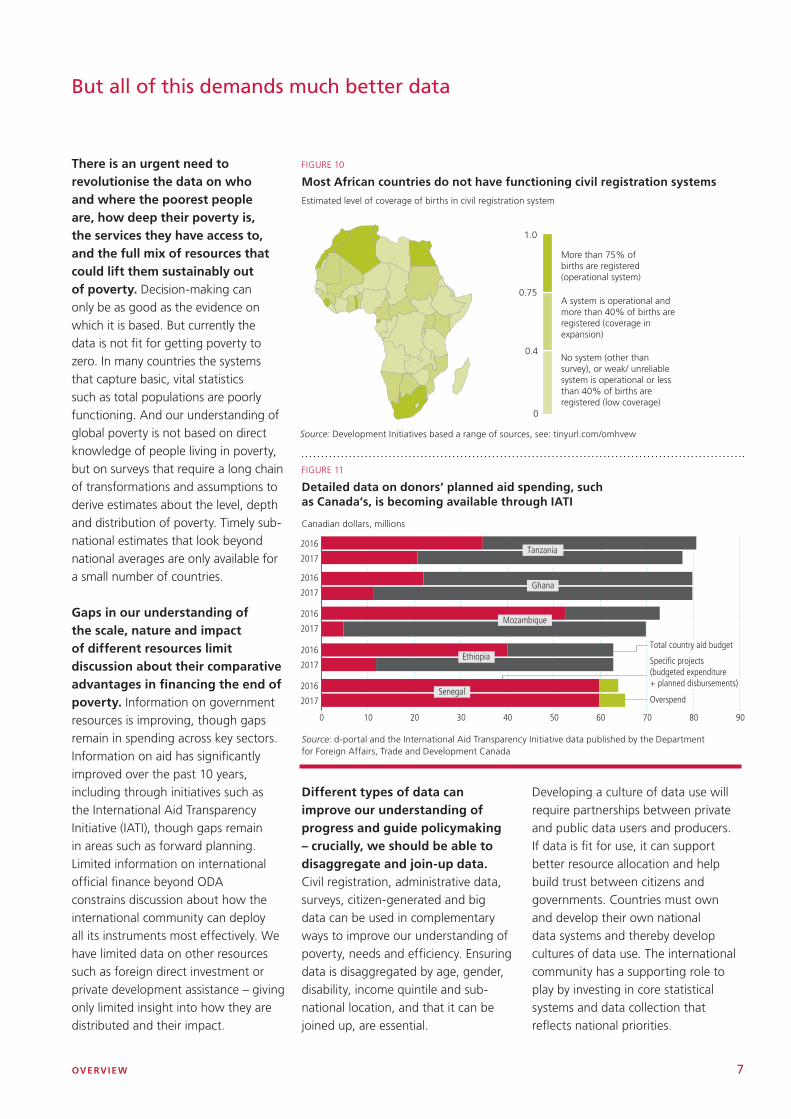
Estimated level of coverage of births in civil registration systems
0.75
1.0
0
0.4
More than 75% of births are registered (operational system)
No system (other than survey), or weak/ unreliable system is operational or less than 40% of births are registered (low coverage)
A system is operational and more than 40% of births are registered (coverage in expansion)
0 10 20 30 40 50 60 70 80 90
2016
2017
2016
2017
2016
2017
2016
2017
2016
2017
Speci�c projects (budgeted expenditure + planned disbursements)
Total country aid budget
Overspend
Tanzania
Ghana
Mozambique
Ethiopia
Senegal
FIGURE 10
Most African countries do not have functioning civil registration systems
Estimated level of coverage of births in civil registration system
Source: Development Initiatives based a range of sources, see: tinyurl.com/omhvew
FIGURE 11
Detailed data on donors’ planned aid spending, such as Canada’s, is becoming available through IATI
Canadian dollars, millions
Source: d-portal and the International Aid Transparency Initiative data published by the Department for Foreign Affairs, Trade and Development Canada
There is an urgent need to revolutionise the data on who and where the poorest people are, how deep their poverty is, the services they have access to, and the full mix of resources that could lift them sustainably out of poverty. Decision-making can only be as good as the evidence on which it is based. But currently the data is not fit for getting poverty to zero. In many countries the systems that capture basic, vital statistics such as total populations are poorly functioning. And our understanding of global poverty is not based on direct knowledge of people living in poverty, but on surveys that require a long chain of transformations and assumptions to derive estimates about the level, depth and distribution of poverty. Timely sub-national estimates that look beyond national averages are only available for a small number of countries.
Gaps in our understanding of the scale, nature and impact of different resources limit discussion about their comparative advantages in financing the end of poverty. Information on government resources is improving, though gaps remain in spending across key sectors. Information on aid has significantly improved over the past 10 years, including through initiatives such as the International Aid Transparency Initiative (IATI), though gaps remain in areas such as forward planning. Limited information on international official finance beyond ODA constrains discussion about how the international community can deploy all its instruments most effectively. We have limited data on other resources such as foreign direct investment or private development assistance – giving only limited insight into how they are distributed and their impact.
But all of this demands much better data
Different types of data can improve our understanding of progress and guide policymaking – crucially, we should be able to disaggregate and join-up data. Civil registration, administrative data, surveys, citizen-generated and big data can be used in complementary ways to improve our understanding of poverty, needs and efficiency. Ensuring data is disaggregated by age, gender, disability, income quintile and sub-national location, and that it can be joined up, are essential.
Developing a culture of data use will require partnerships between private and public data users and producers. If data is fit for use, it can support better resource allocation and help build trust between citizens and governments. Countries must own and develop their own national data systems and thereby develop cultures of data use. The international community has a supporting role to play by investing in core statistical systems and data collection that reflects national priorities.

9
1
T he MDGs were an unprecedented commitment for progress against poverty
and social challenges across the world. The first target, to halve the proportion of people living in extreme poverty, has been instrumental in galvanising effort to reduce poverty, and the target was met ahead of schedule in 2009.
The Sustainable Development Goals (SDGs) build on the MDGs and the first goal – ending poverty in all its forms
everywhere – includes target 1.1 which aims to end extreme, $1.25 a day, poverty by 2030. Achieving this target is by no means the end – to many the idea of an international poverty threshold of $1.25 is far short of what is needed for people to command basic standards of wellbeing – but it would nevertheless be an important and historic step on the path to ending poverty in all its forms everywhere.
However, ending extreme poverty under the SDGs will be more
challenging than halving it was under the MDGs. Many countries must realise a significant change in their current trajectories and overcome challenging contexts of fragility or environmental vulnerability. Even in those countries where progress has been more rapid, it will be important to ensure no one is left behind, requiring focused sub-national efforts. To achieve this we must focus on the poorest people, and this in turn requires significant improvements in disaggregated data, to inform resource allocation decisions.
Ending extreme poverty by 2030• The first Sustainable Development Goal (SDG) goal of ending poverty in all
its forms everywhere, specifically the first target of ending extreme poverty by 2030, will be much more challenging than the previous Millennium Development Goal (MDG) goal of halving poverty.
• Progress has been very uneven to date, with poverty becoming increasingly concentrated in a number of priority countries that now need a significant shift in their current trajectories if they are to end poverty by 2030. Business as usual will not be good enough.
• Many of these countries are politically fragile, environmentally vulnerable, or both; these challenges hold back progress and risk undermining or reversing achievements made. These issues must be addressed to sustainably end poverty
• Ending poverty requires a focus on people as well as countries: on reaching the poorest people wherever they are.
• Furthermore, ending poverty will require the ability to measure the progress of the poorest people against this goal to make sure no one is left behind.
CHAP TER 1 ENDING E X TREME POVERT Y BY 2030 9
10 INVESTMENTS TO END POVERT Y 2015
Ending poverty will be more challenging than halving it
The goal to halve extreme poverty rates was met ahead of target, in 2009
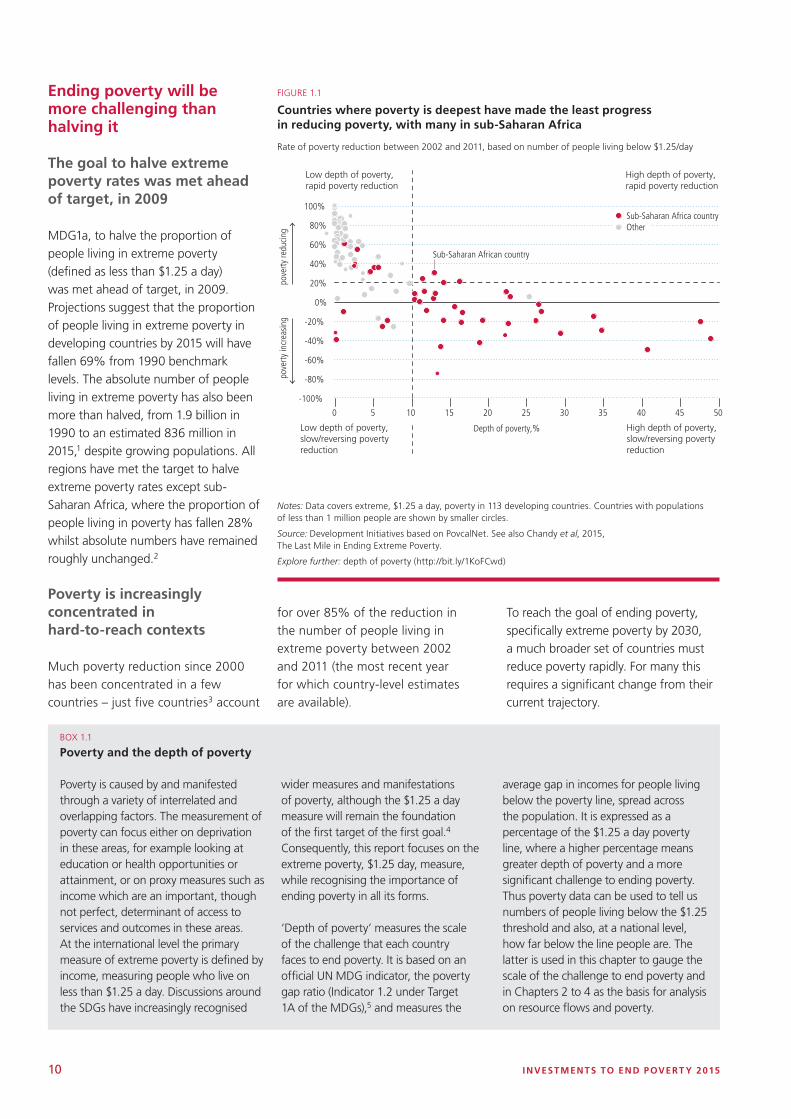
MDG1a, to halve the proportion of people living in extreme poverty (defined as less than $1.25 a day) was met ahead of target, in 2009. Projections suggest that the proportion of people living in extreme poverty in developing countries by 2015 will have fallen 69% from 1990 benchmark levels. The absolute number of people living in extreme poverty has also been more than halved, from 1.9 billion in 1990 to an estimated 836 million in 2015,1 despite growing populations. All regions have met the target to halve extreme poverty rates except sub-Saharan Africa, where the proportion of people living in poverty has fallen 28% whilst absolute numbers have remained roughly unchanged.2
Poverty is increasingly concentrated in hard-to-reach contexts
Much poverty reduction since 2000 has been concentrated in a few countries – just five countries3 account
BOX 1.1
Poverty and the depth of poverty
Poverty is caused by and manifested through a variety of interrelated and overlapping factors. The measurement of poverty can focus either on deprivation in these areas, for example looking at education or health opportunities or attainment, or on proxy measures such as income which are an important, though not perfect, determinant of access to services and outcomes in these areas. At the international level the primary measure of extreme poverty is defined by income, measuring people who live on less than $1.25 a day. Discussions around the SDGs have increasingly recognised
wider measures and manifestations of poverty, although the $1.25 a day measure will remain the foundation of the first target of the first goal.4 Consequently, this report focuses on the extreme poverty, $1.25 day, measure, while recognising the importance of ending poverty in all its forms.
‘Depth of poverty’ measures the scale of the challenge that each country faces to end poverty. It is based on an official UN MDG indicator, the poverty gap ratio (Indicator 1.2 under Target 1A of the MDGs),5 and measures the
average gap in incomes for people living below the poverty line, spread across the population. It is expressed as a percentage of the $1.25 a day poverty line, where a higher percentage means greater depth of poverty and a more significant challenge to ending poverty. Thus poverty data can be used to tell us numbers of people living below the $1.25 threshold and also, at a national level, how far below the line people are. The latter is used in this chapter to gauge the scale of the challenge to end poverty and in Chapters 2 to 4 as the basis for analysis on resource flows and poverty.
-100%
-80%
-60%
-40%
-20%
0%
20%
40%
60%
80%
100%
0 5 10 15 20 25
Depth of poverty,%
30 35 40 45 50
Sub-Saharan African country
pove
rty re
ducin
gpo
verty
incr
easin
g
Low depth of poverty, rapid poverty reduction
High depth of poverty, rapid poverty reduction
Low depth of poverty, slow/reversing poverty reduction
High depth of poverty, slow/reversing poverty reduction
Poverty reduction, based on number of people living belowthe extreme poverty line
OtherSub-Saharan Africa country
FIGURE 1.1
Countries where poverty is deepest have made the least progress in reducing poverty, with many in sub-Saharan Africa
Rate of poverty reduction between 2002 and 2011, based on number of people living below $1.25/day
Notes: Data covers extreme, $1.25 a day, poverty in 113 developing countries. Countries with populations of less than 1 million people are shown by smaller circles.
Source: Development Initiatives based on PovcalNet. See also Chandy et al, 2015, The Last Mile in Ending Extreme Poverty.
Explore further: depth of poverty (http://bit.ly/1KoFCwd)
for over 85% of the reduction in the number of people living in extreme poverty between 2002 and 2011 (the most recent year for which country-level estimates are available).
To reach the goal of ending poverty, specifically extreme poverty by 2030, a much broader set of countries must reduce poverty rapidly. For many this requires a significant change from their current trajectory.
CHAP TER 1 ENDING E X TREME POVERT Y BY 2030 11
More than half of developing countries (70 of 113 countries with data6) reduced the number of people living in extreme poverty by more than 20% between 2002 and 2011 (Figure 1.1). Many of these countries are moving towards ending extreme poverty: in 66 of these 70 countries the depth of poverty is below 10%.7
But in other countries the pace of poverty reduction is slower. In 13 countries the number of people living in extreme poverty fell by less than 20% between 2002 and 2011; in a further 30 the number of people living in extreme poverty actually increased over the period. While some of these countries may have started to reverse this trend8 since 2011 there is, at the very least, a need for many countries to significantly increase the pace of poverty reduction.
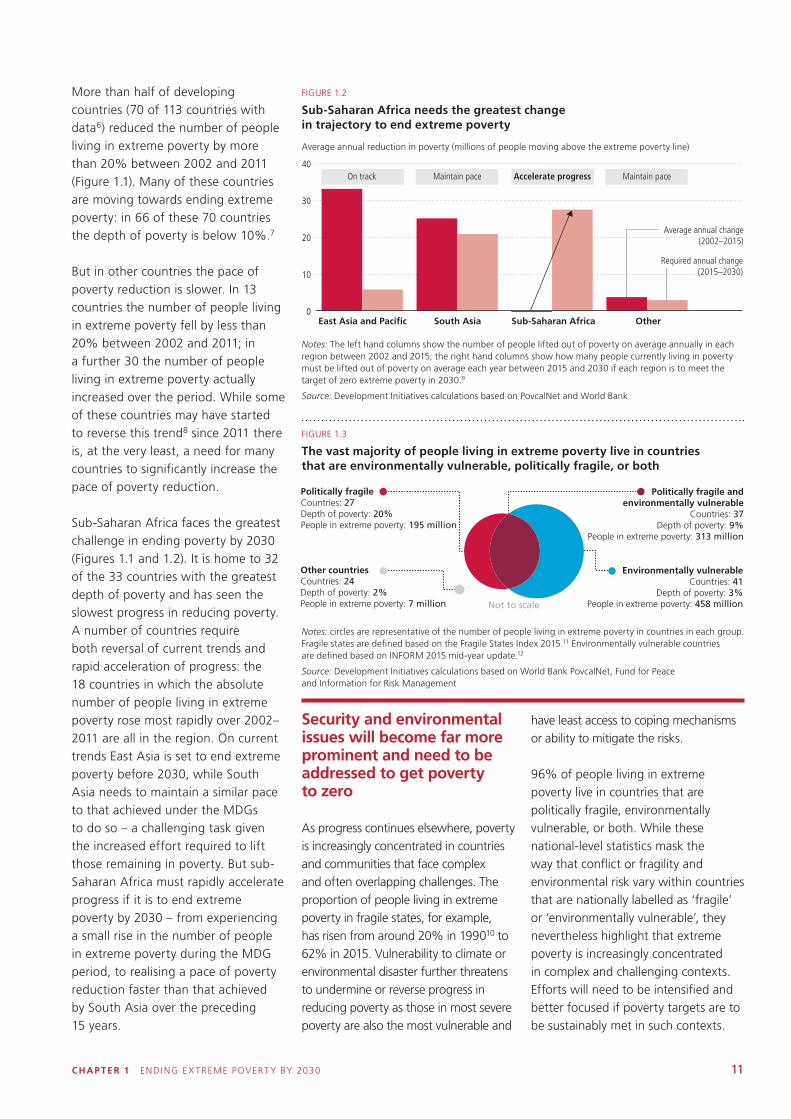
Sub-Saharan Africa faces the greatest challenge in ending poverty by 2030 (Figures 1.1 and 1.2). It is home to 32 of the 33 countries with the greatest depth of poverty and has seen the slowest progress in reducing poverty. A number of countries require both reversal of current trends and rapid acceleration of progress: the 18 countries in which the absolute number of people living in extreme poverty rose most rapidly over 2002–2011 are all in the region. On current trends East Asia is set to end extreme poverty before 2030, while South Asia needs to maintain a similar pace to that achieved under the MDGs to do so – a challenging task given the increased effort required to lift those remaining in poverty. But sub-Saharan Africa must rapidly accelerate progress if it is to end extreme poverty by 2030 – from experiencing a small rise in the number of people in extreme poverty during the MDG period, to realising a pace of poverty reduction faster than that achieved by South Asia over the preceding 15 years.
Security and environmental issues will become far more prominent and need to be addressed to get poverty to zero
As progress continues elsewhere, poverty is increasingly concentrated in countries and communities that face complex and often overlapping challenges. The proportion of people living in extreme poverty in fragile states, for example, has risen from around 20% in 199010 to 62% in 2015. Vulnerability to climate or environmental disaster further threatens to undermine or reverse progress in reducing poverty as those in most severe poverty are also the most vulnerable and
have least access to coping mechanisms or ability to mitigate the risks.
96% of people living in extreme poverty live in countries that are politically fragile, environmentally vulnerable, or both. While these national-level statistics mask the way that conflict or fragility and environmental risk vary within countries that are nationally labelled as ‘fragile’ or ‘environmentally vulnerable’, they nevertheless highlight that extreme poverty is increasingly concentrated in complex and challenging contexts. Efforts will need to be intensified and better focused if poverty targets are to be sustainably met in such contexts.
Politically fragile andenvironmentally vulnerable
Countries: 37Depth of poverty: 9%
People in extreme poverty: 313 million
Other countriesCountries: 24Depth of poverty: 2%People in extreme poverty: 7 million
Environmentally vulnerableCountries: 41
Depth of poverty: 3%People in extreme poverty: 458 millionNot to scale
Politically fragileCountries: 27Depth of poverty: 20%People in extreme poverty: 195 million
FIGURE 1.3
The vast majority of people living in extreme poverty live in countries that are environmentally vulnerable, politically fragile, or both
Notes: circles are representative of the number of people living in extreme poverty in countries in each group. Fragile states are defined based on the Fragile States Index 2015.11 Environmentally vulnerable countries are defined based on INFORM 2015 mid-year update.12
Source: Development Initiatives calculations based on World Bank PovcalNet, Fund for Peace and Information for Risk Management
FIGURE 1.2
Sub-Saharan Africa needs the greatest change in trajectory to end extreme poverty
Average annual reduction in poverty (millions of people moving above the extreme poverty line)
Sub-Saharan Africa needs the biggest change in trajectory
Income per day (2005 PPP$)
On track Maintain pace Maintain paceAccelerate progress
South AsiaEast Asia and Paci�c Sub-Saharan Africa Other
Notes: The left hand columns show the number of people lifted out of poverty on average in each region between2002 and 2015; the right hand columns show how many people currently living in poverty must be lifted out ofpoverty on average each year between 2015 and 2030 if each region is to meet the target of zero extreme poverty in2030.
Source: Development Initiatives calculations based on Povcalnet and World Development Indicators
0
10
20
30
40
Average annual change (2002–2015)
Required annual change (2015–2030)
Notes: The left hand columns show the number of people lifted out of poverty on average annually in each region between 2002 and 2015; the right hand columns show how many people currently living in poverty must be lifted out of poverty on average each year between 2015 and 2030 if each region is to meet the target of zero extreme poverty in 2030.9
Source: Development Initiatives calculations based on PovcalNet and World Bank
12 INVESTMENTS TO END POVERT Y 2015
Ending poverty needs a focus on people as well as countries
MDG1a focused on halving poverty rates – the number of people living in poverty as a percentage of a given population. Ending poverty, on the other hand, requires lifting every person above the poverty line. While some countries need to make progress as a whole (see above), the goal of ending poverty everywhere takes this further, requiring a move beyond national averages to ensure no one is left behind, wherever they are. This demands a clear understanding of who is living in poverty and where. A key step to achieving this goal will be subnational data on people living in poverty.
As global poverty reduction trends mask differences between countries, national trends often mask considerable differences within them. For example, India and Indonesia are two countries on the path to ending extreme poverty: both have achieved healthy economic growth rates (averaging 6.9% and 5.4% a year over 2000–2015 respectively), have reduced national poverty rapidly and are in the ‘low depth, fast poverty reduction’ category shown in Figure 1.1. Both countries, however, still have notable populations living in extreme poverty (estimated at 301 million in India and 39 million in Indonesia in 2011).
The rate at which progress in reducing poverty has been achieved, and the sub-national distribution of that progress differs substantially between these countries (Figure 1.3).
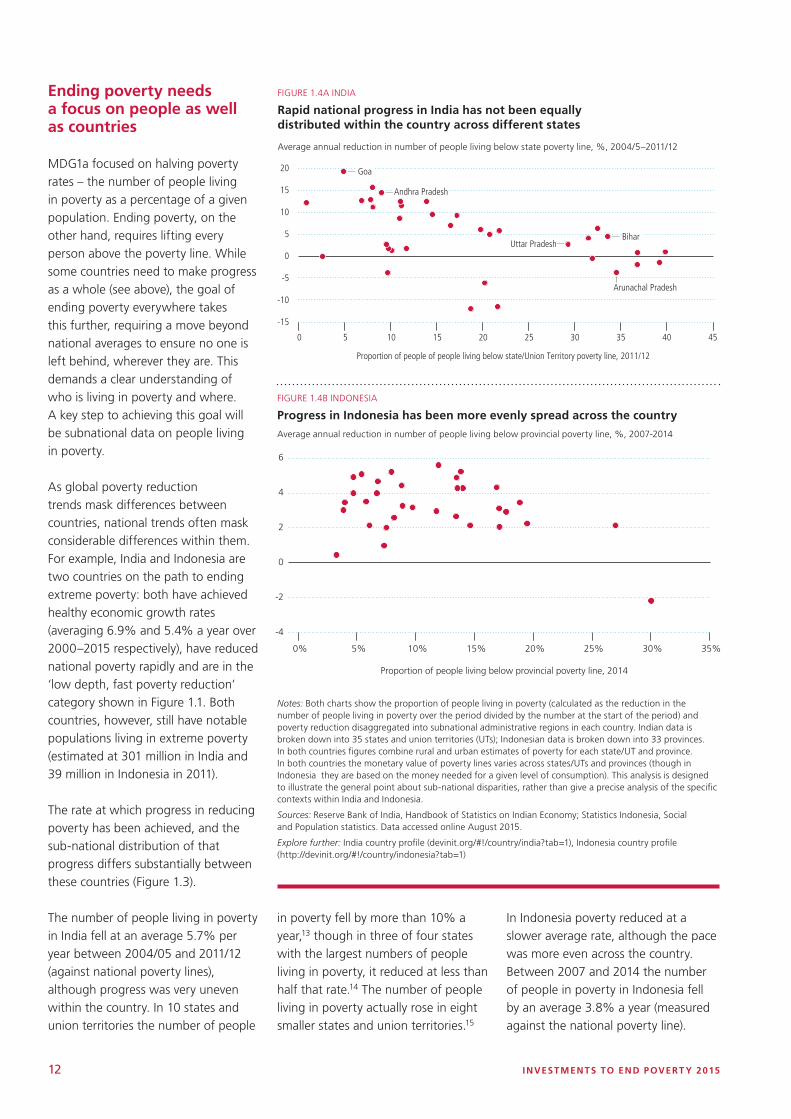
The number of people living in poverty in India fell at an average 5.7% per year between 2004/05 and 2011/12 (against national poverty lines), although progress was very uneven within the country. In 10 states and union territories the number of people
-15
-10
-5
0
5
10
15
20
0% 5% 10% 15% 20% 25% 30% 35% 40% 45%
Proportion of people living below state/UT poverty line, 2011/12
Average annual reduction in number of people living below provincial poverty line, 2004/5−2011/12
-4
-2
0
2
4
6
0% 5% 10% 15% 20% 25% 30% 35%
Proportion of people living below provincial poverty line, 2014
Average annual reduction in number of people living below provincial poverty line, 2007−2014 FIGURE 1.4B INDONESIA
Progress in Indonesia has been more evenly spread across the country
Average annual reduction in number of people living below provincial poverty line, %, 2007-2014
Notes: Both charts show the proportion of people living in poverty (calculated as the reduction in the number of people living in poverty over the period divided by the number at the start of the period) and poverty reduction disaggregated into subnational administrative regions in each country. Indian data is broken down into 35 states and union territories (UTs); Indonesian data is broken down into 33 provinces. In both countries figures combine rural and urban estimates of poverty for each state/UT and province. In both countries the monetary value of poverty lines varies across states/UTs and provinces (though in Indonesia they are based on the money needed for a given level of consumption). This analysis is designed to illustrate the general point about sub-national disparities, rather than give a precise analysis of the specific contexts within India and Indonesia.
Sources: Reserve Bank of India, Handbook of Statistics on Indian Economy; Statistics Indonesia, Social and Population statistics. Data accessed online August 2015.
Explore further: India country profile (devinit.org/#!/country/india?tab=1), Indonesia country profile (http://devinit.org/#!/country/indonesia?tab=1)
in poverty fell by more than 10% a year,13 though in three of four states with the largest numbers of people living in poverty, it reduced at less than half that rate.14 The number of people living in poverty actually rose in eight smaller states and union territories.15
In Indonesia poverty reduced at a slower average rate, although the pace was more even across the country. Between 2007 and 2014 the number of people in poverty in Indonesia fell by an average 3.8% a year (measured against the national poverty line).
-15
-10
-5
0
5
10
15
20
0 5 10 15 20 25 30 35 40 45
Proportion of people of people living below state/Union Territory poverty line, 2011/12
Uttar Pradesh
Arunachal Pradesh
Average annual reduction in number of people living below provincial poverty line, 2004/5−2011/12
Andhra Pradesh
Goa
Bihar
FIGURE 1.4A INDIA
Rapid national progress in India has not been equally distributed within the country across different states
Average annual reduction in number of people living below state poverty line, %, 2004/5–2011/12
CHAP TER 1 ENDING E X TREME POVERT Y BY 2030 13
Poverty fell between 2% and 5.6% in all except four provinces and the number of people living in poverty only increased in one province.16
Understanding trends within countries is essential for achieving the goal of ending poverty and leaving no one behind. Sub-national data will be vital for focusing efforts to tackle the specific drivers of poverty in different regions, and to inform policy on the effectiveness of different instruments for groups of people in different contexts within countries.
To end poverty everywhere means we must focus on people and measure their progress against the goal of ending poverty.
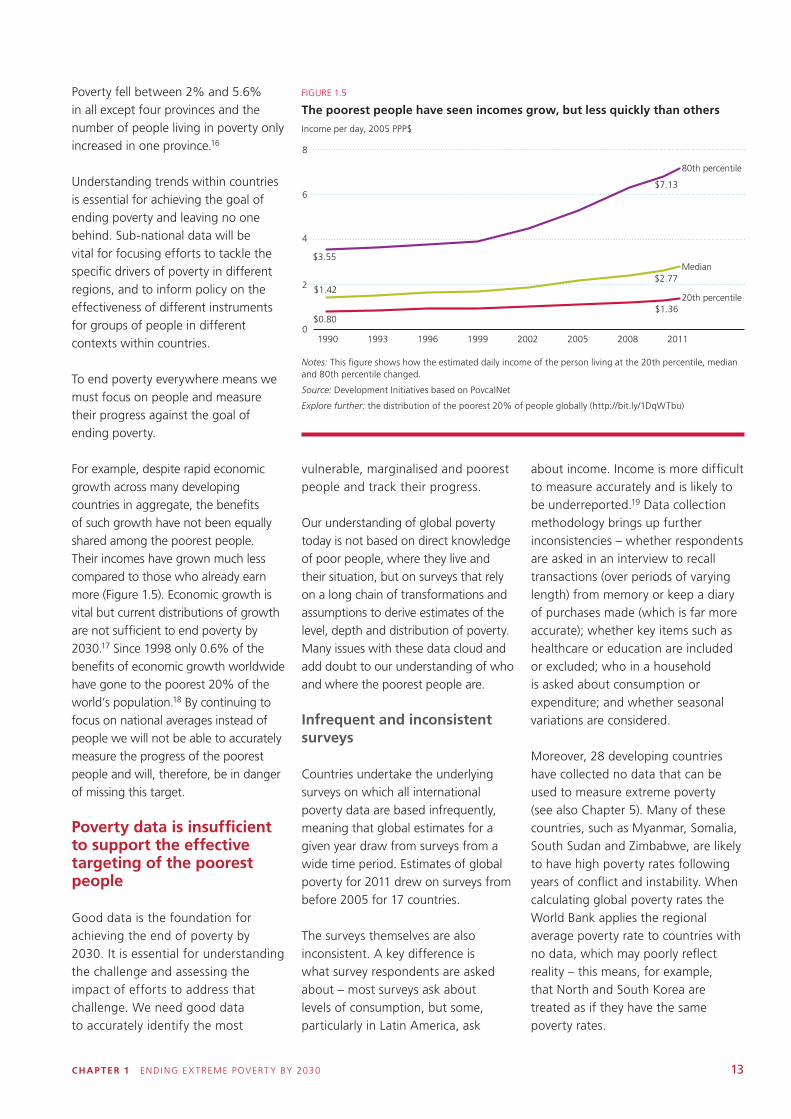
For example, despite rapid economic growth across many developing countries in aggregate, the benefits of such growth have not been equally shared among the poorest people. Their incomes have grown much less compared to those who already earn more (Figure 1.5). Economic growth is vital but current distributions of growth are not sufficient to end poverty by 2030.17 Since 1998 only 0.6% of the benefits of economic growth worldwide have gone to the poorest 20% of the world’s population.18 By continuing to focus on national averages instead of people we will not be able to accurately measure the progress of the poorest people and will, therefore, be in danger of missing this target.
Poverty data is insufficient to support the effective targeting of the poorest people
Good data is the foundation for achieving the end of poverty by 2030. It is essential for understanding the challenge and assessing the impact of efforts to address that challenge. We need good data to accurately identify the most
20th percentile
Median
80th percentile
$2.77$1.42
$3.55
$7.13
$0.80$1.36
Income per day (2005 PPP$)
1990 1993 1996 1999 2002 2005 2008 2011
Source: Development Initiatives based on Povcalnet
Notes: This �gure shows how the estimated daily income of the person living at the 20th percentile, median and 80th percentile changed.
The poorest people have seen incomes grow, but less quickly than others
0
2
4
6
8
FIGURE 1.5
The poorest people have seen incomes grow, but less quickly than others
Income per day, 2005 PPP$
Notes: This figure shows how the estimated daily income of the person living at the 20th percentile, median and 80th percentile changed.
Source: Development Initiatives based on PovcalNet
Explore further: the distribution of the poorest 20% of people globally (http://bit.ly/1DqWTbu)
vulnerable, marginalised and poorest people and track their progress.
Our understanding of global poverty today is not based on direct knowledge of poor people, where they live and their situation, but on surveys that rely on a long chain of transformations and assumptions to derive estimates of the level, depth and distribution of poverty. Many issues with these data cloud and add doubt to our understanding of who and where the poorest people are.
Infrequent and inconsistent surveys
Countries undertake the underlying surveys on which all international poverty data are based infrequently, meaning that global estimates for a given year draw from surveys from a wide time period. Estimates of global poverty for 2011 drew on surveys from before 2005 for 17 countries.
The surveys themselves are also inconsistent. A key difference is what survey respondents are asked about – most surveys ask about levels of consumption, but some, particularly in Latin America, ask
about income. Income is more difficult to measure accurately and is likely to be underreported.19 Data collection methodology brings up further inconsistencies – whether respondents are asked in an interview to recall transactions (over periods of varying length) from memory or keep a diary of purchases made (which is far more accurate); whether key items such as healthcare or education are included or excluded; who in a household is asked about consumption or expenditure; and whether seasonal variations are considered.
Moreover, 28 developing countries have collected no data that can be used to measure extreme poverty (see also Chapter 5). Many of these countries, such as Myanmar, Somalia, South Sudan and Zimbabwe, are likely to have high poverty rates following years of conflict and instability. When calculating global poverty rates the World Bank applies the regional average poverty rate to countries with no data, which may poorly reflect reality – this means, for example, that North and South Korea are treated as if they have the same poverty rates.
14 INVESTMENTS TO END POVERT Y 2015
Adjusting for different prices
To compare poverty data across countries, prices must be converted into a common price basis known as purchasing power parity (PPP) prices. PPPs are constructed by comparing the cost of a common basket of goods in different countries, but a central challenge is that consumption patterns vary widely and few items are consumed everywhere. Approaches for dealing with these challenges have become more sophisticated over time, having a major impact on our understanding of poverty – previous revisions of PPPs have caused significant shifts in the estimated number and distribution of people living in extreme poverty. At the start of the SDG era, another change is coming: PPPs for 2011 were published in 2014 and the World Bank has launched a commission to advise on the best approach for applying these to poverty data.20
Modelling
Different models are used to estimate poverty in different countries. The World Bank is responsible for producing global estimates of poverty and uses econometric models to turn surveys with such issues and gaps into estimates that can be compared across countries.
Understanding how consumption is distributed in each country is a fundamental building block of estimating poverty levels – yet the models used to estimate consumption distribution differ from country to country. Most construct parametric models, though some use a larger array of micro-level data.21
When survey data is out of date, further modelling is used and proxy measures are applied to infer likely trends since the last survey was conducted. For most countries the proxy measures estimate total household consumption growth. But in sub-Saharan Africa gross domestic
product (GDP) per capita trends are used instead (GDP per capita is known to be a less accurate indicator of consumption trends for the poorest people). These models also assume that growth since the last survey is ‘distribution-neutral’ – that the underlying consumption distribution is unchanged.
Timeliness
Effective interventions rely on timely, up-to-date information, yet estimates of poverty are out of date. Until recently estimates of global poverty were available only with a considerable timelag. The World Bank has committed to and now started publishing annual estimates of global and regional poverty levels – a big step forward: for the first time we have official estimates for current poverty rates worldwide. But country-level data is still untimely – the most recent estimates available as the SDGs are agreed in September 2015 are for 2011. Each problem, assumption or calculation needed to develop poverty estimates increases the margin of error and reduces the accuracy of poverty data. This in turn reduces the efficiency with which efforts to reduce poverty can be targeted across and within countries. We must improve the comprehensiveness, timeliness, accuracy and disaggregation of the underlying data if we are to achieve the end of poverty in the SDG era (see Chapter 5). The goal to end poverty in all its forms everywhere and the specific target to end extreme poverty by 2030 is a serious challenge which will not be met if the world continues to rely on the practices of the last 15 years. Achieving this goal will require a significant change in trajectory for many of the poorest countries, as well as overcoming challenging contexts of conflict, fragility and environmental vulnerability. It also requires a focus on the poorest people. While measures of national progress were sufficient for the goal of halving poverty rates, ending poverty means leaving no one behind,
Summary
The goal to end poverty in all its forms everywhere and the specific target to end income poverty by 2030 is a serious challenge. Achieving it will require a significant change in approach. A new trajectory for poverty reduction must be established for many of the poorest countries; challenging contexts of conflict, fragility and environmental vulnerability must be overcome. This requires a focus on the poorest people. While measures of national progress were sufficient for the goal of halving poverty rates, ending poverty means leaving no one behind, and this demands much better disaggregated sub-national data to allow for targeted investments which can distribute the benefits of economic growth to the poorest people. Targeted investments require mobilising resources from across the public, commercial and private spheres and using them according to their comparative strengths to offer greater access to the benefits of growth, improved access to services, and strengthened resilience for the world’s poorest people.
and this demands much better data. Such acceleration of progress requires targeted investments. Economic growth is vital, but the current distribution of the benefits of growth is not reaching the poorest sufficiently to end extreme poverty by 2030. Targeted investments require resources to be mobilised from across the public, commercial and private spheres to contribute according to their comparative strengths to offer greater opportunity and access the benefits of growth, improved access to services, and strengthened resilience for the world’s poorest people.
CHAP TER 2 THE MIX OF ALL RESOURCES 15
2
The mix of all resources• Actors across the official, commercial and private spheres perform
different functions and invest resources for different reasons. All can contribute to the goal of ending poverty, though they impact people in poverty in different ways to different degrees and over different timelines.
• To end poverty by 2030, we must create an environment at global, national and local levels that leverages the comparative advantage of each investment and resource.
• Official resources at the domestic and international level are particularly important because they can be targeted directly towards the investments needed to reduce poverty.
• Unfortunately there are least domestic resources in the countries where the challenge of ending poverty is greatest.
• Therefore, development assistance will remain critical for countries with the greatest depth of poverty and the least domestic public resources.
• International commercial and private resource flows to developing countries are growing rapidly, but remain primarily concentrated in a few larger emerging markets.
• Data on resource flows – particularly disaggregated data that describes context below the national level – must improve if we are to understand how different resources can be used to benefit people in poverty.
A chieving the end of extreme poverty by 2030 requires a diverse mix of
resources that offer the world’s poorest people improved access to services, greater economic opportunity and strengthened resilience against shocks.
Actors from all sectors – public and private, domestic and international – have a role to play in ensuring the end
of poverty, though they bring different strengths and comparative advantages. Different resources are driven by incentives and perform functions that vary widely in different contexts. Their impact on people in poverty also varies, with each resource impacting over a wide-ranging timeline through diverse mechanisms.
Ending extreme poverty by 2030 requires a political environment at
national and international levels that can leverage the strengths of different resources and ensure that the people in the deepest poverty also benefit from an appropriate mix of investments. To understand these comparative strengths and the role each resource can play, we must first understand the resource landscape – what resources are available, why they move in and out of countries and communities, and how they impact on people in poverty.
CHAP TER 2 THE MIX OF ALL RESOURCES 15
16 INVESTMENTS TO END POVERT Y 2015
The scale of resources available
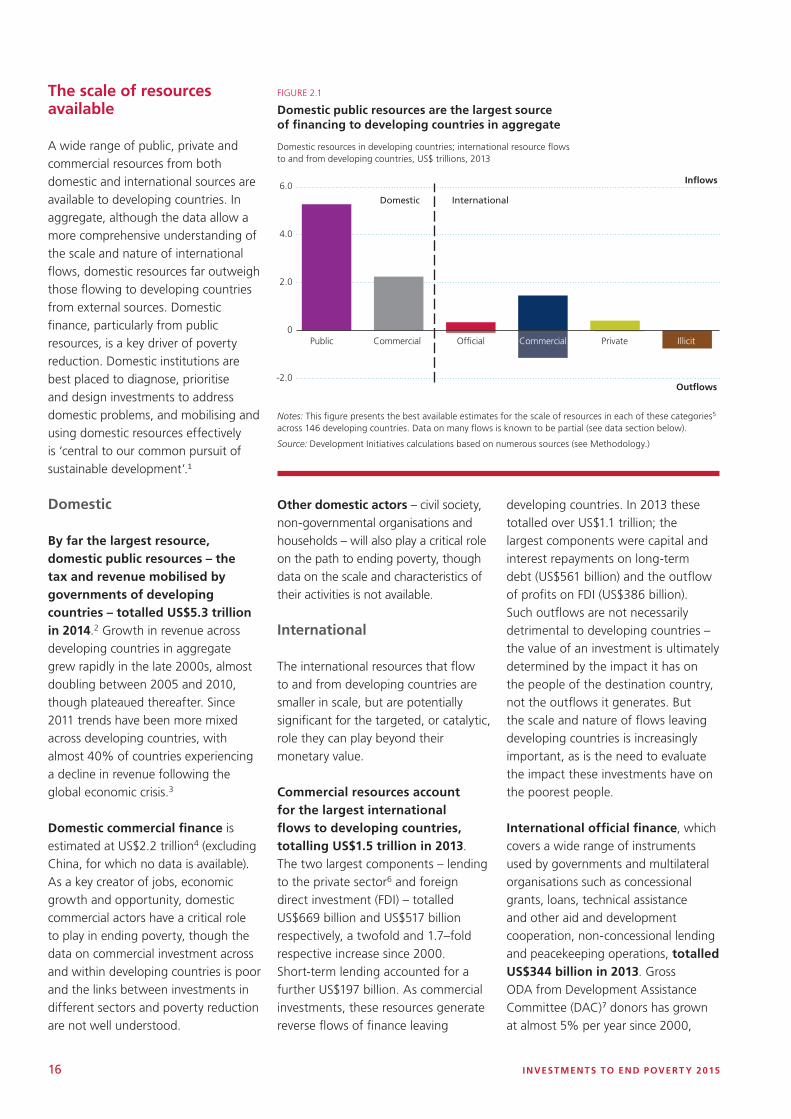
A wide range of public, private and commercial resources from both domestic and international sources are available to developing countries. In aggregate, although the data allow a more comprehensive understanding of the scale and nature of international flows, domestic resources far outweigh those flowing to developing countries from external sources. Domestic finance, particularly from public resources, is a key driver of poverty reduction. Domestic institutions are best placed to diagnose, prioritise and design investments to address domestic problems, and mobilising and using domestic resources effectively is ‘central to our common pursuit of sustainable development’.1
Domestic
By far the largest resource, domestic public resources – the tax and revenue mobilised by governments of developing countries – totalled US$5.3 trillion in 2014.2 Growth in revenue across developing countries in aggregate grew rapidly in the late 2000s, almost doubling between 2005 and 2010, though plateaued thereafter. Since 2011 trends have been more mixed across developing countries, with almost 40% of countries experiencing a decline in revenue following the global economic crisis.3
Domestic commercial finance is estimated at US$2.2 trillion4 (excluding China, for which no data is available). As a key creator of jobs, economic growth and opportunity, domestic commercial actors have a critical role to play in ending poverty, though the data on commercial investment across and within developing countries is poor and the links between investments in different sectors and poverty reduction are not well understood.
0
Illicit
Domestic International
In�ows
Out�ows-2.0
2.0
4.0
6.0
Public Commercial Of�cial Commercial Private Illicit
FIGURE 2.1
Domestic public resources are the largest source of financing to developing countries in aggregate
Domestic resources in developing countries; international resource flows to and from developing countries, US$ trillions, 2013
Notes: This figure presents the best available estimates for the scale of resources in each of these categories5 across 146 developing countries. Data on many flows is known to be partial (see data section below).
Source: Development Initiatives calculations based on numerous sources (see Methodology.)
Other domestic actors – civil society, non-governmental organisations and households – will also play a critical role on the path to ending poverty, though data on the scale and characteristics of their activities is not available.
International
The international resources that flow to and from developing countries are smaller in scale, but are potentially significant for the targeted, or catalytic, role they can play beyond their monetary value.
Commercial resources account for the largest international flows to developing countries, totalling US$1.5 trillion in 2013. The two largest components – lending to the private sector6 and foreign direct investment (FDI) – totalled US$669 billion and US$517 billion respectively, a twofold and 1.7–fold respective increase since 2000. Short-term lending accounted for a further US$197 billion. As commercial investments, these resources generate reverse flows of finance leaving
developing countries. In 2013 these totalled over US$1.1 trillion; the largest components were capital and interest repayments on long-term debt (US$561 billion) and the outflow of profits on FDI (US$386 billion). Such outflows are not necessarily detrimental to developing countries – the value of an investment is ultimately determined by the impact it has on the people of the destination country, not the outflows it generates. But the scale and nature of flows leaving developing countries is increasingly important, as is the need to evaluate the impact these investments have on the poorest people.
International official finance, which covers a wide range of instruments used by governments and multilateral organisations such as concessional grants, loans, technical assistance and other aid and development cooperation, non-concessional lending and peacekeeping operations, totalled US$344 billion in 2013. Gross ODA from Development Assistance Committee (DAC)7 donors has grown at almost 5% per year since 2000,
CHAP TER 2 THE MIX OF ALL RESOURCES 17
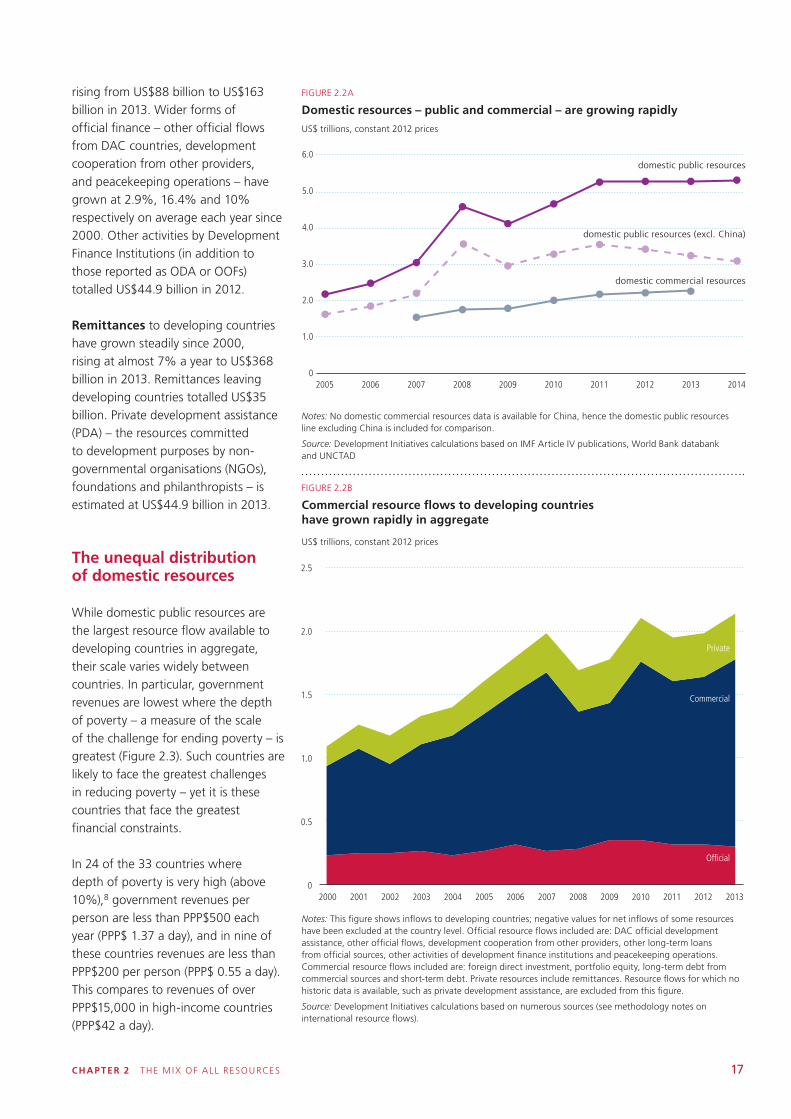
rising from US$88 billion to US$163 billion in 2013. Wider forms of official finance – other official flows from DAC countries, development cooperation from other providers, and peacekeeping operations – have grown at 2.9%, 16.4% and 10% respectively on average each year since 2000. Other activities by Development Finance Institutions (in addition to those reported as ODA or OOFs) totalled US$44.9 billion in 2012.
Remittances to developing countries have grown steadily since 2000, rising at almost 7% a year to US$368 billion in 2013. Remittances leaving developing countries totalled US$35 billion. Private development assistance (PDA) – the resources committed to development purposes by non-governmental organisations (NGOs), foundations and philanthropists – is estimated at US$44.9 billion in 2013.
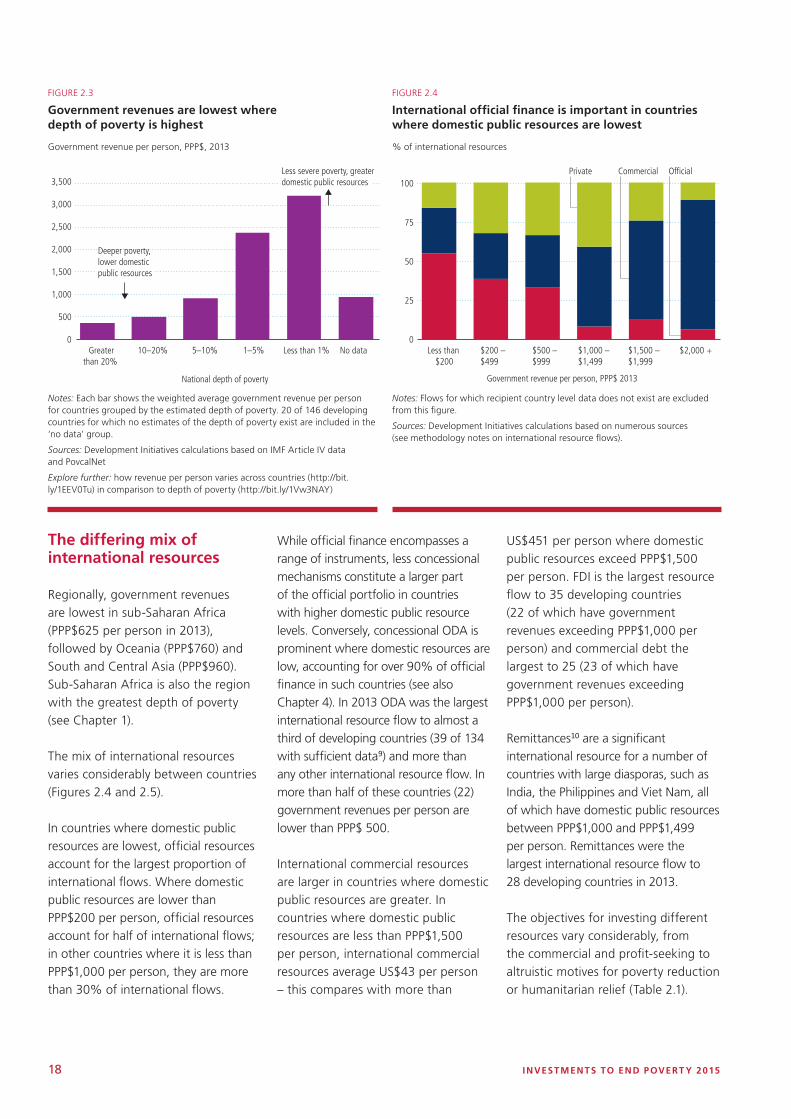
The unequal distribution of domestic resources
While domestic public resources are the largest resource flow available to developing countries in aggregate, their scale varies widely between countries. In particular, government revenues are lowest where the depth of poverty – a measure of the scale of the challenge for ending poverty – is greatest (Figure 2.3). Such countries are likely to face the greatest challenges in reducing poverty – yet it is these countries that face the greatest financial constraints.
In 24 of the 33 countries where depth of poverty is very high (above 10%),8 government revenues per person are less than PPP$500 each year (PPP$ 1.37 a day), and in nine of these countries revenues are less than PPP$200 per person (PPP$ 0.55 a day). This compares to revenues of over PPP$15,000 in high-income countries (PPP$42 a day).
FIGURE 2.2A
Domestic resources – public and commercial – are growing rapidly
US$ trillions, constant 2012 prices
1.0
0
2.0
3.0
4.0
5.0
6.0
2005 2006 2007 2008 2009 2010 2011 2012 2013 2014
2012 constant US$ trillions
domestic public resources
domestic commercial resources
domestic public resources (excl. China)
0.5
0
1.0
1.5
2.0
2.5
2000 2001 2002 2003 2004 2005 2006 2007 2008 2009 2010 2011 2012 2013
Private
Commercial
Of�cial
FIGURE 2.2B
Commercial resource flows to developing countries have grown rapidly in aggregate
US$ trillions, constant 2012 prices
Notes: No domestic commercial resources data is available for China, hence the domestic public resources line excluding China is included for comparison.
Source: Development Initiatives calculations based on IMF Article IV publications, World Bank databank and UNCTAD
Notes: This figure shows inflows to developing countries; negative values for net inflows of some resources have been excluded at the country level. Official resource flows included are: DAC official development assistance, other official flows, development cooperation from other providers, other long-term loans from official sources, other activities of development finance institutions and peacekeeping operations. Commercial resource flows included are: foreign direct investment, portfolio equity, long-term debt from commercial sources and short-term debt. Private resources include remittances. Resource flows for which no historic data is available, such as private development assistance, are excluded from this figure.
Source: Development Initiatives calculations based on numerous sources (see methodology notes on international resource flows).
18 INVESTMENTS TO END POVERT Y 2015
FIGURE 2.3
Government revenues are lowest where depth of poverty is highest
Government revenue per person, PPP$, 2013
Notes: Each bar shows the weighted average government revenue per person for countries grouped by the estimated depth of poverty. 20 of 146 developing countries for which no estimates of the depth of poverty exist are included in the ‘no data’ group.
Sources: Development Initiatives calculations based on IMF Article IV data and PovcalNet
Explore further: how revenue per person varies across countries (http://bit.ly/1EEV0Tu) in comparison to depth of poverty (http://bit.ly/1Vw3NAY)
500
0
1,000
1,500
2,000
2,500
3,000
3,500
Greaterthan 20%
10–20% 5–10% 1–5% Less than 1% No data Less than $200
$200 –$499
$500 – $999
$1,000 –$1,499
$1,500 – $1,999
$2,000 +
Government revenue per person, PPP$ 2013
Private Commercial Of�cial
National depth of poverty
Deeper poverty, lower domestic public resources
Less severe poverty, greater domestic public resources
0
25
50
75
100
Greater than 20%
10-20% 5-10% 1-5% Less than 1%
No data
Depth of poverty
The differing mix of international resources
Regionally, government revenues are lowest in sub-Saharan Africa (PPP$625 per person in 2013), followed by Oceania (PPP$760) and South and Central Asia (PPP$960). Sub-Saharan Africa is also the region with the greatest depth of poverty (see Chapter 1).
The mix of international resources varies considerably between countries (Figures 2.4 and 2.5).
In countries where domestic public resources are lowest, official resources account for the largest proportion of international flows. Where domestic public resources are lower than PPP$200 per person, official resources account for half of international flows; in other countries where it is less than PPP$1,000 per person, they are more than 30% of international flows.
While official finance encompasses a range of instruments, less concessional mechanisms constitute a larger part of the official portfolio in countries with higher domestic public resource levels. Conversely, concessional ODA is prominent where domestic resources are low, accounting for over 90% of official finance in such countries (see also Chapter 4). In 2013 ODA was the largest international resource flow to almost a third of developing countries (39 of 134 with sufficient data9) and more than any other international resource flow. In more than half of these countries (22) government revenues per person are lower than PPP$ 500.
International commercial resources are larger in countries where domestic public resources are greater. In countries where domestic public resources are less than PPP$1,500 per person, international commercial resources average US$43 per person – this compares with more than
US$451 per person where domestic public resources exceed PPP$1,500 per person. FDI is the largest resource flow to 35 developing countries (22 of which have government revenues exceeding PPP$1,000 per person) and commercial debt the largest to 25 (23 of which have government revenues exceeding PPP$1,000 per person).
Remittances10 are a significant international resource for a number of countries with large diasporas, such as India, the Philippines and Viet Nam, all of which have domestic public resources between PPP$1,000 and PPP$1,499 per person. Remittances were the largest international resource flow to 28 developing countries in 2013.
The objectives for investing different resources vary considerably, from the commercial and profit-seeking to altruistic motives for poverty reduction or humanitarian relief (Table 2.1).
FIGURE 2.4
International official finance is important in countries where domestic public resources are lowest
% of international resources
Notes: Flows for which recipient country level data does not exist are excluded from this figure.
Sources: Development Initiatives calculations based on numerous sources (see methodology notes on international resource flows).

ODA is the largest international resource �ow to 40 developing countries
This map shows the largest international resource �ow for each developing country in 2013.Source: Development Initiatives calculations based on numerous sources (see methodology notes on international resource �ows)Get the data
ODAOOFsFDILong-term debt (commercial)Long-term debt (of�cial)Short-term debtRemittancesNot enough data
CHAP TER 2 THE MIX OF ALL RESOURCES 19
Type of flow Resource Objective Channels to impact the poorest people
Official
ODA (DAC providers) Welfare and development
Poverty reduction
Mutual interest
Numerous, including: improved service provision; strengthened public sector;
support to economic sectors; humanitarian response to crises
Other providers of development cooperation
Development and poverty reduction
Mutual interest
Numerous, including: improved service provision; economic development
Other official flows Economic development
Mutual interest
Finance for private sector development; indirect job creation
Other official debt Economic development
Strategic interests
Indirect job creation
Peacekeeping Peace and security Enhanced security
Military and security Peace and security Enhanced security; indirect job creation, economic development
Commercial
Foreign direct investment Return on investment Job creation; payment of taxes; multiplier effects within local economy
Portfolio equity Return on investment Indirect economic development; job creation
Commercial debt Commercial returns Finance for private sector development; indirect job creation
Private
Private development assistance
Poverty reduction
Humanitarian
Solidarity
Numerous, including: improved access to basic services; humanitarian response to crises
Remittances Support for family and friends
Small-scale private investment
Increased household income for recipients; investments in human capital and enterprise; safety net in times of crisis
FIGURE 2.5
ODA is the largest international resource flow to 39 developing countries
Developing countries coloured by the largest international resource flow, 2013
Notes: ODA is the largest international resource flow for a number of smaller countries, including a number of Pacific Islands, which appear small on this world map.
Source: Development Initiatives calculations based on numerous sources (see methodology notes on international resource flows).
Explore further: the largest international resource for each developing country (http://bit.ly/1TWecDc) and how this has changed since 2000 (http://bit.ly/1Vw40nQ)
TABLE 2.1
Different resources have different comparative advantages for ending poverty
20 INVESTMENTS TO END POVERT Y 2015
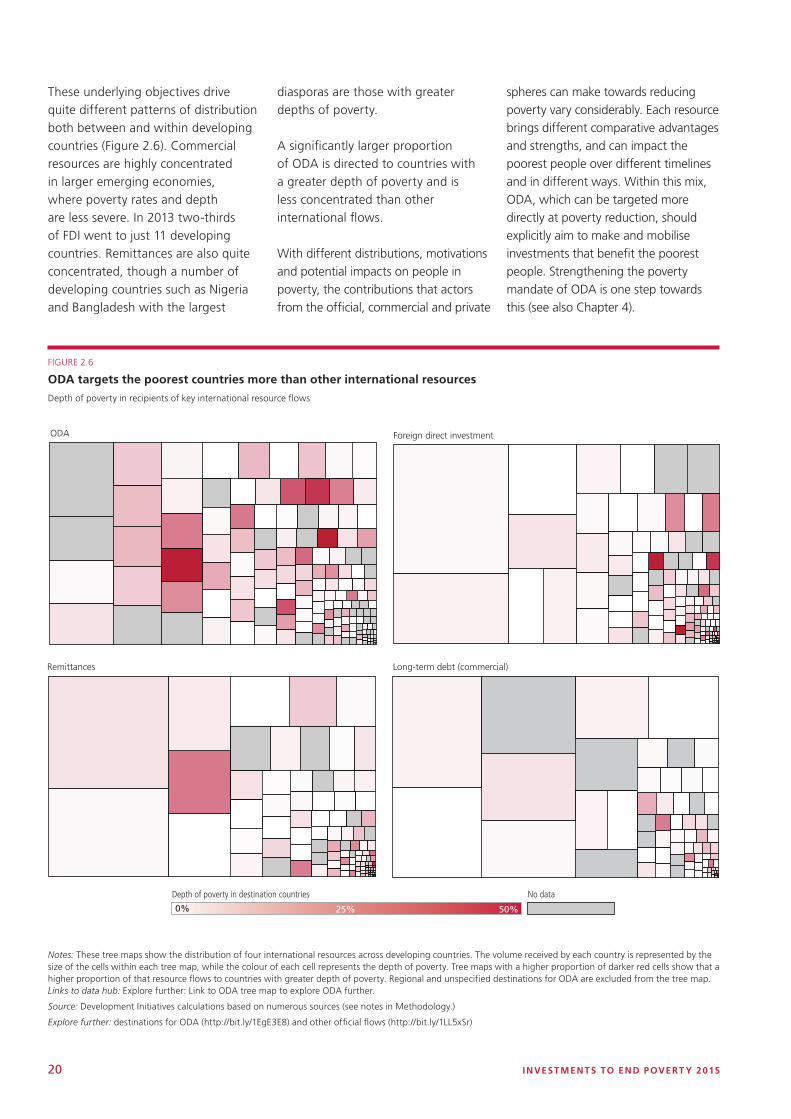
These underlying objectives drive quite different patterns of distribution both between and within developing countries (Figure 2.6). Commercial resources are highly concentrated in larger emerging economies, where poverty rates and depth are less severe. In 2013 two-thirds of FDI went to just 11 developing countries. Remittances are also quite concentrated, though a number of developing countries such as Nigeria and Bangladesh with the largest
diasporas are those with greater depths of poverty.
A significantly larger proportion of ODA is directed to countries with a greater depth of poverty and is less concentrated than other international flows.
With different distributions, motivations and potential impacts on people in poverty, the contributions that actors from the official, commercial and private
spheres can make towards reducing poverty vary considerably. Each resource brings different comparative advantages and strengths, and can impact the poorest people over different timelines and in different ways. Within this mix, ODA, which can be targeted more directly at poverty reduction, should explicitly aim to make and mobilise investments that benefit the poorest people. Strengthening the poverty mandate of ODA is one step towards this (see also Chapter 4).
Foreign direct investmentODA
Remittances Long-term debt (commercial)
50%25%
Depth of poverty in destination countries No data
0%
FIGURE 2.6
ODA targets the poorest countries more than other international resources
Depth of poverty in recipients of key international resource flows
Notes: These tree maps show the distribution of four international resources across developing countries. The volume received by each country is represented by the size of the cells within each tree map, while the colour of each cell represents the depth of poverty. Tree maps with a higher proportion of darker red cells show that a higher proportion of that resource flows to countries with greater depth of poverty. Regional and unspecified destinations for ODA are excluded from the tree map.Links to data hub: Explore further: Link to ODA tree map to explore ODA further.
Source: Development Initiatives calculations based on numerous sources (see notes in Methodology.)
Explore further: destinations for ODA (http://bit.ly/1EgE3E8) and other official flows (http://bit.ly/1LL5xSr)
CHAP TER 2 THE MIX OF ALL RESOURCES 21
Data poverty
There are some significant gaps in our understanding of the resource landscape, both what is available to whom and the roles each can play in reducing poverty. At the domestic level, there is little internationally comparable data that captures the activities of domestic actors beyond the public sector. And while data on the way governments mobilise and use resources is improving, there are still significant gaps in tracking public resources in key sectors for poverty reduction (see Chapter 3).
At the international level the focus on aid effectiveness and transparency over the last decade has driven significant improvements in ODA data, though there is still some way to go: for example much data on ODA remains untimely and difficult to use for forward planning. But wider forms of official finance are less visible, and without comprehensive information that describes the scale, characteristics and uses of these instruments it is difficult to have informed discussions about the role that different types of official finance should play in efforts to end poverty.
Many private development assistance actors – NGOs, civil society organisations, philanthropists and foundations – do publish information on their activities. Yet this information is disparate, often published only in each organisation’s own annual report.
Until this is standardised we can have little understanding of what private development assistance actors are doing in aggregate, limiting discussion on the role they can play in the SDG era.
The basic characteristics of international commercial activity are often recorded by governments or central banks, so estimates on the scale of investment are reasonably accurate. But many important details, such as the sectors in which investments are being made or the mechanisms through which they are financed, are rarely captured.11 This
makes it difficult to assess which aspects of it the SDG agenda the international commercial sector is best placed to contribute to in different contexts.
Beyond these constraints of the existing data, one of the biggest challenges will be to develop disaggregated data that can accurately inform and guide policymakers as they aim to secure investments that benefit people in poverty. Understanding the mix of resources available to people within countries will be essential for effectively targeting investments.
Summary
All investments can contribute to the goal of ending extreme poverty by 2030, though the nature of these contributions will vary given their different objectives and the different mechanisms through which each resource can impact people in poverty. Creating an environment at the global, national and local levels that leverages the comparative advantage of each resource will be vital to the progress of the world’s poorest people.
Official finance at the domestic and international level has a critical role to play as it has a mandate to meet people’s needs and consequently can be targeted more directly
towards the investments needed to reduce poverty.
Domestic public resources will be central to implementing the SDG agenda, though resources remain constrained in many countries where the depth of poverty is greatest. In these places international official finance will play a key role in efforts to end poverty. Using ODA effectively is particularly important as it remains a vital resource in the countries and communities that face the biggest challenges in meeting the goal of ending poverty, and which have the least access to domestic resources to address those challenges.
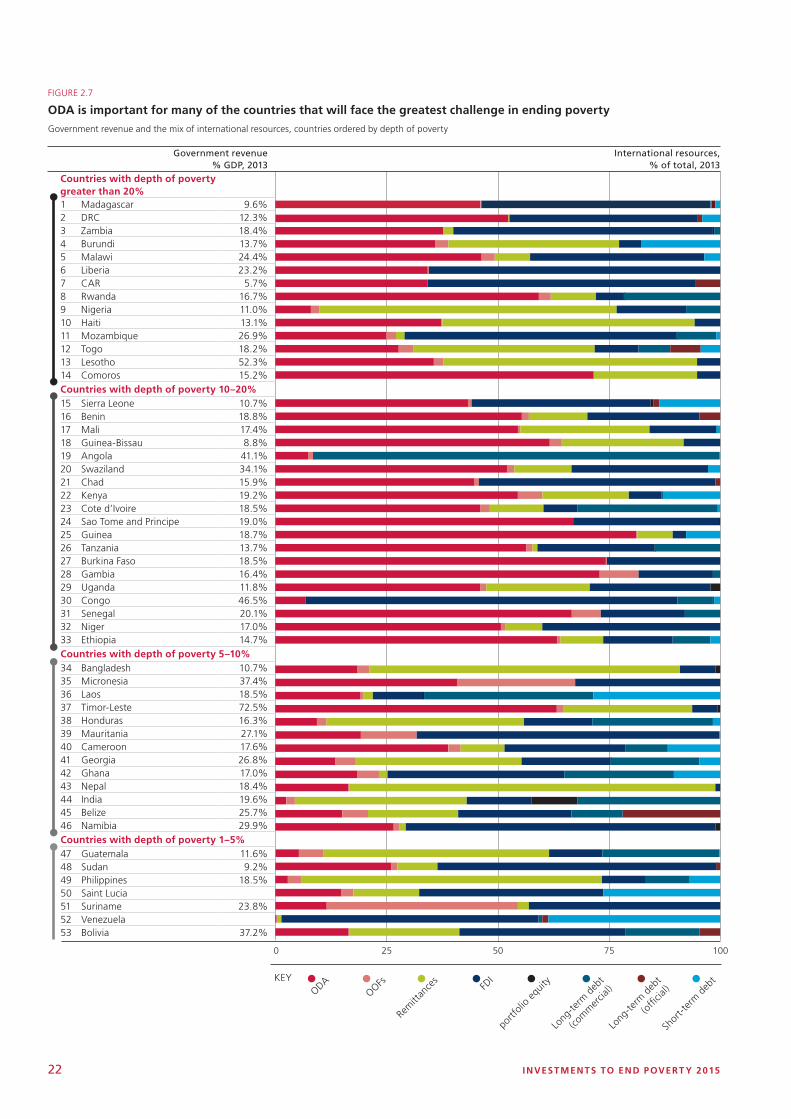
22 INVESTMENTS TO END POVERT Y 2015
0 25 50 75 100
0 25 50 75 100
KEY
ODAOOFs
Rem
ittan
ces
FDI
portf
olio
equit
y
Long
-term
deb
t
(of�
cial)
Long
-term
deb
t
(com
mer
cial)
Shor
t-ter
m d
ebt
FIGURE 2.7
ODA is important for many of the countries that will face the greatest challenge in ending poverty
Government revenue and the mix of international resources, countries ordered by depth of poverty
Countries with depth of poverty greater than 20%1 Madagascar 9.6%2 DRC 12.3%3 Zambia 18.4%4 Burundi 13.7%5 Malawi 24.4%6 Liberia 23.2%7 CAR 5.7%8 Rwanda 16.7%9 Nigeria 11.0%10 Haiti 13.1%11 Mozambique 26.9%12 Togo 18.2%13 Lesotho 52.3%14 Comoros 15.2%Countries with depth of poverty 10–20%15 Sierra Leone 10.7%16 Benin 18.8%17 Mali 17.4%18 Guinea-Bissau 8.8%19 Angola 41.1%20 Swaziland 34.1%21 Chad 15.9%22 Kenya 19.2%23 Cote d’Ivoire 18.5%24 Sao Tome and Principe 19.0%25 Guinea 18.7%26 Tanzania 13.7%27 Burkina Faso 18.5%28 Gambia 16.4%29 Uganda 11.8%30 Congo 46.5%31 Senegal 20.1%32 Niger 17.0%33 Ethiopia 14.7%Countries with depth of poverty 5–10%34 Bangladesh 10.7%35 Micronesia 37.4%36 Laos 18.5%37 Timor-Leste 72.5%38 Honduras 16.3%39 Mauritania 27.1%40 Cameroon 17.6%41 Georgia 26.8%42 Ghana 17.0%43 Nepal 18.4%44 India 19.6%45 Belize 25.7%46 Namibia 29.9%Countries with depth of poverty 1–5%47 Guatemala 11.6%48 Sudan 9.2%49 Philippines 18.5%50 Saint Lucia51 Suriname 23.8%52 Venezuela53 Bolivia 37.2%
Government revenue % GDP, 2013
International resources, % of total, 2013
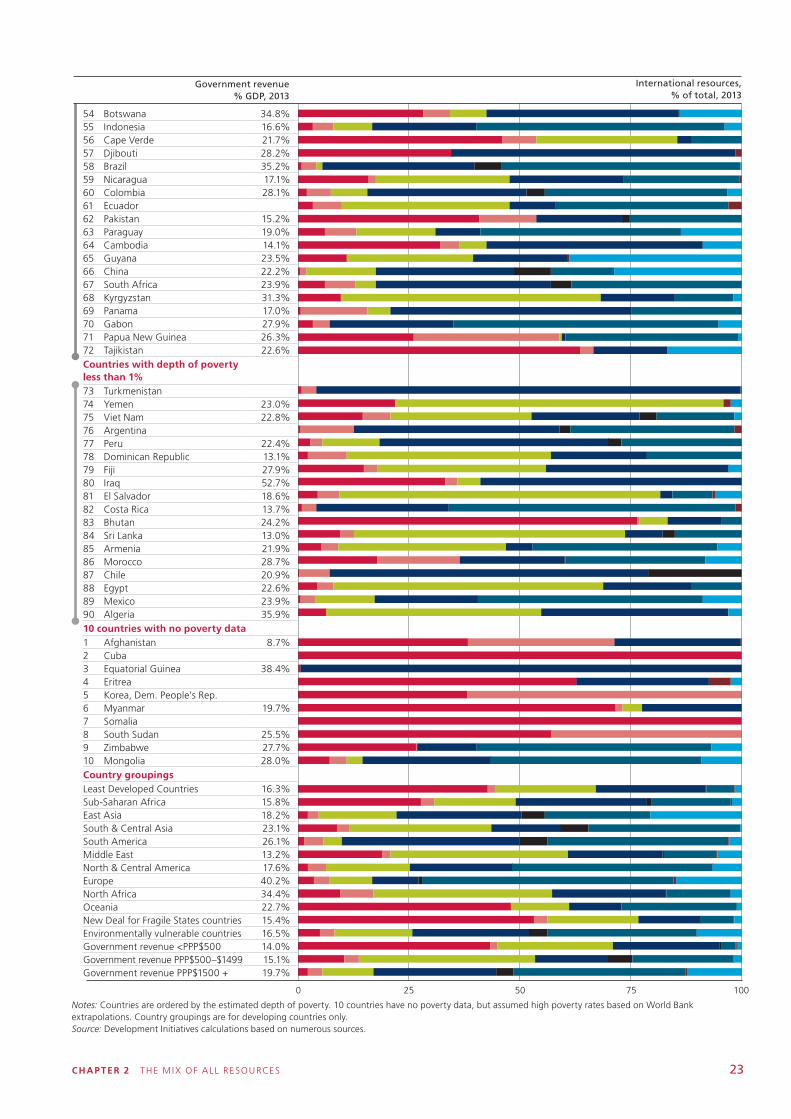
CHAP TER 2 THE MIX OF ALL RESOURCES 23
0 25 50 75 100
0 25 50 75 100
KEY
ODAOOFs
Rem
ittan
ces
FDI
portf
olio
equit
y
Long
-term
deb
t
(of�
cial)
Long
-term
deb
t
(com
mer
cial)
Shor
t-ter
m d
ebt
54 Botswana 34.8%55 Indonesia 16.6%56 Cape Verde 21.7%57 Djibouti 28.2%58 Brazil 35.2%59 Nicaragua 17.1%60 Colombia 28.1%61 Ecuador62 Pakistan 15.2%63 Paraguay 19.0%64 Cambodia 14.1%65 Guyana 23.5%66 China 22.2%67 South Africa 23.9%68 Kyrgyzstan 31.3%69 Panama 17.0%70 Gabon 27.9%71 Papua New Guinea 26.3%72 Tajikistan 22.6%Countries with depth of poverty less than 1%73 Turkmenistan74 Yemen 23.0%75 Viet Nam 22.8%76 Argentina77 Peru 22.4%78 Dominican Republic 13.1%79 Fiji 27.9%80 Iraq 52.7%81 El Salvador 18.6%82 Costa Rica 13.7%83 Bhutan 24.2%84 Sri Lanka 13.0%85 Armenia 21.9%86 Morocco 28.7%87 Chile 20.9%88 Egypt 22.6%89 Mexico 23.9%90 Algeria 35.9%10 countries with no poverty data 1 Afghanistan 8.7%2 Cuba3 Equatorial Guinea 38.4%4 Eritrea5 Korea, Dem. People’s Rep.6 Myanmar 19.7%7 Somalia8 South Sudan 25.5%9 Zimbabwe 27.7%10 Mongolia 28.0%Country groupingsLeast Developed Countries 16.3%Sub-Saharan Africa 15.8%East Asia 18.2%South & Central Asia 23.1%South America 26.1%Middle East 13.2%North & Central America 17.6%Europe 40.2%North Africa 34.4%Oceania 22.7%New Deal for Fragile States countries 15.4%Environmentally vulnerable countries 16.5%Government revenue <PPP$500 14.0%Government revenue PPP$500–$1499 15.1%Government revenue PPP$1500 + 19.7%
Government revenue % GDP, 2013
Notes: Countries are ordered by the estimated depth of poverty. 10 countries have no poverty data, but assumed high poverty rates based on World Bank extrapolations. Country groupings are for developing countries only.Source: Development Initiatives calculations based on numerous sources.
International resources, % of total, 2013

CHAP TER 3 DOMEST IC PUBL IC RESOURCES 25
3
Domestic public resources• National institutions are best placed to end poverty (in countries with functioning national
governing institutions – the focus of this chapter); they can diagnose, prioritise and design investments to address domestic problems.
• For governments to set and drive the poverty reduction agenda, domestic resources must become the ‘spine’ around which other development finance flows are coordinated.
• The way governments mobilise and use their resources can have a significant impact on the poorest people living in poverty.
• Yet the countries facing the greatest challenge in ending poverty also:
• Mobilise the fewest domestic resources and are projected to have slowest revenue growth
• Rely more on particular taxes – such as indirect taxes, that can be regressive, imposing a greater relative burden on people in poverty – and on international grant funding
• Can often have weak or no governing institutions, especially if they are emerging out of a conflict.
• Many countries facing the greatest challenge to ending poverty prioritise spending in key sectors such as health and education, although spending in absolute terms remains very low, and rely heavily on donor funding for key sectors such as agriculture, education and health, and on external financing to fund capital investment.
• Lower administrative levels of government will also play an important role in reducing poverty - their ability to raise revenues and the way they spend these resources can have a big impact on the poorest people.
• Ending poverty by 2030 requires a significant increase in the resources available to national institutions through sustainable, progressive mechanisms, and closer monitoring to ensure they are invested in a way that benefits the poorest people.
National institutions are the main drivers of poverty eradication.
They are best placed to diagnose, prioritise and design investments to address domestic problems. But for governments to set and drive their own poverty reduction agenda, domestic resources must become the ‘spine’ around which other
development finance flows are coordinated.
Although domestic public resources in many developing countries have seen an increase since the start of the millennium development goals (MDGs), it is now recognised that there is both need and space for governments to significantly increase their own resources further. We must
strive for greater public resources, but to do this we need to understand the nature and impact of domestic public revenue, particularly on the people in the deepest poverty. The distribution of poverty is uneven at the sub-national level, so the ways in which governments allocate resources across thematic areas and geographic regions is also important to ensure development goals are implemented successfully.
CHAP TER 3 DOMEST IC PUBL IC RESOURCES 25
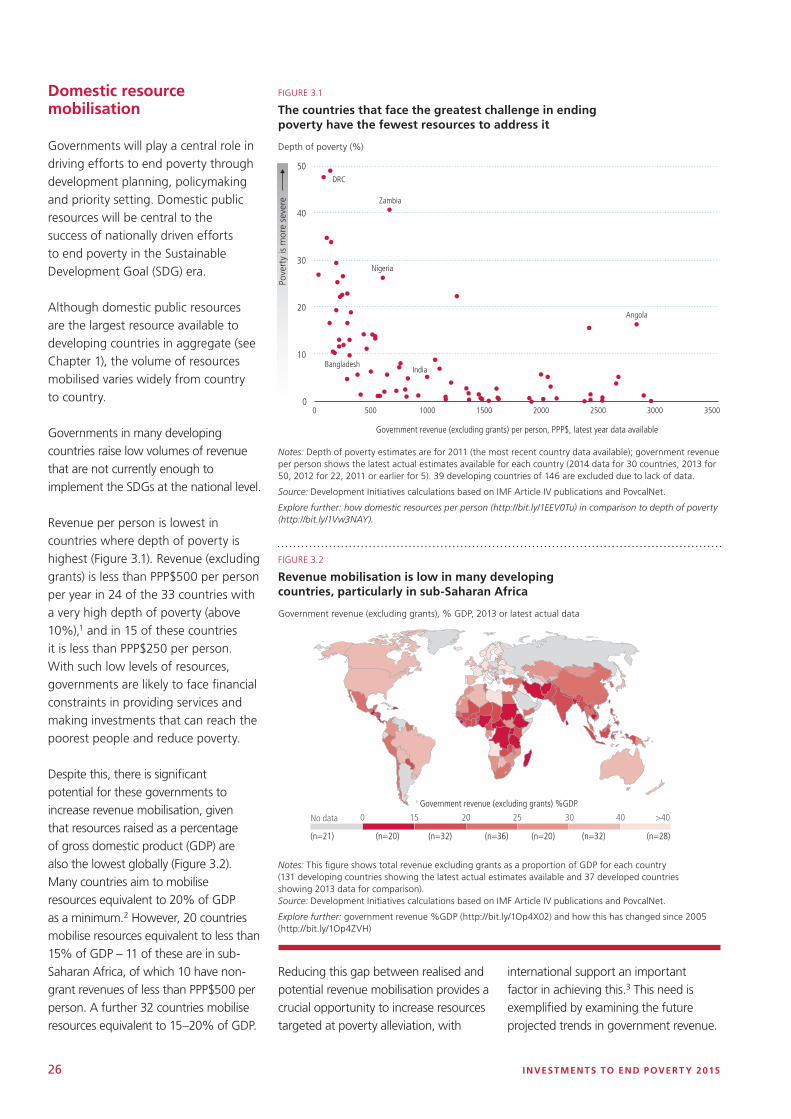
26 INVESTMENTS TO END POVERT Y 2015
Domestic resource mobilisation
Governments will play a central role in driving efforts to end poverty through development planning, policymaking and priority setting. Domestic public resources will be central to the success of nationally driven efforts to end poverty in the Sustainable Development Goal (SDG) era.
Although domestic public resources are the largest resource available to developing countries in aggregate (see Chapter 1), the volume of resources mobilised varies widely from country to country.
Governments in many developing countries raise low volumes of revenue that are not currently enough to implement the SDGs at the national level.
Revenue per person is lowest in countries where depth of poverty is highest (Figure 3.1). Revenue (excluding grants) is less than PPP$500 per person per year in 24 of the 33 countries with a very high depth of poverty (above 10%),1 and in 15 of these countries it is less than PPP$250 per person. With such low levels of resources, governments are likely to face financial constraints in providing services and making investments that can reach the poorest people and reduce poverty.
Despite this, there is significant potential for these governments to increase revenue mobilisation, given that resources raised as a percentage of gross domestic product (GDP) are also the lowest globally (Figure 3.2). Many countries aim to mobilise resources equivalent to 20% of GDP as a minimum.2 However, 20 countries mobilise resources equivalent to less than 15% of GDP – 11 of these are in sub-Saharan Africa, of which 10 have non-grant revenues of less than PPP$500 per person. A further 32 countries mobilise resources equivalent to 15–20% of GDP.
0
10
20
30
40
50
0 500 1000 1500 2000 2500 3000 3500
Government revenue (excluding grants) per person, PPP$, latest year data available
Angola
IndiaBangladesh
Nigeria
Zambia
DRC
Pove
rty
is m
ore
seve
re
FIGURE 3.1
The countries that face the greatest challenge in ending poverty have the fewest resources to address it
Depth of poverty (%)
FIGURE 3.2
Revenue mobilisation is low in many developing countries, particularly in sub-Saharan Africa
Government revenue (excluding grants), % GDP, 2013 or latest actual data
Notes: Depth of poverty estimates are for 2011 (the most recent country data available); government revenue per person shows the latest actual estimates available for each country (2014 data for 30 countries, 2013 for 50, 2012 for 22, 2011 or earlier for 5). 39 developing countries of 146 are excluded due to lack of data.
Source: Development Initiatives calculations based on IMF Article IV publications and PovcalNet.
Explore further: how domestic resources per person (http://bit.ly/1EEV0Tu) in comparison to depth of poverty (http://bit.ly/1Vw3NAY).
Notes: This figure shows total revenue excluding grants as a proportion of GDP for each country (131 developing countries showing the latest actual estimates available and 37 developed countries showing 2013 data for comparison).Source: Development Initiatives calculations based on IMF Article IV publications and PovcalNet.
Explore further: government revenue %GDP (http://bit.ly/1Op4X02) and how this has changed since 2005 (http://bit.ly/1Op4ZVH)
Government revenue (excluding grants) %GDP
150
(n=21) (n=20) (n=32) (n=36) (n=20) (n=32) (n=28)
20 25 30 40 >40No data
Reducing this gap between realised and potential revenue mobilisation provides a crucial opportunity to increase resources targeted at poverty alleviation, with
international support an important factor in achieving this.3 This need is exemplified by examining the future projected trends in government revenue.
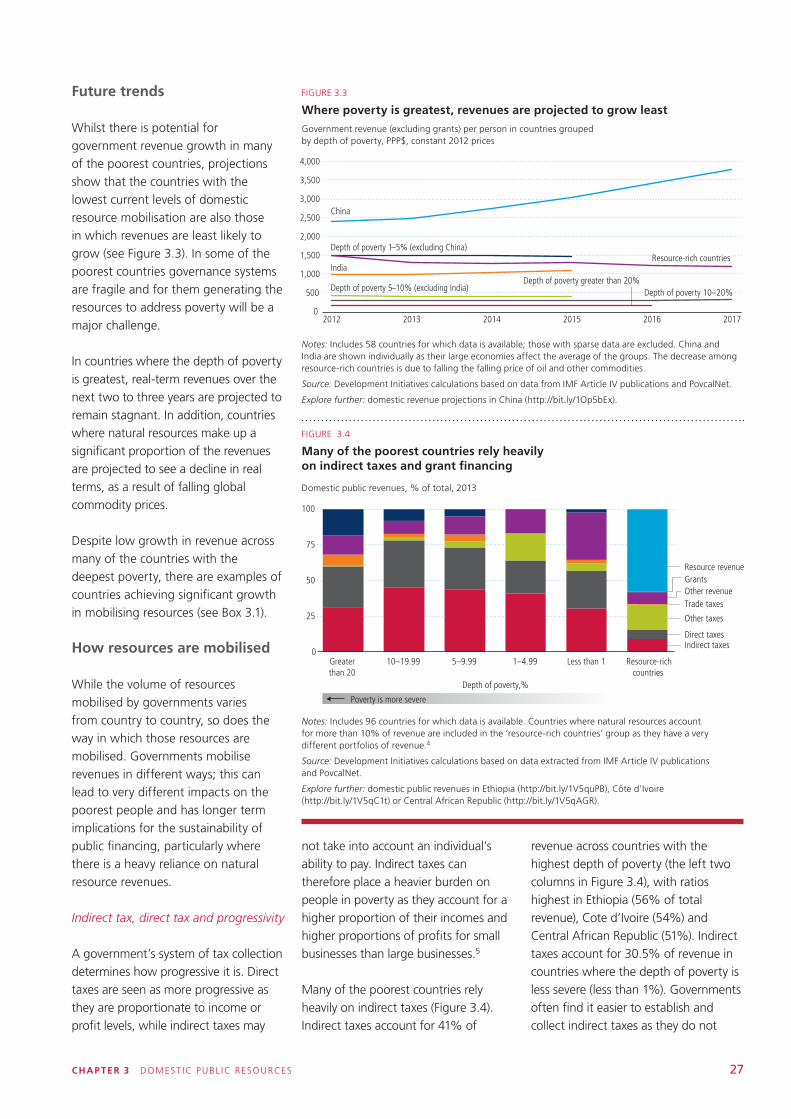
CHAP TER 3 DOMEST IC PUBL IC RESOURCES 27
Future trends
Whilst there is potential for government revenue growth in many of the poorest countries, projections show that the countries with the lowest current levels of domestic resource mobilisation are also those in which revenues are least likely to grow (see Figure 3.3). In some of the poorest countries governance systems are fragile and for them generating the resources to address poverty will be a major challenge.
In countries where the depth of poverty is greatest, real-term revenues over the next two to three years are projected to remain stagnant. In addition, countries where natural resources make up a significant proportion of the revenues are projected to see a decline in real terms, as a result of falling global commodity prices.
Despite low growth in revenue across many of the countries with the deepest poverty, there are examples of countries achieving significant growth in mobilising resources (see Box 3.1).
How resources are mobilised
While the volume of resources mobilised by governments varies from country to country, so does the way in which those resources are mobilised. Governments mobilise revenues in different ways; this can lead to very different impacts on the poorest people and has longer term implications for the sustainability of public financing, particularly where there is a heavy reliance on natural resource revenues.
Indirect tax, direct tax and progressivity
A government’s system of tax collection determines how progressive it is. Direct taxes are seen as more progressive as they are proportionate to income or profit levels, while indirect taxes may
Notes: Includes 58 countries for which data is available; those with sparse data are excluded. China and India are shown individually as their large economies affect the average of the groups. The decrease among resource-rich countries is due to falling the falling price of oil and other commodities.
Source: Development Initiatives calculations based on data from IMF Article IV publications and PovcalNet.
Explore further: domestic revenue projections in China (http://bit.ly/1Op5bEx).
0
500
1,000
1,500
2,000
2,500
3,000
3,500
4,000
2012 2013 2014 2015 2016 2017
Depth of poverty 1–5% (excluding China) Resource-rich countries
India Depth of poverty greater than 20%
China
Depth of poverty 5–10% (excluding India) Depth of poverty 10–20%
0
25
50
75
100
Greater than 20
10–19.99 5–9.99 1–4.99 Less than 1 Resource-richcountries
Depth of poverty,%
Indirect taxes Direct taxes
Other taxes
Trade taxes Other revenueGrants Resource revenue
Poverty is more severe
FIGURE 3.4
Many of the poorest countries rely heavily on indirect taxes and grant financing
Domestic public revenues, % of total, 2013
Notes: Includes 96 countries for which data is available. Countries where natural resources account for more than 10% of revenue are included in the ‘resource-rich countries’ group as they have a very different portfolios of revenue.4
Source: Development Initiatives calculations based on data extracted from IMF Article IV publications and PovcalNet.
Explore further: domestic public revenues in Ethiopia (http://bit.ly/1V5quPB), Côte d’Ivoire (http://bit.ly/1V5qC1t) or Central African Republic (http://bit.ly/1V5qAGR).
not take into account an individual’s ability to pay. Indirect taxes can therefore place a heavier burden on people in poverty as they account for a higher proportion of their incomes and higher proportions of profits for small businesses than large businesses.5
Many of the poorest countries rely heavily on indirect taxes (Figure 3.4). Indirect taxes account for 41% of
revenue across countries with the highest depth of poverty (the left two columns in Figure 3.4), with ratios highest in Ethiopia (56% of total revenue), Cote d’Ivoire (54%) and Central African Republic (51%). Indirect taxes account for 30.5% of revenue in countries where the depth of poverty is less severe (less than 1%). Governments often find it easier to establish and collect indirect taxes as they do not
FIGURE 3.3
Where poverty is greatest, revenues are projected to grow least
Government revenue (excluding grants) per person in countries grouped by depth of poverty, PPP$, constant 2012 prices
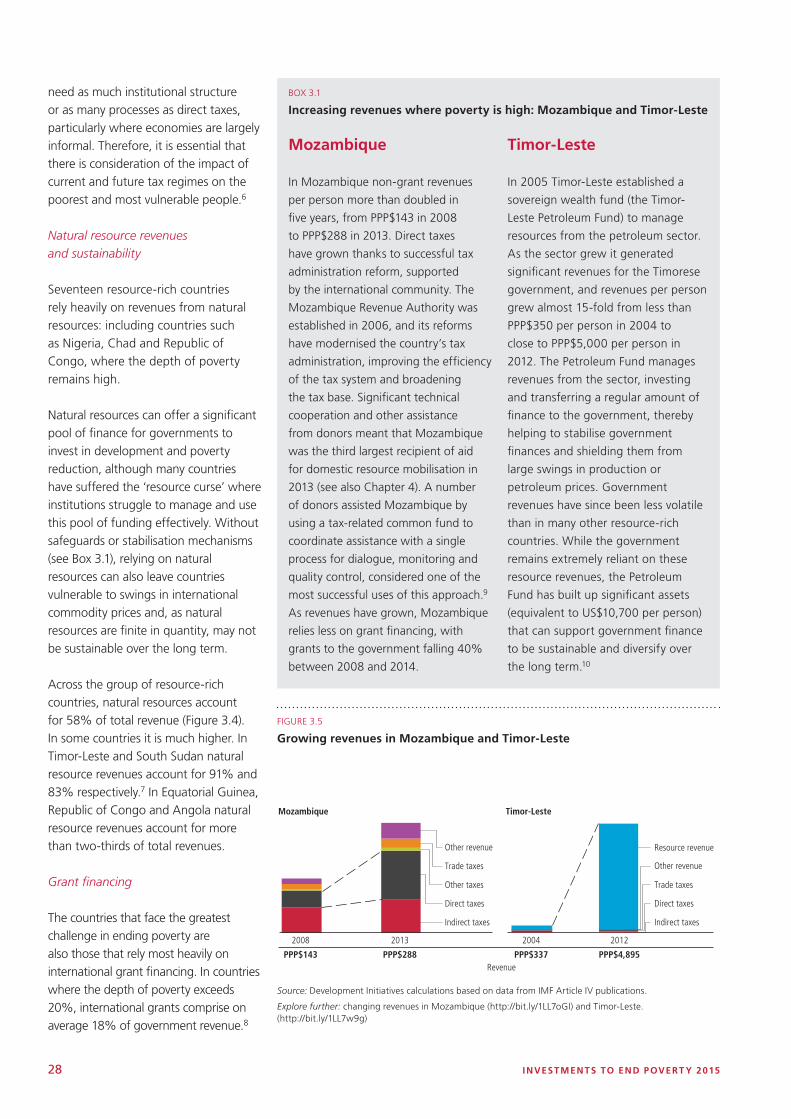
28 INVESTMENTS TO END POVERT Y 2015
Mozambique
In Mozambique non-grant revenues
per person more than doubled in
five years, from PPP$143 in 2008
to PPP$288 in 2013. Direct taxes
have grown thanks to successful tax
administration reform, supported
by the international community. The
Mozambique Revenue Authority was
established in 2006, and its reforms
have modernised the country’s tax
administration, improving the efficiency
of the tax system and broadening
the tax base. Significant technical
cooperation and other assistance
from donors meant that Mozambique
was the third largest recipient of aid
for domestic resource mobilisation in
2013 (see also Chapter 4). A number
of donors assisted Mozambique by
using a tax-related common fund to
coordinate assistance with a single
process for dialogue, monitoring and
quality control, considered one of the
most successful uses of this approach.9
As revenues have grown, Mozambique
relies less on grant financing, with
grants to the government falling 40%
between 2008 and 2014.
Timor-Leste
In 2005 Timor-Leste established a
sovereign wealth fund (the Timor-
Leste Petroleum Fund) to manage
resources from the petroleum sector.
As the sector grew it generated
significant revenues for the Timorese
government, and revenues per person
grew almost 15-fold from less than
PPP$350 per person in 2004 to
close to PPP$5,000 per person in
2012. The Petroleum Fund manages
revenues from the sector, investing
and transferring a regular amount of
finance to the government, thereby
helping to stabilise government
finances and shielding them from
large swings in production or
petroleum prices. Government
revenues have since been less volatile
than in many other resource-rich
countries. While the government
remains extremely reliant on these
resource revenues, the Petroleum
Fund has built up significant assets
(equivalent to US$10,700 per person)
that can support government finance
to be sustainable and diversify over
the long term.10
need as much institutional structure or as many processes as direct taxes, particularly where economies are largely informal. Therefore, it is essential that there is consideration of the impact of current and future tax regimes on the poorest and most vulnerable people.6
Natural resource revenues and sustainability
Seventeen resource-rich countries rely heavily on revenues from natural resources: including countries such as Nigeria, Chad and Republic of Congo, where the depth of poverty remains high.
Natural resources can offer a significant pool of finance for governments to invest in development and poverty reduction, although many countries have suffered the ‘resource curse’ where institutions struggle to manage and use this pool of funding effectively. Without safeguards or stabilisation mechanisms (see Box 3.1), relying on natural resources can also leave countries vulnerable to swings in international commodity prices and, as natural resources are finite in quantity, may not be sustainable over the long term.
Across the group of resource-rich countries, natural resources account for 58% of total revenue (Figure 3.4). In some countries it is much higher. In Timor-Leste and South Sudan natural resource revenues account for 91% and 83% respectively.7 In Equatorial Guinea, Republic of Congo and Angola natural resource revenues account for more than two-thirds of total revenues.
Grant financing
The countries that face the greatest challenge in ending poverty are also those that rely most heavily on international grant financing. In countries where the depth of poverty exceeds 20%, international grants comprise on average 18% of government revenue.8
2008 2013
Indirect taxes
Direct taxes
Other taxes
Trade taxes
Other revenue
Indirect taxes
Direct taxes
Trade taxes
Other revenue
Resource revenue
Revenue
Mozambique Timor-Leste
PPP$143 PPP$288
2004 2012
PPP$337 PPP$4,895
FIGURE 3.5
Growing revenues in Mozambique and Timor-Leste
Source: Development Initiatives calculations based on data from IMF Article IV publications.
Explore further: changing revenues in Mozambique (http://bit.ly/1LL7oGI) and Timor-Leste. (http://bit.ly/1LL7w9g)
BOX 3.1
Increasing revenues where poverty is high: Mozambique and Timor-Leste
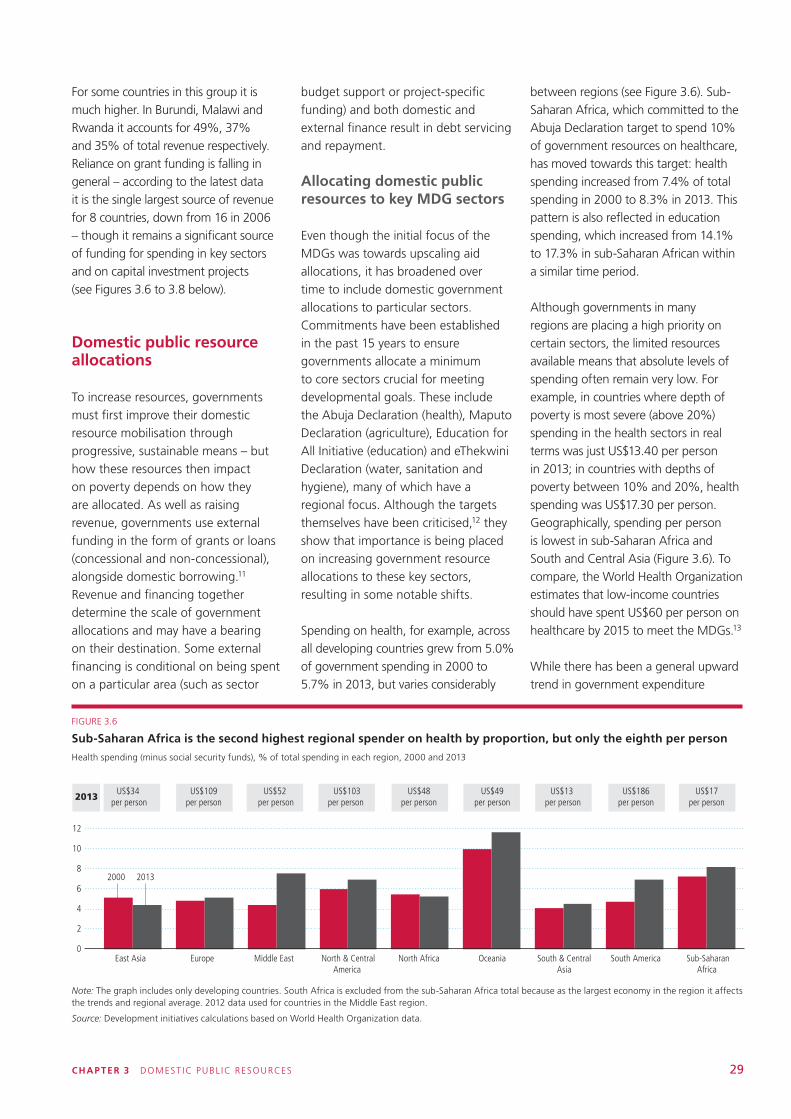
CHAP TER 3 DOMEST IC PUBL IC RESOURCES 29
For some countries in this group it is much higher. In Burundi, Malawi and Rwanda it accounts for 49%, 37% and 35% of total revenue respectively. Reliance on grant funding is falling in general – according to the latest data it is the single largest source of revenue for 8 countries, down from 16 in 2006 – though it remains a significant source of funding for spending in key sectors and on capital investment projects (see Figures 3.6 to 3.8 below).
Domestic public resource allocations
To increase resources, governments must first improve their domestic resource mobilisation through progressive, sustainable means – but how these resources then impact on poverty depends on how they are allocated. As well as raising revenue, governments use external funding in the form of grants or loans (concessional and non-concessional), alongside domestic borrowing.11 Revenue and financing together determine the scale of government allocations and may have a bearing on their destination. Some external financing is conditional on being spent on a particular area (such as sector
budget support or project-specific funding) and both domestic and external finance result in debt servicing and repayment.
Allocating domestic public resources to key MDG sectors
Even though the initial focus of the MDGs was towards upscaling aid allocations, it has broadened over time to include domestic government allocations to particular sectors. Commitments have been established in the past 15 years to ensure governments allocate a minimum to core sectors crucial for meeting developmental goals. These include the Abuja Declaration (health), Maputo Declaration (agriculture), Education for All Initiative (education) and eThekwini Declaration (water, sanitation and hygiene), many of which have a regional focus. Although the targets themselves have been criticised,12 they show that importance is being placed on increasing government resource allocations to these key sectors, resulting in some notable shifts.
Spending on health, for example, across all developing countries grew from 5.0% of government spending in 2000 to 5.7% in 2013, but varies considerably
between regions (see Figure 3.6). Sub-Saharan Africa, which committed to the Abuja Declaration target to spend 10% of government resources on healthcare, has moved towards this target: health spending increased from 7.4% of total spending in 2000 to 8.3% in 2013. This pattern is also reflected in education spending, which increased from 14.1% to 17.3% in sub-Saharan African within a similar time period.
Although governments in many regions are placing a high priority on certain sectors, the limited resources available means that absolute levels of spending often remain very low. For example, in countries where depth of poverty is most severe (above 20%) spending in the health sectors in real terms was just US$13.40 per person in 2013; in countries with depths of poverty between 10% and 20%, health spending was US$17.30 per person. Geographically, spending per person is lowest in sub-Saharan Africa and South and Central Asia (Figure 3.6). To compare, the World Health Organization estimates that low-income countries should have spent US$60 per person on healthcare by 2015 to meet the MDGs.13
While there has been a general upward trend in government expenditure
0
2
4
6
8
10
12
East Asia Europe Middle East North & CentralAmerica
North Africa Oceania South & CentralAsia
South America Sub-SaharanAfrica
US$34 per person
US$109 per person
US$52 per person
US$103per person
US$48per person
US$49per person
US$13 per person
US$186per person
US$17per person
2000 2013
2013
FIGURE 3.6
Sub-Saharan Africa is the second highest regional spender on health by proportion, but only the eighth per person
Health spending (minus social security funds), % of total spending in each region, 2000 and 2013
Note: The graph includes only developing countries. South Africa is excluded from the sub-Saharan Africa total because as the largest economy in the region it affects the trends and regional average. 2012 data used for countries in the Middle East region.
Source: Development initiatives calculations based on World Health Organization data.
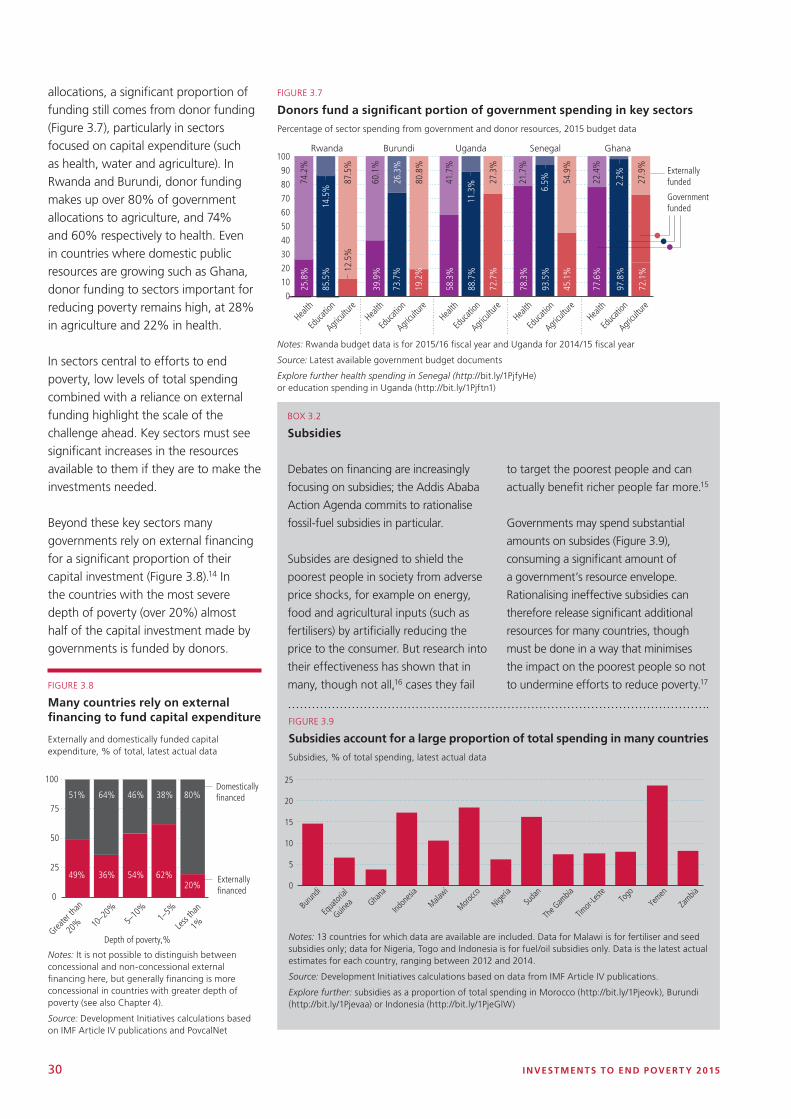
30 INVESTMENTS TO END POVERT Y 2015
BOX 3.2
Subsidies
Debates on financing are increasingly
focusing on subsidies; the Addis Ababa
Action Agenda commits to rationalise
fossil-fuel subsidies in particular.
Subsides are designed to shield the
poorest people in society from adverse
price shocks, for example on energy,
food and agricultural inputs (such as
fertilisers) by artificially reducing the
price to the consumer. But research into
their effectiveness has shown that in
many, though not all,16 cases they fail
to target the poorest people and can
actually benefit richer people far more.15
Governments may spend substantial
amounts on subsides (Figure 3.9),
consuming a significant amount of
a government’s resource envelope.
Rationalising ineffective subsidies can
therefore release significant additional
resources for many countries, though
must be done in a way that minimises
the impact on the poorest people so not
to undermine efforts to reduce poverty.17
0
10
20
30
40
50
60
70
80
90
100
39.9
%
73.7
%
19.2
%
60.1
%
26.3
%
80.8
%
Burundi
25.8
%
85.5
% 12.5
%
74.2
%
14.5
%
87.5
%
Rwanda
58.3
%
88.7
%
72.7
%
41.7
%
11.3
% 27.3
%
Uganda
78.3
%
93.5
%
45.1
%
21.7
%
6.5% 54
.9%
Senegal
77.6
%
97.8
%
72.1
%
22.4
%
2.2% 27.9
%
Health
Educ
ation
Agricu
lture
Health
Educ
ation
Agricu
lture
Health
Educ
ation
Agricu
lture
Health
Educ
ation
Agricu
lture
Health
Educ
ation
Agricu
lture
Ghana
Government funded
Externally funded
FIGURE 3.7
Donors fund a significant portion of government spending in key sectors
Percentage of sector spending from government and donor resources, 2015 budget data
Notes: Rwanda budget data is for 2015/16 fiscal year and Uganda for 2014/15 fiscal year
Source: Latest available government budget documents
Explore further health spending in Senegal (http://bit.ly/1PjfyHe) or education spending in Uganda (http://bit.ly/1Pjftn1)
FIGURE 3.8
Many countries rely on external financing to fund capital expenditure
Externally and domestically funded capital expenditure, % of total, latest actual data
FIGURE 3.9
Subsidies account for a large proportion of total spending in many countries
Subsidies, % of total spending, latest actual data
Notes: It is not possible to distinguish between concessional and non-concessional external financing here, but generally financing is more concessional in countries with greater depth of poverty (see also Chapter 4).
Source: Development Initiatives calculations based on IMF Article IV publications and PovcalNet
Notes: 13 countries for which data are available are included. Data for Malawi is for fertiliser and seed subsidies only; data for Nigeria, Togo and Indonesia is for fuel/oil subsidies only. Data is the latest actual estimates for each country, ranging between 2012 and 2014.
Source: Development Initiatives calculations based on data from IMF Article IV publications.
Explore further: subsidies as a proportion of total spending in Morocco (http://bit.ly/1Pjeovk), Burundi (http://bit.ly/1Pjevaa) or Indonesia (http://bit.ly/1PjeGlW)
0
25
50
75
100
Greater
than
20%
10–2
0%5–
10%
1–5%
Less t
han
1%
Depth of poverty,%
Externally �nanced
Domestically �nanced 51%
49%
64%
36%
46%
54%
38%
62%
80%
20% 0
5
10
15
20
25
Burun
di
Equa
torial
Guinea Gha
na
Indon
esia
Malawi
Morocco
Nigeria
Suda
n
The G
ambia
Timor-
Leste
Togo
Yemen
Zambia
0
5
10
15
20
25
Burun
di
Equa
torial
Guinea Gha
na
Indon
esia
Malawi
Morocco
Nigeria
Suda
n
The G
ambia
Timor-
Leste
Togo
Yemen
Zambia
allocations, a significant proportion of funding still comes from donor funding (Figure 3.7), particularly in sectors focused on capital expenditure (such as health, water and agriculture). In Rwanda and Burundi, donor funding makes up over 80% of government allocations to agriculture, and 74% and 60% respectively to health. Even in countries where domestic public resources are growing such as Ghana, donor funding to sectors important for reducing poverty remains high, at 28% in agriculture and 22% in health.
In sectors central to efforts to end poverty, low levels of total spending combined with a reliance on external funding highlight the scale of the challenge ahead. Key sectors must see significant increases in the resources available to them if they are to make the investments needed.
Beyond these key sectors many governments rely on external financing for a significant proportion of their capital investment (Figure 3.8).14 In the countries with the most severe depth of poverty (over 20%) almost half of the capital investment made by governments is funded by donors.
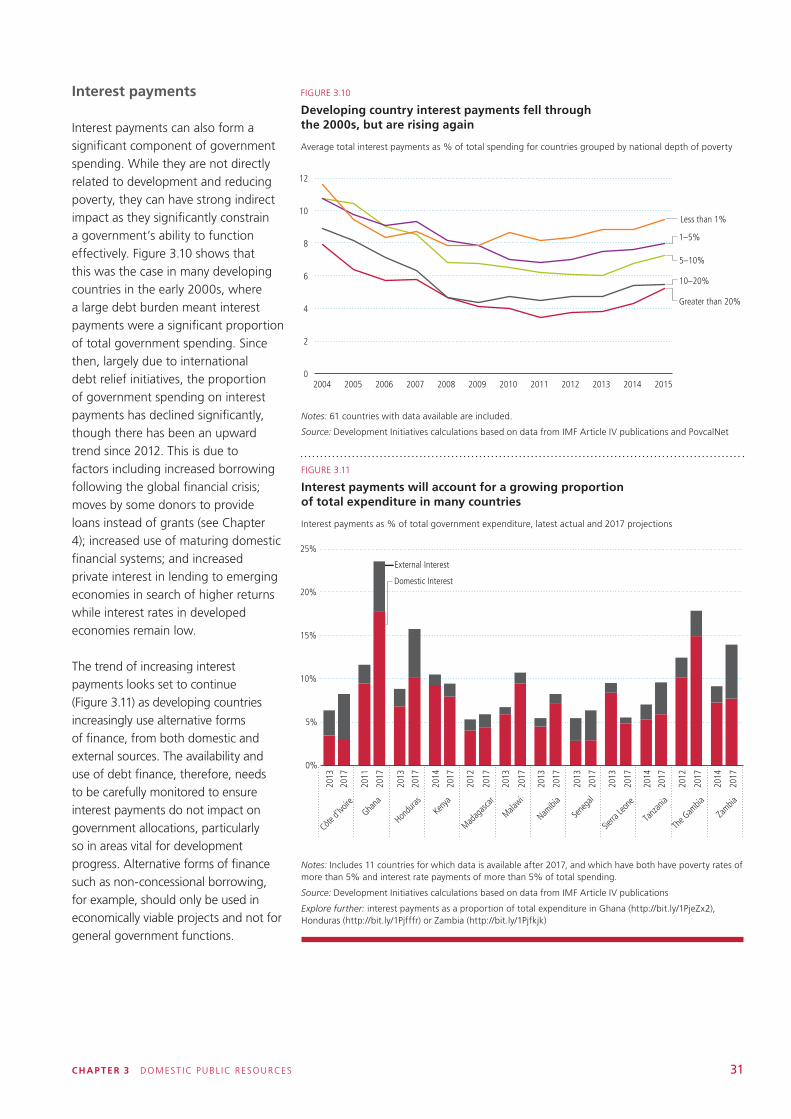
CHAP TER 3 DOMEST IC PUBL IC RESOURCES 31
FIGURE 3.10
Developing country interest payments fell through the 2000s, but are rising again
Average total interest payments as % of total spending for countries grouped by national depth of poverty
FIGURE 3.11
Interest payments will account for a growing proportion of total expenditure in many countries
Interest payments as % of total government expenditure, latest actual and 2017 projections
Notes: 61 countries with data available are included.
Source: Development Initiatives calculations based on data from IMF Article IV publications and PovcalNet
Notes: Includes 11 countries for which data is available after 2017, and which have both have poverty rates of more than 5% and interest rate payments of more than 5% of total spending.
Source: Development Initiatives calculations based on data from IMF Article IV publications
Explore further: interest payments as a proportion of total expenditure in Ghana (http://bit.ly/1PjeZx2), Honduras (http://bit.ly/1Pjfffr) or Zambia (http://bit.ly/1Pjfkjk)
0
2
4
6
8
10
12
2004 2005 2006 2007 2008 2009 2010 2011 2012 2013 2014 2015
Greater than 20%
10–20%
5–10%
1–5%
Less than 1%
0%
5%
10%
15%
25%
20%
2017
2017
2017
2017
2017
2017
2017
2017
2017
2017
2017
2017
2011
2012
2012
2013
2013
2013
2013
2013
2013
2014
2014
2014
Côte d'
Ivoire
Ghana
Hondu
rasKe
nya
Madag
ascar
Malawi
Namibi
a
Sene
gal
Sierra
Leon
e
Tanz
ania
The G
ambia
Zambia
Domestic Interest
External Interest
Interest payments
Interest payments can also form a significant component of government spending. While they are not directly related to development and reducing poverty, they can have strong indirect impact as they significantly constrain a government’s ability to function effectively. Figure 3.10 shows that this was the case in many developing countries in the early 2000s, where a large debt burden meant interest payments were a significant proportion of total government spending. Since then, largely due to international debt relief initiatives, the proportion of government spending on interest payments has declined significantly, though there has been an upward trend since 2012. This is due to factors including increased borrowing following the global financial crisis; moves by some donors to provide loans instead of grants (see Chapter 4); increased use of maturing domestic financial systems; and increased private interest in lending to emerging economies in search of higher returns while interest rates in developed economies remain low.
The trend of increasing interest payments looks set to continue (Figure 3.11) as developing countries increasingly use alternative forms of finance, from both domestic and external sources. The availability and use of debt finance, therefore, needs to be carefully monitored to ensure interest payments do not impact on government allocations, particularly so in areas vital for development progress. Alternative forms of finance such as non-concessional borrowing, for example, should only be used in economically viable projects and not for general government functions.
32 INVESTMENTS TO END POVERT Y 2015
Sub-national domestic public resources
• To end poverty we need disaggregated data on people and resources that unpacks national averages to show exactly who and how people are benefiting from investments, together with the inequalities in resource allocations and outcomes within a country. As we enter the SDG era, sub-national data on domestic public resources is increasingly both important and available, particularly because: A growing number of developing countries have devolved responsibility and decentralised fiscal powers to sub-national governments, enabling resource allocation mapping in key areas such as basic education, primary healthcare, agriculture and WASH.
• Information management systems have been improved, enabling more accurate and timely information to be published on sector performance.
• Government data is increasingly transparent and accessible.
To meet development goals both nationally and internationally, we must have and use sub-national data on resource allocations and outcomes.
Sub-national spending
Sub-national government spending varies within countries because different areas have different contexts and population needs. For most sub-national governments, financing comes from central government transfers. These are often calculated according to a needs-based formula, with conditions placed on how they can be spent (such as on teachers’ wages). Donor funding can also be a significant resource for local government spending, and is also
often targeted to areas of need. Sub-national governments are able to raise their own revenue to finance aspects of their budgets that often otherwise go unfunded, although these usually make up smaller portions of the total resource bundle.
While we would expect some differences in funding levels in line with differing needs, in practice the resources available to sub-national governments often vary widely. While some localities have adequate resources to provide for effective service delivery, others are constrained in the level of service they can provide.
Uganda is leading efforts to publish detailed sub-national revenue and spending data, allowing detailed monitoring of investments and outcomes. District spending per person for primary health varies from US$1 in Mukono District to US$37 in Kalangala District (Figure 3.12). For primary education it varies from US$10 per child in Zombo District to US$217 in Kalangala.18 Donor funding of primary education and health also varies significantly between districts, although as Figure 3.12 shows it is seemingly well targeted to regions of most need. Certain districts rely heavily on donor financing, highlighting issues around sustainability and variability of financing. The data also exposes a number of districts, like Arua, that have intermediate needs that are neither a priority for government-allocated revenue or external finance.
Sub-national revenue
The extent to which sub-national development challenges can be addressed is influenced by the source of revenue funding as well as they way it is spent. Each source of revenue presents a set of challenges faced at the local level. For example, central government transfers can be delayed
and resources are often allocated conditionally, making them difficult to target other areas of need. Donor funding disbursements can also be unpredictable and while they may be on-budget, they may not go through government systems or be coordinated towards government development planning. Unpredictable financial disbursements to sub-national governments can have a severe impact on outcome performance as they engenders uncertainty, hampering the ability to plan for sustained activities.
Improving sub-national governments’ own revenue mobilisation capacity is increasingly identified19 as a means of providing additional development finance and a funding reserve to compensate for the unpredictability of other resource flows.
While most tax is controlled by central governments, sub-national governments can use a number of revenue-raising measures such as fees, fines and property taxes. But because local institutions commonly have limited capacity to collect revenue and often lack formal record keeping,20 sub-national governments normally have the potential to significantly increase revenue.
As with spending allocations, locally raised revenue collection also varies widely across sub-national governments, often because of differing contexts such as how urban or economically mature the region is. But there can still be clear differences in how areas that are similar in nature raise revenue, so it is important to understand why and learn lessons from these different approaches and experiences. Consistent, comparable sub-national data is the first step in identifying these issues.
This differential picture of local revenue raising is illustrated in Figure 3.13 by the case of Uganda. An average district raises only 4.2% of their own revenue
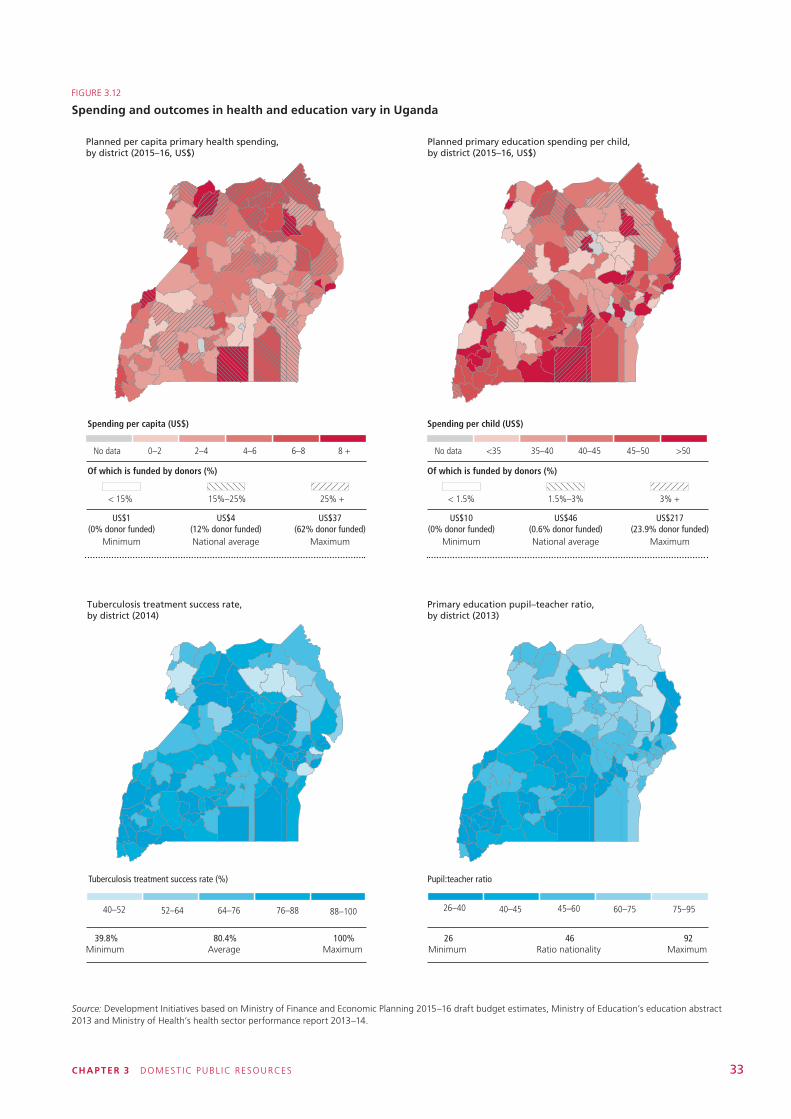
CHAP TER 3 DOMEST IC PUBL IC RESOURCES 33
Primary education pupil–teacher ratio, by district (2013)
Pupil:teacher ratio
26–40 40–45 45–60 60–75 75–95
Tuberculosis treatment success rate, by district (2014)
Tuberculosis treatment success rate (%)
40–52 52–64 64–76 76–88 88–100
80.4%Average
39.8%Minimum
100%Maximum
Planned primary education spending per child, by district (2015–16, US$)
Spending per child (US$)
No data <35 35–40 40–45 45–50 >50No data
Of which is funded by donors (%)
< 1.5% 1.5%–3% 3% +
US$46(0.6% donor funded)National average
US$217(23.9% donor funded)
Maximum
US$10(0% donor funded)
Minimum
US$4(12% donor funded)National average
US$37(62% donor funded)
Maximum
US$1(0% donor funded)
Minimum
46Ratio nationality
26Minimum
92Maximum
Of which is funded by donors (%)
< 15% 15%–25% 25% +
Planned per capita primary health spending, by district (2015–16, US$)
Spending per capita (US$)
0–2 2–4 4–6 6–8 8 +
FIGURE 3.12
Spending and outcomes in health and education vary in Uganda
Source: Development Initiatives based on Ministry of Finance and Economic Planning 2015–16 draft budget estimates, Ministry of Education’s education abstract 2013 and Ministry of Health’s health sector performance report 2013–14.
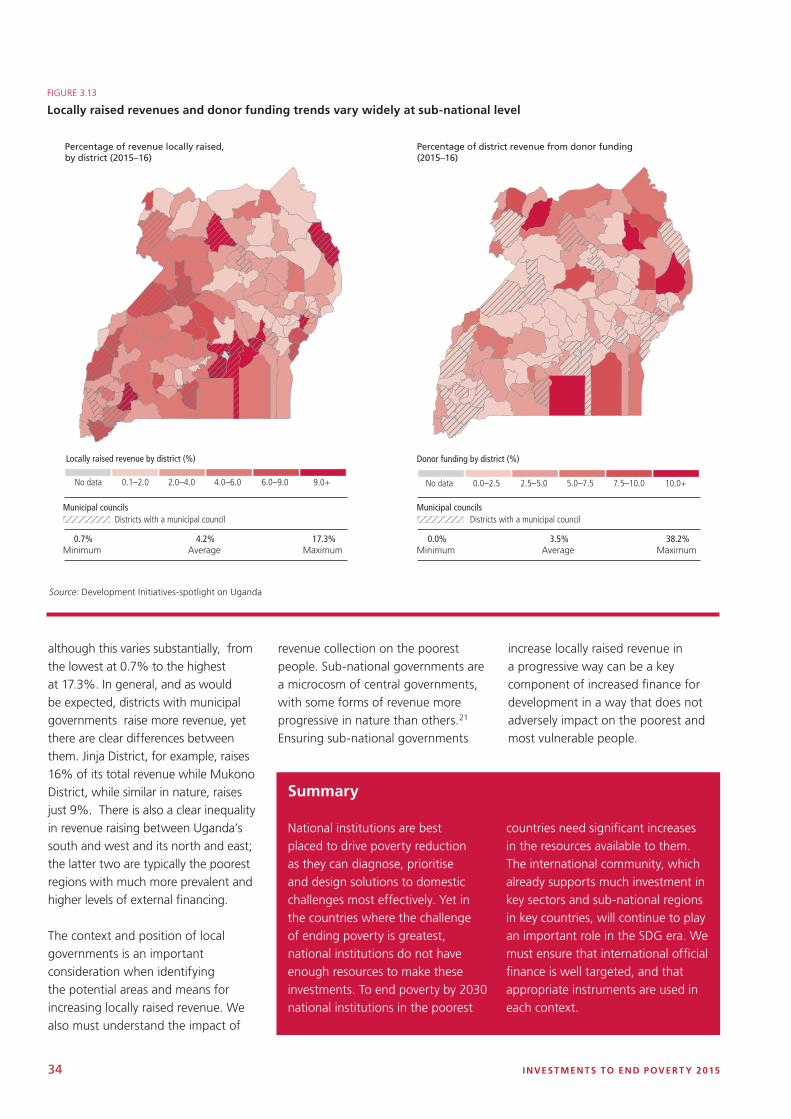
34 INVESTMENTS TO END POVERT Y 2015
although this varies substantially, from the lowest at 0.7% to the highest at 17.3%. In general, and as would be expected, districts with municipal governments raise more revenue, yet there are clear differences between them. Jinja District, for example, raises 16% of its total revenue while Mukono District, while similar in nature, raises just 9%. There is also a clear inequality in revenue raising between Uganda’s south and west and its north and east; the latter two are typically the poorest regions with much more prevalent and higher levels of external financing.
The context and position of local governments is an important consideration when identifying the potential areas and means for increasing locally raised revenue. We also must understand the impact of
revenue collection on the poorest people. Sub-national governments are a microcosm of central governments, with some forms of revenue more progressive in nature than others.21 Ensuring sub-national governments
increase locally raised revenue in a progressive way can be a key component of increased finance for development in a way that does not adversely impact on the poorest and most vulnerable people.
FIGURE 3.13
Locally raised revenues and donor funding trends vary widely at sub-national level
Source: Development Initiatives-spotlight on Uganda
Locally raised revenue by district (%) Donor funding by district (%)
No data 2.0–4.00.1–2.0 4.0–6.0 6.0–9.0 9.0+ No data 2.5–5.00.0–2.5 5.0–7.5 7.5–10.0 10.0+
Percentage of revenue locally raised, by district (2015–16)
Percentage of district revenue from donor funding (2015–16)
Municipal councilsDistricts with a municipal councilDistricts with a municipal council
4.2%Average
0.7%Minimum
17.3%Maximum
Municipal councils
3.5%Average
0.0%Minimum
38.2%Maximum
Summary
National institutions are best placed to drive poverty reduction as they can diagnose, prioritise and design solutions to domestic challenges most effectively. Yet in the countries where the challenge of ending poverty is greatest, national institutions do not have enough resources to make these investments. To end poverty by 2030 national institutions in the poorest
countries need significant increases in the resources available to them. The international community, which already supports much investment in key sectors and sub-national regions in key countries, will continue to play an important role in the SDG era. We must ensure that international official finance is well targeted, and that appropriate instruments are used in each context.
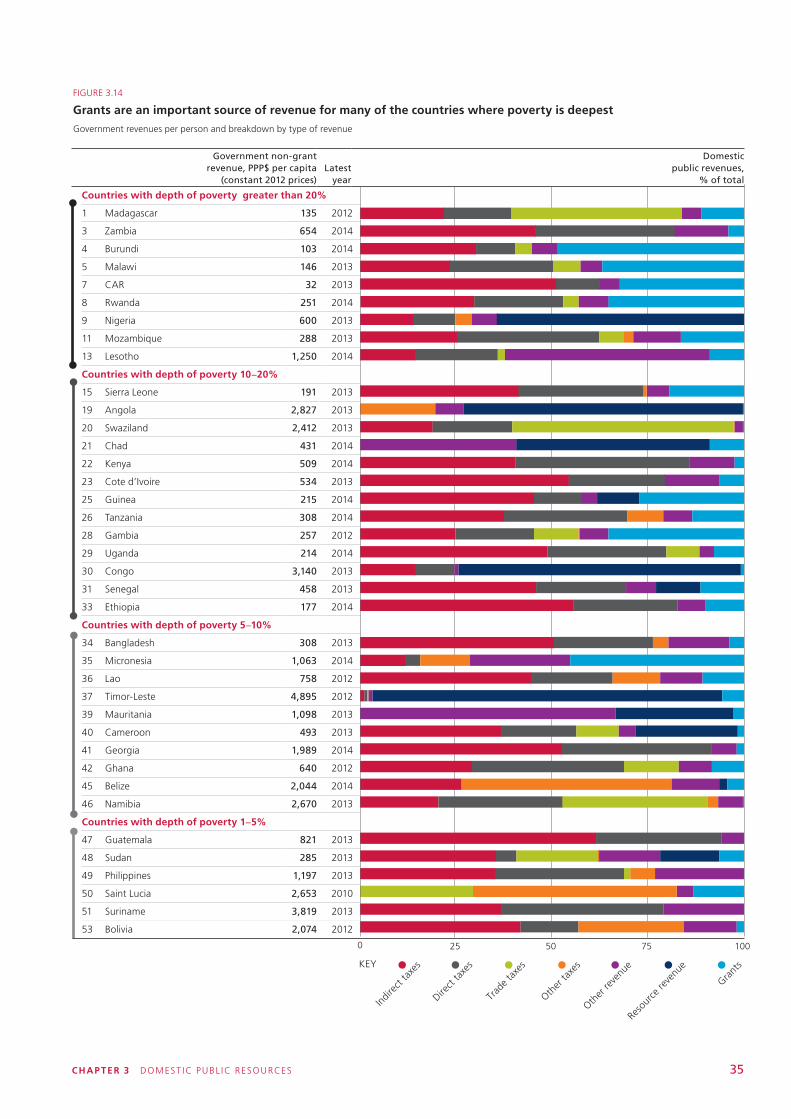
CHAP TER 3 DOMEST IC PUBL IC RESOURCES 35
Countries with depth of poverty greater than 20%
1 Madagascar 135 2012
3 Zambia 654 2014
4 Burundi 103 2014
5 Malawi 146 2013
7 CAR 32 2013
8 Rwanda 251 2014
9 Nigeria 600 2013
11 Mozambique 288 2013
13 Lesotho 1,250 2014
Countries with depth of poverty 10–20%
15 Sierra Leone 191 2013
19 Angola 2,827 2013
20 Swaziland 2,412 2013
21 Chad 431 2014
22 Kenya 509 2014
23 Cote d’Ivoire 534 2013
25 Guinea 215 2014
26 Tanzania 308 2014
28 Gambia 257 2012
29 Uganda 214 2014
30 Congo 3,140 2013
31 Senegal 458 2013
33 Ethiopia 177 2014
Countries with depth of poverty 5–10%
34 Bangladesh 308 2013
35 Micronesia 1,063 2014
36 Lao 758 2012
37 Timor-Leste 4,895 2012
39 Mauritania 1,098 2013
40 Cameroon 493 2013
41 Georgia 1,989 2014
42 Ghana 640 2012
45 Belize 2,044 2014
46 Namibia 2,670 2013
Countries with depth of poverty 1–5%
47 Guatemala 821 2013
48 Sudan 285 2013
49 Philippines 1,197 2013
50 Saint Lucia 2,653 2010
51 Suriname 3,819 2013
53 Bolivia 2,074 2012
FIGURE 3.14
Grants are an important source of revenue for many of the countries where poverty is deepest
Government revenues per person and breakdown by type of revenue
0 25 50 75 100
0 25 50 75 100
KEY
Indire
ct ta
xes
Direct
taxe
s
Trad
e tax
es
Other
taxe
s
Other
reve
nue
Reso
urce
reve
nue
Grant
s
Government non-grant revenue, PPP$ per capita
(constant 2012 prices) Latest
year
Domestic public revenues,
% of total
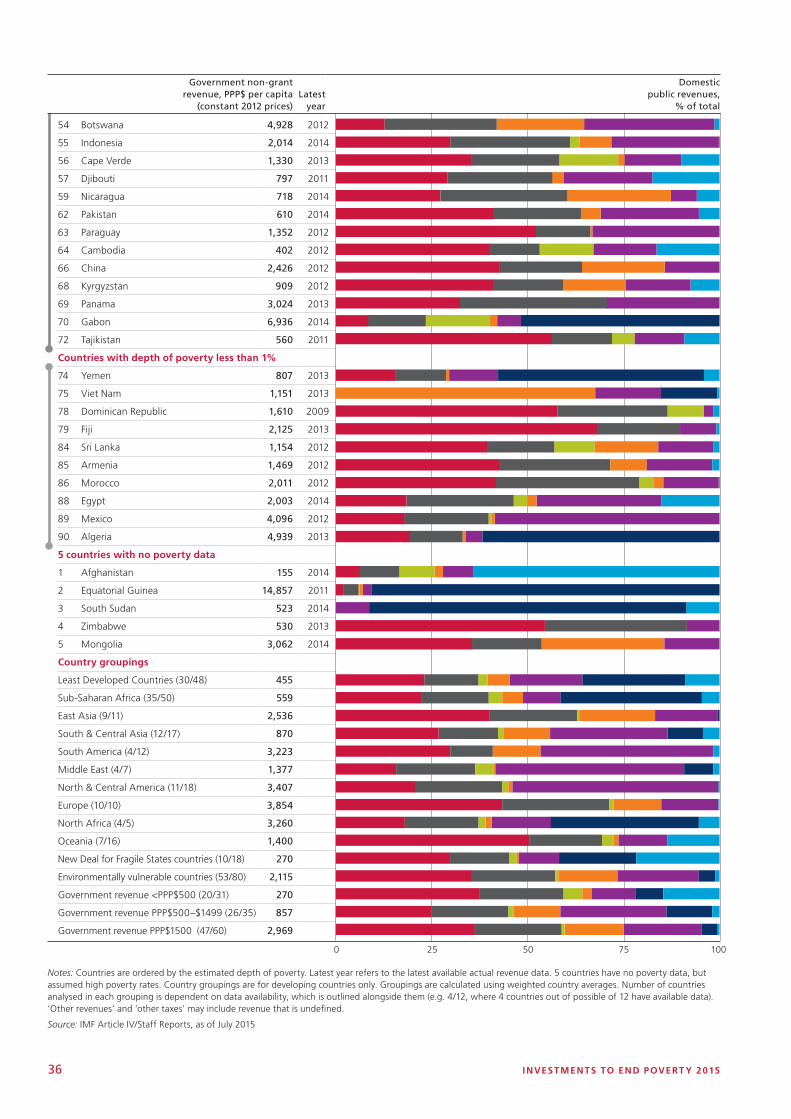
36 INVESTMENTS TO END POVERT Y 2015
54 Botswana 4,928 2012
55 Indonesia 2,014 2014
56 Cape Verde 1,330 2013
57 Djibouti 797 2011
59 Nicaragua 718 2014
62 Pakistan 610 2014
63 Paraguay 1,352 2012
64 Cambodia 402 2012
66 China 2,426 2012
68 Kyrgyzstan 909 2012
69 Panama 3,024 2013
70 Gabon 6,936 2014
72 Tajikistan 560 2011
Countries with depth of poverty less than 1%
74 Yemen 807 2013
75 Viet Nam 1,151 2013
78 Dominican Republic 1,610 2009
79 Fiji 2,125 2013
84 Sri Lanka 1,154 2012
85 Armenia 1,469 2012
86 Morocco 2,011 2012
88 Egypt 2,003 2014
89 Mexico 4,096 2012
90 Algeria 4,939 2013
5 countries with no poverty data
1 Afghanistan 155 2014
2 Equatorial Guinea 14,857 2011
3 South Sudan 523 2014
4 Zimbabwe 530 2013
5 Mongolia 3,062 2014
Country groupings
Least Developed Countries (30/48) 455
Sub-Saharan Africa (35/50) 559
East Asia (9/11) 2,536
South & Central Asia (12/17) 870
South America (4/12) 3,223
Middle East (4/7) 1,377
North & Central America (11/18) 3,407
Europe (10/10) 3,854
North Africa (4/5) 3,260
Oceania (7/16) 1,400
New Deal for Fragile States countries (10/18) 270
Environmentally vulnerable countries (53/80) 2,115
Government revenue <PPP$500 (20/31) 270
Government revenue PPP$500–$1499 (26/35) 857
Government revenue PPP$1500 (47/60) 2,969
Notes: Countries are ordered by the estimated depth of poverty. Latest year refers to the latest available actual revenue data. 5 countries have no poverty data, but assumed high poverty rates. Country groupings are for developing countries only. Groupings are calculated using weighted country averages. Number of countries analysed in each grouping is dependent on data availability, which is outlined alongside them (e.g. 4/12, where 4 countries out of possible of 12 have available data). ‘Other revenues’ and ‘other taxes’ may include revenue that is undefined.
Source: IMF Article IV/Staff Reports, as of July 2015
0 25 50 75 100
0 25 50 75 100
KEY
Indire
ct ta
xes
Direct
taxe
s
Trad
e tax
es
Other
taxe
s
Other
reve
nue
Reso
urce
reve
nue
Grant
s
Government non-grant revenue, PPP$ per capita
(constant 2012 prices) Latest
year
Domestic public revenues,
% of total

CHAP TER 4 INTERNAT IONAL OFF ICIAL F INANCE 37
4
International official finance• We need greater visibility on all official finance instruments to have
informed debate about the comparative advantage of each type of finance in different contexts.
• An ‘instrument neutral’ approach needs to be taken when deciding between different types of official financing, enabling the most appropriate type of finance to be deployed in each situation.
• Although ODA should be considered alongside other forms of finance, its focus on poverty and development means it will remain a unique and vital resource in the post-2015 era and international commitments on ODA are still important.
• Strengthening the mandate of ODA to target investments that explicitly benefit the poorest people would strengthen its role in ending poverty. Agencies with a specific mandate to tackle poverty allocate resources more effectively than agencies without such a mandate.
• We need to understand both the needs and the impact of flows on specific goals so they can be better targeted. ODA marked as supporting climate change adaptation often does not go to the countries considered most vulnerable, and the direct and indirect impact of global public goods on poverty can be difficult to assess.
• As well as targeting poverty directly, official finance can act as a catalyst. There is scope for increasingly support to domestic resource mobilisation to enable developing countries to enhance their own ability to tackle poverty within their borders.
• Development cooperation from other government providers will play an important role toward the goal of ending poverty. Greater visibility and principles for accounting and reporting can support progress in decision-making, technical capacity and effective partnerships.
CHAP TER 4 INTERNAT IONAL OFF ICIAL F INANCE 37
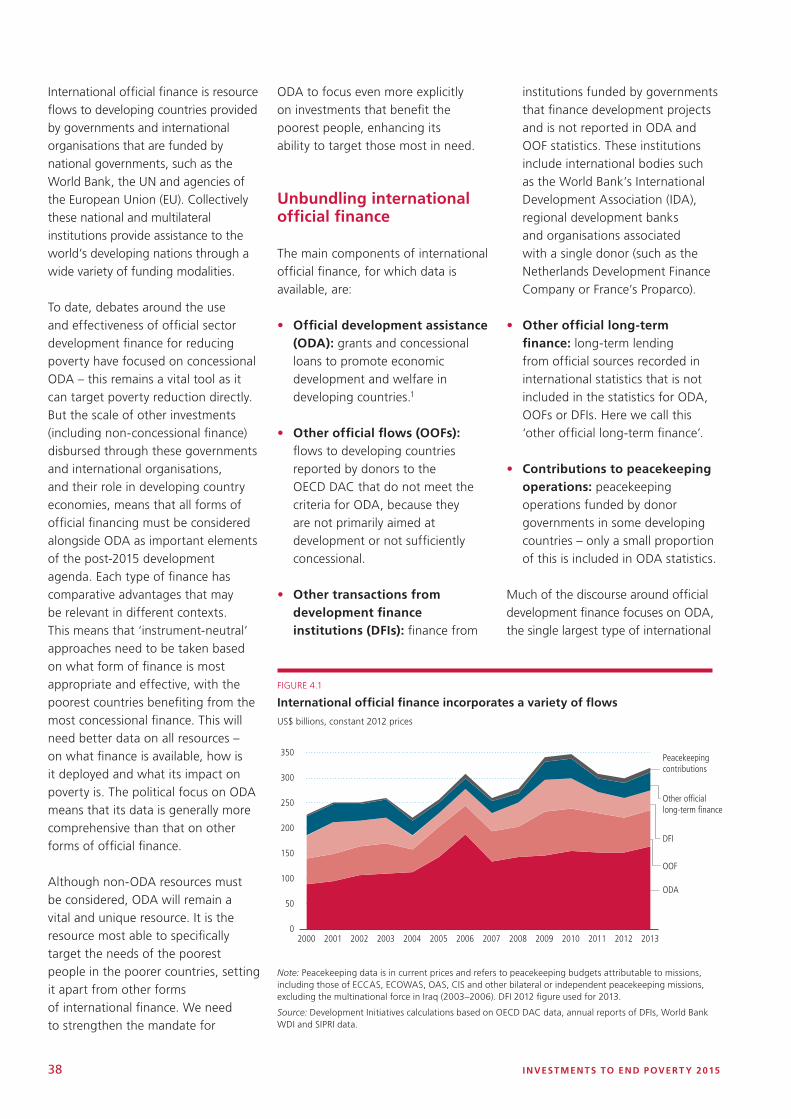
38 INVESTMENTS TO END POVERT Y 2015
International official finance is resource flows to developing countries provided by governments and international organisations that are funded by national governments, such as the World Bank, the UN and agencies of the European Union (EU). Collectively these national and multilateral institutions provide assistance to the world’s developing nations through a wide variety of funding modalities.
To date, debates around the use and effectiveness of official sector development finance for reducing poverty have focused on concessional ODA – this remains a vital tool as it can target poverty reduction directly. But the scale of other investments (including non-concessional finance) disbursed through these governments and international organisations, and their role in developing country economies, means that all forms of official financing must be considered alongside ODA as important elements of the post-2015 development agenda. Each type of finance has comparative advantages that may be relevant in different contexts. This means that ‘instrument-neutral’ approaches need to be taken based on what form of finance is most appropriate and effective, with the poorest countries benefiting from the most concessional finance. This will need better data on all resources – on what finance is available, how is it deployed and what its impact on poverty is. The political focus on ODA means that its data is generally more comprehensive than that on other forms of official finance.
Although non-ODA resources must be considered, ODA will remain a vital and unique resource. It is the resource most able to specifically target the needs of the poorest people in the poorer countries, setting it apart from other forms of international finance. We need to strengthen the mandate for
0
50
100
150
200
250
300
350
400
2000 2001 2002 2003 2004 2005 2006 2007 2008 2009 2010 2011 2012 2013
ODA
OOF
DFI
Peacekeepingcontributions
Other of�cial long-term �nance
FIGURE 4.1
International official finance incorporates a variety of flows
US$ billions, constant 2012 prices
Note: Peacekeeping data is in current prices and refers to peacekeeping budgets attributable to missions, including those of ECCAS, ECOWAS, OAS, CIS and other bilateral or independent peacekeeping missions, excluding the multinational force in Iraq (2003–2006). DFI 2012 figure used for 2013.
Source: Development Initiatives calculations based on OECD DAC data, annual reports of DFIs, World Bank WDI and SIPRI data.
ODA to focus even more explicitly on investments that benefit the poorest people, enhancing its ability to target those most in need.
Unbundling international official finance
The main components of international official finance, for which data is available, are:
• Official development assistance (ODA): grants and concessional loans to promote economic development and welfare in developing countries.1
• Other official flows (OOFs): flows to developing countries reported by donors to the OECD DAC that do not meet the criteria for ODA, because they are not primarily aimed at development or not sufficiently concessional.
• Other transactions from development finance institutions (DFIs): finance from
institutions funded by governments that finance development projects and is not reported in ODA and OOF statistics. These institutions include international bodies such as the World Bank’s International Development Association (IDA), regional development banks and organisations associated with a single donor (such as the Netherlands Development Finance Company or France’s Proparco).
• Other official long-term finance: long-term lending from official sources recorded in international statistics that is not included in the statistics for ODA, OOFs or DFIs. Here we call this ‘other official long-term finance’.
• Contributions to peacekeeping operations: peacekeeping operations funded by donor governments in some developing countries – only a small proportion of this is included in ODA statistics.
Much of the discourse around official development finance focuses on ODA, the single largest type of international
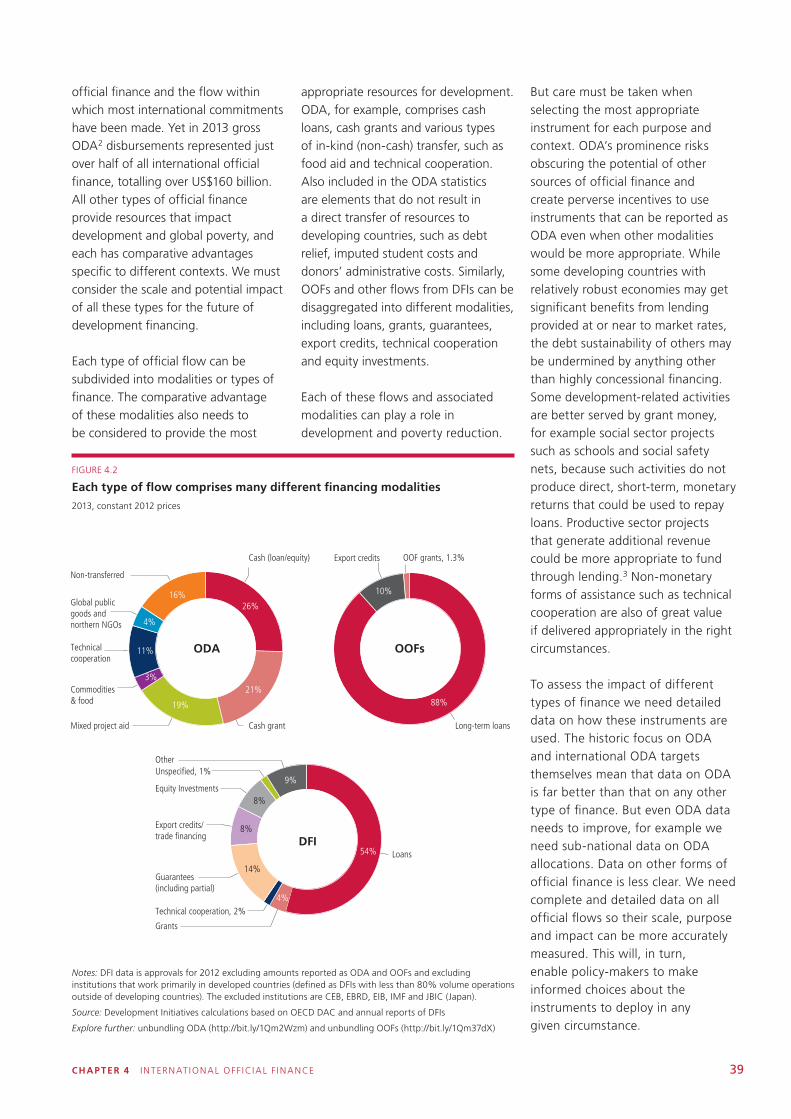
CHAP TER 4 INTERNAT IONAL OFF ICIAL F INANCE 39
official finance and the flow within which most international commitments have been made. Yet in 2013 gross ODA2 disbursements represented just over half of all international official finance, totalling over US$160 billion. All other types of official finance provide resources that impact development and global poverty, and each has comparative advantages specific to different contexts. We must consider the scale and potential impact of all these types for the future of development financing.
Each type of official flow can be subdivided into modalities or types of finance. The comparative advantage of these modalities also needs to be considered to provide the most
appropriate resources for development. ODA, for example, comprises cash loans, cash grants and various types of in-kind (non-cash) transfer, such as food aid and technical cooperation. Also included in the ODA statistics are elements that do not result in a direct transfer of resources to developing countries, such as debt relief, imputed student costs and donors’ administrative costs. Similarly, OOFs and other flows from DFIs can be disaggregated into different modalities, including loans, grants, guarantees, export credits, technical cooperation and equity investments.
Each of these flows and associated modalities can play a role in development and poverty reduction.
FIGURE 4.2
Each type of flow comprises many different financing modalities
2013, constant 2012 prices
Notes: DFI data is approvals for 2012 excluding amounts reported as ODA and OOFs and excluding institutions that work primarily in developed countries (defined as DFIs with less than 80% volume operations outside of developing countries). The excluded institutions are CEB, EBRD, EIB, IMF and JBIC (Japan).
Source: Development Initiatives calculations based on OECD DAC and annual reports of DFIs
Explore further: unbundling ODA (http://bit.ly/1Qm2Wzm) and unbundling OOFs (http://bit.ly/1Qm37dX)
Cash (loan/equity)
26%
Cash grant
21%
Mixed project aid
19%
Commodities & food
3%
Technical cooperation
11%
Global public goods and northern NGOs 4%
Non-transferred
16%
Loans54%
88%
Grants
4%Technical cooperation, 2%
Guarantees (including partial)
14%
Export credits/trade �nancing
8%
Equity Investments8%
Unspeci�ed, 1%Other
9%
Long-term loans
Export credits OOF grants, 1.3%
10%
ODA OOFs
DFI
But care must be taken when selecting the most appropriate instrument for each purpose and context. ODA’s prominence risks obscuring the potential of other sources of official finance and create perverse incentives to use instruments that can be reported as ODA even when other modalities would be more appropriate. While some developing countries with relatively robust economies may get significant benefits from lending provided at or near to market rates, the debt sustainability of others may be undermined by anything other than highly concessional financing. Some development-related activities are better served by grant money, for example social sector projects such as schools and social safety nets, because such activities do not produce direct, short-term, monetary returns that could be used to repay loans. Productive sector projects that generate additional revenue could be more appropriate to fund through lending.3 Non-monetary forms of assistance such as technical cooperation are also of great value if delivered appropriately in the right circumstances.
To assess the impact of different types of finance we need detailed data on how these instruments are used. The historic focus on ODA and international ODA targets themselves mean that data on ODA is far better than that on any other type of finance. But even ODA data needs to improve, for example we need sub-national data on ODA allocations. Data on other forms of official finance is less clear. We need complete and detailed data on all official flows so their scale, purpose and impact can be more accurately measured. This will, in turn, enable policy-makers to make informed choices about the instruments to deploy in any given circumstance.
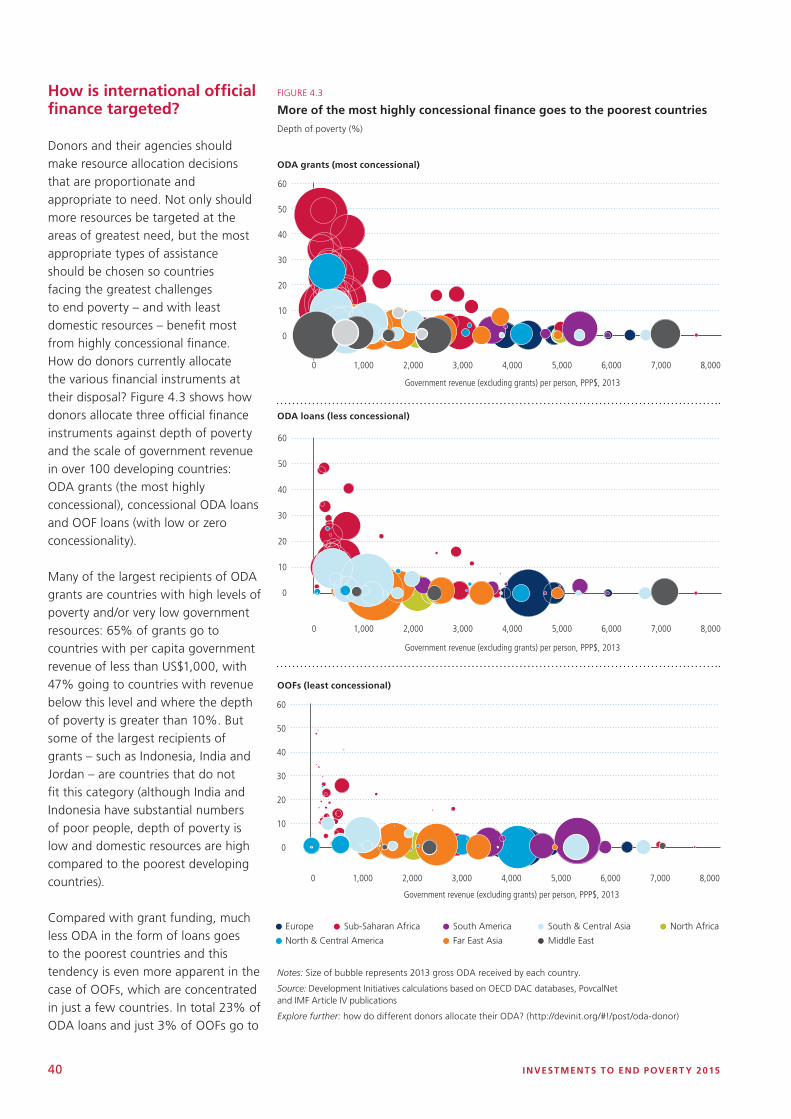
40 INVESTMENTS TO END POVERT Y 2015
How is international official finance targeted?
Donors and their agencies should make resource allocation decisions that are proportionate and appropriate to need. Not only should more resources be targeted at the areas of greatest need, but the most appropriate types of assistance should be chosen so countries facing the greatest challenges to end poverty – and with least domestic resources – benefit most from highly concessional finance. How do donors currently allocate the various financial instruments at their disposal? Figure 4.3 shows how donors allocate three official finance instruments against depth of poverty and the scale of government revenue in over 100 developing countries: ODA grants (the most highly concessional), concessional ODA loans and OOF loans (with low or zero concessionality).
Many of the largest recipients of ODA grants are countries with high levels of poverty and/or very low government resources: 65% of grants go to countries with per capita government revenue of less than US$1,000, with 47% going to countries with revenue below this level and where the depth of poverty is greater than 10%. But some of the largest recipients of grants – such as Indonesia, India and Jordan – are countries that do not fit this category (although India and Indonesia have substantial numbers of poor people, depth of poverty is low and domestic resources are high compared to the poorest developing countries).
Compared with grant funding, much less ODA in the form of loans goes to the poorest countries and this tendency is even more apparent in the case of OOFs, which are concentrated in just a few countries. In total 23% of ODA loans and just 3% of OOFs go to
0
10
20
30
40
50
60
0 1,000 2,000 3,000 4,000 5,000 6,000 7,000 8,000
0 1,000 2,000 3,000 4,000 5,000 6,000 7,000 8,000
0 1,000 2,000 3,000 4,000 5,000 6,000 7,000 8,000
Europe North AfricaSub-Saharan Africa
North & Central America
South America
Far East Asia
South & Central Asia
Middle East
0
10
20
30
40
50
60
Government revenue (excluding grants) per person, PPP$, 2013
Government revenue (excluding grants) per person, PPP$, 2013
Government revenue (excluding grants) per person, PPP$, 2013
0
10
20
30
40
50
60
0
10
20
30
40
50
60
0 1,000 2,000 3,000 4,000 5,000 6,000 7,000 8,000
0 1,000 2,000 3,000 4,000 5,000 6,000 7,000 8,000
0 1,000 2,000 3,000 4,000 5,000 6,000 7,000 8,000
Europe North AfricaSub-Saharan Africa
North & Central America
South America
Far East Asia
South & Central Asia
Middle East
0
10
20
30
40
50
60
Government revenue (excluding grants) per person, PPP$, 2013
Government revenue (excluding grants) per person, PPP$, 2013
Government revenue (excluding grants) per person, PPP$, 2013
0
10
20
30
40
50
60
FIGURE 4.3
More of the most highly concessional finance goes to the poorest countries
Depth of poverty (%)
ODA grants (most concessional)
Notes: Size of bubble represents 2013 gross ODA received by each country.
Source: Development Initiatives calculations based on OECD DAC databases, PovcalNet and IMF Article IV publications
Explore further: how do different donors allocate their ODA? (http://devinit.org/#!/post/oda-donor)
ODA loans (less concessional)
OOFs (least concessional)

CHAP TER 4 INTERNAT IONAL OFF ICIAL F INANCE 41
countries with per capita government revenue of less than US$1,000 and a depth of poverty greater than 10%.
Official finance can support the poorest countries to speed up poverty reduction (see Chapter 1), and work with rapidly growing countries to ensure no one is left behind. But with significant volumes of ODA grants going to countries with low levels of poverty, and significant concessional and non-concessional lending directed to countries with limited government revenues, they could be much better targeted. An improved system for allocating resources would allow the most concessional finance to be targeted to the countries facing the greatest challenges in ending poverty – and where local resources are not enough to either tackle poverty or repay large amounts of debt. Less concessional forms of finance can be used to boost the funds available to tackle poverty in countries with stronger economies. But under such a system, there may still be a rationale for using some highly concessional ODA in economically stronger developing countries where:
• it specifically targets the poorest people who would otherwise be left behind
• those people do not have access to services and wider resources in the country
• concessional ODA grants, rather than other forms of official finance, are the most appropriate instrument for reaching the poorest people.
ODA allocated by donor agencies
ODA providers follow different mandates that influence how they allocate ODA. The degree to which different ODA agencies – even those from the same donor country – focus on reducing poverty strongly determines how effective they are at doing so. Many donors allocate their ODA via a number of different donor agencies (such as separate government departments). For example, less than 60% of ODA from the US is managed by the United States Agency for International Development (USAID), while the rest comes from a further 30 government departments and specialist agencies including the State Department, the Department of Defense, the Millennium Challenge Corporation and the Peace Corps.
Some donor agencies have poverty reduction as a legal mandate, or at
least a stated primary goal. For other agencies, reducing poverty is less of a focus or not a specific goal at all.
Based on a review of the legal foundations and mission statements of 63 DAC donor agencies that report ODA to the OECD,4 agencies can be grouped according to the mandate they have with respect to ending poverty:
1. They have a legal mandate that specifies poverty reduction as a goal of development cooperation (six agencies)
2. Poverty reduction is the primary goal of development cooperation (21 agencies)
3. Poverty reduction is a stated joint goal alongside other goals of development cooperation (10 agencies)
4. Poverty reduction is not highlighted as a specific goal (13 agencies)
Agencies with a legal mandate to reduce poverty allocated more than half of their ODA in 2013 to countries with a depth of poverty of 10% or greater and 88% to countries where government revenue is less than PPP$1,000 per person. This highlights how sttrengthening the mandate for providing ODA can improve its targeting.
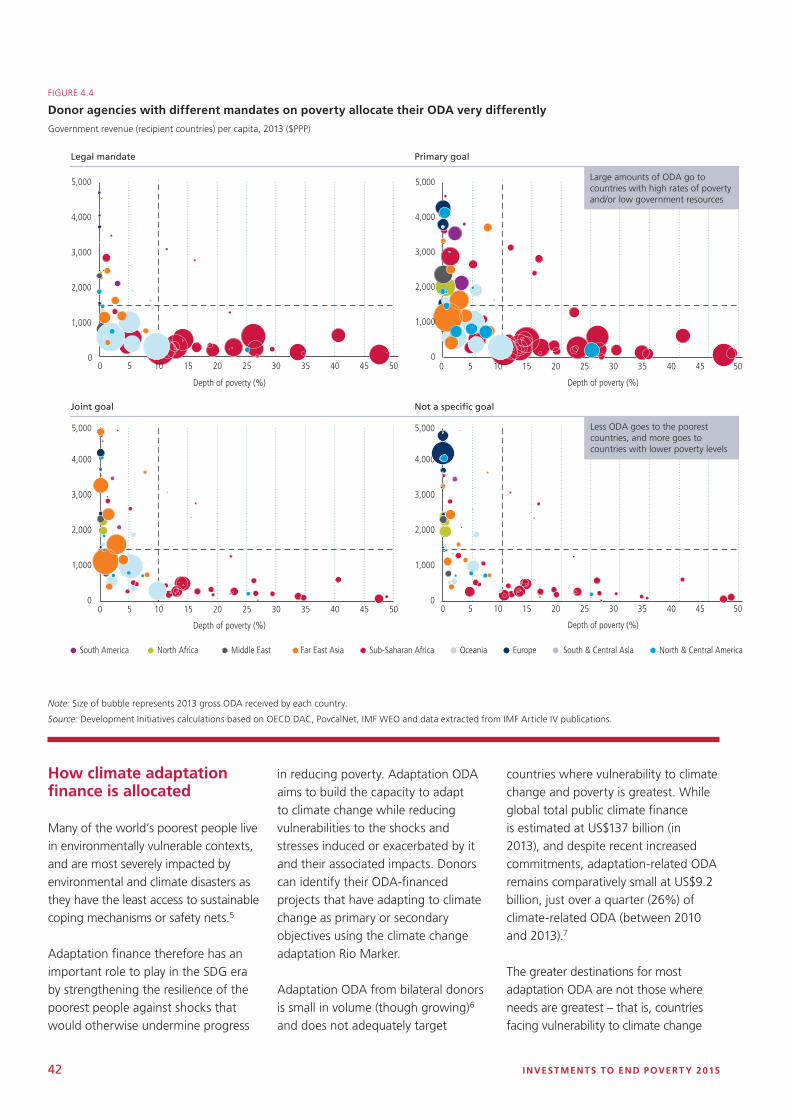
42 INVESTMENTS TO END POVERT Y 2015
How climate adaptation finance is allocated
Many of the world’s poorest people live in environmentally vulnerable contexts, and are most severely impacted by environmental and climate disasters as they have the least access to sustainable coping mechanisms or safety nets.5
Adaptation finance therefore has an important role to play in the SDG era by strengthening the resilience of the poorest people against shocks that would otherwise undermine progress
in reducing poverty. Adaptation ODA aims to build the capacity to adapt to climate change while reducing vulnerabilities to the shocks and stresses induced or exacerbated by it and their associated impacts. Donors can identify their ODA-financed projects that have adapting to climate change as primary or secondary objectives using the climate change adaptation Rio Marker.
Adaptation ODA from bilateral donors is small in volume (though growing)6 and does not adequately target
countries where vulnerability to climate change and poverty is greatest. While global total public climate finance is estimated at US$137 billion (in 2013), and despite recent increased commitments, adaptation-related ODA remains comparatively small at US$9.2 billion, just over a quarter (26%) of climate-related ODA (between 2010 and 2013).7
The greater destinations for most adaptation ODA are not those where needs are greatest – that is, countries facing vulnerability to climate change
FIGURE 4.4
Donor agencies with different mandates on poverty allocate their ODA very differently
Government revenue (recipient countries) per capita, 2013 ($PPP)
Note: Size of bubble represents 2013 gross ODA received by each country.
Source: Development Initiatives calculations based on OECD DAC, PovcalNet, IMF WEO and data extracted from IMF Article IV publications.
0
1,000
2,000
3,000
4,000
5,000
Legal mandate
Joint goal Not a speci�c goal
Primary goal
0 5 10 15 20 25 30 35 40 45 50
0 5 10 15 20 25 30 35 40 45 50
Depth of poverty (%) Depth of poverty (%)
Depth of poverty (%)
Sub-Saharan AfricaSouth America OceaniaNorth Africa EuropeMiddle East South & Central AsiaFar East Asia North & Central America
0
1,000
2,000
3,000
4,000
5,000
0 5 10 15 20 25 30 35 40 45 50
Depth of poverty (%)
0 5 10 15 20 25 30 35 40 45 500
1,000
2,000
3,000
4,000
5,000
0
1,000
2,000
3,000
4,000
5,000
Large amounts of ODA go to countries with high rates of poverty and/or low government resources
Less ODA goes to the poorest countries, and more goes to countries with lower poverty levels
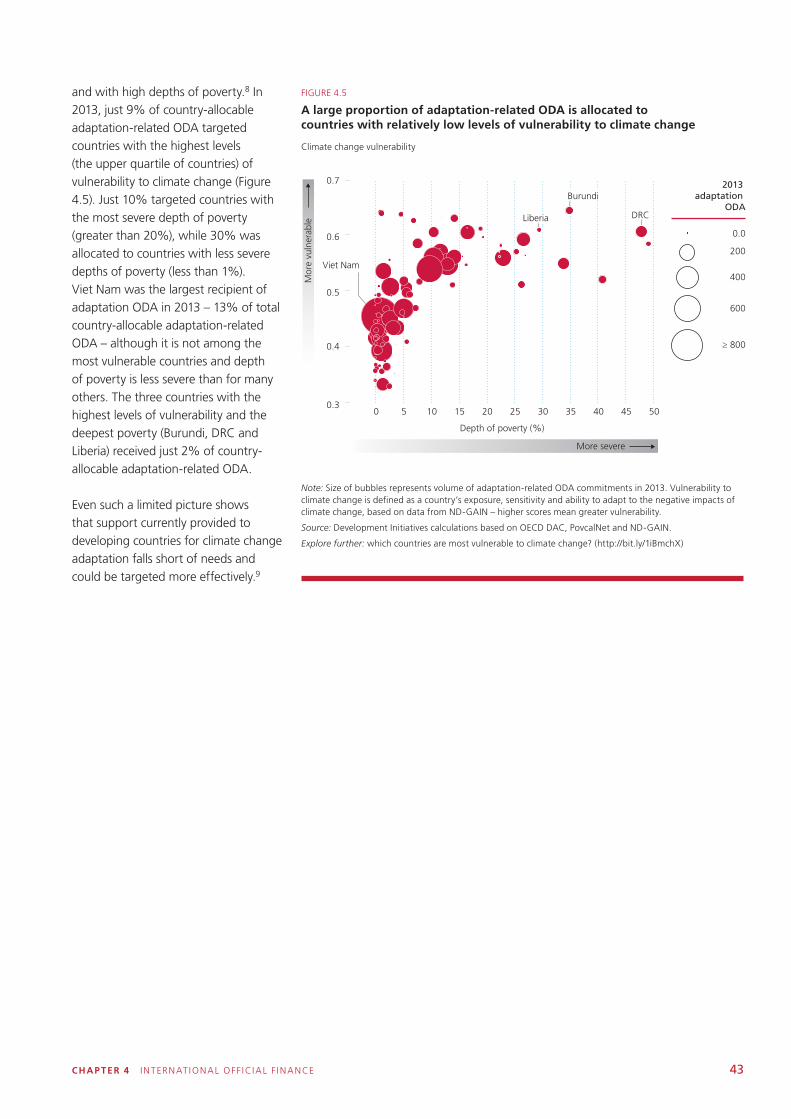
CHAP TER 4 INTERNAT IONAL OFF ICIAL F INANCE 43
and with high depths of poverty.8 In 2013, just 9% of country-allocable adaptation-related ODA targeted countries with the highest levels (the upper quartile of countries) of vulnerability to climate change (Figure 4.5). Just 10% targeted countries with the most severe depth of poverty (greater than 20%), while 30% was allocated to countries with less severe depths of poverty (less than 1%). Viet Nam was the largest recipient of adaptation ODA in 2013 – 13% of total country-allocable adaptation-related ODA – although it is not among the most vulnerable countries and depth of poverty is less severe than for many others. The three countries with the highest levels of vulnerability and the deepest poverty (Burundi, DRC and Liberia) received just 2% of country-allocable adaptation-related ODA.
Even such a limited picture shows that support currently provided to developing countries for climate change adaptation falls short of needs and could be targeted more effectively.9
0 5 10 15 20 25 30 35 40 50
Mor
e vu
lner
able
0.7
0.6
0.5
0.3
0.4
DRC
Burundi
Liberia
Viet Nam
2013 adaptation
ODA
0.0
200
400
600
≥ 800
Depth of poverty (%)
More severe
45
FIGURE 4.5
A large proportion of adaptation-related ODA is allocated to countries with relatively low levels of vulnerability to climate change
Climate change vulnerability
Note: Size of bubbles represents volume of adaptation-related ODA commitments in 2013. Vulnerability to climate change is defined as a country’s exposure, sensitivity and ability to adapt to the negative impacts of climate change, based on data from ND-GAIN – higher scores mean greater vulnerability.
Source: Development Initiatives calculations based on OECD DAC, PovcalNet and ND-GAIN.
Explore further: which countries are most vulnerable to climate change? (http://bit.ly/1iBmchX)
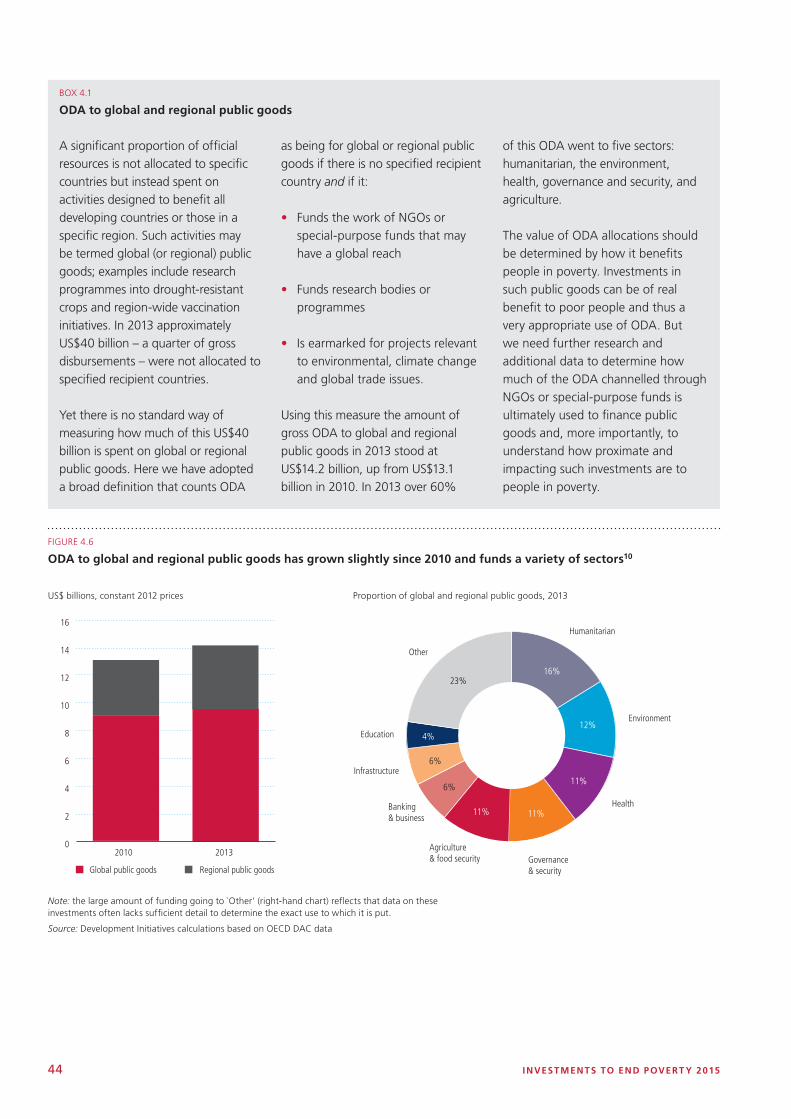
44 INVESTMENTS TO END POVERT Y 2015
0
2
4
6
8
10
12
14
16
2010 2013
Global public goods Regional public goods
Humanitarian
16%
Environment12%
Health
11%
Governance & security
11%
Agriculture & food security
11%Banking & business
6%
Infrastructure6%
Education 4%
Other
23%
FIGURE 4.6
ODA to global and regional public goods has grown slightly since 2010 and funds a variety of sectors10
Note: the large amount of funding going to `Other’ (right-hand chart) reflects that data on these investments often lacks sufficient detail to determine the exact use to which it is put.
Source: Development Initiatives calculations based on OECD DAC data
BOX 4.1
ODA to global and regional public goods
A significant proportion of official resources is not allocated to specific countries but instead spent on activities designed to benefit all developing countries or those in a specific region. Such activities may be termed global (or regional) public goods; examples include research programmes into drought-resistant crops and region-wide vaccination initiatives. In 2013 approximately US$40 billion – a quarter of gross disbursements – were not allocated to specified recipient countries.
Yet there is no standard way of measuring how much of this US$40 billion is spent on global or regional public goods. Here we have adopted a broad definition that counts ODA
as being for global or regional public goods if there is no specified recipient country and if it:
• Funds the work of NGOs or special-purpose funds that may have a global reach
• Funds research bodies or programmes
• Is earmarked for projects relevant to environmental, climate change and global trade issues.
Using this measure the amount of gross ODA to global and regional public goods in 2013 stood at US$14.2 billion, up from US$13.1 billion in 2010. In 2013 over 60%
of this ODA went to five sectors: humanitarian, the environment, health, governance and security, and agriculture.
The value of ODA allocations should be determined by how it benefits people in poverty. Investments in such public goods can be of real benefit to poor people and thus a very appropriate use of ODA. But we need further research and additional data to determine how much of the ODA channelled through NGOs or special-purpose funds is ultimately used to finance public goods and, more importantly, to understand how proximate and impacting such investments are to people in poverty.
US$ billions, constant 2012 prices Proportion of global and regional public goods, 2013
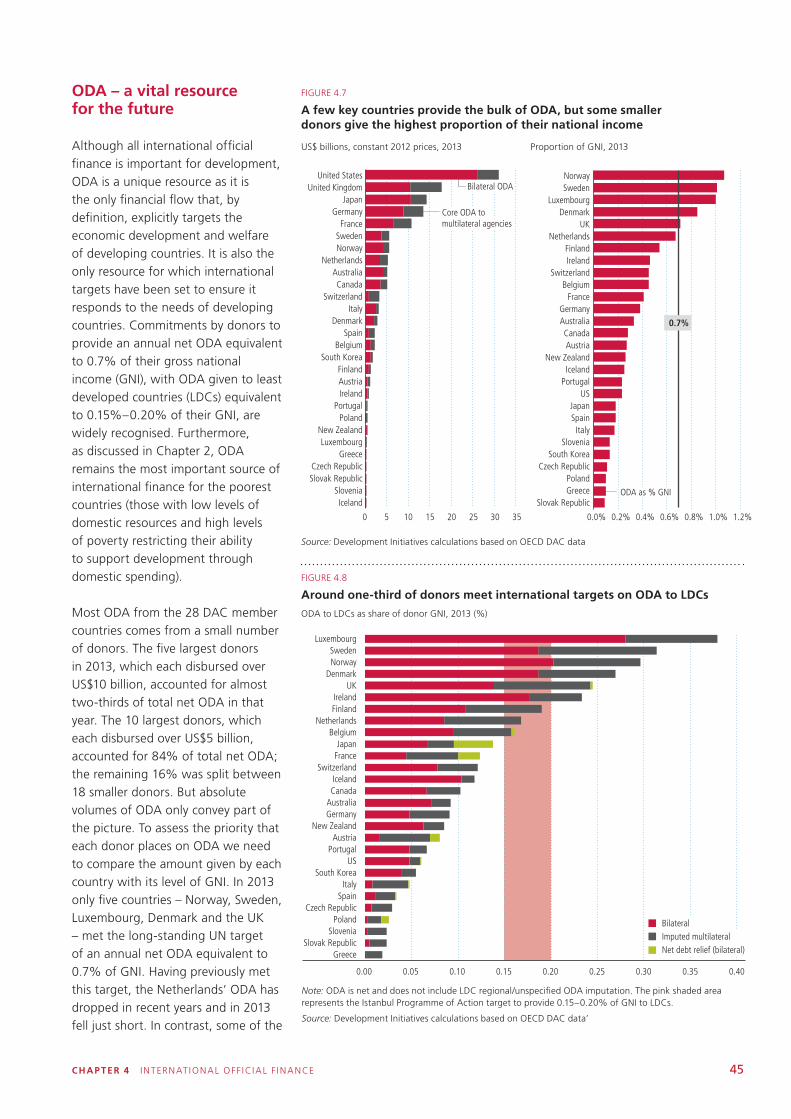
CHAP TER 4 INTERNAT IONAL OFF ICIAL F INANCE 45
ODA – a vital resource for the future
Although all international official finance is important for development, ODA is a unique resource as it is the only financial flow that, by definition, explicitly targets the economic development and welfare of developing countries. It is also the only resource for which international targets have been set to ensure it responds to the needs of developing countries. Commitments by donors to provide an annual net ODA equivalent to 0.7% of their gross national income (GNI), with ODA given to least developed countries (LDCs) equivalent to 0.15%–0.20% of their GNI, are widely recognised. Furthermore, as discussed in Chapter 2, ODA remains the most important source of international finance for the poorest countries (those with low levels of domestic resources and high levels of poverty restricting their ability to support development through domestic spending).
Most ODA from the 28 DAC member countries comes from a small number of donors. The five largest donors in 2013, which each disbursed over US$10 billion, accounted for almost two-thirds of total net ODA in that year. The 10 largest donors, which each disbursed over US$5 billion, accounted for 84% of total net ODA; the remaining 16% was split between 18 smaller donors. But absolute volumes of ODA only convey part of the picture. To assess the priority that each donor places on ODA we need to compare the amount given by each country with its level of GNI. In 2013 only five countries – Norway, Sweden, Luxembourg, Denmark and the UK – met the long-standing UN target of an annual net ODA equivalent to 0.7% of GNI. Having previously met this target, the Netherlands’ ODA has dropped in recent years and in 2013 fell just short. In contrast, some of the
0 5 10 15 20 25 30 35
IcelandSlovenia
Slovak RepublicCzech Republic
GreeceLuxembourg
New ZealandPoland
PortugalIrelandAustriaFinland
South KoreaBelgium
SpainDenmark
SwitzerlandItaly
CanadaAustralia
NetherlandsNorwaySwedenFrance
GermanyJapan
United KingdomUnited States
Bilateral ODA
Core ODA to multilateral agencies
0.0% 0.2% 0.4% 0.6% 0.8% 1.0% 1.2%
Slovak RepublicGreecePoland
Czech RepublicSouth Korea
SloveniaItaly
Spain
USJapan
PortugalIceland
New ZealandAustriaCanada
AustraliaGermany
FranceBelgium
SwitzerlandIrelandFinland
NetherlandsUK
DenmarkLuxembourg
SwedenNorway
0.7%
ODA as % GNI
FIGURE 4.7
A few key countries provide the bulk of ODA, but some smaller donors give the highest proportion of their national income
US$ billions, constant 2012 prices, 2013
Source: Development Initiatives calculations based on OECD DAC data
0.00 0.05 0.10 0.15 0.20 0.25 0.30 0.35 0.40
GreeceSlovak Republic
SloveniaPoland
Czech RepublicSpain
ItalySouth Korea
USPortugal
AustriaNew Zealand
GermanyAustraliaCanadaIceland
SwitzerlandFranceJapan
BelgiumNetherlands
FinlandIreland
UKDenmark
NorwaySweden
Luxembourg
BilateralImputed multilateralNet debt relief (bilateral)
FIGURE 4.8
Around one-third of donors meet international targets on ODA to LDCs
ODA to LDCs as share of donor GNI, 2013 (%)
Note: ODA is net and does not include LDC regional/unspecified ODA imputation. The pink shaded area represents the Istanbul Programme of Action target to provide 0.15–0.20% of GNI to LDCs.
Source: Development Initiatives calculations based on OECD DAC data’
Proportion of GNI, 2013
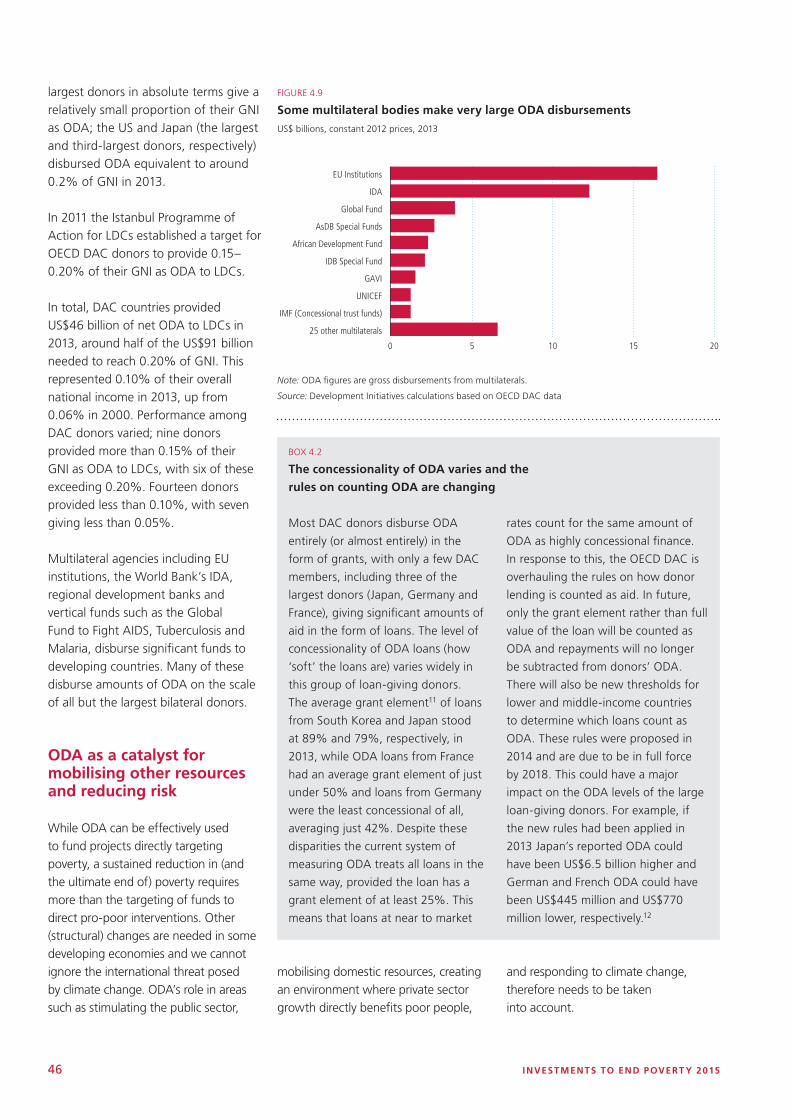
46 INVESTMENTS TO END POVERT Y 2015
25 other multilaterals
IMF (Concessional trust funds)
UNICEF
GAVI
IDB Special Fund
African Development Fund
AsDB Special Funds
Global Fund
IDA
EU Institutions
0 5 10 15 20
FIGURE 4.9
Some multilateral bodies make very large ODA disbursements
US$ billions, constant 2012 prices, 2013
Note: ODA figures are gross disbursements from multilaterals.
Source: Development Initiatives calculations based on OECD DAC data
largest donors in absolute terms give a relatively small proportion of their GNI as ODA; the US and Japan (the largest and third-largest donors, respectively) disbursed ODA equivalent to around 0.2% of GNI in 2013.
In 2011 the Istanbul Programme of Action for LDCs established a target for OECD DAC donors to provide 0.15–0.20% of their GNI as ODA to LDCs.
In total, DAC countries provided US$46 billion of net ODA to LDCs in 2013, around half of the US$91 billion needed to reach 0.20% of GNI. This represented 0.10% of their overall national income in 2013, up from 0.06% in 2000. Performance among DAC donors varied; nine donors provided more than 0.15% of their GNI as ODA to LDCs, with six of these exceeding 0.20%. Fourteen donors provided less than 0.10%, with seven giving less than 0.05%.
Multilateral agencies including EU institutions, the World Bank’s IDA, regional development banks and vertical funds such as the Global Fund to Fight AIDS, Tuberculosis and Malaria, disburse significant funds to developing countries. Many of these disburse amounts of ODA on the scale of all but the largest bilateral donors.
ODA as a catalyst for mobilising other resources and reducing risk
While ODA can be effectively used to fund projects directly targeting poverty, a sustained reduction in (and the ultimate end of) poverty requires more than the targeting of funds to direct pro-poor interventions. Other (structural) changes are needed in some developing economies and we cannot ignore the international threat posed by climate change. ODA’s role in areas such as stimulating the public sector,
BOX 4.2
The concessionality of ODA varies and the
rules on counting ODA are changing
Most DAC donors disburse ODA
entirely (or almost entirely) in the
form of grants, with only a few DAC
members, including three of the
largest donors (Japan, Germany and
France), giving significant amounts of
aid in the form of loans. The level of
concessionality of ODA loans (how
‘soft’ the loans are) varies widely in
this group of loan-giving donors.
The average grant element11 of loans
from South Korea and Japan stood
at 89% and 79%, respectively, in
2013, while ODA loans from France
had an average grant element of just
under 50% and loans from Germany
were the least concessional of all,
averaging just 42%. Despite these
disparities the current system of
measuring ODA treats all loans in the
same way, provided the loan has a
grant element of at least 25%. This
means that loans at near to market
rates count for the same amount of
ODA as highly concessional finance.
In response to this, the OECD DAC is
overhauling the rules on how donor
lending is counted as aid. In future,
only the grant element rather than full
value of the loan will be counted as
ODA and repayments will no longer
be subtracted from donors’ ODA.
There will also be new thresholds for
lower and middle-income countries
to determine which loans count as
ODA. These rules were proposed in
2014 and are due to be in full force
by 2018. This could have a major
impact on the ODA levels of the large
loan-giving donors. For example, if
the new rules had been applied in
2013 Japan’s reported ODA could
have been US$6.5 billion higher and
German and French ODA could have
been US$445 million and US$770
million lower, respectively.12
mobilising domestic resources, creating an environment where private sector growth directly benefits poor people,
and responding to climate change, therefore needs to be taken into account.
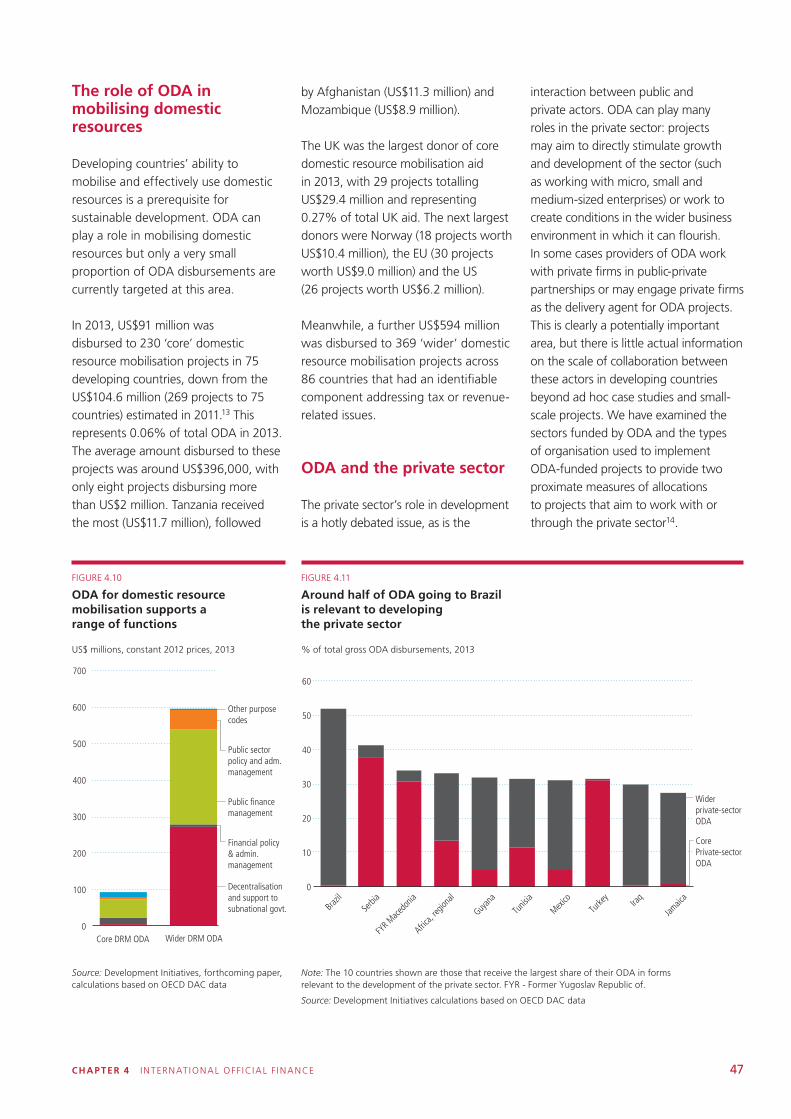
CHAP TER 4 INTERNAT IONAL OFF ICIAL F INANCE 47
The role of ODA in mobilising domestic resources
Developing countries’ ability to mobilise and effectively use domestic resources is a prerequisite for sustainable development. ODA can play a role in mobilising domestic resources but only a very small proportion of ODA disbursements are currently targeted at this area.
In 2013, US$91 million was disbursed to 230 ‘core’ domestic resource mobilisation projects in 75 developing countries, down from the US$104.6 million (269 projects to 75 countries) estimated in 2011.13 This represents 0.06% of total ODA in 2013. The average amount disbursed to these projects was around US$396,000, with only eight projects disbursing more than US$2 million. Tanzania received the most (US$11.7 million), followed
by Afghanistan (US$11.3 million) and Mozambique (US$8.9 million).
The UK was the largest donor of core domestic resource mobilisation aid in 2013, with 29 projects totalling US$29.4 million and representing 0.27% of total UK aid. The next largest donors were Norway (18 projects worth US$10.4 million), the EU (30 projects worth US$9.0 million) and the US (26 projects worth US$6.2 million).
Meanwhile, a further US$594 million was disbursed to 369 ‘wider’ domestic resource mobilisation projects across 86 countries that had an identifiable component addressing tax or revenue-related issues.
ODA and the private sector
The private sector’s role in development is a hotly debated issue, as is the
interaction between public and private actors. ODA can play many roles in the private sector: projects may aim to directly stimulate growth and development of the sector (such as working with micro, small and medium-sized enterprises) or work to create conditions in the wider business environment in which it can flourish. In some cases providers of ODA work with private firms in public-private partnerships or may engage private firms as the delivery agent for ODA projects. This is clearly a potentially important area, but there is little actual information on the scale of collaboration between these actors in developing countries beyond ad hoc case studies and small-scale projects. We have examined the sectors funded by ODA and the types of organisation used to implement ODA-funded projects to provide two proximate measures of allocations to projects that aim to work with or through the private sector14.
0
100
200
300
400
500
600
700
Core DRM ODA Wider DRM ODA
Other purpose codes
Public sector policy and adm. management
Public �nance management
Financial policy & admin. management
Decentralisation and support to subnational govt.
FIGURE 4.10
ODA for domestic resource mobilisation supports a range of functions
US$ millions, constant 2012 prices, 2013
FIGURE 4.11
Around half of ODA going to Brazil is relevant to developing the private sector
% of total gross ODA disbursements, 2013
Source: Development Initiatives, forthcoming paper, calculations based on OECD DAC data
0
10
20
30
40
50
60
Brazil
Serbi
a
FYR M
acedo
nia
Africa,
region
al
Guyan
a
Tunis
ia
Mexico
Turke
yIra
q
Jamaic
a
Wider private-sector ODA
Core Private-sector ODA
Note: The 10 countries shown are those that receive the largest share of their ODA in forms relevant to the development of the private sector. FYR - Former Yugoslav Republic of.
Source: Development Initiatives calculations based on OECD DAC data
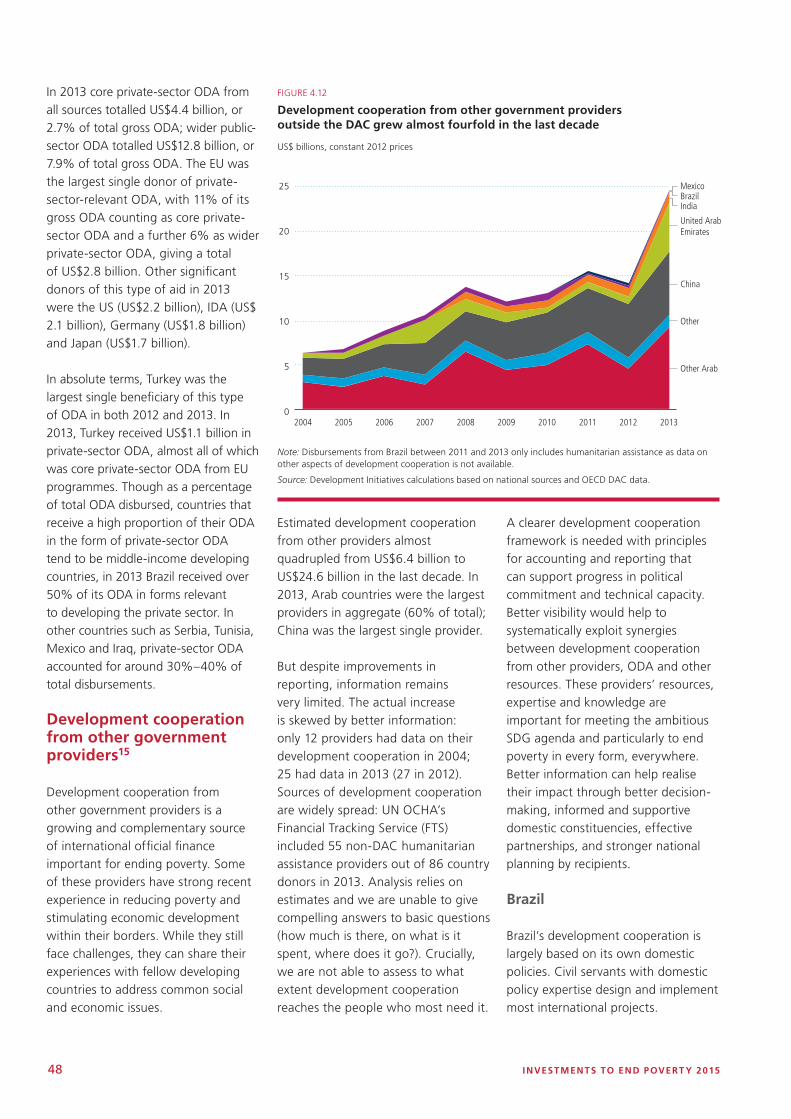
48 INVESTMENTS TO END POVERT Y 2015
In 2013 core private-sector ODA from all sources totalled US$4.4 billion, or 2.7% of total gross ODA; wider public-sector ODA totalled US$12.8 billion, or 7.9% of total gross ODA. The EU was the largest single donor of private-sector-relevant ODA, with 11% of its gross ODA counting as core private-sector ODA and a further 6% as wider private-sector ODA, giving a total of US$2.8 billion. Other significant donors of this type of aid in 2013 were the US (US$2.2 billion), IDA (US$ 2.1 billion), Germany (US$1.8 billion) and Japan (US$1.7 billion).
In absolute terms, Turkey was the largest single beneficiary of this type of ODA in both 2012 and 2013. In 2013, Turkey received US$1.1 billion in private-sector ODA, almost all of which was core private-sector ODA from EU programmes. Though as a percentage of total ODA disbursed, countries that receive a high proportion of their ODA in the form of private-sector ODA tend to be middle-income developing countries, in 2013 Brazil received over 50% of its ODA in forms relevant to developing the private sector. In other countries such as Serbia, Tunisia, Mexico and Iraq, private-sector ODA accounted for around 30%–40% of total disbursements.
Development cooperation from other government providers15
Development cooperation from other government providers is a growing and complementary source of international official finance important for ending poverty. Some of these providers have strong recent experience in reducing poverty and stimulating economic development within their borders. While they still face challenges, they can share their experiences with fellow developing countries to address common social and economic issues.
0
5
10
15
20
25
US$ billion
MexicoBrazilIndia
United Arab Emirates
China
2004 2005 2006 2007 2008 2009 2010 2011 2012 2013
Other
Other Arab
FIGURE 4.12
Development cooperation from other government providers outside the DAC grew almost fourfold in the last decade
US$ billions, constant 2012 prices
Note: Disbursements from Brazil between 2011 and 2013 only includes humanitarian assistance as data on other aspects of development cooperation is not available.
Source: Development Initiatives calculations based on national sources and OECD DAC data.
Estimated development cooperation from other providers almost quadrupled from US$6.4 billion to US$24.6 billion in the last decade. In 2013, Arab countries were the largest providers in aggregate (60% of total); China was the largest single provider.
But despite improvements in reporting, information remains very limited. The actual increase is skewed by better information: only 12 providers had data on their development cooperation in 2004; 25 had data in 2013 (27 in 2012). Sources of development cooperation are widely spread: UN OCHA’s Financial Tracking Service (FTS) included 55 non-DAC humanitarian assistance providers out of 86 country donors in 2013. Analysis relies on estimates and we are unable to give compelling answers to basic questions (how much is there, on what is it spent, where does it go?). Crucially, we are not able to assess to what extent development cooperation reaches the people who most need it.
A clearer development cooperation framework is needed with principles for accounting and reporting that can support progress in political commitment and technical capacity. Better visibility would help to systematically exploit synergies between development cooperation from other providers, ODA and other resources. These providers’ resources, expertise and knowledge are important for meeting the ambitious SDG agenda and particularly to end poverty in every form, everywhere. Better information can help realise their impact through better decision-making, informed and supportive domestic constituencies, effective partnerships, and stronger national planning by recipients.
Brazil
Brazil’s development cooperation is largely based on its own domestic policies. Civil servants with domestic policy expertise design and implement most international projects.
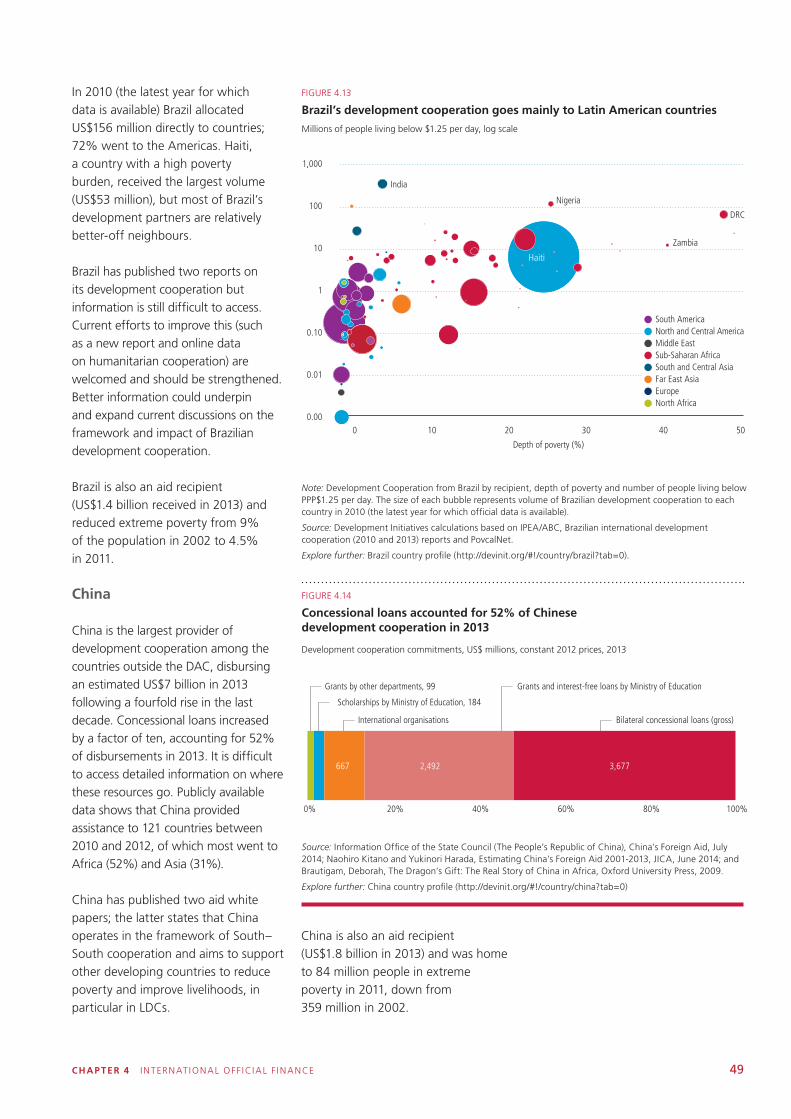
CHAP TER 4 INTERNAT IONAL OFF ICIAL F INANCE 49
In 2010 (the latest year for which data is available) Brazil allocated US$156 million directly to countries; 72% went to the Americas. Haiti, a country with a high poverty burden, received the largest volume (US$53 million), but most of Brazil’s development partners are relatively better-off neighbours.
Brazil has published two reports on its development cooperation but information is still difficult to access. Current efforts to improve this (such as a new report and online data on humanitarian cooperation) are welcomed and should be strengthened. Better information could underpin and expand current discussions on the framework and impact of Brazilian development cooperation.
Brazil is also an aid recipient (US$1.4 billion received in 2013) and reduced extreme poverty from 9% of the population in 2002 to 4.5% in 2011.
China
China is the largest provider of development cooperation among the countries outside the DAC, disbursing an estimated US$7 billion in 2013 following a fourfold rise in the last decade. Concessional loans increased by a factor of ten, accounting for 52% of disbursements in 2013. It is difficult to access detailed information on where these resources go. Publicly available data shows that China provided assistance to 121 countries between 2010 and 2012, of which most went to Africa (52%) and Asia (31%).
China has published two aid white papers; the latter states that China operates in the framework of South–South cooperation and aims to support other developing countries to reduce poverty and improve livelihoods, in particular in LDCs.
FIGURE 4.13
Brazil’s development cooperation goes mainly to Latin American countries
Millions of people living below $1.25 per day, log scale
FIGURE 4.14
Concessional loans accounted for 52% of Chinese development cooperation in 2013
Development cooperation commitments, US$ millions, constant 2012 prices, 2013
Haiti
DRC
Zambia
Nigeria
India
0.00
0.01
0.10
1
10
100
1,000
0 10 20 30 40 50
Depth of poverty (%)
Number of people living below PPP$1.25 per day, millions, log scale
South AmericaNorth and Central AmericaMiddle EastSub-Saharan AfricaSouth and Central AsiaFar East AsiaEuropeNorth Africa
What di�erence in blues
Note: Development Cooperation from Brazil by recipient, depth of poverty and number of people living below PPP$1.25 per day. The size of each bubble represents volume of Brazilian development cooperation to each country in 2010 (the latest year for which official data is available).
Source: Development Initiatives calculations based on IPEA/ABC, Brazilian international development cooperation (2010 and 2013) reports and PovcalNet.
Explore further: Brazil country profile (http://devinit.org/#!/country/brazil?tab=0).
China is also an aid recipient (US$1.8 billion in 2013) and was home to 84 million people in extreme poverty in 2011, down from 359 million in 2002.
Source: Information Office of the State Council (The People’s Republic of China), China’s Foreign Aid, July 2014; Naohiro Kitano and Yukinori Harada, Estimating China’s Foreign Aid 2001-2013, JICA, June 2014; and Brautigam, Deborah, The Dragon’s Gift: The Real Story of China in Africa, Oxford University Press, 2009.
Explore further: China country profile (http://devinit.org/#!/country/china?tab=0)
Technical and scienti�c Economic and �nancial
667 2,492 3,677
0% 20% 40% 60% 80% 100%
0% 20% 40% 60% 80% 100%
Scholarships by Ministry of Education, 184
International organisations Bilateral concessional loans (gross)
Grants by other departments, 99 Grants and interest-free loans by Ministry of Education
167 287 826
Other, 10.18
Interest subsidy for lines of credit, 12.78
International organisations
Loans and advances to foreign governments
Technical & economic cooperation with other countries
19 71 180
0% 10% 20% 30% 40% 50% 60% 70% 80% 90% 100%
Humanitarian assistance, 1
Education and cultural, 6
International organisations
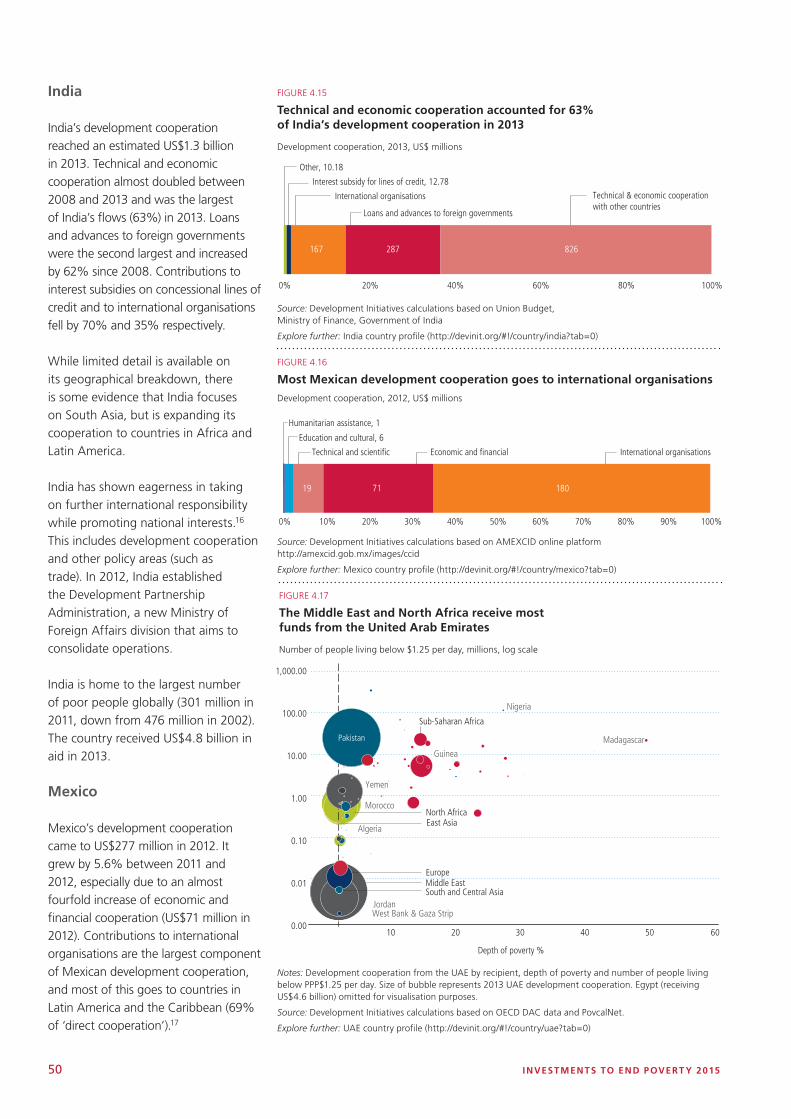
50 INVESTMENTS TO END POVERT Y 2015
India
India’s development cooperation reached an estimated US$1.3 billion in 2013. Technical and economic cooperation almost doubled between 2008 and 2013 and was the largest of India’s flows (63%) in 2013. Loans and advances to foreign governments were the second largest and increased by 62% since 2008. Contributions to interest subsidies on concessional lines of credit and to international organisations fell by 70% and 35% respectively.
While limited detail is available on its geographical breakdown, there is some evidence that India focuses on South Asia, but is expanding its cooperation to countries in Africa and Latin America.
India has shown eagerness in taking on further international responsibility while promoting national interests.16 This includes development cooperation and other policy areas (such as trade). In 2012, India established the Development Partnership Administration, a new Ministry of Foreign Affairs division that aims to consolidate operations.
India is home to the largest number of poor people globally (301 million in 2011, down from 476 million in 2002). The country received US$4.8 billion in aid in 2013.
Mexico
Mexico’s development cooperation came to US$277 million in 2012. It grew by 5.6% between 2011 and 2012, especially due to an almost fourfold increase of economic and financial cooperation (US$71 million in 2012). Contributions to international organisations are the largest component of Mexican development cooperation, and most of this goes to countries in Latin America and the Caribbean (69% of ‘direct cooperation’).17
Technical and scienti�c Economic and �nancial
667 2,492 3,677
0% 20% 40% 60% 80% 100%
0% 20% 40% 60% 80% 100%
Scholarships by Ministry of Education, 184
International organisations Bilateral concessional loans (gross)
Grants by other departments, 99 Grants and interest-free loans by Ministry of Education
167 287 826
Other, 10.18
Interest subsidy for lines of credit, 12.78
International organisations
Loans and advances to foreign governments
Technical & economic cooperation with other countries
19 71 180
0% 10% 20% 30% 40% 50% 60% 70% 80% 90% 100%
Humanitarian assistance, 1
Education and cultural, 6
International organisations
FIGURE 4.15
Technical and economic cooperation accounted for 63% of India’s development cooperation in 2013
Development cooperation, 2013, US$ millions
FIGURE 4.17
The Middle East and North Africa receive most funds from the United Arab Emirates
Number of people living below $1.25 per day, millions, log scale
FIGURE 4.16
Most Mexican development cooperation goes to international organisations
Development cooperation, 2012, US$ millions
Source: Development Initiatives calculations based on Union Budget, Ministry of Finance, Government of India
Explore further: India country profile (http://devinit.org/#!/country/india?tab=0)
Source: Development Initiatives calculations based on AMEXCID online platform http://amexcid.gob.mx/images/ccid
Explore further: Mexico country profile (http://devinit.org/#!/country/mexico?tab=0)
Jordan
Morocco
Algeria
Yemen
Guinea
Madagascar
Nigeria
0.00
0.01
0.10
1.00
10.00
100.00
1,000.00
10 20 30 40 50 60
Depth of poverty %
West Bank & Gaza Strip
Europe
East Asia
Middle East
North Africa
South and Central Asia
Sub-Saharan Africa
Pakistan
Notes: Development cooperation from the UAE by recipient, depth of poverty and number of people living below PPP$1.25 per day. Size of bubble represents 2013 UAE development cooperation. Egypt (receiving US$4.6 billion) omitted for visualisation purposes.
Source: Development Initiatives calculations based on OECD DAC data and PovcalNet.
Explore further: UAE country profile (http://devinit.org/#!/country/uae?tab=0)
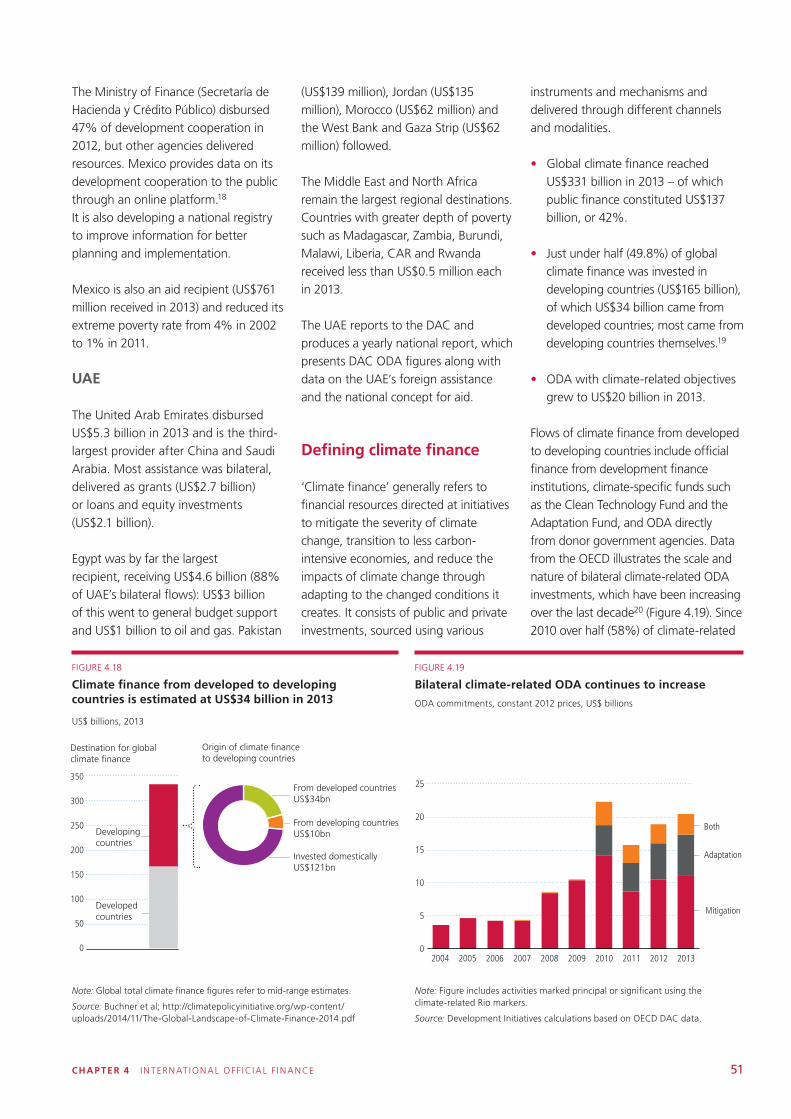
CHAP TER 4 INTERNAT IONAL OFF ICIAL F INANCE 51
The Ministry of Finance (Secretaría de Hacienda y Crédito Público) disbursed 47% of development cooperation in 2012, but other agencies delivered resources. Mexico provides data on its development cooperation to the public through an online platform.18 It is also developing a national registry to improve information for better planning and implementation.
Mexico is also an aid recipient (US$761 million received in 2013) and reduced its extreme poverty rate from 4% in 2002 to 1% in 2011.
UAE
The United Arab Emirates disbursed US$5.3 billion in 2013 and is the third-largest provider after China and Saudi Arabia. Most assistance was bilateral, delivered as grants (US$2.7 billion) or loans and equity investments (US$2.1 billion).
Egypt was by far the largest recipient, receiving US$4.6 billion (88% of UAE’s bilateral flows): US$3 billion of this went to general budget support and US$1 billion to oil and gas. Pakistan
(US$139 million), Jordan (US$135 million), Morocco (US$62 million) and the West Bank and Gaza Strip (US$62 million) followed.
The Middle East and North Africa remain the largest regional destinations. Countries with greater depth of poverty such as Madagascar, Zambia, Burundi, Malawi, Liberia, CAR and Rwanda received less than US$0.5 million each in 2013.
The UAE reports to the DAC and produces a yearly national report, which presents DAC ODA figures along with data on the UAE’s foreign assistance and the national concept for aid.
Defining climate finance
‘Climate finance’ generally refers to financial resources directed at initiatives to mitigate the severity of climate change, transition to less carbon-intensive economies, and reduce the impacts of climate change through adapting to the changed conditions it creates. It consists of public and private investments, sourced using various
instruments and mechanisms and delivered through different channels and modalities.
• Global climate finance reached US$331 billion in 2013 – of which public finance constituted US$137 billion, or 42%.
• Just under half (49.8%) of global climate finance was invested in developing countries (US$165 billion), of which US$34 billion came from developed countries; most came from developing countries themselves.19
• ODA with climate-related objectives grew to US$20 billion in 2013.
Flows of climate finance from developed to developing countries include official finance from development finance institutions, climate-specific funds such as the Clean Technology Fund and the Adaptation Fund, and ODA directly from donor government agencies. Data from the OECD illustrates the scale and nature of bilateral climate-related ODA investments, which have been increasing over the last decade20 (Figure 4.19). Since 2010 over half (58%) of climate-related
FIGURE 4.18
Climate finance from developed to developing countries is estimated at US$34 billion in 2013
US$ billions, 2013
FIGURE 4.19
Bilateral climate-related ODA continues to increase
ODA commitments, constant 2012 prices, US$ billions
Note: Figure includes activities marked principal or significant using the climate-related Rio markers.
Source: Development Initiatives calculations based on OECD DAC data.
2004 2005 2006 2007 2008 2009 2010 2011 2012 2013
Mitigation
Adaptation
Both
0
5
10
15
20
25
Destination for global climate �nance
Developing countries
Developedcountries
From developed countriesUS$34bn
From developing countriesUS$10bn
Invested domesticallyUS$121bn
Origin of climate �nance to developing countries
0
50
100
150
200
250
300
350
Note: Global total climate finance figures refer to mid-range estimates.
Source: Buchner et al; http://climatepolicyinitiative.org/wp-content/uploads/2014/11/The-Global-Landscape-of-Climate-Finance-2014.pdf
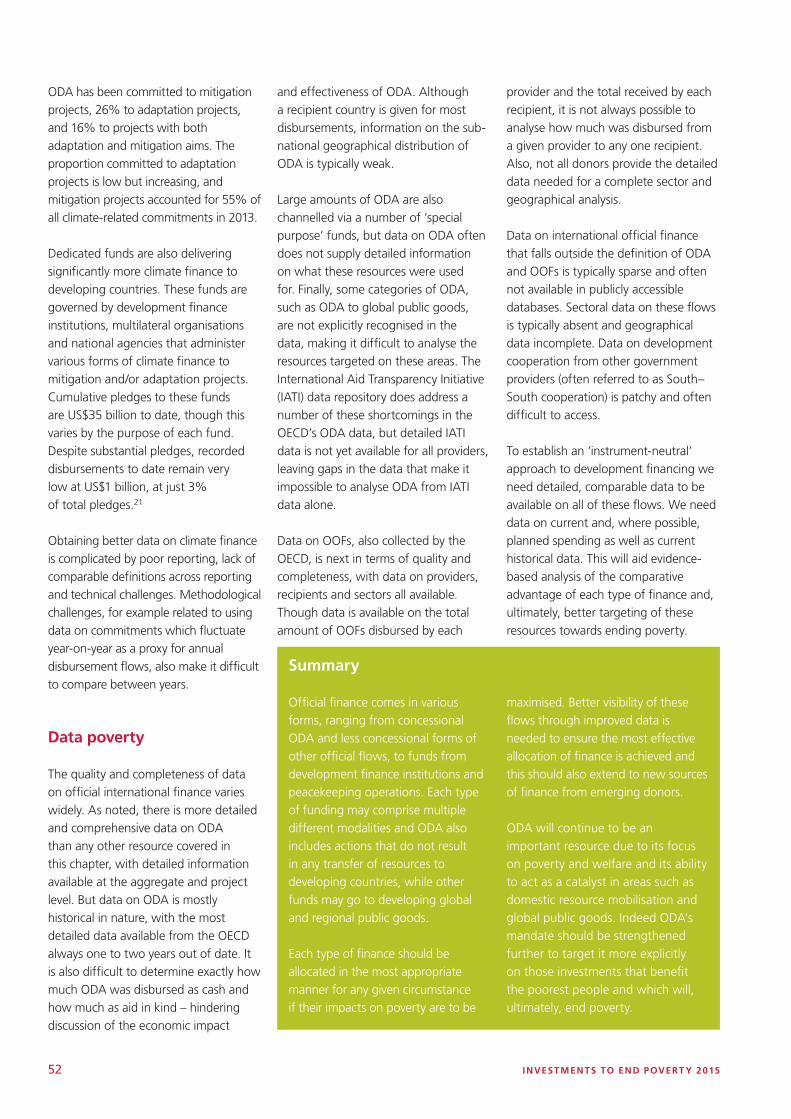
52 INVESTMENTS TO END POVERT Y 2015
ODA has been committed to mitigation projects, 26% to adaptation projects, and 16% to projects with both adaptation and mitigation aims. The proportion committed to adaptation projects is low but increasing, and mitigation projects accounted for 55% of all climate-related commitments in 2013.
Dedicated funds are also delivering significantly more climate finance to developing countries. These funds are governed by development finance institutions, multilateral organisations and national agencies that administer various forms of climate finance to mitigation and/or adaptation projects. Cumulative pledges to these funds are US$35 billion to date, though this varies by the purpose of each fund. Despite substantial pledges, recorded disbursements to date remain very low at US$1 billion, at just 3% of total pledges.21
Obtaining better data on climate finance is complicated by poor reporting, lack of comparable definitions across reporting and technical challenges. Methodological challenges, for example related to using data on commitments which fluctuate year-on-year as a proxy for annual disbursement flows, also make it difficult to compare between years.
Data poverty
The quality and completeness of data on official international finance varies widely. As noted, there is more detailed and comprehensive data on ODA than any other resource covered in this chapter, with detailed information available at the aggregate and project level. But data on ODA is mostly historical in nature, with the most detailed data available from the OECD always one to two years out of date. It is also difficult to determine exactly how much ODA was disbursed as cash and how much as aid in kind – hindering discussion of the economic impact
and effectiveness of ODA. Although a recipient country is given for most disbursements, information on the sub-national geographical distribution of ODA is typically weak.
Large amounts of ODA are also channelled via a number of ‘special purpose’ funds, but data on ODA often does not supply detailed information on what these resources were used for. Finally, some categories of ODA, such as ODA to global public goods, are not explicitly recognised in the data, making it difficult to analyse the resources targeted on these areas. The International Aid Transparency Initiative (IATI) data repository does address a number of these shortcomings in the OECD’s ODA data, but detailed IATI data is not yet available for all providers, leaving gaps in the data that make it impossible to analyse ODA from IATI data alone.
Data on OOFs, also collected by the OECD, is next in terms of quality and completeness, with data on providers, recipients and sectors all available. Though data is available on the total amount of OOFs disbursed by each
provider and the total received by each recipient, it is not always possible to analyse how much was disbursed from a given provider to any one recipient. Also, not all donors provide the detailed data needed for a complete sector and geographical analysis.
Data on international official finance that falls outside the definition of ODA and OOFs is typically sparse and often not available in publicly accessible databases. Sectoral data on these flows is typically absent and geographical data incomplete. Data on development cooperation from other government providers (often referred to as South–South cooperation) is patchy and often difficult to access.
To establish an ‘instrument-neutral’ approach to development financing we need detailed, comparable data to be available on all of these flows. We need data on current and, where possible, planned spending as well as current historical data. This will aid evidence-based analysis of the comparative advantage of each type of finance and, ultimately, better targeting of these resources towards ending poverty.
Summary
Official finance comes in various forms, ranging from concessional ODA and less concessional forms of other official flows, to funds from development finance institutions and peacekeeping operations. Each type of funding may comprise multiple different modalities and ODA also includes actions that do not result in any transfer of resources to developing countries, while other funds may go to developing global and regional public goods.
Each type of finance should be allocated in the most appropriate manner for any given circumstance if their impacts on poverty are to be
maximised. Better visibility of these flows through improved data is needed to ensure the most effective allocation of finance is achieved and this should also extend to new sources of finance from emerging donors.
ODA will continue to be an important resource due to its focus on poverty and welfare and its ability to act as a catalyst in areas such as domestic resource mobilisation and global public goods. Indeed ODA’s mandate should be strengthened further to target it more explicitly on those investments that benefit the poorest people and which will, ultimately, end poverty.
CHAP TER 5 DATA FOR DECIS ION - MAKING 53
5
• To end extreme poverty we need better and more data on people and resources so we can target the poorest people everywhere. Policy and decision-making can only be as good as the data that informs them.
• There are multiple sources of data – such as survey, administrative, big and citizen-generated data – that can be improved and used to inform policy and monitor progress in complementary ways.
• To inform the end of poverty, data needs to be:
• Disaggregated by gender, age, disability, income quintile and geographical location.
• Joined up across datasets so investments can be compared with the needs and their impact on the poorest people to track whether the right resources are benefitting the right people.
• For data to be used as a tool in decision-making:
• Countries must own and develop their own national data systems and thereby develop a culture of data use.
• The international community has a supporting role to play by investing in core statistical systems and data collection that reflects national priorities.
Data for decision-making
To achieve the end of poverty we need data on who and where people in poverty are,
how people experience poverty and the impact that different resources, investments and actions have on their lives. Data coverage and quality are not sufficient to accurately monitor progress of the sustainable development goal (SDG) of ‘ending poverty in all its forms everywhere’.1 We need investments in data collection, including baseline
data, to inform progress. Without this, efforts to reach the poorest people and make the investments needed to end poverty cannot be appropriately targeted and their success cannot be measured.
Different types of data can be drawn on and improved and used to meet these data gaps. Official data, particularly administrative and civil registration data, is central to identifying and targeting poor people. Countries should invest
in core national statistical systems that enhance progress and accountability on poverty reduction to ensure that data collected meets national and sub-national government needs and improves data use. Making data fit for use and developing a culture of data use are two key challenges to ensuring it can be used effectively to reduce poverty. The international community has a strong supporting role to play, aligning with national priorities in developing data systems.
CHAP TER 5 DATA FOR DECIS ION - MAKING 53
54 INVESTMENTS TO END POVERT Y 2015
The data provides an incomplete picture
There are large gaps in data on people’s needs, including who and where people in poverty are, the conditions that contribute to and keep them in poverty, and the type of poverty they are experiencing. Data tracking what and where investments are being made in developing countries is lacking, including who is benefiting from these investments and the impact they have directly on the poorest people.
Poverty data
Poverty data is typically based on surveys, and these are often infrequent and inconsistent across countries and years. For example, for 17 countries 2011 estimates of global extreme poverty measured as PPP $1.25/day incorporate data from surveys conducted in 2005 or earlier (see Chapter 1). For the 28 countries for which survey data is entirely missing, figures are derived from regional averages, which may bear little resemblance to actual country contexts (such as in the case of North Korea).2
Data disaggregated both by geographical location at sub-national level and by social group – which can be used to measure where progress is being achieved and by whom – is also lacking. Disaggregated data by age, gender, disability, income quintile and location would enable progress and inequalities to be tracked across groups. World Bank data on extreme poverty is not disaggregated by gender, which means we cannot accurately measure the progress of women compared with men. Data is lacking to monitor the poorest people’s progress, whether poverty is defined by income or other indicators of wellbeing, such as access to nutrition and health. Since 1998 only 0.6% of the benefits of economic growth worldwide have gone to the poorest
20% of the world’s population (see Chapter 1). Data disaggregated into quintiles for each indicator of wellbeing can help monitor the progress of the poorest 20% of people worldwide.
Data on domestic and international resources
Poor-quality data on domestic and international resources means that there are significant gaps in our understanding of the landscape of resources available, including both their scale and impact (see Annex and Chapters 2 to 4). It is not yet possible to accurately assess the comparative advantage of each resource in financing the end of poverty. Nor can we fully understand the roles that different resources play in reducing poverty or the interrelationships between them.
There is not enough data on domestic public resources, by far the largest resource, to understand where, when and for whose benefit they are being used. Comparable, timely data on domestic spending by sector is lacking, which means that government spending on education compared with agriculture, for example, cannot be accurately tracked across countries. And while most aspects of data on aid flows have improved since the MDGs, in particular the traceability of aid, data on wider forms of official finance are lacking. This makes it difficult to assess the scale of investments made, the financial instruments used, and how people are benefitting from these investments. In turn, this lack of data makes it difficult to fully assess the impact of different resources on people in poverty. Data on private finance is also partial; for example, there are no systems that comprehensively estimate the sectors in which foreign direct investment is being made. Better visibility on all forms of finance would help to systematically exploit synergies between the different providers of finance, both official and private.
Using different types of data to monitor progress
Multiple sources and types of data can be drawn on to improve our understanding of the scale and nature of poverty and how resources are impacting people’s lives. Consequently there is opportunity for a wide body of data to inform policymaking and resource allocation to support the goal of ending poverty.
Civil registration and vital statistics data
Civil registration and vital statistics data collected by national statistical offices captures basic information on people, such as births, deaths and marriages. Accurate civil registration and vital statistical data is essential for counting and locating people, a prerequisite for identifying who and where people in poverty are (see Box 5.1). Goal 16 of the SDGs includes the target of providing identity for all by 2030, including by birth registration.3 Yet comprehensive coverage of the civil registration of births is currently only available for 12 of 55 countries in Africa (see Figure 5.1).4
Administrative data
Administrative data is maintained by government departments to record their operations and interactions with citizens. It is the major source of information on access to services, on government spending and for outcome indicators such as school attendance and vaccination coverage. Administrative data can be a key way to identify and target poor people, and understand how resources are responding to needs. For example, in Uganda administrative data from the Ministry of Education on primary school performance can be used to analyse patterns in education outcomes, and combined with Ministry of Finance data on education funding (see Chapter 3). It is maintained on a
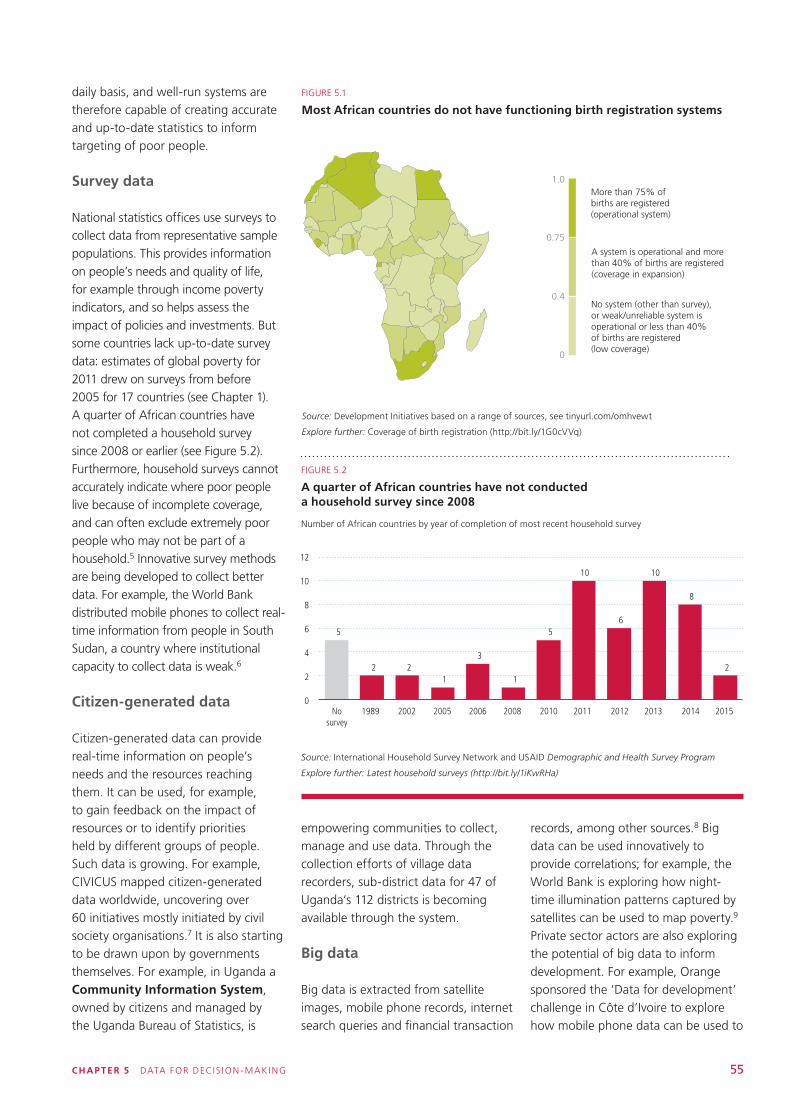
CHAP TER 5 DATA FOR DECIS ION - MAKING 55
daily basis, and well-run systems are therefore capable of creating accurate and up-to-date statistics to inform targeting of poor people.
Survey data
National statistics offices use surveys to collect data from representative sample populations. This provides information on people’s needs and quality of life, for example through income poverty indicators, and so helps assess the impact of policies and investments. But some countries lack up-to-date survey data: estimates of global poverty for 2011 drew on surveys from before 2005 for 17 countries (see Chapter 1). A quarter of African countries have not completed a household survey since 2008 or earlier (see Figure 5.2). Furthermore, household surveys cannot accurately indicate where poor people live because of incomplete coverage, and can often exclude extremely poor people who may not be part of a household.5 Innovative survey methods are being developed to collect better data. For example, the World Bank distributed mobile phones to collect real-time information from people in South Sudan, a country where institutional capacity to collect data is weak.6
Citizen-generated data
Citizen-generated data can provide real-time information on people’s needs and the resources reaching them. It can be used, for example, to gain feedback on the impact of resources or to identify priorities held by different groups of people. Such data is growing. For example, CIVICUS mapped citizen-generated data worldwide, uncovering over 60 initiatives mostly initiated by civil society organisations.7 It is also starting to be drawn upon by governments themselves. For example, in Uganda a Community Information System, owned by citizens and managed by the Uganda Bureau of Statistics, is
More than 75% of births are registered (operational system)
A system is operational and more than 40% of births are registered (coverage in expansion)
No system (other than survey), or weak/unreliable system is operational or less than 40% of births are registered (low coverage)
1.0
0.75
0.4
0
Source: Development Initiatives based on a range of sources, see tinyurl.com/omhvewt
Explore further: Coverage of birth registration (http://bit.ly/1G0cVVq)
FIGURE 5.1
Most African countries do not have functioning birth registration systems
5
2 21
3
1
5
10
6
10
8
2
0
2
4
6
8
10
12
Nosurvey
1989 2002 2005 2006 2008 2010 2011 2012 2013 2014 2015
Number of countries
FIGURE 5.2
A quarter of African countries have not conducted a household survey since 2008
Number of African countries by year of completion of most recent household survey
Source: International Household Survey Network and USAID Demographic and Health Survey Program
Explore further: Latest household surveys (http://bit.ly/1iKwRHa)
empowering communities to collect, manage and use data. Through the collection efforts of village data recorders, sub-district data for 47 of Uganda’s 112 districts is becoming available through the system.
Big data
Big data is extracted from satellite images, mobile phone records, internet search queries and financial transaction
records, among other sources.8 Big data can be used innovatively to provide correlations; for example, the World Bank is exploring how night-time illumination patterns captured by satellites can be used to map poverty.9 Private sector actors are also exploring the potential of big data to inform development. For example, Orange sponsored the ‘Data for development’ challenge in Côte d’Ivoire to explore how mobile phone data can be used to
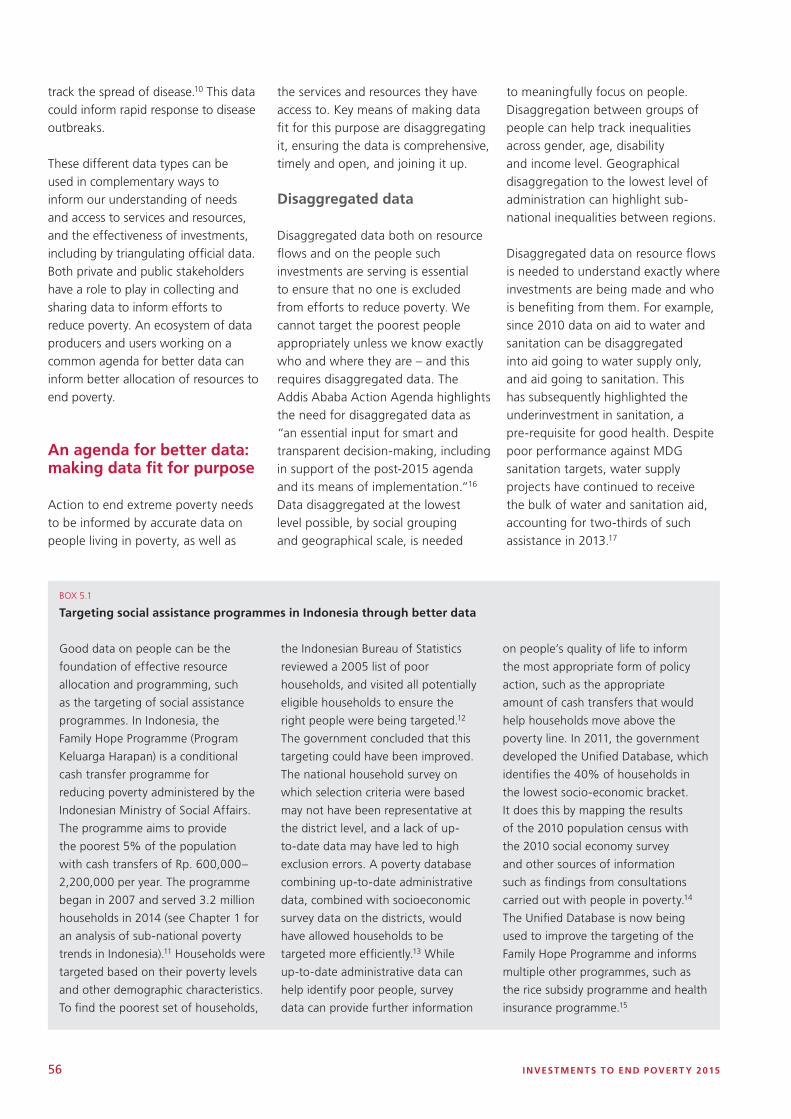
56 INVESTMENTS TO END POVERT Y 2015
track the spread of disease.10 This data could inform rapid response to disease outbreaks.
These different data types can be used in complementary ways to inform our understanding of needs and access to services and resources, and the effectiveness of investments, including by triangulating official data. Both private and public stakeholders have a role to play in collecting and sharing data to inform efforts to reduce poverty. An ecosystem of data producers and users working on a common agenda for better data can inform better allocation of resources to end poverty.
An agenda for better data: making data fit for purpose
Action to end extreme poverty needs to be informed by accurate data on people living in poverty, as well as
the services and resources they have access to. Key means of making data fit for this purpose are disaggregating it, ensuring the data is comprehensive, timely and open, and joining it up.
Disaggregated data
Disaggregated data both on resource flows and on the people such investments are serving is essential to ensure that no one is excluded from efforts to reduce poverty. We cannot target the poorest people appropriately unless we know exactly who and where they are – and this requires disaggregated data. The Addis Ababa Action Agenda highlights the need for disaggregated data as “an essential input for smart and transparent decision-making, including in support of the post-2015 agenda and its means of implementation.”16 Data disaggregated at the lowest level possible, by social grouping and geographical scale, is needed
to meaningfully focus on people. Disaggregation between groups of people can help track inequalities across gender, age, disability and income level. Geographical disaggregation to the lowest level of administration can highlight sub-national inequalities between regions.
Disaggregated data on resource flows is needed to understand exactly where investments are being made and who is benefiting from them. For example, since 2010 data on aid to water and sanitation can be disaggregated into aid going to water supply only, and aid going to sanitation. This has subsequently highlighted the underinvestment in sanitation, a pre-requisite for good health. Despite poor performance against MDG sanitation targets, water supply projects have continued to receive the bulk of water and sanitation aid, accounting for two-thirds of such assistance in 2013.17
BOX 5.1
Targeting social assistance programmes in Indonesia through better data
Good data on people can be the
foundation of effective resource
allocation and programming, such
as the targeting of social assistance
programmes. In Indonesia, the
Family Hope Programme (Program
Keluarga Harapan) is a conditional
cash transfer programme for
reducing poverty administered by the
Indonesian Ministry of Social Affairs.
The programme aims to provide
the poorest 5% of the population
with cash transfers of Rp. 600,000–
2,200,000 per year. The programme
began in 2007 and served 3.2 million
households in 2014 (see Chapter 1 for
an analysis of sub-national poverty
trends in Indonesia).11 Households were
targeted based on their poverty levels
and other demographic characteristics.
To find the poorest set of households,
the Indonesian Bureau of Statistics
reviewed a 2005 list of poor
households, and visited all potentially
eligible households to ensure the
right people were being targeted.12
The government concluded that this
targeting could have been improved.
The national household survey on
which selection criteria were based
may not have been representative at
the district level, and a lack of up-
to-date data may have led to high
exclusion errors. A poverty database
combining up-to-date administrative
data, combined with socioeconomic
survey data on the districts, would
have allowed households to be
targeted more efficiently.13 While
up-to-date administrative data can
help identify poor people, survey
data can provide further information
on people’s quality of life to inform
the most appropriate form of policy
action, such as the appropriate
amount of cash transfers that would
help households move above the
poverty line. In 2011, the government
developed the Unified Database, which
identifies the 40% of households in
the lowest socio-economic bracket.
It does this by mapping the results
of the 2010 population census with
the 2010 social economy survey
and other sources of information
such as findings from consultations
carried out with people in poverty.14
The Unified Database is now being
used to improve the targeting of the
Family Hope Programme and informs
multiple other programmes, such as
the rice subsidy programme and health
insurance programme.15

CHAP TER 5 DATA FOR DECIS ION - MAKING 57
Comprehensive data
To effectively manage and allocate resources to end poverty, national governments need to access information on the totality of investments made by aid donors, as well as other public and private stakeholders. In Nepal, the Aid Management Platform captures data on international resources for reducing poverty. Data from the national Aid Management Platform was used to inform the new Development Cooperation Policy in 2014, including setting minimum thresholds for how much aid can be funnelled into a single project.18 But it does not capture information on all resources, for example domestic contributions.19 Following the April 2015 earthquake, there was a lack of comprehensive data on all financial resources mobilised in response to the emergency.20 The Nepali organisation Young Innovations responded to this information gap by developing the Open Nepal Earthquake Portal to capture data about total pledged and disbursed relief funds and to share the data in a central platform. The Earthquake Portal takes data from a wide range of secondary sources, including the UN Office for the Coordination of Humanitarian Affairs’ Financial Tracking Service and media reports, and crowd sources information for additional flows. The data gathered reflects financial flows from other national governments, multilateral organisations and NGOs, as well as domestic sources, corporations and people.21
Timely data
Timely data is also important for poverty reduction policymaking. As noted above, poverty data in many countries is years out of date, meaning that aid agencies allocating resources for reducing poverty are unable to fully incorporate recent trends and changing
contexts into their decision-making. From a government’s perspective, timely and accurate forward-looking data is also important to enable planning and coordination of resources. Yet forward-looking data on planned aid spending was found to be insufficient for budget preparation by 59% of respondents in a 2014 survey (see Box 5.2 for an example on Canada’s aid).22
Open data
Open data – data published in a common, open format with an open licence to enable use and re-use – allows it to be more accessible to policymakers, civil society and other data users.23 Accessible data can support accountability, as it can enable people to understand government decisions, and help them identify which resources should reach them. The lack of data on how domestic revenue is allocated erodes trust between citizens and governments (see case study on the demand for information in Liberia from the Institute for Research and Democratic Development).24 Open data can support improved accountability, building better relations and trust between civil society and government.
Joined-up data
Joining up data means the ability to compare and combine data sets. Currently, we cannot easily combine resource flow data with poverty indicators, or link input and outcome data for service delivery. This is because different countries have different methodologies, definitions and institutional mandates. To combine resource flows with poverty data, we need consistent information from multiple sources, for example from donors’ aid budgets, with budgets of NGOs receiving aid, with local schools’ budget and results data. Developing
and applying common standards across multiple types of data is a significant undertaking.
A good example to illustrate the challenge of joining up data that comes from incompatible standards is the health sector categories used by the World Bank, the OECD CRS, the UN Classification of the Functions of Government (COFOG) and the US National Taxonomy of Exempt Entities (NTEE). There are a number of exact matches across some categories (such as between the World Bank and the CRS definitions of ‘population and reproductive health services’), and some close matches, such as between the CRS and World Bank ‘population and reproductive health services’ category and the NTEE’s ‘reproductive health’ category. In the vast majority of cases, no match is easily made, for example between the CRS ‘nutrition’ category, for which no equivalent exists in the UN’s COFOG or the NTEE classification, and only a broader one in the World Bank’s ‘nutrition and food security’. This demonstrates a significant challenge to tracking and aggregating financial resources to health sectors.
But the benefits of joined-up data can be substantial. For resource flow data, joining up different data sets on resources helps us to see the whole resource picture. Connecting resource flow data to socioeconomic indicators will enable assessments of the impact of resources on poverty reduction. Joined-up data across countries can also allow comparisons that could support political economic processes such as the African Integration. Adopting common monetary and fiscal policies, for example, requires an understanding of different economic contexts across countries based on comparable data.25
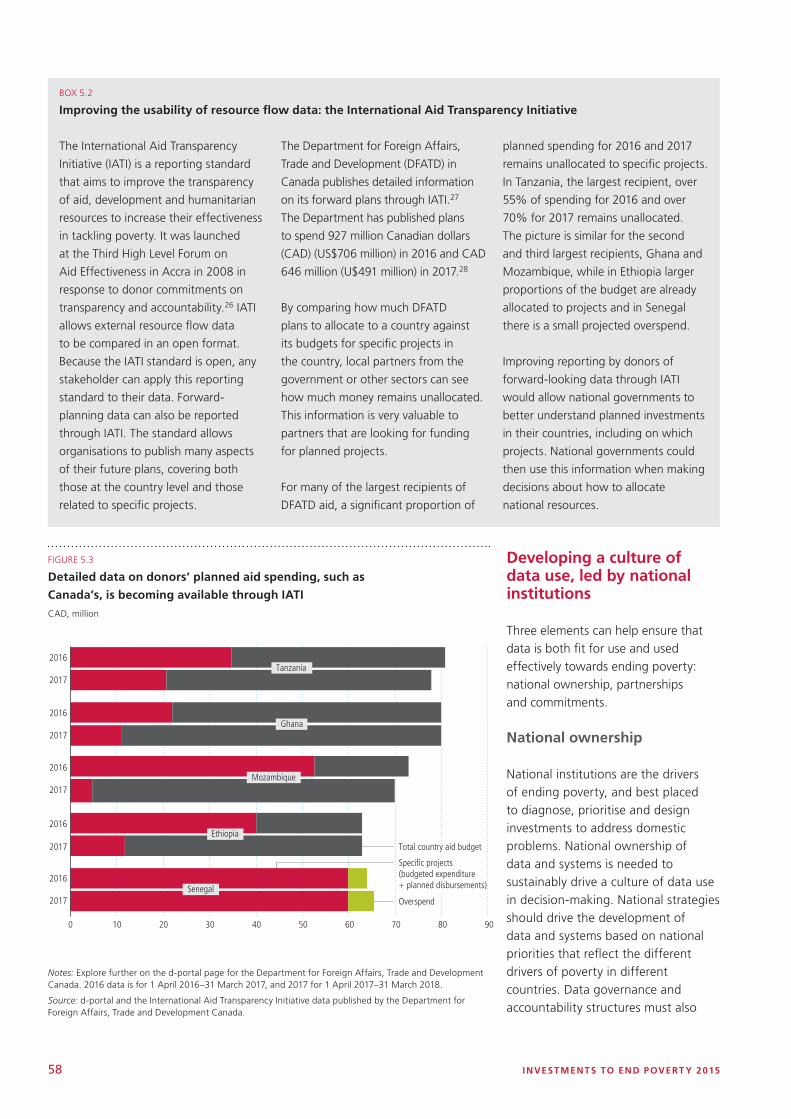
58 INVESTMENTS TO END POVERT Y 2015
BOX 5.2
Improving the usability of resource flow data: the International Aid Transparency Initiative
The International Aid Transparency
Initiative (IATI) is a reporting standard
that aims to improve the transparency
of aid, development and humanitarian
resources to increase their effectiveness
in tackling poverty. It was launched
at the Third High Level Forum on
Aid Effectiveness in Accra in 2008 in
response to donor commitments on
transparency and accountability.26 IATI
allows external resource flow data
to be compared in an open format.
Because the IATI standard is open, any
stakeholder can apply this reporting
standard to their data. Forward-
planning data can also be reported
through IATI. The standard allows
organisations to publish many aspects
of their future plans, covering both
those at the country level and those
related to specific projects.
The Department for Foreign Affairs,
Trade and Development (DFATD) in
Canada publishes detailed information
on its forward plans through IATI.27
The Department has published plans
to spend 927 million Canadian dollars
(CAD) (US$706 million) in 2016 and CAD
646 million (U$491 million) in 2017.28
By comparing how much DFATD
plans to allocate to a country against
its budgets for specific projects in
the country, local partners from the
government or other sectors can see
how much money remains unallocated.
This information is very valuable to
partners that are looking for funding
for planned projects.
For many of the largest recipients of
DFATD aid, a significant proportion of
planned spending for 2016 and 2017
remains unallocated to specific projects.
In Tanzania, the largest recipient, over
55% of spending for 2016 and over
70% for 2017 remains unallocated.
The picture is similar for the second
and third largest recipients, Ghana and
Mozambique, while in Ethiopia larger
proportions of the budget are already
allocated to projects and in Senegal
there is a small projected overspend.
Improving reporting by donors of
forward-looking data through IATI
would allow national governments to
better understand planned investments
in their countries, including on which
projects. National governments could
then use this information when making
decisions about how to allocate
national resources.
0 10 20 30 40 50 60 70 80 90
2016
2017
2016
2017
2016
2017
2016
2017
2016
2017
Speci�c projects (budgeted expenditure + planned disbursements)
Total country aid budget
Overspend
Tanzania
Ghana
Mozambique
Ethiopia
Senegal
FIGURE 5.3
Detailed data on donors’ planned aid spending, such as
Canada’s, is becoming available through IATI
CAD, million
Notes: Explore further on the d-portal page for the Department for Foreign Affairs, Trade and Development Canada. 2016 data is for 1 April 2016–31 March 2017, and 2017 for 1 April 2017–31 March 2018.
Source: d-portal and the International Aid Transparency Initiative data published by the Department for Foreign Affairs, Trade and Development Canada.
Developing a culture of data use, led by national institutions
Three elements can help ensure that data is both fit for use and used effectively towards ending poverty: national ownership, partnerships and commitments.
National ownership
National institutions are the drivers of ending poverty, and best placed to diagnose, prioritise and design investments to address domestic problems. National ownership of data and systems is needed to sustainably drive a culture of data use in decision-making. National strategies should drive the development of data and systems based on national priorities that reflect the different drivers of poverty in different countries. Data governance and accountability structures must also
CHAP TER 5 DATA FOR DECIS ION - MAKING 59
be in place to define data ownership and address data privacy concerns. For example, in South Africa, the government’s commitment to evidence-based policymaking has been driving increasing demand for and use of data.29 The Department of Performance Monitoring and Evaluation was established in the Presidency in 2010 to generate evidence to inform policies. Evidence generated through a range of evaluations on early childhood led to a new Early Childhood Development Policy developed in 2014. This provides a framework for a comprehensive package of new and integrated services to fill gaps identified in the evaluations.30
Investments are needed to create and improve sustainable data systems, including establishing data infrastructure to efficiently store data. Many developing countries need substantial external assistance to establish systems, and the international community can support the up-front investments needed. Capacity needs to be built to support national systems and structures in data collection, analysis and dissemination. This will be important not only for government agencies, but also for the wider ecosystem of data users and producers. Rwanda’s second National Statistical Development Strategy, for example, emphasises improving the “quality and dissemination of statistics and public statistical literacy” to enable citizens to develop capacity to generate, demand and understand data.
Partnerships
Partnerships and cooperation are instrumental to ensuring that data is fit for use. Partnerships between different data users and producers, including private and public stakeholders and academia, can
BOX 5.3
Aligning to national results
framework in Bangladesh
Donors aligning to national
governments’ results frameworks at
various levels, including for strategy
and planning, is a key principle of
aid effectiveness supporting national
ownership. In Bangladesh, the
Development Results Framework is
used to monitor progress against the
country’s Five Year Plan (2011–2015).
The framework is designed to be
incorporated into the systems of
government line ministries and
development partners. The UN has
linked its Development Assistance
Framework 2011–2016 to the
Development Results Framework
and draws on indicators from the
Bangladesh Bureau of Statistics.
The World Bank has also linked
components of its Country
Assistance Strategy 2011–2015. But
some development partners and line
ministries in the government have
not yet incorporated the framework
into their planning. Constraints to
further aligning the framework
are institutional, for example lack
of capacity in line ministries, and
technical, such as gaps in the
coverage of indicators. Overcoming
these challenges will allow greater
alignment to the framework and
ownership of progress by the
national government.38
help join up comprehensive data to end poverty.
At national and sub-national level, bureaucratic alignment between government bodies, such as national statistics offices, line ministries and provincial authorities, can improve how data collection responds to the information needs of policymakers. In Uganda, for example, the UBOS Strategic Plan provides for integration and streamlining of sectoral statistical requirements into the national statistical system.31
Regional and international organisations can support capacity development and access to funding.32 The UN Declaration on the post-2015 development agenda includes a commitment by UN member states to intensify efforts to strengthen statistical capacities in developing countries, recognising the role of international cooperation.33 Global initiatives exist to support this agenda, including the Partnership in Statistics for Development in the 21st Century (PARIS21) and the UN Global Partnership for Sustainable Development Data, to be launched at the UN General Assembly in September 2015.34
Aligning the international community to national priorities and systems is a key principle of aid effectiveness, recognised since the First High Level Forum on Aid Effectiveness produced the Rome Declaration on Harmonisation in 2002.35 More recent discussions on development effectiveness have placed increasing emphasis on developing countries owning development priorities, and on data and evidence to drive a focus on results. The Fourth High Level Forum on Aid Effectiveness, held in Busan in 2011, includes a commitment to accelerate efforts to use data to guide investments.36
Donors should focus on strengthening core statistical systems, rather than on multiple, often duplicative short-term and narrow baseline surveys and project impact assessments. Donors are not yet sufficiently aligned to national systems and further progress is needed, as found by the Global Partnership for Effective Development Cooperation (see Box 5.3 for an example on Bangladesh).37

60 INVESTMENTS TO END POVERT Y 2015
Commitments
Commitments to common goals and agendas can help drive progress and coordination. For example, the Africa Data Consensus sets a common vision among African Union member states to develop a culture of data use through a profound shift in the way that data is harnessed in decision-making. The Eighth Joint African Union-Economic Commission for Africa Conference of Ministers of Finance, Planning and Economic Development endorsed the Africa Data Consensus in March 2015.39 Another example is commitments to the transparency agenda, which have driven increased reporting to the IATI standard by over 300 organisations since 2011.40 Principles, such as data being ‘open by default’, can also be adopted to ensure data is accessible to and usable by the public and complies with data standards. Time-bound objectives and frameworks, such as national action plans and the Africa Data Consensus roadmaps, can drive monitoring of progress and accountability.
Summary
To end poverty in all its forms everywhere, we need data on exactly where people in poverty are, their quality of life, and the impact of resources on their wellbeing. This data is lacking – we don’t accurately know where the world’s poorest people are, or how many of them are women, for example. We also need data on domestic and international financial flows to fully understand all resources, and their comparative advantage in targeting poor people.
To inform investments toward the end of poverty, data must be disaggregated, timely, open, comprehensive and joined up. Disaggregated data by age,
gender, disability, income quintile and location can drive targeted investments and track progress across groups. Different types of data – including survey, administrative, big and citizen-generated data – can be used in complementary ways toward this goal.
Developing a culture of data use will require partnerships between private and public data users and producers. If data is fit for use, it can support better resource allocation and help build trust between citizens and governments. Strengthening national systems for data collection and sharing needs investments, including from the international community.
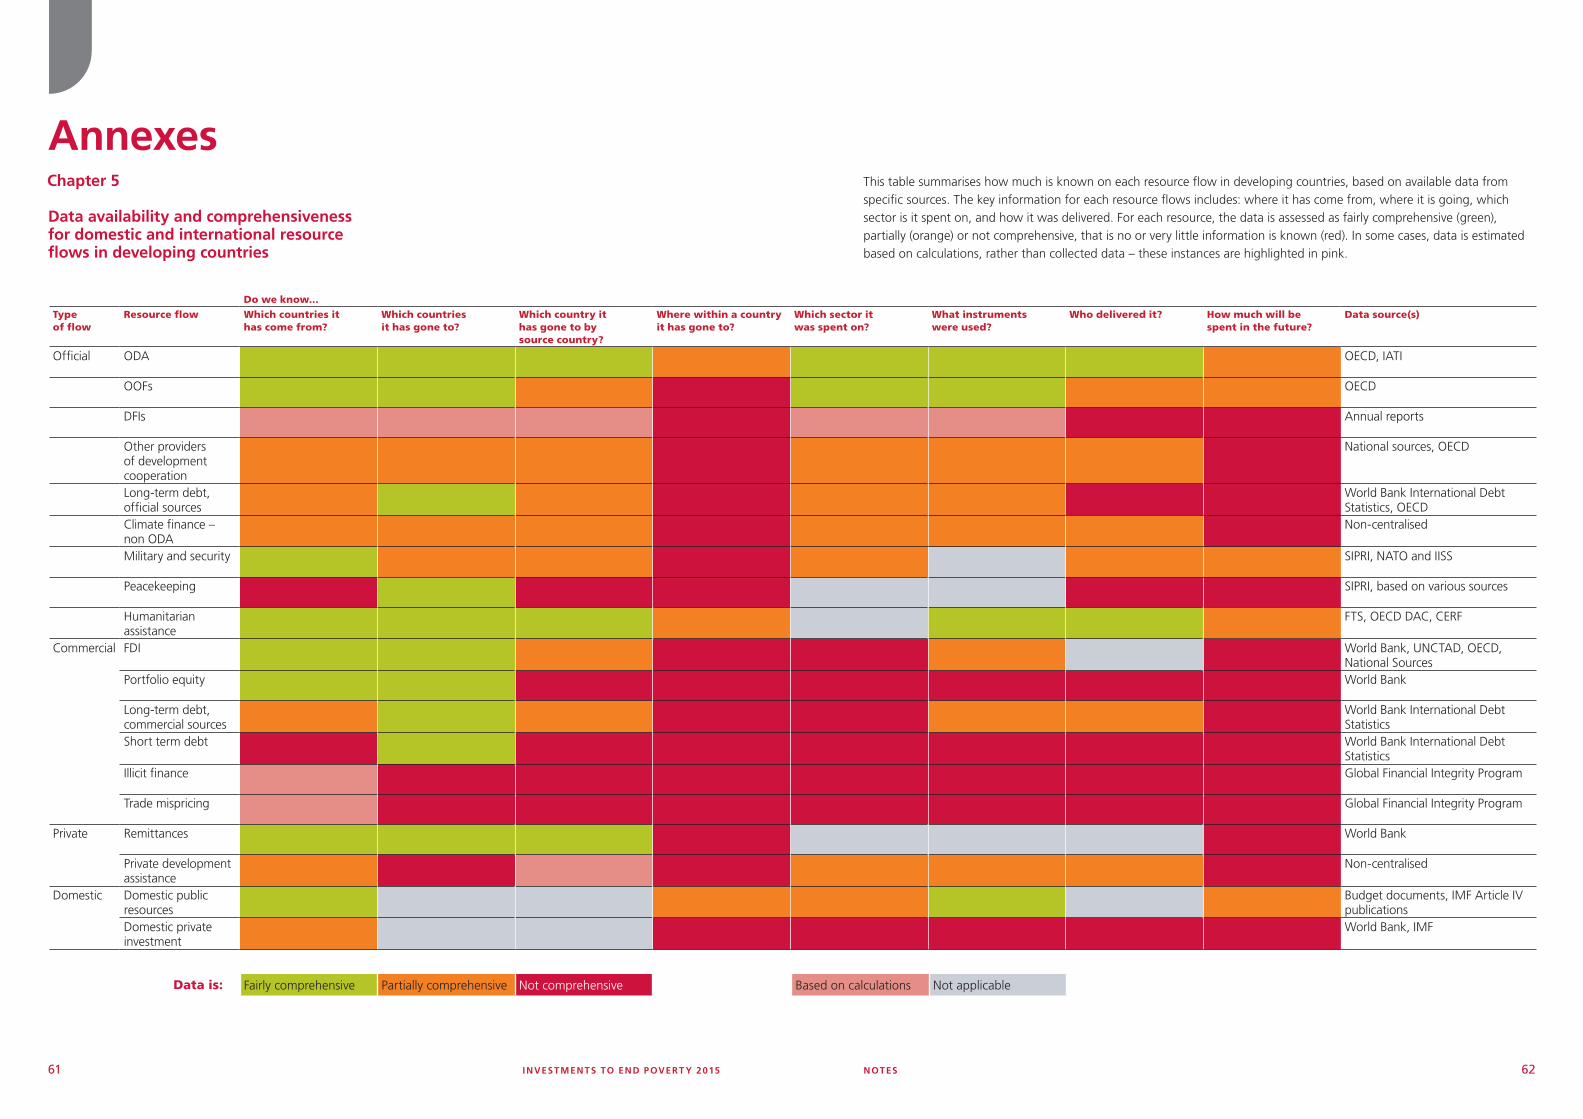
NOTES 6261 INVESTMENTS TO END POVERT Y 2015
Do we know...
Type of flow
Resource flow Which countries it has come from?
Which countries it has gone to?
Which country it has gone to by source country?
Where within a country it has gone to?
Which sector it was spent on?
What instruments were used?
Who delivered it? How much will be spent in the future?
Data source(s)
Official ODA OECD, IATI
OOFs OECD
DFIs Annual reports
Other providers of development cooperation
National sources, OECD
Long-term debt, official sources
World Bank International Debt Statistics, OECD
Climate finance – non ODA
Non-centralised
Military and security SIPRI, NATO and IISS
Peacekeeping SIPRI, based on various sources
Humanitarian assistance
FTS, OECD DAC, CERF
Commercial FDI World Bank, UNCTAD, OECD, National Sources
Portfolio equity World Bank
Long-term debt, commercial sources
World Bank International Debt Statistics
Short term debt World Bank International Debt Statistics
Illicit finance Global Financial Integrity Program
Trade mispricing Global Financial Integrity Program
Private Remittances World Bank
Private development assistance
Non-centralised
Domestic Domestic public resources
Budget documents, IMF Article IV publications
Domestic private investment
World Bank, IMF
This table summarises how much is known on each resource flow in developing countries, based on available data from specific sources. The key information for each resource flows includes: where it has come from, where it is going, which sector is it spent on, and how it was delivered. For each resource, the data is assessed as fairly comprehensive (green), partially (orange) or not comprehensive, that is no or very little information is known (red). In some cases, data is estimated based on calculations, rather than collected data – these instances are highlighted in pink.
Data availability and comprehensiveness for domestic and international resource flows in developing countries
Chapter 5
Annexes
Data is: Fairly comprehensive Partially comprehensive Not comprehensive Based on calculations Not applicable
NOTES 63
Overview
1 $1.25 per day.
2 Indian data is broken down into 35 states and union territories (UTs). Figures combine rural and urban estimates of poverty for each state/UT and province. The monetary value of poverty lines varies across states/UTs and provinces. Designed to illustrate the general point about sub-national disparities, rather than give a precise analysis of the specific contexts in India.
3 Milanovic B, Lakner C, Global income distribution: From the fall of the Berlin Wall to the Great Recession, 2014. Available here: www.voxeu.org/article/global-income-distribution-1988.
4 Depth of poverty is a measure of the average gap in incomes for people living below the poverty line spread across the population of each country, and is used here as a proxy for the scale of the challenge each country faces in ending poverty. It is expressed as a percentage of the $1.25 a day poverty line.
5 Note that resource rich countries are excluded from these statistics.
6 Excluding South Africa, health spending for the rest of sub-Saharan Africa is 8.3% of total spending (still the second highest among all regions) or US$17 per person.
7 This includes spending funded by international grants as it is not possible to distinguish between grant-funded and domestically funded spending for all developing countries (though Chapter 3 includes an analysis on a selection of countries where data is available).
8 World Health Organization, The World Health Report: Health Systems Financing – The Path to Universal Coverage, 2010.
9 Commercial resources include foreign direct investment, portfolio equity, long-term debt from commercial sources and short-term debt. Private resources include remittances. Resource flows such as private development assistance, for which no destination country data is available, are excluded from the figure and analysis.
10 Aid including both ODA from DAC donors and development cooperation from other providers, which can both play crucial and complementary roles in supporting poverty reduction.
11 The upper quartile of countries most vulnerable to climate change.
Chapter 1
1 The Millennium Development Goals Report 2015
2 In 2002 an estimated 401 million people (57% of the population) lived in extreme poverty in sub-Saharan Africa; in 2015 it is estimated that this rose slightly to 403 million people, or 41% of the population (though given the margin of error for 2015 projections it is difficult to say the numbers have risen with certainty). Source: PovcalNet.
3 China, India, Pakistan, Viet Nam and Indonesia.
4 Transforming our world: the 2030 Agenda for Sustainable Development.
5 See http://mdgs.un.org/unsd/mi/wiki/MainPage.ashx.
6 70 countries reduced the number of people living in extreme poverty by 20% or more between 2002 and 2011, from a sample of 113 developing countries with sufficient data. Data is not available for a further 33 developing countries.
7 Angola, Chad, Republic of Congo and Tanzania have depth of poverty rates over 10%.
8 All 18 countries where the absolute number of people living in poverty has risen most rapidly over 2002–2011 are in sub-Saharan Africa. Country-level data only available to 2011 but regional projections for sub-Saharan Africa suggest that the region as a whole may have started to reverse this rising trend since 2011. Over the four years 2011–2015 an estimated 3 million people are thought to have moved out of extreme poverty in the region. This is, however, based on projections that are yet to be confirmed by observed data. It is also not possible to disaggregate these regional projections by
Notes
64 INVESTMENTS TO END POVERT Y 2015
country to see if certain countries in particular are driving projected poverty reduction.
9 A simple calculation is used for the 2015–2030 period to make the broad point about the required change in trends in each region. The calculation is: the current number of people living in poverty, divided by 15 (for the 15 year period), then multiplied by the projected average annual population growth rate over the period 2015–2030 (population projections are sourced from the World Bank).
10 Kharas H, Rogerson A. Horizon 2025: Creative destruction in the aid industry, Overseas Development Institute, 2012.
11 Fragile States Index 2015, Fund for Peace, http://fsi.fundforpeace.org/. 64 countries with a score of 80 or greater are considered fragile.
12 INFORM, 2015 mid-year update. Environmental vulnerability is defined according to the natural hazard indicator in the INFORM index; countries considered ‘very high’ or ‘high’ risk under this indicator are classified here as environmentally vulnerable. Eight environmentally vulnerable countries are based on the Inform Index for Risk Management. Nine countries without both a fragility and vulnerability score are excluded.
13 Goa (19% annual poverty reduction over 2004/05–2011/12), Sikkim (16%), Andhra Pradesh (14%), Himachal (13%), Uttarakhand (13%), Tripura (13%), Andaman & Nicobar Islands (12%), Tamil Nadu (11%) and Punjab (11%).
14 Based on numbers of people living in poverty at the start of the period (in 2004/05), Uttar Pradesh had the largest number of people in poverty (and reduced the number at an average 2.8% per year over 2004/05–2011/12), Bihar (2nd largest, 4.5% annual reduction in number of people living in poverty) and Madhya Pradesh (4th, 4.2% annual reduction). In Maharashtra, the 3rd largest by number of people living in poverty in 2004/05, numbers fell by an average 9.3% per year.
15 Nagaland (average 12% annual increase over 2004/05–2011/12), Chandigarh (11%), Mizoram (6%), Daman and Diu (4%), Arunachal Pradesh (4%), Manipur (2%), Dadra & Nagar Haveli (1%) and Assam (1%).
16 The provinces that achieved the fastest rates of poverty reduction, reducing the number of people living in
poverty by more than 5% a year, were Jawa Timur (5.6%), Kalimantan Barat (5.2%), Lampung (5.2%) and Kalimantan Tengah (5.1%). The number of people living in poverty increased in Papua.
17 Various projections show that current patterns of growth will not alone end extreme poverty by 2030. The Brookings Institution for example estimates 342 million people will remain in extreme poverty in 2030 if there is a a continuation of current growth and inequality trends; with optimistic and pessimistic scenarios applied, the number could range between 108 million and 1.04 billion. Chandy L, Ledlie N, Penciakova V, Africa’s Challenge to End Extreme Poverty by 2030: Too Slow or Too Far Behind?, 2013. http://www.brookings.edu/blogs/up-front/posts/2013/05/29-africa-challenge-end-extreme-poverty-2030-chandy.
18 Milanovic B, Lakner C. Global income distribution: From the fall of the Berlin Wall to the Great Recession, 2014. Available here: http://www.voxeu.org/article/global-income-distribution-1988.
19 See Development Initiatives, Investments to End Poverty 2013, Chapter 6.
20 World Bank Chief Economist sets up new Commission on Global Poverty, June 22nd 2015, www.worldbank.org/en/news/press-release/2015/06/22/world-bank-chief-economist-sets-up-new-commission-on-global-poverty.
21 Dykstra S, Dykstra B, Sandefur J. We just ran 23 million queries of the World Bank’s website, Center for Global Development, 2014.
Chapter 2
1 Addis Ababa Action Agenda, p. 5, point 20. http://www.un.org/esa/ffd/ffd3/wp-content/uploads/sites/2/2015/07/Addis-Ababa-Action-Agenda-Draft-Outcome-Document-7-July-2015.pdf.
2 The data shown is total revenue excluding grants. Data covers 126 developing countries and is the total of either actual or budgeted expenditure estimates for each country.
3 Including some larger developing countries such as Brazil and, to a lesser extent, Iran, Nigeria, South Africa, Indonesia and Turkey. By comparison 83% of countries experienced growing domestic public revenue between 2005 and 2010.
NOTES 65
4 Comprehensive comparable data on domestic commercial investment across developing countries is unavailable. These estimates are based on gross fixed capital formation, which can be taken as a proxy for total investment in each developing country. The calculation applied is: gross fixed capital formation minus FDI (to estimate total domestic investment) minus government capital investment (to separate public and private sources of domestic investment). This approach is preferred to using estimates of gross fixed capital formation for the private sector as country coverage for that data is poor.
5 International official flows include ODA, OOFs, development cooperation from other providers, other activities by development finance institutions, other lending by official actors and peacekeeping operations, as well as corresponding outflows. International commercial flows include FDI, portfolio equity and lending by commercial actors as well as corresponding outflows. International private flows include remittances and private development assistance as well as outflows of remittances from developing countries. Illicit finance includes estimates for trade mispricing and capital flight.
6 This is disbursements of long-term debt (with a term length exceeding one year) to actors categorised as ‘private non-guaranteed’ within each country.
7 The Development Assistance Committee (DAC) is an international forum at the OECD with a mandate to promote development cooperation that contributes to sustainable development. As of September 2015 there are 29 DAC members. http://www.oecd.org/dac/developmentassistancecommitteedac.htm.
8 The depth of poverty measures the average gap in incomes for people living below the poverty line, spread across the population. It is expressed as a proportion of the $1.25 a day poverty line. Countries with depth of poverty above 10% are among those facing the greatest challenge in ending poverty by 2030. See also Chapter 1.
9 Data used in Figure 2.5 is based on 134 of the 146 developing countries included in the definition used by this report. 12 countries were excluded from the analysis because of a lack of sufficient data on wider resource flows beyond official finance.
10 Though international private resources cover private development assistance (PDA) as well as remittances, data on where PDA is used is insufficient to be included in analysis about the mix of international resources at the country level (see also Chapter 5).
11 For example, though FDI is often presented as a simple cross-border transfer in fact a high proportion of it in many countries is funded by companies that are already based in the destination country through reinvested earnings. This is not necessarily better or worse than new investments that involve a cross-border transfer, though the policy implications for a government wanting to partner with investors may be very different.
Chapter 3
1 The depth of poverty measures the average gap in incomes for people living below the poverty line, spread across the population. It is expressed as a proportion of the $1.25 a day poverty line. Countries with depth of poverty above 10% are among those facing the greatest challenge in ending poverty by 2030. See also Chapter 2.
2 The 20% figure was widely discussed in the financing for development debate and was included in the zero draft of the Addis Ababa Agenda for Action, though it did not feature in the final draft.
3 International support can be provided in a number of ways, such as through directs capacity building or through cooperation to prevent illicit flows.
4 This group includes: Nigeria (depth of poverty greater than 20%); Angola, Chad, Guinea, Republic of Congo and Senegal (depth of poverty 10%–19.99%); Cameroon, Mauritania, Timor-Leste, Gabon and Sudan (depth of poverty 5%–9.99%); Algeria, Kazakhstan, Viet Nam, and Yemen (depth of poverty less than 1%); Libya and South Sudan (no poverty data). Other countries may generate smaller amounts of revenue from natural resources without reporting it explicitly.
5 It is important to note that the relationship between direct/indirect taxes and progressivity is not linear. Indirect tax systems can more progressive – for example many countries offer exemptions on goods such as basic food items that are consumed by the poorest people.
6 As noted in the Addis Ababa Action Agenda through the commitment to “enhance revenue administration through modernized, progressive tax systems, improved tax policy and more efficient tax collection.” Addis Ababa Action Agenda, page 6, paragraph 22. www.un.org/esa/ffd/ffd3/wp-content/uploads/sites/2/2015/07/Addis-Ababa-Action-Agenda-Draft-Outcome-Document-7-July-2015.pdf.
66 INVESTMENTS TO END POVERT Y 2015
7 Latest estimates from Libya, in 2012, were that natural resources accounted for 95% of total revenues, though the context has changed significantly since this data was published and more recent estimates are unavailable.
8 This is based on eight countries where the depth of poverty exceeds 20% and where data on the breakdown of revenue are published.
9 International Tax Compact, Tax and Development: Aid Modalities for Strengthening Tax Systems, 2013, page 98. www.taxcompact.net/documents/ITC_2013-07_ Aid-Modalities.pdf.
10 Asia-Pacific Effective Development Cooperation Report, p46.
11 Domestic finance includes borrowing from domestic financial institutions (‘bank’) and ‘non-bank’ sources such as the issuance of domestic bonds.
12 For example see www.odi.org/sites/odi.org.uk/files/odi-assets/publications-opinion-files/6325.pdf on cumulative targets adding to over 100% of government spending. Also a large number of developing country governments have often viewed such targets as arbitrary.
13 World Health Organization, The World Health Report: Health Systems Financing – The Path to Universal Coverage, 2010.
14 Capital expenditure: the expenses of the government in order to maintain or to produce assets.
15 See for example www.imf.org/external/pubs/ft/wp/ 2015/wp15105.pdf and in the specific case of Yemen http://papers.ssrn.com/sol3/papers.cfm?abstract_ id=1774424.
16 To give one example of effective use of targeted subsidies, fertiliser subsidies have been successfully used in Malawi to reduce food insecurity for the most vulnerable farmers. http://onlinelibrary.wiley.com/doi/10.1111/dpr.12026/epdf.
17 In Morocco, for example, reform of subsidies during 2013 and 2014 have been driven by budgetary pressures. The government focused on eliminating subsidies such as gasoline that were more pro-rich and delayed removing subsidies on liquefied petroleum gas (LPG) that would affect poorer people more directly and would have a significant impact on increasing poverty. http://papers.ssrn.com/sol3/papers cfm?abstract_ id=2587515.
18 Based on the population of children in government primary schools.
19 For example, the Outcome Document of the Third International Conference on Financing for Development.
20 For example, written property records.
21 For example, ICTD’s report on property taxes and their progressiveness compared with other forms of locally raised revenue.
Chapter 4
1 The concept of ODA, and the rules that determine which forms of finance are eligible to be counted as ODA, were developed by the OECD DAC and apply to their 28 members. But a number of countries and multilateral bodies who are not DAC members use the definition of ODA when measuring the value of their own development assistance programmes.
2 Gross ODA includes all ODA disbursed in a given year; net ODA is equal to gross ODA minus capital repayments on outstanding ODA loans and minus the principal amount of any loans written off as debt relief that were included in a previous years ODA figures.
3 Tew, R. (2013). ODA loans – Discussion Paper. http://devinit.org/wp-content/uploads/2015/02/ODA_loans_discussion_paper3-1.pdf.
4 There are 250 donor agencies that report ODA to the OECD. This review covered 63 agencies that together accounted for 90% of ODA disbursements in 2012; 13 of these were excluded either because they were established for a specific purpose other than poverty eradication (such as the UN High Commission for Refugees) or because no information on their legal mandate or mission statement could be found.
5 This can be seen in Figure 4.5 at the national level, where many of the countries with the highest vulnerability to climate change are also those where the depth of poverty is greatest. See The Global Landscape of Climate Finance 2013, Climate Policy Initiative. Available here: http://climatepolicyinitiative.org/publication/global-landscape-of-climate-finance-2013.
6 Adaptation ODA compares in scale with only the lower bounds of the most conservative estimates of the scale
NOTES 67
of needs for adaptation finance, which range from US$4 billion to US$171 billion.
7 The US$137 billion figure is based on estimates from Climate Policy Initiative which include climate finance reported as ODA. See The Global Landscape of Climate Finance 2013, http://climatepolicyinitiative.org/publication/global-landscape-of-climate-finance-2013.
8 See also the 2015 Global Humanitarian Assistance Report, page 121, http://www.globalhumanitarianassistance.org/report/gha-report-2015.
9 Further analysis of adaptation ODA is limited by poor reporting, especially on disbursements. While reporting on climate-related ODA has improved in recent years, 42% of bilateral projects reported by DAC donors were simply not screened against the adaptation Rio marker in 2013.
10 Disbursements to the sector marked as ‘other’ are typically cases where the donor has not specified a sector or has stated that the ODA is ‘multisector’.
11 The grant element is the standard way of measuring how concessional a loan is. It can be viewed as the difference between the cost, in today’s prices, of future repayments a borrower will have to make on the loan in question and the repayments the borrower would have had to make on a non-concessional loan. This is therefore the amount of money that is considered to have been ‘given away’ by the donor, hence grant element. The grant element is normally shown as a percentage of the value of the loan.
12 Development Initiatives (2013) ‘ODA loans – tracking a growing source of development financing.’ http://devinit.org/author/admin/#!/post/oda-loans-tracking-a-growing-source-of-development-financing.
13 Aid for domestic resource mobilisation: how much is there? Development Initiatives, 2014. http://devinit.org/#!/post/aid-domestic-resource-mobilisation-much.
14 Core private sector ODA includes ODA that aims to develop the private sector; wider private sector ODA includes ODA that aims to strengthen the sector’s operating environment, for example by improving the business climate or developing infrastructure.
15 Sources include the DAC database and the OCHA FTS. Brazil data are from the IPEA/ABC, Brazilian International Development Cooperation (2010 and 2013) reports. China data are from Naohiro Kitano and Yukinori Harada, Estimating China’s Foreign Aid 2001–2013, JICA, June
2014; data for 2000 are from Information Office of the State Council (The People’s Republic of China), China’s Foreign Aid, July 2014 and Brautigam, Deborah, The Dragon’s Gift: The Real Story of China in Africa, Oxford University Press, 2009. India data is from the Union Budget, various years. Mexico data is from the AMEXCID online platform http://amexcid.gob.mx/images/ccid. Poverty data is from World Bank, PovCalNet. Contributions to international organisations do not compare to multilateral ODA and are calculated differently for each development cooperation provider, except data from DAC sources.
16 Sachin Chaturvedi (2012) India’s development partnership: key policy shifts and institutional evolution, Cambridge Review of International Affairs, 25:4, 557–577, http://dx.doi.org/10.1080/09557571.2012.744639.
17 Direct cooperation includes allocation to countries and excludes contributions to international organisations, administrative expenses and humanitarian assistance. www.amexcid.gob.mx/images/pdf/transparencia/Informe-cuantifica-CID-AMEXCID-2011-2012.pdf.
18 http://amexcid.gob.mx/images/ccid.
19 An estimated 94% of the flows to developing countries originate from public sources.
20 The sudden increase in mitigation-related commitments between 2009 and 2010 is partially due to commitments from Germany, France and Japan, each committing over US$1 billion more than in the previous year. Donors began to report adaptation-related ODA in 2010. It is also important to note that commitments data can appear erratic when presented annually, as donors may make many commitments in a single year that they intend to disburse over following years.
21 This is partially due to poorer and less transparent data on disbursements.
Chapter 5
1 The SDGs will be monitored using a set of global indicators that will be complemented by indicators at national and regional levels. The global indicator framework will be agreed by the UN Statistical Commission by March 2016.
2 Countries for which data is entirely missing are: Antigua and Barbuda, Cook Islands, Cuba, Dominica, Equatorial Guinea, Eritrea, Grenada, Kiribati, Democratic People’s Republic of Korea, Lebanon, Libya, Montserrat, Myanmar, Nauru, Niue,
68 INVESTMENTS TO END POVERT Y 2015
Palau, Samoa, Solomon Islands, Somalia, Saint Helena, Saint Lucia, Saint Vincent and the Grenadines, Tokelau, Tonga, Tuvalu, Vanuatu, Wallis and Futuna, Zimbabwe.
3 Outcome document adopted 12 August 2015 www.un.org/pga/wp-content/uploads/sites/3/2015/08/120815_outcome-document-of-Summit-for-adoption-of-the-post-2015-development-agenda.pdf.
4 Estimates of the coverage of births in civil registration systems are based on desk research conducted by Development Initiatives in August 2015. Figures reflect information that is available and accessible online. Further information on birth registration coverage may be held in national offices in hard copies, and would not have been incorporated in this analysis. Figures may not be fully accurate and are estimated to be ‘optimistic’. Figures are based on government sources for 17 countries. Data from other sources were used to estimate birth coverage in civil registration systems by Development Initiatives. Where no information could be found, it was assumed that a civil registration system is not in place. See full list of sources here (tinyurl.com/omhvewt).
5 ODI (2015), Exclusion in household surveys: causes, impacts and way forward, www.odi.org/sites/odi.org.uk/files/odi-assets/publications-opinion-files/9643.pdf.
6 World Bank (2013), High-frequency data collection: a new breed of household surveys’ www.worldbank.org/en/topic/poverty/brief/high-frequency-data-collection.
7 CIVICUS Case study of the number, type and scale of citizen-generated data initiatives across the world: http://civicus.org/thedatashift/cgd-interactive/.
8 There is no widely recognised definition of ‘big data’. Here we use the 3 V’s definition: volume, velocity and variety.
9 World Bank (2014), Big data in action for development, http://live.worldbank.org/sites/default/files/Big%20Data%20for%20Development%20Report_final%20version.pdf.
10 Orange (2013), Mobile data for development: analysis of the mobile phone datasets for the development of Ivory Coast, selected contributions to the D4D challenge sponsored by Orange, May 1–3, edited by Blondel Vincent et al., available at http://perso.uclouvain.be/vincent.blondel/netmob/2013/D4D-book.pdf.
11 www.tnp2k.go.id/images/uploads/downloads/PKH %20Final_En-2.pdf.
12 See 2012 review of PKH, http://documents.worldbank.org/curated/en/2012/02/15893876/program-keluarga-harapan-pkh-conditional-cash-transfer.
13 Pro-poor Planning and Budgeting Project (2008), Program Keluarga Harapan: two case studies on implementing the Indonesian conditional cash transfer program, Working paper n.5, www.bappenas.go.id/files/1913/5462/9599/p-5-pkh-wo-case-studies-hjalte-final-16-sept-2008__20090217143243__1850__2.pdf.
14 Government of Indonesia National Team for the Acceleration of Poverty Reduction, Unified Database, www.tnp2k.go.id/en/frequently-asked-questions-faqs/unified-database.
15 Indonesia’s Unified Database (UDB): rationalising a fragmented system, www.opml.co.uk/sites/default/files/Poster%20Indonesia_FINAL.pdf.
16 Addis Ababa Action Agenda www.un.org/ga/search/view_doc.asp?symbol=A/CONF.227/L.1. Agreed on 16th July 2015. See paragraphs 125–127.
17 See Wateraid (2015), Why international aid for water, sanitation and hygiene is still a critical source of finance for many countries, www.wateraid.org/what-we-do/our-approach/research-and-publications/view-publication?id=0cad195c-1701-4466-959c-7cc7907732d1.
18 Development Initiatives (2015), Data Use Case study: using foreign aid data to improve policy making in Nepal, January 2015, http://devinit.org/staging/wp/wp-content/uploads/2015/05/CASE-STUDY-Using-aid-data-for-policy-making-Nepal-SHORT-2015-01.pdf.
19 See Ministry of Finance, Nepal Aid Management Platform, http://amis.mof.gov.np/portal/.
20 The UN Office for the Coordination of Humanitarian Affairs (OCHA) Financial Tracking Service also captures formally reported humanitarian aid contribution from international sources, but does not capture the totality of funding to crises. The Financial Tracking Service was established to track humanitarian funding going to emergencies. While the Financial Tracking Service includes financing to all emergencies, the focus is on the major humanitarian crises captured in UN appeals.
21 Nepal Earthquake portal, http://earthquake.opennepal.net/.
22 IATI (2014), Paper 4a: Country survey- IATI data and Aid Information Management Systems (AIMS), meeting

NOTES 69
of IATI Steering Committee Members and Observers, Copenhagen, www.aidtransparency.net/wp-content/uploads/2013/01/Paper-4a-Country-Survey-of-AIMS.pdf. Respondents were from 41 people in 24 countries, including 22 government officials, and aid effectiveness specialists and other consultants.
23 Open Knowledge Foundation, Open Data Handbook: What is open data? http://opendatahandbook.org/guide/en/what-is-open-data/.
24 Development Initiatives (2014), Data Use Case study: transforming data into useful information for transparency advocacy in Liberia, December 2014, http://devinit.org/wp-content/uploads/2015/05/CASE-STUDY-Transforming-data-for-transparency-advocacy-Liberia-LONG-2014-121.pdf.
25 African Union Statistics Division, Strategy for the harmonisation of statistics in Africa, http://auc-statdivision.voila.net/pdfstat/SHaSA_strategy.pdf. The strategy was developed under the African Union to support the African integration agenda, and enhanced collaboration between national statistical offices. It was adopted by the Assembly of Heads of State and Government in July 2010 and launched during the meeting of Directors-General of National Statistical Offices in December 2010.
26 See IATI ‘Understanding transparency’ page, http://iatistandard.org/102/getting-started/policy-considerations/understanding-transparency/.
27 This analysis is focused on Canada, because data for other donors is lacking.
28 2016 data refers to the financial year 1 April 2016–31 March 2017, and 2017 refers to the financial year 1 April 2017–31 March 2018.
29 See Statistics South Africa Strategic Plan, http://beta2.statssa.gov.za/strategy_plan/ strategy_plan_2010.pdf.
30 Boulle, Davids, Mabogoane and Goldman (2014), Early Childhood Development: evidence-based policy making and implementation case study, Republic of South Africa, www.thepresidency-dpme.gov.za/keyfocusareas/evaluationsSite/Evaluations/ECD%20Evidence%20Based%20Policy%20Making%20Case%20Study.pdf.
31 UBOS (2014), Strategic Plan 2013/2014- 2017/2018 – Enhancing Data Quality and Use, www.ubos.org/onlinefiles/uploads/ubos/pdf%20documents/UBOS %20SSPS%202013-18.pdf.
32 Giovannini, Enrico (2015), Harnessing support and building institutions for the data revolution, PARIS 21, www.paris 21.org/sites/default/files/PARIS21-DiscussionPaper6_0.pdf.
33 United Nations (2015) Sustainable Development Goals, www.un.org/sustainabledevelopment/sustainable-development-goals/ . Finalised text for adoption, 1 August. See in particular paragraphs 48, 57, 72, 76.
34 PARIS21 is an initiative that aims to promote the better use and production of statistics in developing countries. Established in 1999, PARIS21 developed a network of statisticians, policy makers, analysts and development practitioners to facilitate statistical capacity development and advocates for the integration of data in decision-making.
35 See Rome Declaration on Harmonisation (2002), www.oecd.org/dac/effectiveness/31451637.pdf.
36 See Paris Declaration on Aid effectiveness (2005) and Accra Agenda for Action (2008) available at www.oecd.org/dac/effectiveness/parisdeclaration andaccraagendaforaction.htm and Busan Partnership for Effective Development Cooperation (2011), www.oecd.org/dac/effectiveness/49650173.pdf.
37 Global Partnership for Effective Development Co-operation (2014), Making Development Co-operation More Effective: 2014 Progress Report, http://effectivecooperation.org/wordpress/progress/.
38 UNDP and Australian Government (2014), Asia Pacific Effective Development Cooperation report, www.asia-pacific.undp.org/content/dam/rbap/docs/Research%20&%20Publications/democratic_governance/RBAP-DG-2014-AP-Effective-Development-Cooperation.pdf.
39 UN Economic Commission for Africa (2015), Africa Data Consensus, www.uneca.org/sites/default/files/PageAttachments/final_adc_-_english.pdf. The Africa Data Consensus is the culmination of a process led by the African Union and UN Economic Commission for Africa to assess the implications of the Data Revolution in Africa for the African Union’s Agenda 2063 and the post‐2015 development agenda. The Africa Data Consensus was adopted in March 2015 at the High Level Conference on Data Revolution held in Addis Ababa.
40 As of 27 August 2015, there are 347 agencies and governments publishing data in the IATI standard.
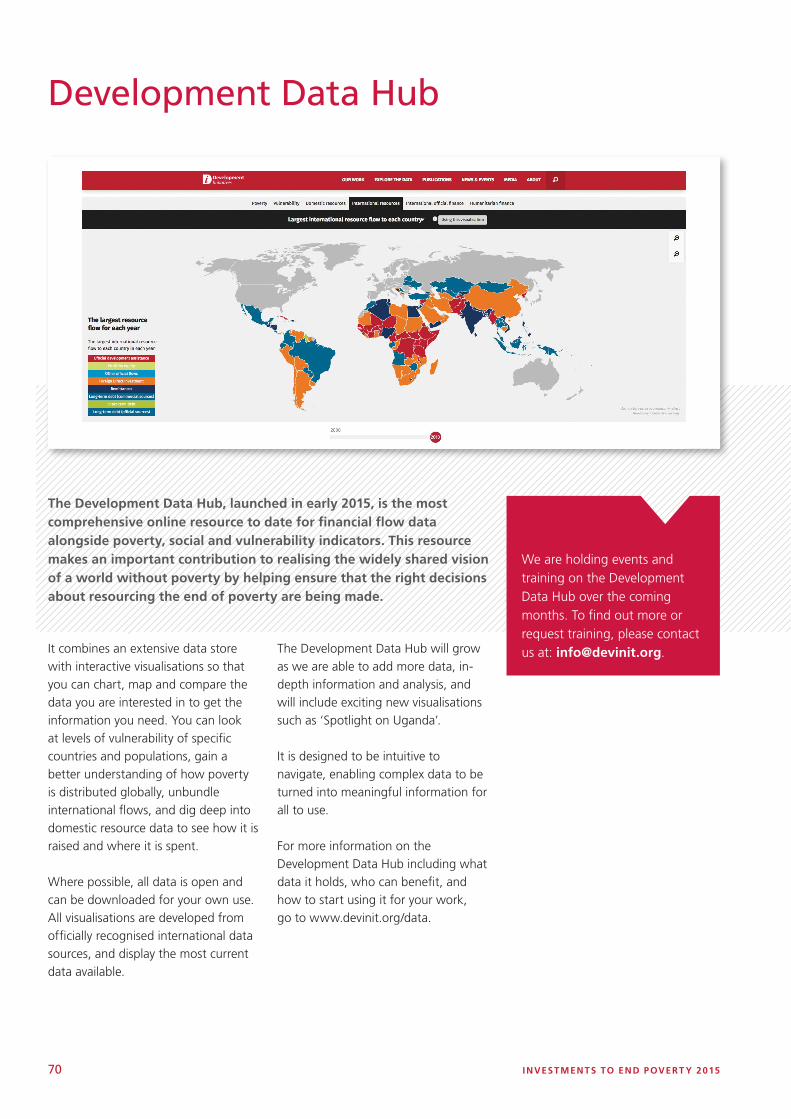
70 INVESTMENTS TO END POVERT Y 2015
The Development Data Hub, launched in early 2015, is the most comprehensive online resource to date for financial flow data alongside poverty, social and vulnerability indicators. This resource makes an important contribution to realising the widely shared vision of a world without poverty by helping ensure that the right decisions about resourcing the end of poverty are being made.
It combines an extensive data store with interactive visualisations so that you can chart, map and compare the data you are interested in to get the information you need. You can look at levels of vulnerability of specific countries and populations, gain a better understanding of how poverty is distributed globally, unbundle international flows, and dig deep into domestic resource data to see how it is raised and where it is spent.
Where possible, all data is open and can be downloaded for your own use. All visualisations are developed from officially recognised international data sources, and display the most current data available.
The Development Data Hub will grow as we are able to add more data, in-depth information and analysis, and will include exciting new visualisations such as ‘Spotlight on Uganda’.
It is designed to be intuitive to navigate, enabling complex data to be turned into meaningful information for all to use.
For more information on the Development Data Hub including what data it holds, who can benefit, and how to start using it for your work, go to www.devinit.org/data.
Development Data Hub
We are holding events and training on the Development Data Hub over the coming months. To find out more or request training, please contact us at: [email protected].

74 INVESTMENTS TO END POVERT Y 2015
Ending extreme poverty over the next 15 years will be a much more difficult task than halving it has been. Our second Investments to End Poverty report and our online Development Data Hub show that when data is disaggregated, people are being left behind. Where poverty appears to be reducing in countries, many people are being lost along the way. Many of the world’s poorest countries need a significant change in trajectory if they are to see an end to poverty.
Investments to End Poverty 2015 focuses in on national institutions – these are best placed to end poverty but have fewer resources where the challenge of ending poverty is greatest. Developing countries cannot end poverty alone and international assistance is critical where poverty is deepest. The international community has a range of tools that can support countries and we need to better understand the comparative advantages of all resources and the role they can play in getting poverty to zero. Our report also shows that official development assistance remains the most important international resource for ending poverty yet we need to improve the way it is targeted towards that goal.
But all of this demands much better data because today’s data is not fit for getting poverty to zero. There is an urgent need to revolutionise the data on who and where the poorest people are, how deep their poverty is, the services they have access to, and the full mix of resources that could lift them sustainably out of poverty. Only then can we set ourselves firmly on the path to end global poverty and make sure no one is left behind.
Development Initiatives works to end extreme poverty by 2030 by making data and information on poverty and resource flows transparent, accessible and useable. We help decision-makers use information to increase their impact for the poorest people in the most sustainable way. Our Investments to End Poverty programme looks at the impact of all resources on poverty reduction. It provides independent, reliable, accessible data and information on resource flows, and promotes the idea that all resources could have a role to play in getting poverty to zero.
To find out more about our work visit www.devinit.org
@devinitorg
UK OFFICE Development Initiatives Ltd North Quay House Quay side Temple Back Bristol, BS1 6FL United Kingdom T: +44 (0) 1179 272 505
AFRICA HUB Development Initiatives Ltd Shelter Afrique Building 4th Floor, Mamlaka Road Nairobi, Kenya PO Box 102802-00101 T: +254 (0) 20 272 5346
UGANDA OFFICE c/o Development Research and Training (DRT) Ggaba Road Mutesasira Zone Kansanga Kampala, Uganda PO Box 22459 T: +256 (0) 312 – 263629/30
6821257809929
ISBN 9780992682125