Embed Size (px)
Citation preview
*The returns for the equity portion of your individual account may differ somewhat from the Composite due to slight variations in account holdings, cash position, and other client-specific circumstances. T 312.334.7300 F 312.334.7308 115 South LaSalle Street, 27th Floor, Chicago, IL 60603 www.kovitz.com
Investment Commentary Spring 2016
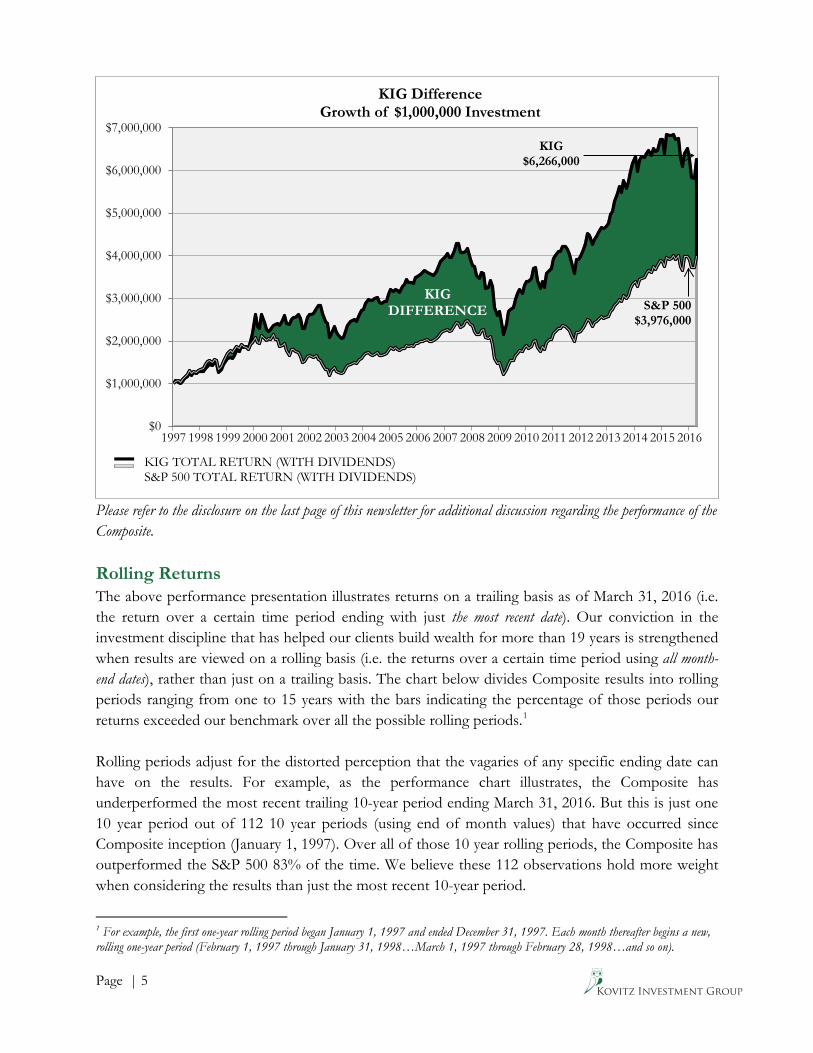
Market and Performance Summary For the quarter ended March 31, 2016, the Kovitz Investment Group® (KIG) Equity Composite (the “Composite”) increased 0.2%*, net of fees, compared to a 1.3% increase for the S&P 500 Index. “Successful investing takes time, discipline and patience. No matter how great the talent or effort, some things just take time. You can’t produce a baby in one month by getting nine women pregnant.” ‐ Warren Buffett Since its inception 19 and one-quarter years ago, the Composite has compounded at an annual rate of 10.0%, which would have had the effect of doubling invested capital every 7.3 years over that time span. Through many bull and bear markets, a $1 million investment in the Composite on January 1, 1997 would have grown to $6,266,000 as of March 31, 2016. Over the same time period, the S&P 500 grew at an annual rate of 7.4%, effectively doubling capital every 9.7 years, and the same $1 million investment would be worth $3,976,000. In our opinion, nothing highlights the power of patience, investment discipline and compounding more than this comparison. From the financial crisis lows of early 2009 until the middle of 2015, the equity market experienced an exceptional, and an exceptionally calm, period as it marched steadily higher with little in the way of volatility. Since that time, however, market gyrations have reappeared and volatility increased throughout the latter half of 2015 and into 2016. In an extreme case of Dr. Jekyll and Mr. Hyde syndrome that manifested itself over the last three months, the U.S. equity markets first discounted (sold off) a recession into stock prices and then completely reversed course (rallied) all within just one quarter. With the market having been down as much as 10% and the Composite down over 14% before snapping back, sentiment turned from paranoia to complacency at a seemingly breakneck speed. Having grown accustomed to a continually rising market with low volatility, the sell-off during the first part of the quarter triggered the typical reaction from financial commentators and media outlets that Armageddon was around the corner. Such sensational headlines generate considerably more
Page | 2
excitement compared to the statements uttered in our hallways that suggested a 10%-20% decline after a 200% gain should not be cause for alarm. But what if the market had not begun its mid-quarter recovery and the downside volatility continued? Would it have implied something nefarious in the offing? Did the market know something? Should you have followed suit and sold along with everybody else? Howard Marks, co-founder and chairman of Oaktree Capital Management (and frequently quoted in these newsletters for his level-headed and disciplined investment approach), recently wrote about this in his latest memo:
“Especially during downdrafts, many investors impute intelligence to the market and look to it to tell them what’s going on and what to do about it. This is one of the biggest mistakes you can make. As Ben Graham pointed out, the day-to-day market isn’t a fundamental analyst; it’s a barometer of investor sentiment. You just can’t take it too seriously. Market participants have limited insight into what’s really happening in terms of fundamentals, and any intelligence that could be behind their buys and sells is obscured by their emotional swings. It would be wrong to interpret the recent worldwide drop as meaning the market “knows” tough times lay ahead.”
What it really boils down to is just that sentiment flies around more than reality. At various inflection points, investors are either more buoyant or more depressed about the future than would be warranted by real world business fundamentals. Today, for example, market prognosticators cite the risk of falling energy prices, potential deflationary conditions, a weakening Chinese economy, and the strengthening dollar as major concerns. A few short years ago, they worried about the opposite: high energy prices, potential inflationary conditions, China’s economic strength, and a weak dollar. We use this example not to minimize the importance of economic and political concerns, but rather to highlight that such risks are a constant part of the investment landscape. What varies are investors’ perceptions concerning these risks. When prices are high, investors optimistically focus only on the positives. When prices are low, they pessimistically focus only on the risks. Marks continues:
“Fundamentals – the outlook for an economy, company or asset – don’t change much from day to day. As a result, daily price changes are mostly about (a) changes in market psychology and thus (b) changes in who wants to own something or un-own something. These two statements become increasingly valid the more daily prices fluctuate. Big fluctuations show that psychology is changing radically.”
In other words, the fundamentals may not have changed much, if at all. However, investors who take their cue from the movement of stock prices may conclude that the fundamentals have changed and be led to believe that risk is rising and prospects for future gains are falling. If someone came to us for a second opinion, we would steadfastly state the opposite – lower prices reduce risk and create higher future value, particularly for those who have the gumption to invest at these lower and
Page | 3
less risky prices. In any case, volatility spiking dramatically is a development which we welcome. In any purchase transaction, it is always better to buy from a panicked seller. In managing our clients’ money, we are determined not to fall into these psychological traps. We tend to be neither optimists, nor pessimists, but realists focused on facts rather than emotions. While macroeconomic factors can have an impact on earnings in the short run, the key driver of long-term earnings power is the durability of a company’s competitive advantage, which provides the ability to sustain pricing and margins throughout an economic cycle. In general, the various economic and political factors that worried investors during the first six weeks of the year (before they didn’t) and depressed prices (before they didn’t) have almost no impact on the long-term earnings power of the majority of companies we own. We subscribe to the notion that there’s only one intelligent form of investing: figure out what something is worth and see if you can buy it at a level well below that price. Once you find something with this inherent advantage, a great number of things can happen to complicate the notion that it will someday reach fair value, including the fear of a severe market decline. Does it make sense to sell something if the price is below your assessment of intrinsic value just because you fear it may fall in the short run? If you’re buying a dollar for 70 cents, does it matter if it falls to 60 cents first? Buying something for less than it’s worth is nirvana to a long-term investor; short-term factors that may or may not materialize should be of little concern. Even if the fear of a market sell-off comes to fruition, all other things being equal, you should want to own even more of something as it falls in price and its discount to intrinsic value widens. In our opinion, the most effective way to combat such irrationality is to recognize that stocks represent ownership interests in real businesses and the value of a business is determined by the earnings and cash it produces over the long term. Spending our time thinking about the value of our investments, rather than worrying about their price, frames our long-term outlook and keeps us from falling prey to emotional biases. We continue to seek and hold companies that we believe have an ability to deliver long-term value to shareholders that is not currently recognized by the market. We remain focused on identifying companies with four key attributes: (1) a commitment to maintain a strong financial position as evidenced by a solid balance sheet; (2) an ability to generate sustainable free cash flow based on one or more defensible competitive advantages; (3) management that intelligently deploys cash balances and free cash flow from operations to increase returns to shareholders; and (4) is selling at a discount to our calculation of intrinsic value. We further believe that by prioritizing these factors, our portfolio of companies will be positioned to perform better than the market in most types of economic settings. We can't promise a certain return in any given month, quarter, year, or even a string of years. We instead promise to methodically and repeatedly follow a logical process to identify good companies at good prices, to research them diligently, and to buy them when we think the chance of losing money is low and the probability of better-than-market returns over a multi-year time horizon is high. This should hopefully lead (and, for the Composite, historically has) to favorable long-term performance when compared to our primary benchmark. Many think investing is about being a
Page | 4
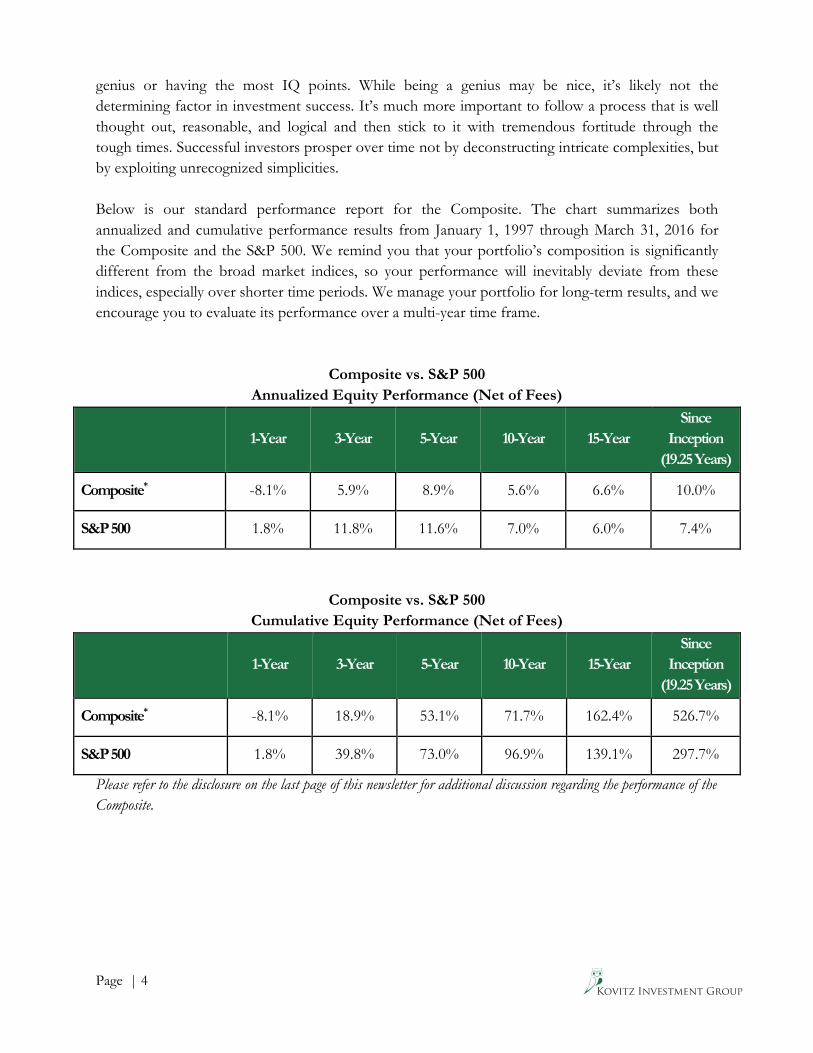
genius or having the most IQ points. While being a genius may be nice, it’s likely not the determining factor in investment success. It’s much more important to follow a process that is well thought out, reasonable, and logical and then stick to it with tremendous fortitude through the tough times. Successful investors prosper over time not by deconstructing intricate complexities, but by exploiting unrecognized simplicities. Below is our standard performance report for the Composite. The chart summarizes both annualized and cumulative performance results from January 1, 1997 through March 31, 2016 for the Composite and the S&P 500. We remind you that your portfolio’s composition is significantly different from the broad market indices, so your performance will inevitably deviate from these indices, especially over shorter time periods. We manage your portfolio for long-term results, and we encourage you to evaluate its performance over a multi-year time frame.
Composite vs. S&P 500 Annualized Equity Performance (Net of Fees)
1-Year 3-Year 5-Year 10-Year 15-Year Since
Inception (19.25 Years)
Composite* -8.1% 5.9% 8.9% 5.6% 6.6% 10.0%
S&P 500 1.8% 11.8% 11.6% 7.0% 6.0% 7.4%
Composite vs. S&P 500 Cumulative Equity Performance (Net of Fees)
1-Year 3-Year 5-Year 10-Year 15-Year Since
Inception (19.25 Years)
Composite* -8.1% 18.9% 53.1% 71.7% 162.4% 526.7%
S&P 500 1.8% 39.8% 73.0% 96.9% 139.1% 297.7%
Please refer to the disclosure on the last page of this newsletter for additional discussion regarding the performance of the Composite.
Page | 5
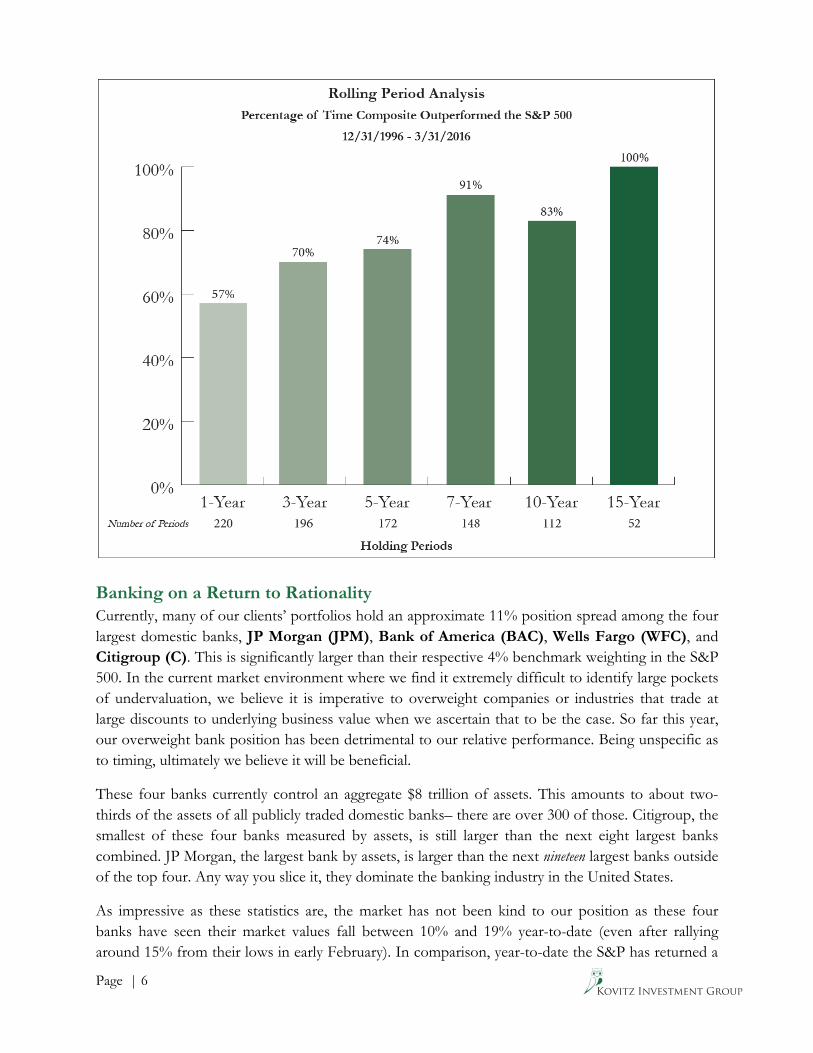
Please refer to the disclosure on the last page of this newsletter for additional discussion regarding the performance of the Composite. Rolling Returns The above performance presentation illustrates returns on a trailing basis as of March 31, 2016 (i.e. the return over a certain time period ending with just the most recent date). Our conviction in the investment discipline that has helped our clients build wealth for more than 19 years is strengthened when results are viewed on a rolling basis (i.e. the returns over a certain time period using all month-end dates), rather than just on a trailing basis. The chart below divides Composite results into rolling periods ranging from one to 15 years with the bars indicating the percentage of those periods our returns exceeded our benchmark over all the possible rolling periods.1 Rolling periods adjust for the distorted perception that the vagaries of any specific ending date can have on the results. For example, as the performance chart illustrates, the Composite has underperformed the most recent trailing 10-year period ending March 31, 2016. But this is just one 10 year period out of 112 10 year periods (using end of month values) that have occurred since Composite inception (January 1, 1997). Over all of those 10 year rolling periods, the Composite has outperformed the S&P 500 83% of the time. We believe these 112 observations hold more weight when considering the results than just the most recent 10-year period.
1 For example, the first one-year rolling period began January 1, 1997 and ended December 31, 1997. Each month thereafter begins a new, rolling one-year period (February 1, 1997 through January 31, 1998…March 1, 1997 through February 28, 1998…and so on).
$0
$1,000,000
$2,000,000
$3,000,000
$4,000,000
$5,000,000
$6,000,000
$7,000,000
1997 1998 1999 2000 2001 2002 2003 2004 2005 2006 2007 2008 2009 2010 2011 2012 2013 2014 2015 2016
KIG Difference Growth of $1,000,000 Investment
KIG DIFFERENCE
KIG TOTAL RETURN (WITH DIVIDENDS) S&P 500 TOTAL RETURN (WITH DIVIDENDS)
KIG $6,266,000
S&P 500 $3,976,000
Page | 6
Banking on a Return to Rationality Currently, many of our clients’ portfolios hold an approximate 11% position spread among the four largest domestic banks, JP Morgan (JPM), Bank of America (BAC), Wells Fargo (WFC), and Citigroup (C). This is significantly larger than their respective 4% benchmark weighting in the S&P 500. In the current market environment where we find it extremely difficult to identify large pockets of undervaluation, we believe it is imperative to overweight companies or industries that trade at large discounts to underlying business value when we ascertain that to be the case. So far this year, our overweight bank position has been detrimental to our relative performance. Being unspecific as to timing, ultimately we believe it will be beneficial.
These four banks currently control an aggregate $8 trillion of assets. This amounts to about two-thirds of the assets of all publicly traded domestic banks– there are over 300 of those. Citigroup, the smallest of these four banks measured by assets, is still larger than the next eight largest banks combined. JP Morgan, the largest bank by assets, is larger than the next nineteen largest banks outside of the top four. Any way you slice it, they dominate the banking industry in the United States.
As impressive as these statistics are, the market has not been kind to our position as these four banks have seen their market values fall between 10% and 19% year-to-date (even after rallying around 15% from their lows in early February). In comparison, year-to-date the S&P has returned a
Page | 7
little more than 1%. Whether it was fears surrounding declining interest rates, increasing defaults on loans to oil and gas companies, or the ever-present cloud of regulatory scrutiny (we’ll touch on each of these later), the crescendo of negative sentiment reached its recent peak in February when JPM, BAC, and C reached lows not seen for three years, and WFC touched a two-year low. In spite of the market’s recent gyrations, we remain as confident as ever that these four banks possess strong franchises and balance sheets that are as robust as they have been in decades.
At current levels, valuations for the group are undemanding with both Bank of America and Citigroup trading at large discounts to tangible book value (10% and 30%, respectively) while the four, in aggregate, command a P/E of 10x our estimate of current year’s earnings, which is well below the market’s multiple of 17x. However, just buying cheap stocks doesn’t do you any good unless they get less cheap at some point. Our feeling is that banks, in general, and these four in particular, are suffering through a period of intense negative sentiment that has become unhinged from their fundamentals. At some point, we believe this irrationality will subside and multiples will adjust higher. In order to fully explain why we feel this way, let’s take a step back and answer the basic question, “What is a bank?” Although the industry has come a long way since the 1930s, George Bailey does a pretty good job of answering that question in the holiday classic It’s a Wonderful Life. Addressing a crowd of depositors clamoring for the return of their money, George replies,
“No, but you’re thinking of this place all wrong. As if I had the money back in a safe. The money’s not here. Your money’s in Joe’s house. And in the Kennedy house, and Mrs. Macklin’s house, and a hundred others. Why you’re lending them the money to build, and then, they’re going to pay it back to you as best they can.”
In its simplest form, that’s a bank. It starts off with some capital (the bank’s equity, or book value), takes in deposits (the bank’s liabilities), and loans out the money (the bank’s assets). The difference between what the bank earns by charging interest on loans and what it pays depositors for the use of their funds is referred to as the net interest margin and makes up the bulk of the earnings of a traditional bank. While this simple form still exists, it is only one of many businesses contained inside the megabanks of today, which include operations in investment banking, capital markets, credit card issuance, asset management, and a variety of other complementary businesses.
The income generated from all of these businesses divided by the equity capital employed to produce it equals the bank’s return on equity. The return on equity divided by the ratio of a bank’s market valuation to its equity capital is effectively the expected return, into perpetuity, on an investment in a bank’s shares. This number for the four megabanks we own is, on average, 11%, which would be more than satisfactory. However, the mere fact that this number is that high means that the market is saying that the book value is inflated, the return on equity is unsustainable, or both. On these matters, we respectfully disagree with the market.
The main risk cited by the market consensus is that interest rates will remain low for a long period of time or, even worse, potentially fall further and possibly into negative territory. As for the former, that would be perfectly fine. Rates have already been low and bank earnings have been what they
Page | 8
have been. While lower rates would continue to be a headwind, earnings should continue to grow due to expanding loan volumes and ongoing cost reductions. From this point forward, current earnings would justify a higher stock price and we would also own an effectively free option on higher earnings if interest rates ever normalize higher.
The more difficult scenario for the banks would be if interest rates declined substantially from here, but this is neither a high probability scenario nor would it be catastrophic for the banks in our clients’ portfolios depending on their individual mix of businesses. While Bank of America could see its pre-tax income reduced by 20% if long-term interest rates declined 1% (roughly cutting the yield on the 10-year Treasury in half), Citigroup and JP Morgan would only see declines of approximately 1% and 2%, respectively. In aggregate, this collection of banks could even perform well under this scenario because the prices of their stocks seem to already imply that this scenario is inevitable.
The most difficult scenario for the banks would be if the Federal Reserve reduced the overnight target rate into negative territory. This could open a veritable Pandora’s Box of consequences that would almost certainly be detrimental to the operations of all banks. However, it is precisely for this reason that this scenario is so unlikely. The Federal Reserve under Janet Yellen has been exceedingly cautious, so pushing the financial system into an abyss of unknown consequence and depth simply to conduct a monetary policy experiment seems like the opposite of something the Fed would propose. Some Fed Governors have also publicly questioned whether such a target would even be legal under the laws governing the permissible actions of the Federal Reserve. Furthermore, the consensus among economists is that the conflicting incentives and distortions in financial decision-making caused by negative interest rates render them ineffective as a tool to stimulate the economy in the first place. Overall, we believe a negative interest rate policy is a very unlikely scenario and is recognized as such in our assessment of these banks’ intrinsic values using probabilistic scenario weightings.
Another risk that has been used by the market to hammer down the prices of bank stocks is that the disruption in the energy industry caused by the rapid decline in the price of oil over the last year and a half has led to significant distress in bank loan portfolios. Again, the risk of loans to oil and gas companies permanently impairing the banks our clients own is vastly overstated. On average, these energy-related loans make up less than 6% of these banks’ outstanding corporate credit portfolios and only about 2% of all outstanding loans. The distress in the energy sector is also far from a surprise to their lenders, and the banks have already increased their reserves against losses on these loans, meaning loan losses would have to exceed this level in order to have any effect on future earnings. Even in the most dire scenario where all energy loans are worthless and banks charge-off the whole loan book over the next year, book values would remain roughly where they are today as earnings from the rest of the business would fill the gap.
This is what banks do – they lend money and take credit risk. In the long run, through all types of market cycles, this has proven to be a profitable business when managed prudently. Jamie Dimon, the CEO of JP Morgan, aptly described the risk and the role of banks as it relates to loans to oil and gas companies on the company’s fourth quarter conference call.
Page | 9
“The oil folks have been surprisingly resilient. And remember, these are asset-backed loans, so a bankruptcy doesn’t necessarily mean your loan is bad. . . . And it’s also a philosophical thing. A bank is supposed to be there for clients in good times and bad times. . . . So the extent we can responsibly support clients, we’re going to. And if we lose a little bit more money because of it, so be it. And we’ve done that around the world. We did in 2007 and 2008 and 2009. We try to do it responsibly. If banks just completely pull out of markets every time something gets volatile and scary, you’ll be sinking companies left and right.”
The obvious implication of these words is that abandoning or otherwise mistreating your clients just because they are experiencing financial distress is bad business. Conversely, lending responsibly to clients and honoring your commitment, even if it results in some short-term pain, is the stuff that long-term relationships are made of and leads to a profitable partnership in the long run when the cycle turns. As a shareholder, this focus on long-term results is exactly what we want to hear.
The third risk frequently cited by critics of today’s banking business model is that an unfriendly regulatory environment will slowly squeeze the life out of the banking business. Again, we disagree. (Or, maybe we just think, in general, that most issues aren’t necessarily black and white. Every issue has nuances with pros and cons, and our job is to weigh all of that against what’s implied in a specific company’s valuation). JP Morgan, Wells Fargo, Bank of America, and Citigroup lived through the financial crisis of 2008 and grew larger and stronger. They suffered (and rightfully so) through countless regulatory investigations into their and (mainly) their acquisitions’ (some of which were essentially foisted upon them by the government) business practices during the financial crisis, paid tens of billions of dollars in fines and penalties, and they grew larger and stronger. They have abided by new capital rules designed to reduce the types of activities that contributed to the financial crisis and the probability of the devastating contagion that required government intervention, and they grew larger and stronger. John Pierpont “J.P.” Morgan, Henry Wells, William Fargo, Amadeo Giannini, and Samuel Osgood would stand in awe of what the banks they founded have become.
In fact, scale is everything in a world of high capital ratios and where risk-taking is limited by law, yet it is very difficult to achieve. The process of getting big has become a substantial obstacle for any bank to navigate because the Federal Reserve requires a bank to hold more capital (as a percentage of assets) as the bank becomes more systemically important to the overall economy. This serves as a deterrent to getting big because a bank would have to voluntarily reduce its return on equity as it is required to hold more capital. This would likely lead to a lengthy period of earnings stagnation combined with increased regulatory scrutiny, which would be a difficult path for investors to accept. Since the megabanks in our clients’ portfolios have already navigated this difficult path, their place atop the financial system looks to remain unchallenged for the foreseeable future.
While the megabanks may never return to the highly levered, mid- to high-teens returns on equity state they occupied before the financial crisis of 2008 (which is undoubtedly a good thing for the “real” economy), they are better capitalized, more able to weather adverse conditions, and more diversified in terms of business lines and exposure to changing interest rates than they have been in decades. Their sheer size and importance to the overall economy have created a nearly impenetrable
Page | 10
moat around their businesses, and, perhaps contrary to the original intent, the heightened regulatory scrutiny and capital requirements have actually served to make their moats even wider. At current prices, we don’t expect spectacular returns going forward, but we do believe the most likely outcome is more-than-satisfactory returns that outpace the overall market, coupled with a lower risk of a permanent loss of capital than the overall market. That’s a combination we will happily include in our clients’ portfolios whenever we can find it.
Portfolio Activity While we are long-term investors, we always seek to optimize the risk/return profile of the portfolio by changing the weightings of existing holdings and comparing current portfolio holdings with new investment opportunities, making adjustments when appropriate. Volatility creates the opportunities to make these adjustments. By allocating capital away from more fully valued companies and adding capital to companies trading at a larger discount to our estimate of intrinsic value, we attempt to reduce risk and improve both our price-to-value ratios and our clients’ long-term prospects. During the quarter, we initiated one new position and added to several existing positions at deeper discounts. We paid for these additions by reducing position sizes in less discounted companies and exiting certain positions altogether. Other than that, we aggressively sat on our hands, knowing that too many portfolio maneuvers at the height of extreme volatility can be counter-productive. We initiated our new position in CBRE Group (CBG); formerly and more popularly known as CB Richard Ellis Group. CBRE is a global commercial real estate services firm offering a wide range of services to tenants, owners, lenders and investors in office, retail, industrial, multi-family and other types of commercial real estate in all major metropolitan areas across the globe. Traditionally known as primarily a commercial real estate broker and leasing agent that relies on transaction flow for revenue, the company entered the property management business in 2006 with the acquisition of Trammell Crow. Several additional acquisitions and impressive organic growth over the past five years have continued to transform CBRE from their traditional identity into the diversified commercial real estate firm we see today where more than half of their 2016 revenue is expected to come from their recurring, fee-based property and asset management outsourcing business. The current combination of the steady, but lower margin, property management outsourcing business and the lumpier, but higher margin, transaction and leasing business creates a formidable company that offers ample opportunities for cross-selling and consolidation in the highly fragmented commercial real estate services industry. Prior to our entry, the price of the stock had fallen approximately 25% as fears that a global economic slowdown would result in a slowdown in commercial real estate transaction and leasing activity. While certainly a plausible scenario, we also believe the severity of the sell-off ignores the transformation of the company over the last half decade. At 12x our 2016 earnings estimate, we believe this is an attractive entry point for a company that is dominant in their industry and whose overall business should be resilient in the face of economic headwinds even if their sales and leasing divisions experience some short-term pain.
Page | 11
Among the positions added to were American Airlines (AAL), American Express (AXP), Aon (AON), Bank of America, CarMax (KMX) and Harley-Davidson (HOG). We reduced our position in American International Group (AIG) and exited Corning (GLW) and Wal-Mart (WMT). Also during the quarter, Berkshire Hathaway (BRK.A/BRK.B) completed its acquisition of our holding in Precision Castparts (PCP) for $235 per share in cash. We appreciate the faith that you, our partners, have placed in us to manage your capital on a long-term basis. Your patient capital and shared long-term time horizon provide a tremendous advantage as we go about our investment decision making process. Managing other people’s money is an enormous responsibility and we hope you take comfort in the fact that we are doing the exact same thing with our own money as we do with yours. Best Regards,
Kovitz Investment Group Kovitz Investment Group This newsletter has been prepared by Kovitz Investment Group (KIG), an investment adviser registered under the Investment Advisers Act of 1940, and is a quarterly newsletter for our clients and other interested persons. Within this newsletter, we express opinions about direction of the market, investment sectors and other trends. The opinions should not be considered predictions of future results. Discussion in this newsletter relating to a particular company is not intended to represent, and should not be interpreted to imply, a past or current specific recommendation to purchase or sell a security, and the companies discussed do not include all the purchases and sales by KIG for clients during the quarter. A list of specific recommendations made by KIG over the past year can be made available upon request. In addition, please note that any performance discussed in this newsletter should be viewed in conjunction with complete performance presentations that we update on a periodic basis. Such presentations are available at www.kovitz.com, or by calling us at 312-334-7300. Information contained in this newsletter which is based on outside sources is believed to be reliable, but is not guaranteed or not necessarily complete. Past performance does not guarantee future returns.
*The returns for the equity portion of your individual account may differ somewhat from the Composite due to slight variations in account holdings, cash position, and other client-specific circumstances. T 312.334.7300 F 312.334.7308 115 South LaSalle Street, 27th Floor, Chicago, IL 60603 www.kovitz.com
Mitchell Kovitz, CFA, CPA 312.334.7301 [email protected] Marc Brenner, JD, CPA 312.334.7302 [email protected] Andrea Cohen, CFP®
312.334.7312 [email protected] Ed Edens, MBA, CFP®
312.334.7333 [email protected]
Mary Anderson, MBA
312.334.7355 [email protected] Jenny Boyke, MAS, CPA, CFP®
312.334.7316 [email protected] David Castro, CFP®
312.334.7361 [email protected] John Conway, CRPC®
312.334.7343 [email protected] Amanda Falkum, CFP® 312.334.7351 [email protected] Debbie Hopkins, MBA, CFP® 312.334.7325 [email protected]
Skip Gianopulos, JD, LLM, CFP®
312.334.7303 [email protected] Leonard Gryn, CPA
312.334.7360 [email protected] Joel Hirsh, CFA
312.334.7307 [email protected] Mark Rosland
312.334.7322 [email protected]
Kate Jonynas, CFP® 312.334.7309 [email protected] Sanford Kovitz, JD, MBA 312.334.7352 [email protected] William Lee 312.334.7335 [email protected] Melissa Mabley Martin, CFP® 312.334.7328 [email protected] Bradford Madison, MBA, CTFA 312.334.7347 [email protected] Christopher Nicholson, CFP® 312.334.7319 [email protected]
Ted Rupp, MBA
312.334.7317 [email protected] Jonathan Shapiro, CFA, MBA
312.334.7324 [email protected] Bruce Weininger, CPA, CFP®
312.334.7334 [email protected]
Jack Nicholson, MBA, CFP® 312.334.7323 [email protected] Ryan Pace, CFP® 312.334.7348 [email protected] Jason Petitte, CFA
312.334.7311 [email protected] Peter Rudman 312.334.7327 [email protected] Rich Salerno
312.334.7304 [email protected] Jesse Stumpf, CFA
312.334.7320 [email protected]