Embed Size (px)
Citation preview
Investment, Trading, and Portfolio Management
An Interactive Qualifying Project Report
Submitted to the Faculty of the
WORCESTER POLYTECHNIC INSTITUTE
in partial fulfillment of the requirements for the
Degree of Bachelor of Science
by
Joshua A. Lambert
Fred E. Seymour
Pak H. Wu
Date: May 25, 2012
Advisor, Professor Hossein Hakim
This report represents the work of one or more WPI undergraduate students
submitted to the faculty as evidence of completion of a degree requirement.
WPI routinely publishes these reports on its web site without editorial or peer review.
ii
Abstract The goal of this project was to get a solid understanding of the forex market in order to
launch a money management company. In order to be successful in terms of trading, many
methods regarding forex trading were considered and were systematically tested to determine the
best strategies. This included using different fundamental and technical indicators, and
programming. To launch a money management company, the legal structure, location, money
management, risk management, government regulation, licensing, and marketing strategies were
examined.
iii
Table of Contents Abstract ........................................................................................................................................... ii
List of Figures ............................................................................................................................... vii
1.0 – Introduction ............................................................................................................................ 1
1.1 – History of Finance/Markets ............................................................................................... 1
1.2 – Project Overview ............................................................................................................... 2
2.0 – Background ............................................................................................................................ 4
2.1 – Overview of the Stock Market and Basic Terms ............................................................... 4
2.2 – The Forex Market .............................................................................................................. 5
3.0 – Methodology - Trading in the Forex Market ......................................................................... 8
3.1 – Trading Platforms .............................................................................................................. 8
3.1.1 – MetaTrader4 ................................................................................................................ 8
3.1.2 – TradeStation 9.0 ........................................................................................................ 12
3.2 – Example Trading Plan/Strategy ....................................................................................... 16
3.3 – Money Management ........................................................................................................ 19
3.3.1 – Loss Management ..................................................................................................... 19
3.4 – Fundamental Indicators .................................................................................................... 19
3.4.1 – GDP........................................................................................................................... 20
3.4.2 – Nonfarm Payroll........................................................................................................ 20
3.4.3 – Interest Rate .............................................................................................................. 21
3.5 – Technical Indicators ......................................................................................................... 21
3.5.1 – Support/Resistance .................................................................................................... 22
3.5.2 – Fibonacci Indicator ................................................................................................... 23
3.5.3 – Elliott Wave Theory .................................................................................................. 24
3.5.4 – FOREX Pivot Point................................................................................................... 27
3.5.5 – Bollinger Bands ....................................................................................................... 28
3.5.6 – Moving Averages ...................................................................................................... 30
3.5.7 – Simple Moving Averages ......................................................................................... 31
3.5.8 – Exponential Moving Averages ................................................................................. 32
3.5.9 – FOREX Stochastic Indicator..................................................................................... 34
3.5.10 – MACD Indicator ..................................................................................................... 35
iv
3.5.11 – CCI Indicator .......................................................................................................... 36
3.5.12 – Average True Range Indicator ................................................................................ 38
3.5.13 – ADX Indicator ........................................................................................................ 39
3.5.14 – Parabolic SAR ......................................................................................................... 41
3.5.15 – Relative Strength Index........................................................................................... 42
3.5.16 – Ichimoku Kinko Hyo .............................................................................................. 43
3.5.17 – Swing Trading ......................................................................................................... 45
3.5.18 – Spinning Top and Railway Track ........................................................................... 46
4.0 – Launching a Forex Money Management Company ............................................................. 48
4.1 – Location Advantage ......................................................................................................... 48
4.2 – Legal Structure ................................................................................................................. 49
4.2.1 – Sole Proprietorship: .................................................................................................. 49
4.2.2 – General Partnership:.................................................................................................. 50
4.2.3 – Limited Partnership:.................................................................................................. 50
4.2.4 – Limited Liability Partnership: ................................................................................... 51
4.2.5 – Corporation ............................................................................................................... 51
4.2.6 – Limited Liability Company....................................................................................... 52
4.3 – Money and Risk Management ......................................................................................... 52
4.4 – Government Regulation ................................................................................................... 53
4.5 – Licensing .......................................................................................................................... 55
4.6 – Marketing Strategy........................................................................................................... 55
Conclusion .................................................................................................................................... 58
Recommendations ......................................................................................................................... 59
References ..................................................................................................................................... 61
Appendix A – Global Development and its Impact on the Forex Market .................................... 76
A-1 Election of Mr. Yoshihiko Noda as Japan’s new Prime Minister ..................................... 76
A-2 The Tying of the Swiss National Bank to the Euro ........................................................... 77
A-3 Operation Twist ................................................................................................................. 79
A-4 Japan’s Situation ................................................................................................................ 81
A-5 The Situation in Europe ..................................................................................................... 81
A-6 Euro Zone .......................................................................................................................... 84
v
A-7 Development Late October to Early December 2011 ........................................................ 86
A-8 Development January to February 2012 ............................................................................ 90
Appendix B – Gartman Letter Summary ...................................................................................... 92
Thursday November 17th
.......................................................................................................... 92
Friday November 18th
............................................................................................................... 92
Monday November 21st............................................................................................................. 93
Tuesday November 22nd
........................................................................................................... 93
Wednesday November 23rd
....................................................................................................... 93
Thursday November 24th
.......................................................................................................... 93
Friday November 25th
............................................................................................................... 94
Monday November 28th
............................................................................................................ 94
Tuesday November 29th
............................................................................................................ 94
Wednesday November 30th
....................................................................................................... 95
Thursday December 1st ............................................................................................................. 95
Friday December 2, 2011 .......................................................................................................... 96
Monday December 5, 2011 ....................................................................................................... 96
Tuesday December 6, 2011....................................................................................................... 96
Wednesday December 7, 2011 ................................................................................................. 97
Thursday December 8, 2011 ..................................................................................................... 97
Wednesday January 11th
........................................................................................................... 98
Thursday January 12th
............................................................................................................... 98
Friday January 13th
.................................................................................................................... 98
Monday January 16th
................................................................................................................. 98
Wednesday, January 18th
.......................................................................................................... 99
Thursday, January 19th
.............................................................................................................. 99
Friday, January 20th
................................................................................................................... 99
Friday January 27th
.................................................................................................................... 99
Monday January 30th
............................................................................................................... 100
Tuesday January 31st ............................................................................................................... 100
Wednesday February 1st .......................................................................................................... 100
Thursday February 2nd
............................................................................................................ 100
vi
Appendix C – Our Trades in the Forex Market .......................................................................... 101
Pak’s Trades ............................................................................................................................ 101
Sample Trades ..................................................................................................................... 106
Josh’s Trades ........................................................................................................................... 110
Trade 1 ................................................................................................................................ 110
Trade 2 ................................................................................................................................ 111
Trade 3 ................................................................................................................................ 113
Trades 4 & 5........................................................................................................................ 114
Trades 5 & 6........................................................................................................................ 116
Trade 7 ................................................................................................................................ 117
Trades 8 & 9........................................................................................................................ 119
Trade 10 .............................................................................................................................. 120
Trade 12 .............................................................................................................................. 123
Trade 13 .............................................................................................................................. 124
Trade 14 .............................................................................................................................. 125
Trade 15 .............................................................................................................................. 126
Trade 16 .............................................................................................................................. 127
Trades 17, 18, & 19............................................................................................................. 128
Fred’s Trades .......................................................................................................................... 130
Appendix D – Programming Projects ......................................................................................... 132
Group Project .......................................................................................................................... 133
Individual Projects .................................................................................................................. 139
Pak’s Programming Project ................................................................................................ 139
Josh’s Programming Project ............................................................................................... 143
Fred’s Programming Project ............................................................................................... 144
Appendix E – Forex Websites .................................................................................................... 147
vii
List of Figures
Figure 1 - MT4 Chart Properties ..................................................................................................... 9
Figure 2 - MT4 Order Window ..................................................................................................... 10
Figure 3 - MT4 Stop Loss/Take Profit .......................................................................................... 11
Figure 4 - Indicators In MT4 ........................................................................................................ 11
Figure 5 - TradeStation 9.0 Window ............................................................................................ 12
Figure 6 - TradeStation 9.0 Chart ................................................................................................ 13
Figure 7 - TradeStation 9.0 View Window ................................................................................... 13
Figure 8 - TradeStation 9.0 ........................................................................................................... 13
Figure 9 - TradeStation 9.0 Order Bar .......................................................................................... 14
Figure 10 - Fibonacci Indicator..................................................................................................... 24
Figure 11 - Colored Elliot Wave Theory; 5 wave trend corrected and reversed by 3 wave
countertrend in a bull market. ....................................................................................................... 25
Figure 12 - Elliott Wave Theory in Action ................................................................................... 27
Figure 13 – Forex Pivot Point ....................................................................................................... 28
Figure 14 - Bollinger Bands .......................................................................................................... 30
Figure 15 - Bollinger Bands .......................................................................................................... 30
Figure 16 - 10 EMA, 20 EMA ...................................................................................................... 31
Figure 17 - 5 SMA, 30 SMA, 62 SMA ......................................................................................... 32
Figure 18 - 30 EMA Compared to 30 SMA ................................................................................. 33
Figure 19 - Stochastic Indicator .................................................................................................... 34
Figure 20 - Stochastic Indicator .................................................................................................... 35
Figure 21 - MACD in Action ....................................................................................................... 36
Figure 22 - CCI Indicator .............................................................................................................. 37
Figure 23 - Average True Range Indicator ................................................................................... 39
Figure 24 - ADX Indicator ............................................................................................................ 40
Figure 25 - ADX Indicator ............................................................................................................ 41
Figure 26 - Parabolic SAR ............................................................................................................ 42
Figure 27 - RSI Example .............................................................................................................. 43
Figure 28 - Ichimoku Kinko Hyo.................................................................................................. 44
Figure 29 - Swing Trading ............................................................................................................ 46
viii
Figure 30 - Spinning Top .............................................................................................................. 46
Figure 31 - Railway Track ............................................................................................................ 47
Figure 32 - Macroeconomic Issues EURUSD 1.4 Mark .............................................................. 85
Figure 33 - B Term Trade Summary ........................................................................................... 102
Figure 34 - B Term Trade Summary 2 ........................................................................................ 105
Figure 35 - Trade Methodology Example ................................................................................... 106
Figure 36 - Trade Methodology Example 2 ................................................................................ 107
Figure 37 - Methodology Example 3 .......................................................................................... 108
Figure 38 - Trade 1 EURUSD 1-min .......................................................................................... 110
Figure 39 - Trade 2 EURUSD 1-min .......................................................................................... 111
Figure 40 - Trade 2 Zoom-in ...................................................................................................... 111
Figure 41 - Trade 3 EURUSD .................................................................................................... 113
Figure 42 - Trades 4&5 EURUSDD 1-min ................................................................................ 114
Figure 43 - Trades 5&6 EURUSD - 15 min ............................................................................... 116
Figure 44 - Trades 5&6 EURUSD - 5 min ................................................................................. 117
Figure 45 - Trade 7 ..................................................................................................................... 118
Figure 46 - Trades 8 & 9 EURUSD, AUDUSD - 5 min............................................................. 119
Figure 47 - Trade 10 ................................................................................................................... 120
Figure 48 - Trade 11 ................................................................................................................... 121
Figure 49 - Trade 12 ................................................................................................................... 123
Figure 50 - 30 Minute Chart Support Level................................................................................ 124
Figure 51 - Trade 14 EURUSD 5-min ........................................................................................ 125
Figure 52 - Trade 15 ................................................................................................................... 126
Figure 53 - Trade 16 EURUSD 5-min ........................................................................................ 127
Figure 54 - Trades 17-19............................................................................................................. 128
Figure 55 - Fred's Trade Summary ............................................................................................. 131
Figure 56 - Fred's Trade Summary ............................................................................................. 132
Figure 57 – 15M chart Results .................................................................................................... 134
Figure 58 – 15M chart Results .................................................................................................... 135
Figure 59 Pak's Progam's Backtest, 25MA and 50MA ............................................................... 140
Figure 60 Pak's Program's Backtest, 12MA and 24MA ............................................................. 140

ix
Figure 61 Pak's Program's Backtest, 18MA and 36MA ............................................................. 141
Figure 62 Pak's Program's Backtest, 25MA and 50MA with Stochastic .................................... 142
1
1.0 – Introduction The first step anyone must take before trying to invest in the forex market is to develop a
complete understanding of the structure of the stock market and forex markets. There are a lot of
important concepts and terminology to learn before one can proceed further in their pursuit of
managing money within the forex market. This is a breakdown of the basic terms involved in
investment and trading. It will cover everything from the basics to different types of analysis and
trading techniques.
1.1 – History of Finance/Markets Today the stock market has millions of investors and billions of dollars in circulation, but
this was not always the case. The first evidence of an exchange system dates back over two
hundred years ago in Manhattan, where people would trade silver for slips of paper that said they
owned shares of cargo on ships that came into the harbor on a daily basis. Trade flourished with
this new system.
Another practice that led to the institution of the stock exchange was the issuance of
bonds, particularly war bonds. This dates back to the American Colonial War, where the
government was selling war bonds to raise funds for the war. The bonds would mature in value
over time and could be exchanged for a profit in a certain number of years. The first banks would
also sell shares of their company to raise money. This is very similar to how new companies will
sell shares of their companies to investors to raise money in today’s market.
At the time, Wall Street was the place where most transactions of this nature would take
place. As a result, in 1792 a group of twenty-four men signed an agreement, known as the
“Button Agreement,” that officially started the New York Stock Exchange (NYSE). They set up
2
a system where they would trade shares amongst themselves and charge others fees to trade for
them.
There were many stocks that were, in one way or another, not good enough to be traded
within the NYSE, and were thus traded on the curb outside. This became known as “curb
trading,” and would eventually develop into what is known today as the American Stock
Exchange (AMEX). These have been joined today by NASDAQ and countless other
international stock exchanges. Regardless, trading in the stock market was a new way to make
and manage money, and it was the beginning of a new global economy.
The Industrial Revolution in the twentieth century brought with it a surge of activity in
the stock market. As more and more money was flowing through Wall Street, more investors
flocked to the stock market to get their piece of the action. This completely changed the dynamic
of the American lifestyle and created many successful entrepreneurs virtually overnight.
With the huge surge in activity in the stock market and following the stock market crash
of 1929, the government realized it needed to take a more active role in regulating exchange to
protect small investors. For this reason, in 1934 Congress passed the Securities and Exchange
Act, which resulted in the Securities and Exchange Commission (SEC). The SEC is responsible
for overseeing and regulating all trading within the market.
1.2 – Project Overview In the past seven months, teams of three to five set out to establish the guidelines for
launching a successful money management company through investment in the forex market.
The research and progress through the duration of the project was split into three major steps that
would build upon one another and lead to a more complete understanding of the material. The
first necessary step was to familiarize ourselves with both the stock market and the forex market
3
through research. This research would cover a wide range of topics, from a simple review of
basic terms and concepts to a complex breakdown of different analysis and trading techniques.
The next step would be hands on experience in the forex market, through a real-time simulated
account. First, there was a focus on trading individually, familiarizing ourselves with different
trading platforms, and building a rigid trading and money management plan. The focus then
shifted into trading as a group and developing our trading plans further, both individually and as
a group. This would transition quite nicely into the third and final step, which would be
conducting research in the necessary attributes of a money management company investing in
the forex market.
This paper will cover in depth the necessary background information to legally and
comfortably invest both your own and others’ funds in the forex market. It will be organized to
mimic the path through which we progressed our own understanding of the material –
concentrating on each individual step in order and developing chronologically. The results of our
research reflect our own personal interests and may serve as recommendations. There are the
various choices and pathways one can take in creating a company of this nature and show what
the ideal steps were. Ultimately it will be up to the reader to decide what suits them best.
4
2.0 – Background
2.1 – Overview of the Stock Market and Basic Terms Stock is “a type of security that signifies ownership in a corporation and represents a
claim on part of the corporation's assets and earnings.” (Investopedia). A person who owns stock
in a company, or a shareholder, technically owns a certain percent of that company’s assets,
depending on how many shares they hold. Instead of taking out massive loans, company’s sell
stock to raise money to cover start-up costs. Stock exchanges are places where people can trade
stocks and bonds. The stock market’s hours of operation are 9:30 a.m. to 4:00 p.m. Eastern
Standard Time, Monday through Friday. Short sessions, which end at 1:00 p.m., are held on New
Year’s Day, Martin Luther King, Jr. Day, Washington’s Birthday, Good Friday, Memorial Day,
Independence Day, Labor Day, Thanksgiving, and Christmas.
An average person would normally trade stocks by hiring a professional trader, or a stock
broker. Stock brokers employ a lot of different methodologies to make decisions on how to trade
stock. Many professionals are highly educated in economics, finance, mathematics, and
computer science. They use knowledge of current events and trends in recent trading, among
other things, to make predictions about the market and make smart investments. Traders use
“stock screens” to keep constant track of what is going on, so they can make their move when
they see something that is desirable to them.
Stock traders use either fundamental analysis, technical analysis, or a combination of the
two to make decisions in the stock market. These two methods are based on different types of
indicators. Fundamental analysis is based off knowledge of economics while technical analysis is
based off trends in the stock market. Someone who uses fundamental analysis would focus more
on current events and economic factors that would cause the price of a stock to fluctuate. They
look at balance sheets, cash flow statements, and income statements to try to evaluate the true
5
value of a company. Someone using technical analysis would base their judgments off recent
price changes and use these to predict where the stock would likely go next. Technical traders do
not think the value of a company is useful in trading. They study charts to get all their
information.
2.2 – The Forex Market Another type of trading is foreign currency exchange, more commonly known as forex
trading. Forex traders work off the relative value of different currencies around the world. Forex
trading is usually done through a broker or a market maker. It is mainly done over the internet
and with just a few clicks a trader can place and order. The broker will then pass the order to a
partner in the Interbank Market, and when the trade is closed the loss or gain will be credited to
the trader’s account. This can quite often be a very quick process. The forex market is open from
Sunday at 5:15 p.m. at Sydney until Friday at 4:00 p.m. Eastern Standard Time. It operates 24
hours a day, because of time differences all around the world, and likewise it has been said that
the forex market never sleeps.
Fundamental and technical analysis can also be used in forex trading. Like trading in the
stock market, fundamental analysis in forex depends on economic factors. It would require a
good eye for what events within a country would cause a rise or drop in the relative value of their
currency. For example, a country struck by a natural disaster would need foreign aid, and the
value of their currency would likely drop as a result. Technical analysis in forex trading also
relies on the ability to read a chart. Learning how to read a forex chart can be very complicated,
but it is also very useful. Charts vary in style and time frame. Different types of charts are
Japanese candlesticks, line charts, and bar charts, and their time frames can vary from as little as
one second to as much as ten years. All have their own benefits.
6
Types of indicators used in forex trading are oscillators, Larry Williams Indicators,
moving averages, and momentum indicators. Oscillators are based off of identifying highs and
lows and turning points. For example, when a certain stock has been declining for a while and is
reaching one of its all-time lows, an investor may view this as a good time to buy, because it is
due for a rebound. This may also be risky business, however, because sometimes these
downward trends don’t stop and lead to bankruptcy. Larry Williams Indicators are a bunch of
technical tools developed by Larry Williams in the 1980s. Moving averages measure the
momentum and direction of certain trends. They compare current market values to market
averages, believing that prices usually fluctuate around the average over a given period of time.
Momentum indicators are somewhat a mix of oscillators and moving averages. Traders that use
this method try to pinpoint where the price action is at its height to make large gains quickly.
Fundamental and technical indicators will be explored more in depth.
The terms spread, leverage, pip, and margin are all important in understanding forex
trading. Spread is the difference between buy and sell price for the same thing from a market
maker. In other words, a market maker will buy for one price and sell for another, so if the
market price doesn’t change, a trader will actually lose money. Pips are used to describe the
change in currency rates. One pip is equal to 0.0001, except for in Yen, where one pip is 0.01.
This is because currency rates do not change by a lot, so it is easier to express it in pips. Margin
is a type of collateral used by trading providers to make sure an investor can pay up in the case of
large losses. It is a deposit on the trading account to cover potential future losses. Leverage is
allowing a trader to play with a larger amount of money than they actually deposited. It can
allow a trader to control anywhere from 50-400 times more than the amount they deposited,
allowing for larger gains but also putting all their money at risk.
7
Two more important terms in trading stocks are long and short. Going long refers to the
process of buying low and selling high. A trader, who expects a certain stock to increase in value
in the future, will buy a certain number of shares and sell them when they have reached a
desirable price. Selling short is a little trickier. If a trader expects that a certain stock will
decrease in value for whatever reason, they can sell short to try to profit from this. They basically
borrow shares of said stock from their broker and sell that at the current market price and then
use this money to buy the shares back once the prices have fallen to a target level. Selling short
can be very risky, however, because the stock market is inevitably unpredictable.
Another important concept to know about as a trader is hedge funds. A hedge fund is a
privately managed portfolio of investments, which uses highly advanced trading strategies in
both domestic and international markets with the goal of generating high returns. They are used
to offset losses during a market downturn and generate returns higher than traditional stock and
bond investments. Because they are private, they are open to a limited number of investors and
require a very high initial investment. In tight times, hedge funds would look to commodities
such as gold to make money, in what would otherwise seem an unprofitable situation.
8
3.0 – Methodology - Trading in the Forex Market
3.1 – Trading Platforms There are a variety of trading platforms you can use for forex trading and below are the
tutorials for the two we had used; MetaTrader4 and TradeStation 9.0.
3.1.1 – MetaTrader4
MetaTrader4 is a very common and user friendly currency trading platform. Below are
the fundamentals of using MetaTrader4:
First you want to set up your graphs and the currency you want to see so right click on the side
with all the symbols and click Chart Window to see the chart window of it. Up top you will see
the time intervals for each chart: . Next, you can
change the appearance of the price movements such as lines, bars, or candlesticks.
After everything is all set, you can also change the background of your chart so it
will save ink if you choose to print it or have less strain on your eyes. To do this, simply right
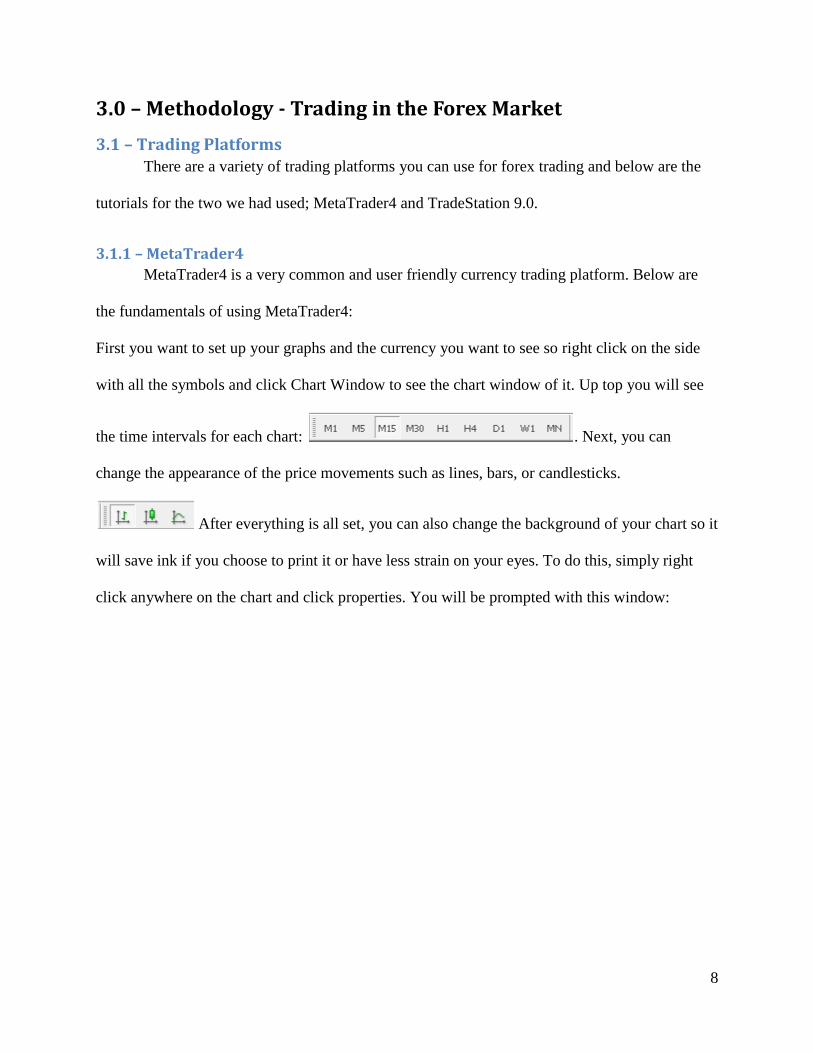
click anywhere on the chart and click properties. You will be prompted with this window:
9
Figure 1 - MT4 Chart Properties
In this window, you can use their convenient color schemes that MT4 has built in or set up your
own colors for everything.
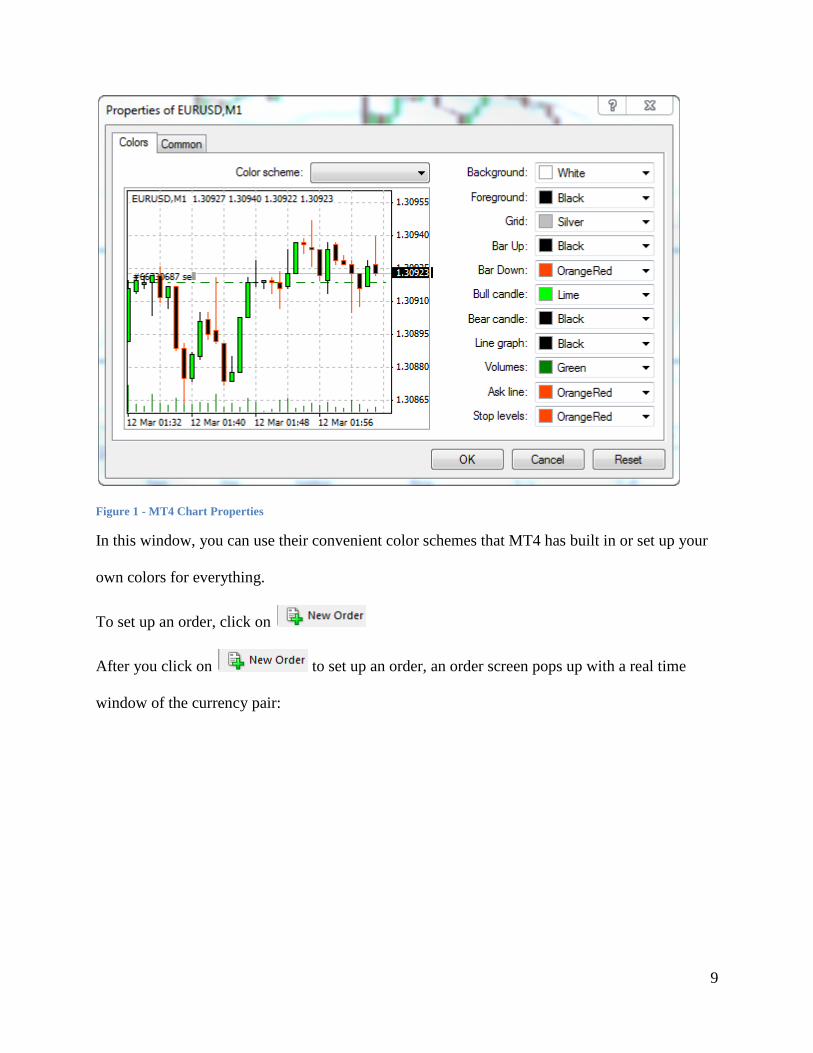
To set up an order, click on
After you click on to set up an order, an order screen pops up with a real time
window of the currency pair:
10
Figure 2 - MT4 Order Window
In this window, you can pick the currency you want to go short or go long on. You can pick the
lot size by the Volume: drag down box and you can type a comment so you know what happened
and why you traded. The Type drop down box you see is to set either an instant order or a
pending order to execute when certain conditions are met. The bottom two buttons in red and
blue does a short or does a long. Notice how you can not set stop loss or set profit when you do
an instant buy. You will have to click on on the bottom of the terminal and then right
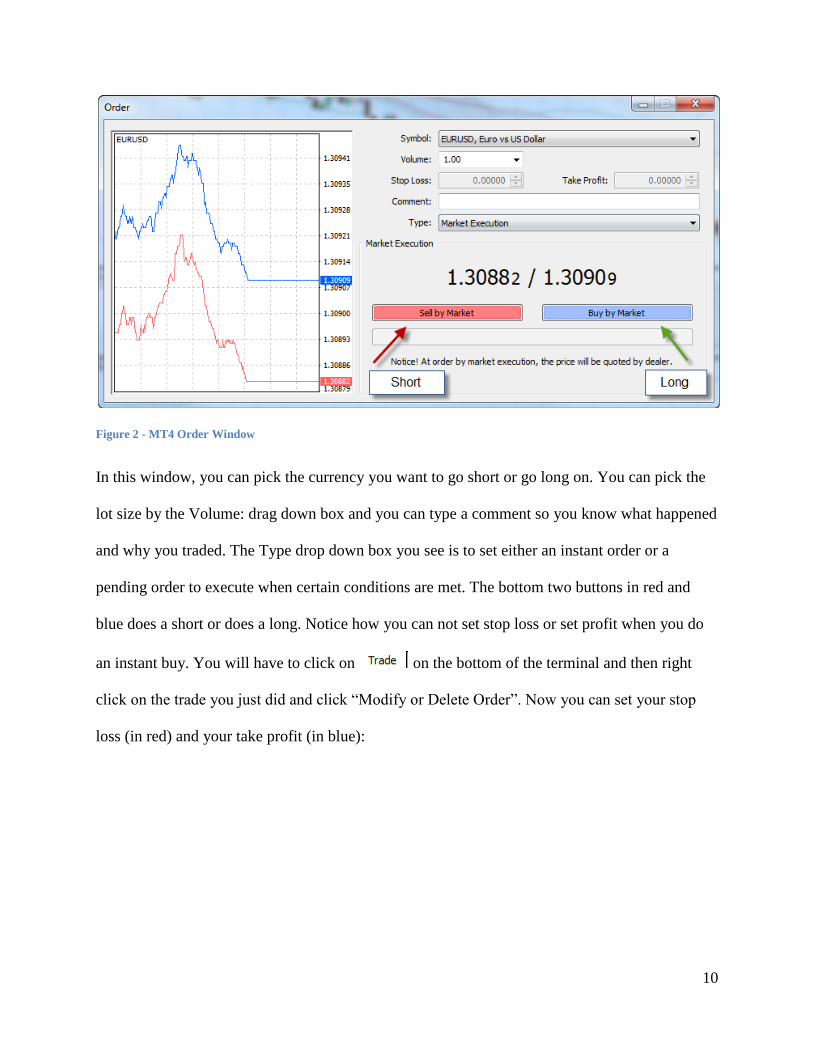
click on the trade you just did and click “Modify or Delete Order”. Now you can set your stop
loss (in red) and your take profit (in blue):
11
Figure 3 - MT4 Stop Loss/Take Profit
Once you set up your take profit and your stop loss and you want to close the order before either
one hits, you can right click your trade again in the Trade terminal and click “Close Order.” Now
on the bottom it will has the close button in yellow.
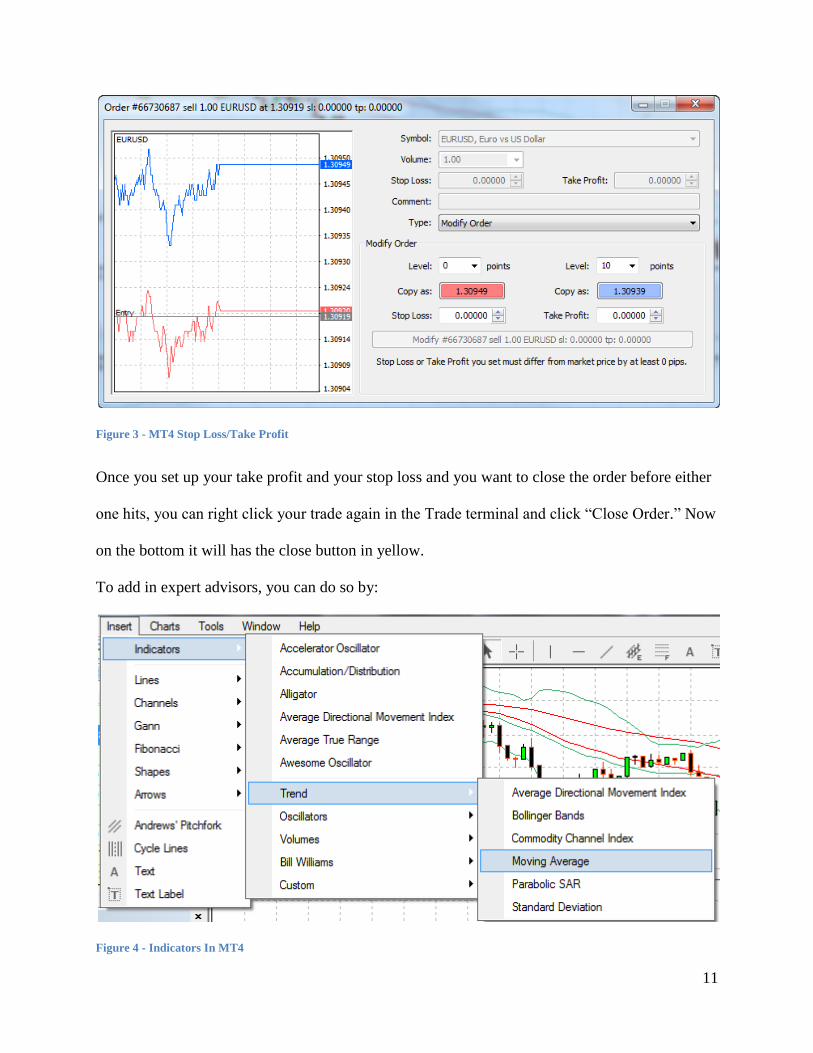
To add in expert advisors, you can do so by:
Figure 4 - Indicators In MT4
12
When you set up all the parameters on the indicator and you want to either adjust it or delete,
simply right click on the indicator on the graph and you can modify or delete it.
3.1.2 – TradeStation 9.0
Another very commonly used trading platform is TradeStation 9.0. It offers similar
features as MetaTrader, but also has a little more to offer. However, it is a little more difficult to
get acclimated with the software. These are the basics to navigating TradeStation 9.0 and using
its basic functions.
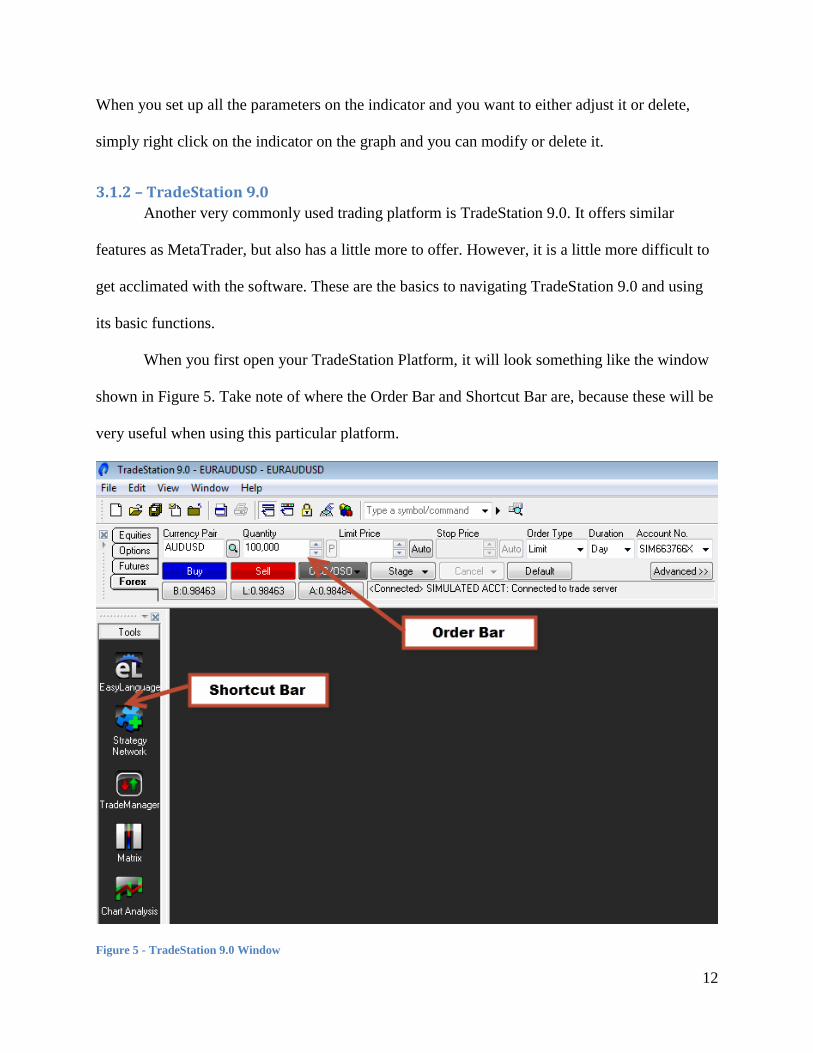
When you first open your TradeStation Platform, it will look something like the window
shown in Figure 5. Take note of where the Order Bar and Shortcut Bar are, because these will be
very useful when using this particular platform.
Figure 5 - TradeStation 9.0 Window
13
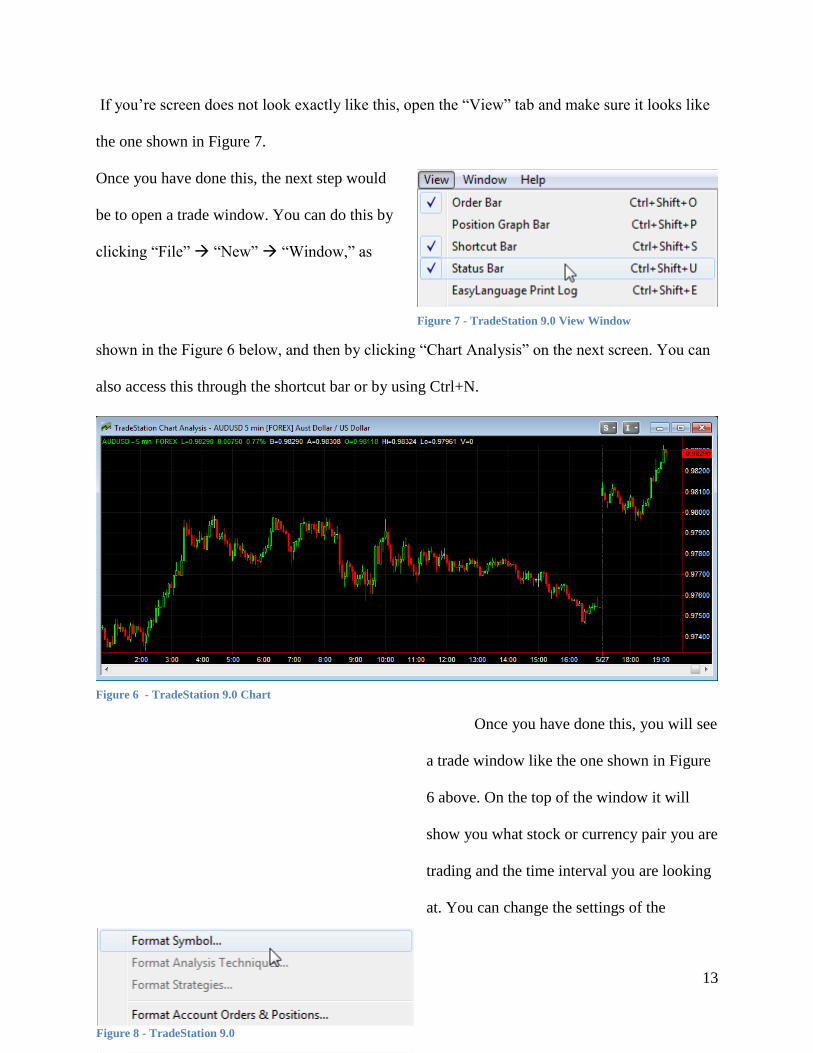
If you’re screen does not look exactly like this, open the “View” tab and make sure it looks like
the one shown in Figure 7.
Once you have done this, the next step would
be to open a trade window. You can do this by
clicking “File” “New” “Window,” as
shown in the Figure 6 below, and then by clicking “Chart Analysis” on the next screen. You can
also access this through the shortcut bar or by using Ctrl+N.
Once you have done this, you will see
a trade window like the one shown in Figure
6 above. On the top of the window it will
show you what stock or currency pair you are
trading and the time interval you are looking
at. You can change the settings of the
Figure 7 - TradeStation 9.0 View Window
Figure 6 - TradeStation 9.0 Chart
Figure 8 - TradeStation 9.0
14
window by right clicking anywhere in the window and selecting “Format Symbol” as shown in
Figure X. From here you will be able to change which stock or currency pair you are viewing,
the time interval, and the bar type, among other things. You can also change colors and overall
appearance by clicking “Format Window” from this same menu bar.
There are a lot of technical indicators built into TradeStation. You can access these by
clicking “Insert” “Indicator,” at which point you will be able to choose from a large list of
indicators, including everything from simple moving averages, to oscillators and Fibonacci
numbers. All of your indicators can be accessed and edited by clicking “Format” “Analysis
Techniques.” You can edit the color of the indicator as well as the numerical values that go into
creating the indicator.
Once you have your window set up the way you like it, with your desired currency pair,
time interval, indicators, colors, etc., you are ready to make some trades. The easiest way to
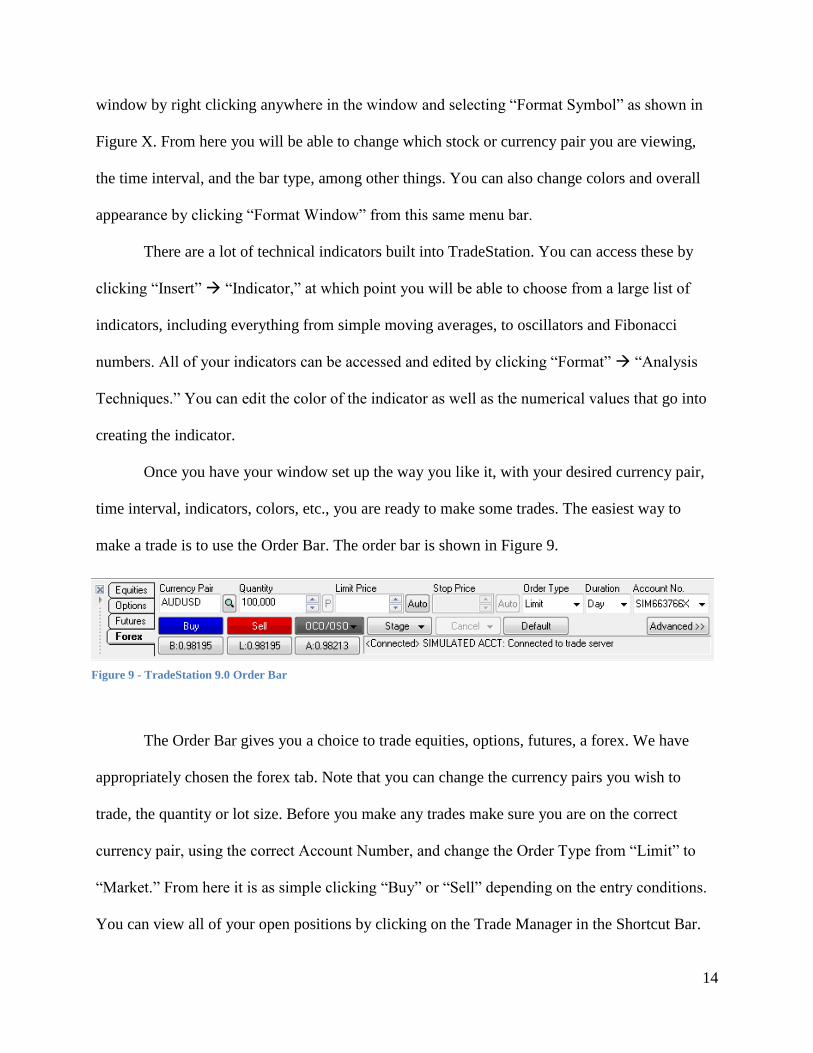
make a trade is to use the Order Bar. The order bar is shown in Figure 9.
The Order Bar gives you a choice to trade equities, options, futures, a forex. We have
appropriately chosen the forex tab. Note that you can change the currency pairs you wish to
trade, the quantity or lot size. Before you make any trades make sure you are on the correct
currency pair, using the correct Account Number, and change the Order Type from “Limit” to
“Market.” From here it is as simple clicking “Buy” or “Sell” depending on the entry conditions.
You can view all of your open positions by clicking on the Trade Manager in the Shortcut Bar.
Figure 9 - TradeStation 9.0 Order Bar

15
Here you can see your profit or loss. You can also close any positions by right clicking them and
selecting “Close Position.”
Understanding these basic features should allow anyone to trade comfortably using this
platform. As said before, however, these are simply the basics to using the TradeStation
platform. There are a lot more features that this platform offers, and the only way one can
familiarize his or her self with the program is to use it a lot.
16
3.2 – Example Trading Plan/Strategy NEVER FULLY LEVERAGE. NEVER FORGET A STOP LOSS. ALWAYS THINK OF
WORST CASE SCENARIO. DON’T BE GREEDY. BE PATIENT. HAVE FUN!
1. Stick to the Majors (EURUSD, GBPUSD, USDCHF, and USDJPY)
a. Lower spreads
b. More reliable
2. Trade in the morning between 8:00 and 10:00, NOT in the late afternoon
a. The market is more reliable in the morning, because both the London and New
York markets are open
b. This adds more liquidity to the market, allowing for lower spreads and preventing
big players from manipulating prices
3. Base most of your trades off of the 15 minute interval chart
a. This chart will show you the overall trend of the day
b. Short term trends that move in the same direction as the trend of the day tend to
be stronger than those which move against it
c. Keep in mind long term support and resistance levels that may cause what appears
to be an overwhelmingly upward trend to turn downward
4. Look at the different currency pairs, and narrow it down to which one(s) you want to
work with
a. If there is no clear trend developing in a particular currency, there’s no need to
waste your time trading with it
b. It is easier to focus on maybe 1 or 2 as opposed to 4 or 5, and then you can have
more than one time interval open for a single currency pair
5. When you have an idea of the long term trend, look the 5 minute and 1 minute intervals
a. Look at the trends here and try to match them up with the long term trend
6. Technical Indicators Used
a. Candlestick chart – gives more information about the direction in a particular
interval as well as the high and low in the interval
b. 50 Day Moving Average – gives a good idea of the direction and strength of a
trend. Less sensitive than the 14 day moving average but not quite as rigid as the
200 day moving average
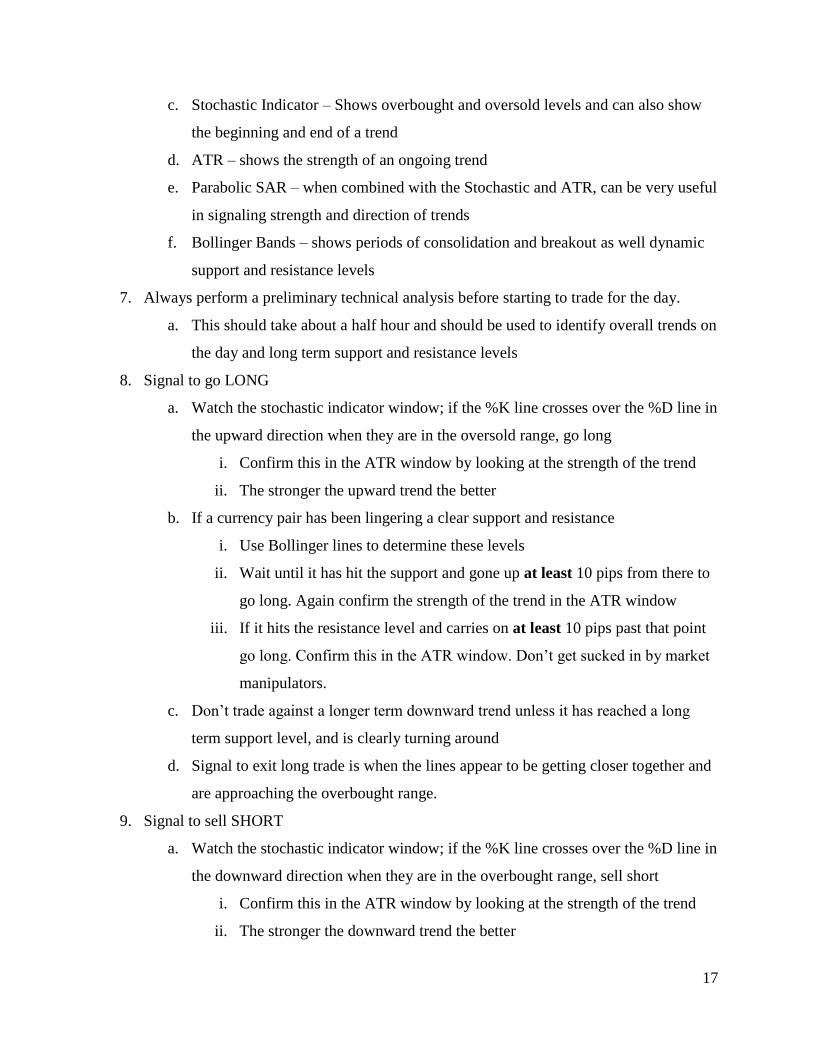
17
c. Stochastic Indicator – Shows overbought and oversold levels and can also show
the beginning and end of a trend
d. ATR – shows the strength of an ongoing trend
e. Parabolic SAR – when combined with the Stochastic and ATR, can be very useful
in signaling strength and direction of trends
f. Bollinger Bands – shows periods of consolidation and breakout as well dynamic
support and resistance levels
7. Always perform a preliminary technical analysis before starting to trade for the day.
a. This should take about a half hour and should be used to identify overall trends on
the day and long term support and resistance levels
8. Signal to go LONG
a. Watch the stochastic indicator window; if the %K line crosses over the %D line in
the upward direction when they are in the oversold range, go long
i. Confirm this in the ATR window by looking at the strength of the trend
ii. The stronger the upward trend the better
b. If a currency pair has been lingering a clear support and resistance
i. Use Bollinger lines to determine these levels
ii. Wait until it has hit the support and gone up at least 10 pips from there to
go long. Again confirm the strength of the trend in the ATR window
iii. If it hits the resistance level and carries on at least 10 pips past that point
go long. Confirm this in the ATR window. Don’t get sucked in by market
manipulators.
c. Don’t trade against a longer term downward trend unless it has reached a long
term support level, and is clearly turning around
d. Signal to exit long trade is when the lines appear to be getting closer together and
are approaching the overbought range.
9. Signal to sell SHORT
a. Watch the stochastic indicator window; if the %K line crosses over the %D line in
the downward direction when they are in the overbought range, sell short
i. Confirm this in the ATR window by looking at the strength of the trend
ii. The stronger the downward trend the better
18
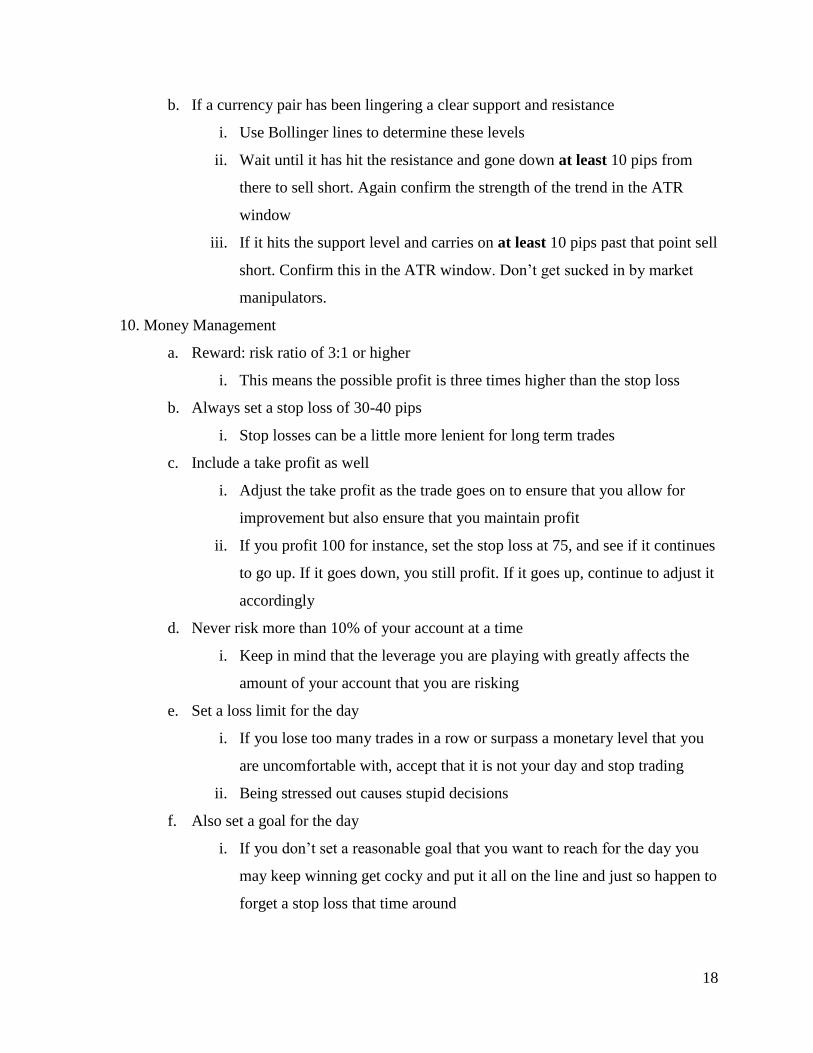
b. If a currency pair has been lingering a clear support and resistance
i. Use Bollinger lines to determine these levels
ii. Wait until it has hit the resistance and gone down at least 10 pips from
there to sell short. Again confirm the strength of the trend in the ATR
window
iii. If it hits the support level and carries on at least 10 pips past that point sell
short. Confirm this in the ATR window. Don’t get sucked in by market
manipulators.
10. Money Management
a. Reward: risk ratio of 3:1 or higher
i. This means the possible profit is three times higher than the stop loss
b. Always set a stop loss of 30-40 pips
i. Stop losses can be a little more lenient for long term trades
c. Include a take profit as well
i. Adjust the take profit as the trade goes on to ensure that you allow for
improvement but also ensure that you maintain profit
ii. If you profit 100 for instance, set the stop loss at 75, and see if it continues
to go up. If it goes down, you still profit. If it goes up, continue to adjust it
accordingly
d. Never risk more than 10% of your account at a time
i. Keep in mind that the leverage you are playing with greatly affects the
amount of your account that you are risking
e. Set a loss limit for the day
i. If you lose too many trades in a row or surpass a monetary level that you
are uncomfortable with, accept that it is not your day and stop trading
ii. Being stressed out causes stupid decisions
f. Also set a goal for the day
i. If you don’t set a reasonable goal that you want to reach for the day you
may keep winning get cocky and put it all on the line and just so happen to
forget a stop loss that time around
19
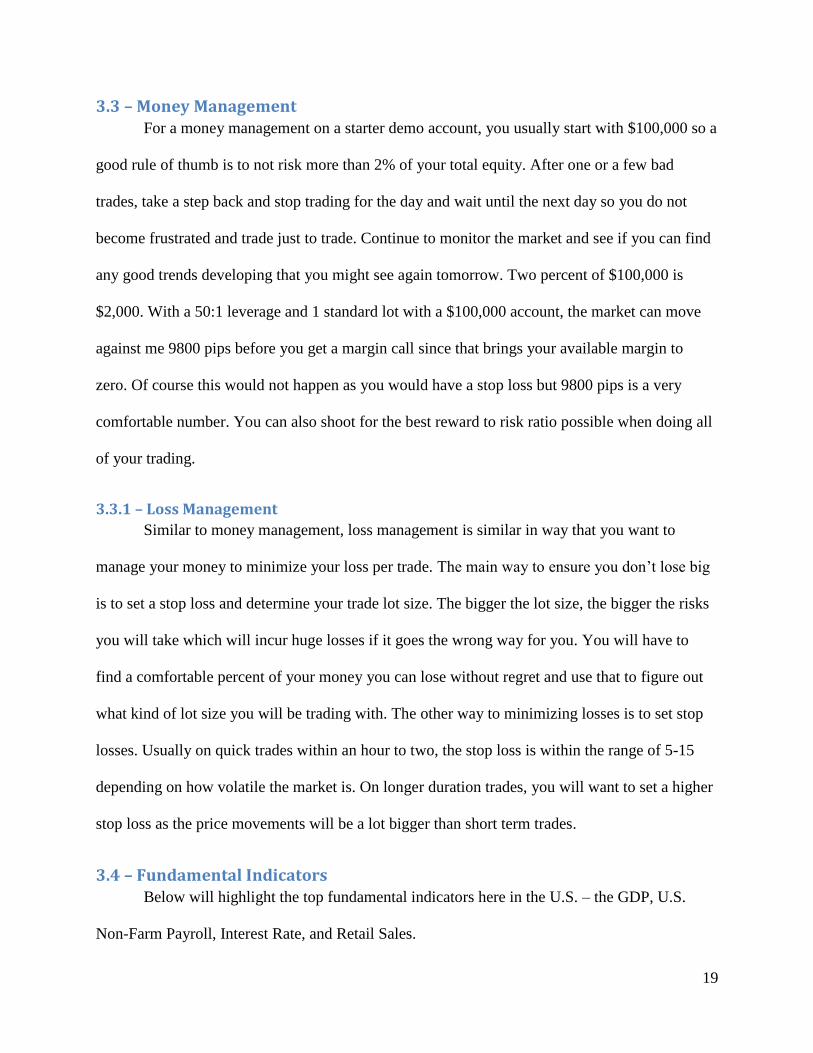
3.3 – Money Management For a money management on a starter demo account, you usually start with $100,000 so a
good rule of thumb is to not risk more than 2% of your total equity. After one or a few bad
trades, take a step back and stop trading for the day and wait until the next day so you do not
become frustrated and trade just to trade. Continue to monitor the market and see if you can find
any good trends developing that you might see again tomorrow. Two percent of $100,000 is
$2,000. With a 50:1 leverage and 1 standard lot with a $100,000 account, the market can move
against me 9800 pips before you get a margin call since that brings your available margin to
zero. Of course this would not happen as you would have a stop loss but 9800 pips is a very
comfortable number. You can also shoot for the best reward to risk ratio possible when doing all
of your trading.
3.3.1 – Loss Management
Similar to money management, loss management is similar in way that you want to
manage your money to minimize your loss per trade. The main way to ensure you don’t lose big
is to set a stop loss and determine your trade lot size. The bigger the lot size, the bigger the risks
you will take which will incur huge losses if it goes the wrong way for you. You will have to
find a comfortable percent of your money you can lose without regret and use that to figure out
what kind of lot size you will be trading with. The other way to minimizing losses is to set stop
losses. Usually on quick trades within an hour to two, the stop loss is within the range of 5-15
depending on how volatile the market is. On longer duration trades, you will want to set a higher
stop loss as the price movements will be a lot bigger than short term trades.
3.4 – Fundamental Indicators Below will highlight the top fundamental indicators here in the U.S. – the GDP, U.S.
Non-Farm Payroll, Interest Rate, and Retail Sales.
20
3.4.1 – GDP
GDP stands for Gross Domestic Product and it’s a value of all of the completed products,
goods, and services that are produced within a countries boarders. The GDP is a year-to-date
report that represents the past year of production and includes all public consumption,
government outlays, investments, exports, and imports that occur within a defined territory. This
fundamental indicator is used to gauge the economic health of a country and is also used to
determine the standard of living. Naturally the value of the US-dollar and GDP would go hand
in hand. The GDP basically shows how well we are doing as a country, so you would expect that
if the number is high the value of our currency would reflect that. On the other hand, if a country
has a low GDP, then the value of their currency is likely to be lower.
3.4.2 – Nonfarm Payroll
The nonfarm payroll is a statistic that represents the total number of paid US workers of
any business with exception to government employees, private household employees, employees
of nonprofit organizations, and farm employees. It is commonly referred to in the Gartman
Letter, and many people use it as an indicator of the strength of the U.S. economy. It is reported
by the US Bureau of Labor Statistics and comes out on the first Friday of every month. The
report encompasses approximately 80% of the workers who produce the entire GDP so it is a
great way to determine the strength of the economy. For this reason it has a large effect on the
forex market. If the nonfarm payroll increases over a month, we would expect to see an increase
in the value of the US-dollar. If it decreases, we would expect the opposite. There are also
estimates that are put out before the release of the report and these would also affect the value of
the US-dollar. If the report is below what the economists expected then the currency tends to be
weaker and when it comes out higher than expected, the currency price will go higher.
21
3.4.3 – Interest Rate
The interest rate is the amount charged by a lender for someone to borrow money. The
forex market is affected by this because when interest rates are lower people will have an easier
time borrowing and paying back their loans. When this happens it is a good sign for the economy
and usually a sign that the market is getting stronger. The interest rates that the Forex market
pays attention to are the FOMC interest rates because these rates give a better view at the broad
market.
This report is a measure of the sales of retail goods over a certain time period. The
monthly report in the US is released by the Census Bureau and the Department of Commerce and
comes out two weeks after the end of every month. The report covers the previous month and
compares historical data, but the year over year comparisons are used more because it shows
trends for the consumer based on the season. The report is made up of in store sales and out of
store sales and is usually broken down into groups which are beverages, clothing, and autos.
These sales are a large part of the GDP and an extended drop off in retail sales can often lead to a
recession because tax receipts will be lowered and companies will have to let people go. Also the
retail report is a very timely report unlike some other reports which are a month of two late for
what they are reporting. This report only waits two weeks and with all the value in the report, the
market can become very volatile at the time of its release.
3.5 – Technical Indicators The two main types of technical indicators are leading and lagging. Leading indicators
have predicting qualities – preceding price movements – while lagging indicators follow price
movements and are used as a confirmation tool. A category of indicators known as oscillators
focus on a bound range and use average high and low values to predict trends and turnarounds.
Two other tools used are crossovers and divergence. Crossovers are very commonly used and
22
show when the price moves through a moving average or when two moving averages cross over
each other. Divergence is when the price is going in the opposite direction of the indicator and
shows the user that the direction of the price trend is weakening.
There are other types of indicators that have more specific uses. Average directional
index (ADX) shows the strength of a current trend. It is used more to identify momentum rather
than direction. Positive and negative directional indicators are plotted and measured on a scale
from zero to 100, with readings below 20 indicating a weak trend and readings above 40
indicating a strong trend. The Aroon indicator shows the security and magnitude of a trend. It
analyzes the amount of time since the highest and lowest prices in a given time period, which can
be altered according to a user’s preference. Aroon oscillators plot the difference between these
values between a range of -100 and 100, with a centerline at zero. The further a given value is
from the center line shows the trader how strong a certain trend is. The moving average
convergence divergence (MACD) uses two moving averages to measure momentum. It shows
the difference between the two moving averages against a centerline, and is used to measure
short-term momentum as opposed to long term. The stochastic oscillator uses highs, lows, and
moving averages to measure momentum. The idea is that upward trends should be closing near
high points, downward trends should be closing near low points, and momentum should be
strongest in the middle of these cycles.
3.5.1 – Support/Resistance
These are levels that indicate when prices are likely to reverse. You can tell when prices
are likely to reverse when there is a bounce on the resistance or the support levels. Simply, the
highest point reached in a certain point is the resistance and the lowest point a currency pair has
reached is the support. A few things about support and resistance indicators are that the more
often a price tests a level of support or resistance without actually touching or breaking it shows
23
that the area of resistance or support is very strong. Also, when the price passes through
resistance, it could mean that the resistance is now the support. When the price breaks through a
support or resistance level, the strength of that depends on how the support or resistance levels
have been holding.
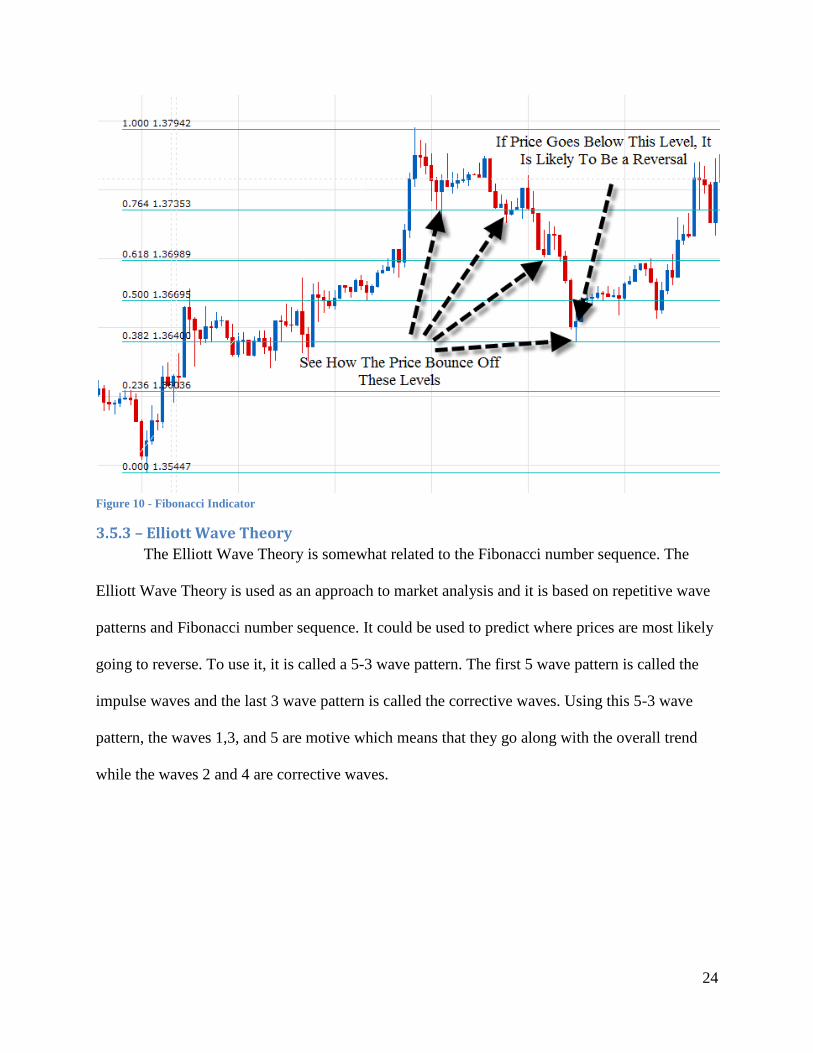
3.5.2 – Fibonacci Indicator
The Fibonacci Indicator is a support/resistance indicator in which it’s made up of
retracements and extensions levels and it’s used to help you enter a trade in the direction of the
trend. The retracement ratios are 0.236, 0.382, 0.500, 0.618, and 0.764. The extension ratios are
1.272, 1.382, 1.500, and 1.618. These ratios will be just like support and resistance levels in
which it helps you decide when to sell or buy depending on what you see. To use the Fibonacci
indicator, use the tool in the trading platform and pick a high point and a low point and then pick
the levels you want to show. Usually when the price is moving below the 0.382 level, it could
very well mean that the trend is reversing. If you are in an uptrend, you will see that the
retracement of the price will land on the 0.382, 0.500 or the 0.618 levels as they are strong
support levels.
24
Figure 10 - Fibonacci Indicator
3.5.3 – Elliott Wave Theory
The Elliott Wave Theory is somewhat related to the Fibonacci number sequence. The
Elliott Wave Theory is used as an approach to market analysis and it is based on repetitive wave
patterns and Fibonacci number sequence. It could be used to predict where prices are most likely
going to reverse. To use it, it is called a 5-3 wave pattern. The first 5 wave pattern is called the
impulse waves and the last 3 wave pattern is called the corrective waves. Using this 5-3 wave
pattern, the waves 1,3, and 5 are motive which means that they go along with the overall trend
while the waves 2 and 4 are corrective waves.
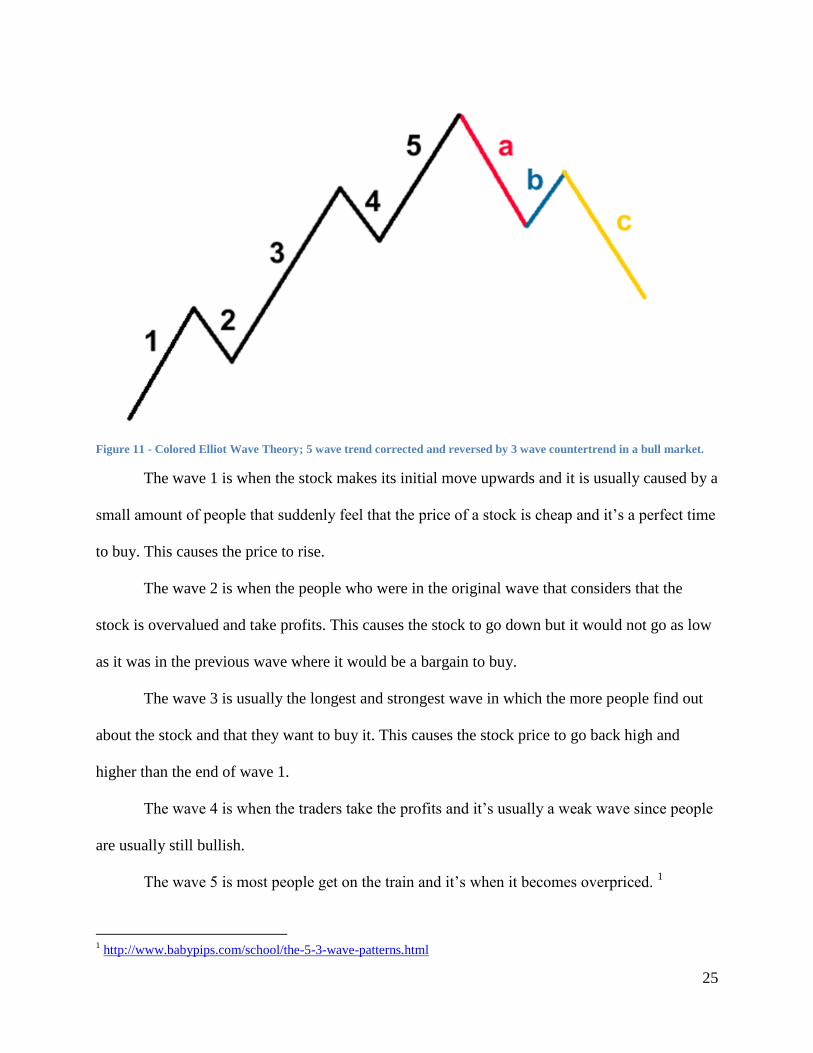
25
Figure 11 - Colored Elliot Wave Theory; 5 wave trend corrected and reversed by 3 wave countertrend in a bull market.
The wave 1 is when the stock makes its initial move upwards and it is usually caused by a
small amount of people that suddenly feel that the price of a stock is cheap and it’s a perfect time
to buy. This causes the price to rise.
The wave 2 is when the people who were in the original wave that considers that the
stock is overvalued and take profits. This causes the stock to go down but it would not go as low
as it was in the previous wave where it would be a bargain to buy.
The wave 3 is usually the longest and strongest wave in which the more people find out
about the stock and that they want to buy it. This causes the stock price to go back high and
higher than the end of wave 1.
The wave 4 is when the traders take the profits and it’s usually a weak wave since people
are usually still bullish.
The wave 5 is most people get on the train and it’s when it becomes overpriced. 1
1 http://www.babypips.com/school/the-5-3-wave-patterns.html
26
There are three basic corrective 3 wave countertrends and they are the Zig-Zag
Formation, the Flat Formation, and the Triangle Formation.
The Zig-Zag Formation is formed when there are very steep moves in the price that goes
against the main dominant trend. Wave b would be the shortest in this case and it could happen
twice or even three times in a correction.
The Flat Formation is formed when the waves are generally equal in length with wave B
reversing wave A and wave C reversing wave B. These are simple sideways corrective waves.
The Triangle Formation is a corrective pattern that forms by either diverging or
converging trend lines. Triangles are made up of 5 waves (a, b, c, d, e) that move in a sideways
fashion against the trend and these triangles can be all sort of shapes such as symmetrical,
descending, ascending, or expanding.2
There are three cardinal rules of the Elliott Wave Theory and they are:
Rule 1: Wave 3 can never be the shortest wave
Rule 2: Wave 2 can never go further than the start of wave 1
Rule 3: Wave 4 can never cross in the same area as wave 1
There are also common trends in the Elliott Wave Theory:
Truncation: Wave 5 does not move beyond the end of wave 3
Wave 5 usually goes beyond the trend line of Wave 3.
Wave 3 is usually very long, sharp, and extended.
Wave 2 and 4 bounce off the Fibonacci retracement levels quite often.3
2 http://www.babypips.com/school/abc-correction.html
3 http://www.babypips.com/school/the-3-cardinal-rules-and-some-guidelines.html
27
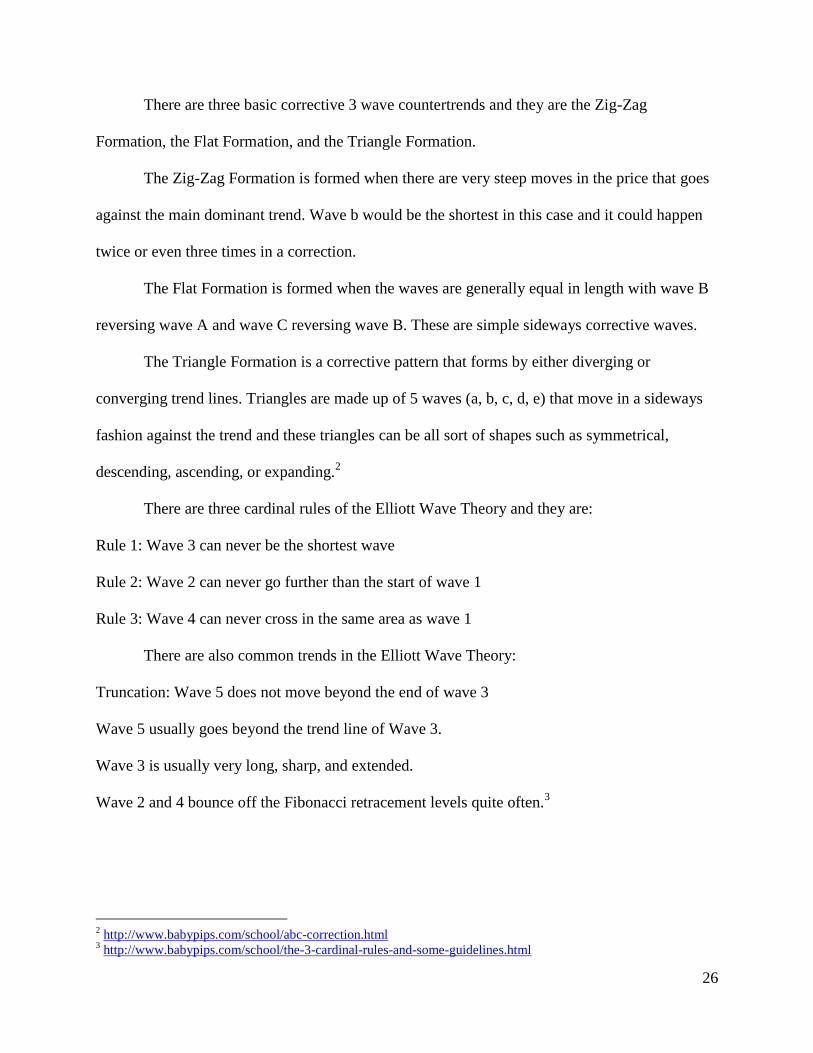
To actually use the Elliott Wave Theory, you can take into consideration into what each
wave represents. A strong buy signal could be when wave 2 drops about 50% of wave 1 and the
wave 3 could be starting soon. You can set your stop loss at the bottom of wave 1.4
Figure 12 - Elliott Wave Theory in Action
Shown is an example of the Elliott Wave Theory in action on an EURUSD currency. Once you
decide which waves are what, you can easily predict future price movements and buy at the
beginning of each wave.
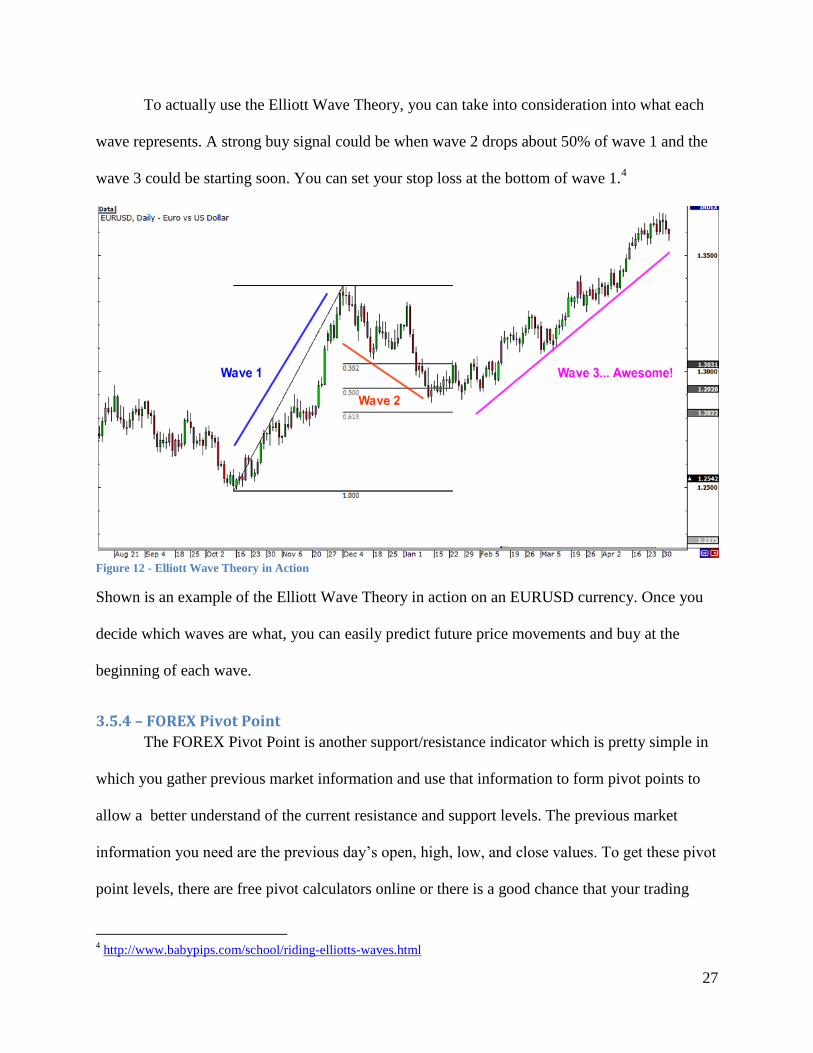
3.5.4 – FOREX Pivot Point
The FOREX Pivot Point is another support/resistance indicator which is pretty simple in
which you gather previous market information and use that information to form pivot points to
allow a better understand of the current resistance and support levels. The previous market
information you need are the previous day’s open, high, low, and close values. To get these pivot
point levels, there are free pivot calculators online or there is a good chance that your trading
4 http://www.babypips.com/school/riding-elliotts-waves.html
28
platform can easily plot these. Pivot point levels can be used as entry levels and exit levels. As an
entry level, you can usually enter a long position when you are in an uptrend and you see the
price break above the pivot level. Place the stop loss just below the pivot level. As an exit level if
you had entered a long position after the uptrend has broken the pivot level, set a take profit 10 to
15 pips below the next highest pivot level. If you had entered a short after seeing the price
repelled by the pivot, exit the trade once the price move down half of a pivot length. 5
Figure 13 – Forex Pivot Point
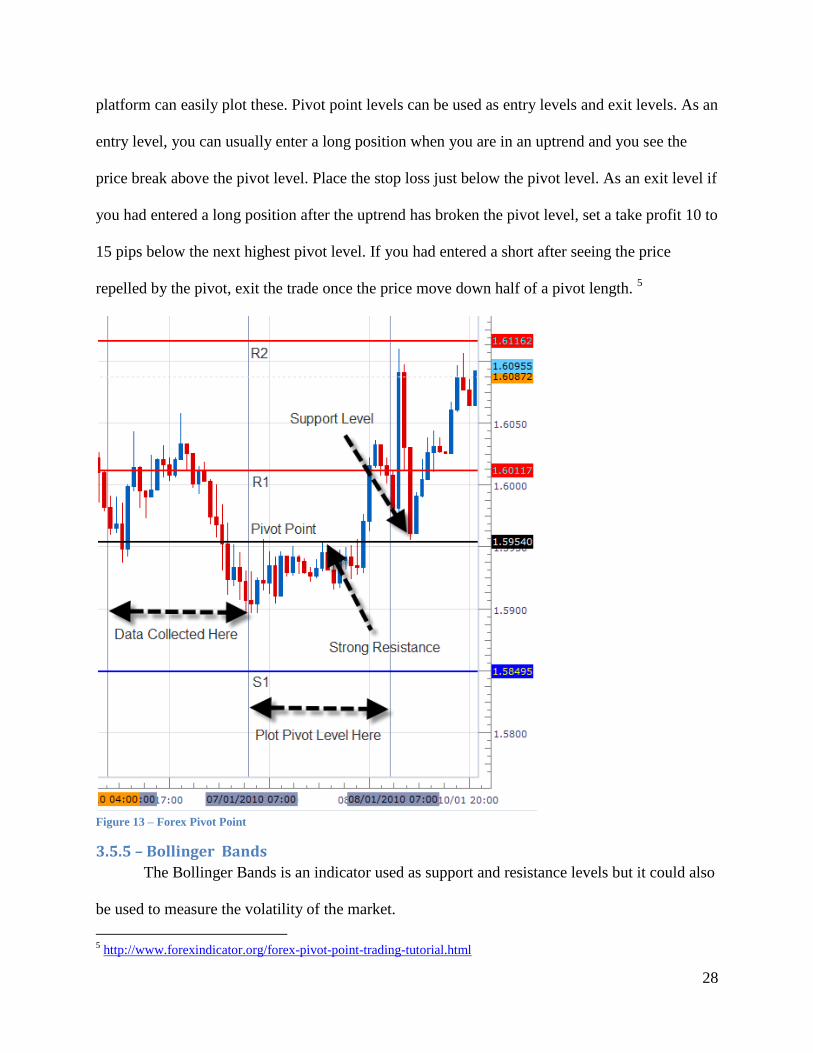
3.5.5 – Bollinger Bands
The Bollinger Bands is an indicator used as support and resistance levels but it could also
be used to measure the volatility of the market.
5 http://www.forexindicator.org/forex-pivot-point-trading-tutorial.html
29
To use Bollinger Bands, it is basically three bands that revolve around the simple moving
average. The upper band shows the simple moving average +2x standard deviation. The middle
band is just the simple moving average and the lower band shows the simple moving average -2x
standard deviation. To set up Bollinger bands, you can use the 20 days simple moving average
and plus and minus 2x standard deviation for the upper and lower bands. If the price goes
through either the upper or lower bands constantly, then you will have to adjust them. These
bands show support and resistance and when the upper and lower bands are narrow, it usually
means that it is consolidating. If the bands are wide apart, then it usually means that it’s in a
period of strong price movement. If the bands squeeze together, it usually means that a breakout
is getting ready to happen. This is called a Bollinger squeeze.
To use to measure a market’s volatility, the market is quiet when the bands contract and
the market is “loud” when the bands expand. When the prices hit the Bollinger bands, it tends to
bounce to return to the middle of the Bollinger bands. You can use this information to do quick
trades or if the market is just not doing much so you can tell there is a clear trend of going back
to the middle every time it hits the bands to trade in a time of no movement.6 7
6 http://www.forexindicator.org/forex-bollinger-bands-explained.html
7 http://www.babypips.com/school/bollinger-bands.html
30
Figure 14 - Bollinger Bands
Figure 15 - Bollinger Bands
3.5.6 – Moving Averages
Moving averages are charts that take averages of historic data so you can use them to
determine if a currency pair is on its way up, down, or just ranging. It’s a tool that smoothes out
price action. Simple Moving Averages seem to be a safer trend and it’s a little slow but the
Exponential Moving Averages is quicker and will allow you to buy in and get out at the optimal
time but there could be a lot of fake outs. To use Moving Averages to aid buying or selling in
the FOREX market, you need to plot the moving averages charts on the actual currency pair
31
chart. For up trends, it’s usually when the price is above the moving average. For down trends,
it’s usually when the price is below the moving average. It’s a lot better to have more than one
moving average on your charts because this will indicate a clearer signal of whether a currency
pair will be trending up or trending down. When you have more than one Moving Average plot
on your chart, the crossover between the two or more moving averages could indicate a change
in direction. Moving Averages also indicate dynamic support and resistance levels and you can
use it as a benchmark to where you can expect the currency pair to bounce to. It acts as the lower
boundary and the upper boundary.
Figure 16 - 10 EMA, 20 EMA
3.5.7 – Simple Moving Averages
Simple Moving Averages are a study of the historic trend of data calculated by adding up
the last “n” period’s closing prices and then dividing that by “n”. An example to calculate a 5
day simple moving average is finding the previous closing prices for the last 5 days:
Day 1: 1.39258
32
Day 2: 1.39597
Day 3: 1.38675
Day 4: 1.39617
Day 5: 1.38598
And then finding the average of these 5 days:
(1.39258 + 1.39597 + 1.38675 + 1.39617 + 1.38598) / 5 = 1.39149
With the use of Simple Moving Averages, it is a nice indicator to see if a pair is trending up,
down, or just ranging but it is very simple so spikes in old data could mess up the simple moving
average.
Figure 17 - 5 SMA, 30 SMA, 62 SMA
3.5.8 – Exponential Moving Averages
Since simple moving averages are not always truly representative of a historic trend as
there could be spikes, you can use exponential moving averages. Exponential moving average
helps clear the spikes as it puts more weight into calculation in the most recent days. It also
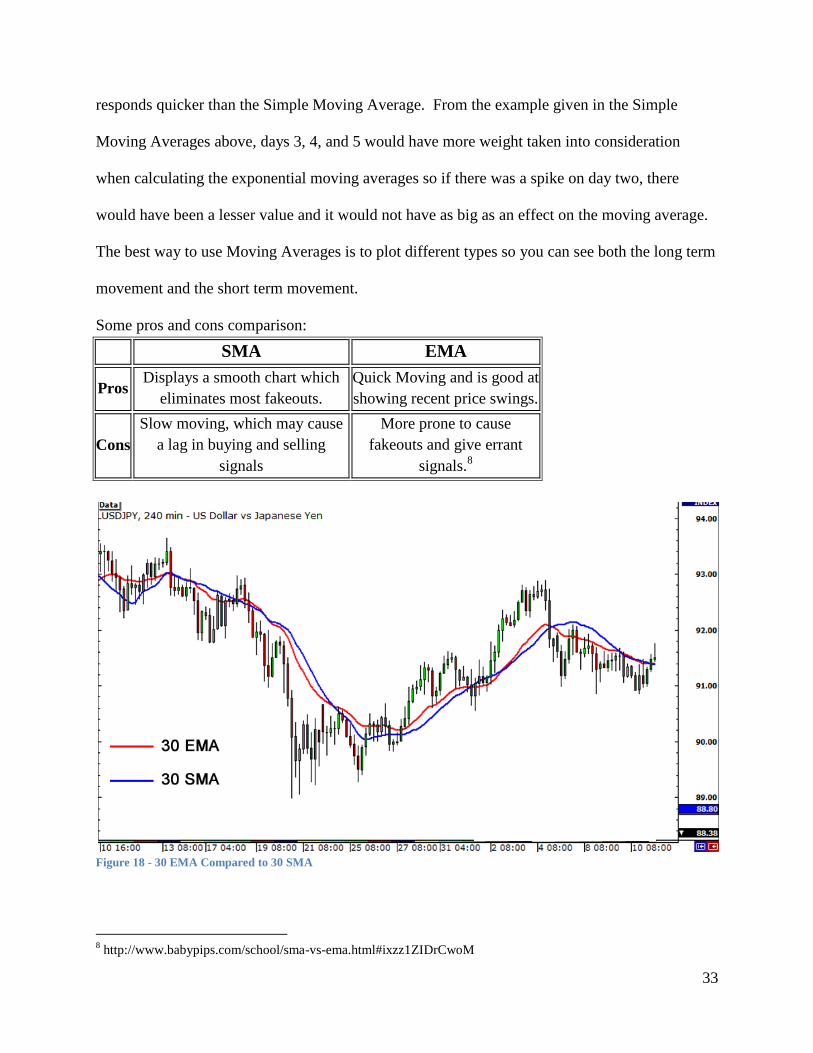
33
responds quicker than the Simple Moving Average. From the example given in the Simple
Moving Averages above, days 3, 4, and 5 would have more weight taken into consideration
when calculating the exponential moving averages so if there was a spike on day two, there
would have been a lesser value and it would not have as big as an effect on the moving average.
The best way to use Moving Averages is to plot different types so you can see both the long term
movement and the short term movement.
Some pros and cons comparison:
SMA EMA
Pros Displays a smooth chart which
eliminates most fakeouts.
Quick Moving and is good at
showing recent price swings.
Cons
Slow moving, which may cause
a lag in buying and selling
signals
More prone to cause
fakeouts and give errant
signals.8
Figure 18 - 30 EMA Compared to 30 SMA
8 http://www.babypips.com/school/sma-vs-ema.html#ixzz1ZIDrCwoM
34
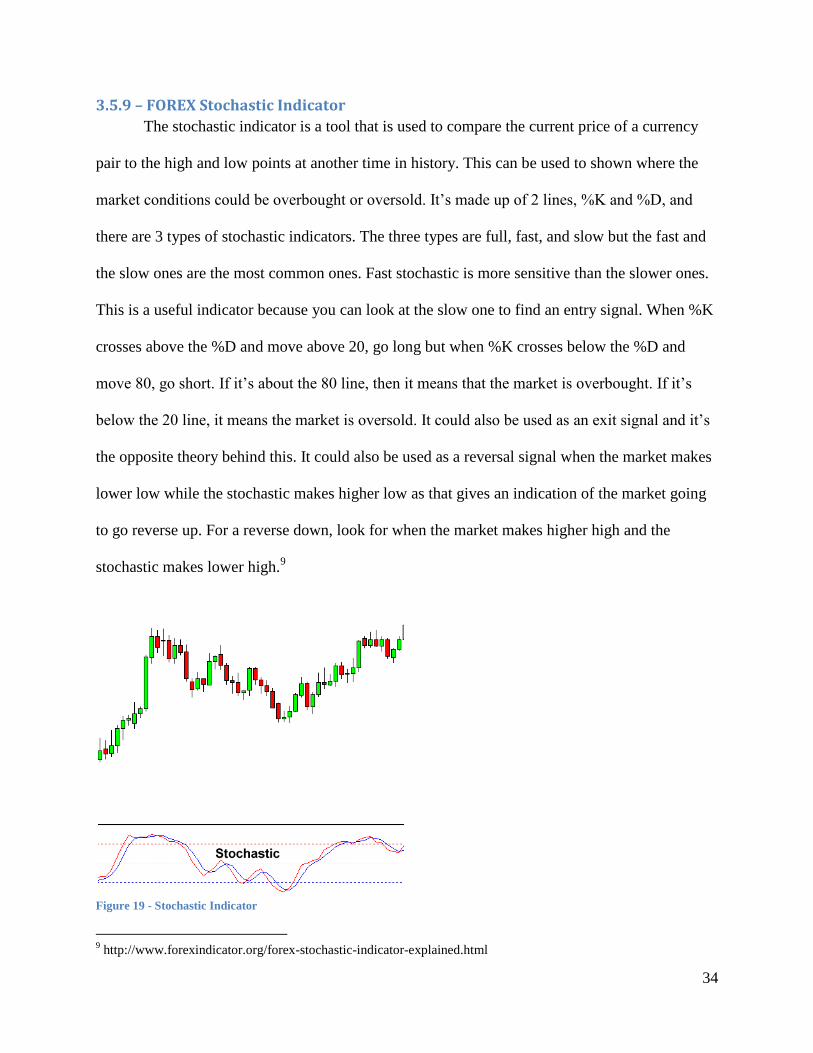
3.5.9 – FOREX Stochastic Indicator
The stochastic indicator is a tool that is used to compare the current price of a currency
pair to the high and low points at another time in history. This can be used to shown where the
market conditions could be overbought or oversold. It’s made up of 2 lines, %K and %D, and
there are 3 types of stochastic indicators. The three types are full, fast, and slow but the fast and
the slow ones are the most common ones. Fast stochastic is more sensitive than the slower ones.
This is a useful indicator because you can look at the slow one to find an entry signal. When %K
crosses above the %D and move above 20, go long but when %K crosses below the %D and
move 80, go short. If it’s about the 80 line, then it means that the market is overbought. If it’s
below the 20 line, it means the market is oversold. It could also be used as an exit signal and it’s
the opposite theory behind this. It could also be used as a reversal signal when the market makes
lower low while the stochastic makes higher low as that gives an indication of the market going
to go reverse up. For a reverse down, look for when the market makes higher high and the
stochastic makes lower high.9
Figure 19 - Stochastic Indicator
9 http://www.forexindicator.org/forex-stochastic-indicator-explained.html
35
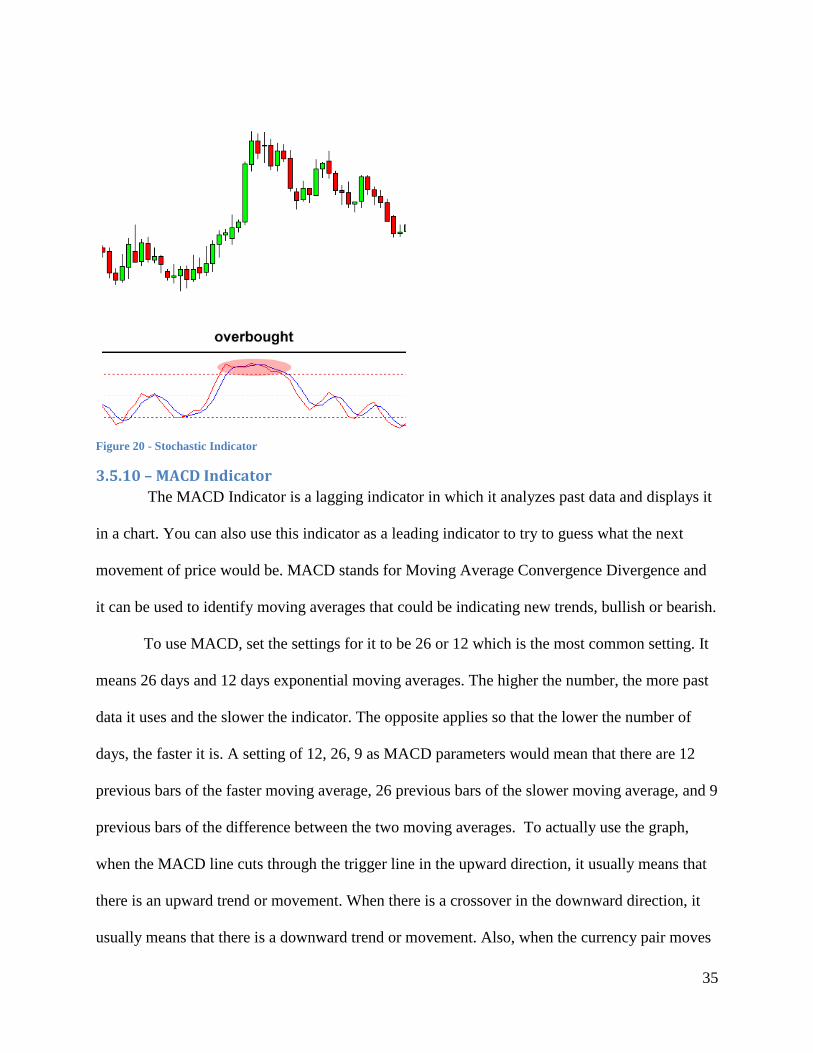
Figure 20 - Stochastic Indicator
3.5.10 – MACD Indicator
The MACD Indicator is a lagging indicator in which it analyzes past data and displays it
in a chart. You can also use this indicator as a leading indicator to try to guess what the next
movement of price would be. MACD stands for Moving Average Convergence Divergence and
it can be used to identify moving averages that could be indicating new trends, bullish or bearish.
To use MACD, set the settings for it to be 26 or 12 which is the most common setting. It
means 26 days and 12 days exponential moving averages. The higher the number, the more past
data it uses and the slower the indicator. The opposite applies so that the lower the number of
days, the faster it is. A setting of 12, 26, 9 as MACD parameters would mean that there are 12
previous bars of the faster moving average, 26 previous bars of the slower moving average, and 9
previous bars of the difference between the two moving averages. To actually use the graph,
when the MACD line cuts through the trigger line in the upward direction, it usually means that
there is an upward trend or movement. When there is a crossover in the downward direction, it
usually means that there is a downward trend or movement. Also, when the currency pair moves
36
above the MACD lines, it is called a negative divergence and it means that there is usually a
downside movement. The opposite applies in which if the currency pair moves below the MACD
lines, it is called a positive divergence and there is usually an upward movement. The downside
of MACD is that since it represents moving averages of other moving averages and is smoothed
out by another moving average, there would be some lag in trends.10
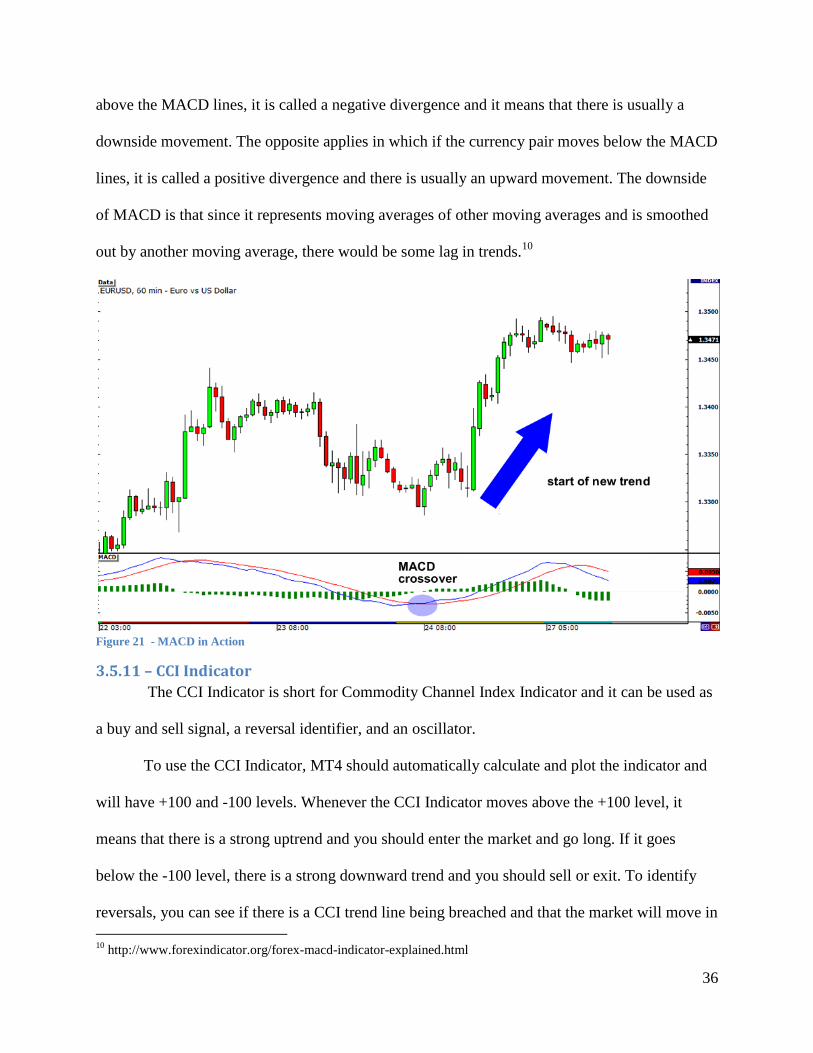
Figure 21 - MACD in Action
3.5.11 – CCI Indicator
The CCI Indicator is short for Commodity Channel Index Indicator and it can be used as
a buy and sell signal, a reversal identifier, and an oscillator.
To use the CCI Indicator, MT4 should automatically calculate and plot the indicator and
will have +100 and -100 levels. Whenever the CCI Indicator moves above the +100 level, it
means that there is a strong uptrend and you should enter the market and go long. If it goes
below the -100 level, there is a strong downward trend and you should sell or exit. To identify
reversals, you can see if there is a CCI trend line being breached and that the market will move in
10
http://www.forexindicator.org/forex-macd-indicator-explained.html
37
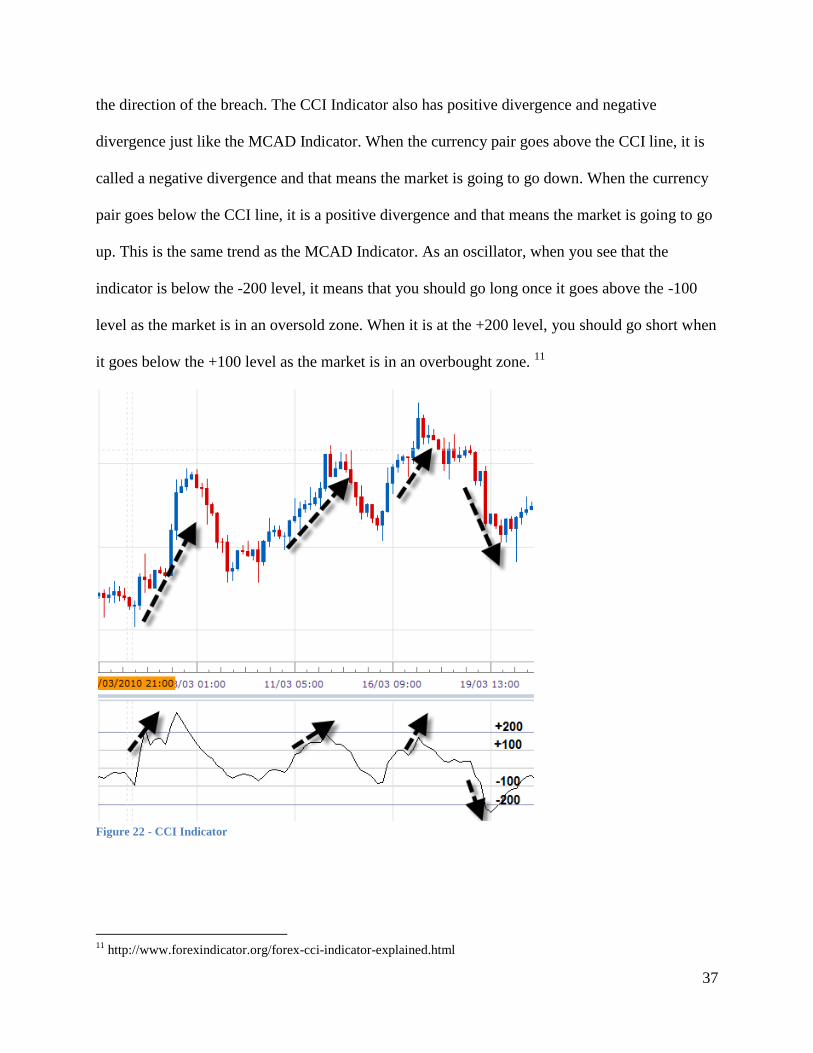
the direction of the breach. The CCI Indicator also has positive divergence and negative
divergence just like the MCAD Indicator. When the currency pair goes above the CCI line, it is
called a negative divergence and that means the market is going to go down. When the currency
pair goes below the CCI line, it is a positive divergence and that means the market is going to go
up. This is the same trend as the MCAD Indicator. As an oscillator, when you see that the
indicator is below the -200 level, it means that you should go long once it goes above the -100
level as the market is in an oversold zone. When it is at the +200 level, you should go short when
it goes below the +100 level as the market is in an overbought zone. 11
Figure 22 - CCI Indicator
11
http://www.forexindicator.org/forex-cci-indicator-explained.html
38
3.5.12 – Average True Range Indicator
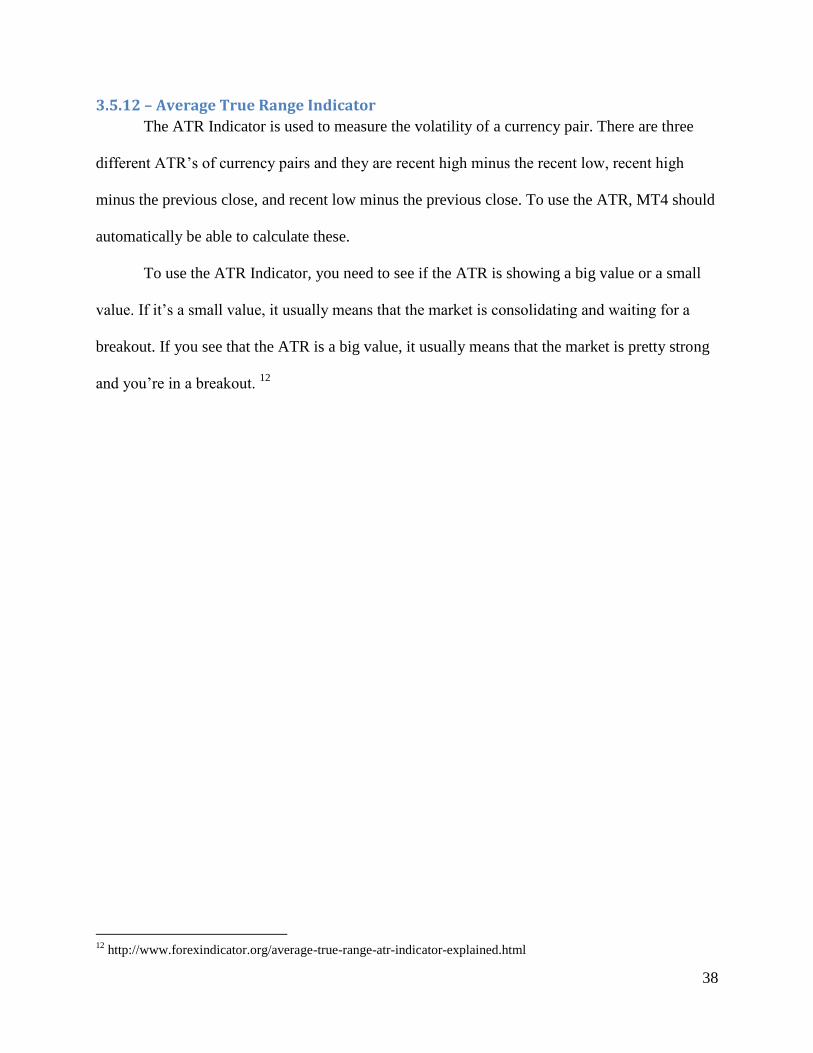
The ATR Indicator is used to measure the volatility of a currency pair. There are three
different ATR’s of currency pairs and they are recent high minus the recent low, recent high
minus the previous close, and recent low minus the previous close. To use the ATR, MT4 should
automatically be able to calculate these.
To use the ATR Indicator, you need to see if the ATR is showing a big value or a small
value. If it’s a small value, it usually means that the market is consolidating and waiting for a
breakout. If you see that the ATR is a big value, it usually means that the market is pretty strong
and you’re in a breakout. 12
12
http://www.forexindicator.org/average-true-range-atr-indicator-explained.html
39
Figure 23 - Average True Range Indicator
3.5.13 – ADX Indicator
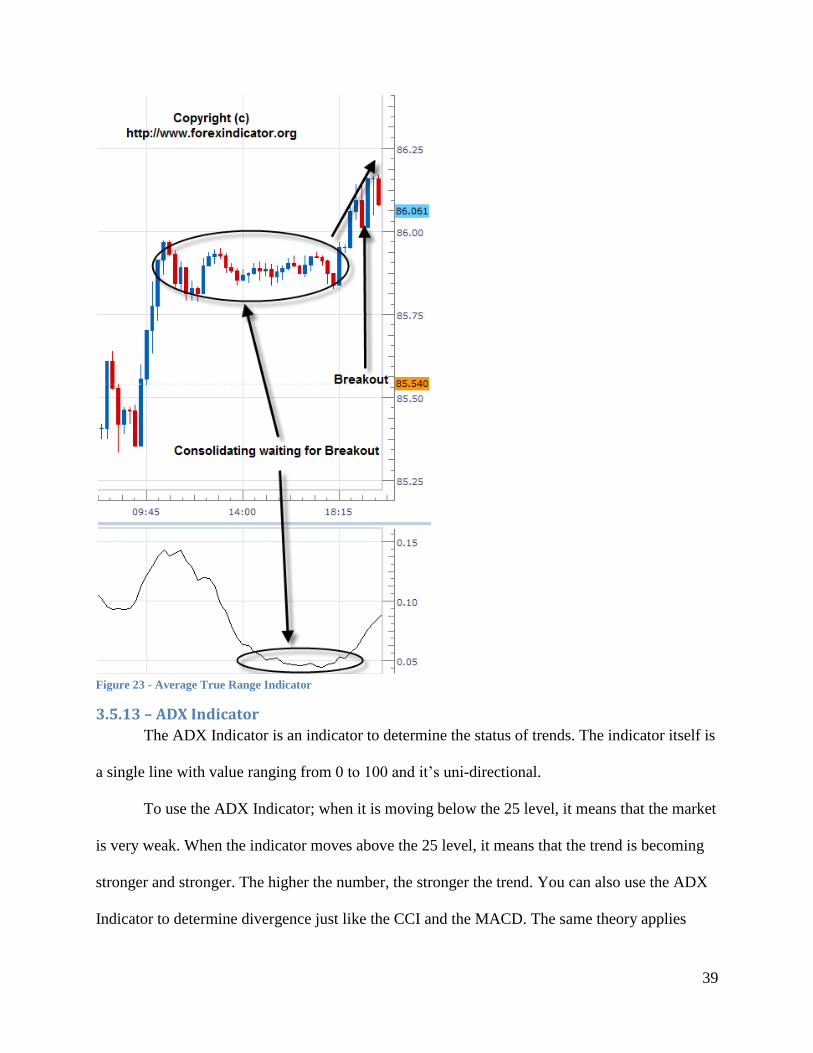
The ADX Indicator is an indicator to determine the status of trends. The indicator itself is
a single line with value ranging from 0 to 100 and it’s uni-directional.
To use the ADX Indicator; when it is moving below the 25 level, it means that the market
is very weak. When the indicator moves above the 25 level, it means that the trend is becoming
stronger and stronger. The higher the number, the stronger the trend. You can also use the ADX
Indicator to determine divergence just like the CCI and the MACD. The same theory applies
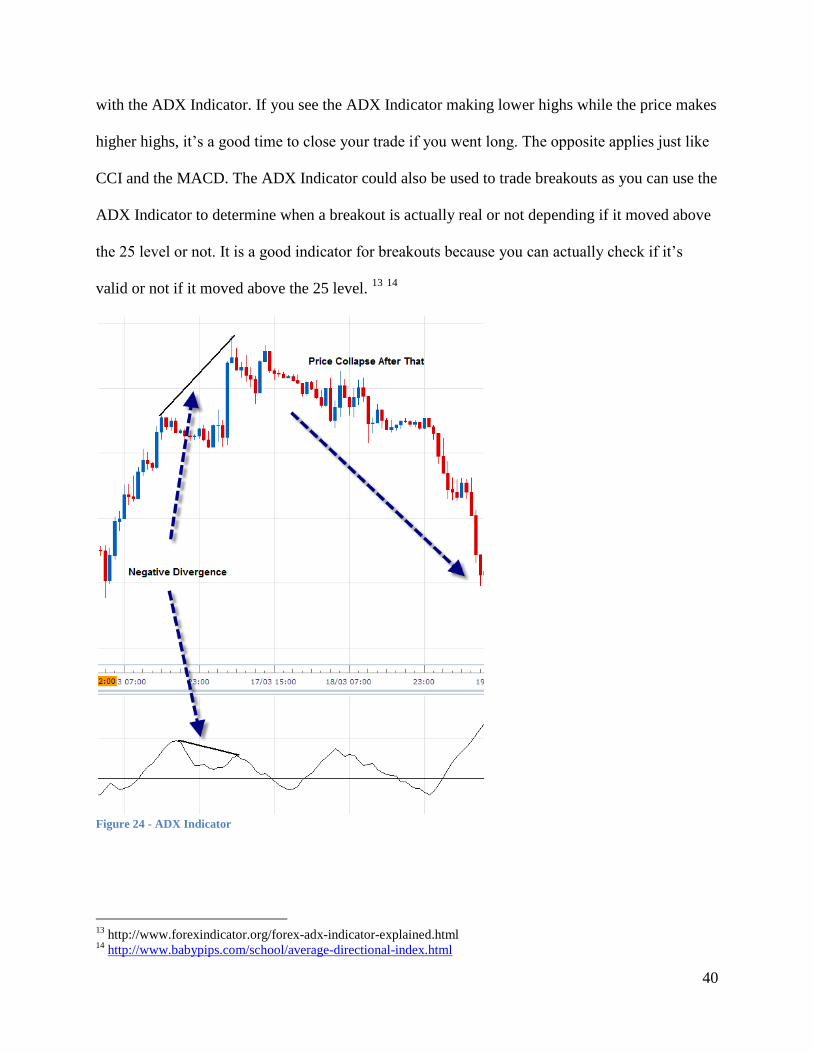
40
with the ADX Indicator. If you see the ADX Indicator making lower highs while the price makes
higher highs, it’s a good time to close your trade if you went long. The opposite applies just like
CCI and the MACD. The ADX Indicator could also be used to trade breakouts as you can use the
ADX Indicator to determine when a breakout is actually real or not depending if it moved above
the 25 level or not. It is a good indicator for breakouts because you can actually check if it’s
valid or not if it moved above the 25 level. 13
14
Figure 24 - ADX Indicator
13
http://www.forexindicator.org/forex-adx-indicator-explained.html 14
http://www.babypips.com/school/average-directional-index.html
41
Figure 25 - ADX Indicator
3.5.14 – Parabolic SAR
The Parabolic SAR (Stop and Reversal) is an indicator that can help us determine when a
trend might be ending. It places dots or points onto your chart that could indicate a potential
price movement reversal. It’s a very simple indicator to use as when the dots are below the
candles, you should buy. When the dots are above the candles, you should sell. To use the
Parabolic SAR to exit trades, you can see when there are three dots going in the opposite
direction. If there are three dots going in the opposite direction, the earlier trend is probably over
and an opposite trend is now happening. 15
15
http://www.babypips.com/school/parabolic-sar.html
42
Figure 26 - Parabolic SAR
3.5.15 – Relative Strength Index
The Relative Strength Index (RSI) is an index that measures the ratio of up moves to
down moves and normalizes that calculation so there could be an index made with a range from
0-100. It is very similar to the stochastic indicator because it identifies overbought or oversold
conditions. If the RSI is greater than or equal to 70, then it could be seen that the market is
overbought. If the RSI is smaller than or equal to 30, then it could be a signal that the market is
oversold. If it drops below 30, it could also mean that the move could be over and that there
could be almost no more sellers left in the market. You can also use the RSI as a trend confirmer
as if a trend is possibly forming, just look at the RSI. If you think there is a possible uptrend,
then the RSI should be above the 50 level. If you think there is a possible downtrend, then the
RSI should be below the 50 level. Make sure to wait until there is a cross of the 50 level to avoid
fake outs. 16
16
http://www.babypips.com/school/relative-strength-index.html
43
Figure 27 - RSI Example
You can see the picture above to see how it is used to indicate an oversold condition in the
EURUSD market.
3.5.16 – Ichimoku Kinko Hyo
Ichimoku Kinko Hyo is an indicator that predicts future price momentum and determines
future areas of support and resistance. It is mainly used on JPY pairs hence the name as it means
“a glance at a chart in equilibrium”.
44
Figure 28 - Ichimoku Kinko Hyo
Shown above is a picture of the Ichimoku Kinko Hyo indicator on a chart. It’s a lot easier to
explain it with a chart. The blue line called the Kijun Sen is the base line and it is calculated by
averaging the highest high and the lowest low from the past 26 periods. The red line is called the
Tenkan Sen and it is the turning line. It is derived from averaging the highest high and the lowest
low for the past nine periods. The green line is called the Chikou Span and it is the lagging line.
It is that day’s closing price plotted 26 periods behind. The orange lines are called the Senkou
Span and there are a few lines. The first Senkou line is calculated by the averages of the Tenkan
Sen (red) and the Kijun Sen (blue) and plotted 26 periods ahead. The second line is derived from
averaging the highest high and the lowest low for the past 52 periods and plotted 26 periods
ahead.
The blue line, the Kijun Sen acts as an indicator of future price movements. If the price is
higher than the line, then it could mean that the price could climb higher in the future. If the price
is below the line, then it could mean that the price could keep dropping in the future.
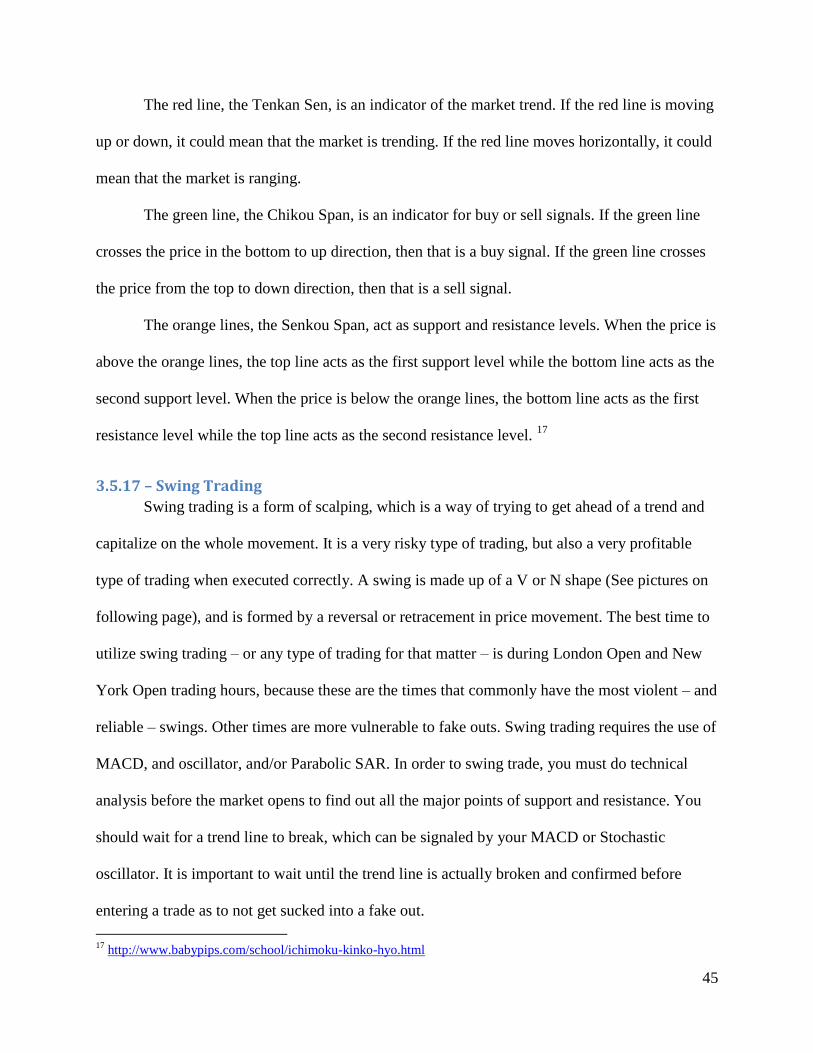
45
The red line, the Tenkan Sen, is an indicator of the market trend. If the red line is moving
up or down, it could mean that the market is trending. If the red line moves horizontally, it could
mean that the market is ranging.
The green line, the Chikou Span, is an indicator for buy or sell signals. If the green line
crosses the price in the bottom to up direction, then that is a buy signal. If the green line crosses
the price from the top to down direction, then that is a sell signal.
The orange lines, the Senkou Span, act as support and resistance levels. When the price is
above the orange lines, the top line acts as the first support level while the bottom line acts as the
second support level. When the price is below the orange lines, the bottom line acts as the first
resistance level while the top line acts as the second resistance level. 17
3.5.17 – Swing Trading
Swing trading is a form of scalping, which is a way of trying to get ahead of a trend and
capitalize on the whole movement. It is a very risky type of trading, but also a very profitable
type of trading when executed correctly. A swing is made up of a V or N shape (See pictures on
following page), and is formed by a reversal or retracement in price movement. The best time to
utilize swing trading – or any type of trading for that matter – is during London Open and New
York Open trading hours, because these are the times that commonly have the most violent – and
reliable – swings. Other times are more vulnerable to fake outs. Swing trading requires the use of
MACD, and oscillator, and/or Parabolic SAR. In order to swing trade, you must do technical
analysis before the market opens to find out all the major points of support and resistance. You
should wait for a trend line to break, which can be signaled by your MACD or Stochastic
oscillator. It is important to wait until the trend line is actually broken and confirmed before
entering a trade as to not get sucked into a fake out.
17
http://www.babypips.com/school/ichimoku-kinko-hyo.html
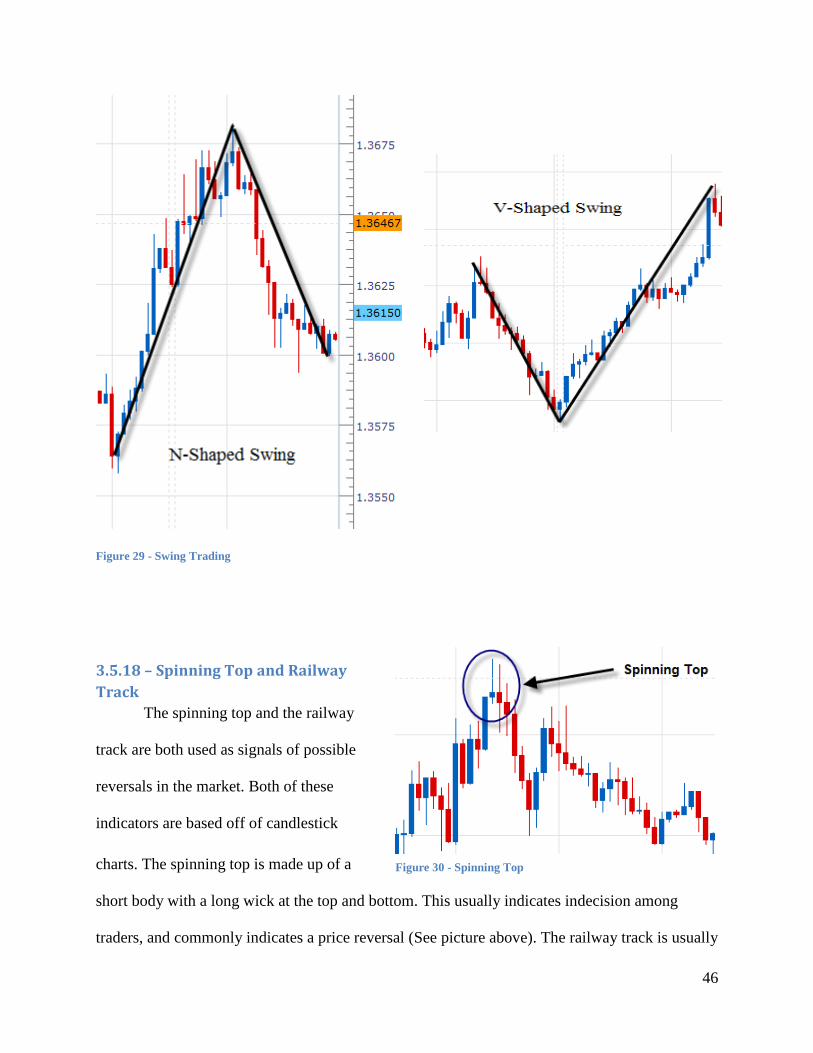
46
Figure 29 - Swing Trading
3.5.18 – Spinning Top and Railway
Track
The spinning top and the railway
track are both used as signals of possible
reversals in the market. Both of these
indicators are based off of candlestick
charts. The spinning top is made up of a
short body with a long wick at the top and bottom. This usually indicates indecision among
traders, and commonly indicates a price reversal (See picture above). The railway track is usually
Figure 30 - Spinning Top
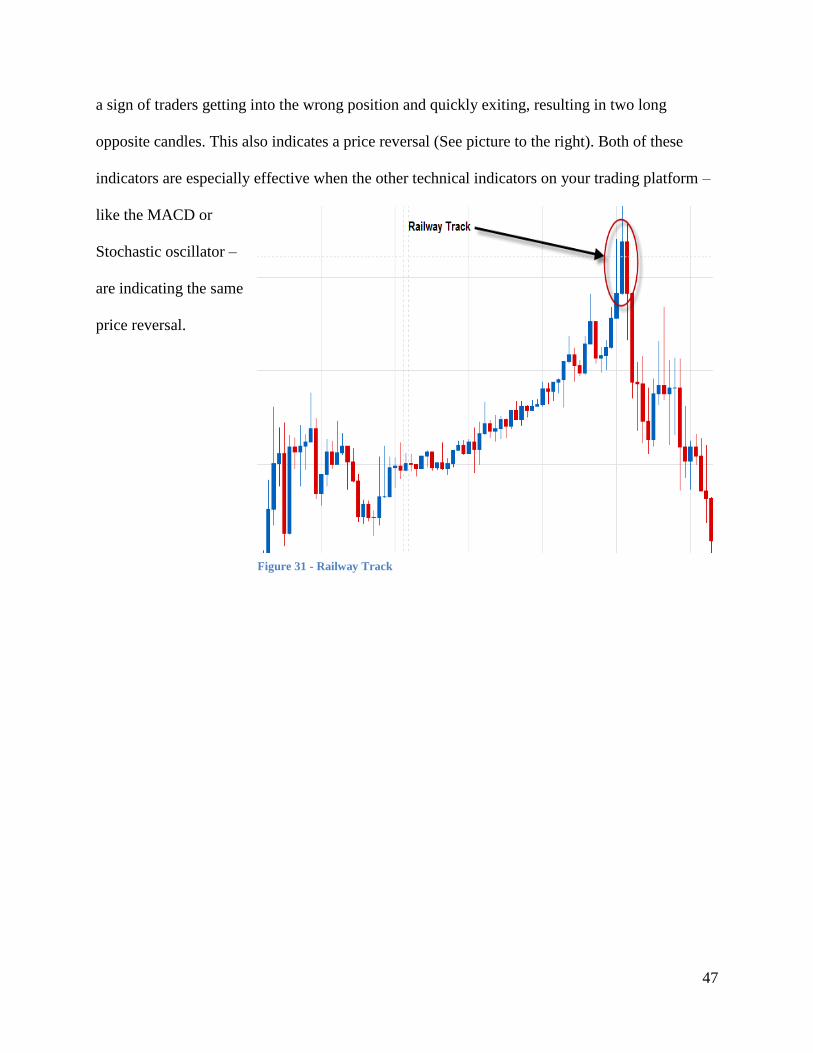
47
a sign of traders getting into the wrong position and quickly exiting, resulting in two long
opposite candles. This also indicates a price reversal (See picture to the right). Both of these
indicators are especially effective when the other technical indicators on your trading platform –
like the MACD or
Stochastic oscillator –
are indicating the same
price reversal.
Figure 31 - Railway Track
48
4.0 – Launching a Forex Money Management Company When trying to create a business that deals with managing money and trading in the forex
market, there is a lot of planning and a lot of steps to be taken to ensure the safety of everyone’s
money and set you apart from the competition. Major things to take into consideration are the
main advantages and disadvantages of launching the company here in the states or elsewhere.
One must also consider the possible legal structures of the company and the amount of liability
each shareholder has in the company. You must also put a lot of time into developing a complex
money management strategy. Finally you must know the agencies responsible for overseeing
such activities and acquire the proper licensing.
4.1 – Location Advantage The first step in creating a company is to decide where you want to locate your company.
For money management companies this is a very important decision because of all the
regulations that need to be followed. In the United States every company must be a member of
The Commodity Futures Trading Commission (CFTC) and the National Futures Association
(NFA). Being a member of these subjects the company to regular audits to observe everything
from the practices of the company all the way down to the training of the employees. Companies
are also subject to regular financial reports which mean that records have to be very well kept
and most importantly kept honestly. Also in the US, in the Forex market the leverage is set at a
maximum of 50:1 to protect investors from losing large amount of money that they do not have.
International countries have a few less regulations to adhere to because of the amount of
regulations in other countries. Due to the economy crisis and hedge fund managers such as
Madoff there have been a lot more regulations put in to avoid people having their money stolen.
Setting up a company in another country only requires you to follow those countries regulations,

49
which vary by country. For the most part there is one major regulating body in each country to
oversee the money management companies and make sure they operate fairly and justly. Also in
the forex market outside the US can have a leverage of up to 400:1 in the Forex market.
For our company we have decided to stay in the US and follow the regulations. There are
more rules to follow but we feel that with more regulations it will give our clients more trust in
us and they will not have to worry about illegal practices. Also with all of the audits and reports
we will have to keep our records very well and make sure our company is run in the proper
manor, which will make the company better overall.
4.2 – Legal Structure When creating a money management company of any type, it is important to know and
understand the different types of legal structures. The type of structure you choose will prove
vital in protecting both the company’s assets, as well as the money of your investors.
There are many types of different legal structures that are available to be formed. The
main ones are sole proprietorship, general partnership, limited partnership, limited liability
partnership, corporation, limited liability company. The main differences we looked at for this
that are most important to our company are the risks involved, our liability, taxation, the
transferability of the business, and expenses. We have conducted research about all of them and
our summary is outlined below:
4.2.1 – Sole Proprietorship:
This is the most basic form of a business and is the ideal structure for a small business. It
is because the start up costs for a sole proprietorship is a lot lower compared to bigger business
legal structures. In terms of taxation, all profits get taxed as your personal income so you will
earn a lot more. The legal term for this is “pass through” income taxation. The risks involved in a

50
sole proprietorship would be medium as you can close your business at will. Although you can
close your business at will, you have unlimited liability if anything goes wrong as it is a sole
proprietorship. Unlimited liability includes your own personal assets too if your business debt is
larger than your business asset. This is not very good for a company like ours even with a
successful history of good trades as you would be reliable for anything and everything. This
type of ownership would be ideal for smaller businesses such as a coffee shop and not one that
manages a large amount f money.
4.2.2 – General Partnership:
A general partnership is basically what the name hints at, a partnership. This is a business
structure owned by 2 or more people who acts as the owners and share profits. Like sole
proprietorship, the startup cost is relatively low and the taxation works the same, with the profits
treated as personal income tax. With more people comes more money and knowledge so that is
another plus side of a general partnership. The risks involved in this would be slightly lower than
sole proprietorship as you have one or more partners to count on but it could also act against you
if there are disagreements. In terms of liability, it is similar to sole proprietorship but all partners
share the unlimited liability. This type of ownership is slightly better for us as we are a group so
it would make sense for us to be partners in business. However, it still holds unlimited liability
on us and that is not advantageous.
4.2.3 – Limited Partnership:
A limited partnership has the same structure as a general partnership but it is more useful
to raise capital. The difference between the two partnerships is that a limited partnership allows
for investors to be “limited partners” in which they will invest in your company but they have
limited liability if your company happens to fail. The limited partners have limited liability but
the main partners in the partnership will still have to carry the burden of unlimited liability. It is
51
however helped out a little by the limited partners’ investments. This is slightly better than a
general partnership for our business but is still not very ideal.
4.2.4 – Limited Liability Partnership:
A limited liability partnership is very similar to a general partnership and a limited
partnership. What’s different about this one is that this one has limited liability for all the
partners. This means that if your business fails, then limited liability kicks in and none of your
personal assets can be taken into account to take care of your business’s debt. This seems like the
most ideal business structure for us as it is relatively simple to set up, has the taxation rules of a
general partnership, and has limited liability.
4.2.5 – Corporation
A corporation is a business legal structure that is aimed for the bigger businesses. It is
also the most common form of business structure for larger companies. The difference between a
corporation and partnerships and sole proprietorships is that a corporation is not linked to owners
as it exists separately as an entity just like another individual. It is in a way one individual entity
controlled by multiple people as it has the same rights as an individual to buy and property, buy
and sell shares, and take legal actions. The startup costs for a corporation is far greater than the
startup costs for any business structure mentioned prior. In terms of taxation, it is completely
different than the structures above as corporations are taxed twice. The best thing about a
corporation is that you can raise a lot of investment capital and to have limited liability. The
transfer of ownership is also easily transferable. Besides the start up costs and taxation being the
negatives of a corporation, government agencies closely regulate corporations which in turn
means a lot more work and regulations to meet whereas partnerships and individual ownership
has much less. Since a corporation is such a large business and includes a bunch of paper work
52
and start up, we would most likely not choose this one even though of the advantages such as
limited liability and the ability to raise capital.
4.2.6 – Limited Liability Company
A limited liability company is similar to a limited liability partnership in terms of start up
costs, liability, and taxation. The startup cost for a limited liability company is slightly higher
than a partnership. The liability is pretty much the same as you have limited liability which
means you will have protection of your personal assets. For taxation, it is taxed the same way
which means your profits are counted as personal income tax. Similar to partnership, you can
also get out of a limited liability company at will. Given all these advantages of a general
partnership and a corporation, this seems like the best bet for our company so we will go with the
business structure of a limited liability company. A quick search shows that FXCM is also a LLC
while Oanda is a corporation so that reassures our correct choice in business legal structures.
4.3 – Money and Risk Management One of the most important aspects of a company of this nature is the money management
policy. There are many different ways of going about structuring the money management of your
company, and this can really separate you from the pack. Your money management strategy will
ultimately be the deal sealer with your clients and give you credibility among investors.
Effectively this decision comes down to whether you want to hire someone to do the
book keeping for you or if you want to do it yourself. In our case we would like to manage the
money on or own by making calculated risks. By doing this we can set reasonable goals and
make steady profits to reach them. Also to simplify things, all of the accounts we manage will be
trading on the same trading account.
The first step in developing your money management strategy is to know how much you
want to make and how much you’re willing to risk. We would like to be able to promise
53
somewhere around a 2% return per month on the investor’s money, but this does not mean that
this is all we are making, otherwise the company would get no income. For this reason we would
like to get closer to 4 or 5% per month, or between 50 and 60% a year. You can use this to
calculate how much you want to make per day, and how much you’re willing to lose per day.
As far as single trades go, we always set stop loss and take profit levels. We also set our
take profit at least two times higher than the stop loss, meaning we like to have a risk to reward
ratio of 2:1 or higher. This manages our losses and locks in profit. We never risk any more than
2% of our account balance with stop loss, and we always calculate stop loss ahead of time. We
also use support and resistance lines to determine stop losses.
Our goal is to make steady money, not have make or break trades once in a while. We
want to lock in our strategy and be able to consistently pull down steady profits week by week,
month by month. It is a rule of ours never to get excited about one important trade. Every trade is
equally important, and they all have the same realistic goals.
Another important aspect of our money management is the hours at which we trade. To
maximize our trading potential we have agreed to trade only during peak trading hours. This
means the London session and the American session, and that’s it – 3:00 a.m. or 8:00 a.m. These
times are chosen, because the market is most reliable at these times and has high liquidity and
therefore lower spreads. We will never fall victim to market manipulation.
4.4 – Government Regulation It’s very important to know which US agencies oversee and regulate the operation of
companies that manage money by trading currencies. It is also important to know their rules, so
as to not run into any legal trouble down the road.
54
The United States Securities and Exchange Commission is the main federal agency that is
responsible for enforcing the laws of foreign exchange currency trading. The SEC is responsible
for enforcing acts relevant to the securities industry which means they enforce acts such as the
Investment Advisers Act of 1940, the Sarbanes-Oxley Act of 2002, the Credit Rating Agency
Reform Act of 2006, and more. This means that we need to follow all the acts that the SEC is
responsible for and make sure we follow the rules of them in order to stay out of legal trouble.
Other than the SEC, the Federal Reserve Banks and the U.S. Treasury also looks and regulates
the foreign exchange market to look for anything suspicious.
Another agency is the Commodity Futures Trading Comission. The CFTC was created
back in 1974 to regulate futures and securities in the U.S. and has 6 major operating units. The
units are the Division of clearing and Intermediary Oversight, Division of Market Oversight,
Division of Enforcement, Office of Chief Economist, Office of the General Counsel, and the
Office of the Executive Director. All of the divisions work together to regulate pretty much the
whole futures trading as their roles include sales practices, customer protection, registration,
financial integrity, market surveillance, reviews of futures guides and products, and to
investigate and prosecute any wrong doings. The Office of Chief Economist is responsible for
providing economic advice while the Office of the General Counsel is responsible for legal
advising for the Comission. The Office of the Executive Director is the management part of the
CFTC and deals with all the management and admistrative issues.
One more agency is the National Futures Association and it is a self-regulatory
organization for the U.S. futures market. It is a very good indicator of whether a futures business
is credible or not and the NFA also works with the CFTC to find flaws and frauds.

55
4.5 – Licensing
In order to gain legitimacy in this business, you need to have proper licensing. No one in
their right mind is going to hand over their money to a bunch of college kids with a trading plan
and money management strategy. The forex market is an unpredictable place, and investors need
peace of mind. A license shows professionalism as well as experience, and is absolutely
necessary in creating a company of this nature. In order to manage someone’s money in the forex
market you would need a series 7 license and a series 34 license. The series 7 license allows an
individual to make and place trades for a customer. The state can also require investment adviser
representatives to have the series 65 license. We would not need a series 3 license, because we
are not interested in trading anything but currencies here.
4.6 – Marketing Strategy How we will spread the word about our company to gain trust among our clientele
and a positive reputation. While in the process of building our reputation, we will offer a lower
rate of return and some other sort of incentive to investing with us. We will also offer three
different plans, one geared toward low-risk people, another toward high-risk people, and one that
appeals to the people who fall in the middle. Each risk level will have its own trading strategy,
money management, and potential rate of return.
Spreading the word about a new money management company will not be easy. We will
be starting with relatively low funding, and therefore will not be able to use expensive
advertisement methods. To start, much of our recognition will come from word of mouth. The
best way to market a company is to have a common ground and certain level of trust between the
company and the customer. For this reason we will start by targeting our friends and family,
building a solid reputation with them, and having them refer their friends and family. We will
56
offer incentives for referring a friend, much like what certain cable companies are doing
nowadays. For every person that you refer, you will get $10 put into your trading account. This
will cause people to want to spread the word, and we will get a lot more clientele this way.
Once we have a large clientele, it will be up to our performance as traders to gain a good
reputation. No matter how many people we have, if we do not perform and achieve results, we
will not have a solid reputation. Once we build our reputation locally, we will then move onto
larger business ventures. With experience and a built up reputation, it will be a lot easier to
market ourselves to larger corporations and get investments and funding.
As mentioned before, we will have three different tiers of trading, based on the level of
risk. We had initially planned on offering a 2% return on investment per month, because it was
higher than what most companies offer now, but because we have no reputation, there is no way
that anyone would trust us to live up to that. We do still want to offer this option as our third and
highest tier of risk. This tier will employ a more risky trading strategy, but with the potential of
more reward. Tier 1, the lowest risk level, will offer a 1% return on investment per month, but
with a far lower level of risk that tier 3. A lot more trades will be executed on tier 3 than on tier
1, and the risk to reward ratio will also be lower for tier 3. Tier 1 trades will only use 1 standard
lot, while tier 3 trades may use multiple lots. Right in the middle of both of these will be tier 2.
This will offer a 1.5% return on investment per month, and will be a nice balance of risk and
profit. This will be the tier that we recommend for most of our customers.
The difference between the trading strategies in each tier will lie in the time interval
traded on. We will always stick to our trading strategy, using the Stochastic and moving average
crosses along with basic support and resistance levels. Tier 1 trades will be executed based off
longer term oscillations seen in the 15-30 minute intervals. Tier 2 trades will be based mainly off

57
the 15-minute interval, and tier 3 trades will be executed on all levels; this means more trades,
and more opportunities for profit, but also more potential for losses.
58
Conclusion
After 7 months of experience with the forex market and studying its tendencies, a
successful money management company is now a very real possibility. Through research and
practicing with prop accounts we have learned how the forex market works on multiple levels.
This includes the effect of real world problems on the market as well as technical factors that
show how the market is going to react. Based off of this research a trading plan was created that
outlines how the company will invest a client’s money. There are multiple plans depending on
the level of risk that the client would be comfortable with. Also included in this plan is the
percentage the company will expect to make based off of the amount of money invested and the
level of risk associated with the investment. A risk management system is outlined that tells how
we will trade and the stop losses of the trades that will be made. Based off of this trading plan the
group created automatic trading robots that would successfully make trades based off of certain
conditions. The conditions which we made the robots trade are the same conditions that the
group traded and that are outlined in the plan. Research on where and how the company would
be constructed was also done. This included government regulations imposed on companies
inside and outside of the United States. Liability issues with the owners of the company were
considered as well as the structure of the insurance of the company. Through this project our
group gained a much greater understanding of the Forex market and how it works on a micro and
macro level. This along with the knowing of how to create and protect a company will give us
the tools we need to manage ours and other people’s money and allow us to invest our money
intelligently in the future.

59
Recommendations For future IQPs, we would recommend a very similar structure, but with more idea for
the students of what the ultimate goal will be. The order in which we learned the material,
focusing on individual aspects, served us well in our overall understanding of the subject, but we
felt that we were not always aware of what the end result would be. If the students knew that in
the end it would all conclude around launching a successful forex trading company, we may have
been able to focus our research accordingly. Other than that, the order in which we went about it,
and the way we concentrated on each aspect one at a time, really allowed our knowledge to build
upon itself, leading to a thorough understanding of it all.
Another recommendation we would make is to give an alternative to programming. We
think it was pretty clear that some groups simply lacked programming skills, and this really
affected our ability to make complex trading robots. In the future you could either try to make
sure that each group has someone who is a capable programmer, or make it so that groups can
choose between marketing a trading robot and marketing a money management firm. This way
groups will not be affected negatively because of their inability to program.
One final recommendation we would have to make is to have more group trading chat
rooms and more demonstrations in class of how you trade. We had talked about doing this in
class a few times, but it was very hard to have everybody present at the same time. We think it is
definitely something that should be implemented in the future, because a lot can be learned from
watching other people trade in real time and also trading and making decisions as a large group,
and talking about the decisions as you make them, getting real time criticism.
A recommendation for students taking this IQP in the future would be to work closely
with others taking the class. People can offer valuable advice and can be a great tool when you
are unsure how to do something. Most of the time others are having similar problems and you

60
can work as a group to figure them out. Your classmates will be more than happy to help, and all
it takes is simply walking up to someone and asking. It is an invaluable resource that should be
used whenever possible.
61
References "Bank of Italy: EMU Debt Crisis Main Risk To Global Economy | ForexLive." Forex News |
Currency News by ForexLive. Web. 03 Nov. 2011.
<http://www.forexlive.com/blog/2011/11/02/bank-of-italy-emu-debt-crisis-main-risk-to-
global-economy/>.
"Bernanke Letter to Congress Defends Fed Emergency Lending | ForexLive." Forex News |
Currency News by ForexLive. 06 Dec. 2011. Web. 06 Dec. 2011.
<http://www.forexlive.com/blog/2011/12/06/bernanke-letter-to-congress-defends-fed-
emergency-lending/>.
"Bernanke Letter to Congress Defends Fed Emergency Lending | ForexLive." Forex News |
Currency News by ForexLive. 06 Dec. 2011. Web. 06 Dec. 2011.
<http://www.forexlive.com/blog/2011/12/06/bernanke-letter-to-congress-defends-fed-
emergency-lending/>.
"Business & Money" Web. 27 Oct. 2011. <http://money.howstuffworks.com/personal-
finance/financial-planning/stocks.htm>.
"Business Legal Structure." QuickMBA: Accounting, Business Law, Economics,
Entrepreneurship, Finance, Management, Marketing, Operations, Statistics, Strategy.
Web. 24 Jan. 2012. <http://www.quickmba.com/law/org/>.
"Central Banks Act to Ease Euro Liquidity Strains; Fears Remain | ForexLive." Forex News |
Currency News by ForexLive. 30 Nov. 2011. Web. 30 Nov. 2011.
<http://www.forexlive.com/blog/2011/11/30/central-banks-act-to-ease-euro-liquidity-
strains-fears-remain/>.
"Choosing the Legal Structure of Your Business - Sole Proprietorship, Partnership, LLC,
Corporation, S-Corporation." Home Business, Start Your Home-Based Business with
62
PowerHomeBiz.com. Web. 26 Jan. 2012.
<http://www.powerhomebiz.com/vol3/legalstructure.htm>.
"Commodity Futures Trading Commission." Wikipedia, the Free Encyclopedia. Web. 26 Jan.
2012. <http://en.wikipedia.org/wiki/Commodity_Futures_Trading_Commission>.
"Comparison Table." University of Wisconsin Center for Cooperatives. Web. 26 Jan. 2012.
<http://www.uwcc.wisc.edu/staff/lawless/gregtab.html>.
"Draghi Dashes Hopes Of Aggressive ECB Funding For EMU Govts | ForexLive." Forex News |
Currency News by ForexLive. 08 Dec. 2011. Web. 08 Dec. 2011.
<http://www.forexlive.com/blog/2011/12/08/draghi-dashes-hopes-of-aggressive-ecb-
funding-for-emu-govts/>.
"Draghi Dashes Hopes Of Aggressive ECB Funding For EMU Govts | ForexLive." Forex News |
Currency News by ForexLive. 08 Dec. 2011. Web. 08 Dec. 2011.
<http://www.forexlive.com/blog/2011/12/08/draghi-dashes-hopes-of-aggressive-ecb-
funding-for-emu-govts/>.
"ECB: More SMEs Report Difficulty Obtaining External Financing | ForexLive." Forex News |
Currency News by ForexLive. 01 Dec. 2011. Web. 01 Dec. 2011.
<http://www.forexlive.com/blog/2011/12/01/ecb-more-smes-report-difficulty-obtaining-
external-financing/>.
"EMU Finance Ministers Seek Further Options To Boost EFSF | ForexLive." Forex News |
Currency News by ForexLive. 30 Nov. 2011. Web. 30 Nov. 2011.
<http://www.forexlive.com/blog/2011/11/30/emu-finance-ministers-seek-further-options-
to-boost-efsf/>.
63
"EU Commissioners Debating Expanded ECB Mandate | ForexLive." Forex News | Currency
News by ForexLive. 21 Nov. 2011. Web. 21 Nov. 2011.
<http://www.forexlive.com/blog/2011/11/21/eu-commissioners-debating-expanded-ecb-
mandate/>.
"EU Rules Charge Banks In Weak Countries Less For Funding Aid | ForexLive." Forex News |
Currency News by ForexLive. 01 Dec. 2011. Web. 01 Dec. 2011.
<http://www.forexlive.com/blog/2011/12/01/eu-rules-charge-banks-in-weak-countries-
less-for-funding-aid/>.
"EU Threatens Greece Over Written Commitment To Aid Terms | ForexLive." Forex News |
Currency News by ForexLive. 21 Nov. 2011. Web. 21 Nov. 2011.
<http://www.forexlive.com/blog/2011/11/21/eu-threatens-greece-over-written-
commitment-to-aid-terms/>.
"Excerpt:FOMC Mins: Committee Policy Action | ForexLive." Forex News | Currency News by
ForexLive. 22 Nov. 2011. Web. 22 Nov. 2011.
<http://www.forexlive.com/blog/2011/11/22/excerptfomc-mins-committee-policy-
action/>.
"FRB: Press Release--Federal Reserve Issues FOMC Statement--November 2, 2011." Board of
Governors of the Federal Reserve System. Web. 03 Nov. 2011.
<http://www.federalreserve.gov/newsevents/press/monetary/20111102a.htm>.
"Fed's 'Operation Twist,' Explained In 4 Easy Steps : Planet Money : NPR." NPR : National
Public Radio : News & Analysis, World, US, Music & Arts : NPR. Web. 27 Oct. 2011.
<http://www.npr.org/blogs/money/2011/09/21/140643696/operation-twist-explained-in-
4-easy-steps>.
64
"Fitch: 50% Greek Haircut If Accepted Would Be Default – Text | ForexLive." Forex News |
Currency News by ForexLive. Web. 03 Nov. 2011.
<http://www.forexlive.com/blog/2011/10/28/fitch-50-greek-haircut-if-accepted-would-
be-default-text/>.
"Forex - Pips, Spread, Margin, Leverage." Learn to Invest Money. Web. 15 Jan. 2012.
<http://www.learning-to-invest.com/Forex---pips-spread-margin-leverage--9.html>.
"Forex - Pips, Spread, Margin, Leverage." Learn to Invest Money. Web. 27 Oct. 2011.
<http://www.learning-to-invest.com/Forex---pips-spread-margin-leverage--9.html>.
"Forex Basics - Forex Trading Basics." Forex Trading | Forex Trading Tutorials | Currency
Trading. Web. 15 Jan. 2012.
<http://forextrading.about.com/od/forexbasics/Forex_Basics.htm>.
"Forex Basics - Forex Trading Basics." Forex Trading | Forex Trading Tutorials | Currency
Trading. Web. 27 Oct. 2011.
<http://forextrading.about.com/od/forexbasics/Forex_Basics.htm>.
"Forex Trading Money Management - An EYE OPENING Article | Forex Trading." Nial Fuller
~ Learn To Trade 'Price Action' Forex Trading Strategies. Web. 26 Jan. 2012.
<http://www.learntotradethemarket.com/forex-articles/forex-trading-money-managment-
truths-article>.
"France, Germany to Push for Treaty Changes for Fiscal Union | ForexLive." Forex News |
Currency News by ForexLive. 24 Nov. 2011. Web. 24 Nov. 2011.
<http://www.forexlive.com/blog/2011/11/24/france-germany-to-push-for-treaty-changes-
for-fiscal-union/>.
65
"Germany,France See Reduced Sovereignty For High-Deficit Govts | ForexLive." Forex News |
Currency News by ForexLive. 07 Dec. 2011. Web. 07 Dec. 2011.
<http://www.forexlive.com/blog/2011/12/07/germanyfrance-see-reduced-sovereignty-
for-high-deficit-govts/>.
"Germany,France See Reduced Sovereignty For High-Deficit Govts | ForexLive." Forex News |
Currency News by ForexLive. 07 Dec. 2011. Web. 07 Dec. 2011.
<http://www.forexlive.com/blog/2011/12/07/germanyfrance-see-reduced-sovereignty-
for-high-deficit-govts/>.
"Germany Sells E1.933 Bln In New 12-Mth Bubills,Avg Yld 0.346% | ForexLive." Forex News |
Currency News by ForexLive. Web. 03 Nov. 2011.
<http://www.forexlive.com/blog/2011/10/31/germany-sells-e1-933-bln-in-new-12-mth-
bubillsavg-yld-0-346/>.
"Germany’s Merkel: Money To Defend The Euro Is Limited | ForexLive." Forex News |
Currency News by ForexLive. 23 Nov. 2011. Web. 23 Nov. 2011.
<http://www.forexlive.com/blog/2011/11/23/germanys-merkel-money-to-defend-the-
euro-is-limited/>.
"Germany’s Merkel Underlines Need For PSI In Future ESM | ForexLive." Forex News |
Currency News by ForexLive. 2 Dec. 2011. Web. 2 Dec. 2011.
<http://www.forexlive.com/blog/2011/12/02/germanys-merkel-underlines-need-for-psi-
in-future-esm/>.
"Germany’s Merkel Underlines Need For PSI In Future ESM | ForexLive." Forex News |
Currency News by ForexLive. 2 Dec. 2011. Web. 2 Dec. 2011.
66
<http://www.forexlive.com/blog/2011/12/02/germanys-merkel-underlines-need-for-psi-
in-future-esm/>.
"Greece’s Papandreou: Greeks Want To Stay In The Eurozone | ForexLive." Forex News |
Currency News by ForexLive. Web. 03 Nov. 2011.
<http://www.forexlive.com/blog/2011/11/03/greeces-papandreou-greeks-want-to-stay-in-
the-eurozone/>.
"Greece’s Papandreou Wants Referendum On New Bailout Plan | ForexLive." Forex News |
Currency News by ForexLive. Web. 03 Nov. 2011.
<http://www.forexlive.com/blog/2011/10/31/greeces-papandreou-wants-referendum-on-
new-bailout-plan/>.
"Hedge Fund Database." Research on Hedge Funds, Fund of Funds, and Managed Futures |
Alternative Investments. Web. 26 Jan. 2012.
<http://www.barclayhedge.com/products/best-hedge-funds-database.html>.
"Hedge Fund Law Blog» Blog Archive » What Licenses Do You Need to Start or Manage a
Hedge Fund?" Hedge Fund Law Blog. 24 Aug. 2008. Web. 26 Jan. 2012.
<http://www.hedgefundlawblog.com/what-licenses-do-you-need-to-start-or-manage-a-
hedge-fund.html>.
"HowStuffWorks "How Stocks and the Stock Market Work"" HowStuffWorks
"IIF Welcomes Eurogroup Approval Of EFSF Leveraging Plan | ForexLive." Forex News |
Currency News by ForexLive. 30 Nov. 2011. Web. 30 Nov. 2011.
<http://www.forexlive.com/blog/2011/11/30/iif-welcomes-eurogroup-approval-of-efsf-
leveraging-plan/>.
67
"Merkel Stresses Need For EU Treaty Changes To Fight Crisis | ForexLive." Forex News |
Currency News by ForexLive. 2 Dec. 2011. Web. 2 Dec. 2011.
<http://www.forexlive.com/blog/2011/12/02/merkel-stresses-need-for-eu-treaty-changes-
to-fight-crisis/>.
"Merkel Stresses Need For EU Treaty Changes To Fight Crisis | ForexLive." Forex News |
Currency News by ForexLive. 2 Dec. 2011. Web. 2 Dec. 2011.
<http://www.forexlive.com/blog/2011/12/02/merkel-stresses-need-for-eu-treaty-changes-
to-fight-crisis/>.
"News Headlines." CNBC Mobile Home. Web. 27 Oct. 2011.
<http://www.cnbc.com/id/24273207>.
"OECD: ECB Shld Cut Rates, Prepare For More Radical Measures | ForexLive." Forex News |
Currency News by ForexLive. 28 Nov. 2011. Web. 28 Nov. 2011.
<http://www.forexlive.com/blog/2011/11/28/oecd-ecb-shld-cut-rates-prepare-for-more-
radical-measures/>.
"OECD: Italy In Recession But Needs More Austerity Measures | ForexLive." Forex News |
Currency News by ForexLive. 28 Nov. 2011. Web. 28 Nov. 2011.
<http://www.forexlive.com/blog/2011/11/28/oecd-italy-in-recession-but-needs-more-
austerity-measures/>.
"Obama: US Recovery Still Fragile; Europe Adding To Uncertainty | ForexLive." Forex News |
Currency News by ForexLive. 05 Dec. 2011. Web. 05 Dec. 2011.
<http://www.forexlive.com/blog/2011/12/05/obama-us-recovery-still-fragile-europe-
adding-to-uncertainty/>.
68
"Obama: US Recovery Still Fragile; Europe Adding To Uncertainty | ForexLive." Forex News |
Currency News by ForexLive. 05 Dec. 2011. Web. 05 Dec. 2011.
<http://www.forexlive.com/blog/2011/12/05/obama-us-recovery-still-fragile-europe-
adding-to-uncertainty/>.
"Ohio Poised to Take Center Stage in Natural Gas Drilling Debate as It Considers Tapping Park
Lands « Protecting Our Waters." Protecting Our Waters. Web. 27 Oct. 2011.
<http://protectingourwaters.wordpress.com/2011/04/01/ohio-poised-to-take-center-stage-
in-natural-gas-drilling-debate-as-it-considers-tapping-park-lands/>.
"Safe Haven No More: Swiss Franc ETF Collapses On Peg To Euro." Self Directed Investor.
Web. 27 Oct. 2011. <http://www.selfdirectedinvestor.com/article/201109/safe-haven-no-
more-swiss-franc-etf-collapses-on-peg-to-euro-safehavennomore.htm/>.
"Sarkozy, Merkel: Referendum Must Ask If Greece Will Keep Euro | ForexLive." Forex News |
Currency News by ForexLive. Web. 03 Nov. 2011.
<http://www.forexlive.com/blog/2011/11/02/sarkozy-merkel-referendum-must-ask-if-
greece-will-keep-euro/>.
"Sarkozy: Must Reform EMU So That No Govt Will Default On Debt | ForexLive." Forex News
| Currency News by ForexLive. 1 Dec. 2011. Web. 1 Dec. 2011.
<http://www.forexlive.com/blog/2011/12/01/sarkozy-must-reform-emu-so-that-no-govt-
will-default-on-debt/>.
"Sarkozy: Must Reform EMU So That No Govt Will Default On Debt | ForexLive." Forex News
| Currency News by ForexLive. 1 Dec. 2011. Web. 1 Dec. 2011.
<http://www.forexlive.com/blog/2011/12/01/sarkozy-must-reform-emu-so-that-no-govt-
will-default-on-debt/>.
69
"Schaeuble: All EMU States Would Lose AAA If Eurobond Adopted | ForexLive." Forex News |
Currency News by ForexLive. 28 Nov. 2011. Web. 28 Nov. 2011.
<http://www.forexlive.com/blog/2011/11/28/schaeuble-all-emu-states-would-lose-aaa-if-
eurobond-adopted/>.
"Securities and Exchange Commission - Credo Reference Topic." Credo Reference Home. Web.
26 Jan. 2012.
<http://www.credoreference.com/topic/securities_and_exchange_commission>.
"Spain Gross Bond Sales YTD Is E75.7Bn Or 80.5% Projection | ForexLive." Forex News |
Currency News by ForexLive. Web. 03 Nov. 2011.
<http://www.forexlive.com/blog/2011/11/02/spain-gross-bond-sales-ytd-is-e75-7bn-or-
80-5-projection/>.
"Stock Definition." Investopedia.com - Your Source For Investing Education. Web. 27 Oct.
2011. <http://www.investopedia.com/terms/s/stock.asp#axzz1WfUsXKgz>.
"Stock Definition | Investopedia." Investopedia – The Web’s Largest Investing Resource. Web.
15 Jan. 2012. <http://www.investopedia.com/terms/s/stock.asp>.
"Stock Exchange." Wikipedia, the Free Encyclopedia. Web. 15 Jan. 2012.
<http://en.wikipedia.org/wiki/Stock_exchange>.
"Stock Market History." Stock Market History. Web. 29 May 2012.
<http://stockmarketinvestinginfo.com/smi_history.html>.
"The Stock Market [The Beginning]." ThinkQuest. Oracle Foundation. Web. 29 May 2012.
<http://library.thinkquest.org/3088/stockmarket/thebeginning.html>.
"Stock Market Timeline." Stock Market Timeline. Web. 29 May 2012. <http://www.stocks-
simplified.com/Stock-Market-Timeline.html>.
70
"Stock Trader." Wikipedia, the Free Encyclopedia. Web. 15 Jan. 2012.
<http://en.wikipedia.org/wiki/Stock_trader>.
"Stock Trading Strategies." Online Stock Trading Guide - Stock Market Education for Traders.
Web. 15 Jan. 2012. <http://www.online-stock-trading-guide.com/stock-trading-
strategies.html>.
"Stock Trading Strategies." Online Stock Trading Guide - Stock Market Education for Traders.
Web. 27 Oct. 2011. <http://www.online-stock-trading-guide.com/stock-trading-
strategies.html>.
"U.S. Securities and Exchange Commission." Wikipedia, the Free Encyclopedia. Web. 26 Jan.
2012. <http://en.wikipedia.org/wiki/U.S._Securities_and_Exchange_Commission>.
"US ISM Text: US Manufacturing Growth Expected In 2012 | ForexLive." Forex News |
Currency News by ForexLive. 06 Dec. 2011. Web. 06 Dec. 2011.
<http://www.forexlive.com/blog/2011/12/06/us-ism-text-us-manufacturing-growth-
expected-in-2012/>.
"US ISM Text: US Manufacturing Growth Expected In 2012 | ForexLive." Forex News |
Currency News by ForexLive. 06 Dec. 2011. Web. 06 Dec. 2011.
<http://www.forexlive.com/blog/2011/12/06/us-ism-text-us-manufacturing-growth-
expected-in-2012/>.
"Update: Draghi: ECB Council Divided On Timing Of Rate Cut | ForexLive." Forex News |
Currency News by ForexLive. 08 Dec. 2011. Web. 08 Dec. 2011.
<http://www.forexlive.com/blog/2011/12/08/update-draghi-ecb-council-divided-on-
timing-of-rate-cut/>.
71
"Update: Draghi: ECB Council Divided On Timing Of Rate Cut | ForexLive." Forex News |
Currency News by ForexLive. 08 Dec. 2011. Web. 08 Dec. 2011.
<http://www.forexlive.com/blog/2011/12/08/update-draghi-ecb-council-divided-on-
timing-of-rate-cut/>.
"Yearly Gold Chart - 1 Year Gold Price Chart, Daily Closes." Gold Price, Buy Gold, Gold
Coins, Gold Mining Stocks, Free Gold News and Precious Metals Online Information -
GoldSeek.com. Web. 27 Oct. 2011.
<http://www.goldseek.com/quotes/charts/yearlygoldchart.php>.
Barufaldi, Dan. "Hedge Funds: Performance Measurement." Investopedia – The Web’s Largest
Investing Resource. Web. 26 Jan. 2012. <http://www.investopedia.com/university/hedge-
fund/performance-measurement.asp>.
Beckner, Steven K. "Bernanke: Ready to Provide More Mon Stimulus If Needed | ForexLive."
Forex News | Currency News by ForexLive. Web. 03 Nov. 2011.
<http://www.forexlive.com/blog/2011/11/02/bernanke-ready-to-provide-more-mon-
stimulus-if-needed>.
Brain, Marshall, and Dave Roos. "HowStuffWorks "How Stocks and the Stock Market Work""
HowStuffWorks "Business & Money" Web. 15 Jan. 2012.
<http://money.howstuffworks.com/personal-finance/financial-planning/stocks.htm>.
DuBoff, Leonard. "AIGA Center for Practice Management - Legal Structures for the Design
Firm." AIGA Center for Practice Management - Home. 18 June 2002. Web. 24 Jan. 2012.
<http://cpm.aiga.org/legal_issues/legal_structures_for_the_design_firm>.
Duffy, Jack. "Germany’s Auction Flop Spurs Higher Yields Across Eurozone | ForexLive."
Forex News | Currency News by ForexLive. 23 Nov. 2011. Web. 23 Nov. 2011.
72
<http://www.forexlive.com/blog/2011/11/23/germanys-auction-flop-spurs-higher-yields-
across-eurozone/>.
Forex Indicators | Tutorials, Explanations and Free Forex Indicators. Web. 15 Jan. 2012.
<http://www.forexindicators.net/>.
Forex News | Currency News by ForexLive. Web. 15 Jan. 2012. <http://forexlive.com>.
Forex Trading Regulation. Web. 26 Jan. 2012. <http://www.forex-regulation.com/>.
Gandel, Stephen. "The Fed Says the Economy Is Getting Better and Worse At the Same Time -
The Curious Capitalist - TIME.com." The Curious Capitalist - Commentary on the
Economy, the Markets, and Business - TIME.com. Web. 03 Nov. 2011.
<http://curiouscapitalist.blogs.time.com/2011/11/02/the-fed-says-the-economy-is-getting-
better-and-worse-at-the-same-time/>.
Gartman, Dennis. The Gartman Letter. Web. 15 Jan. 2012. <http://www.thegartmanletter.com/>.
Gartman, Dennis. The Gartman Letter – Cloud.thegartmanletter.com. Web. 15 Jan. 2012.
<http://cloud.thegartmanletter.com/>.
Geewax, Marilyn, and Eyder Peralta. "S&P Downgrades The Credit Of Nine European
Countries, Including France." WBUR. 13 Jan. 2012. Web. 15 Jan. 2012.
<http://www.wbur.org/npr/145178453/s-p-downgrades-france-deals-a-blow-to-
eurozone>.
Jack, Duffy. "Germany’s Auction Flop Spurs Higher Yields Across Eurozone | ForexLive."
Forex News | Currency News by ForexLive. 23 Nov. 2011. Web. 23 Nov. 2011.
<http://www.forexlive.com/blog/2011/11/23/germanys-auction-flop-spurs-higher-yields-
across-eurozone/>.
73
Janssen, Cory, Chad Langager, and Casey Murphy. "Technical Analysis: Fundamental Vs.
Technical Analysis." Investopedia – The Web’s Largest Investing Resource. Web. 15
Jan. 2012. <http://www.investopedia.com/university/technical/techanalysis2.asp>.
Janssen, Cory. "Technical Analysis: Fundamental Vs. Technical Analysis." Investopedia.com -
Your Source For Investing Education. Web. 27 Oct. 2011.
<http://www.investopedia.com/university/technical/techanalysis2.asp#axzz1WfUsXKgz>
.
Lee, Kelvin. "Average True Range (ATR) Indicator Explained | Forex Indicator Guide." Best
Forex Indicator - Forex Indicators - Forex Training. Web. 27 Oct. 2011.
<http://www.forexindicator.org/average-true-range-atr-indicator-explained.html>.
Lee, Kelvin. "Forex Support and Resistance Indicator Explained | Forex Indicator Guide." Best
Forex Indicator - Forex Indicators - Forex Training. Web. 27 Oct. 2011.
<http://www.forexindicator.org/forex-support-and-resistance-indicator-explained.html>.
Lee, Kelvin. "Most Popular Forex Indicator In My Chart | Forex Indicator Guide." Best Forex
Indicator - Forex Indicators - Forex Training. Web. 27 Oct. 2011.
<http://www.forexindicator.org/most-popular-forex-indicator-in-my-chart.html>.
Lee, Kelvin. "My Favourite Forex Reversal Indicators | Forex Indicator Guide." Best Forex
Indicator - Forex Indicators - Forex Training. Web. 27 Oct. 2011.
<http://www.forexindicator.org/my-favourite-forex-reversal-indicators.html>.
Logue, Ann C. "Who Regulates the Financial Markets? - For Dummies." How-To Help and
Videos - For Dummies. Web. 26 Jan. 2012. <http://www.dummies.com/how-
to/content/who-regulates-the-financial-markets.html>.
74
NFA - National Futures Association. Web. 26 Jan. 2012.
<http://www.nfa.futures.org/index.asp>.
Odion-Esene, Brai. "Bernanke: Addtl Monetary Stimulus Option Remains On The Table |
ForexLive." Forex News | Currency News by ForexLive. Web. 03 Nov. 2011.
<http://www.forexlive.com/blog/2011/11/02/bernanke-addtl-monetary-stimulus-option-
remains-on-the-table/>.
Protess, Ben. "Commodity Futures Trading Commission News - The New York Times." Times
Topics - The New York Times. 6 Oct. 2011. Web. 26 Jan. 2012.
<http://topics.nytimes.com/top/reference/timestopics/organizations/c/commodity_futures
_trading_commission/index.html>.
Revy, Edward. "Forex Money Management & Exit Strategies." Forex Strategies & Systems
Revealed. Web. 26 Jan. 2012. <http://forex-strategies-revealed.com/money-management-
systems>.
Updegrave, Walter. "Ask the Expert: Long vs. Short - Feb. 2, 2005." CNNMoney - Business,
Financial and Personal Finance News. 02 Feb. 2005. Web. 15 Jan. 2012.
<http://money.cnn.com/2005/02/02/pf/expert/ask_expert/index.htm>.
Updegrave, Walter. "Ask the Expert: Long vs. Short - Feb. 2, 2005." CNNMoney - Business,
Financial and Personal Finance News. 02 Feb. 2005. Web. 27 Oct. 2011.
<http://money.cnn.com/2005/02/02/pf/expert/ask_expert/index.htm>.
Wearden, Graeme. "Swiss Bid to Peg 'safe Haven' Franc to the Euro Stuns Currency Traders |
Business | Guardian.co.uk." Latest News, Sport and Comment from the Guardian | The
Guardian. Web. 27 Oct. 2011.
<http://www.guardian.co.uk/business/2011/sep/06/switzerland-pegs-swiss-franc-euro>.

75
76
Appendix A – Global Development and its Impact on the Forex Market This will be a summary of the events that have taken place since the start of this project
and will explain their impact on the forex market.
A-1 Election of Mr. Yoshihiko Noda as Japan’s new Prime Minister Mr. Yoshihiko has been the Finance Minister in Mr. Kan’s Administration. Mr. Noda had
defeated his rival, Mr. Banri Kaieda, in the second round of votes by 215-177. This affects things
in a macroeconomic sense because Mr. Noda has been a support of a materially higher
consumption tax in Japan and a very strong supporter of the increased US-Japanese military
cooperation in Asia. Gartman finds that a higher consumption tax in Japan is illogical because
Japan has been in depression for almost two decades. Mr. Noda also believes in nuclear power
and that nuclear power is going to play a role in powering japan on a daily basis. Also, since Mr.
Noda was very conservative about using his powers to intervene in the FOREX market when he
was the finance minister so it will be interesting to see who Mr. Noda appoints as his
replacement. The MOF has intervened twice during Mr. Noda’s tenure, after the tsunami at the
Fukushima nuclear power plant earlier this year. The MOF stands for the Ministry of Finance
and it’s one of the cabinet level ministries of the Japanese government. When Mr. Noda has
chosen Mr. Jun Azumi as the new Minister of Finance, it had seemed to surprise Gartman
because Mr. Azumi is very young at an age of 49 years old. The position seems to have always
been for a more senior ranking member of the party. There is speculation that Mr. Noda’s first
pick was Mr. Katsuya Okada but since Mr. Noda was going to be very involved in the Finance
Ministry than most previous Prime Ministers in the previous years, Mr. Okada had declined.
I agree with Gartman that the higher consumption tax in Japan seems illogical because
Japan has been in depression for so long. However, it seems like it could be working for them as
77
the debt Japan owes is to its people. With so much support from its own people, it is likely that
its own people will keep supporting Japan and keep paying a higher consumption tax. A higher
consumption tax will give more money to the government which will in turn hopefully turns
things around in Japan after the disaster. It also seems to be a good thing that Mr. Noda is going
to be more involved with the Finance Ministry than the previous Prime Ministers in the previous
years but it could also be bad because he would be working two different positions at once if he
gets too involved with the Finance Ministry.
A-2 The Tying of the Swiss National Bank to the Euro The Swiss National Bank has chosen to peg the Franc to the EUR at 1.2000 EURs/CHf
and that the Swiss National Bank would expend however much money it needs to spend to do so.
This is interesting because in history, there had never been a case in which a stronger currency
regime will willingly tie itself to a lesser, weaker currency regime. Gartman acknowledges that it
might have been done by some nation, major or minor, but he is not aware of such event
happening. With the Swiss National Bank pegging the franc to the EUR, it basically means that
the Swiss Franc is done as a currency. It means that it is basically the EUR because it’s pegged at
the same relative value. Since the Franc is a “safe haven” for a lot of investors during times of
monetary duress, these investors will now have to look somewhere else for a “safe haven”. This
is the first time since 1978 that the Swiss National Bank has limited the value of the Swiss Franc
in this way against another currency.18
What’s interesting about this is how the Swiss National Bank has decided to peg itself to
a currency that is a lot weaker. It’s also interesting how the economy is going to react to this
because since the Swiss Franc is a safe haven currency, where are people going to put their
money after this peg happens? Gold seems to be a clear next choice but it has not been very
18
http://finance.yahoo.com/news/Swiss-central-bank-sets-limit-apf-2514152395.html?x=0&.v=11
78
stable in recent weeks and months. The Swiss Franc had soared by a third since the collapse of
the Lehman Brothers in 2008 as investors invest in the Swiss Franc since it’s a safe haven
currency. Will this peg also slow down growth or increase growth for the Swiss? It should
increase the growth of the Swiss economy as exports and tourism would be cheaper. Since the
massive overvaluation of the Swiss Franc will pose a threat to the Swiss economy, how will this
peg to the EUR affect the Swiss economy? Hopefully this is a right choice for the Swiss as it
could fix their overvaluation of the Swiss Franc as there are too many investors using the Swiss
Franc as a safe haven currency. There could be other implications with pegging a currency make
as the Swiss National Bank will have to keep printing money and buying other currencies to keep
their value down. With a stronger Swiss Franc, the exports of Swiss products would be very
expensive. With a weaker Swiss Franc, it could help the export business in Switzerland and also
the tourism business. It could very well help the whole Swiss economy because the Swiss
government estimated that the recent rise in the strength of the Swiss Franc’s value will reduce
the growth rate of the Swiss economy by 0.3% this year and by another 0.6% the following year.
The exports of jewelry, precious metals, machinery, and electronics were on the decline as
well.19
The actions made by the Swiss National Bank might be in consideration by Japan as
Japan has the same problem of having too high of a currency which makes exports very
expensive. 20
I think this is a smart move by the Swiss National Bank to actually enforce your currency
to be lower so it’s not as overvalued. The peg will allow for the Swiss Franc to be weaker and for
the exports out of Switzerland to be cheaper. It will also help the tourism business as everything
is so expensive in Switzerland. A Big Mac from McDonalds in Switzerland right now costs a
19
http://finance.yahoo.com/news/Swiss-central-bank-sets-limit-apf-2514152395.html?x=0&.v=11 20
http://english.aljazeera.net/business/2011/09/2011979103975856.html
79
little more than $8 so the tourism business right now is not doing very well as everything is so
expensive. I’m not quite sure what it would mean overall for the whole FOREX market though if
the Swiss Franc is going to be pegged to the EUR. Also, since the Swiss Franc would now not be
a safe haven currency anymore, investors might look to the Yen and that would be bad as the
Japan Finance Ministry are also trying to devalue their currency.21
A-3 Operation Twist The Federal Reserve has announced their new operation from their two day meeting and
it is a stimulus move which revives a policy from the 1960’s. It is called “Operation Twist” and
it is supposed to sell $400 billion in short term treasuries in exchange for the same amount of
longer-term bonds starting in October and ending in June 2012. The Federal Reserve plans to sell
the securities with remaining maturities of 3 years or less and plan to buy securities with
maturities of six to thirty years. This would be an example in money and it would be dollar for
dollar so no new money would be forced into the banking system. This exchange from short term
treasures to long term bonds would lower yields on long term bonds while keeping the rates of
short term bonds around the same. This move would therefore push down the interest rates on a
wide variety of loans such as mortgages to business loans which would give consumers and
companies an incentive to borrow and spend money. Mainly, it seems like this operation would
support the mortgage markets as there was a new paragraph quoted in the Gartman Letter that
says:
“To help support conditions in mortgage markets, the Committee will now reinvest
principal payments from its holdings of agency debt and agency mortgage-backed securities in
agency mortgage back securities. In addition, the Committee will maintain is existing policy of
rolling over maturing Treasury securities at auction.”
21
http://www.forextv.com/forex-news-story/what-would-a-swiss-franc-peg-to-the-euro-mean-to-world-currencies
80
This clause that was added shows how important the mortgage market is to the economy and
how the Federal Reserve is trying to make it better. The last sentence of rolling over maturing
Treasury securities is a little confusing but hopefully the Fed is doing something about the
securities they have.22
It would be interesting to see how this Operation Twist would work because back in
1961, a similar operation was down it had only lowered the long term rates by 0.15 of a percent.
Even though Gartman had been a supporter of the actions of the Federal Reserve, Gartman thinks
that this decision was a poor decision and that it was ill-advised and would do damage to the
national regional and small banks. He thinks this because the national regional and small banks
depend on the positive slope to the curve to get profits. By twisting the curve, the nation’s banks
seem to have been dealt a very severe blow. He believes that the twist in the curve would have
little to no affect on the mortgage market and the housing market as it is such a small shift.
Overall, Gartman believes that the twist is a bad idea because it would harm the nations smaller
banks that rely on the positively sloped yield curve to get profits. 23
I would agree with Gartman on Operation Twist as it appears that it did not do much back
when this sort of policy was enacted back in 1961. The twist in the curve would have only a very
little change to the mortgage market and the long term rates. From what I understand, the
twisting in the curve would hurt smaller banks because they would borrow short and lend long
and that twisting it would affect that ratio and would net less profits to the smaller banks.
Hopefully this would not be a very severe case because if it was a very small change in long term
rates, it would be a small change in short term rates as well.
22
http://money.cnn.com/2011/09/21/news/economy/federal_reserve_operation_twist/index.htm 23
http://www.guardian.co.uk/business/2011/sep/21/operation-twist-federal-resrve-gamble-us-economic-stimulus
81
A-4 Japan’s Situation Japan has a lot of debt right now and the Yen is way too strong for Japan’s liking for
Japan to recover. The Swiss Franc and the Yen were the safe haven currencies and with the move
made by the Swiss Franc to peg itself to the EUR, the Yen looks more and more as a better safe
haven currency. With such a strong currency, the Japan is not doing as well as there is economic
news that show how they are not doing so well in terms of their own economy. A leading
indicator for corporate capital spending, core machinery orders, have fell 8.2% in July from the
previous month in Japan. This means that Japan itself is not doing so well and a strong currency
would make situations worse. Exports have also fallen due to the strong Yen. Japan also has a
net debt that is bigger as a share of GDP and it also has a primary budget deficit.
I think it would be smart for Japan to try to lower their currency as it is too strong for
them to bounce back from their debts right now. I would assume they would do something
similar that the Swiss National Bank is doing and that is to buy unlimited amounts of other
currencies to try to lower their currency. It’s also interesting as we talked about in class that the
Japanese debt is mainly held by its own people and that is why Japan is doing so well. It appears
that households alone have around $16 trillion in assets and that is roughly twice the amount of
outstanding government bonds. Corporations and firms also hold a lot of the debt. It would be
very interesting to see where Japan will lead and how they would handle their too strong of a
Yen. 24
A-5 The Situation in Europe The spotlight in Europe is put on Greece as Greece fights its way against an inevitable
default. Issue after issue of the Gartman Letter, Gartman is very keen on the fact that Greece
would end up defaulting sometime in the near future as the situation there is not improving and
24
http://www.economist.com/node/18988858
82
countries that support Greece may not be able to continue to support Greece. If Greece defaults,
it seems that other European countries such as Italy would default as well. Gartman also talks
about how the working people of Greece such as teachers, dock workers, lawyers, doctors, health
care workers, plumbers, pipefitters, carpenters, bartenders, and all would not abide by these
austerity measures if Greece does not default. Austerity measures mean that there is a lower
spending and a reduction of benefits and public services provided to help cut a country’s deficit.
An example of other countries not being able to continue to support Greece is in the Gartman
Letter issue from September 14. In this issue, Gartman goes over how Mr. Wen from China had
spoke at a World Economic Forum event and that he basically said that China has countless
times lent a helping hand to Europe and that they would continue to invest in Europe. However,
he wants and expects proper action to be taken so that China’s investments there would be secure
and right now he is not quite convinced that investments there are safe. The markets appear to
have granted a 90% or more probability to an imminent Greek default so Mr. Wen has basically
told Europe that this cannot be allowed to spread as China has investments all over Europe. It is
also historically shown that Greece has defaulted on its loans. Other European countries are not
doing too well either such as Italy as Standard and Poors had decided to cut its debt rating on
Italy one notch. Italy went from A+/A-1+ to A/A-1 and Standard and Poors also decided that the
outlook for Italy was negative. Italy has Europe’s second largest debt level in raw terms. Buyers
of Italy’s debt have become skeptical and nervous on Italy’s ability to repay them.
If Greece happens to default, there would be a “Domino Effect” in which other PIIGS
(Portugal, Italy, Spain, and Ireland) would follow. Basically, if Greece defaults, countries such as
Italy, Portugal, and Spain would most likely follow as you can not really expect these countries
to continue with all their debt from investors abroad. There is basically an idea that Gartman
83
brings up that is basically if you are either Portugal, Spain, or Italy and you see Greece default on
its loan, why would you try to stick it out and take the higher road and pay the outstanding debts?
This “Domino Effect” would have a huge effect on the world economy as there is so much
money from other countries involved invested in these European countries. Germany,
represented by Ms. Merkel, for one has said that they would try their best and use all of the
economic and political tools to prevent Greece from defaulting. This was stated in the September
14th
Gartman Letter but in the September 12th
Gartman Letter, it seems that Germany does not
want to give Greece any more money as history has shown over and over that Greece would
default on its loans. This makes it seem like Germany is split in helping Greece as the German
people does not seem to want their tax dollars being sent to countries that might default but the
higher authorities see the bigger picture in which a Greece default would lead to other defaults
which would be devastating for European countries. There was also a mentioning about how
Jurgen Stark has resigned from his position at the ECB which would mean that the interests of
the people of Germany were being torn to tatters by others in the ECB committee. Jurgen Stark
was very old school in terms of his ways of banking as he had old guard principals to central
banking and that he was “stark” in his attitudes. His resignation also immediately had an effect
on the EUR as it fell instantly when the news of his resignation went public.
I think that it is smart that Germany is trying their best to help Greece as if Greece falls,
Germany could be in a lot of trouble as well as they are pretty much tied together along with the
rest of the European countries. I also find that it is very interesting that you can see the trends
with the EUR in real time looking at the EURUSD currency trade in MT4. The whole past month
after the initial drop in the EUR it had been pretty much around the same level and nothing much
seems to have happened. Right now it is mainly just hanging around the same levels and there
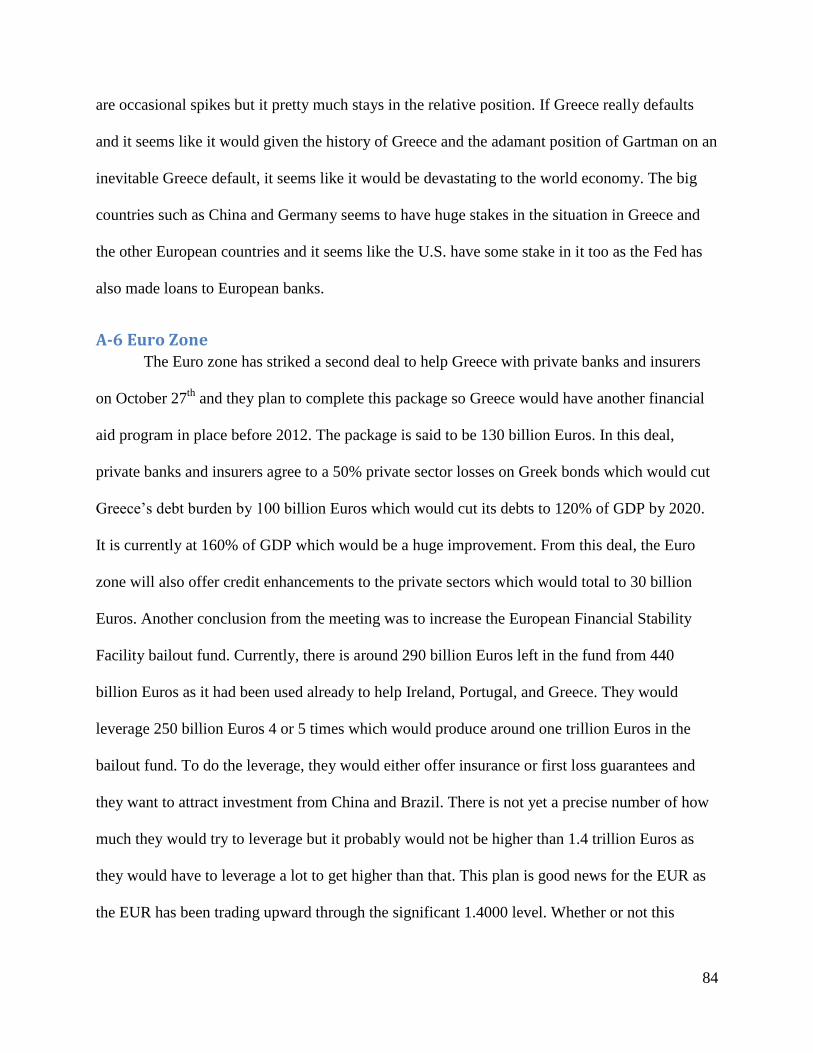
84
are occasional spikes but it pretty much stays in the relative position. If Greece really defaults
and it seems like it would given the history of Greece and the adamant position of Gartman on an
inevitable Greece default, it seems like it would be devastating to the world economy. The big
countries such as China and Germany seems to have huge stakes in the situation in Greece and
the other European countries and it seems like the U.S. have some stake in it too as the Fed has
also made loans to European banks.
A-6 Euro Zone The Euro zone has striked a second deal to help Greece with private banks and insurers
on October 27th
and they plan to complete this package so Greece would have another financial
aid program in place before 2012. The package is said to be 130 billion Euros. In this deal,
private banks and insurers agree to a 50% private sector losses on Greek bonds which would cut
Greece’s debt burden by 100 billion Euros which would cut its debts to 120% of GDP by 2020.
It is currently at 160% of GDP which would be a huge improvement. From this deal, the Euro
zone will also offer credit enhancements to the private sectors which would total to 30 billion
Euros. Another conclusion from the meeting was to increase the European Financial Stability
Facility bailout fund. Currently, there is around 290 billion Euros left in the fund from 440
billion Euros as it had been used already to help Ireland, Portugal, and Greece. They would
leverage 250 billion Euros 4 or 5 times which would produce around one trillion Euros in the
bailout fund. To do the leverage, they would either offer insurance or first loss guarantees and
they want to attract investment from China and Brazil. There is not yet a precise number of how
much they would try to leverage but it probably would not be higher than 1.4 trillion Euros as
they would have to leverage a lot to get higher than that. This plan is good news for the EUR as
the EUR has been trading upward through the significant 1.4000 level. Whether or not this
85
program would work, the EUR has responded in a positive way and has been trending upwards
the whole day on October 27th
. 25
26
Figure 32 - Macroeconomic Issues EURUSD 1.4 Mark
Pictured is the EURUSD currency pair and you can tell that the EUR has been trending upwards
and has broken through the 1.4000 mark.
I think that it is a good idea that the Euro zone had decided to help Greece once more and
that it is very important for European countries to work together. I’m not quite sure how the
leveraging of the bailout money to get to one trillion Euros work but I would assume it is based
VERY heavily on investors and how much trust they can put into the Euro zone and the situation
in Europe. China has given their input on how they want their investments to be safe and how
they are getting more and more skeptical every day in terms of how safe their investment is.
From a report today (October, 27), the Chinese Premier Wen Jiabao had signaled some sort of
25
http://www.reuters.com/article/2011/10/27/eurozone-idUSL5E7LR0M220111027 26
http://www.businessweek.com/news/2011-10-27/sarkozy-wins-china-cooperation-pledge-as-japan-plans-efsf-
aid.html
86
willingness to help with the European Union. What China is worried about however is that there
is disagreement amongst the European policy makers so that it makes China uneasy on spending
money on a plan even Europeans do not want to support. This is very true in the case of
Germany as the people of Germany do not want their tax money helping Greece for example. It
would be interesting on how the Euro zone can get their investments to raise their bailout fund to
around one trillion Euros. There are some programs the banks are trying to make so that China
and Brazil can play a role and it appears that there would be programs in which China and Brazil
would recycle their trade surpluses through Europe in the form of debt issues. These programs
would be called “Special Purpose Vehicles” and Gartman had compared this to the Special
Purpose Vehicles that were related to Enron. There is also the factor of how much is enough as
there is already so much money pumped in Greece so one do not really know how much would
be a good bailout fund.
A-7 Development Late October to Early December 2011 The following information was gathered from reading the Gartman Letter daily for the
past couple of months and following news updates on forexlive.com.
In mid-November Japan made yet another unsuccessful attempt at intervening with the
increasing value of the Yen. They had announced previously that they have $200 billion to
intervene with the situation, which they put to use earlier this week. The efforts were successful
at first, but the MOF decided not to intervene for a second day and thus the Yen was pushed back
up in the next day of trading. They refrained from intervention again on the third day, and it
seems as if all hope has been lost on this fourth attempt to stabilize the currency.
Europe has been all over the headlines in the last couple of months. They were able to
spark everyone’s interest their plan for a plan, allowing EURUSD to trade back up to the all-
87
important 1.4000 level once again. In mid-November S&P filed false report about Europe
downgrading France’s debt, which caused a huge downward spike for the EUR. The losses were
regained after the false rumor was proven wrong, but the “damage had been done.” But it just
seems to be problem after problem for Europe, with a number of its countries in serious debt, and
two of its countries losing their prime ministers and feeling their way into new governments. The
Italian president has asked Mr. Monti to form a new government, and in Greece the new Prime
Minister, Mr. Papademos, has also undertaken the same task. Now we have two “technocrat”
governments in the Eurozone. Hopefully the new leaders can remain un-political and focus on
their tasks of forming governments that will reduce debt, cut spending, and increase national
productivity.
Nicolas Sarkozy called for a change that will ask for the creation of a European
Monetary Fund to support countries in need. The ECB’s new president, Mr. Draghi, made a
statement that forces authorities to be concerned about both inflationary and deflationary risks.
They are trying to weaken to currency in order to strengthen the economy and save the union.
S&P has put 15 Euro-zone countries on “credit watch.” It is clear that something must happen in
Europe, because the real way to get rid of deficits is with economic growth.
The source of a lot of Europe’s problems in the past few months has been Greece, which
is currently on the brink of leaving the EMU. Greece is expected to run out of funding by the end
of the year. It is unclear whether they will default, leave the EMU, or be kicked out of the EMU.
In Germany, discussion has begun concerning the requirements for a member of the EMU to be
allowed to leave on its own accord, or how the “core” nations will be able to force nations out
that cannot repay their debt.
88
Europe seems to be taking drastic measures to prevent this from happening. In the
meantime, Mr. Papandreou chose to stand down from his position of Prime Minister. Mr.
Papademos took his position and set out to make a new coalition/unity government which would
include a number of austerity measures. This transfer of power was not supportive of the EUR. It
is unclear as to who will become prime minister when actual elections are held. There was chaos
in Athens over the austerity measures with tear gas and violence in the streets.
Italy has also seen its fair share of problems. Their government has been on the verge of
failure, and the ECB has considered stopping the buying of Italian debt unless Italy figures out
its situation. On top of all this Prime Minster Berlusconi stepped down from his position. Senator
Monti was put in charge of creating a new government. Italy had austerity measures imposed
upon them by the “Troika” in order to start paying back their debt.
France also found its way into the headlines a few times. They voiced their rising concern
with continuously worsening situation in Europe which has driven their lending rates through the
roof. They have been fighting for reform, but Germany shows no interest in reform because of
the small affect the recession is having upon their country. There has also been speculation that
France’s AAA debt rating may be lowered sooner rather than later. Germany decided to make a
stability pact with the French that will take effect on the first day of the new year and chance the
treaties that govern Europe. The pact will impose even more austerity measures for Europe and
punishments for not fulfilling them. It will also require the ECB to buy European debt more
aggressively and be a “crisis fighter.”
Chinese government has taken action to cut its reserve requirements from 21.5% to
21.0% causing the Renminbi to be weaker. This was a signal that something big had changed in
the market today and the ECB and Federal Reserve reported that “swap lines” had been opened
89
to create liquidity for the European Monetary authorities. The swap lines are simply to supply
dollars overseas at a cheaper rate then had been previously available. The FED lends money to
foreign banks for a period of time during the liquidity and the banks use the money to lend to
local banks.
In two months, Canada has lost 54,000 jobs, and considering their lower population in
comparison to the U.S., this is a very high number. As a result the Canadian dollar has fallen
relative to the U.S. dollar. For the first time in a long time the USD has traded higher than the
Canadian dollar.
Here in the United States, the state of the economy is unclear. The Fed says the economy
is getting better and worse at the same time. There is not much news which would give reason
for joy or despair; just same stuff, different day. Consumers have been spending more money
than expected in this holiday season; businesses are purchasing more equipment and software;
and inflation has dropped as the price of oil and gas prices have fallen. However, the Fed says
that GDP and employment won’t improve as much as was previously estimated. This has caused
economic growth estimates for this year to be nearly cut in half. Federal Reserve Chairman Ben
Bernanke says that the Fed is ready to provide more monetary stimulus if necessary. One
possibility would be to do a large-scale purchasing of mortgage backed securities. The Fed chief
also talked of the possibility of providing clearer, more dependent data on exactly how long the
Fed will keep the federal funds rate near zero. The Fed will try to use its remaining tools of asset
purchases and communication in combination with one another to achieve its dual mandate of
maximum employment and price stability. Other than that, unemployment has held relatively
steady as well as many other economic indicators. Some things are signaling a turnaround while
others are saying that we are still in a recession. The future is uncertain.
90
One positive thing that the U.S. economy has going for it at this time is its rising oil
production, due mostly to the discovery of shales capable of producing vast amount of natural
gas products. Oil production here in the U.S. has risen drastically in the past few years, and as
more and more shales are being discovered, this number is expected to do nothing less than rise,
and at an exponential rate. Not only will this bring money in the U.S., but it will also create
countless new jobs, and will cause business to thrive in the areas of these shale formations. Also,
as we are able to create more and more of our own oil, our dependency on other countries for oil
will decrease, and hopefully oil prices will drop for the citizens here in the U.S. as well. This
could really stimulate our economy and hopefully steer us away from recession.
President Obama spoke in China, asking China to stop “gaming” the system and start
acting like a “grown up” economy. As of late, China’s success has been due to their ability to
keep their currency’s value low. This shall prove to be popular among people here in America,
but his stance will not be taken kindly from those in Beijing.
A-8 Development January to February 2012 As the term started the situation in Europe was still worsening while US, Canada,
Australia, and New Zealand were improving. Canada and US are working on the oil pipeline
project but Canada had become less and less cooperative if the US didn’t do what Canada wants.
Also the money borrowed from the ECB in Europe was approaching 600 Billion and therefore
the ECB was pushing for more monetary policies and austerity programs. Mr. Draghi said that
this was not the way to deal with the debt because more austerity would be a recipe for recession
or depression, not growth. All of the European countries have had their debt rating go down with
the exceptions being Finland, Germany, Luxembourg and Netherlands. France and Australia
have been cut to AA+, Solvenia cut to A+, Slovakia and Spain cut to A, Malta cut to A-, Italy cut
91
to BBB+, Cyprus cut to BB+, Portugal to BB, and Greece remains at a CC. The EFSF’s debt
rating had also been cut down to a AA+, which resulted in Netherlands, Finland, and
Luxembourg announcing that they will no longer put money into the EFSF. After this the IMF
vowed to help the European situation but the ECB owns 40 billion in Greek debt and Gartman
was very doubtful of Greek debt. Despite all of this there was finally a plan worked out to create
a rescue fund for Greece. The ESM and EFSF were combined to make a fund as large as 750
billion euros. Now it is a waiting game to see if the new austerity measures and the bailout fund
works to reduce the crisis in Europe.
In the US the term started off good for the economy especially the value of the USD with
respect to the Euro because of the situation over there. Despite the crisis level the currency pair
never dropped as much as people thought, going down to only about 1.2. Also unemployment
decline considerably throughout the term, capped off in January when the unemployment report
showed the decline had been from 50,000 to 352,000 jobless claims. Gartman commented on the
dependency of the market based on this report and he does not like it because the report is almost
never right and is constantly being revised in later months.
92
Appendix B – Gartman Letter Summary
Thursday November 17th
With the situation in Europe still making front page news, the US dollar will continue to
strengthen. In general western hemisphere currencies have been relatively strong as of
late.
France is becoming more and more worried about the situation in Europe as their
borrowing rates have raised quite drastically. They are urging the ECB and ESFS to take
action. Germany, which has not been affected as much, is more reluctant to make any
changes at this time.
The economic data of the day says that industrial production here in the US rose 0.7% in
October, which was higher than expected. Industrial production levels are far higher than
the lows set during the recession in the summer of 2009 but are still below the levels we
experienced pre-recession in fall of 2007.
Foreign holdings of US debt increased 1.9% in September which suggests that foreign
demand for US debt remains strong.
Friday November 18th
It was thought the EUR might make a recovery but chaos in Athens and images of tear
gas and violence in the streets prevented this from happening
The occupy Wall Street movement has gotten achieved more recognition and success
than was originally anticipated.
France’s debt rating may be lowered sooner rather than later. The debate between France
and Germany continues, with France pushing for reform and Germany rather content
with its current situation.
With all the negativity in Europe it is surprising that the EUR has remained steady as
long as it has, but it is uncertain how long this will last.
We await the results of the President of the Federal Reserve Bank speaking this morning
as well as the results of the Conference Board’s Coincident Leading and Lagging
Indicators.
93
Monday November 21st
Thanksgiving is this week so the markets will most likely be quiet, as they have been in
the past.
Super committee in congress has to make 1.2 trillion in deficit reductions. This is a task
of cutting 1.2 trillion from budgets over the next ten years. However the reports from
Washington are that neither the democrats nor republicans have budged over their
positions. The republicans refuse to budge on the tax increase that the democrats want
and the democrats have refused to budge on the entitlement cuts that the republicans
want.
Debate in Europe is over whether the ECB should buy the sovereign debts of the nations
in Europe and it is basically everybody vs. Germany. Germany has made it known that
they do not want this to happen, and France is the leader of the opposition.
Tuesday November 22nd
The Dollar is up and down today while the other dollars are weak.
Obama made a speech saying the budget cuts will be “done with a scalpel rather than an
ax” which is not too good considering the large deficit.
S&P and Moody’s said they would not downgrade the US’s sovereign debt rating despite
no decision from congress, which is a good thing at this point.
Despite bad news in Europe the EUR wont falter and is staying at 1.3400.
Wednesday November 23rd
FOMC meeting minutes;
QE III – very likely on the way
unemployment rates concern – rate holding steady at 9.1%
housing market concerns – still very weak
Talk about how Sarkozy and Merkkel would be talking to revise Treaties (Political and
monetary)
Thursday November 24th
Latest German bond offering failed game in Europe changed so Germany
94
Friday November 25th
Both Sarkozy and Merkkel want to make revisions to the Treaties, both political and
monetary unions
France might lose AAA rating soon
Monday November 28th
Germany is going to make announcement later this week regarding the stability pact that
was made with the French. The pact will take effect on January first and is a change to
the treaties that govern Europe.
First component is there will be more austerity measures that must be taken by all the
members of the EMU and the punishments for not obeying these measures are mandatory
for EURO-zone members. The second component is the ECB will now be expected to
buy European debt aggressively and be a “crisis fighter”.
This news sent the EUR up but it did not hold at its highs for too long.
Gartman says that the beneficiaries of this pact are “dollar” countries like Canada and the
US. Mainly Canada because of their banking system which is in very good shape, they
are rich in raw materials, a lot of port facilities, educated work force, and a nation of laws
and property rights that are protected.
Tuesday November 29th
There is another European Finance Minister’s summit meeting which is planning to
downgrade banks across Europe because the governments were too strained to come o
their aid. Also S&P is talking about downgrading France’s AAA rating in the next two
weeks. Also at the meeting they are expected to approve an expansion of the EFSF’s
ability to buy Spanish and Italian debts.
There is also talk of the US’s AAA rating being downgraded unless something is done
about the US budget deficit.
Italy is set to auction 8 billion in notes today, both a 3 year and a 10 year note which shall
demand coupons above 7%.
95
News from the political Unions in the UK is getting worse. Britain’s Labor party said that
it will oppose any expansion of Brussels’ power if it means any damage might be brought
upon prospects for economic growth in the UK. Douglas Alexander said that joining the
single currency was never on the Labor’s agenda and he says the UK will not lose
influence in the world if it remains outside of the monetary union.
Wednesday November 30th
EUR has been moving today, has traded at 1.3260 up to 1.3440, although the rest of the
market it pretty stable.
Gartman commented about the EUR and the concept of the countries that make up that
currency. He didn’t think it would work when it was first created and he is very surprised
that it has remained in the global spot light for as long as it has. The history of violence
among the countries that comprise the EUR has made it destined to fail, as the notion that
they could forgive and forget is clearly against human nature.
There is also talk that the IMF could be pressed into coming to EUR’s aid but this is a
misconceived notion. That would mean that the treasuries of America, Canada, Australia,
or New Zealand would vote to spend their tax payers dollars to help out the non tax
payers in Greece and Italy etc. In a time of 5% unemployment and large GDP growth this
might be a possibility but at the current state this is impossible and it is nothing but
rumors.
Thursday December 1st
Chinese government has taken action to cut its reserve requirements from 21.5% to
21.0% and this has the Renminbi weaker today. This was a signal that something big had
changed in the market today and the ECB and Federal Reserve reported that “swap lines”
had been opened to create liquidity for the European Monetary authorities.
The swap lines are simply to supply dollars overseas at a cheaper rate then had been
previously available. The FED lends money to foreign banks for a period of time during
the liquidity and the banks use the money to lend to local banks.
Poland Foreign Minister, Mr. Sikorski said that he fears German inactivity more than
German power and he encourages them to do something. He realizes that the survival of
96
Poland is based on the EURO ZONE and needs it to be strong. Therefore doing nothing
is not the answer and actions needs to be taken.
Friday December 2, 2011
Nicolas Sarkozy called for a change that will ask for the creation of a European Monetary
Fund to support countries in need. He did it without much approval or assent.
The ECB’s new president, Mr. Draghi, made a statement that forces authorities to be
concerned about both inflationary and deflationary risks. They are trying to weaken to
currency in order to strengthen the economy and save the union.
The ISM Manufacturing Index rose 1.9 points to 52.7 in November, which was better
than expected. The New Orders Index increased 4.3 percent from October to 56.7
percent. The Prices Index also rose 4 percent to 45 percent, but prices of raw materials
continue to decrease for the second month in a row.
Unemployment is still relatively constant.
Monday December 5, 2011
In two months, Canada has lost 54,000 jobs, and considering their lower population in
comparison to the U.S., this is a very high number. As a result the Canadian dollar has
fallen relative to the U.S. dollar.
The central banks of Europe, Canada, Japan, and the U.S. agreed last week to lower the
price of existing U.S. dollar liquidity swaps.
Today, Italy will learn how severe their austerity measures will be. It is expected that
they will have to make a lot of sacrifices. Similarly, Greece is expected to approve their
austere budget on the 7th
.
Tuesday December 6, 2011
S&P has put 15 Euro-zone countries on “credit watch”
Could cut ratings within the next ninety days
It is because of constant pressure of the countries as we know the problems of Europe, it
has put downward pressure on Eurozone’s credit rating
Austria, Belgium, Finland, Germany, Luxembourg, the Netherlands would most likely
have their ratings cut by one notch
97
Other Eurozone countries might be cut by two
Encourages leaders in Europe and ECB to let banks be more aggressive
Gartman finds that the “constitutions” that Merkel and Sarkozy would revise pretty much
when they want disconcerting
U.S. Treasury; Geithner going to meet with Germany’s Finance minister and Ms. Merkel
4th
trip there, shows the U.S. cares about the situation in Europe
Reserve Bank of Australia cut base rate by 25bps which brings it to 4.25%; lowest level
since a year and a half ago
Wednesday December 7, 2011
Starts off talking about ECB monetary policy committee meetings and how Mr. Geithner
(U.S. Treasury Secretary) would be there too
Talks about how the monetary and political unions made before were supposed to keep
Germany under rules and regulations but Germany remains top dog
o Berlin dictate new rules of new treaties
o Germany dictates debt/GDP ratios, spending programs, taxation
regulations
Basically Germany dictates and others would have to sign whether they like it or not
Gartman speculates that there will be a lot of compromise in the Eurozone regarding
debt, spending, taxes, etc and how there might be a new super governmental organization
similar to the IMF
Germany to have more severe debt/GDP ratios, new “supra-national bond buying
mechanism”
Thursday December 8, 2011
Forex market is “in neutral” today and most likely into tomorrow because everyone is
awaiting the outcomes of the meetings in Europe. Nothing could happen or agreements
could be made about debt reduction, rules, punishment and so forth.
Something needs to happen in Europe because the real way to get rid of deficits is with
economic growth so progress must occur.
ECB President Mario Draghi said that a material overhaul of the euro zone’s fiscal rules
is an absolute prerequisite to the banks playing a greater role is helping the debt crisis.
98
Possibility of a rate cut at the ECB monetary policy committee today.
Wednesday January 11th
Situation in Europe getting worse and worse while the US, Canada, Australia, and New
Zealand are going strong
Canadian prime minister following the US less and less with his decision to press ahead
with Canada’s interests in mind if the US doesn’t do what Canada expects such as the oil
pipeline project
Canadian dollar strongly over-bought…became more over-bought so this shows how
unpredictable the market is
Money borrowed from ECB by European banks approaching $600 billion
o Banks in Europe losing faith
Thursday January 12th
ECB has been pushing more and more monetary policies
o Clear difference of ECB under Mr. Draghi compared to ECB under Mr. Trichet
o Balance sheet has rose from 2.0 trillion euros to 2.69 trillion euros
Mr. Draghi knows that continued austerity programs along with other mandates are
ingredients for recession if not fully fledged depression
China inflation fallen to a new 15 months low of 4.1%
Friday January 13th
Strong auction of Spanish debt; major reversal being traced out
o Sold twice as much as they had targeted
Italy will sell bonds too and hopes for the best
o Rome selling 3 billion euros of three year notes, 1.75 billion of two old notes
o 90 billion euro of Italian bonds/notes will mature between Feb/April
o Madrid has 86 billion euro of bonds that will mature through the end of the year
Italian Prime Minister Mario Monti intends to put a new tax on financial transactions
Jobless claims rose, retail sales were disappointing
Monday January 16th
(S&P) Only Finland, Germany, Luxembourg, and Netherlands have AAA ratings
(S&P) France and Austria cut to AA+, Solvenia was cut to A+, Slovakia and Spain cut to
A, Malta cut to A-, Italy cut to BBB+, Cyprus to BB+, Portugal to BB, Greece is still at
CC.
o France in danger of another cut as public debt and budget deficits continue to rise
because of the poor economy
Seems to be waiting for Moody’s and Fitch to see what they would do in reaction to
S&P’s decisions
99
o ESFS rating might be in jeopardy as France and Austria have fallen from AAA to
AA+ and the S&P had said that they would use the lowest of the ESFS’s rating to
rate it so it would possibly be changed to AA+
Risks for institutional investors of European debt are heavily skewed
For Greece, the situation is still pretty bad but seem to have worked out a deal with
banks, pension funds, and hedge funds to accept a 50% cut.
o Need to convince IMF and EUR to lend them more money to stay alive
Wednesday, January 18th
The AAA rating of the EFSF has been downgraded to AA+, which puts upward pressure
upon interest rates. The Netherlands, Finland, and Luxembourg announced they have no
intention of putting more money into the EFSF.
The FDIC proposed an idea of requiring banks in control of over $10 billion to undergo
annual stress tests to evaluate their performance financial stability.
Thursday, January 19th
The IMF has vowed its aid to the European situation, but past experiences have people
worried about the outcome.
The Australian government reported that the employment totals there fell 29,300, which
was far worse than expected. The unemployment rate itself remained steady. It seems
they have learned something from the statisticians in the US labor department.
Friday, January 20th
Greek Finance Minister, Mr. Evangelos spoke on the progress being made with the Greek
debt situation and addressed the importance of acting now.
Weekly jobless claims saw a remarkable drop of 50,000 to 352,000, the largest single-
week decline since September ’05. The amount is expected to settle a middle point but
the decline is still impressive.
The Fed. St. Louis adjusted monetary base has remained overall unchanged for months.
Friday January 27th
Yen strengthening a lot from buying of the Yen by Japanese exporters
Ms. Christine Legarde from ECB says that they have no choice but to accept losses from
Greek debt
o -ECB owns ~40 billion euros of Greek debt
Still, Gartman remains very doubtful of Greece because of Greece’s past history
Trend of weekly jobless claims to be “from the upper left to the lower right”
National Statistics Institute in Madrid reported that the # of unemployed rushed past 5.0
million
100
Monday January 30th
Australia’s banks on “credit watch” so the Aussie dollar is under a lot of pressure
In Europe, it seems like they have agreed to a permanent rescue fund; seems like they
have summit meetings on a regular basis
o Told there is progress made with the discussions between holders of Greek debt
and the Greek government
European Stability Mechanism (ESM) will be live in July
o Funds from ESM and EFSF will be combined, fund as large as 750 billion euros.
Tuesday January 31st
EUR is strong and the dollar is weak because of news that 25 of the 27 EU nations have
agreed to a program to bail out Greece. Only UK and Czech Republic haven’t signed.
Compact will put into place balanced budget rules that are national laws for all EU
countries.
Gartman doesn’t like the compact because it just makes budget cuts rather than
supporting economic growth.
Unemployment report to come out in the US but speculation on this number is foolish.
Wednesday February 1st
Market has finally started to understand the error in the ways of how Europe is cutting so
much spending and not supporting economic growth. Because of this EUR is bearish.
The Swiss Franc almost made a cross of 1.2 relative to the EUR and traded at 2.015.
Swiss Bank has made it known that it will defend the 1.2 number with whatever means
they need.
Sarkozy and Merkel don’t seem to like each other and after the last round of meeting
Sarkozy said he would not be pushed around by Germany.
Man opposing Sarkozy for presidency has made it public he does not like the compact
and if elected will try to abrogate the compact or renegotiate the terms.
Thursday February 2nd
Market is quiet today and really waiting to see in the EURUSD can break the 1.3200
level.
Gartman again commented on how he does not think the market dependency on the
Employment Situation Report in the US is a good idea.
Japan is again concerned about the value of the Yen and Juri Azumi, the Minister of
Finance, is demanding a more aggressive stance on quantitative easing to bring the Yen
down.
101
Appendix C – Our Trades in the Forex Market
Pak’s Trades
Forex Capital Markets, LLC
Account: 2089478136 Name: B Term Currency: USD 2012 January 13, 21:55
Closed Transactions:
Ticket Open Time Type Size
Item Price S / L T / P Close Time Price Commissi
on Taxe
s Swa
p Profit
61215642
2011.11.14 22:02
balance
Deposit 100
000.00
61229976
2011.11.15 02:21
sell 1.0
0 eurus
d 1.3632
5 1.3637
0 1.3627
5 2011.11.15
02:33 1.3630
0 0.00 0.00 0.00 25.00
61247720
2011.11.15 07:03
sell 1.0
0 eurus
d 1.3599
0 0.0000
0 0.0000
0 2011.11.15
07:07 1.3588
6 0.00 0.00 0.00 104.00
61356220
2011.11.16 00:55
sell 1.0
0 eurus
d 1.3507
1 1.3516
5 0.0000
0 2011.11.16
00:59 1.3516
5 0.00 0.00 0.00 -94.00
61358816
2011.11.16 01:38
buy 1.0
0 eurus
d 1.3509
8 1.3487
0 1.3509
8 2011.11.16
02:03 1.3487
0 0.00 0.00 0.00 -228.00
61885497
2011.11.22 07:48
sell 1.0
0 eurus
d 1.3524
5 0.0000
0 1.3495
0 2011.11.22
13:50 1.3495
0 0.00 0.00 0.00 295.00
62108676
2011.11.24 09:10
sell 1.0
0 eurus
d 1.3395
0 0.0000
0 1.3368
5 2011.11.24
10:45 1.3368
5 0.00 0.00 0.00 265.00
62393846
2011.11.29 06:02
sell 1.0
0 eurus
d 1.3360
3 0.0000
0 1.3326
0 2011.11.29
08:41 1.3326
0 0.00 0.00 0.00 343.00
62928866
2011.12.06 01:53
buy 1.0
0 eurus
d 1.3368
4 0.0000
0 1.3380
0 2011.12.06
02:31 1.3373
4 0.00 0.00 0.00 50.00
63026812
2011.12.07 07:04
buy 1.0
0 eurus
d 1.3448
7 0.0000
0 0.0000
0 2011.12.07
07:39 1.3440
5 0.00 0.00 0.00 -82.00
63113037
2011.12.08 07:11
sell 1.0
0 eurus
d 1.3407
4 0.0000
0 1.3377
5 2011.12.08
13:59 1.3377
5 0.00 0.00 0.00 299.00
63223368
2011.12.09 07:00
sell 1.0
0 eurus
d 1.3301
8 0.0000
0 0.0000
0 2011.12.09
07:08 1.3293
0 0.00 0.00 0.00 88.00
64789011
2012.01.10 07:59
sell 1.0
0 eurus
d 1.2768
2 0.0000
0 0.0000
0 2012.01.10
08:08 1.2756
3 0.00 0.00 0.00 119.00
0.00 0.00 0.00 1
184.00
Closed P/L: 1 184.00
Open Trades:
Ticket Open Time Type Size
Item Price S / L T / P Price Commissi
on Taxe
s Swa
p Profit
No transactions
0.00 0.00 0.00 0.00
Floating P/L: 0.00
Working Orders:
Ticket Open Time Type Size
Item Price S / L T / P Market Price
No transactions
102
Summary:
Deposit/Withdrawal: 100
000.00 Credit Facility: 0.00
Closed Trade P/L: 1 184.00 Floating P/L: 0.00 Margin: 0.00
Balance: 101
184.00 Equity: 101 184.00 Free Margin: 101 184.00
Details:
Gross Profit: 1 588.00 Gross Loss: 404.00 Total Net Profit: 1 184.00
Profit Factor: 3.93 Expected Payoff: 98.67
Absolute Drawdown: 193.00 Maximal Drawdown: 322.00
(0.32%) Relative Drawdown:
0.32% (322.00)
Total Trades: 12 Short Positions (won %): 9 (88.89%) Long Positions (won
%): 3 (33.33%)
Profit Trades (% of total): 9 (75.00%) Loss trades (% of
total): 3 (25.00%)
Largest profit trade: 343.00 loss trade: -228.00
Average profit trade: 176.44 loss trade: -134.67
Maximum consecutive wins ($): 4 (953.00) consecutive losses
($): 2 (-322.00)
Maximal consecutive profit (count): 953.00 (4) consecutive loss
(count): -322.00 (2)
Average consecutive wins: 3 consecutive losses: 2
Figure 33 - B Term Trade Summary
Overall from trading between 11/14/2011 to 1/10/2012, I had made a profit of $1,184.00
which is pretty good for personal benefit but it does not meet our requirements of trying to
achieve 20% return on our investments. Daily, I had needed to get 8 pips a day because there are
260 trading days in an average trading year. With an initial investment of $100,000, 20% of it is
$20,000 divided by 260 days is 76.9 which is rounded up to 8 pips ($80) to make it much
simpler. I had found myself not to be able to trade every single day with other responsibilities so
103
that goal was not met even though I tried to go for more than 8 pips every time I traded. To try to
better this next term, I will try to trade with bigger lots to increase my profit.
Looking at the history log of my B term MT4 account, the trades look good and seems to
be strategic as I had remembered them to be. There has not been much stop losses put in but I
hope to put them in this term. I had not used the stop loss as I was previously frustrated with
opening a trade and setting a stop loss and pretty quickly have it close because it hit the stop loss.
Next, it would seem to just trigger my stop loss and then do a reversal of what I had expected to
have happened so I just stopped using stop loss. I also watch the screen pretty often when I have
an open position so I am somewhat a human stop loss as I will exit the trade I f it is going very
badly.
The history also shows the average profit and losses and my average profit was $176.44
while my average loss was $-134.67 which is pretty good but still not ideal. Ideally, I want my
risk-reward ratio to be greater than the ratio it is at now. My largest profit was $343.00 and my
largest loss was $-228 which is similar to the ratios of the average profit and losses. Again, this is
not as ideal as I would have liked as $-228 for a loss is pretty huge with 22.8 pips lost. The
history also shows that I prefer to go short as this whole past term the EURUSD has not really
rallied up that high. Constantly, it would just hold the current price point and eventually give up
and go lower and lower. This will probably be the case again this term considering how the
Eurozone nations are not doing very well. In terms of winning trades compared to losing trades, I
have a 75% success rate looking at the history. This is a pretty good ratio but I just need to put in
stop losses to make customers feel better if they were to see the history of my trades.
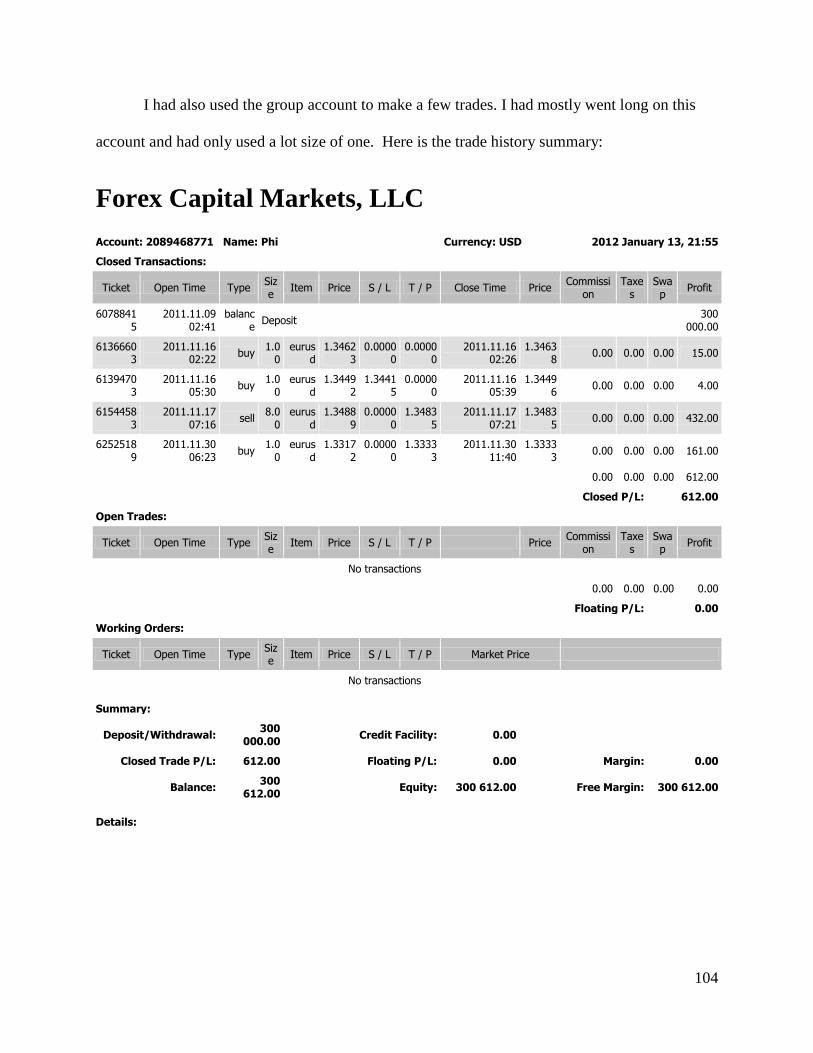
104
I had also used the group account to make a few trades. I had mostly went long on this
account and had only used a lot size of one. Here is the trade history summary:
Forex Capital Markets, LLC
Account: 2089468771 Name: Phi Currency: USD 2012 January 13, 21:55
Closed Transactions:
Ticket Open Time Type Size
Item Price S / L T / P Close Time Price Commissi
on Taxe
s Swa
p Profit
60788415
2011.11.09 02:41
balance
Deposit 300
000.00
61366603
2011.11.16 02:22
buy 1.0
0 eurus
d 1.3462
3 0.0000
0 0.0000
0 2011.11.16
02:26 1.3463
8 0.00 0.00 0.00 15.00
61394703
2011.11.16 05:30
buy 1.0
0 eurus
d 1.3449
2 1.3441
5 0.0000
0 2011.11.16
05:39 1.3449
6 0.00 0.00 0.00 4.00
61544583
2011.11.17 07:16
sell 8.0
0 eurus
d 1.3488
9 0.0000
0 1.3483
5 2011.11.17
07:21 1.3483
5 0.00 0.00 0.00 432.00
62525189
2011.11.30 06:23
buy 1.0
0 eurus
d 1.3317
2 0.0000
0 1.3333
3 2011.11.30
11:40 1.3333
3 0.00 0.00 0.00 161.00
0.00 0.00 0.00 612.00
Closed P/L: 612.00
Open Trades:
Ticket Open Time Type Size
Item Price S / L T / P Price Commissi
on Taxe
s Swa
p Profit
No transactions
0.00 0.00 0.00 0.00
Floating P/L: 0.00
Working Orders:
Ticket Open Time Type Size
Item Price S / L T / P Market Price
No transactions
Summary:
Deposit/Withdrawal: 300
000.00 Credit Facility: 0.00
Closed Trade P/L: 612.00 Floating P/L: 0.00 Margin: 0.00
Balance: 300
612.00 Equity: 300 612.00 Free Margin: 300 612.00
Details:
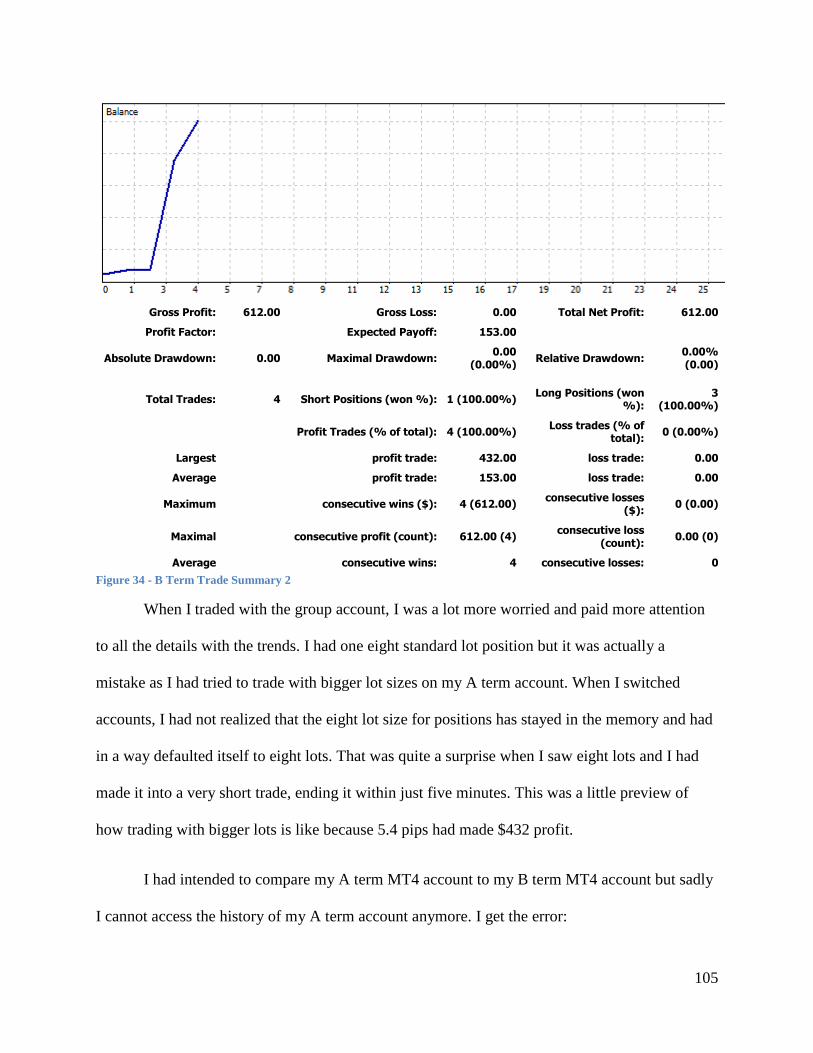
105
Gross Profit: 612.00 Gross Loss: 0.00 Total Net Profit: 612.00
Profit Factor:
Expected Payoff: 153.00
Absolute Drawdown: 0.00 Maximal Drawdown: 0.00
(0.00%) Relative Drawdown:
0.00% (0.00)
Total Trades: 4 Short Positions (won %): 1 (100.00%) Long Positions (won
%): 3
(100.00%)
Profit Trades (% of total): 4 (100.00%) Loss trades (% of
total): 0 (0.00%)
Largest profit trade: 432.00 loss trade: 0.00
Average profit trade: 153.00 loss trade: 0.00
Maximum consecutive wins ($): 4 (612.00) consecutive losses
($): 0 (0.00)
Maximal consecutive profit (count): 612.00 (4) consecutive loss
(count): 0.00 (0)
Average consecutive wins: 4 consecutive losses: 0
Figure 34 - B Term Trade Summary 2
When I traded with the group account, I was a lot more worried and paid more attention
to all the details with the trends. I had one eight standard lot position but it was actually a
mistake as I had tried to trade with bigger lot sizes on my A term account. When I switched
accounts, I had not realized that the eight lot size for positions has stayed in the memory and had
in a way defaulted itself to eight lots. That was quite a surprise when I saw eight lots and I had
made it into a very short trade, ending it within just five minutes. This was a little preview of
how trading with bigger lots is like because 5.4 pips had made $432 profit.
I had intended to compare my A term MT4 account to my B term MT4 account but sadly
I cannot access the history of my A term account anymore. I get the error:
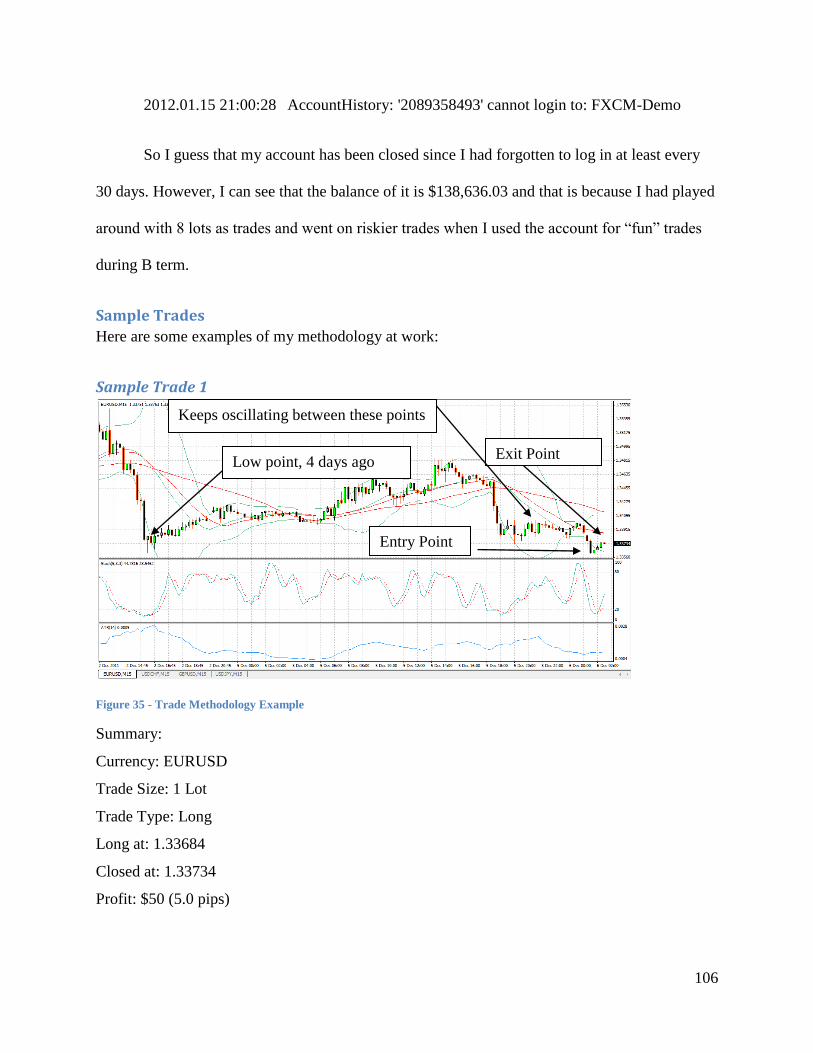
106
2012.01.15 21:00:28 AccountHistory: '2089358493' cannot login to: FXCM-Demo
So I guess that my account has been closed since I had forgotten to log in at least every
30 days. However, I can see that the balance of it is $138,636.03 and that is because I had played
around with 8 lots as trades and went on riskier trades when I used the account for “fun” trades
during B term.
Sample Trades
Here are some examples of my methodology at work:
Sample Trade 1
Figure 35 - Trade Methodology Example
Summary:
Currency: EURUSD
Trade Size: 1 Lot
Trade Type: Long
Long at: 1.33684
Closed at: 1.33734
Profit: $50 (5.0 pips)
Exit Point
Entry Point
Low point, 4 days ago
Keeps oscillating between these points
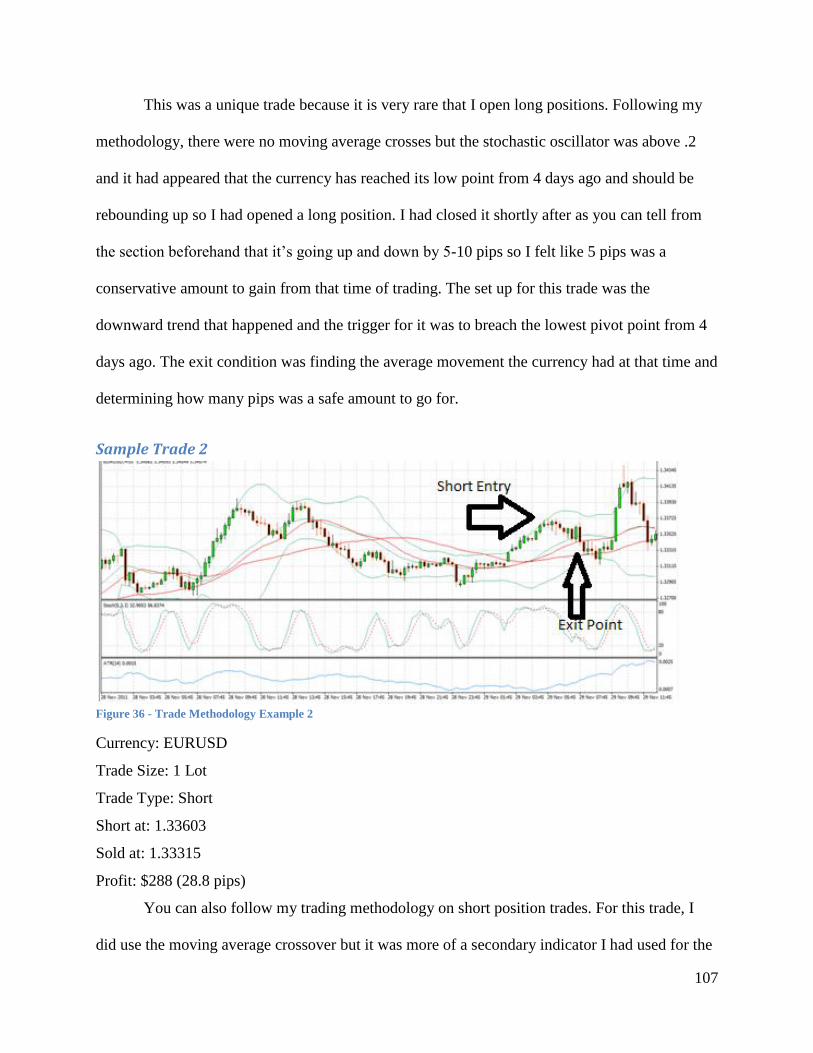
107
This was a unique trade because it is very rare that I open long positions. Following my
methodology, there were no moving average crosses but the stochastic oscillator was above .2
and it had appeared that the currency has reached its low point from 4 days ago and should be
rebounding up so I had opened a long position. I had closed it shortly after as you can tell from
the section beforehand that it’s going up and down by 5-10 pips so I felt like 5 pips was a
conservative amount to gain from that time of trading. The set up for this trade was the
downward trend that happened and the trigger for it was to breach the lowest pivot point from 4
days ago. The exit condition was finding the average movement the currency had at that time and
determining how many pips was a safe amount to go for.
Sample Trade 2
Figure 36 - Trade Methodology Example 2
Currency: EURUSD
Trade Size: 1 Lot
Trade Type: Short
Short at: 1.33603
Sold at: 1.33315
Profit: $288 (28.8 pips)
You can also follow my trading methodology on short position trades. For this trade, I
did use the moving average crossover but it was more of a secondary indicator I had used for the
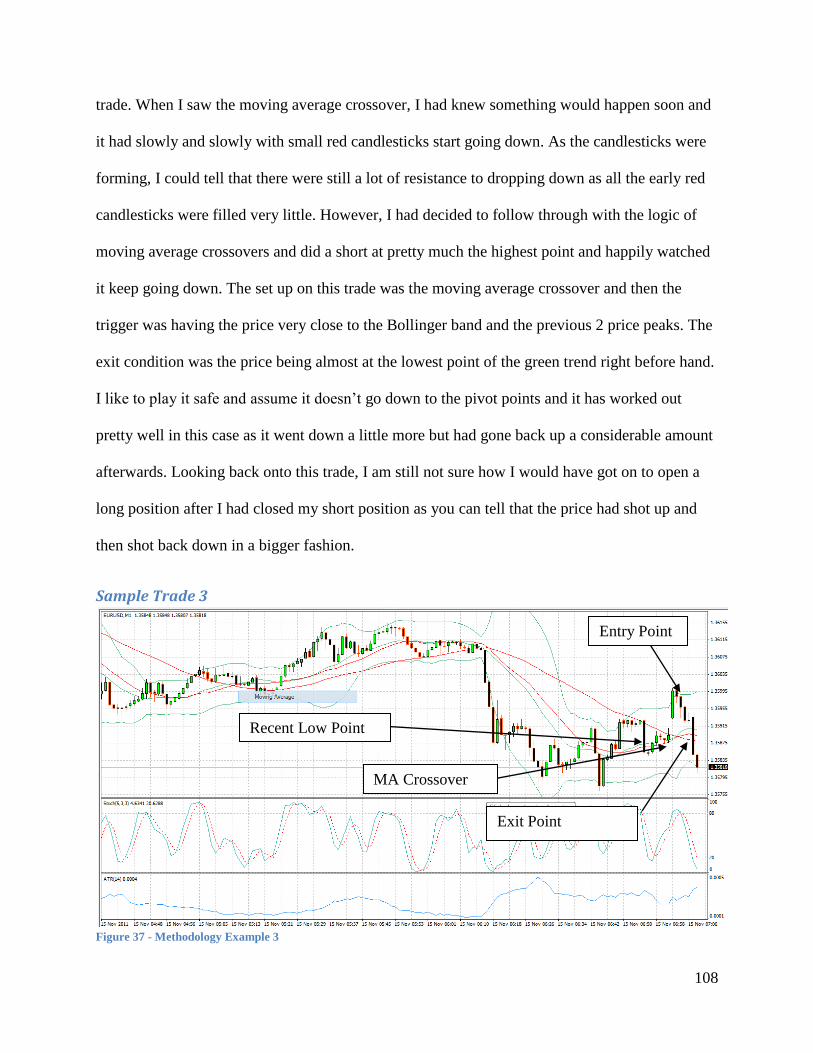
108
trade. When I saw the moving average crossover, I had knew something would happen soon and
it had slowly and slowly with small red candlesticks start going down. As the candlesticks were
forming, I could tell that there were still a lot of resistance to dropping down as all the early red
candlesticks were filled very little. However, I had decided to follow through with the logic of
moving average crossovers and did a short at pretty much the highest point and happily watched
it keep going down. The set up on this trade was the moving average crossover and then the
trigger was having the price very close to the Bollinger band and the previous 2 price peaks. The
exit condition was the price being almost at the lowest point of the green trend right before hand.
I like to play it safe and assume it doesn’t go down to the pivot points and it has worked out
pretty well in this case as it went down a little more but had gone back up a considerable amount
afterwards. Looking back onto this trade, I am still not sure how I would have got on to open a
long position after I had closed my short position as you can tell that the price had shot up and
then shot back down in a bigger fashion.
Sample Trade 3
Figure 37 - Methodology Example 3
Entry Point
Exit Point
MA Crossover
Recent Low Point
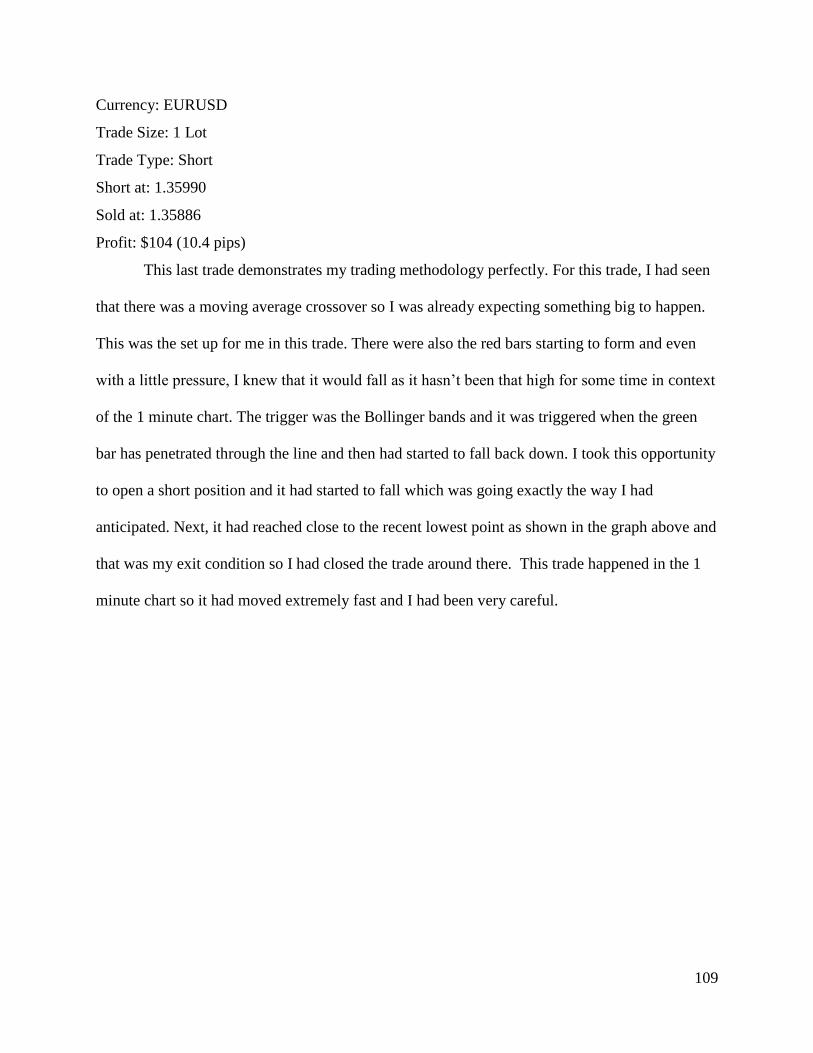
109
Currency: EURUSD
Trade Size: 1 Lot
Trade Type: Short
Short at: 1.35990
Sold at: 1.35886
Profit: $104 (10.4 pips)
This last trade demonstrates my trading methodology perfectly. For this trade, I had seen
that there was a moving average crossover so I was already expecting something big to happen.
This was the set up for me in this trade. There were also the red bars starting to form and even
with a little pressure, I knew that it would fall as it hasn’t been that high for some time in context
of the 1 minute chart. The trigger was the Bollinger bands and it was triggered when the green
bar has penetrated through the line and then had started to fall back down. I took this opportunity
to open a short position and it had started to fall which was going exactly the way I had
anticipated. Next, it had reached close to the recent lowest point as shown in the graph above and
that was my exit condition so I had closed the trade around there. This trade happened in the 1
minute chart so it had moved extremely fast and I had been very careful.
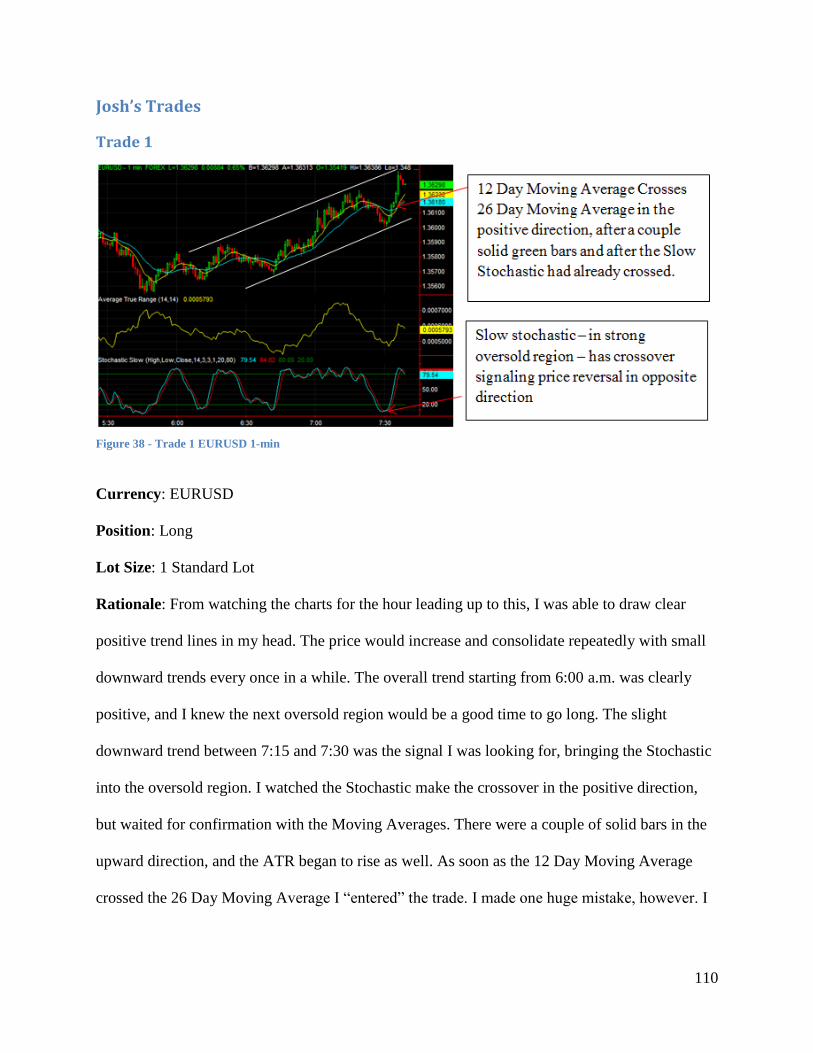
110
Josh’s Trades
Trade 1
Currency: EURUSD
Position: Long
Lot Size: 1 Standard Lot
Rationale: From watching the charts for the hour leading up to this, I was able to draw clear
positive trend lines in my head. The price would increase and consolidate repeatedly with small
downward trends every once in a while. The overall trend starting from 6:00 a.m. was clearly
positive, and I knew the next oversold region would be a good time to go long. The slight
downward trend between 7:15 and 7:30 was the signal I was looking for, bringing the Stochastic
into the oversold region. I watched the Stochastic make the crossover in the positive direction,
but waited for confirmation with the Moving Averages. There were a couple of solid bars in the
upward direction, and the ATR began to rise as well. As soon as the 12 Day Moving Average
crossed the 26 Day Moving Average I “entered” the trade. I made one huge mistake, however. I
Figure 38 - Trade 1 EURUSD 1-min
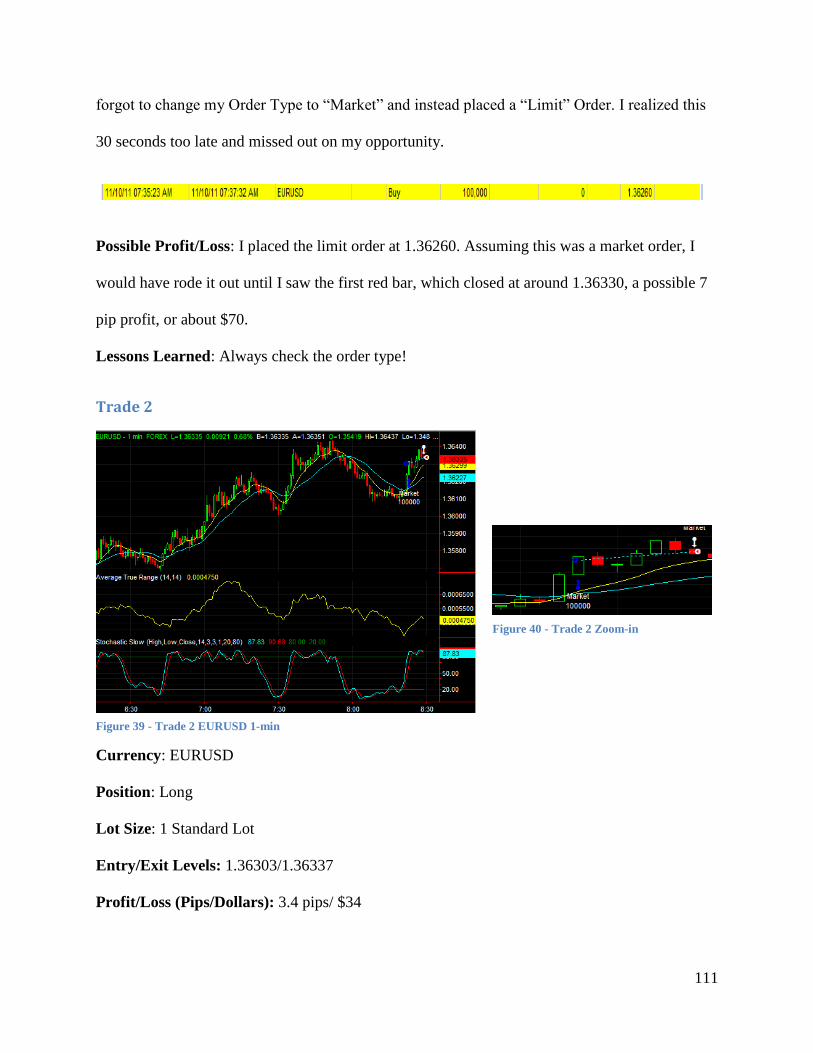
111
forgot to change my Order Type to “Market” and instead placed a “Limit” Order. I realized this
30 seconds too late and missed out on my opportunity.
Possible Profit/Loss: I placed the limit order at 1.36260. Assuming this was a market order, I
would have rode it out until I saw the first red bar, which closed at around 1.36330, a possible 7
pip profit, or about $70.
Lessons Learned: Always check the order type!
Trade 2
Currency: EURUSD
Position: Long
Lot Size: 1 Standard Lot
Entry/Exit Levels: 1.36303/1.36337
Profit/Loss (Pips/Dollars): 3.4 pips/ $34
Figure 39 - Trade 2 EURUSD 1-min
Figure 40 - Trade 2 Zoom-in
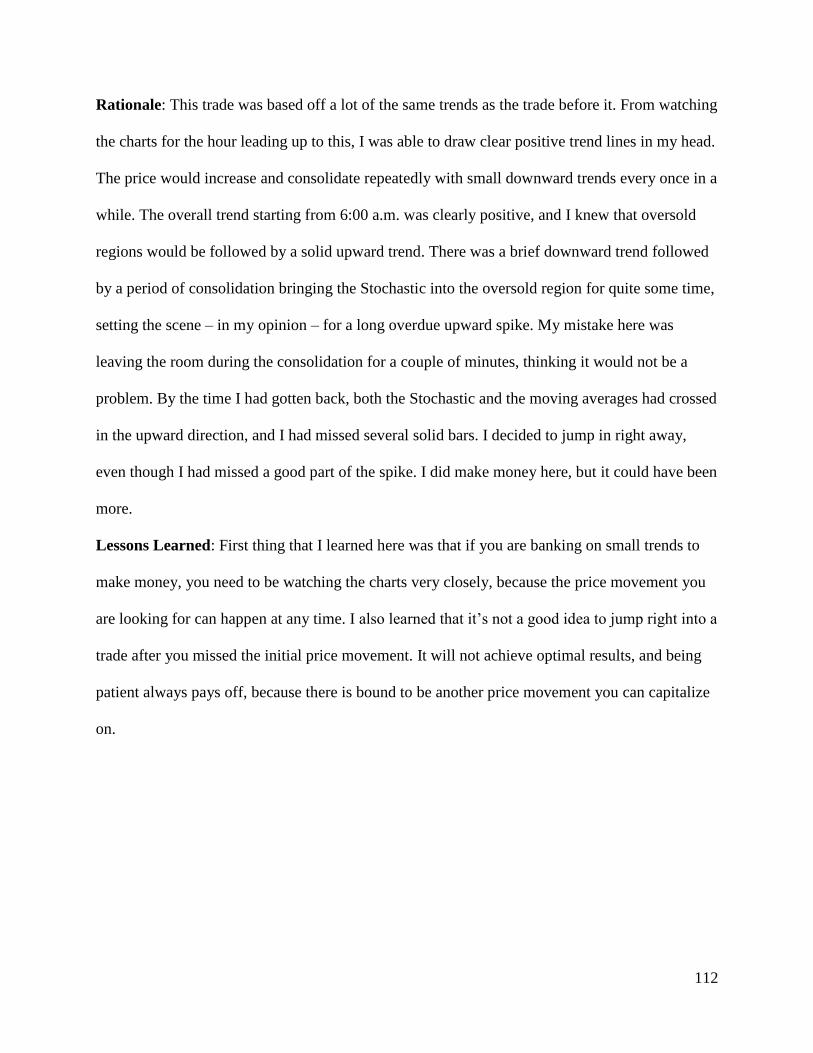
112
Rationale: This trade was based off a lot of the same trends as the trade before it. From watching
the charts for the hour leading up to this, I was able to draw clear positive trend lines in my head.
The price would increase and consolidate repeatedly with small downward trends every once in a
while. The overall trend starting from 6:00 a.m. was clearly positive, and I knew that oversold
regions would be followed by a solid upward trend. There was a brief downward trend followed
by a period of consolidation bringing the Stochastic into the oversold region for quite some time,
setting the scene – in my opinion – for a long overdue upward spike. My mistake here was
leaving the room during the consolidation for a couple of minutes, thinking it would not be a
problem. By the time I had gotten back, both the Stochastic and the moving averages had crossed
in the upward direction, and I had missed several solid bars. I decided to jump in right away,
even though I had missed a good part of the spike. I did make money here, but it could have been
more.
Lessons Learned: First thing that I learned here was that if you are banking on small trends to
make money, you need to be watching the charts very closely, because the price movement you
are looking for can happen at any time. I also learned that it’s not a good idea to jump right into a
trade after you missed the initial price movement. It will not achieve optimal results, and being
patient always pays off, because there is bound to be another price movement you can capitalize
on.
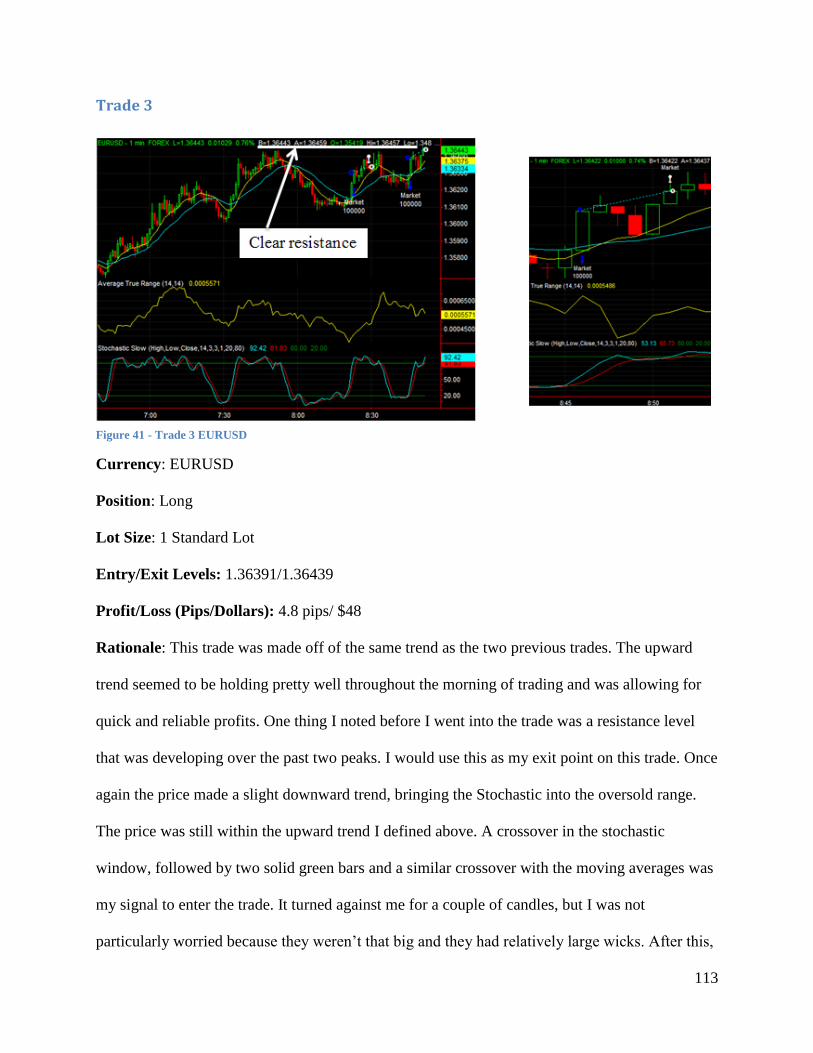
113
Trade 3
Currency: EURUSD
Position: Long
Lot Size: 1 Standard Lot
Entry/Exit Levels: 1.36391/1.36439
Profit/Loss (Pips/Dollars): 4.8 pips/ $48
Rationale: This trade was made off of the same trend as the two previous trades. The upward
trend seemed to be holding pretty well throughout the morning of trading and was allowing for
quick and reliable profits. One thing I noted before I went into the trade was a resistance level
that was developing over the past two peaks. I would use this as my exit point on this trade. Once
again the price made a slight downward trend, bringing the Stochastic into the oversold range.
The price was still within the upward trend I defined above. A crossover in the stochastic
window, followed by two solid green bars and a similar crossover with the moving averages was
my signal to enter the trade. It turned against me for a couple of candles, but I was not
particularly worried because they weren’t that big and they had relatively large wicks. After this,
Clear resistance
Figure 41 - Trade 3 EURUSD
114
the price continued in the upward direction until it reached a level that was very close to the
resistance level I had made note of, which was my signal to exit the trade (upper right hand
corner of the left picture).
Lessons Learned: Support and resistance levels are very important in deciding entry and exit
levels.
Trades 4 & 5
Currency: EURUSD
Position: 4) Long 5) Short
Lot Size: 1 Standard Lot
Entry/Exit Levels: 4)1.36393/1.36182 5) 1.36131/1.35809
Profit/Loss (Pips/Dollars): 4) -21.1 pips/ -$221 5) 32.2 pips/ $322
Clear resistance Figure 42 - Trades 4&5 EURUSDD 1-min
115
Rationale: I got a little overconfident on my fourth trade I made, with the consistency of the
results I was achieving on the upward trend. I saw another downward trend, bringing the
stochastic into the oversold range. Once again, there was a crossover signaling a price reversal,
and I decided to jump the gun on this one, testing the reliability of the stochastic indicator by
itself (big mistake). I saw that the moving averages were about to cross as well so I entered the
trade a little early. They never crossed and I got sucked into a fake out. One thing that really
killed me was the opening of the U.S. market, which completely reversed the upward trend of
EURUSD. I rode it out for a little while, thinking it would correct itself, and decided to cut my
losses when it dipped below 20 pips. My next trade was a short position on EURUSD, because
the reversal in the trend was very clear after the open of early session here the U.S., and I knew
that there had to be something going on that was causing this. I opened this position almost
immediately after I closed the previous one, right at the beginning of the regular session in the
U.S. The price dipped in my favor, and I rode this trend for 20-30 minutes. There were a few
green bars along the way, but they were not large or convincing enough for me to exit my
position. I closed my position when I saw two reasonably large green candles in a row.
Lessons Learned: From these trades I learned to be aware of the effect that the beginning of a
session can have on the market. The EURUSD was clearly trending upward in the morning
leading up to 8:00 a.m., but the beginning of the early session caused it to slow down, and the
beginning of the regular session at 9:30 caused a complete reversal. From now on I will probably
not have a trade open when a session is about to begin.
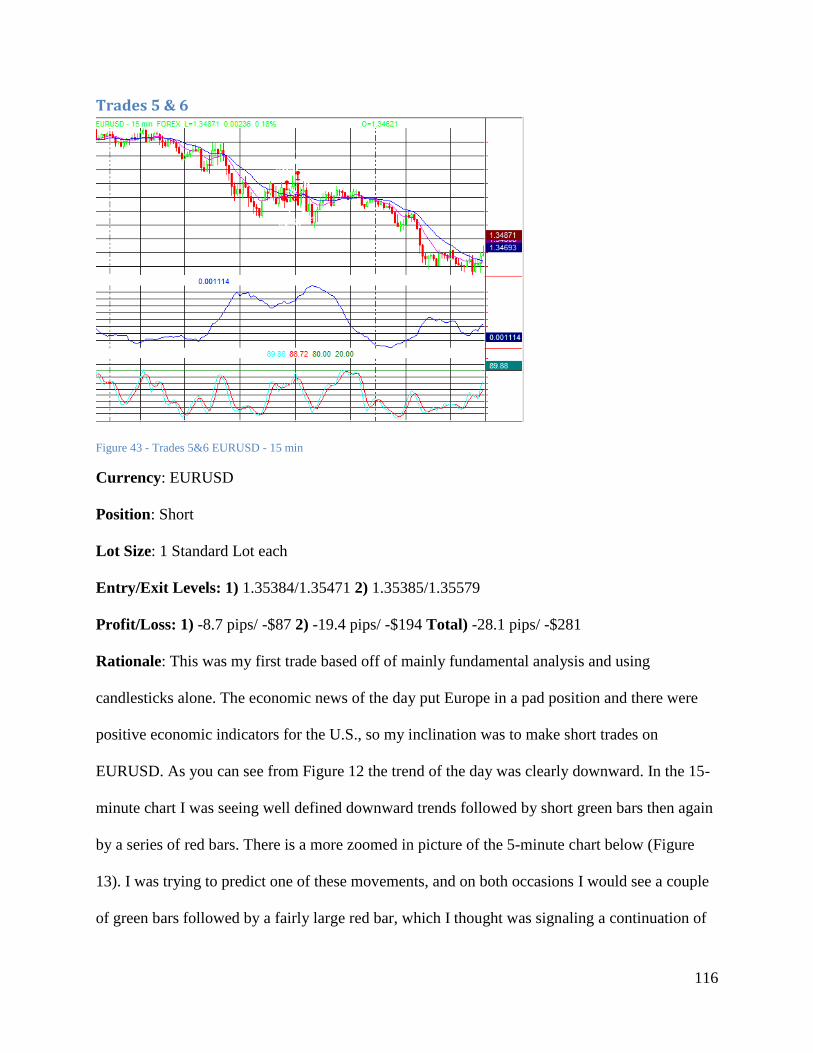
116
Trades 5 & 6
Figure 43 - Trades 5&6 EURUSD - 15 min
Currency: EURUSD
Position: Short
Lot Size: 1 Standard Lot each
Entry/Exit Levels: 1) 1.35384/1.35471 2) 1.35385/1.35579
Profit/Loss: 1) -8.7 pips/ -$87 2) -19.4 pips/ -$194 Total) -28.1 pips/ -$281
Rationale: This was my first trade based off of mainly fundamental analysis and using
candlesticks alone. The economic news of the day put Europe in a pad position and there were
positive economic indicators for the U.S., so my inclination was to make short trades on
EURUSD. As you can see from Figure 12 the trend of the day was clearly downward. In the 15-
minute chart I was seeing well defined downward trends followed by short green bars then again
by a series of red bars. There is a more zoomed in picture of the 5-minute chart below (Figure
13). I was trying to predict one of these movements, and on both occasions I would see a couple
of green bars followed by a fairly large red bar, which I thought was signaling a continuation of
Clear resistance
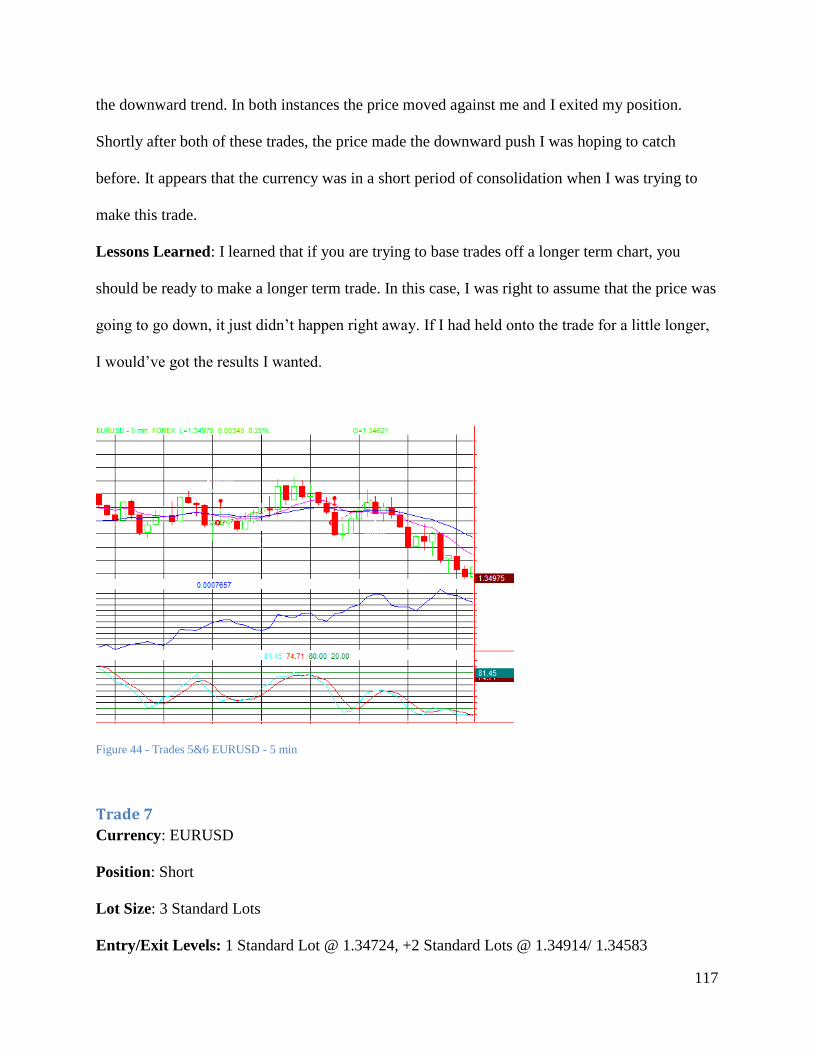
117
the downward trend. In both instances the price moved against me and I exited my position.
Shortly after both of these trades, the price made the downward push I was hoping to catch
before. It appears that the currency was in a short period of consolidation when I was trying to
make this trade.
Lessons Learned: I learned that if you are trying to base trades off a longer term chart, you
should be ready to make a longer term trade. In this case, I was right to assume that the price was
going to go down, it just didn’t happen right away. If I had held onto the trade for a little longer,
I would’ve got the results I wanted.
Figure 44 - Trades 5&6 EURUSD - 5 min
Trade 7
Currency: EURUSD
Position: Short
Lot Size: 3 Standard Lots
Entry/Exit Levels: 1 Standard Lot @ 1.34724, +2 Standard Lots @ 1.34914/ 1.34583
Clear resistance
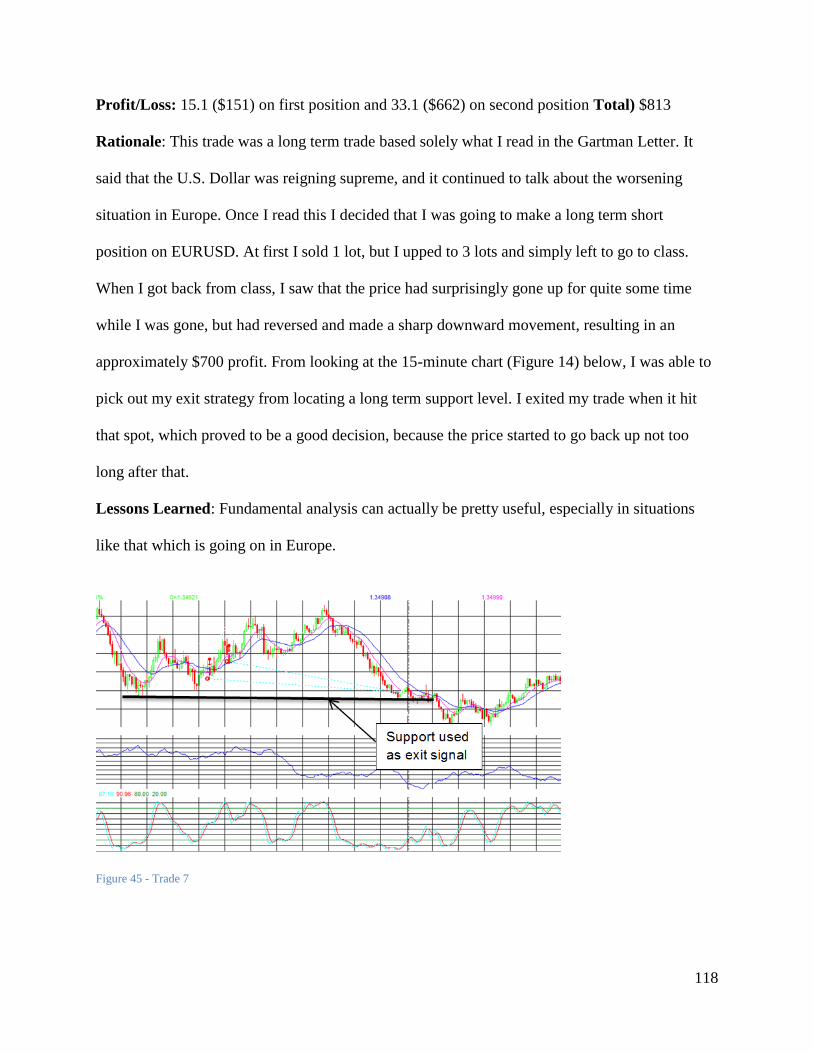
118
Profit/Loss: 15.1 ($151) on first position and 33.1 ($662) on second position Total) $813
Rationale: This trade was a long term trade based solely what I read in the Gartman Letter. It
said that the U.S. Dollar was reigning supreme, and it continued to talk about the worsening
situation in Europe. Once I read this I decided that I was going to make a long term short
position on EURUSD. At first I sold 1 lot, but I upped to 3 lots and simply left to go to class.
When I got back from class, I saw that the price had surprisingly gone up for quite some time
while I was gone, but had reversed and made a sharp downward movement, resulting in an
approximately $700 profit. From looking at the 15-minute chart (Figure 14) below, I was able to
pick out my exit strategy from locating a long term support level. I exited my trade when it hit
that spot, which proved to be a good decision, because the price started to go back up not too
long after that.
Lessons Learned: Fundamental analysis can actually be pretty useful, especially in situations
like that which is going on in Europe.
Figure 45 - Trade 7
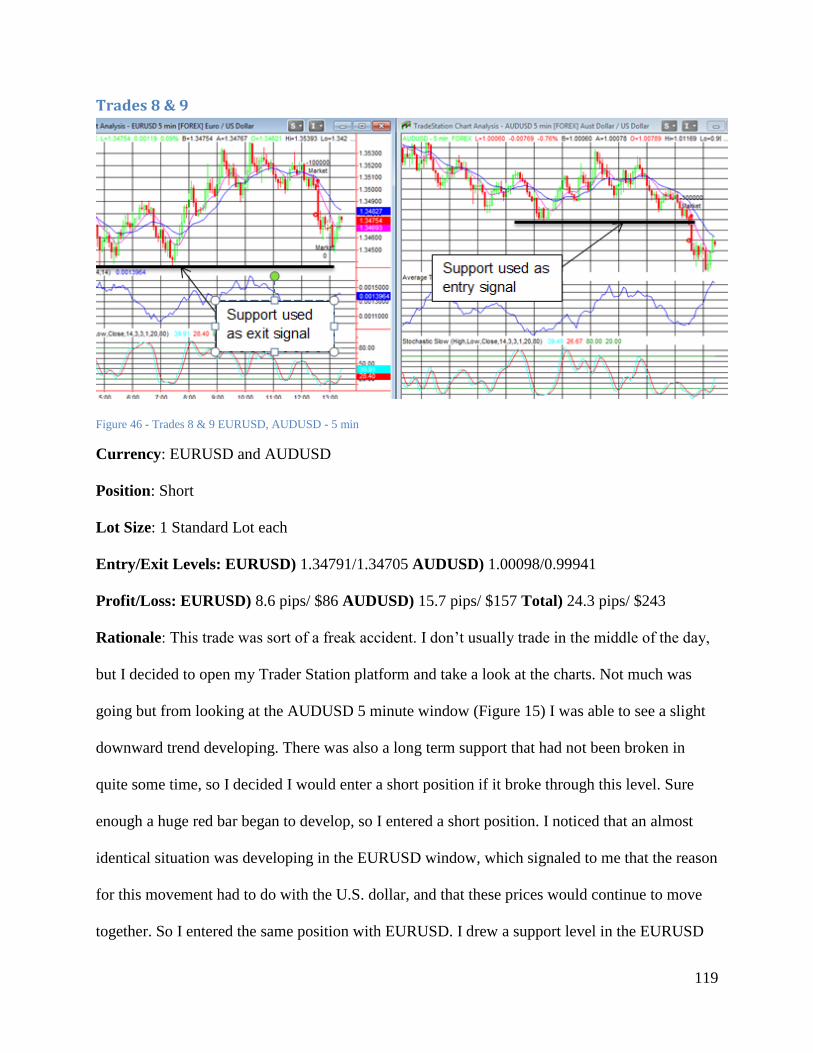
119
Trades 8 & 9
Figure 46 - Trades 8 & 9 EURUSD, AUDUSD - 5 min
Currency: EURUSD and AUDUSD
Position: Short
Lot Size: 1 Standard Lot each
Entry/Exit Levels: EURUSD) 1.34791/1.34705 AUDUSD) 1.00098/0.99941
Profit/Loss: EURUSD) 8.6 pips/ $86 AUDUSD) 15.7 pips/ $157 Total) 24.3 pips/ $243
Rationale: This trade was sort of a freak accident. I don’t usually trade in the middle of the day,
but I decided to open my Trader Station platform and take a look at the charts. Not much was
going but from looking at the AUDUSD 5 minute window (Figure 15) I was able to see a slight
downward trend developing. There was also a long term support that had not been broken in
quite some time, so I decided I would enter a short position if it broke through this level. Sure
enough a huge red bar began to develop, so I entered a short position. I noticed that an almost
identical situation was developing in the EURUSD window, which signaled to me that the reason
for this movement had to do with the U.S. dollar, and that these prices would continue to move
together. So I entered the same position with EURUSD. I drew a support level in the EURUSD
120
window that would be my exit position. Before the price even got to this point I saw some bars
with large wicks developing, which signaled to me that there was resistance at that level, so I
decided to exit the trade a little earlier. This wasn’t a bad decision. Although the price did end up
going down to a level very close to the line I had drawn, it made an upward reversal soon after.
Lessons Learned: I learned that if you are trying to base trades off a longer term chart, you
should be ready to make a longer term trade. In this case, I was right to assume that the price was
going to go down, it just didn’t happen right away. If I had held onto the trade for a little longer,
I would’ve got the results I wanted.
Trade 10
Figure 47 - Trade 10
Currency: EURUSD
Position: Short
Lot Size: 1 Standard Lot
121
Entry/Exit Levels: 1.34430/1.34303
Profit/Loss: 12.7 pips / $127
Rationale: This trade was made around the beginning of the London session. Leading up to the
trade the price was lingering in a well-defined region, but the ATR window was signaling that
the market was beginning to trend strongly. Just before the trade the stochastic window was in
the overbought region. It made a bearish crossover, which was followed by several red bars of
relatively no significance in my opinion; they weren’t very large. A large red bar began to
develop (and rapidly) just as the moving averages made the bearish crossover that I look for
before entering a trade. This was a clear signal for me to enter the trade. I rode out this bar and
several bars after it until a rather large green bar signaled the end of the trend. This all happened
within 7 minutes.
Lessons Learned: London session is a great time to trade.
Trade 11
Figure 48 - Trade 11
Currency: EURUSD
122
Position: Short
Lot Size: 1 Standard Lot
Entry/Exit Levels: 1.34837/1.34895
Profit/Loss: 5.5 pips / $55
Rationale: This trade was made somewhere around the middle of the London session. From the
1 and minute charts I was able to identify a clear upward trend. Although the trend was gradual,
it was also very reliable and showed no signs of reversing. I decided to enter the trade after I saw
a large green bar. I rode the trade out through the slight down slopes, because the larger time
intervals showed that this was normal for this trend, and the price was still making markedly
higher highs. I exited the trade when I noticed that the downward trends were no longer followed
by higher highs, but rather a steady oscillation of high and low values within the same support
and resistance region.
Lessons Learned: Overall trends are good to trade off of. As long as the market is making
consistently higher highs and consistently higher lows, it is fine to ride out the red bars and bank
on the upward trend (vice versa).
123
Trade 12
Figure 49 - Trade 12
Currency: EURUSD
Position: Short
Lot Size: 2 Standard Lot
Entry/Exit Levels: ??? (TradeStation has no record of it)
Profit/Loss: Should have been 5.1 pips / $102 (See below)
Rationale: I based this trade off the clear downward trend developing in the window. I waited
for a convincing red bar that would cause a further separation on the moving averages and
entered the trade. This trade did something really screwy, however. I closed it out right at the
beginning of the green bar you see above, with a profit of $102. The platform then did something
weird, and the profit changed to $101.80 for a second, then in the end I ended up making $28.94
(I’ve never seen a profit or loss go into cents). It also marked my exit level higher than the
current bar, which also isn’t possible.
Lessons Learned: TradeStation can do some crazy things
I exited the trade right here when
the bar opened. The bar had not
moved and had no wicks. The exit
position they had marked me at
was considerably higher than my
position and the current bar itself,
which is not possible.
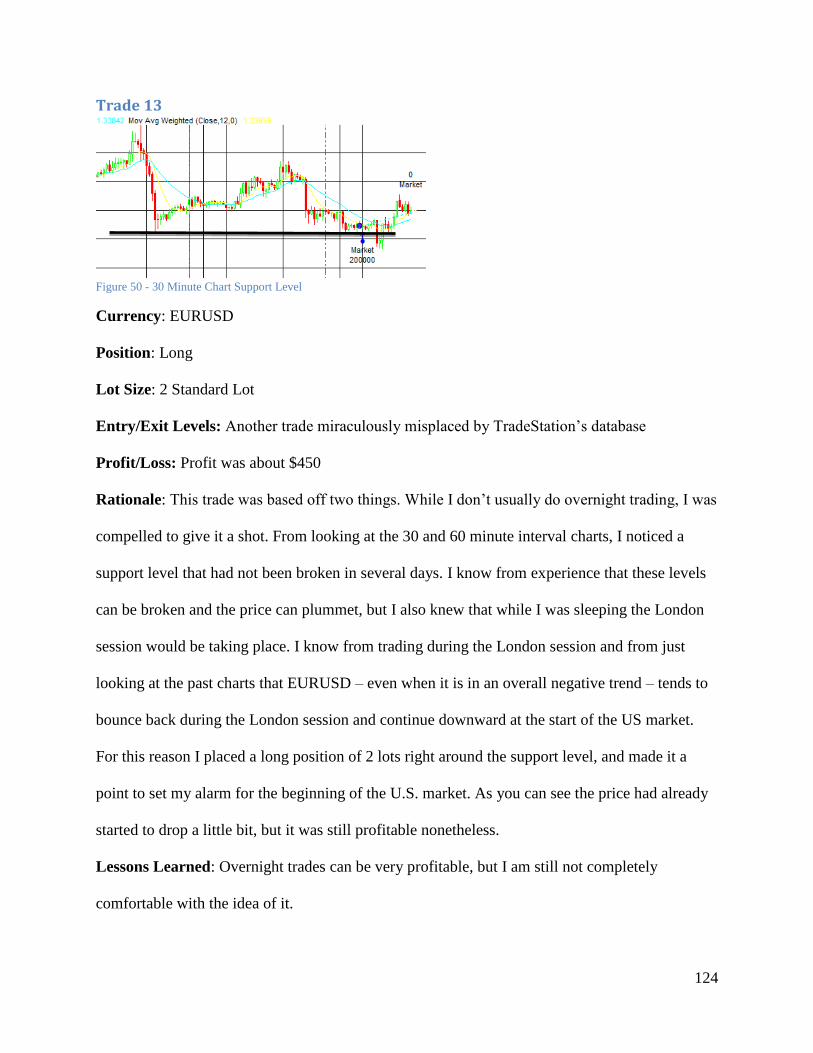
124
Trade 13
Figure 50 - 30 Minute Chart Support Level
Currency: EURUSD
Position: Long
Lot Size: 2 Standard Lot
Entry/Exit Levels: Another trade miraculously misplaced by TradeStation’s database
Profit/Loss: Profit was about $450
Rationale: This trade was based off two things. While I don’t usually do overnight trading, I was
compelled to give it a shot. From looking at the 30 and 60 minute interval charts, I noticed a
support level that had not been broken in several days. I know from experience that these levels
can be broken and the price can plummet, but I also knew that while I was sleeping the London
session would be taking place. I know from trading during the London session and from just
looking at the past charts that EURUSD – even when it is in an overall negative trend – tends to
bounce back during the London session and continue downward at the start of the US market.
For this reason I placed a long position of 2 lots right around the support level, and made it a
point to set my alarm for the beginning of the U.S. market. As you can see the price had already
started to drop a little bit, but it was still profitable nonetheless.
Lessons Learned: Overnight trades can be very profitable, but I am still not completely
comfortable with the idea of it.
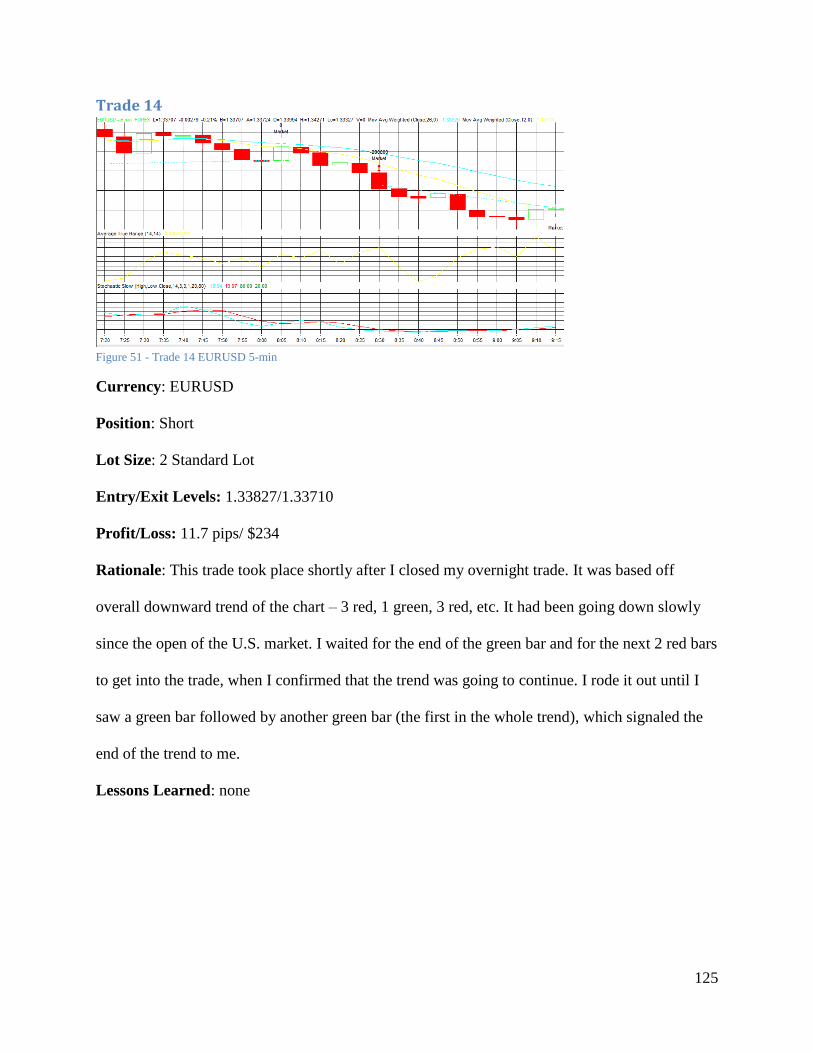
125
Trade 14
Figure 51 - Trade 14 EURUSD 5-min
Currency: EURUSD
Position: Short
Lot Size: 2 Standard Lot
Entry/Exit Levels: 1.33827/1.33710
Profit/Loss: 11.7 pips/ $234
Rationale: This trade took place shortly after I closed my overnight trade. It was based off
overall downward trend of the chart – 3 red, 1 green, 3 red, etc. It had been going down slowly
since the open of the U.S. market. I waited for the end of the green bar and for the next 2 red bars
to get into the trade, when I confirmed that the trend was going to continue. I rode it out until I
saw a green bar followed by another green bar (the first in the whole trend), which signaled the
end of the trend to me.
Lessons Learned: none
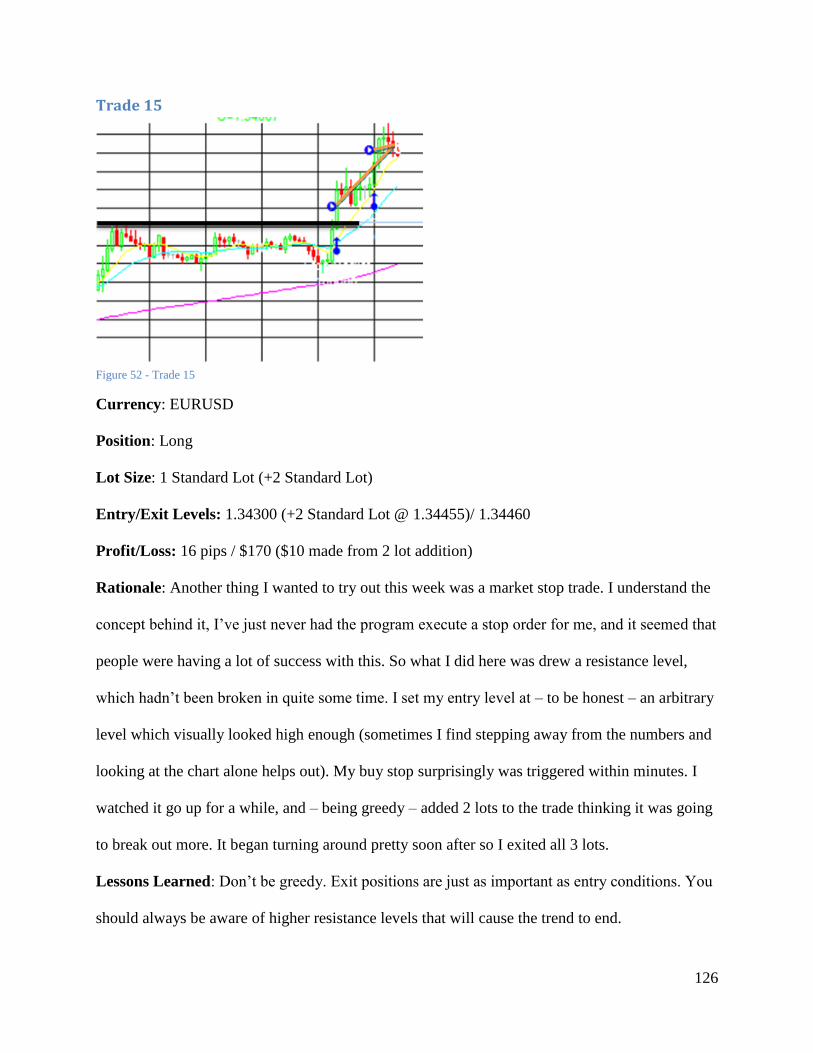
126
Trade 15
Figure 52 - Trade 15
Currency: EURUSD
Position: Long
Lot Size: 1 Standard Lot (+2 Standard Lot)
Entry/Exit Levels: 1.34300 (+2 Standard Lot @ 1.34455)/ 1.34460
Profit/Loss: 16 pips / $170 ($10 made from 2 lot addition)
Rationale: Another thing I wanted to try out this week was a market stop trade. I understand the
concept behind it, I’ve just never had the program execute a stop order for me, and it seemed that
people were having a lot of success with this. So what I did here was drew a resistance level,
which hadn’t been broken in quite some time. I set my entry level at – to be honest – an arbitrary
level which visually looked high enough (sometimes I find stepping away from the numbers and
looking at the chart alone helps out). My buy stop surprisingly was triggered within minutes. I
watched it go up for a while, and – being greedy – added 2 lots to the trade thinking it was going
to break out more. It began turning around pretty soon after so I exited all 3 lots.
Lessons Learned: Don’t be greedy. Exit positions are just as important as entry conditions. You
should always be aware of higher resistance levels that will cause the trend to end.
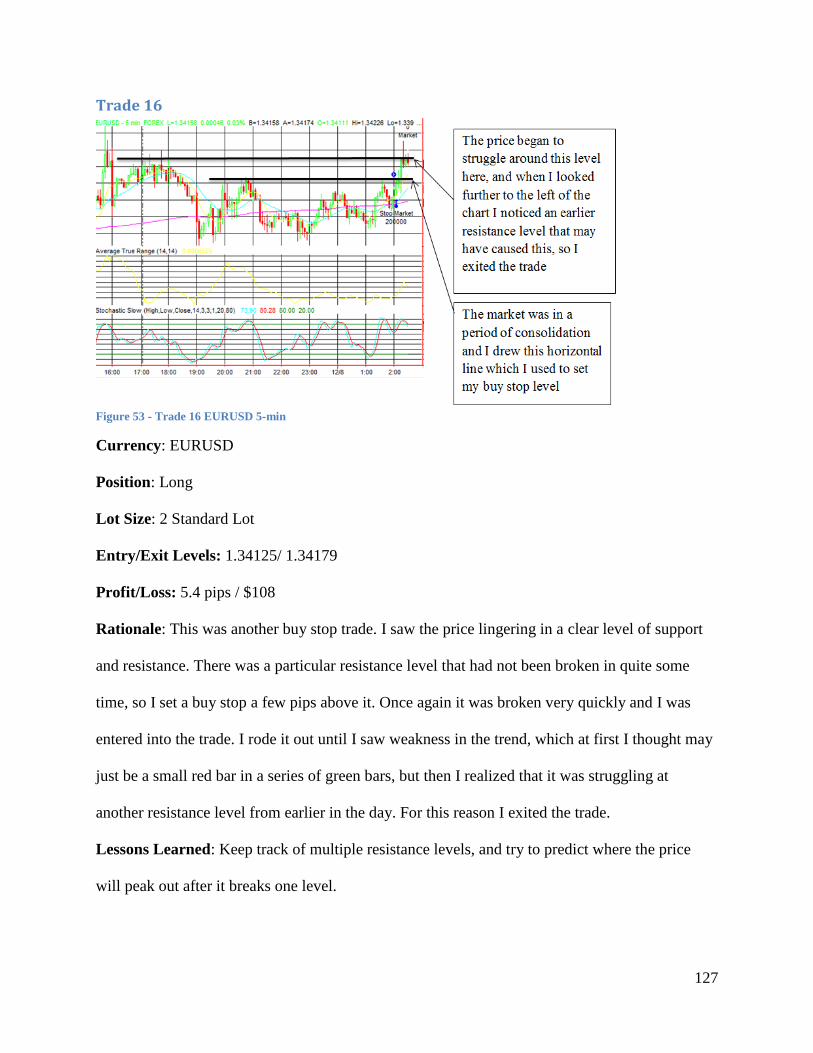
127
Trade 16
Figure 53 - Trade 16 EURUSD 5-min
Currency: EURUSD
Position: Long
Lot Size: 2 Standard Lot
Entry/Exit Levels: 1.34125/ 1.34179
Profit/Loss: 5.4 pips / $108
Rationale: This was another buy stop trade. I saw the price lingering in a clear level of support
and resistance. There was a particular resistance level that had not been broken in quite some
time, so I set a buy stop a few pips above it. Once again it was broken very quickly and I was
entered into the trade. I rode it out until I saw weakness in the trend, which at first I thought may
just be a small red bar in a series of green bars, but then I realized that it was struggling at
another resistance level from earlier in the day. For this reason I exited the trade.
Lessons Learned: Keep track of multiple resistance levels, and try to predict where the price
will peak out after it breaks one level.
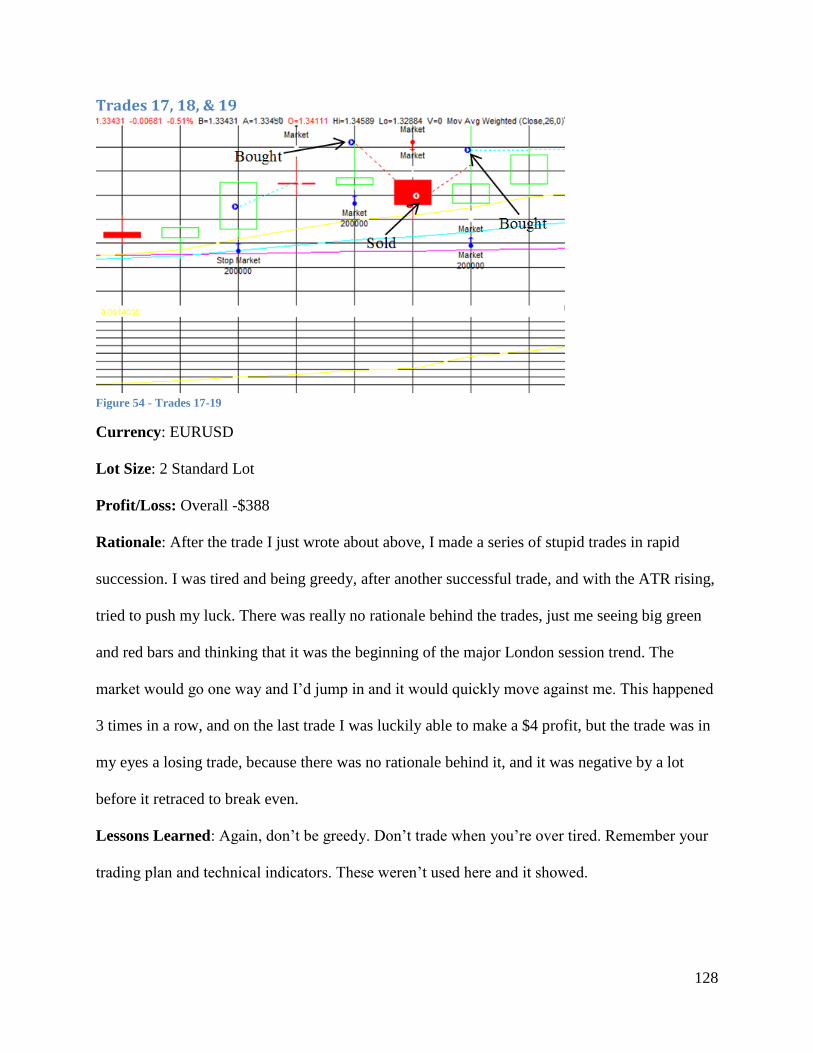
128
Trades 17, 18, & 19
Figure 54 - Trades 17-19
Currency: EURUSD
Lot Size: 2 Standard Lot
Profit/Loss: Overall -$388
Rationale: After the trade I just wrote about above, I made a series of stupid trades in rapid
succession. I was tired and being greedy, after another successful trade, and with the ATR rising,
tried to push my luck. There was really no rationale behind the trades, just me seeing big green
and red bars and thinking that it was the beginning of the major London session trend. The
market would go one way and I’d jump in and it would quickly move against me. This happened
3 times in a row, and on the last trade I was luckily able to make a $4 profit, but the trade was in
my eyes a losing trade, because there was no rationale behind it, and it was negative by a lot
before it retraced to break even.
Lessons Learned: Again, don’t be greedy. Don’t trade when you’re over tired. Remember your
trading plan and technical indicators. These weren’t used here and it showed.
129
I have learned a lot from my time trading this term. I have learned to be patient with my
trades. It will often appear that the price is making a reversal and starting to trend in a particular
direction. Sometimes I will enter a trade too soon, and the price will move against me rather
quickly. It is better to wait to see if the trend will continue, rather than try to get in right away
and ride the whole trend. Wait to see at least two or three solid candle sticks before you enter a
trade. Also, I’ve learned not to be greedy. As opposed to trying to ride a trend to the bitter end, it
is better to get out when you have reached a reasonable profit. I have also learned that a better
way to judge when to get in or out of a trade is to use resistance levels. I have marked these
levels on our graphs and have found that it helps me get in and out of trades at the right time.
I have also learned that using strictly one technical indicator is not always the best idea. I
have found that when I entered a trade based strictly off of signals in the stochastic oscillator or
the MACD, the price would often turn against me. It is better to use multiple indicators at the
same time to ensure that the price change is real. For this reason, I tend to use the Stochastic and
MACD in combination with the ATR. When I see the Stochastic and MACD making crosses at
the same time and the ATR shows that it is a strong trend, it is a clear indication that it is a good
trade to get into. In general, do not trade when the ATR is low, because this means the market is
relatively quiet and more susceptible to unexpected price movements. I have also learned the
importance of keeping fundamental factors in the back of my head when trading. They can often
completely dictate the direction of the market.
Another important thing I have learned is not to try to predict what the graph is going to
do in the future, and react to what it is currently doing. This means I will try to stay away from
watching the graph go in one direction and then get in the opposite position to make money.
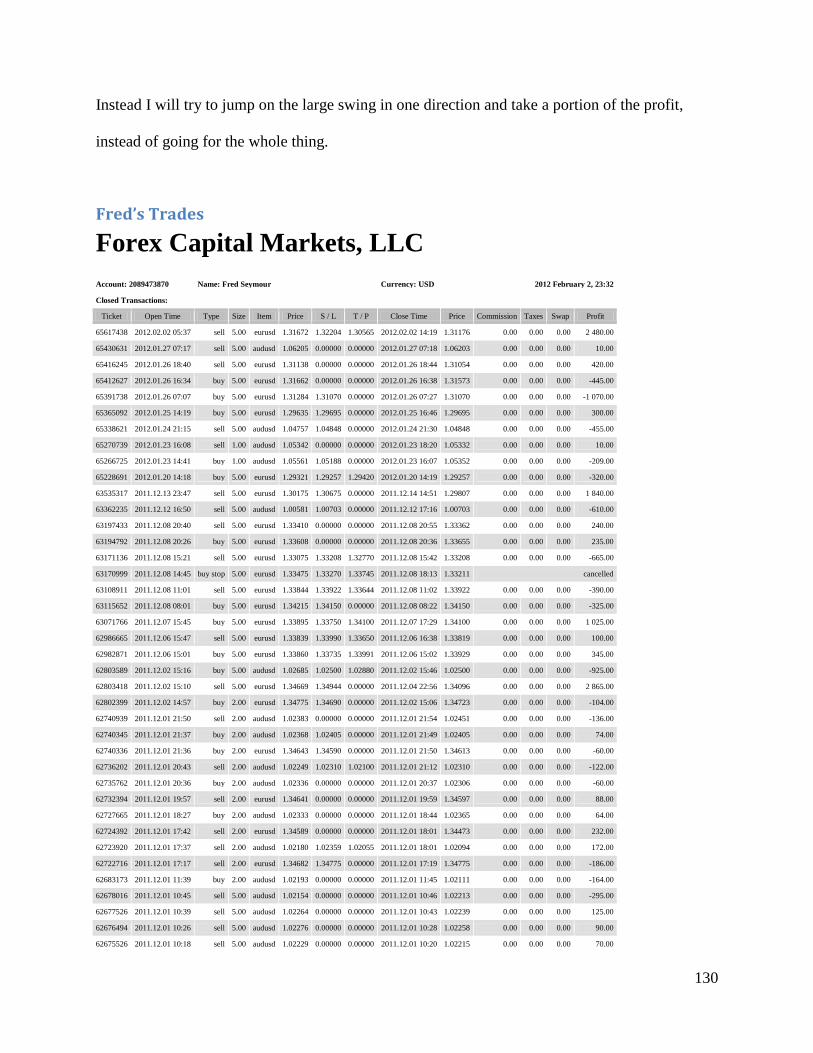
130
Instead I will try to jump on the large swing in one direction and take a portion of the profit,
instead of going for the whole thing.
Fred’s Trades
Forex Capital Markets, LLC Account: 2089473870 Name: Fred Seymour Currency: USD 2012 February 2, 23:32
Closed Transactions:
Ticket Open Time Type Size Item Price S / L T / P Close Time Price Commission Taxes Swap Profit
65617438 2012.02.02 05:37 sell 5.00 eurusd 1.31672 1.32204 1.30565 2012.02.02 14:19 1.31176 0.00 0.00 0.00 2 480.00
65430631 2012.01.27 07:17 sell 5.00 audusd 1.06205 0.00000 0.00000 2012.01.27 07:18 1.06203 0.00 0.00 0.00 10.00
65416245 2012.01.26 18:40 sell 5.00 eurusd 1.31138 0.00000 0.00000 2012.01.26 18:44 1.31054 0.00 0.00 0.00 420.00
65412627 2012.01.26 16:34 buy 5.00 eurusd 1.31662 0.00000 0.00000 2012.01.26 16:38 1.31573 0.00 0.00 0.00 -445.00
65391738 2012.01.26 07:07 buy 5.00 eurusd 1.31284 1.31070 0.00000 2012.01.26 07:27 1.31070 0.00 0.00 0.00 -1 070.00
65365092 2012.01.25 14:19 buy 5.00 eurusd 1.29635 1.29695 0.00000 2012.01.25 16:46 1.29695 0.00 0.00 0.00 300.00
65338621 2012.01.24 21:15 sell 5.00 audusd 1.04757 1.04848 0.00000 2012.01.24 21:30 1.04848 0.00 0.00 0.00 -455.00
65270739 2012.01.23 16:08 sell 1.00 audusd 1.05342 0.00000 0.00000 2012.01.23 18:20 1.05332 0.00 0.00 0.00 10.00
65266725 2012.01.23 14:41 buy 1.00 audusd 1.05561 1.05188 0.00000 2012.01.23 16:07 1.05352 0.00 0.00 0.00 -209.00
65228691 2012.01.20 14:18 buy 5.00 eurusd 1.29321 1.29257 1.29420 2012.01.20 14:19 1.29257 0.00 0.00 0.00 -320.00
63535317 2011.12.13 23:47 sell 5.00 eurusd 1.30175 1.30675 0.00000 2011.12.14 14:51 1.29807 0.00 0.00 0.00 1 840.00
63362235 2011.12.12 16:50 sell 5.00 audusd 1.00581 1.00703 0.00000 2011.12.12 17:16 1.00703 0.00 0.00 0.00 -610.00
63197433 2011.12.08 20:40 sell 5.00 eurusd 1.33410 0.00000 0.00000 2011.12.08 20:55 1.33362 0.00 0.00 0.00 240.00
63194792 2011.12.08 20:26 buy 5.00 eurusd 1.33608 0.00000 0.00000 2011.12.08 20:36 1.33655 0.00 0.00 0.00 235.00
63171136 2011.12.08 15:21 sell 5.00 eurusd 1.33075 1.33208 1.32770 2011.12.08 15:42 1.33208 0.00 0.00 0.00 -665.00
63170999 2011.12.08 14:45 buy stop 5.00 eurusd 1.33475 1.33270 1.33745 2011.12.08 18:13 1.33211 cancelled
63108911 2011.12.08 11:01 sell 5.00 eurusd 1.33844 1.33922 1.33644 2011.12.08 11:02 1.33922 0.00 0.00 0.00 -390.00
63115652 2011.12.08 08:01 buy 5.00 eurusd 1.34215 1.34150 0.00000 2011.12.08 08:22 1.34150 0.00 0.00 0.00 -325.00
63071766 2011.12.07 15:45 buy 5.00 eurusd 1.33895 1.33750 1.34100 2011.12.07 17:29 1.34100 0.00 0.00 0.00 1 025.00
62986665 2011.12.06 15:47 sell 5.00 eurusd 1.33839 1.33990 1.33650 2011.12.06 16:38 1.33819 0.00 0.00 0.00 100.00
62982871 2011.12.06 15:01 buy 5.00 eurusd 1.33860 1.33735 1.33991 2011.12.06 15:02 1.33929 0.00 0.00 0.00 345.00
62803589 2011.12.02 15:16 buy 5.00 audusd 1.02685 1.02500 1.02880 2011.12.02 15:46 1.02500 0.00 0.00 0.00 -925.00
62803418 2011.12.02 15:10 sell 5.00 eurusd 1.34669 1.34944 0.00000 2011.12.04 22:56 1.34096 0.00 0.00 0.00 2 865.00
62802399 2011.12.02 14:57 buy 2.00 eurusd 1.34775 1.34690 0.00000 2011.12.02 15:06 1.34723 0.00 0.00 0.00 -104.00
62740939 2011.12.01 21:50 sell 2.00 audusd 1.02383 0.00000 0.00000 2011.12.01 21:54 1.02451 0.00 0.00 0.00 -136.00
62740345 2011.12.01 21:37 buy 2.00 audusd 1.02368 1.02405 0.00000 2011.12.01 21:49 1.02405 0.00 0.00 0.00 74.00
62740336 2011.12.01 21:36 buy 2.00 eurusd 1.34643 1.34590 0.00000 2011.12.01 21:50 1.34613 0.00 0.00 0.00 -60.00
62736202 2011.12.01 20:43 sell 2.00 audusd 1.02249 1.02310 1.02100 2011.12.01 21:12 1.02310 0.00 0.00 0.00 -122.00
62735762 2011.12.01 20:36 buy 2.00 audusd 1.02336 0.00000 0.00000 2011.12.01 20:37 1.02306 0.00 0.00 0.00 -60.00
62732394 2011.12.01 19:57 sell 2.00 eurusd 1.34641 0.00000 0.00000 2011.12.01 19:59 1.34597 0.00 0.00 0.00 88.00
62727665 2011.12.01 18:27 buy 2.00 audusd 1.02333 0.00000 0.00000 2011.12.01 18:44 1.02365 0.00 0.00 0.00 64.00
62724392 2011.12.01 17:42 sell 2.00 eurusd 1.34589 0.00000 0.00000 2011.12.01 18:01 1.34473 0.00 0.00 0.00 232.00
62723920 2011.12.01 17:37 sell 2.00 audusd 1.02180 1.02359 1.02055 2011.12.01 18:01 1.02094 0.00 0.00 0.00 172.00
62722716 2011.12.01 17:17 sell 2.00 eurusd 1.34682 1.34775 0.00000 2011.12.01 17:19 1.34775 0.00 0.00 0.00 -186.00
62683173 2011.12.01 11:39 buy 2.00 audusd 1.02193 0.00000 0.00000 2011.12.01 11:45 1.02111 0.00 0.00 0.00 -164.00
62678016 2011.12.01 10:45 sell 5.00 audusd 1.02154 0.00000 0.00000 2011.12.01 10:46 1.02213 0.00 0.00 0.00 -295.00
62677526 2011.12.01 10:39 sell 5.00 audusd 1.02264 0.00000 0.00000 2011.12.01 10:43 1.02239 0.00 0.00 0.00 125.00
62676494 2011.12.01 10:26 sell 5.00 audusd 1.02276 0.00000 0.00000 2011.12.01 10:28 1.02258 0.00 0.00 0.00 90.00
62675526 2011.12.01 10:18 sell 5.00 audusd 1.02229 0.00000 0.00000 2011.12.01 10:20 1.02215 0.00 0.00 0.00 70.00
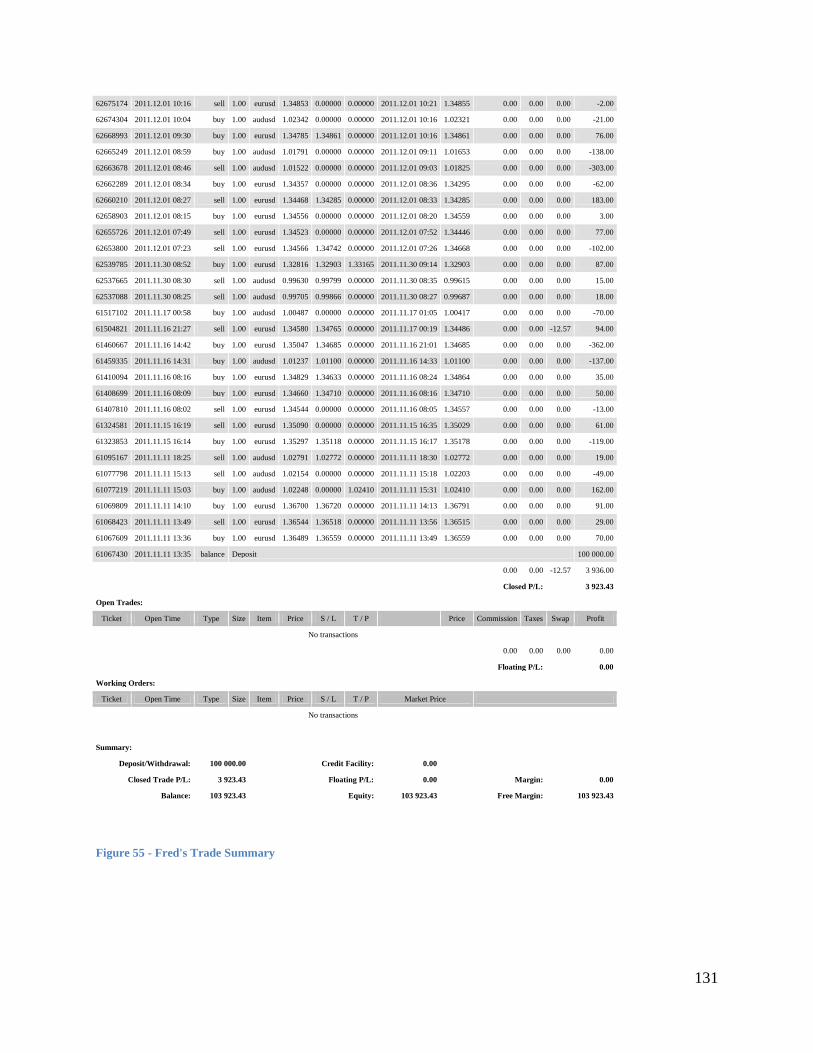
131
62675174 2011.12.01 10:16 sell 1.00 eurusd 1.34853 0.00000 0.00000 2011.12.01 10:21 1.34855 0.00 0.00 0.00 -2.00
62674304 2011.12.01 10:04 buy 1.00 audusd 1.02342 0.00000 0.00000 2011.12.01 10:16 1.02321 0.00 0.00 0.00 -21.00
62668993 2011.12.01 09:30 buy 1.00 eurusd 1.34785 1.34861 0.00000 2011.12.01 10:16 1.34861 0.00 0.00 0.00 76.00
62665249 2011.12.01 08:59 buy 1.00 audusd 1.01791 0.00000 0.00000 2011.12.01 09:11 1.01653 0.00 0.00 0.00 -138.00
62663678 2011.12.01 08:46 sell 1.00 audusd 1.01522 0.00000 0.00000 2011.12.01 09:03 1.01825 0.00 0.00 0.00 -303.00
62662289 2011.12.01 08:34 buy 1.00 eurusd 1.34357 0.00000 0.00000 2011.12.01 08:36 1.34295 0.00 0.00 0.00 -62.00
62660210 2011.12.01 08:27 sell 1.00 eurusd 1.34468 1.34285 0.00000 2011.12.01 08:33 1.34285 0.00 0.00 0.00 183.00
62658903 2011.12.01 08:15 buy 1.00 eurusd 1.34556 0.00000 0.00000 2011.12.01 08:20 1.34559 0.00 0.00 0.00 3.00
62655726 2011.12.01 07:49 sell 1.00 eurusd 1.34523 0.00000 0.00000 2011.12.01 07:52 1.34446 0.00 0.00 0.00 77.00
62653800 2011.12.01 07:23 sell 1.00 eurusd 1.34566 1.34742 0.00000 2011.12.01 07:26 1.34668 0.00 0.00 0.00 -102.00
62539785 2011.11.30 08:52 buy 1.00 eurusd 1.32816 1.32903 1.33165 2011.11.30 09:14 1.32903 0.00 0.00 0.00 87.00
62537665 2011.11.30 08:30 sell 1.00 audusd 0.99630 0.99799 0.00000 2011.11.30 08:35 0.99615 0.00 0.00 0.00 15.00
62537088 2011.11.30 08:25 sell 1.00 audusd 0.99705 0.99866 0.00000 2011.11.30 08:27 0.99687 0.00 0.00 0.00 18.00
61517102 2011.11.17 00:58 buy 1.00 audusd 1.00487 0.00000 0.00000 2011.11.17 01:05 1.00417 0.00 0.00 0.00 -70.00
61504821 2011.11.16 21:27 sell 1.00 eurusd 1.34580 1.34765 0.00000 2011.11.17 00:19 1.34486 0.00 0.00 -12.57 94.00
61460667 2011.11.16 14:42 buy 1.00 eurusd 1.35047 1.34685 0.00000 2011.11.16 21:01 1.34685 0.00 0.00 0.00 -362.00
61459335 2011.11.16 14:31 buy 1.00 audusd 1.01237 1.01100 0.00000 2011.11.16 14:33 1.01100 0.00 0.00 0.00 -137.00
61410094 2011.11.16 08:16 buy 1.00 eurusd 1.34829 1.34633 0.00000 2011.11.16 08:24 1.34864 0.00 0.00 0.00 35.00
61408699 2011.11.16 08:09 buy 1.00 eurusd 1.34660 1.34710 0.00000 2011.11.16 08:16 1.34710 0.00 0.00 0.00 50.00
61407810 2011.11.16 08:02 sell 1.00 eurusd 1.34544 0.00000 0.00000 2011.11.16 08:05 1.34557 0.00 0.00 0.00 -13.00
61324581 2011.11.15 16:19 sell 1.00 eurusd 1.35090 0.00000 0.00000 2011.11.15 16:35 1.35029 0.00 0.00 0.00 61.00
61323853 2011.11.15 16:14 buy 1.00 eurusd 1.35297 1.35118 0.00000 2011.11.15 16:17 1.35178 0.00 0.00 0.00 -119.00
61095167 2011.11.11 18:25 sell 1.00 audusd 1.02791 1.02772 0.00000 2011.11.11 18:30 1.02772 0.00 0.00 0.00 19.00
61077798 2011.11.11 15:13 sell 1.00 audusd 1.02154 0.00000 0.00000 2011.11.11 15:18 1.02203 0.00 0.00 0.00 -49.00
61077219 2011.11.11 15:03 buy 1.00 audusd 1.02248 0.00000 1.02410 2011.11.11 15:31 1.02410 0.00 0.00 0.00 162.00
61069809 2011.11.11 14:10 buy 1.00 eurusd 1.36700 1.36720 0.00000 2011.11.11 14:13 1.36791 0.00 0.00 0.00 91.00
61068423 2011.11.11 13:49 sell 1.00 eurusd 1.36544 1.36518 0.00000 2011.11.11 13:56 1.36515 0.00 0.00 0.00 29.00
61067609 2011.11.11 13:36 buy 1.00 eurusd 1.36489 1.36559 0.00000 2011.11.11 13:49 1.36559 0.00 0.00 0.00 70.00
61067430 2011.11.11 13:35 balance Deposit 100 000.00
0.00 0.00 -12.57 3 936.00
Closed P/L: 3 923.43
Open Trades:
Ticket Open Time Type Size Item Price S / L T / P Price Commission Taxes Swap Profit
No transactions
0.00 0.00 0.00 0.00
Floating P/L: 0.00
Working Orders:
Ticket Open Time Type Size Item Price S / L T / P Market Price
No transactions
Summary:
Deposit/Withdrawal: 100 000.00 Credit Facility: 0.00
Closed Trade P/L: 3 923.43 Floating P/L: 0.00 Margin: 0.00
Balance: 103 923.43 Equity: 103 923.43 Free Margin: 103 923.43
Figure 55 - Fred's Trade Summary
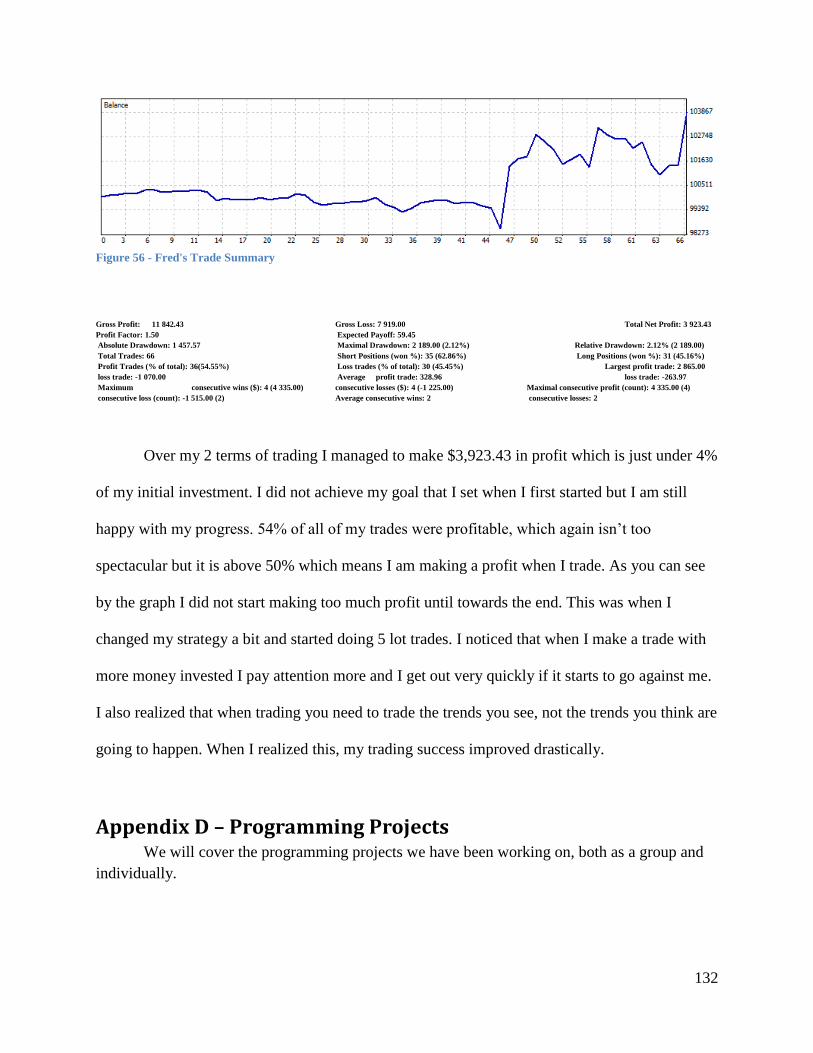
132
Figure 56 - Fred's Trade Summary
Gross Profit: 11 842.43 Gross Loss: 7 919.00 Total Net Profit: 3 923.43
Profit Factor: 1.50 Expected Payoff: 59.45
Absolute Drawdown: 1 457.57 Maximal Drawdown: 2 189.00 (2.12%) Relative Drawdown: 2.12% (2 189.00)
Total Trades: 66 Short Positions (won %): 35 (62.86%) Long Positions (won %): 31 (45.16%)
Profit Trades (% of total): 36(54.55%) Loss trades (% of total): 30 (45.45%) Largest profit trade: 2 865.00
loss trade: -1 070.00 Average profit trade: 328.96 loss trade: -263.97
Maximum consecutive wins ($): 4 (4 335.00) consecutive losses ($): 4 (-1 225.00) Maximal consecutive profit (count): 4 335.00 (4)
consecutive loss (count): -1 515.00 (2) Average consecutive wins: 2 consecutive losses: 2
Over my 2 terms of trading I managed to make $3,923.43 in profit which is just under 4%
of my initial investment. I did not achieve my goal that I set when I first started but I am still
happy with my progress. 54% of all of my trades were profitable, which again isn’t too
spectacular but it is above 50% which means I am making a profit when I trade. As you can see
by the graph I did not start making too much profit until towards the end. This was when I
changed my strategy a bit and started doing 5 lot trades. I noticed that when I make a trade with
more money invested I pay attention more and I get out very quickly if it starts to go against me.
I also realized that when trading you need to trade the trends you see, not the trends you think are
going to happen. When I realized this, my trading success improved drastically.
Appendix D – Programming Projects We will cover the programming projects we have been working on, both as a group and
individually.
133
Group Project We had initially planned to do a currency meter as our team programming project, but
after much thought we have decided to change our idea. We saw that a lot of other teams were
already doing a currency meter, and although our ideas were all different in some way or
another, we decided to deviate from the path. The parameters of our next idea are a lot simpler
and the program will be very useful.
Our program will make trades based of exponential moving averages crosses and certain
volatility conditions. The way it works is if the 5 day EMA crosses the 13 day EMA then the
program will know that the currency is currently in a bull of bear condition, depending on the
direction of the cross. Both the 5 minute and 15 minute graphs are monitored by the program so
it can make trades based off of both conditions. There are also other trade conditions that need to
be present for the program to make a trade. The first is no trade will be made if the ask price of
the currency is higher than the current high of the currency. The program uses the force index to
identify the strength of the currency at the time a trade is going to be made. It monitors the
previous 3 bars and if the force is greater than .05 than the condition is met. If all of these
conditions are met and the ask price minus the bid price is less than 4 pips, a trade will be made.
The stop loss is also set for the trade based on the average price of the currency for the past 12
hours. There is also a trailing stop loss implemented with the program.
After testing the program it does not work to well and always results in a loss of money.
We cannot figure out why it does not work and have changed parameter numerous times and no
matter what happens it is always a loss. This could be a result of just the tested market conditions
not working, because the time frame is this past August and September. The results for the 5 and
15 minute graph tests can be seen below.
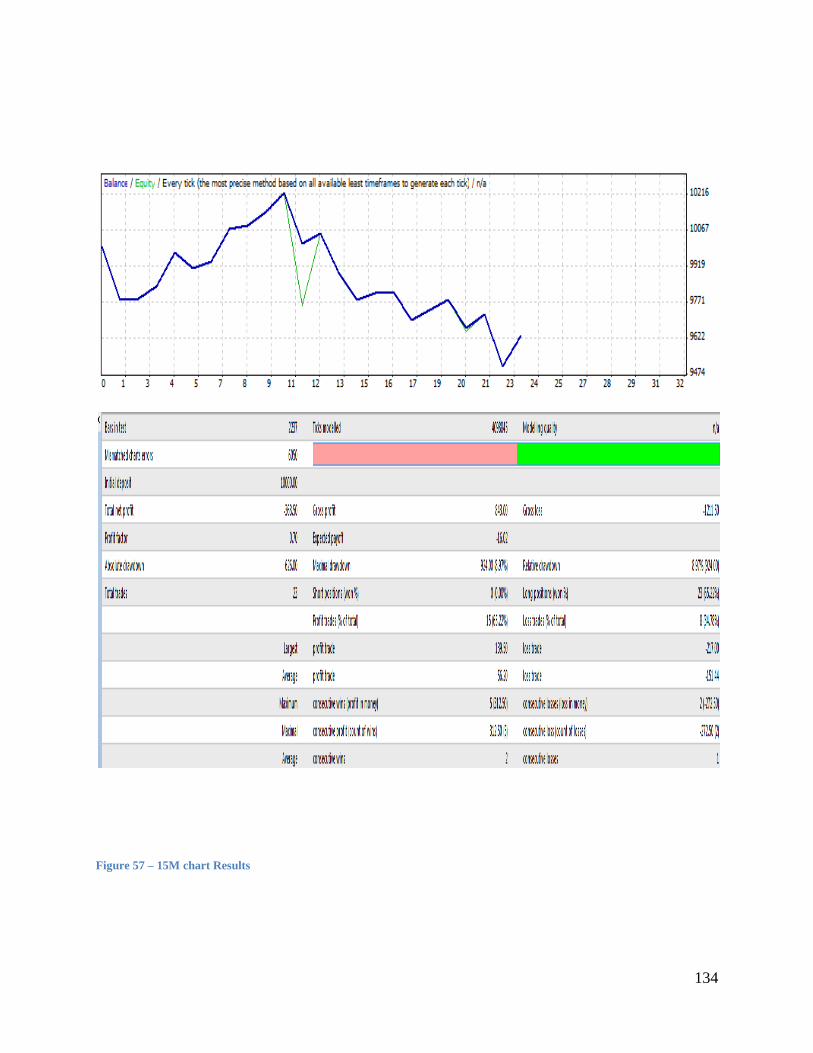
134
Figure 57 – 15M chart Results
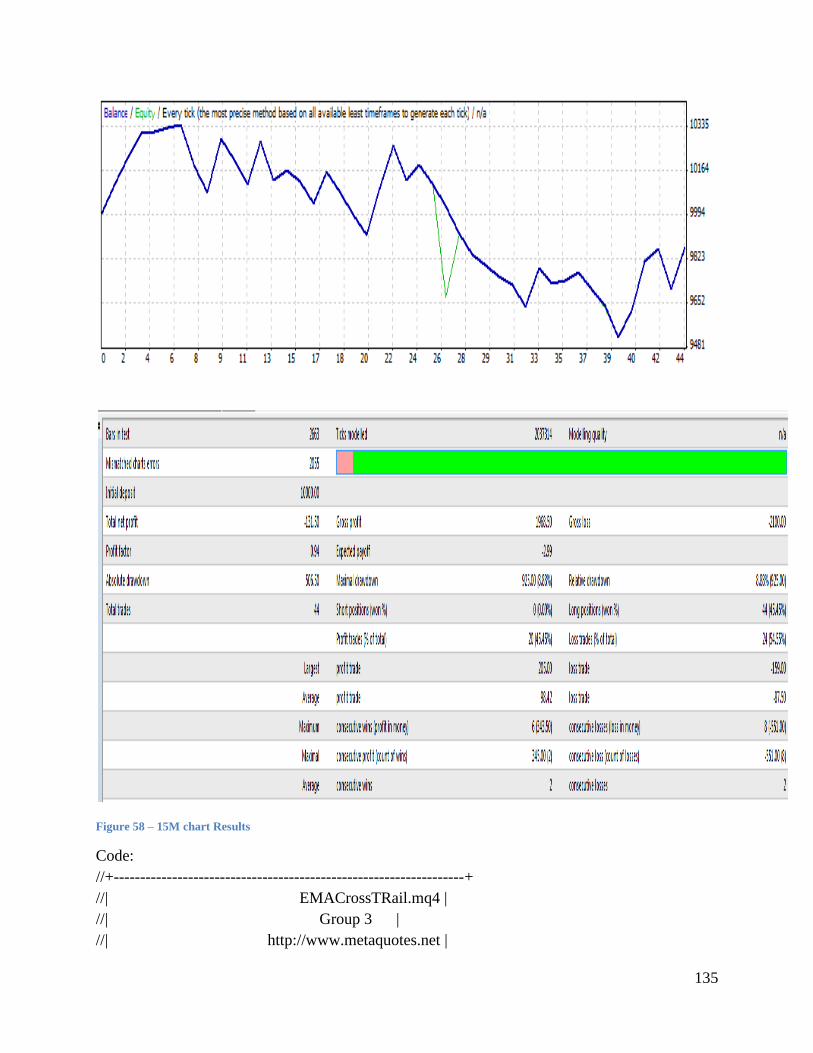
135
Figure 58 – 15M chart Results
Code:
//+------------------------------------------------------------------+
//| EMACrossTRail.mq4 |
//| Group 3 |
//| http://www.metaquotes.net |
136
//+------------------------------------------------------------------+
#property copyright "Group 3"
#property link "http://www.metaquotes.net"
//--- input parameters
extern double TakeProfit=1500.0;
extern int AllowedTrades=1;
extern double TrailingStop=150.0;
extern double SLfactor=1.5;
//+------------------------------------------------------------------+
//| expert initialization function |
//+------------------------------------------------------------------+
int init()
{
//----
//----
return(0);
}
//+------------------------------------------------------------------+
//| expert deinitialization function |
//+------------------------------------------------------------------+
int deinit()
{
//----
//----
return(0);
}
//+------------------------------------------------------------------+
//| expert start function |
//+------------------------------------------------------------------+
int start()
{
//----
bool bull5=FALSE;
bool bull15=FALSE;
bool TradeAllow=True;
bool Force=FALSE;
137
double vol=0.5;
double Stoploss;
int ticket;
double currenthigh=High[1];
double currentlow=Low[1];
double averages[12];
double currentaverage=0;
double ema5_5 = iMA(Symbol(),5,4,0,MODE_EMA,PRICE_CLOSE,0);
double ema5_15 = iMA(Symbol(),15,5,0,MODE_EMA,PRICE_CLOSE,0);
double ema13_5 = iMA(Symbol(),5,10,0,MODE_EMA,PRICE_CLOSE,0);
double ema13_15 = iMA(Symbol(),15,13,0,MODE_EMA,PRICE_CLOSE,0);
double sma5_501 = iMA(Symbol(),5,50,0,MODE_SMA,PRICE_CLOSE,0);
double sma5_502 = iMA(Symbol(),5,50,0,MODE_SMA,PRICE_CLOSE,2);
double sma5_503 = iMA(Symbol(),5,50,0,MODE_SMA,PRICE_CLOSE,3);
double forces = iForce(Symbol(), 0, 13,MODE_SMA,PRICE_CLOSE,0);
double forces2 = iForce(Symbol(), 0, 13,MODE_SMA,PRICE_CLOSE,3);
double rsi1 = iRSI(Symbol(),0,5,PRICE_CLOSE,0);
if (ema5_5>ema13_5) bull5=TRUE;
if (ema5_15>ema13_15) bull15=TRUE;
for(int i=0;i<24;i++)
{
if (currenthigh<High[i]) currenthigh=High[i];
if (currentlow>Low[i]) currentlow=Low[i];
}
if (Ask+100.0*Point>currenthigh) TradeAllow=FALSE;
if (forces<=0.02 && forces-forces2>0.05)Force=TRUE;
double total=OrdersTotal();
if (total<1)
{
138
if (bull5==TRUE && sma5_501>sma5_503 && TradeAllow==TRUE && Force==TRUE
&& rsi1>50.0)
{
if (Ask-Bid<0.0004)
{
ticket=OrderSend(Symbol(),OP_BUY,vol,Ask, 3, 0, 0, "EMA5>EMA13", 01010,0,Green);
for (int j=0;j<12;j++)
{
averages[j]=High[j+1]-Low[j+1];
currentaverage=currentaverage+averages[j];
}
currentaverage=currentaverage/11;
Stoploss=currentaverage*SLfactor;
OrderModify(ticket,OrderOpenPrice(),Ask-Stoploss,Ask+TakeProfit*Point,0,Green);
}
}
}
for(int count=0;count<total;count++)
{
OrderSelect(count,SELECT_BY_POS,MODE_TRADES);
if(OrderType()<=OP_SELL && OrderSymbol()==Symbol())
{
if(OrderType()==OP_BUY)
{
if (TrailingStop>0)
{
if(Bid-OrderOpenPrice()>Point*TrailingStop)
{
if(OrderStopLoss()<Bid-Point*TrailingStop)
{
OrderModify(OrderTicket(),OrderOpenPrice(),Bid-
Point*TrailingStop,OrderTakeProfit(),0,Green);
return(0);
}
}
}
}
139
}
}
//----
return(0);
}
//+------------------------------------------------------------------+
Individual Projects
Pak’s Programming Project
For my programming project, I had decided to develop an expert advisor that will trade
similarly to my trading methods. I have a simple expert advisor right now that will buy and sell
according to moving averages crosses as I had first imagined it while writing my A term report.
Currently, the script would open a long position when my moving average of 25 crosses and
goes above my moving average of 50. When the moving average of 25 crosses back with the
moving average of 50 and goes below it, then the expert advisor closes the position. When the
moving average of 25 crosses and goes below the moving average of 50, the script would open a
short position. To trigger a close, I had set it to close short positions when the moving average of
25 crosses and goes above the moving average of 50. There is a stop loss of 30 pips and a take
profit of 60 pips with a trailing stop loss of 30 pips. I had chosen the Moving Average periods
according to the indicators I already had in MT4 and it was periods of 25 and 50.
To try to better my expert advisor, I have been experimenting with different Moving
Average periods to use for the program. With Moving averages of 12 and 24, the results were a
lot worse and it only had a profit margin of .06. Using Moving averages of 18 and 36, the profit
factor is .19, slightly bigger but still not profitable.
140
Backtesting Logs:
Figure 59 Pak's Progam's Backtest, 25MA and 50MA
Figure 60 Pak's Program's Backtest, 12MA and 24MA
141
Figure 61 Pak's Program's Backtest, 18MA and 36MA
As you can tell from the back testing, my script is not perfected right now as it had a total
net profit of -$3999.90 with a gross profit of $782.82. The profit factor is 0.17 so it is only 17%
right with a total of 174 trades made.
I had wanted during B term to add another indicator to my expert advisor as it had not
really been successful so I had added the stochastic oscillator. I had made my expert advisor
follow the conditions of the moving averages crosses and if the stochastic is over .2 to make sure
that it is a good trend. With the stochastic oscillator, here is my backtesting log:
142
Figure 62 Pak's Program's Backtest, 25MA and 50MA with Stochastic
As you can tell from that latest back test, the profit factor has increased to .32 but it is
still not a profitable robot. With the stochastic value of at least 20 implemented with the moving
average crossovers, this expert advisor has became more successful but needs more
improvements to be actually used with real money. Other than adding the stochastic oscillator to
the program, I had changed the values of the stop loss, take profit, trailing stop loss, and the time
period. The moving averages are 25 day periods and 50 day periods which is the same as the first
test. The stop loss is now 100 with a take profit of 50 and a trailing stop of 25. For reference, the
old stop loss was set to 30, the old take profit was set at 60, and the old trailing stop loss was set
at 30. I had also changed the period to thirty minutes to make sure that the moving average
crossovers would be even safer to use. The stop loss is bigger than the profit is something I had
tried out but after professor Radzicki’s presentation, I feel like mathematically, I would not work
143
out that great. My reasoning behind raising these was that there are a lot more fluctuations of
prices so a lower stop loss would trigger to close the position way too quick.
After seeing professor Radzicki’s trading robot and his robot’s methods, I realized that
my expert advisor is still very, very basic and is not adapt to my trading methodology yet. My
expert advisor is not as smart as it could be to have adaptive take profit and stop losses since I
have a different take profit and stop loss with every trade. If somehow the expert advisor could
use the data from the past four to seven days to mathematically figure out the take profit and stop
loss points from recent lows and highs, then it would be closer to my trading methodology. I
think that was the main problem with my expert advisor because waiting for crossovers for an
entry condition and then waiting for another crossover for an exit condition takes a very long
time especially in the 30 minute charts.
Josh’s Programming Project
For my programming project I wanted to create something that mimics my trading style. I
use the Stochastic Oscillator and two weighted moving averages to make most of my trading
decisions. I have found that the Stochastic Oscillator generally signals a price reversal a little
earlier than the moving averages and sometimes even jumps the gun a little bit. There are often
cases where the Stochastic Oscillator will fall victim to fake outs. It will signal a price reversal
and the price will move in that direction very slightly, but the moving averages never cross and
the price continues going in the direction it was going before. For this reason I like to wait for the
moving averages to cross as well, at which point I will enter a trade. I have written the code for
this simple parameter, but there is much to be added. The code I have as of now is this:
inputs: Length( 14 ), OverSold( 20 ),Price( Close ), FastLength( 12 ),
SlowLength( 26 ) ;
variables: oFastK( 0 ), oFastD( 0 ), oSlowK( 0 ), oSlowD( 0 ), FastAvg( 0 ),
SlowAvg( 0 ) ;
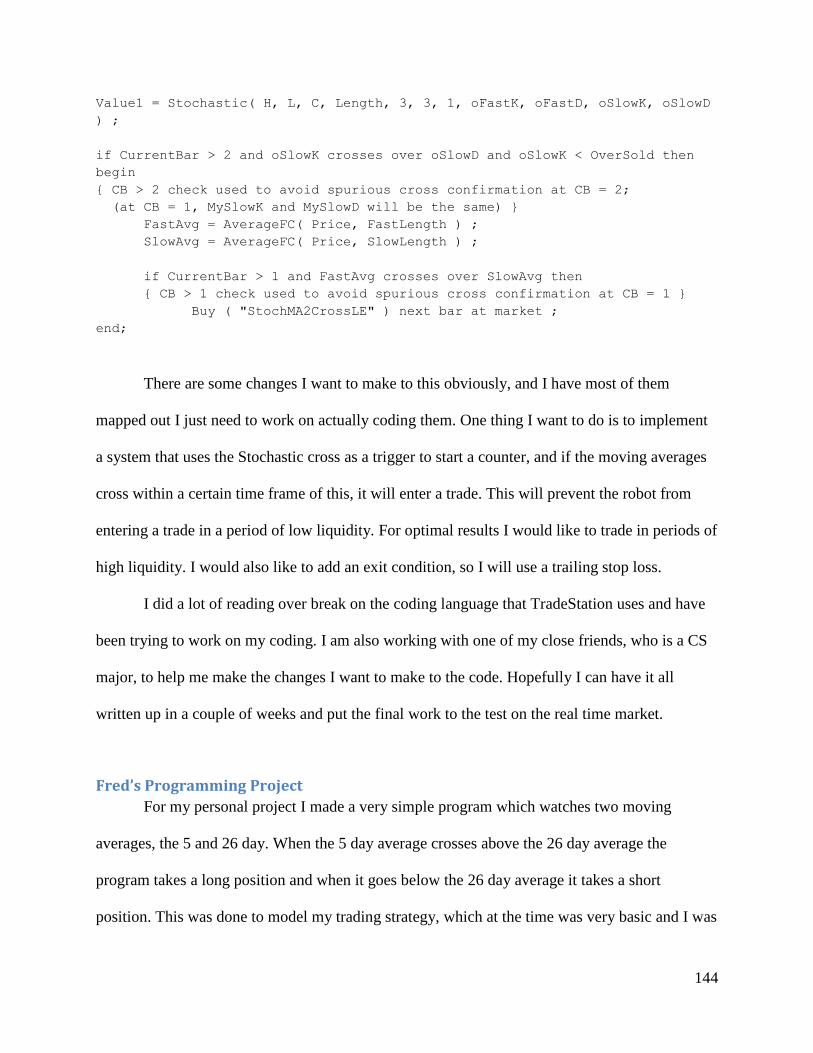
144
Value1 = Stochastic( H, L, C, Length, 3, 3, 1, oFastK, oFastD, oSlowK, oSlowD
) ;
if CurrentBar > 2 and oSlowK crosses over oSlowD and oSlowK < OverSold then
begin
{ CB > 2 check used to avoid spurious cross confirmation at CB = 2;
(at CB = 1, MySlowK and MySlowD will be the same) }
FastAvg = AverageFC( Price, FastLength ) ;
SlowAvg = AverageFC( Price, SlowLength ) ;
if CurrentBar > 1 and FastAvg crosses over SlowAvg then
{ CB > 1 check used to avoid spurious cross confirmation at CB = 1 }
Buy ( "StochMA2CrossLE" ) next bar at market ;
end;
There are some changes I want to make to this obviously, and I have most of them
mapped out I just need to work on actually coding them. One thing I want to do is to implement
a system that uses the Stochastic cross as a trigger to start a counter, and if the moving averages
cross within a certain time frame of this, it will enter a trade. This will prevent the robot from
entering a trade in a period of low liquidity. For optimal results I would like to trade in periods of
high liquidity. I would also like to add an exit condition, so I will use a trailing stop loss.
I did a lot of reading over break on the coding language that TradeStation uses and have
been trying to work on my coding. I am also working with one of my close friends, who is a CS
major, to help me make the changes I want to make to the code. Hopefully I can have it all
written up in a couple of weeks and put the final work to the test on the real time market.
Fred’s Programming Project
For my personal project I made a very simple program which watches two moving
averages, the 5 and 26 day. When the 5 day average crosses above the 26 day average the
program takes a long position and when it goes below the 26 day average it takes a short
position. This was done to model my trading strategy, which at the time was very basic and I was
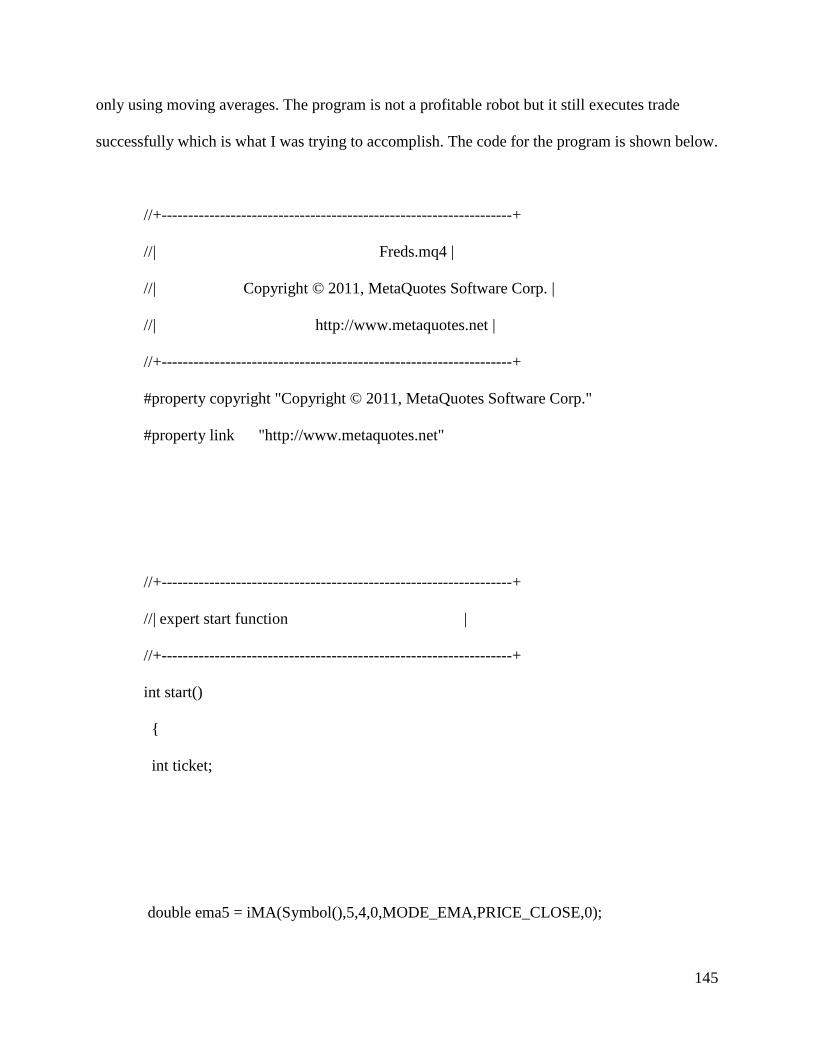
145
only using moving averages. The program is not a profitable robot but it still executes trade
successfully which is what I was trying to accomplish. The code for the program is shown below.
//+------------------------------------------------------------------+
//| Freds.mq4 |
//| Copyright © 2011, MetaQuotes Software Corp. |
//| http://www.metaquotes.net |
//+------------------------------------------------------------------+
#property copyright "Copyright © 2011, MetaQuotes Software Corp."
#property link "http://www.metaquotes.net"
//+------------------------------------------------------------------+
//| expert start function |
//+------------------------------------------------------------------+
int start()
{
int ticket;
double ema5 = iMA(Symbol(),5,4,0,MODE_EMA,PRICE_CLOSE,0);
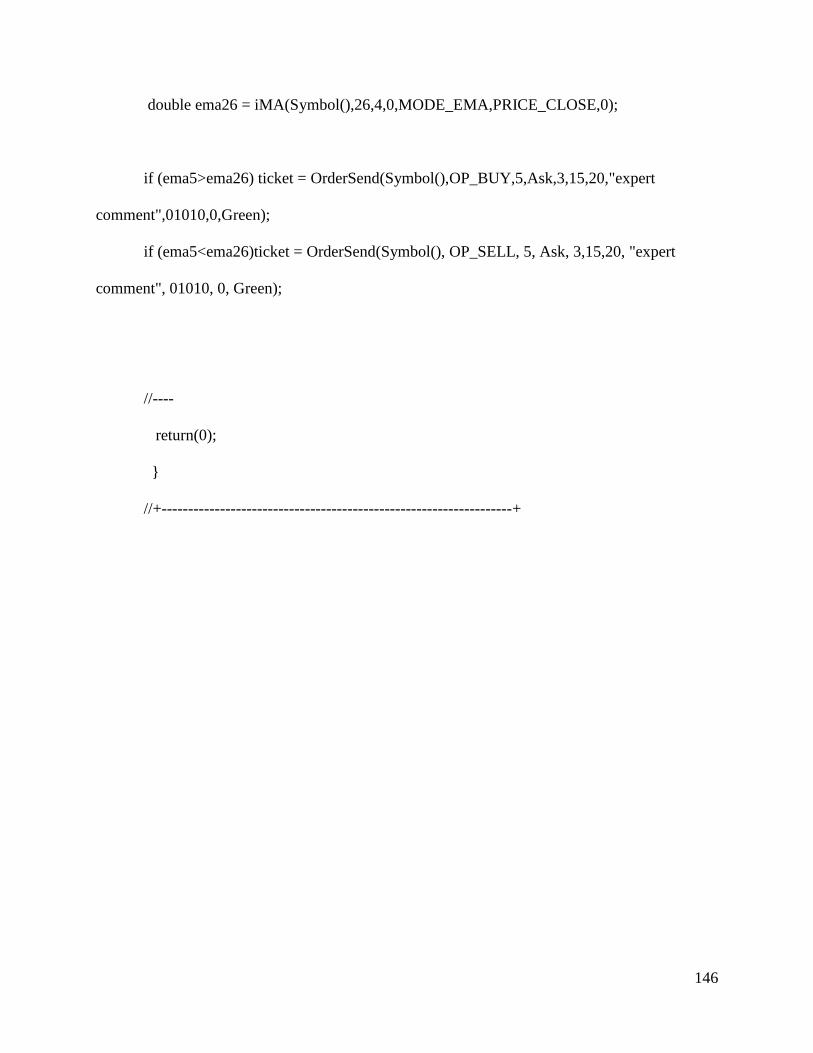
146
double ema26 = iMA(Symbol(),26,4,0,MODE_EMA,PRICE_CLOSE,0);
if (ema5>ema26) ticket = OrderSend(Symbol(),OP_BUY,5,Ask,3,15,20,"expert
comment",01010,0,Green);
if (ema5<ema26)ticket = OrderSend(Symbol(), OP_SELL, 5, Ask, 3,15,20, "expert
comment", 01010, 0, Green);
//----
return(0);
}
//+------------------------------------------------------------------+
147
Appendix E – Forex Websites For more information regarding the forex market, we have also included a list of websites
which we have found useful in retrieving information accompanied by a brief description of the
website.
http://www.forexpros.com/
Forexpros is a good site for experienced traders, or those looking to gain more experience
in trading. They have a lot of links at resources on their site. There are links to brokers, forex
education, charts, news, and technical and fundamental analysis tools listed across the top of the
page. It conveniently states which forex markets are currently open or closed. There is a chart on
the main page which has options for indices, forex, commodities, and rates and bonds. It also has
overviews of specific stocks which rate how bullish/bearish they are and says whether it is a
strong buy or not.
http://forextrading.about.com/
This site would be good for someone who is new to forex trading or just simply wants to
learn about the forex market. There are links across the top of the page leading to getting started,
currency analysis, and forex reviews. There are suggested links for beginners to learn about the
market and business and finance videos featured on the main page.
http://www.forex.com/
This website seems to be geared toward all levels of trading. Across the top of the page
are a lot of links that serve the needs of all levels of experience. For the beginners, there are links
such as learn, getting started, open an account, ways to trade, and trade. There are also links to
video tutorials and webinars and the option to live chat with a forex rep. The site also has a chart
with the current market prices for the main currencies. They have three different options for
148
progression, starting with learn, then practice, and finally trade. For more experienced traders
there are links to research and ideas for strategies and also an explanation of the importance of
execution when trading. There are more links at the bottom of the page to serve traders’ more
specific needs.
http://www.oanda.com/
Oanda has a lot of exchange data. They have a convenient chart on their main page which
compares USD, GBP, EUR, and JPY simultaneously. They also have a link to a currency
converter which can convert both ways between different currencies. They have a link to their
forex site – http://fxtrade.oanda.com/ - which offers some of their forex tools. They have live
updates of currency market prices and long/short recommendations for each currency. They also
have links to get started with an Oanda account, highlighting the advantages of using Oanda as
your broker, in particular, low spreads.
http://www.forexfactory.com/
I find this website really useful, because it shows when the news is on in different
countries, and it also gives a brief description of a news story and rates its impact on the market.
A lot of traders will make the mistake of trading during news hours, whether purposefully or not,
and a lot of times this can be bad, because there can be violent swings at these times. Before
making a trade I often check this website to make sure that a fluctuation is not due to a breaking
news story in another country.

149


![Using Elliott Wave Technique - INDEXES...“Trading Elliott Waves with Regression Trend Channel & Count Back Line”, February, Learning Section, . Dologa, Mircea [2012]. “An Elliott](https://img.pdfslide.us/doc/110x75/60e84c5f9aac8073ff6c4edc/using-elliott-wave-indexes-aoetrading-elliott-waves-with-regression-trend-channel.jpg)