Embed Size (px)
Citation preview
Investment StrategyInterpreting key concepts and choosing appropriate strategies
P

ASSET ALLOCATION STANDARDS
Contents
Asset Allocation 2 Strategic asset allocation
6 Tactical allocation
8 Choosing the appropriate mix
9 Portfolio rebalancing
10 Disciplined investing
13 Managing your portfolio
Tax Efficiency14 Tax-efficient investing15 Asset location 16 Tax-loss harvesting
17 Tax-sensitive investment management1
Your Next Steps18 Put your strategies to work
INVESTMENT STRATEGY 1
Designing your specialized investment strategy
Your goals are as unique as you are. That’s why your personal investment strategy needs to reflect the following:
• Where you’re headed• How you plan to get there • What your specific objectives are• When you want to achieve them• What level of risk you’re willing to accept to reach your goals
In this discussion guide, we’ll take a look at how you can use several investment strategies to serve your family’s unique needs. The strategies are broken into two categories — asset allocation and tax efficiency.
Tax EfficiencyAsset Allocation
At Fidelity, we believe:• Asset allocation is the single
most important factor in assessing the long-term risk- and-return characteristics of a diversified portfolio.
• Efficient portfolio diversification can be one way to lower a port-folio’s risk while maintaining its expected return.
At Fidelity, we believe:• Overlooking the potential
impact taxes can have on investment returns is one of the most common mistakes investors make.
• The type of account in which you hold certain assets can make a major difference in how much you can earn, after tax, over time.
Portfolio ReviewAt Fidelity, we believe:
Investors should begin the portfolio review process by clearly defining their investing goals and time frame, then commit to periodic
reviews of their portfolio.
Return to Table of Contents
INVESTMENT STRATEGY2
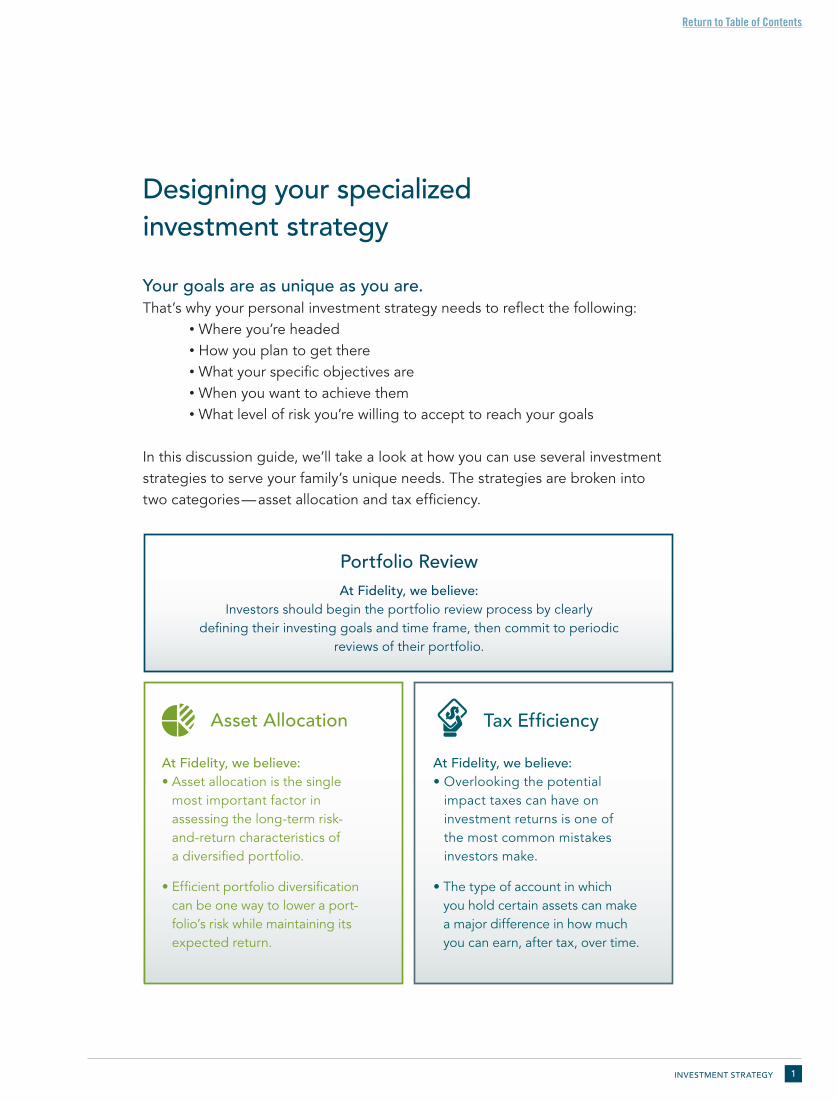
Strategic asset allocationBuild a strategy designed for your needs, and stay committed to it.
Asset allocation is the single most important factor in assessing the long-term risk-and-return characteristics of your portfolio. Research shows that the strategy of selecting the percentage of stocks, bonds, and cash in a portfolio can be said to be responsible for more than 90% of the variability in portfolio returns.2
Poor asset allocation decisions can cause the returns of the average stock or bond investor to lag the respective markets. You should allocate your investments across stocks, bonds, and cash to help reduce portfolio risk, seek attractive returns, and avoid the pitfalls of market timing. In addition, investors with longer time horizons have the capacity to accept a higher level of portfolio volatility associated with a more significant weighting in equities, which should include broadly diversified international funds to take advantage of diversification benefits outside the United States.
Determining your asset mix.Your time horizon, current financial situation, and tolerance for market swings will influence how aggressively or conservatively you choose to invest.
Investors can trail the market significantly. Decisions by investors to get in and out of the market or to select underperforming investments can cause them to generate far lower returns than the overall market.
UNDERSTAND YOUR RISK TOLERANCE
LessAggressive
Profile
MoreAggressiveProfile
Time HorizonShort-term goal
No emergency fundsDecreasing future incomeLarge amount of debt
Market changes cause anxiety
Long-term goal
Adequate emergency fundsIncreasing future income
Small amount of debt
Comfort with market changes
Current Financial Situation
Risk Tolerance
ASSET ALLOCATION
• Where do you fall on the spectrum of time horizon, current financial situation, and risk tolerance?
• How has your risk tolerance influenced your investment decisions?
Q
Return to Table of Contents
ASSET ALLOCATION 3
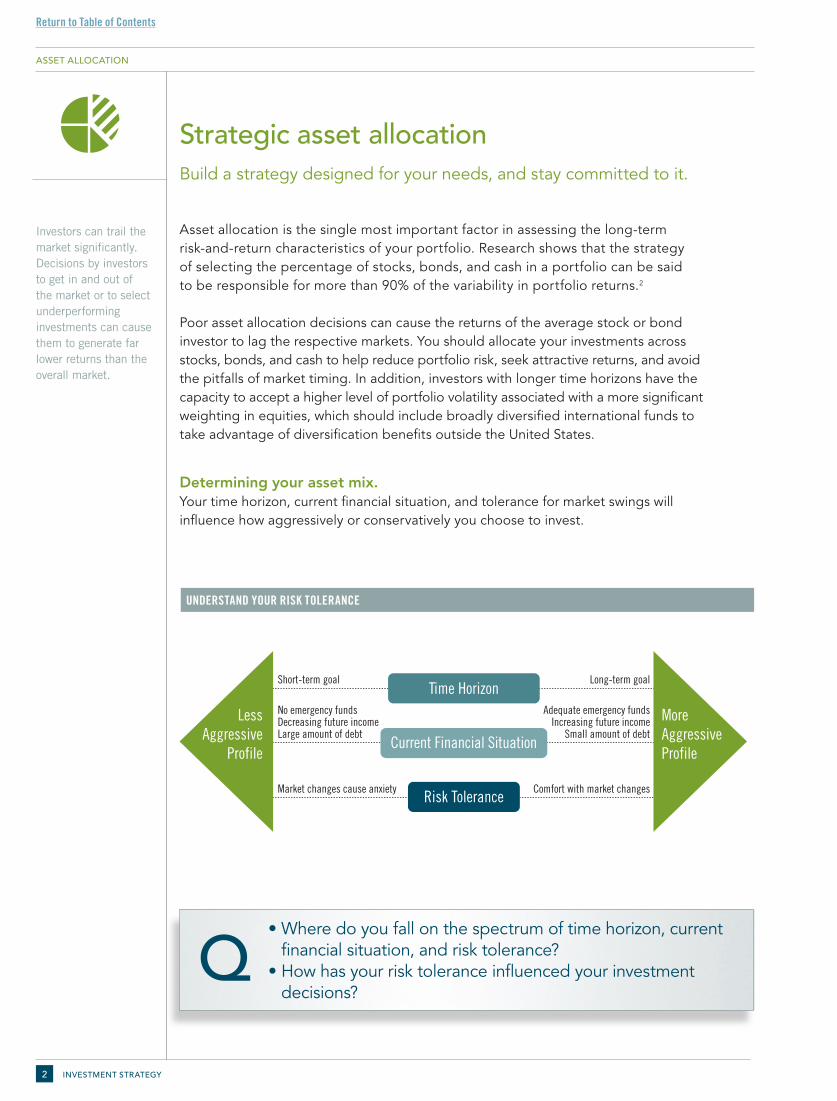
Consider portfolio diversification and select your target asset mix.Portfolio diversification is the mix of stocks, bonds, and cash held in a portfolio. One way to help protect yourself from the unpredictability of the market may be to diversify your holdings across these three main types of investments. This approach can help lower the risks associated with having all your money in only one type of investment.
Your asset mix depends largely on your specific financial situation. Typically, a longer investing time frame allows for a higher percentage of stocks in your portfolio. If you are near retirement you may want to consider a gradual process of transitioning into a lower volatility asset mix. Keep in mind that retirement for some investors could last 30 years or longer, so the growth potential of your portfolio should still be an important consideration when selecting your investment mix.
100%Short Term
30%Short Term
14%U.S. Stocks
50%Bonds
6%Int’l Stocks
10%Short Term
Short TermAggressive
GrowthMost
AggressiveConservative Balanced Growth
35%U.S. Stocks40%
Bonds
15%Int’l Stocks
5%Short Term
49%U.S. Stocks
25%Bonds
21%Int’l Stocks
60%U.S. Stocks
15%Bonds
25%Int’l Stocks
70%U.S. Stocks
30%Int’l Stocks
100%30%
14%50%
6% 10%
35%40%
15% 5%
49%25%
21%60%
15%
25%
70%
30%
TARGET ASSET MIXES
Short-Term Conservative Balanced Growth Aggressive Growth
Most Aggressive
May be appropriate for investors who:
• Seek to preserve capital
• Seek to minimize fluctuations in market values
• Seek potential for capital appreciation and some growth
• Have a preference for growth
• Seek aggressive growth
• Seek very aggressive growth
• Can accept the lowest returns in exchange for price stability
• Take an income-oriented approach with some potential for capital appreciation
• Can withstand moderate fluctuations in market value
• Can withstand significant fluctuations in market value
• Can tolerate wide fluctuations in market values, especially over the short term
• Can tolerate very wide fluctuations in market values, especially over the short term
Legend: n Short-Term n International Stocks n Domestic Stocks n Bonds
ASSET ALLOCATION
• What has led you to arrive at your current asset mix?Q
Return to Table of Contents
INVESTMENT STRATEGY4
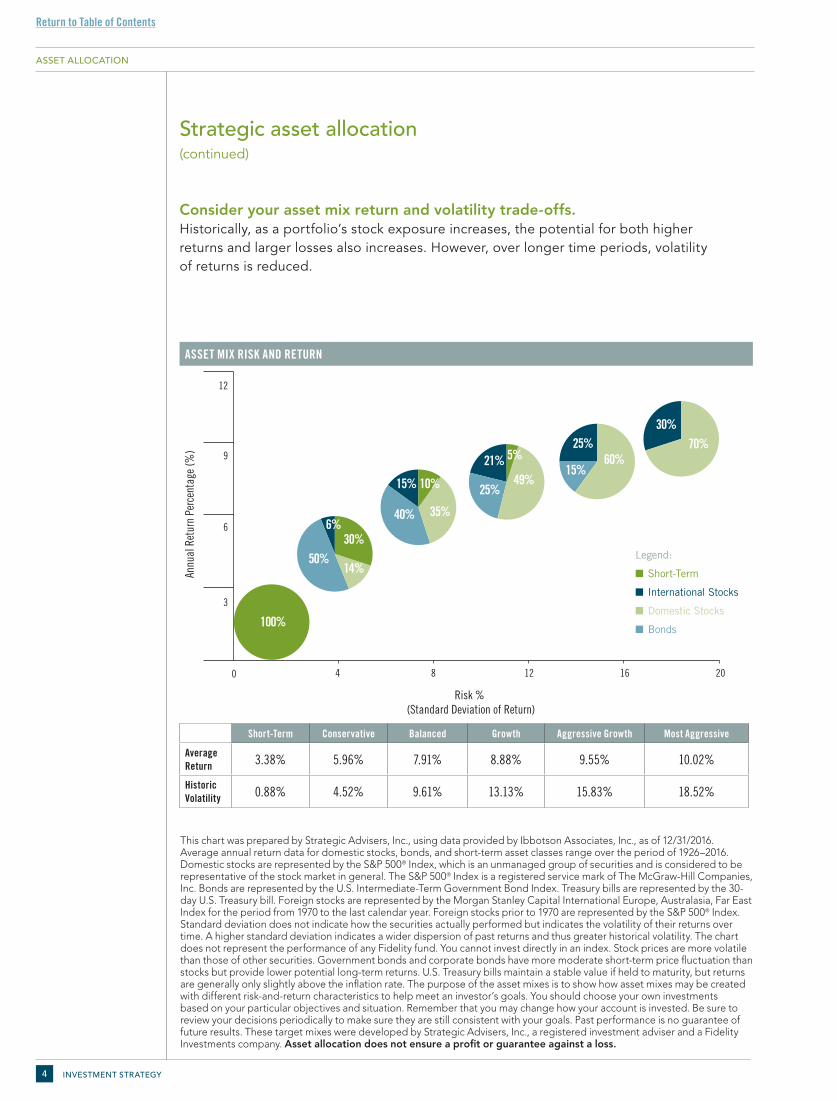
Consider your asset mix return and volatility trade-offs.Historically, as a portfolio’s stock exposure increases, the potential for both higher returns and larger losses also increases. However, over longer time periods, volatility of returns is reduced.
ASSET MIX RISK AND RETURN
0
3
6
9
12
Annu
al R
etur
n Pe
rcen
tage
(%)
Risk % (Standard Deviation of Return)
4 8 12 16 20
30%
14%50%
6%
10%
Short-Term InvestmentsDomestic StocksBondsForeign Stocks
35%40%
15%
5%
49%25%21% 60%15%
25% 70%30%
0
3
6
9
12
Annu
al R
etur
n Pe
rcen
tage
(%)
Risk % (Standard Deviation of Return)
4 8 12 16 20
100%
100%
30%
14%50%
6%
10%
35%40%
15%
5%
49%25%
21% 60%15%
25% 70%30%
This chart was prepared by Strategic Advisers, Inc., using data provided by Ibbotson Associates, Inc., as of 12/31/2016. Average annual return data for domestic stocks, bonds, and short-term asset classes range over the period of 1926–2016. Domestic stocks are represented by the S&P 500® Index, which is an unmanaged group of securities and is considered to be representative of the stock market in general. The S&P 500® Index is a registered service mark of The McGraw-Hill Companies, Inc. Bonds are represented by the U.S. Intermediate-Term Government Bond Index. Treasury bills are represented by the 30-day U.S. Treasury bill. Foreign stocks are represented by the Morgan Stanley Capital International Europe, Australasia, Far East Index for the period from 1970 to the last calendar year. Foreign stocks prior to 1970 are represented by the S&P 500® Index. Standard deviation does not indicate how the securities actually performed but indicates the volatility of their returns over time. A higher standard deviation indicates a wider dispersion of past returns and thus greater historical volatility. The chart does not represent the performance of any Fidelity fund. You cannot invest directly in an index. Stock prices are more volatile than those of other securities. Government bonds and corporate bonds have more moderate short-term price fluctuation than stocks but provide lower potential long-term returns. U.S. Treasury bills maintain a stable value if held to maturity, but returns are generally only slightly above the inflation rate. The purpose of the asset mixes is to show how asset mixes may be created with different risk-and-return characteristics to help meet an investor’s goals. You should choose your own investments based on your particular objectives and situation. Remember that you may change how your account is invested. Be sure to review your decisions periodically to make sure they are still consistent with your goals. Past performance is no guarantee of future results. These target mixes were developed by Strategic Advisers, Inc., a registered investment adviser and a Fidelity Investments company. Asset allocation does not ensure a profit or guarantee against a loss.
Strategic asset allocation (continued)
Legend:
n Short-Term
n International Stocks
n Domestic Stocks
n Bonds
Short-Term Conservative Balanced Growth Aggressive Growth Most Aggressive
Average Return 3.38% 5.96% 7.91% 8.88% 9.55% 10.02%
Historic Volatility 0.88% 4.52% 9.61% 13.13% 15.83% 18.52%
ASSET ALLOCATION
Return to Table of Contents
ASSET ALLOCATION 5
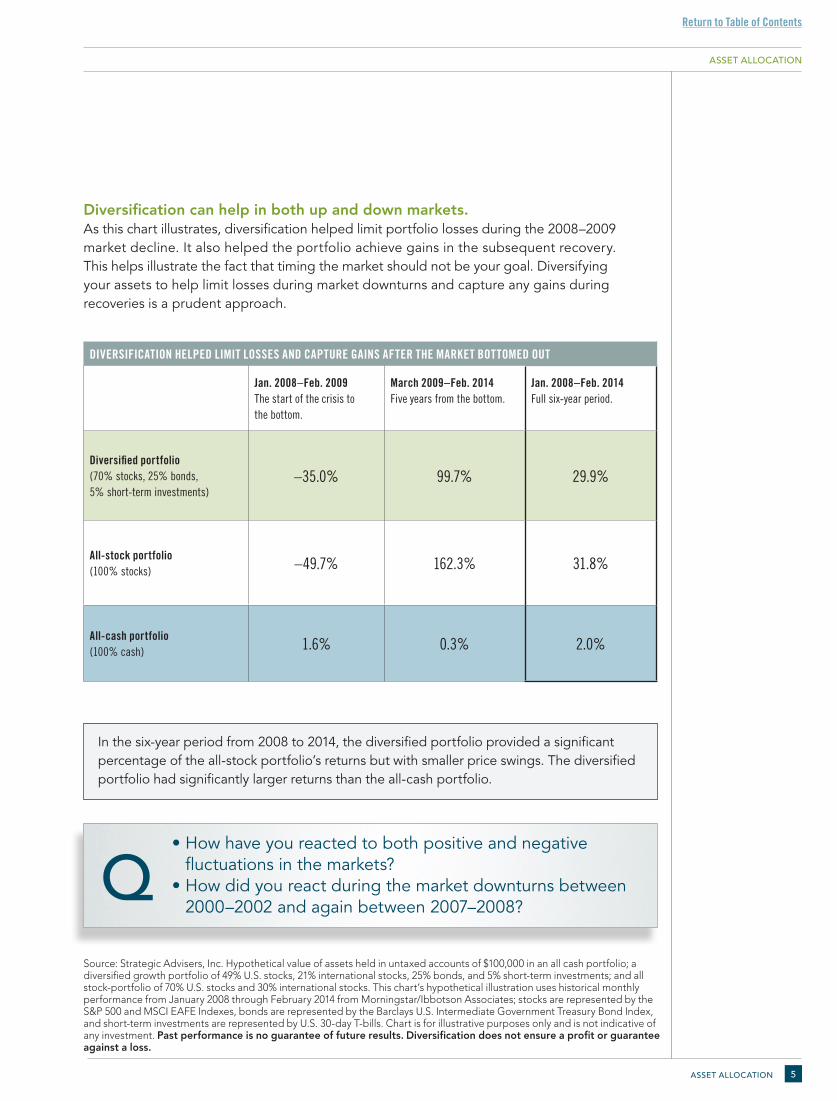
In the six-year period from 2008 to 2014, the diversified portfolio provided a significant percentage of the all-stock portfolio’s returns but with smaller price swings. The diversified portfolio had significantly larger returns than the all-cash portfolio.
Source: Strategic Advisers, Inc. Hypothetical value of assets held in untaxed accounts of $100,000 in an all cash portfolio; a diversified growth portfolio of 49% U.S. stocks, 21% international stocks, 25% bonds, and 5% short-term investments; and all stock-portfolio of 70% U.S. stocks and 30% international stocks. This chart’s hypothetical illustration uses historical monthly performance from January 2008 through February 2014 from Morningstar/Ibbotson Associates; stocks are represented by the S&P 500 and MSCI EAFE Indexes, bonds are represented by the Barclays U.S. Intermediate Government Treasury Bond Index, and short-term investments are represented by U.S. 30-day T-bills. Chart is for illustrative purposes only and is not indicative of any investment. Past performance is no guarantee of future results. Diversification does not ensure a profit or guarantee against a loss.
Diversification can help in both up and down markets.As this chart illustrates, diversification helped limit portfolio losses during the 2008–2009 market decline. It also helped the portfolio achieve gains in the subsequent recovery. This helps illustrate the fact that timing the market should not be your goal. Diversifying your assets to help limit losses during market downturns and capture any gains during recoveries is a prudent approach.
DIVERSIFICATION HELPED LIMIT LOSSES AND CAPTURE GAINS AFTER THE MARKET BOTTOMED OUT
Jan. 2008–Feb. 2009The start of the crisis to the bottom.
March 2009–Feb. 2014 Five years from the bottom.
Jan. 2008–Feb. 2014Full six-year period.
Diversified portfolio (70% stocks, 25% bonds, 5% short-term investments)
–35.0% 99.7% 29.9%
All-stock portfolio (100% stocks) –49.7% 162.3% 31.8%
All-cash portfolio (100% cash) 1.6% 0.3% 2.0%
ASSET ALLOCATION
• How have you reacted to both positive and negative fluctuations in the markets?
• How did you react during the market downturns between 2000–2002 and again between 2007–2008?
Q
Return to Table of Contents
INVESTMENT STRATEGY6
Tactical allocationEstablishing your asset allocation mix is important, but your investment strategy also needs to take into consideration the sub–asset classes, or the more specific holdings of several categories of assets.
StocksAt the heart of diversification is the concept of correlation, or the measure of how the returns of two investments tend to move together, i.e., whether their returns move in the same or in opposite directions, and to what degree. To build a diversified portfolio, you should consider owning investments across multiple asset classes. This is because different asset classes typically have different risk-return trade-offs.
Because it’s impossible to predict which will outperform, you should diversify not only across asset classes but also within an asset class. For example, within equities, you could have large-, medium-, and small-capitalization stocks; growth and value stocks; and domestic and international stocks.
BondsFixed-income investing is a critical component of asset allocation. Diversifying across a broad spectrum of fixed-income issuers, sectors, and maturities may significantly improve your portfolio’s risk-adjusted return while helping to protect it against interest rate changes.
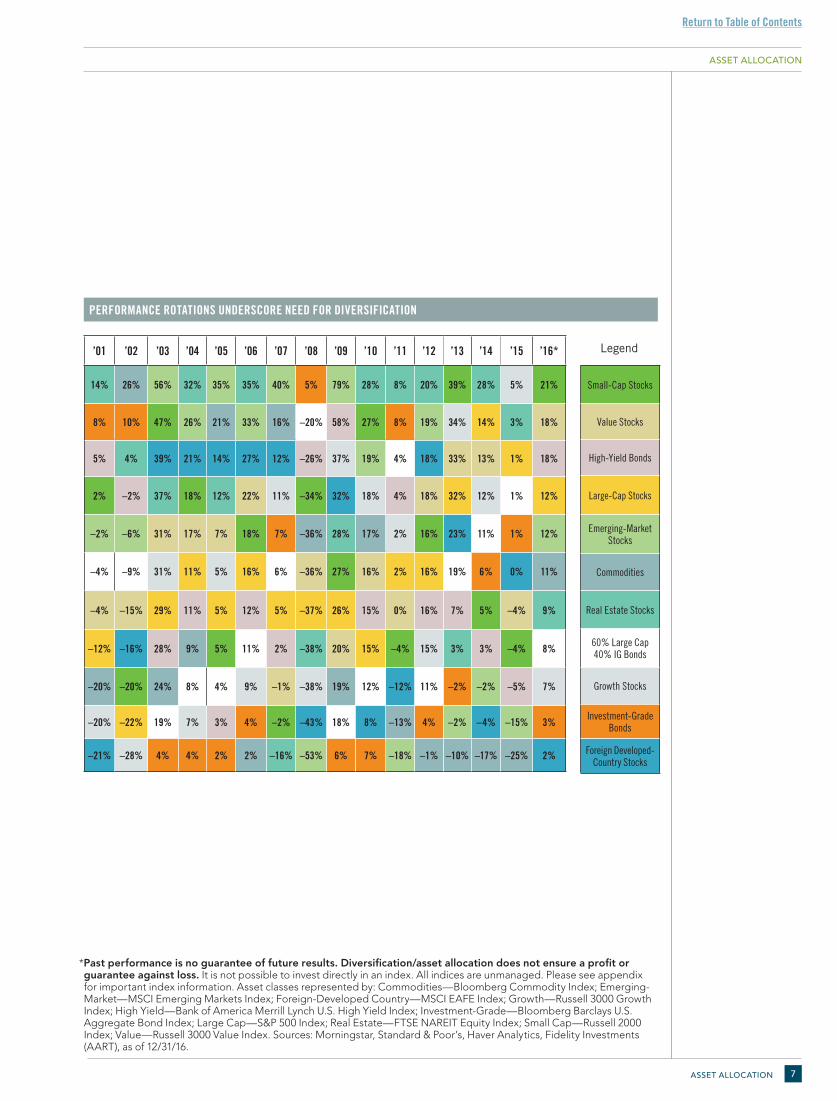
Not all market capitalizations, sectors, and regions prosper at the same time. By spreading your investments across several asset classes and sub–asset classes, you may be able to reduce portfolio risk and take advantage of opportunities as various assets rotate in and out of favor.
ASSET ALLOCATION
• How have you attempted to reduce risk in your portfolio?• How familiar are you with different sub-assets classes in the
market?Q
Return to Table of Contents
ASSET ALLOCATION 7
*Past performance is no guarantee of future results. Diversification/asset allocation does not ensure a profit or guarantee against loss. It is not possible to invest directly in an index. All indices are unmanaged. Please see appendix for important index information. Asset classes represented by: Commodities—Bloomberg Commodity Index; Emerging-Market—MSCI Emerging Markets Index; Foreign-Developed Country—MSCI EAFE Index; Growth—Russell 3000 Growth Index; High Yield—Bank of America Merrill Lynch U.S. High Yield Index; Investment-Grade—Bloomberg Barclays U.S. Aggregate Bond Index; Large Cap—S&P 500 Index; Real Estate—FTSE NAREIT Equity Index; Small Cap—Russell 2000 Index; Value—Russell 3000 Value Index. Sources: Morningstar, Standard & Poor’s, Haver Analytics, Fidelity Investments (AART), as of 12/31/16.
PERFORMANCE ROTATIONS UNDERSCORE NEED FOR DIVERSIFICATION
Small-Cap Stocks
Value Stocks
High-Yield Bonds
Large-Cap Stocks
Emerging-MarketStocks
Commodities
Real Estate Stocks
60% Large Cap40% IG Bonds
Growth Stocks
Investment-GradeBonds
Foreign Developed- Country Stocks
’01 ’02 ’03 ’04 ’05 ’06 ’07 ’08 ’09 ’10 ’11 ’12 ’13 ’14 ’15 ’16*
14% 26% 56% 32% 35% 35% 40% 5% 79% 28% 8% 20% 39% 28% 5% 21%
8% 10% 47% 26% 21% 33% 16% –20% 58% 27% 8% 19% 34% 14% 3% 18%
5% 4% 39% 21% 14% 27% 12% –26% 37% 19% 4% 18% 33% 13% 1% 18%
2% –2% 37% 18% 12% 22% 11% –34% 32% 18% 4% 18% 32% 12% 1% 12%
–2% –6% 31% 17% 7% 18% 7% –36% 28% 17% 2% 16% 23% 11% 1% 12%
–4% –9% 31% 11% 5% 16% 6% –36% 27% 16% 2% 16% 19% 6% 0% 11%
–4% –15% 29% 11% 5% 12% 5% –37% 26% 15% 0% 16% 7% 5% –4% 9%
–12% –16% 28% 9% 5% 11% 2% –38% 20% 15% –4% 15% 3% 3% –4% 8%
–20% –20% 24% 8% 4% 9% –1% –38% 19% 12% –12% 11% –2% –2% –5% 7%
–20% –22% 19% 7% 3% 4% –2% –43% 18% 8% –13% 4% –2% –4% –15% 3%
–21% –28% 4% 4% 2% 2% –16% –53% 6% 7% –18% –1% –10% –17% –25% 2%
Legend
ASSET ALLOCATION
Return to Table of Contents
INVESTMENT STRATEGY8
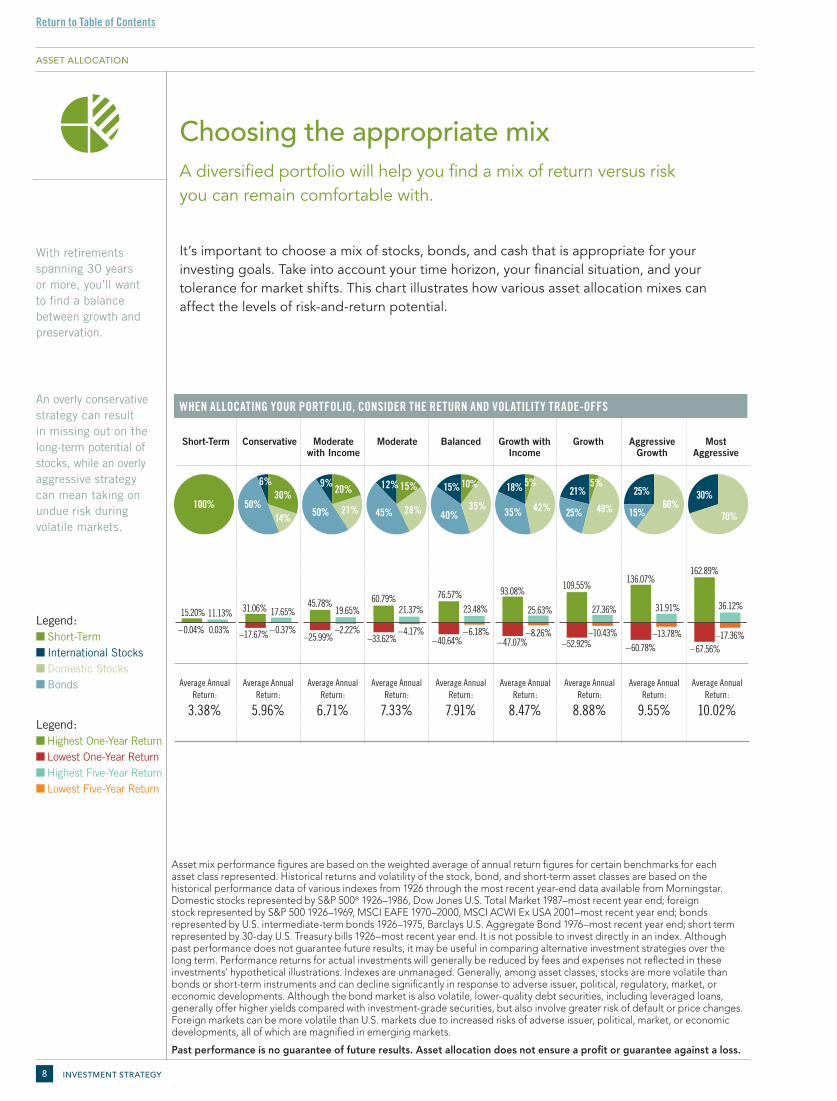
Choosing the appropriate mix A diversified portfolio will help you find a mix of return versus risk you can remain comfortable with.
It’s important to choose a mix of stocks, bonds, and cash that is appropriate for your investing goals. Take into account your time horizon, your financial situation, and your tolerance for market shifts. This chart illustrates how various asset allocation mixes can affect the levels of risk-and-return potential.
With retirements spanning 30 years or more, you’ll want to find a balance between growth and preservation.
Asset mix performance figures are based on the weighted average of annual return figures for certain benchmarks for each asset class represented. Historical returns and volatility of the stock, bond, and short-term asset classes are based on the historical performance data of various indexes from 1926 through the most recent year-end data available from Morningstar. Domestic stocks represented by S&P 500® 1926–1986, Dow Jones U.S. Total Market 1987–most recent year end; foreign stock represented by S&P 500 1926–1969, MSCI EAFE 1970–2000, MSCI ACWI Ex USA 2001–most recent year end; bonds represented by U.S. intermediate-term bonds 1926–1975, Barclays U.S. Aggregate Bond 1976–most recent year end; short term represented by 30-day U.S. Treasury bills 1926–most recent year end. It is not possible to invest directly in an index. Although past performance does not guarantee future results, it may be useful in comparing alternative investment strategies over the long term. Performance returns for actual investments will generally be reduced by fees and expenses not reflected in these investments’ hypothetical illustrations. Indexes are unmanaged. Generally, among asset classes, stocks are more volatile than bonds or short-term instruments and can decline significantly in response to adverse issuer, political, regulatory, market, or economic developments. Although the bond market is also volatile, lower-quality debt securities, including leveraged loans, generally offer higher yields compared with investment-grade securities, but also involve greater risk of default or price changes. Foreign markets can be more volatile than U.S. markets due to increased risks of adverse issuer, political, market, or economic developments, all of which are magnified in emerging markets.
Past performance is no guarantee of future results. Asset allocation does not ensure a profit or guarantee against a loss.
An overly conservative strategy can result in missing out on the long-term potential of stocks, while an overly aggressive strategy can mean taking on undue risk during volatile markets.
Legend: n Short-Term n International Stocks n Domestic Stocks n Bonds
Legend: n Highest One-Year Returnn Lowest One-Year Returnn Highest Five-Year Returnn Lowest Five-Year Return
Short TermAggressive
GrowthMost
AggressiveConservative Balanced Growth
76.57%23.48%
–6.18%–40.64%
31.06% 17.65%
–0.37%–17.67%
15.20% 11.13%
0.03%–0.04%
162.89%
36.12%
–17.36%–67.56%
136.07%
31.91%
–13.78%–60.78%
109.55%
27.36%
–10.43%–52.92%
100%30%
14%50%
6% 10%
35%40%
15% 5%
49%25%
21%
70%
30%60%
15%
25%
50%
20%
21%
9%
45%
12% 15% 28%
5%18%
35% 42%
93.08%
25.63%
–8.26%–47.07%
45.78%19.65%
–2.22%–25.99%
60.79%21.37%
–4.17%–33.62%
WHEN ALLOCATING YOUR PORTFOLIO, CONSIDER THE RETURN AND VOLATILITY TRADE-OFFS
Short-Term Conservative Moderate with Income
Moderate Balanced Growth with Income
Growth Aggressive Growth
Most Aggressive
Average Annual Return:
3.38%
Average Annual Return:
5.96%
Average Annual Return:
6.71%
Average Annual Return:
7.33%
Average Annual Return:
7.91%
Average Annual Return:
8.47%
Average Annual Return:
8.88%
Average Annual Return:
9.55%
Average Annual Return:
10.02%
Short TermAggressive
GrowthMost
AggressiveBalanced Growth
100%30%
14%50%
6% 10%
35%40%
15% 5%
49%25%
21%
70%
30%60%
15%
25%
50%
20%
21%
9%
45%
12% 15% 28%
5%18%
35% 42%
100%Short Term
30%Short Term
14%U.S. Stocks
50%Bonds
6%Int’l Stocks
10%Short Term
35%U.S. Stocks40%
Bonds
15%Int’l Stocks
5%Short Term
49%U.S. Stocks
25%Bonds
21%Int’l Stocks
60%U.S. Stocks
15%Bonds
25%Int’l Stocks
70%U.S. Stocks
30%Int’l Stocks
ASSET ALLOCATION
Return to Table of Contents
ASSET ALLOCATION 9
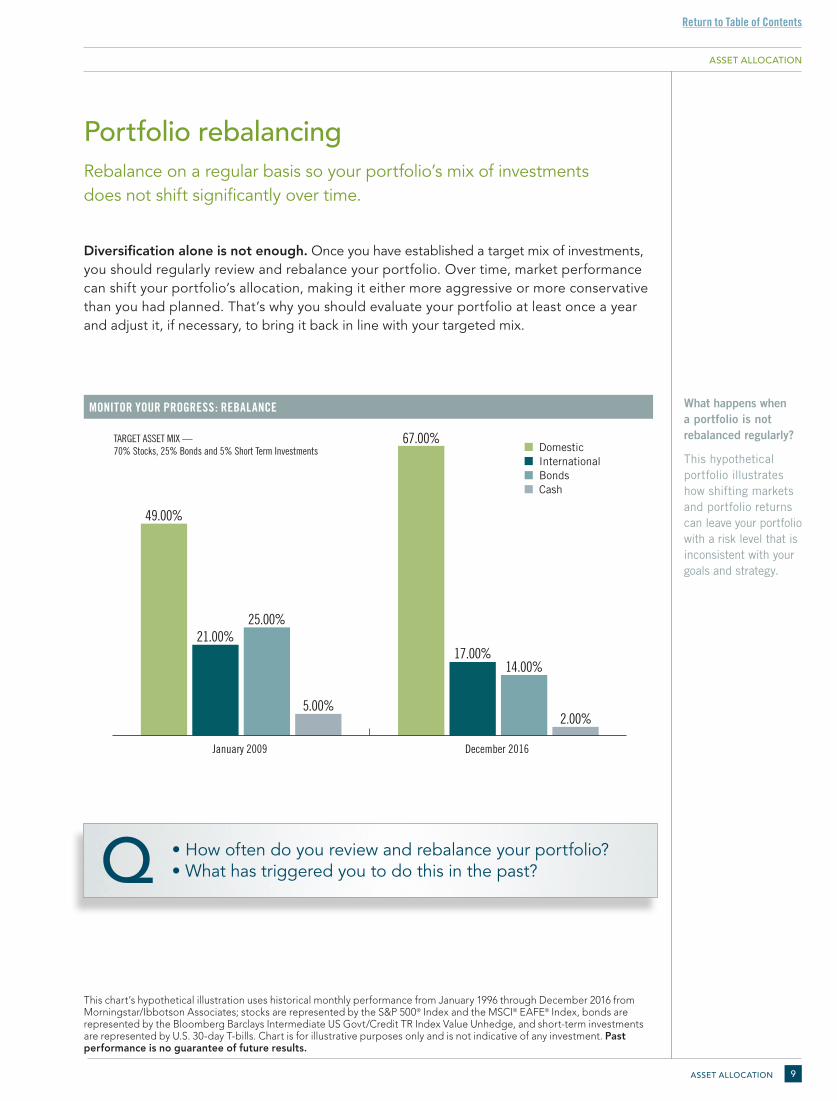
Portfolio rebalancing Rebalance on a regular basis so your portfolio’s mix of investments does not shift significantly over time.
Diversification alone is not enough. Once you have established a target mix of investments, you should regularly review and rebalance your portfolio. Over time, market performance can shift your portfolio’s allocation, making it either more aggressive or more conservative than you had planned. That’s why you should evaluate your portfolio at least once a year and adjust it, if necessary, to bring it back in line with your targeted mix.
This chart’s hypothetical illustration uses historical monthly performance from January 1996 through December 2016 from Morningstar/Ibbotson Associates; stocks are represented by the S&P 500® Index and the MSCI® EAFE® Index, bonds are represented by the Bloomberg Barclays Intermediate US Govt/Credit TR Index Value Unhedge, and short-term investments are represented by U.S. 30-day T-bills. Chart is for illustrative purposes only and is not indicative of any investment. Past performance is no guarantee of future results.
What happens when a portfolio is not rebalanced regularly?
This hypothetical portfolio illustrates how shifting markets and portfolio returns can leave your portfolio with a risk level that is inconsistent with your goals and strategy.
MONITOR YOUR PROGRESS: REBALANCE
49.00%
21.00%25.00%
5.00%
67.00%
17.00%14.00%
2.00%
December 2016�January 2009�
■ Domestic■ International■ Bonds■ Cash
TARGET ASSET MIX — 70% Stocks, 25% Bonds and 5% Short Term Investments
• How often do you review and rebalance your portfolio?• What has triggered you to do this in the past?Q
ASSET ALLOCATION
Return to Table of Contents
INVESTMENT STRATEGY10
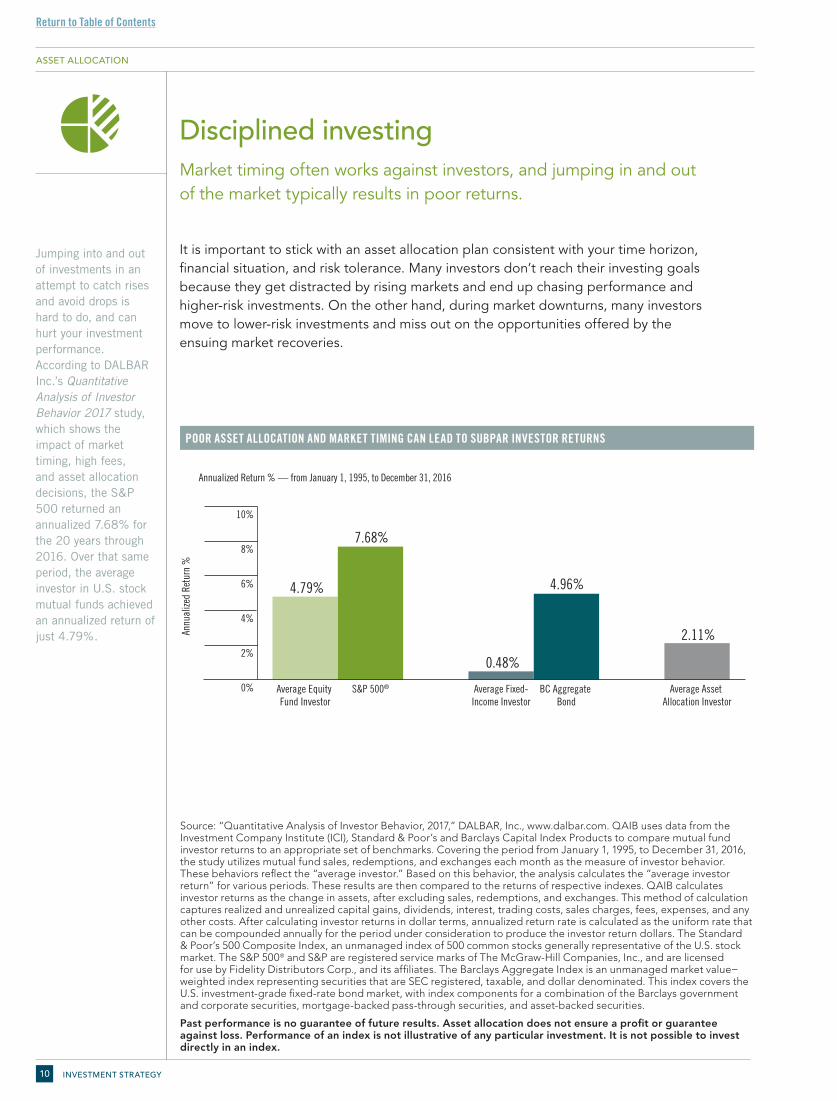
Disciplined investingMarket timing often works against investors, and jumping in and out of the market typically results in poor returns.
It is important to stick with an asset allocation plan consistent with your time horizon, financial situation, and risk tolerance. Many investors don’t reach their investing goals because they get distracted by rising markets and end up chasing performance and higher-risk investments. On the other hand, during market downturns, many investors move to lower-risk investments and miss out on the opportunities offered by the ensuing market recoveries.
Source: “Quantitative Analysis of Investor Behavior, 2017,” DALBAR, Inc., www.dalbar.com. QAIB uses data from the Investment Company Institute (ICI), Standard & Poor’s and Barclays Capital Index Products to compare mutual fund investor returns to an appropriate set of benchmarks. Covering the period from January 1, 1995, to December 31, 2016, the study utilizes mutual fund sales, redemptions, and exchanges each month as the measure of investor behavior. These behaviors reflect the “average investor.” Based on this behavior, the analysis calculates the “average investor return” for various periods. These results are then compared to the returns of respective indexes. QAIB calculates investor returns as the change in assets, after excluding sales, redemptions, and exchanges. This method of calculation captures realized and unrealized capital gains, dividends, interest, trading costs, sales charges, fees, expenses, and any other costs. After calculating investor returns in dollar terms, annualized return rate is calculated as the uniform rate that can be compounded annually for the period under consideration to produce the investor return dollars. The Standard & Poor’s 500 Composite Index, an unmanaged index of 500 common stocks generally representative of the U.S. stock market. The S&P 500® and S&P are registered service marks of The McGraw-Hill Companies, Inc., and are licensed for use by Fidelity Distributors Corp., and its affiliates. The Barclays Aggregate Index is an unmanaged market value−weighted index representing securities that are SEC registered, taxable, and dollar denominated. This index covers the U.S. investment-grade fixed-rate bond market, with index components for a combination of the Barclays government and corporate securities, mortgage-backed pass-through securities, and asset-backed securities.
Past performance is no guarantee of future results. Asset allocation does not ensure a profit or guarantee against loss. Performance of an index is not illustrative of any particular investment. It is not possible to invest directly in an index.
0%
2%
4%
6%
8%
10%
Average Asset Allocation Investor
BC Aggregate Bond
Average Fixed-Income Investor
S&P 500®Average Equity Fund Investor
Annualized Return % — from January 1, 1995, to December 31, 2016
7.68%
0.48%
4.96%
2.11%Annu
alize
d Re
turn
%
4.79%
POOR ASSET ALLOCATION AND MARKET TIMING CAN LEAD TO SUBPAR INVESTOR RETURNS
Jumping into and out of investments in an attempt to catch rises and avoid drops is hard to do, and can hurt your investment performance. According to DALBAR Inc.’s Quantitative Analysis of Investor Behavior 2017 study, which shows the impact of market timing, high fees, and asset allocation decisions, the S&P 500 returned an annualized 7.68% for the 20 years through 2016. Over that same period, the average investor in U.S. stock mutual funds achieved an annualized return of just 4.79%.
ASSET ALLOCATION
Return to Table of Contents
ASSET ALLOCATION 11
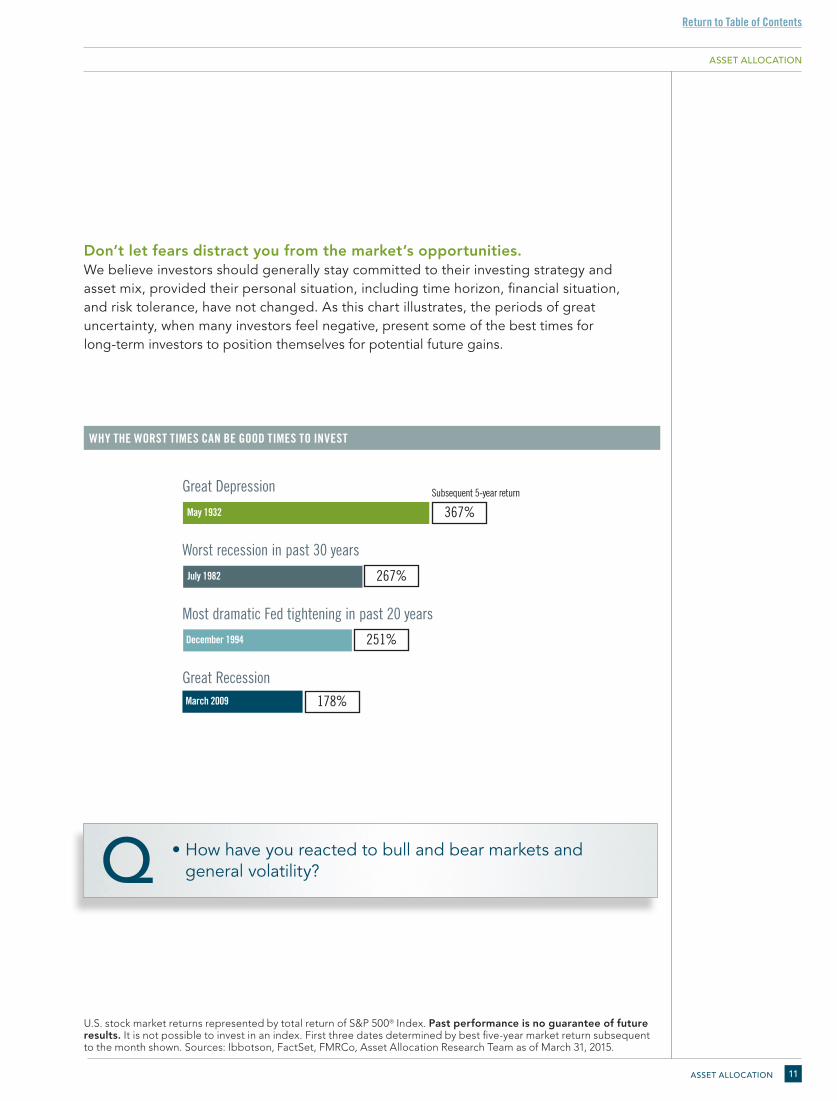
WHY THE WORST TIMES CAN BE GOOD TIMES TO INVEST
Great Depression
Worst recession in past 30 years
Most dramatic Fed tightening in past 20 years
Great Recession
May 1932
July 1982
December 1994
March 2009
Subsequent 5-year return
367%
267%
251%
178%
Don’t let fears distract you from the market’s opportunities.We believe investors should generally stay committed to their investing strategy and asset mix, provided their personal situation, including time horizon, financial situation, and risk tolerance, have not changed. As this chart illustrates, the periods of great uncertainty, when many investors feel negative, present some of the best times for long-term investors to position themselves for potential future gains.
U.S. stock market returns represented by total return of S&P 500® Index. Past performance is no guarantee of future results. It is not possible to invest in an index. First three dates determined by best five-year market return subsequent to the month shown. Sources: Ibbotson, FactSet, FMRCo, Asset Allocation Research Team as of March 31, 2015.
ASSET ALLOCATION
• How have you reacted to bull and bear markets and general volatility?Q
Return to Table of Contents
INVESTMENT STRATEGY12
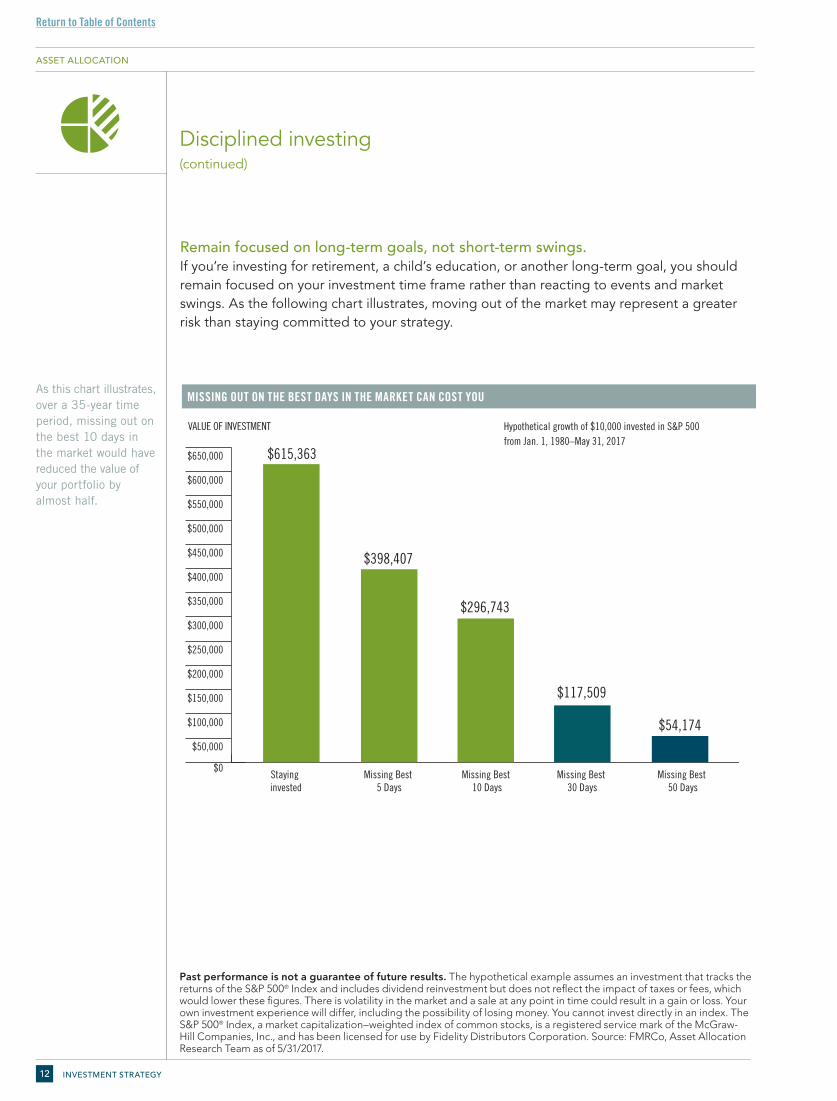
Remain focused on long-term goals, not short-term swings. If you’re investing for retirement, a child’s education, or another long-term goal, you should remain focused on your investment time frame rather than reacting to events and market swings. As the following chart illustrates, moving out of the market may represent a greater risk than staying committed to your strategy.
Past performance is not a guarantee of future results. The hypothetical example assumes an investment that tracks the returns of the S&P 500® Index and includes dividend reinvestment but does not reflect the impact of taxes or fees, which would lower these figures. There is volatility in the market and a sale at any point in time could result in a gain or loss. Your own investment experience will differ, including the possibility of losing money. You cannot invest directly in an index. The S&P 500® Index, a market capitalization–weighted index of common stocks, is a registered service mark of the McGraw-Hill Companies, Inc., and has been licensed for use by Fidelity Distributors Corporation. Source: FMRCo, Asset Allocation Research Team as of 5/31/2017.
MISSING OUT ON THE BEST DAYS IN THE MARKET CAN COST YOU
$0
$50,000
$100,000
$150,000
$200,000
$250,000
$300,000
$350,000
$400,000
$450,000
$500,000
$550,000
$600,000
$650,000
Missing Best 50 Days
Missing Best 30 Days
Missing Best 10 Days
Missing Best 5 Days
Staying invested
VALUE OF INVESTMENT Hypothetical growth of $10,000 invested in S&P 500 from Jan. 1, 1980–May 31, 2017
$615,363
$117,509
$54,174
$398,407
$296,743
Disciplined investing
(continued)
As this chart illustrates, over a 35-year time period, missing out on the best 10 days in the market would have reduced the value of your portfolio by almost half.
ASSET ALLOCATION
Return to Table of Contents
ASSET ALLOCATION 13
Managing your portfolioConstructing and maintaining your portfolio requires long-term commitment and attention to detail.
You should review your portfolio regularly — which may mean weekly, monthly, or quarterly. At a minimum, you need to review your financial situation, needs, and objectives annually to make sure your portfolio and positions are properly aligned with your goals.
Asset allocation does not ensure a profit or guarantee against a loss.
ASSET ALLOCATION
• How do you choose your investments?• How do you decide when and what to buy and sell?Q
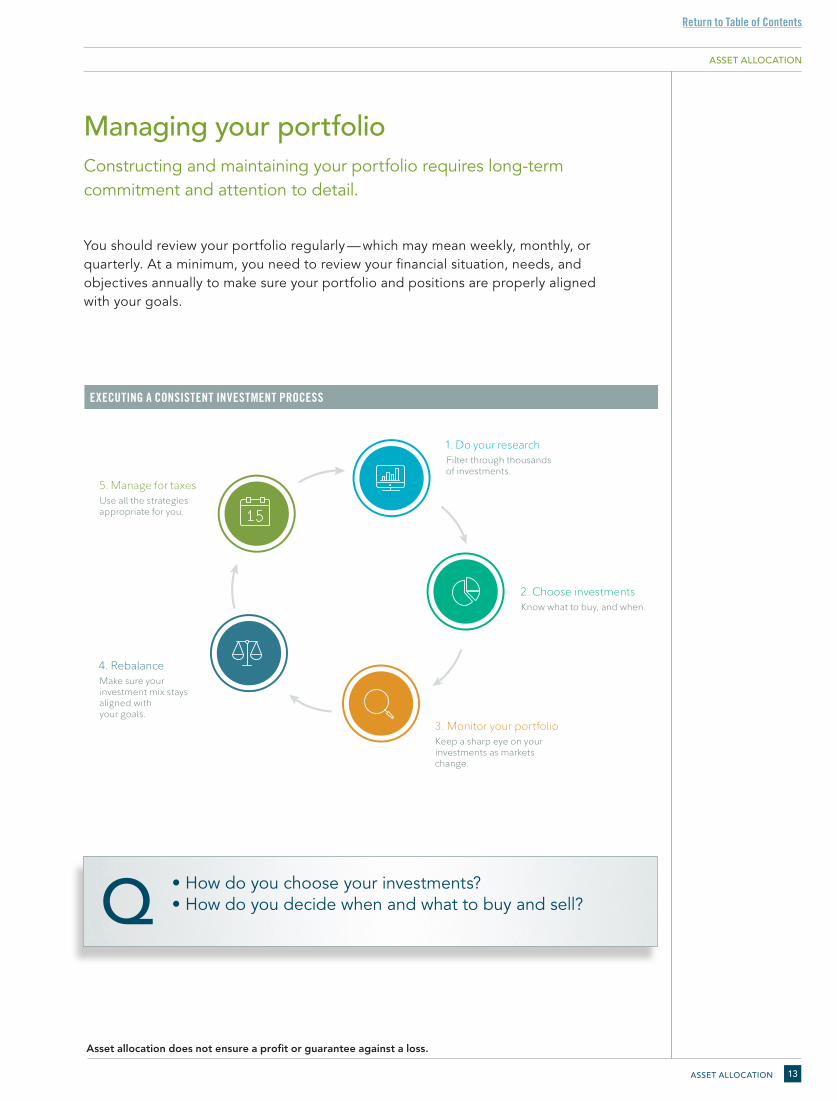
EXECUTING A CONSISTENT INVESTMENT PROCESS
1. Do your researchFilter through thousands of investments.
2. Choose investmentsKnow what to buy, and when.
3. Monitor your portfolioKeep a sharp eye on your investments as markets change.
4. Rebalance Make sure your investment mix stays aligned with your goals.
5. Manage for taxesUse all the strategies appropriate for you.
Return to Table of Contents
INVESTMENT STRATEGY14
Tax-efficient investing Taxes have the potential to significantly affect your investment returns.
One way to help reach your financial goals is to be tax smart with your investments. You can affect your tax bill by paying attention to how and where you generate investment income, dividends, interest, and capital gains and losses. There are three strategies you can use to try to manage the potential impact on your federal income taxes:
• Defer: Retirement savings accounts — including 401(k) and 403(b) plans, IRAs, health savings accounts (HSAs), and other tax-deferred products such as deferred annuities — all allow you to put off paying taxes.
• Manage: Using asset location strategies, investing in lower turnover funds, understanding mutual fund distributions, and taking advantage of charitable gifts and capital loss deductions can all help you manage your tax burden.
• Reduce: Consider tax-free investments, municipal bonds, HSAs, and college savings accounts to help reduce your taxes.
*Past performance is no guarantee of future results. This chart is for illustrative purposes only and does not represent actual or future performance of any investment option. Returns include the reinvestment of dividends and other earnings. Stocks are represented by the Ibbotson® Large Company Stock Index. The Ibbotson® Large Company Stock Index is represented by the S&P 500 Composite Index (S&P 500) from 1957 to present, and the S&P 90 from 1926–1956. Government bonds are represented by the 20-year U.S. government bond, cash by the 30-day U.S. Treasury bill, and inflation by the Consumer Price Index. The data assumes reinvestment of income and does not account for transaction costs. Please note that indexes are unmanaged and are not illustrative of any particular investment. It is not possible to invest directly in an index.© 2015 Morningstar, Inc. All rights reserved.
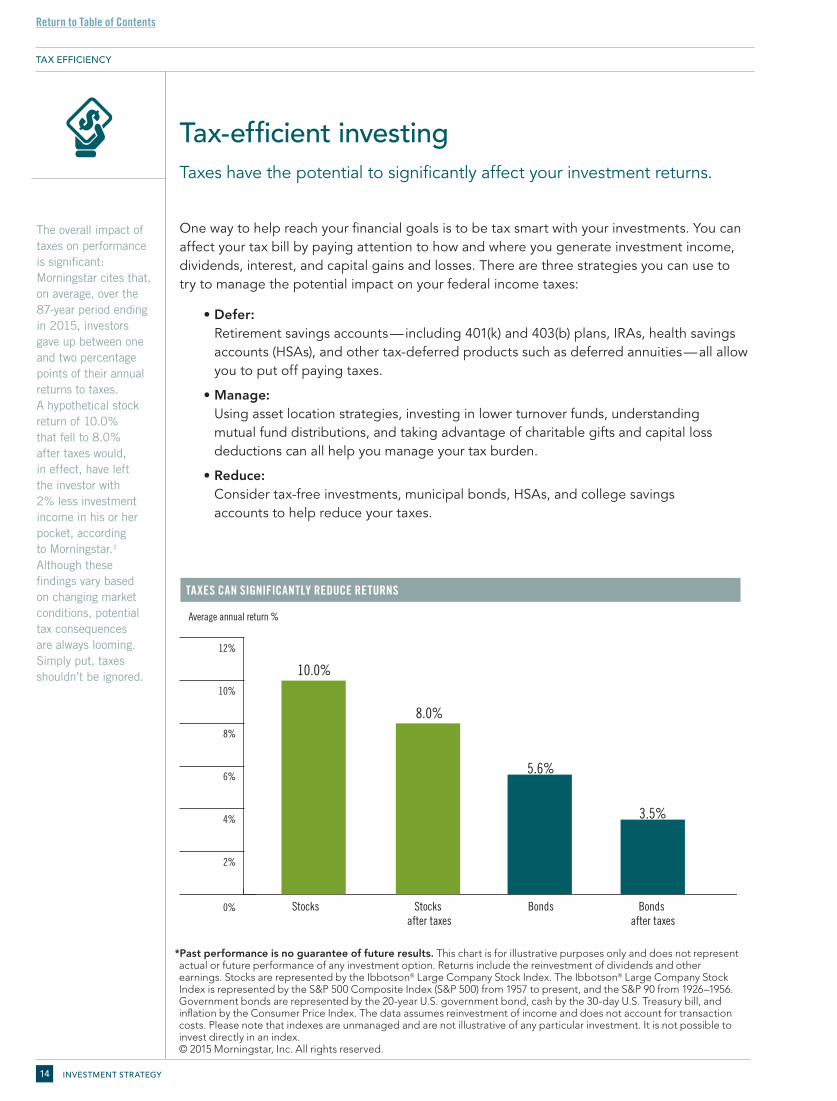
TAXES CAN SIGNIFICANTLY REDUCE RETURNS
The overall impact of taxes on performance is significant: Morningstar cites that, on average, over the 87-year period ending in 2015, investors gave up between one and two percentage points of their annual returns to taxes. A hypothetical stock return of 10.0% that fell to 8.0% after taxes would, in effect, have left the investor with 2% less investment income in his or her pocket, according to Morningstar.3 Although these findings vary based on changing market conditions, potential tax consequences are always looming. Simply put, taxes shouldn’t be ignored.
0%
2%
4%
6%
8%
10%
12%
Bonds after taxes
BondsStocks after taxes
Stocks
Average annual return %
10.0%
5.6%
3.5%
8.0%
TAX EFFICIENCY
Return to Table of Contents
TAX-EFFICIENT INVESTING 15
Asset location Place your investments where they may help enhance returns, in concert with your goals and overall portfolio.
With an asset location strategy, you position the most tax-efficient investments that typically generate the least taxable income — such as municipal bonds, low-turnover stock funds, or exchange-traded funds — in taxable accounts, because of their low- tax-generation characteristics.
Conversely, relatively tax-inefficient assets — such as taxable bonds, high-turnover stock funds, or real estate investment trusts — may be better kept in tax-advantaged accounts like 401(k) plans, IRAs, and tax-deferred variable annuities. Of course, you also need to consider your overall asset allocation and investment time frame before making any changes.
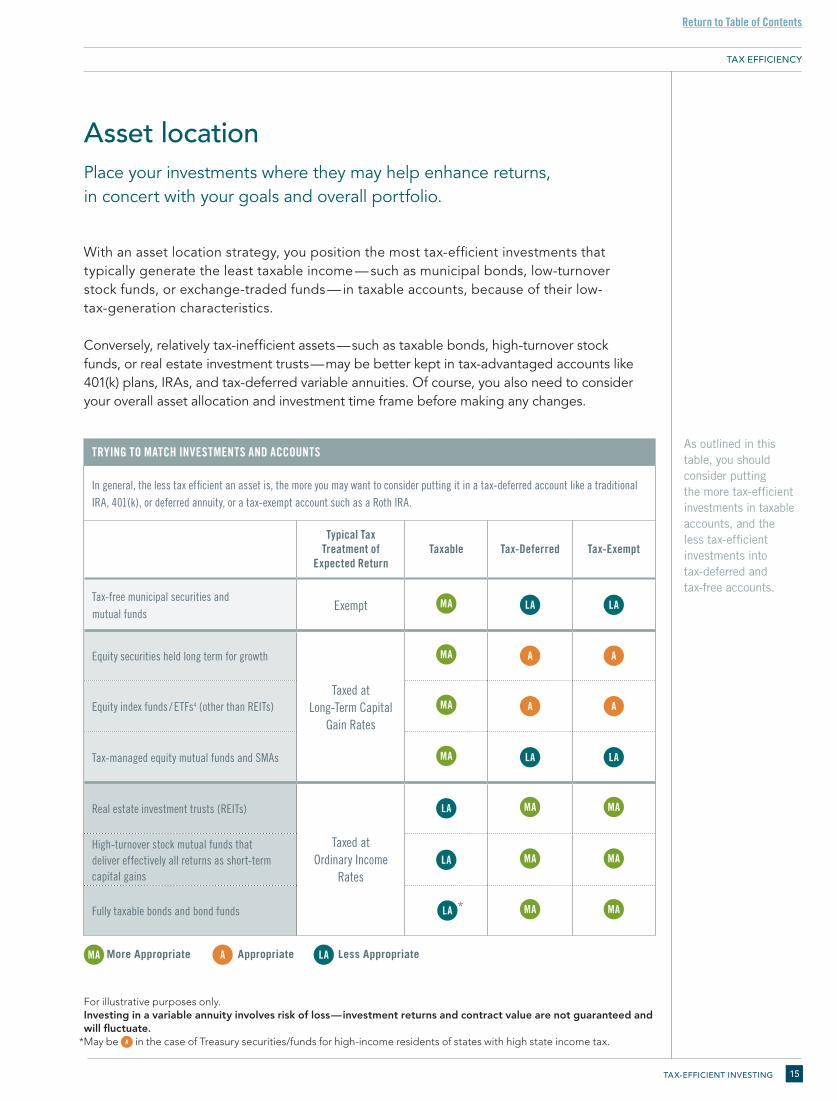
As outlined in this table, you should consider putting the more tax-efficient investments in taxable accounts, and the less tax-efficient investments into tax-deferred and tax-free accounts.
MA More Appropriate Appropriate Less AppropriateA LA
For illustrative purposes only.Investing in a variable annuity involves risk of loss — investment returns and contract value are not guaranteed and will fluctuate. *May be A in the case of Treasury securities/funds for high-income residents of states with high state income tax.
TRYING TO MATCH INVESTMENTS AND ACCOUNTS
In general, the less tax efficient an asset is, the more you may want to consider putting it in a tax-deferred account like a traditional IRA, 401(k), or deferred annuity, or a tax-exempt account such as a Roth IRA.
Typical Tax Treatment of
Expected ReturnTaxable Tax-Deferred Tax-Exempt
Tax-free municipal securities and mutual funds
Exempt MA LA LA
Equity securities held long term for growth
Taxed at Long-Term Capital
Gain Rates
MA A A
Equity index funds / ETFs4 (other than REITs) MA A A
Tax-managed equity mutual funds and SMAs MA LA LA
Real estate investment trusts (REITs)
Taxed at Ordinary Income
Rates
LA MA MA
High-turnover stock mutual funds that deliver effectively all returns as short-term capital gains
LA MA MA
Fully taxable bonds and bond funds LA * MA MA
TAX EFFICIENCY
Return to Table of Contents
INVESTMENT STRATEGY16
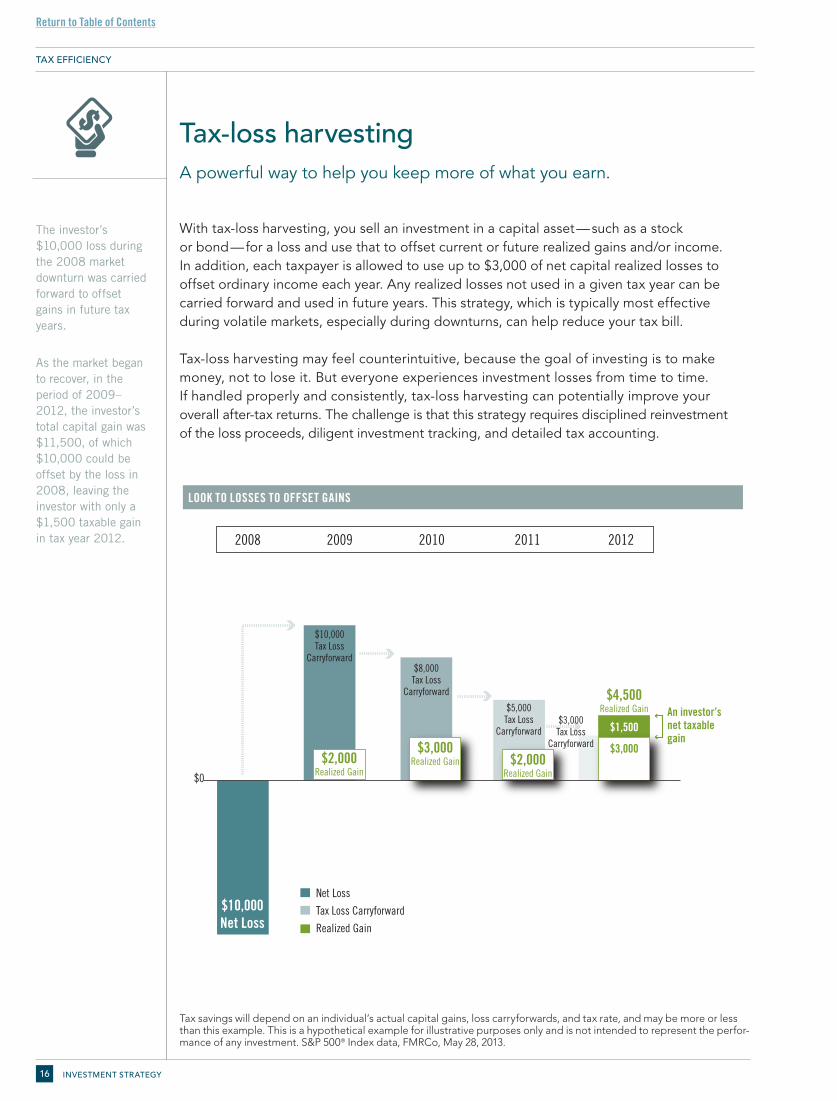
Tax-loss harvesting A powerful way to help you keep more of what you earn.
With tax-loss harvesting, you sell an investment in a capital asset — such as a stock or bond — for a loss and use that to offset current or future realized gains and/or income. In addition, each taxpayer is allowed to use up to $3,000 of net capital realized losses to offset ordinary income each year. Any realized losses not used in a given tax year can be carried forward and used in future years. This strategy, which is typically most effective during volatile markets, especially during downturns, can help reduce your tax bill.
Tax-loss harvesting may feel counterintuitive, because the goal of investing is to make money, not to lose it. But everyone experiences investment losses from time to time. If handled properly and consistently, tax-loss harvesting can potentially improve your overall after-tax returns. The challenge is that this strategy requires disciplined reinvestment of the loss proceeds, diligent investment tracking, and detailed tax accounting.
Tax savings will depend on an individual’s actual capital gains, loss carryforwards, and tax rate, and may be more or less than this example. This is a hypothetical example for illustrative purposes only and is not intended to represent the perfor-mance of any investment. S&P 500® Index data, FMRCo, May 28, 2013.
LOOK TO LOSSES TO OFFSET GAINS
The investor’s $10,000 loss during the 2008 market downturn was carried forward to offset gains in future tax years.
As the market began to recover, in the period of 2009–2012, the investor’s total capital gain was $11,500, of which $10,000 could be offset by the loss in 2008, leaving the investor with only a $1,500 taxable gain in tax year 2012.
$0
2008 2009 2010 2011 2012
$10,000Net Loss
Net Loss
Tax Loss Carryforward
Realized Gain
An investor’snet taxable gain
$1,500
$3,000Realized Gain $2,000
Realized Gain
$4,500Realized Gain
$10,000Tax Loss
Carryforward$8,000
Tax LossCarryforward
$5,000Tax Loss
Carryforward
$2,000Realized Gain
$3,000
$3,000Tax Loss
Carryforward
TAX EFFICIENCY
Return to Table of Contents
TAX-EFFICIENT INVESTING 17
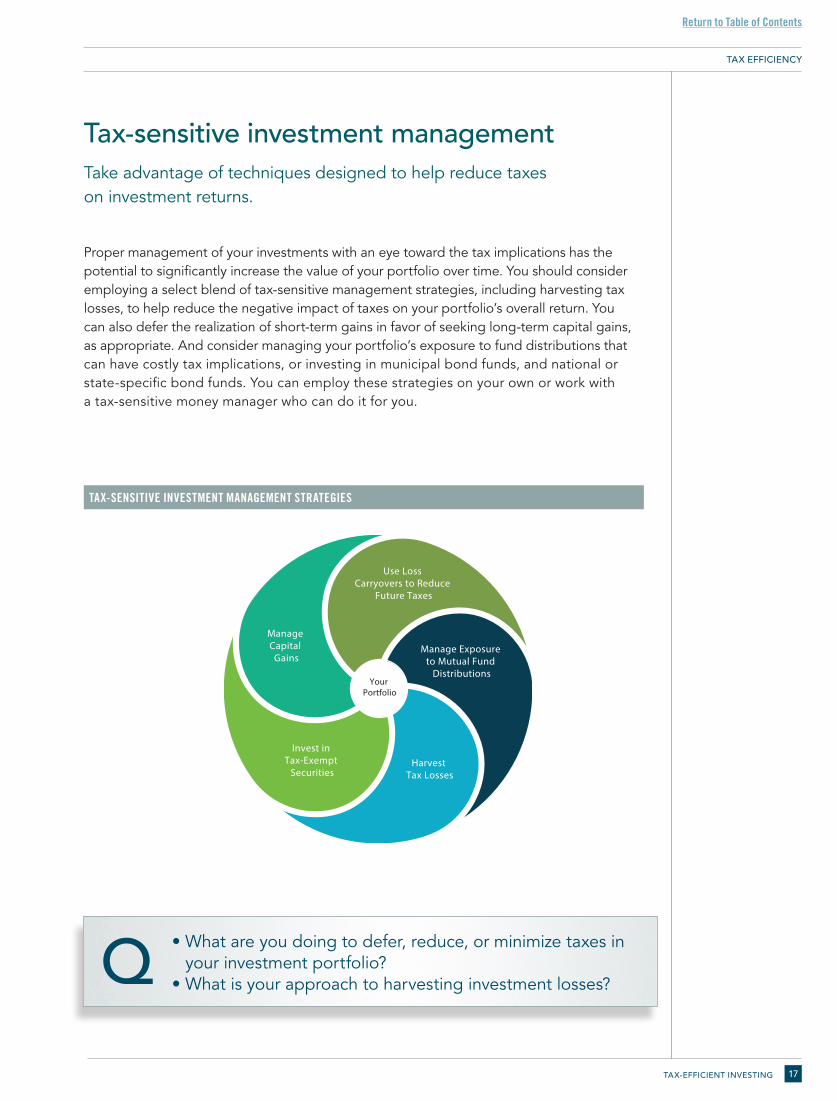
Tax-sensitive investment managementTake advantage of techniques designed to help reduce taxes on investment returns.
Proper management of your investments with an eye toward the tax implications has the potential to significantly increase the value of your portfolio over time. You should consider employing a select blend of tax-sensitive management strategies, including harvesting tax losses, to help reduce the negative impact of taxes on your portfolio’s overall return. You can also defer the realization of short-term gains in favor of seeking long-term capital gains, as appropriate. And consider managing your portfolio’s exposure to fund distributions that can have costly tax implications, or investing in municipal bond funds, and national or state-specific bond funds. You can employ these strategies on your own or work with a tax-sensitive money manager who can do it for you.
TAX-SENSITIVE INVESTMENT MANAGEMENT STRATEGIES
TAX EFFICIENCY
• What are you doing to defer, reduce, or minimize taxes in your investment portfolio?
• What is your approach to harvesting investment losses?Q
Manage Capital
Gains
Invest in Tax-Exempt
SecuritiesHarvest
Tax Losses
Manage Exposure to Mutual Fund
DistributionsYour
Portfolio
Use Loss Carryovers to Reduce
Future Taxes
Return to Table of Contents

Your next stepsWe have developed this discussion guide as part of Fidelity Viewpoints®, an exclusive program that enables you to take advantage of our latest thinking on the financial markets, investing ideas, and other tips for personal finance. You have access to Fidelity’s resources, solutions, and services — including our informational and educational videos, seminars, and webinars — to help evaluate and refine your investment strategy.
Working together with you, we’ll take the following four steps to help you put your specific investment strategies to work, to help you reach your family’s goals:
NEXT STEPS18
Review your overall portfolio positioning with the help of our Fidelity Guided Portfolio SummarySM (Fidelity GPSSM).5
Determine the appropriate asset allocation for
your accounts with the help of the Planning &
Guidance Center.6,7
❑ Fidelity mutual funds and Fidelity® FundsNetwork®
❑ Professionally managed accounts with Fidelity Portfolio Advisory Service® and Fidelity® Personalized Portfolios8
❑ Fixed Deferred Annuities9
❑ Fidelity Personal Retirement Annuity® 10
❑ Stock research and trading11
❑ Fixed-income research and trading11
❑ Advanced planning and investment services through Fidelity Private Wealth Management®12 and Fidelity Wealth Advisor Solutions®13 programs
Set up regular check-ins to review your portfolio.
Put your strategy in motion with select investments and solutions aligned to your needs, including:
2
3
1
4
Completed
Return to Table of Contents
NEXT STEPS 19
Fidelity does not provide legal or tax advice. The information herein is general and educational in nature and should not be considered legal or tax advice. Tax laws and regulations are complex and subject to change, which can materially impact investment results. Fidelity cannot guarantee that the information herein is accurate, complete, or timely. Fidelity makes no warranties with regard to such information or results obtained by its use, and disclaims any liability arising out of your use of, or any tax position taken in reliance on, such information. Consult an attorney or tax professional regarding your specific situation.
1 Strategic Advisers, Inc. (SAI), applies tax-sensitive investment management techniques in connection with Fidelity Personalized Portfolios (including “tax-loss harvesting”) on a limited basis, at its discretion, primarily with respect to determining when assets in a client’s account should be bought or sold. As a discretionary investment manager, SAI may elect to sell assets in an account at any time. A client may have a gain or loss when assets are sold. SAI does not currently invest in tax-deferred products, such as variable insurance products or tax-managed funds, but may do so in the future if it deems such to be appropriate for a client. SAI does not actively manage for alternative minimum taxes; state or local taxes; foreign taxes on non-U.S. investments; or estate, gift, or generation-skipping transfer taxes. SAI relies on information provided by clients in an effort to provide tax-sensitive investment management, and does not offer tax advice. SAI can make no guarantees as to the effectiveness of the tax-sensitive investment management techniques applied in serving to reduce or minimize a client’s overall tax liabilities or as to the tax results that may be generated by a given transaction. Clients are responsible for all tax liabilities arising from transactions in their accounts, for the adequacy and accuracy of any positions taken on tax returns, for the actual filing of tax returns, and for the remittance of tax payments to taxing authorities.
2 See Gary P. Brinson, L. Randolph Hood, and Gilbert L. Beebower, 1986, “Determinants of Portfolio Performance,” Financial Analysts Journal vol. 42 (4), July/August, pages 39–44 (reprint, 1995, Financial Analysts Journal 51 (1), pages 133–138, 50th Anniversary Issue). Gary P. Brinson, Brian D. Singer, and Gilbert L. Beebower, 1991, “Determinants of Portfolio Performance II: An Update,” Financial Analysts Journal 47 (3), pages 40–48. Roger G. Ibbotson and Paul D. Kaplan, 2000, “Does Asset Allocation Policy Explain 40, 90, or 100 Percent of Performance?”, Financial Analysts Journal 56 (1), pages 26–33.
3 Taxes Can Significantly Reduce Returns data, Morningstar, Inc., 2014. Federal income tax is calculated using the historical marginal and capital gains tax rates for a single taxpayer earning $110,000 in 2010 dollars every year. This annual income is adjusted using the Consumer Price Index in order to obtain the corresponding income level for each year. Income is taxed at the appropriate federal income tax rate as it occurs. When realized, capital gains are calculated assuming the appropriate capital gains rates. The holding period for capital gains tax calculation is assumed to be five years for stocks, while government bonds are held until replaced in the index. No state income taxes are included. Stock values fluctuate in response to the activities of individual companies and general market and economic conditions. Generally, among asset classes stocks are more volatile than bonds or short-term instruments. Government bonds and corporate bonds have more moderate short-term price fluctuations than stocks, but provide lower potential long-term returns. U.S. Treasury bills maintain a stable value if held to maturity, but returns are generally only slightly above the inflation rate. Although bonds generally present less short-term risk and volatility than stocks, bonds do entail interest rate risk (as interest rates rise, bond prices usually fall, and vice versa), issuer credit risk, and the risk of default, or the risk that an issuer will be unable to make income or principal payments. The effect of interest rate changes is usually more pronounced for longer-term securities. Additionally, bonds and short-term investments entail greater inflation risk, or the risk that the return of an investment will not keep up with increases in the prices of goods and services, than stocks.
4 ETFs may trade at a premium or discount to their NAV and are subject to the market fluctuations of their underlying invest ments. ETFs are subject to management fees and other expenses. Effective September 30, 2013, any eligible iShares® ETFs purchased commission free must be held for a minimum of 30 calendar days or a short-term trading fee will apply.
5 Fidelity Guided Portfolio SummarySM (Fidelity GPSSM) is provided for educational purposes only and is not intended to provide legal, tax, investment, or insurance advice, nor should it be construed as an offer to sell, a solicitation of an offer to buy, or a recommendation for any security by Fidelity or any third party. You are solely responsible for determining whether any investment, investment strategy, security, or related transaction is appropriate for you based on your personal investment objectives, financial circumstances, and risk tolerance. You should consult your legal or tax professional regarding your specific situation.
6 This information is intended to be educational and is not tailored to the investment needs of any specific investor.7 IMPORTANT: The projections or other information generated by Fidelity’s Planning & Guidance Center Retirement Analysis, regarding the
likelihood of various investment outcomes, is hypothetical in nature, does not reflect actual investment results, and is not a guarantee of future results. Results may vary with each use and over time.
8 Fidelity Portfolio Advisory Service® is a service of Strategic Advisers, Inc., a registered investment adviser and a Fidelity Investments company. Fidelity Private Portfolio Service® may be offered through the following Fidelity Investments companies: Strategic Advisers, Inc.; Fidelity Personal Trust Company, FSB (“FPT”), a federal savings bank; or Fidelity Management Trust Company (“FMTC”). Nondeposit investment products and trust services offered through FPT and FMTC and their affiliates are not insured or guaranteed by the Federal Deposit Insurance Corporation or any other government agency, are not obligations of any bank, and are subject to risk, including possible loss of principal. These services provide discretionary money management for a fee.
9 Fixed annuities available at Fidelity are issued by third-party insurance companies, which are not affiliated with any Fidelity Investments company. These products are distributed by Fidelity Insurance Agency, Inc., and, for certain products, by Fidelity Brokerage Services, member NYSE and SIPC. A contract’s financial guarantees are solely the responsibility of and are subject to the claims-paying ability of the issuing insurance company.
10 Fidelity Personal Retirement Annuity® (Policy Form No. DVA-2005 et al.) is issued by Fidelity Investments Life Insurance Company, 100 Salem Street, Smithfield, RI 02917, and, for New York residents, Personal Retirement Annuity (Policy Form No. EDVA-2005 et al.) is issued by Empire Fidelity Investments Life Insurance Company®, New York, NY. FILI is licensed in all states except New York. Fidelity Brokerage Services, member NYSE and SIPC, and Fidelity Insurance Agency, Inc., are the distributors. A contract’s financial guarantees are subject to the claims-paying ability of the issuing insurance company.
11 Research is provided for informational purposes only, does not constitute advice or guidance, nor is it an endorsement or recommendation for any particular security or trading strategy. Research is provided by independent companies not affiliated with Fidelity. Please determine which security, product, or service is right for you based on your investment objectives, risk tolerance, and financial situation. Be sure to review your decisions periodically to make sure they are still consistent with your goals.
12 Fidelity Private Wealth Management® is a service of Strategic Advisers Inc., a registered investment adviser and a Fidelity Investments company. This service provides nondiscretionary investment advisory services for a fee.
13 Fidelity Wealth Advisor Solutions® program (“Program”) is provided without charge as a convenience to you by Strategic Advisers, Inc. (SAI), a Fidelity Investments company. In no event shall SAI’s providing the names of one or more registered investment advisors (RIAs) constitute an endorsement, recommendation, or opinion as to the quality or appropriateness of the RIA or the related advisory services. SAI acts as solicitor to the RIAs in the Program, and receives solicitation fees from the RIAs as a result of their participation. RIAs are not affiliated with or agents of SAI or any other Fidelity Investments company, but they are Fidelity Investments customers and their clients compensate Fidelity Investments for custody, clearing, or other brokerage services. You must conduct the evaluation and due diligence you deem necessary to determine whether an RIA and any related advisory services are suitable for your needs. You are under no obligation to contact or engage any RIA.
Fidelity, Fidelity Investments, and the Fidelity Investments and pyramid design logo are registered service marks of FMR LLC.Clearing, custody, or other brokerage services may be provided by National Financial Services LLC or Fidelity Brokerage Services LLC, Members NYSE, SIPC. Both are Fidelity Investments companies.
Before investing, consider the investment objectives, risks, charges, and expenses of the fund or annuity and its investment options. Contact Fidelity for a prospectus or, if available, a summary prospectus containing this information. Read it carefully.
Return to Table of Contents

FIDELITY INVESTMENTS00
ASSET ALLOCATION STANDARDS
P
© 2017 FMR LLC. All rights reserved. 678562.7.0 1.9859233.105
900 SALEM STREET SMITHFIELD, RHODE ISL AND 02917