Embed Size (px)
Citation preview
CHAPTeR 7
INVESTMENT, SAVINGS, AND fINANCE
7.1 introduction
Rapid and sustained economic growth requires adequate investment. The economic history of Asia over the past 50 years bears testimony to this inexorable fact. All fast-growing economies made large investments in new factories and plants, as well as physical infrastructure such as roads, railways, ports, power plants and transmission lines, urban water supply, and telecommunications, often provided or supported by the government (Chapter 8). These investments increased productive capacity, raised labor productivity, facilitated technical progress, accelerated economic growth, and improved living standards.
Asia’s high investments were financed largely by domestic savings—by households, corporations, and governments. In many countries, external financing also played an important role. Bilateral official development assistance and multilateral development bank funding were essential especially in the early stages of development (Chapter 14). Foreign direct investment (FDI) became the largest source of external finance after countries began liberalizing inward investment (Chapter 9). Remittances from overseas workers have also provided a stable source of financing in some countries.
226 | ASIA’S JOURNeY TO PROSPeRITY—CHAPTeR 7
Asia’s bank-based financial system played a critical role in channeling domestic savings to domestic investment. More recently, capital markets have grown significantly to provide long-term financing, especially since the 1997–1998 Asian financial crisis.
This chapter examines the patterns of investment, savings, and finance in developing Asia during the past 50 years of rapid growth and transformation. Section 7.2 describes Asia’s rapid capital accumulation, including investment in productive capacity and infrastructure. Section 7.3 looks at savings by households, corporations, and governments as sources of domestic investment financing, and their corresponding policy and institutional drivers. Section 7.4 focuses on sources of external financing. Section 7.5 examines the role of Asia’s financial system in channeling savings to investment, including the roles of banks, capital markets, and small and medium-sized enterprise (SME) finance. Section 7.6 briefly discusses the future challenges of investment, savings, and finance in Asia.
7.2 asia’s rapid capital accumulation
In the 1960s, most Asian economies had low investment rates—investment as a share of gross domestic product (GDP). The average gross investment rate for the region was 20.3%, comparable to Latin America and the Caribbean (Appendix 12). Only a few economies had gross investment rates exceeding 20%, including Hong Kong, China; the People’s Republic of China (PRC); the Philippines; and Taipei,China.
Over the following several decades, however, there was a significant increase in investment rates across Asia. By the 2010s, developing Asia’s average gross investment rate was 38.9%, almost double the levels of Latin America and the Caribbean, and the Organisation for Economic Co-operation and Development (OECD). The rate was highest for East Asia (42.9%), driven by the PRC, followed by South Asia (32.2%), Southeast Asia (28.6%), and Central Asia (26.9%).1
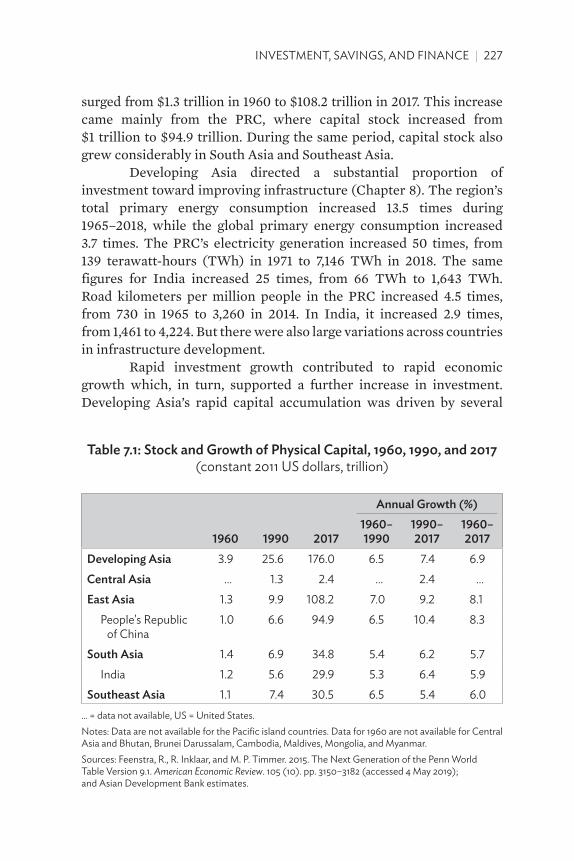
These rapidly rising investment rates led to a significant expansion of developing Asia’s capital stock, from $3.9 trillion in 1960 to $176 trillion in 2017 (in constant 2011 United States [US] dollars), growing by 6.9% annually (Table 7.1). While all developing Asian subregions (except the Pacific where data are not available) had significant increases, it was most pronounced in East Asia, where it
1 World Bank. World Development Indicators. https://data.worldbank.org (accessed 2 August 2019).
INVeSTMeNT, SAVINGS, AND FINANCe | 227
surged from $1.3 trillion in 1960 to $108.2 trillion in 2017. This increase came mainly from the PRC, where capital stock increased from $1 trillion to $94.9 trillion. During the same period, capital stock also grew considerably in South Asia and Southeast Asia.
Developing Asia directed a substantial proportion of investment toward improving infrastructure (Chapter 8). The region’s total primary energy consumption increased 13.5 times during 1965–2018, while the global primary energy consumption increased 3.7 times. The PRC’s electricity generation increased 50 times, from 139 terawatt-hours (TWh) in 1971 to 7,146 TWh in 2018. The same figures for India increased 25 times, from 66 TWh to 1,643 TWh. Road kilometers per million people in the PRC increased 4.5 times, from 730 in 1965 to 3,260 in 2014. In India, it increased 2.9 times, from 1,461 to 4,224. But there were also large variations across countries in infrastructure development.
Rapid investment growth contributed to rapid economic growth which, in turn, supported a further increase in investment. Developing Asia’s rapid capital accumulation was driven by several
Table 7.1: stock and growth of Physical Capital, 1960, 1990, and 2017 (constant 2011 US dollars, trillion)
annual growth (%)
1960 1990 20171960–1990
1990–2017
1960–2017
Developing asia 3.9 25.6 176.0 6.5 7.4 6.9Central asia … 1.3 2.4 … 2.4 …east asia 1.3 9.9 108.2 7.0 9.2 8.1
People's Republic of China
1.0 6.6 94.9 6.5 10.4 8.3
south asia 1.4 6.9 34.8 5.4 6.2 5.7India 1.2 5.6 29.9 5.3 6.4 5.9
southeast asia 1.1 7.4 30.5 6.5 5.4 6.0... = data not available, US = United States.Notes: Data are not available for the Pacific island countries. Data for 1960 are not available for Central Asia and Bhutan, Brunei Darussalam, Cambodia, Maldives, Mongolia, and Myanmar.Sources: Feenstra, R., R. Inklaar, and M. P. Timmer. 2015. The Next Generation of the Penn world Table Version 9.1. American Economic Review. 105 (10). pp. 3150–3182 (accessed 4 May 2019); and Asian Development Bank estimates.
228 | ASIA’S JOURNeY TO PROSPeRITY—CHAPTeR 7
factors. In many countries, investment was propelled by a strong push for industrialization. In the 1960s and 1970s, industrialization was often led or promoted by governments. They emphasized heavy industries that were capital-intensive and required large outlays of capital investment. State-owned enterprises often played a critical role in these investments, although private sector investment was also important, especially in the newly industrialized economies (NIEs) of Hong Kong, China; the Republic of Korea (ROK); Singapore; and Taipei,China.
Since the 1980s and especially the 1990s, most Asian economies have implemented market-oriented reforms that led to a surge in investment by the private sector. The PRC began market-oriented reforms and introduced an open-door policy from the late 1970s, followed by an upsurge in private investment—from 12.2% of total fixed asset investment value in 1995 to 14% in 2000 and 61% in 2018.2 India started economic liberalization from 1991 and experienced a similar rise in gross capital formation by the private sector—from 10% of GDP in 1980 to 15% in 1990, 17% in 2000, and 21% in 2017.
Foreign investors also played an important role in driving investment in many Asian economies, especially over the past 2 to 3 decades. From the 1980s, many foreign companies came to Asia to produce goods for developed markets, later focusing on local markets as well. Since the mid-1980s, developing Asia has seen inward FDI grow rapidly, following the introduction of market reforms that allowed easier FDI entry, initially from Japan and other developed economies, and increasingly from the NIEs and the PRC. These FDI inflows were not disrupted by the Asian financial crisis. In 2017, the region continued to be the world’s top recipient of FDI, accounting for 35% of the global total, with the PRC as the top destination (Chapter 9).
7.3 Domestic savings provided the bulk of investment financing
Asia’s high investment was financed mainly through domestic savings by households, corporations, and governments, although external financing was an important supplement.
In theory, with perfect capital mobility and information, domestic investment may not depend on domestic savings because it can be financed by external capital. But country experiences in and
2 National Bureau of Statistics of China. 1995, 2000, and 2018. Statistical Communiqué on the National Economic and Social Development. Beijing.
INVeSTMeNT, SAVINGS, AND FINANCe | 229
outside Asia show that countries with high savings, tend to have high investment, which, in turn, leads to high growth.3
Aggregate savings
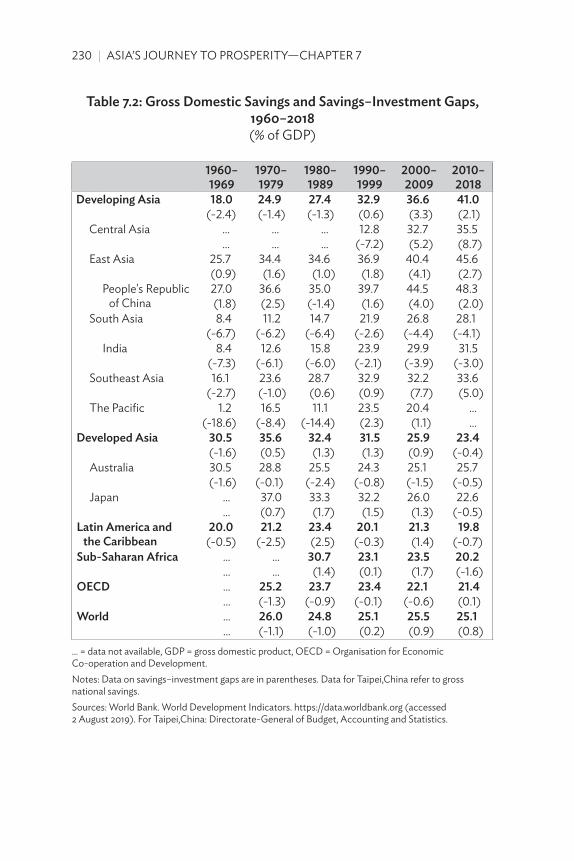
In the 1960s, developing Asia’s gross domestic savings rate averaged 18.0% of GDP, the lowest among regions globally (Table 7.2). The savings rate was also lower than the investment rate (resulting in a current account deficit) by 2.4 percentage points, meaning a portion of domestic investment was funded by external financing. Over time, developing Asia’s savings rate increased significantly. From the 1990s, domestic savings exceeded domestic investment, and developing Asia as a whole became a net saver (current account surplus). In the 2010s, the region’s average gross domestic savings rate reached 41%, primarily driven by a rapidly rising rate in the PRC (48.3%). The excess of gross domestic savings over investment reached 3.3% of the region’s GDP in the 2000s, before moderating to 2.1% in the 2010s after the global financial crisis.
During the past half century, East Asia was mostly a net saver, except for several years in the early 1960s, late 1970s, and early 1980s. However, South Asia has consistently been a net borrower, with its savings–investment gap at 6.7% of GDP in the 1960s; it has declined in recent years, but remained at more than 4% of GDP, on average, in the 2000s and 2010s. Southeast Asia was primarily a net borrower before the 1997–1998 Asian financial crisis; it became a consistent net saver afterward. The Pacific was also a net borrower in most years, except the 1990s, when it posted net savings mainly due to resource-rich Papua New Guinea. Most Pacific island countries still struggle to mobilize sufficient domestic resources to finance substantial infrastructure needs (section 7.4). Central Asia was a net borrower after independence in the 1990s, but has become a net saver since 2002 (except in 2016), also driven by resource-rich countries such as Azerbaijan, Kazakhstan, and Turkmenistan. Since the late 1990s, developing Asia’s high net savings was reflected in large current account surpluses (Box 7.1).
There are three principal sources of domestic savings: households, corporations, and the government. Household savings are part of the disposable income that is not consumed. Gross corporate savings mainly comprise retained earnings (after corporate tax and
3 Feldstein, M., and C. Horioka. 1980. Domestic Saving and International Capital Flows. The Economic Journal. 90 (June). pp. 314–329.
230 | ASIA’S JOURNeY TO PROSPeRITY—CHAPTeR 7
Table 7.2: gross Domestic savings and savings–investment gaps, 1960–2018(% of GDP)
1960–1969
1970–1979
1980–1989
1990–1999
2000–2009
2010–2018
Developing asia 18.0 24.9 27.4 32.9 36.6 41.0(-2.4) (-1.4) (-1.3) (0.6) (3.3) (2.1)
Central Asia ... ... ... 12.8 32.7 35.5... ... ... (-7.2) (5.2) (8.7)
east Asia 25.7 34.4 34.6 36.9 40.4 45.6(0.9) (1.6) (1.0) (1.8) (4.1) (2.7)
People's Republic of China
27.0 36.6 35.0 39.7 44.5 48.3(1.8) (2.5) (-1.4) (1.6) (4.0) (2.0)
South Asia 8.4 11.2 14.7 21.9 26.8 28.1(-6.7) (-6.2) (-6.4) (-2.6) (-4.4) (-4.1)
India 8.4 12.6 15.8 23.9 29.9 31.5(-7.3) (-6.1) (-6.0) (-2.1) (-3.9) (-3.0)
Southeast Asia 16.1 23.6 28.7 32.9 32.2 33.6(-2.7) (-1.0) (0.6) (0.9) (7.7) (5.0)
The Pacific 1.2 16.5 11.1 23.5 20.4 ...(-18.6) (-8.4) (-14.4) (2.3) (1.1) ...
Developed asia 30.5 35.6 32.4 31.5 25.9 23.4(-1.6) (0.5) (1.3) (1.3) (0.9) (-0.4)
Australia 30.5 28.8 25.5 24.3 25.1 25.7(-1.6) (-0.1) (-2.4) (-0.8) (-1.5) (-0.5)
Japan ... 37.0 33.3 32.2 26.0 22.6... (0.7) (1.7) (1.5) (1.3) (-0.5)
latin america and the Caribbean
20.0 21.2 23.4 20.1 21.3 19.8(-0.5) (-2.5) (2.5) (-0.3) (1.4) (-0.7)
sub-saharan africa ... ... 30.7 23.1 23.5 20.2... ... (1.4) (0.1) (1.7) (-1.6)
oeCD ... 25.2 23.7 23.4 22.1 21.4... (-1.3) (-0.9) (-0.1) (-0.6) (0.1)
World ... 26.0 24.8 25.1 25.5 25.1... (-1.1) (-1.0) (0.2) (0.9) (0.8)
... = data not available, GDP = gross domestic product, OeCD = Organisation for economic Co-operation and Development. Notes: Data on savings–investment gaps are in parentheses. Data for Taipei,China refer to gross national savings. Sources: world Bank. world Development Indicators. https://data.worldbank.org (accessed 2 August 2019). For Taipei,China: Directorate-General of Budget, Accounting and Statistics.
INVeSTMeNT, SAVINGS, AND FINANCe | 231
box 7.1: asian savings and global imbalances
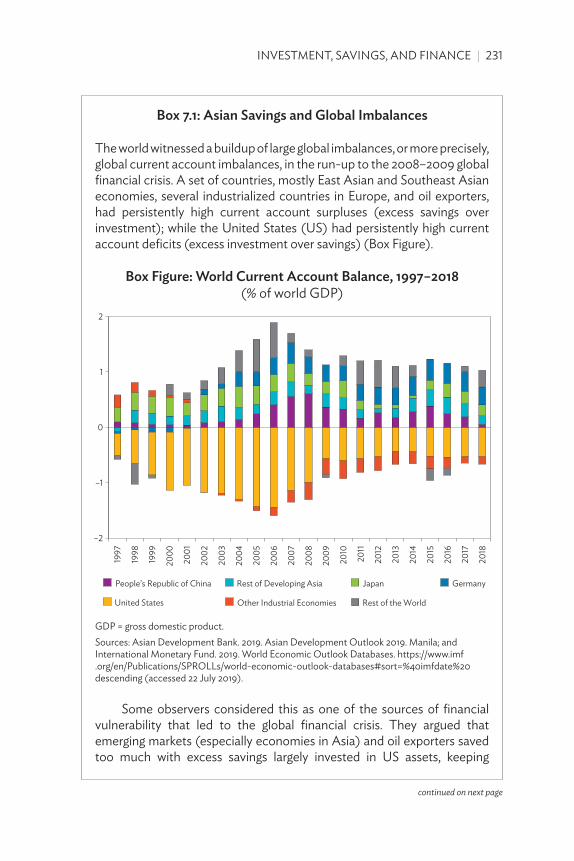
The world witnessed a buildup of large global imbalances, or more precisely, global current account imbalances, in the run-up to the 2008–2009 global financial crisis. A set of countries, mostly east Asian and Southeast Asian economies, several industrialized countries in europe, and oil exporters, had persistently high current account surpluses (excess savings over investment); while the United States (US) had persistently high current account deficits (excess investment over savings) (Box Figure).
box Figure: World Current account balance, 1997–2018 (% of world GDP)
–2
–1
0
1
2
1997
1998
1999
2000
2001
2002
2003
2004
2005
2006
2007
2008
2009
2010
2011
2012
2013
2014
2015
2016
2017
2018
People’s Republic of China Rest of Developing Asia Japan Germany
United States Other Industrial Economies Rest of the World
GDP = gross domestic product.Sources: Asian Development Bank. 2019. Asian Development Outlook 2019. Manila; and International Monetary Fund. 2019. world economic Outlook Databases. https://www.imf .org/en/Publications/SPROlls/world-economic-outlook-databases#sort=%40imfdate%20descending (accessed 22 July 2019).
Some observers considered this as one of the sources of financial vulnerability that led to the global financial crisis. They argued that emerging markets (especially economies in Asia) and oil exporters saved too much with excess savings largely invested in US assets, keeping
continued on next page
232 | ASIA’S JOURNeY TO PROSPeRITY—CHAPTeR 7
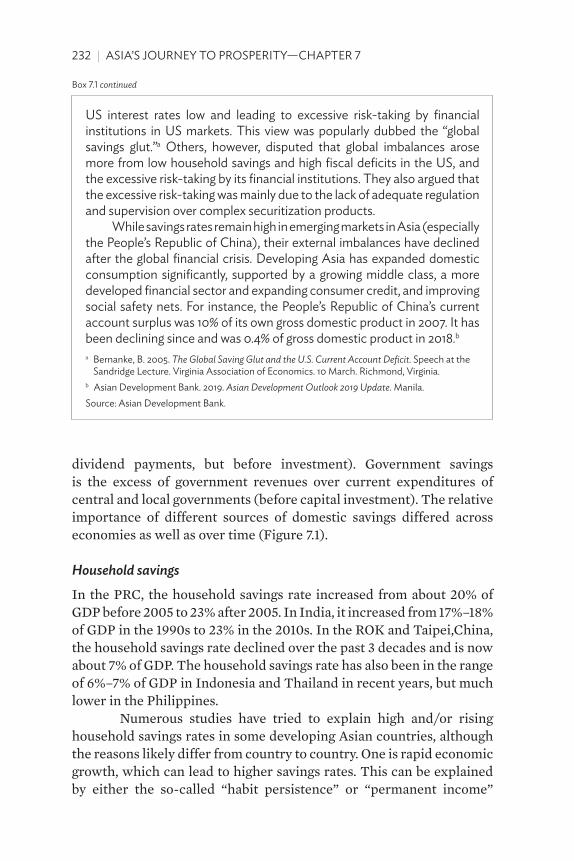
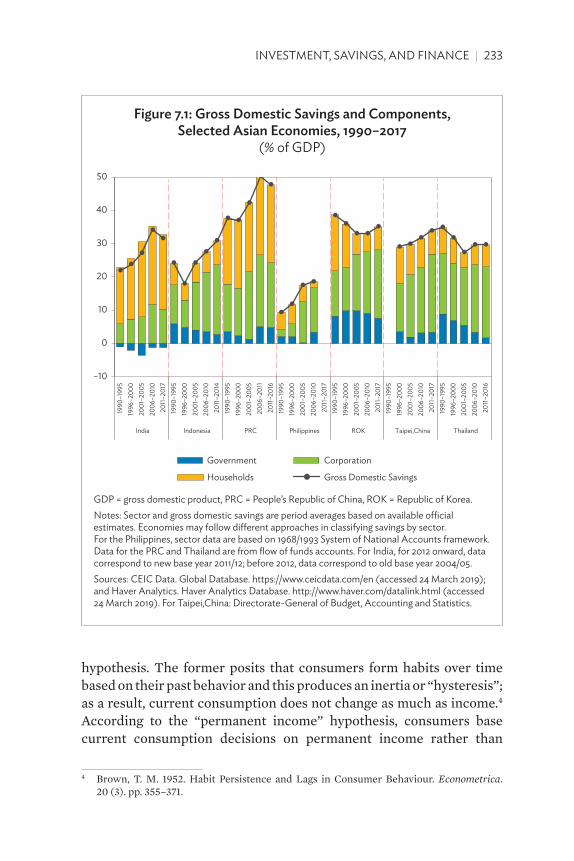
dividend payments, but before investment). Government savings is the excess of government revenues over current expenditures of central and local governments (before capital investment). The relative importance of different sources of domestic savings differed across economies as well as over time (Figure 7.1).
Household savings
In the PRC, the household savings rate increased from about 20% of GDP before 2005 to 23% after 2005. In India, it increased from 17%–18% of GDP in the 1990s to 23% in the 2010s. In the ROK and Taipei,China, the household savings rate declined over the past 3 decades and is now about 7% of GDP. The household savings rate has also been in the range of 6%–7% of GDP in Indonesia and Thailand in recent years, but much lower in the Philippines.
Numerous studies have tried to explain high and/or rising household savings rates in some developing Asian countries, although the reasons likely differ from country to country. One is rapid economic growth, which can lead to higher savings rates. This can be explained by either the so-called “habit persistence” or “permanent income”
US interest rates low and leading to excessive risk-taking by financial institutions in US markets. This view was popularly dubbed the “global savings glut.”a Others, however, disputed that global imbalances arose more from low household savings and high fiscal deficits in the US, and the excessive risk-taking by its financial institutions. They also argued that the excessive risk-taking was mainly due to the lack of adequate regulation and supervision over complex securitization products.
while savings rates remain high in emerging markets in Asia (especially the People’s Republic of China), their external imbalances have declined after the global financial crisis. Developing Asia has expanded domestic consumption significantly, supported by a growing middle class, a more developed financial sector and expanding consumer credit, and improving social safety nets. For instance, the People’s Republic of China’s current account surplus was 10% of its own gross domestic product in 2007. It has been declining since and was 0.4% of gross domestic product in 2018.b a Bernanke, B. 2005. The Global Saving Glut and the U.S. Current Account Deficit. Speech at the
Sandridge lecture. Virginia Association of economics. 10 March. Richmond, Virginia.b Asian Development Bank. 2019. Asian Development Outlook 2019 Update. Manila.Source: Asian Development Bank.
Box 7.1 continued
INVeSTMeNT, SAVINGS, AND FINANCe | 233
Figure 7.1: gross Domestic savings and Components, selected asian economies, 1990–2017
(% of GDP)
–10
0
10
20
30
40
50
1990
–199
519
96–2
000
2001
–200
520
06–2
010
2011
–201
719
90–1
995
1996
–200
020
01–2
005
2006
–201
020
11–2
014
1990
–199
519
96–2
000
2001
–200
520
06–2
011
2011
–201
619
90–1
995
1996
–200
020
01–2
005
2006
–201
020
11–2
017
1990
–199
519
96–2
000
2001
–200
520
06–2
010
2011
–201
719
90–1
995
1996
–200
020
01–2
005
2006
–201
020
11–2
017
1990
–199
519
96–2
000
2001
–200
520
06–2
010
2011
–201
6
India Indonesia PRC Philippines ROK Taipei,China Thailand
Government Corporation
Households Gross Domestic Savings
GDP = gross domestic product, PRC = People’s Republic of China, ROK = Republic of Korea. Notes: Sector and gross domestic savings are period averages based on available official estimates. economies may follow different approaches in classifying savings by sector. For the Philippines, sector data are based on 1968/1993 System of National Accounts framework. Data for the PRC and Thailand are from flow of funds accounts. For India, for 2012 onward, data correspond to new base year 2011/12; before 2012, data correspond to old base year 2004/05.Sources: CeIC Data. Global Database. https://www.ceicdata.com/en (accessed 24 March 2019); and Haver Analytics. Haver Analytics Database. http://www.haver.com/datalink.html (accessed 24 March 2019). For Taipei,China: Directorate-General of Budget, Accounting and Statistics.
hypothesis. The former posits that consumers form habits over time based on their past behavior and this produces an inertia or “hysteresis”; as a result, current consumption does not change as much as income.4 According to the “permanent income” hypothesis, consumers base current consumption decisions on permanent income rather than
4 Brown, T. M. 1952. Habit Persistence and Lags in Consumer Behaviour. Econometrica. 20 (3). pp. 355–371.
234 | ASIA’S JOURNeY TO PROSPeRITY—CHAPTeR 7
current income; they might be reluctant to increase consumption if they are uncertain whether the income increase will be permanent or temporary.5
The second set of explanations relates to demographic factors based on the so-called “life-cycle hypothesis.” According to this theory, individuals want to smooth consumption over their lifetime—they take on debt (or save less) when they are young, anticipating that future income streams will allow them to pay off debt; save (or save more) during middle age to maintain their consumption level when they retire; and after retirement, draw down on previous savings. The past 50 years have seen a rapid rise in the share of the working-age population in many Asian countries, likely contributing to rising household savings rates.
Recent empirical studies support this hypothesis, finding that young and old households save less than middle-aged ones in the Philippines; the PRC; the ROK; Taipei,China; and Thailand.6 Empirical studies have also shown negative correlation between dependency ratios (both young and old) and savings rates, based on data from economies in East Asia, Southeast Asia, and South Asia.7 As dependency ratios declined in many economies over the past 50 years, associated with rising shares of the working-age population, savings rates increased as a result, consistent with global cross-country studies.8 Apart from age-related factors, in the PRC, the sex ratio imbalance in favor of boys has also been suggested as one motive for savings because families save to prepare houses and consumer durables for their sons’ future marriage.9
5 Friedman, M. 1957. A Theory of the Consumption Function. Princeton: Princeton University Press.
6 See, for example, Deaton, A., and C. Paxson. 2000. Growth and Savings among Individuals and Households. Review of Economics and Statistics. 82 (2). pp. 212–225; and Chamon, M., and E. S. Prasad. 2008. Why Are Saving Rates of Urban Households in China Rising? NBER Working Paper. No. w14546. Cambridge, MA: National Bureau of Economic Research.
7 Kim, S., and J.-W. Lee. 2007. Demographic Changes, Saving, and Current Account in East Asia. Asian Economic Papers. 6 (2). pp. 22–53; and Horioka, C., and A. Terada-Hagiwara. 2012. The Determinants and Long-Term Projections of Saving Rates in Developing Asia. Japan and the World Economy. 24 (2). pp. 128–137.
8 See, for example, Chinn, M. D., and E. S. Prasad 2003. Medium-Term Determinants of Current Accounts in Industrial and Developing Countries: An Empirical Exploration. Journal of International Economics. 59 (1). pp. 47–76; and Bosworth, B., and G. Chodorow-Reich. 2007. Saving and Demographic Change: The Global Dimension. Center for Retirement Research at Boston College Working Paper. No. 2007-2. Boston: Boston College.
9 Wei, S.-J., and X. Zhang. 2011. The Competitive Saving Motive: Evidence from Rising Sex Ratios and Savings Rates in China. Journal of Political Economy. 119 (3). pp. 511–564.
INVeSTMeNT, SAVINGS, AND FINANCe | 235
The third set of explanations relates to financial sector development, including access to savings facilities and household borrowing constraints.
A stable bank-based financial system in many Asian countries enabled access to financial services by small and rural savers at low transaction costs, encouraging household savings. This occurred even though many countries kept nominal interest rates below equilibrium levels, a phenomenon known as “financial repression” common in developing countries. It has been suggested that, while there was financial repression in many developing Asian countries, the level of repression was often mild because of low inflation and tax incentives for saving (such as tax exemption for interest earnings), so real interest rates remained positive to attract household savings.10
Many Asian economies have well-established voluntary household savings mobilization programs. One example is postal savings, inspired by Japan’s success (Box 7.2). Bangladesh; India; Kazakhstan; Malaysia; the Philippines; the PRC; the ROK; Singapore; Taipei,China; and Viet Nam all developed extensive postal savings systems. In some economies, agricultural and fisheries cooperatives also provided savings deposit services to rural households.
The ROK established its postal savings system as early as the 1960s. In Taipei,China, about 40% of household savings in the formal financial sector were in postal savings during the mid-1980s. In the PRC, postal savings became increasingly popular among households more recently, with the number of branches mushrooming from less than 2,500 in 1986 to 37,000 in 2009.11 In India, the Post Office Savings Bank (POSB) had over 154,000 branches by the late 1990s.12
Less-developed consumer credit markets may have contributed to high household savings as well. In many Asian economies, mortgages, credit card facilities, and other consumer credit services were not well developed until very recently. When households cannot borrow from formal financial institutions, they either use informal financial arrangements or save more to finance durable purchases such as cars and electronic appliances, or large family events such as weddings or
10 World Bank. 1993. The East Asian Miracle: Economic Growth and Public Policy. New York: Oxford University Press.
11 Garon, S. 2012. Why the Chinese Save? Foreign Policy. 19 January. https://foreignpolicy .com/2012/01/19/why-the-chinese-save/.
12 World Bank. 2002. The Reform of India Post: Transforming a Postal Infrastructure to Deliver Modern Information and Financial Services. Washington, DC.
236 | ASIA’S JOURNeY TO PROSPeRITY—CHAPTeR 7
box 7.2: Japan’s Postal savings system
Japan’s postal savings system (popularly known as Yu-cho) is the world’s largest postal savings system in terms of deposits. It was established in 1871, following the example of Great Britain, which started the post office savings system in 1861. with its extensive postal network, Yu-cho was able to reach “small” rural household savers. The tax-exempt nature of these deposits, as well as the minimum costs of making deposits and withdrawals, led to tremendous growth; for instance, from 1905 to 1914, they grew almost fourfold compared with a far more modest increase of ordinary bank deposits.
From the postwar period until 2001, postal savings, together with the national pension system, were the main sources of funding for the government’s Fiscal Incentive loan Program (FIlP). This program funded industries such as synthetic fiber, oil refining, machinery, and electronics industries during the postwar recovery. At the height of high-speed economic development, FIlP financed public infrastructure investment such as highways and railways, as well as small and medium-sized enterprises, housing, and regional development through government-affiliated financial institutions such as the Development Bank of Japan, export–Import Bank of Japan, and Housing Finance Corporation.
Japan’s postal system—including postal savings—was privatized in the 2000s. Many government-affiliated institutions are consolidated and started issuing their own bonds without government guarantees.Source: Asian Development Bank.
education. When formal consumer credit markets were liberalized in Taipei,China in 1987, for example, the average propensity to save by households declined from 29% in the early-1990s to 26% in 1996, and declined further to about 20% in the 2010s.
In recent years, credit to households increased in many Asian countries. In 2018, household credit as a percentage of GDP was 68% in Malaysia and Thailand, and 53% in the PRC, compared with 62% in the European Union and 78% in North America. More recently, in Indonesia and the Philippines, consumer loans have grown rapidly, including for cars and motorbikes.
The fourth set of explanations for high household savings relates to precautionary savings, largely due to underdeveloped social security systems, such as the lack of universal health coverage and
INVeSTMeNT, SAVINGS, AND FINANCe | 237
inadequate pension provisions. These precautionary saving motives played an important role in high household savings in many Asian countries, particularly the PRC.
This is consistent with recent empirical studies. In Taipei,China, there was a 9%–14% decline in average savings after the National Health Insurance system was introduced in 1995.13 There was a similar decline in the private household savings rate in Thailand, beginning in the early 1990s, when a three-pillar social security system was introduced, consisting of social assistance, social insurance, and social service.14 A similar decline in savings also occurred in the Philippines between 1994 and 2006 due to expanding social security coverage in the early 1990s.15
Gross corporate savings
From the 1990s to the 2010s, the gross corporate savings rate increased in the PRC; the ROK; Taipei,China; and Indonesia from below 15% of GDP to about 20% or higher (Figure 7.1). Over the same period, the corporate savings rate increased from 18% of GDP to 21% in Thailand, from 2% to 13% in the Philippines, and from 6% to 10% in India. During 2010–2017, gross corporate savings accounted for 60%–70% of total domestic savings in Indonesia; the Philippines; the ROK; Taipei,China; and Thailand; about 40% in the PRC; and 30% in India. Growing gross corporate savings rates are a global phenomenon, and many developed countries have also seen them increase significantly over the past 3 to 4 decades.
Several factors have been suggested for rising gross corporate savings rates globally: (i) declining labor income shares associated with technological progress, globalization, and the diminished bargaining power of trade unions; (ii) falling prices of investment goods possibly associated with technological progress; (iii) lower dividend payouts in some countries to retain greater income for investment; (iv) reductions in corporate income tax rates; (v) low interest rates which increased
13 Chou, S., J. Liu, and J. Hammit. 2003. National Health Insurance and Precautionary Saving. Journal of Public Economics. 87 (9–10). pp. 1873–1894.
14 Pootrakool, K., K. Ariyapruchya, and T. Sodsrichai. 2005. Long-Term Saving in Thailand: Are We Saving Enough and What Are the Risks? Monetary Policy Group Working Papers. No. 2005-03. Bangkok: Bank of Thailand.
15 Terada-Hagiwara, A. 2009. Explaining Filipino Households’ Declining Saving Rate. ADB Economics Working Paper Series. No. 178. Manila: Asian Development Bank.
238 | ASIA’S JOURNeY TO PROSPeRITY—CHAPTeR 7
corporate profits; and (vi) the emergence of highly profitable platform companies that do not need to make huge investments in physical or tangible capital.
Many of these factors also apply to Asia. In the PRC, for example, labor’s income share in industrial value added declined from 48% in the early 1990s to 42% in the mid-2000s, and in India, it decreased from 50% to 22% (for the formal industry sector).16 Many listed companies in developing Asia have limited dividend payments. In the PRC, for instance, about 50% of listed firms did not pay dividends until recently.17
Government savings
Government savings is important to gross domestic savings in Indonesia; the PRC;18 the ROK; Taipei,China; and Thailand. India’s government savings rate, however, continued to be negative, meaning government revenues fell short of current expenditures, with capital investment financed by bond issuance and borrowing. Philippine government savings also were small, which, until recently, led to insufficient government infrastructure investment.
High government savings rates often go hand in hand with fiscal prudence (Chapter 10). Asian Development Bank (ADB) studies have documented the role fiscal prudence played in Southeast Asian economies—such as Indonesia, Malaysia, and Singapore—in augmenting government savings.19 A strong commitment to fiscal prudence and sustainability both boosted public savings and created a stable economic environment conducive to higher private savings. In recent years, fiscal reforms to increase tax revenues or cut subsidies in several Asian economies—such as India, Indonesia, and the Philippines—increased government savings and enabled larger public infrastructure spending.
16 Asian Development Bank (ADB). 2012. Asian Development Outlook 2012: Confronting Rising Inequality in Asia. Manila.
17 Tyers, R., and F. Lu. 2008. Competition Policy, Corporate Saving and China’s Current Account Surplus. ANU Working Papers in Economics and Econometrics. No. 2008-496. Canberra: Australian National University College of Business and Economics.
18 Zhang, L., et al. 2018. China’s High Savings: Drivers, Prospects, and Policies. IMF Working Paper. No. WP/18/277. Washington, DC: International Monetary Fund.
19 ADB. 1997. Emerging Asia: Changes and Challenges. Manila; and Harrigan, F. 1996. Saving Transitions in Southeast Asia. EDRC Report Series. No. 64. Manila: Asian Development Bank.
INVeSTMeNT, SAVINGS, AND FINANCe | 239
7.4 external financing complements domestic savings
Developing Asia’s gross domestic investment rate was higher than its gross domestic savings rate during the 1960s, 1970s, and 1980s (Table 7.2). This excess investment was financed by foreign savings from nonresident capital inflows such as official flows, FDI, private debt (bank lending and bonds), and portfolio equity investment. Since the 1990s, savings rates have exceeded investment rates.
The domestic savings–investment gap equals the current account balance. A positive gap indicates a surplus, while a negative gap shows a deficit. The deficit requires external financing. However, even if a country runs a current account surplus, there can still be net capital inflows by nonresidents. In such a case, the current account surplus and net capital inflows by nonresidents will offset investment by residents abroad (including FDI) and increasing foreign exchange reserves.
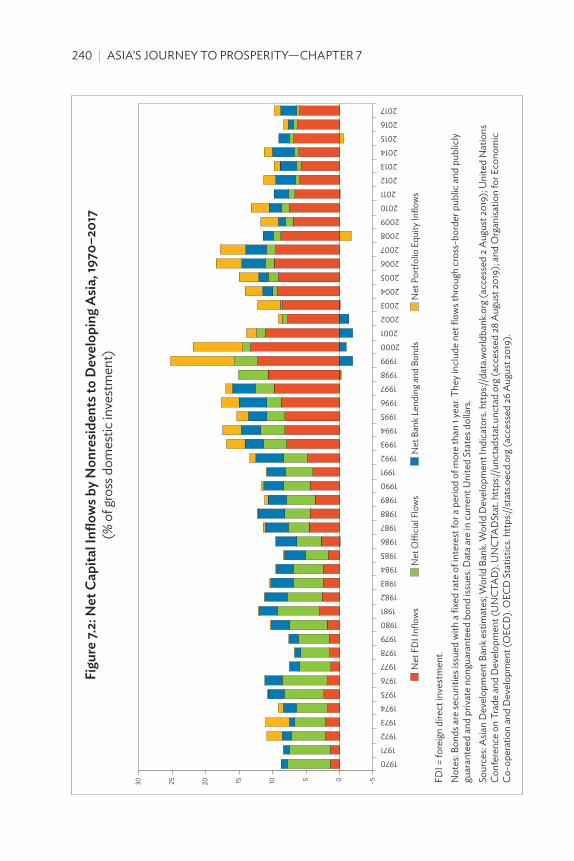
Before 1990, net official flows (bilateral official development assistance, multilateral development financing, and other official flows) were the largest source of external financing for developing Asia (Figure 7.2) (Chapter 14). It was close to 60% (or about 6% of gross domestic investment) in the early 1970s. But it declined over time to less than 40% (or 4% of gross domestic investment) in 1990.
Inward FDI was the second-largest source during the 1970s and 1980s. However, it has become the largest source of external financing since the 1990s, when Asian economies started liberalizing trade and investment (Chapter 9), reaching 13.3% of gross domestic investment in 2000 and hovering around 5.7%–7.0% in recent years.
In developing Asia, external private debt—including borrowing from foreign commercial banks and bond purchases by foreign investors—was the third-largest source of external financing in the 1970s, 1980s, and 1990s. Bank lending saw net outflows in 1998–2002 following the Asian financial crisis, and only recovered after 2004. Bond financing increased in the years leading to the crisis, and again in the years leading to and after the global financial crisis. Inward portfolio equity investment increased significantly after the Asian financial crisis, but has been more volatile.
In the years leading to the Asian financial crisis, many banks in Indonesia, Malaysia, the ROK, and Thailand borrowed extensively from foreign sources. These were primarily short-term bank loans or bonds largely denominated in US dollars and unhedged. The banks
240 | ASIA’S JOURNeY TO PROSPeRITY—CHAPTeR 7
Figu
re 7.
2: n
et C
apita
l inf
low
s by
non
resid
ents
to D
evel
opin
g a
sia, 1
970–
2017
(%
of g
ross
dom
estic
inve
stm
ent)
–5051015202530
1970
1971
1972
1973
1974
1975
1976
1977
1978
1979
1980
1981
1982
1983
1984
1985
1986
1987
1988
1989
1990
1991
1992
1993
1994
1995
1996
1997
1998
1999
2000
2001
2002
2003
2004
2005
2006
2007
2008
2009
2010
2011
2012
2013
2014
2015
2016
2017
Net
FD
I Infl
ows
Net
O�
cial
Flo
ws
Net
Ban
k Len
ding
and
Bon
dsN
et P
ortfo
lio E
quity
Inflo
ws
FDI =
fore
ign
dire
ct in
vest
men
t.N
otes
: Bon
ds a
re se
curit
ies i
ssue
d w
ith a
fixe
d ra
te o
f int
eres
t for
a p
erio
d of
mor
e th
an 1
year
. The
y inc
lude
net
flow
s thr
ough
cro
ss-b
orde
r pub
lic a
nd p
ublic
ly
guar
ante
ed a
nd p
rivat
e no
ngua
rant
eed
bond
issu
es. D
ata
are
in c
urre
nt U
nite
d St
ates
dol
lars
.So
urce
s: A
sian
Dev
elop
men
t Ban
k est
imat
es; w
orld
Ban
k. w
orld
Dev
elop
men
t Ind
icat
ors.
http
s://d
ata.w
orld
bank
.org
(acc
esse
d 2
Aug
ust 2
019)
; Uni
ted
Nat
ions
Co
nfer
ence
on
Trad
e an
d D
evel
opm
ent (
UN
CTA
D).
UN
CTA
DSt
at. h
ttps:/
/unc
tads
tat.u
ncta
d.or
g (ac
cess
ed 2
8 A
ugus
t 201
9); a
nd O
rgan
isatio
n fo
r eco
nom
ic
Co-o
pera
tion
and
Dev
elop
men
t (O
eCD
). O
eCD
Sta
tistic
s. ht
tps:/
/sta
ts.o
ecd.
org (
acce
ssed
26
Aug
ust 2
019)
.
INVeSTMeNT, SAVINGS, AND FINANCe | 241
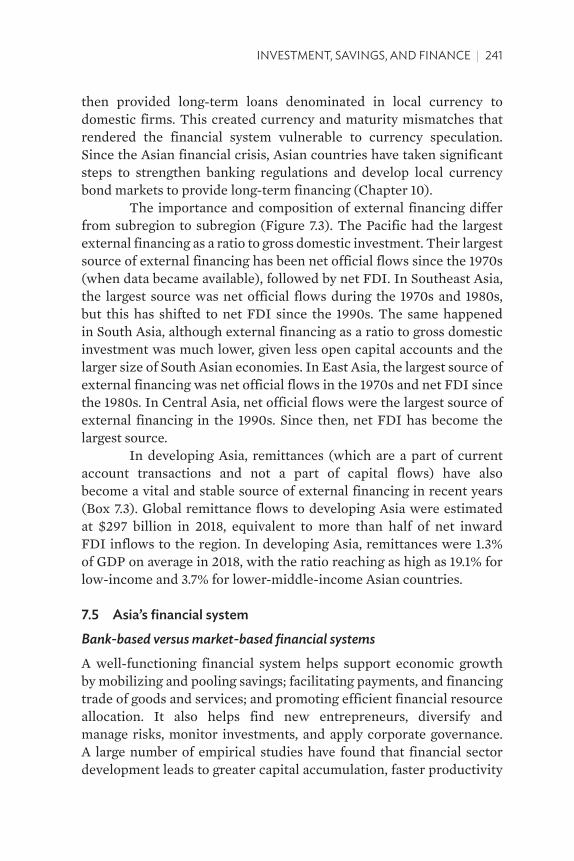
then provided long-term loans denominated in local currency to domestic firms. This created currency and maturity mismatches that rendered the financial system vulnerable to currency speculation. Since the Asian financial crisis, Asian countries have taken significant steps to strengthen banking regulations and develop local currency bond markets to provide long-term financing (Chapter 10).
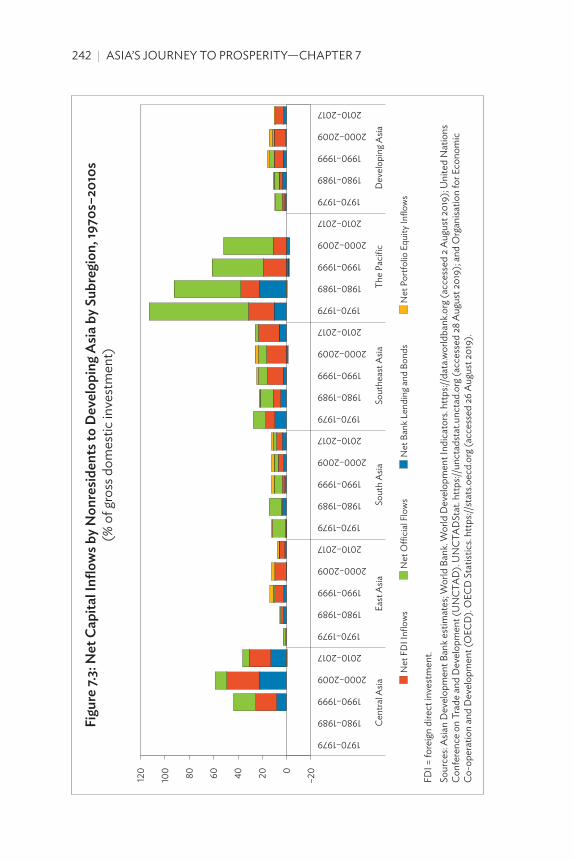
The importance and composition of external financing differ from subregion to subregion (Figure 7.3). The Pacific had the largest external financing as a ratio to gross domestic investment. Their largest source of external financing has been net official flows since the 1970s (when data became available), followed by net FDI. In Southeast Asia, the largest source was net official flows during the 1970s and 1980s, but this has shifted to net FDI since the 1990s. The same happened in South Asia, although external financing as a ratio to gross domestic investment was much lower, given less open capital accounts and the larger size of South Asian economies. In East Asia, the largest source of external financing was net official flows in the 1970s and net FDI since the 1980s. In Central Asia, net official flows were the largest source of external financing in the 1990s. Since then, net FDI has become the largest source.
In developing Asia, remittances (which are a part of current account transactions and not a part of capital flows) have also become a vital and stable source of external financing in recent years (Box 7.3). Global remittance flows to developing Asia were estimated at $297 billion in 2018, equivalent to more than half of net inward FDI inflows to the region. In developing Asia, remittances were 1.3% of GDP on average in 2018, with the ratio reaching as high as 19.1% for low-income and 3.7% for lower-middle-income Asian countries.
7.5 asia’s financial system
Bank-based versus market-based financial systems
A well-functioning financial system helps support economic growth by mobilizing and pooling savings; facilitating payments, and financing trade of goods and services; and promoting efficient financial resource allocation. It also helps find new entrepreneurs, diversify and manage risks, monitor investments, and apply corporate governance. A large number of empirical studies have found that financial sector development leads to greater capital accumulation, faster productivity
242 | ASIA’S JOURNeY TO PROSPeRITY—CHAPTeR 7
Figu
re 7.
3: n
et C
apita
l inf
low
s by
non
resid
ents
to D
evel
opin
g a
sia b
y su
breg
ion,
1970
s–20
10s
(% o
f gro
ss d
omes
tic in
vest
men
t)
–20020406080100
120
1970–1979
1980–1989
1990–1999
2000–2009
2010–2017
1970–1979
1980–1989
1990–1999
2000–2009
2010–2017
1970–1979
1980–1989
1990–1999
2000–2009
2010–2017
1970–1979
1980–1989
1990–1999
2000–2009
2010–2017
1970–1979
1980–1989
1990–1999
2000–2009
2010–2017
1970–1979
1980–1989
1990–1999
2000–2009
2010–2017
Cent
ral A
siaEa
st A
siaSo
uth
Asia
Sout
heas
t Asia
The
Paci
ficD
evel
opin
g Asia
Net
FD
I Infl
ows
Net
O�
cial
Flo
ws
Net
Ban
k Len
ding
and
Bon
dsN
et P
ortfo
lio E
quity
Inflo
ws
FDI =
fore
ign
dire
ct in
vest
men
t.So
urce
s: A
sian
Dev
elop
men
t Ban
k est
imat
es; w
orld
Ban
k. w
orld
Dev
elop
men
t Ind
icat
ors.
http
s://d
ata.w
orld
bank
.org
(acc
esse
d 2
Aug
ust 2
019)
; Uni
ted
Nat
ions
Co
nfer
ence
on
Trad
e an
d D
evel
opm
ent (
UN
CTA
D).
UN
CTA
DSt
at. h
ttps:/
/unc
tads
tat.u
ncta
d.or
g (ac
cess
ed 2
8 A
ugus
t 201
9); a
nd O
rgan
isatio
n fo
r eco
nom
ic
Co-o
pera
tion
and
Dev
elop
men
t (O
eCD
). O
eCD
Sta
tistic
s. ht
tps:/
/sta
ts.o
ecd.
org (
acce
ssed
26
Aug
ust 2
019)
.
INVeSTMeNT, SAVINGS, AND FINANCe | 243
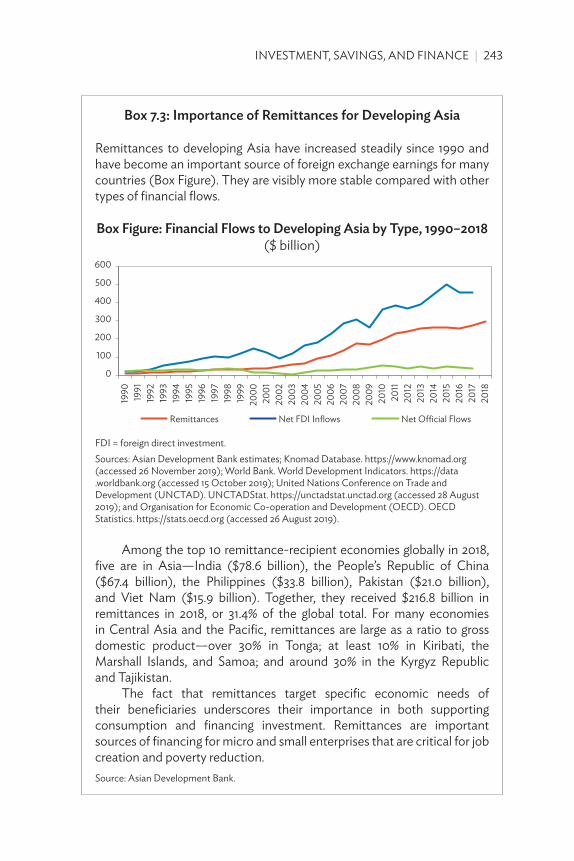
box 7.3: importance of Remittances for Developing asia
Remittances to developing Asia have increased steadily since 1990 and have become an important source of foreign exchange earnings for many countries (Box Figure). They are visibly more stable compared with other types of financial flows.
box Figure: Financial Flows to Developing asia by Type, 1990–2018 ($ billion)
0
100
200
300
400
500
600
1990 1991
1992
1993
1994
1995
1996
1997
1998
1999
2000
2001
2002
2003
2004
2005
2006
2007
2008
2009
2010
2011
2012
2013
2014
2015
2016
2017
2018
Remittances Net FDI Inflows Net O�cial Flows
FDI = foreign direct investment.Sources: Asian Development Bank estimates; Knomad Database. https://www.knomad.org (accessed 26 November 2019); world Bank. world Development Indicators. https://data .worldbank.org (accessed 15 October 2019); United Nations Conference on Trade and Development (UNCTAD). UNCTADStat. https://unctadstat.unctad.org (accessed 28 August 2019); and Organisation for economic Co-operation and Development (OeCD). OeCD Statistics. https://stats.oecd.org (accessed 26 August 2019).
Among the top 10 remittance-recipient economies globally in 2018, five are in Asia—India ($78.6 billion), the People’s Republic of China ($67.4 billion), the Philippines ($33.8 billion), Pakistan ($21.0 billion), and Viet Nam ($15.9 billion). Together, they received $216.8 billion in remittances in 2018, or 31.4% of the global total. For many economies in Central Asia and the Pacific, remittances are large as a ratio to gross domestic product—over 30% in Tonga; at least 10% in Kiribati, the Marshall Islands, and Samoa; and around 30% in the Kyrgyz Republic and Tajikistan.
The fact that remittances target specific economic needs of their beneficiaries underscores their importance in both supporting consumption and financing investment. Remittances are important sources of financing for micro and small enterprises that are critical for job creation and poverty reduction.Source: Asian Development Bank.
244 | ASIA’S JOURNeY TO PROSPeRITY—CHAPTeR 7
growth, and better economic performance.20 Furthermore, the positive impact of financial development on growth is more pronounced in emerging economies than in advanced economies as financial constraints are more binding in the former.21
While the initial structure of a country’s financial system is often determined by historical, institutional, economic, legal, and political factors, there is now a consensus that an effective financial system requires both banks and capital markets.22 Some argue that banks have an advantage, particularly during the early stage of development. This is because banks can mobilize large sums of savings from small savers into medium- to long-term corporate investment. Banks can also monitor these investments on behalf of a large number of savers because they can extract critical information through their long-term relationships with borrowers. For example, until the 1980s, the largest provider of bank loans for corporate borrowers in Japan was often called the “main bank,” and it could influence corporate governance by monitoring company activities and having executives participate in board meetings when needed.
On the other hand, bonds and equity markets have the advantage of better spreading risk across a large number of investors with diverse risk profiles. Market-based financial systems are usually better at financing riskier investments—such as technological innovations—and providing long-term finance. Also, a market-based system can promote strong market discipline and better corporate governance through disclosure requirements, price signals, and the functions of boards representing equity holders. Capital markets offer investment opportunities for institutional investors—such as pension funds and life insurance companies.
The market-based system is also considered better able to prevent financial crises, as losses incurred during financial distress can be absorbed by bond and equity holders instead of impairing bank balance sheets—thus avoiding bank runs and protecting payment systems. However, as the global financial crisis in 2008–2009 made
20 Zhuang, J., et al. 2009. Financial Sector Development, Economic Growth, and Poverty Reduction: A Literature Review. ADB Economics Working Paper Series. No. 173. Manila: Asian Development Bank.
21 Estrada, G., D. Park, and A. Ramayandi. 2015. Financial Development, Financial Openness, and Economic Growth. ADB Economics Working Paper Series. No. 442. Manila: Asian Development Bank.
22 Levine, R. 2002. Bank-Based or Market-Based Financial Systems: Which Is Better? Journal of Financial Intermediation. 11 (4). pp. 398–428.
INVeSTMeNT, SAVINGS, AND FINANCe | 245
clear, financial crises can occur regardless of financial structure—the crisis started in the US, where capital markets were considered most developed.
There have been a lot of discussions about the causes of the global financial crisis. Since the 1990s, with the rapid development of structured finance, banks have invested heavily in market-linked products such as mortgage- and asset-backed securities through special purpose vehicles. Banks were also increasingly involved in derivatives markets (such as currency and credit-default swaps) and exposed to broader market risk. This created a channel through which distress in mortgage-backed securities (reinforced by more sophisticated securitization such as collateralized debt obligations) could quickly spill over to the banking system and impact the entire financial system. This is what happened during the global financial crisis.
After the global financial crisis, there have been serious efforts to reduce systemic risk, including through addressing the “too-big-to-fail” problems—and strengthening firewalls between banking and other investment services. But the boundary remains less clear-cut than what regulations intended. In many ways, the banking sector and capital markets are complements rather than substitutes in providing financial services, and risks can spill over between them.23 Regulators and the financial industry should remain vigilant and respond to any sign of possible irregularities.
Bank-based financing in Asia
Before the 1997–1998 Asian financial crisis, finance across most of developing Asia was bank-based (many state-owned). Banks played a dominant role in mobilizing domestic savings into investment. While some economies developed capital markets, investment through equities and bonds was small. In the ROK, for example, during 1970–1979, bank loans accounted for 82% of financing of nonfinancial corporations, with equity 4% and bonds 14%.24 In Malaysia, from 1986 to 1991, bank loans accounted for 95% of financing of nonfinancial corporations, despite government efforts to develop stock and corporate bond markets.
23 Eichengreen, B. 2015. Financial Development in Asia: The Role of Policy and Institutions, with Special Reference to China. Prepared for the Second Annual Asian Monetary Policy Forum. 29 May. Singapore.
24 World Bank. 1993. The East Asian Miracle: Economic Growth and Public Policy. New York: Oxford University Press.
246 | ASIA’S JOURNeY TO PROSPeRITY—CHAPTeR 7
Fast-growing Asian economies—especially the ROK; Singapore; and Taipei,China—were quite successful in channeling domestic savings into investment using the banking system, partly due to several selective policy interventions. These included establishing public development banks; guiding banks to provide loans to targeted firms and sectors, and providing credit guarantees (for SMEs); moderate interest rate repression; and regulations covering outward foreign investment. Public development banks were substantial lenders of long-term financing in Indonesia; the ROK; and Taipei,China.25
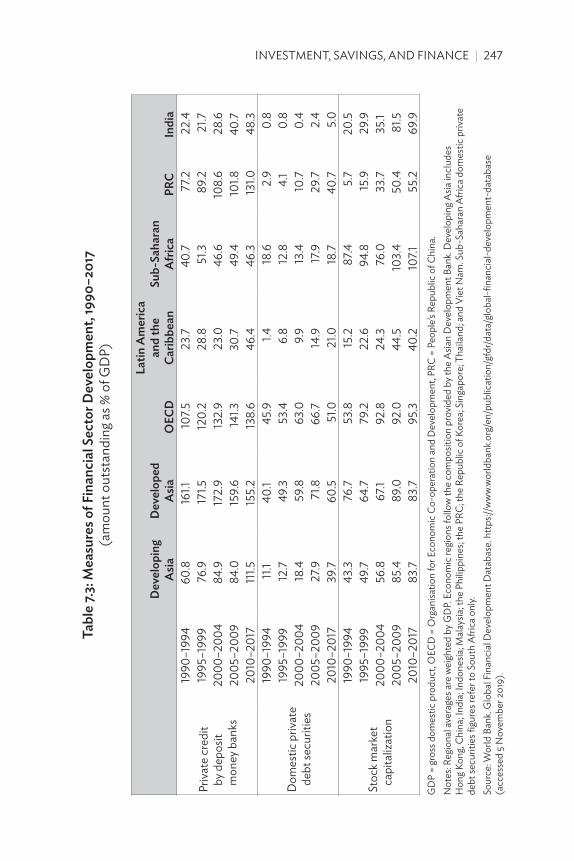
According to measures of financial sector development (Table 7.3), Asia’s financial deepening is an ongoing process and less than the OECD average in terms of outstanding debt securities and stock market capitalization as a ratio to GDP. Despite the rapid growth of capital markets after the Asian financial crisis, bank credit remains the most important source of private sector financing in most Asian economies. In 2010–2017, in 10 selected major developing Asian economies (Hong Kong, China; India; Indonesia; Malaysia; the Philippines; the PRC; the ROK; Singapore; Thailand; and Viet Nam), outstanding bank credit was, on average, 111.5% of GDP; stock market capitalization was 83.7% of GDP; and outstanding corporate bonds was 39.7% of GDP (albeit a threefold increase over 1990–1994).
Increasing importance of capital markets
Capital markets existed in Asia as early as the late 19th century and early 20th century. India’s Bombay Stock Exchange was established in 1875 under British rule. The Tokyo Stock Exchange was established in 1878. The “Shanghai Sharebrokers’ Association” was founded by foreign entrepreneurs in 1891 and renamed the “Shanghai Stock Exchange” in 1904. Indonesia’s first stock exchange opened in 1912 under Dutch rule. Hong Kong, China’s securities market can be traced back to 1866, but the stock market was formally established in 1891, and renamed the “Hong Kong Stock Exchange” in 1914.
Despite these early developments, for the region as a whole, stock markets played a limited role in providing financing for corporate investment before the 1990s. The same was true for Asia’s bond markets.
25 In Japan, banks in special relationships with big businesses through cross shareholdings (typically being part of the same corporate group—the bank-centered “financial keiretsu”) played a major role in corporate finance during industrialization. While ROK chaebols did not own banks, which were nationalized during the 1960s, they nevertheless received guaranteed loans from the banking sector because of their close connections.
INVeSTMeNT, SAVINGS, AND FINANCe | 247
Tabl
e 7.3
: Mea
sure
s of F
inan
cial
sec
tor D
evel
opm
ent,
1990
–201
7(a
mou
nt o
utst
andi
ng a
s % o
f GD
P)
Dev
elop
ing
asia
Dev
elop
ed
asia
oeC
D
latin
am
eric
a an
d th
e Ca
ribbe
ansu
b-sa
hara
n a
fric
aPR
Cin
dia
Priv
ate
cred
it
by d
epos
it m
oney
ban
ks
1990
–199
4 60
.816
1.110
7.523
.740
.777
.222
.4 19
95–1
999
76.9
171.5
120.
228
.851
.389
.221
.7 2
000–
2004
84
.917
2.9
132.
923
.046
.610
8.6
28.6
200
5–20
09
84.0
159.
614
1.330
.749
.410
1.840
.7 2
010–
2017
11
1.515
5.2
138.
646
.446
.313
1.048
.3
Dom
estic
priv
ate
debt
secu
ritie
s
1990
–199
4 11
.140
.145
.91.4
18.6
2.9
0.8
1995
–199
9 12
.749
.353
.46.
812
.84.
10.
8 2
000–
2004
18
.459
.863
.09.
913
.410
.70.
4 2
005–
2009
27
.971
.866
.714
.917
.929
.72.
4 2
010–
2017
39
.760
.551
.021
.018
.740
.75.
0
Stoc
k mar
ket
capi
taliz
atio
n
1990
–199
4 43
.376
.753
.815
.287
.45.
720
.5 19
95–1
999
49.7
64.7
79.2
22.6
94.8
15.9
29.9
200
0–20
04
56.8
67.1
92.8
24.3
76.0
33.7
35.1
200
5–20
09
85.4
89.0
92.0
44.5
103.
450
.481
.5 2
010–
2017
83
.783
.795
.340
.210
7.155
.269
.9G
DP
= gr
oss d
omes
tic p
rodu
ct, O
eCD
= O
rgan
isatio
n fo
r eco
nom
ic C
o-op
erat
ion
and
Dev
elop
men
t, PR
C =
Peop
le’s
Repu
blic
of C
hina
.N
otes
: Reg
iona
l ave
rage
s are
wei
ghte
d by
GD
P. e
cono
mic
regi
ons f
ollo
w th
e co
mpo
sitio
n pr
ovid
ed b
y the
Asia
n D
evel
opm
ent B
ank.
Dev
elop
ing A
sia in
clud
es
Hon
g Kon
g, Ch
ina;
Indi
a; In
done
sia; M
alay
sia; t
he P
hilip
pine
s; th
e PR
C; th
e Re
publ
ic o
f Kor
ea; S
inga
pore
; Tha
iland
; and
Vie
t Nam
. Sub
-Sah
aran
Afri
ca d
omes
tic p
rivat
e de
bt se
curit
ies f
igur
es re
fer t
o So
uth
Afric
a on
ly.
Sour
ce: w
orld
Ban
k. G
loba
l Fin
anci
al D
evel
opm
ent D
atab
ase.
http
s://w
ww.
wor
ldba
nk.o
rg/e
n/pu
blic
atio
n/gf
dr/d
ata/
glob
al-f
inan
cial
-dev
elop
men
t-da
taba
se
(acc
esse
d 5 N
ovem
ber 2
019)
.
248 | ASIA’S JOURNeY TO PROSPeRITY—CHAPTeR 7
In Japan, capital markets played an important role in prewar financing, while the economy became more dependent on bank financing in postwar high growth era.
The 1997–1998 Asian financial crisis severely affected Indonesia, Malaysia, the Philippines, the ROK, and Thailand (Chapter 9). After the crisis, policy makers prioritized capital market development—especially local currency bond markets and nonbank financial institutions—as a more diverse long-term financing alternative to banks.
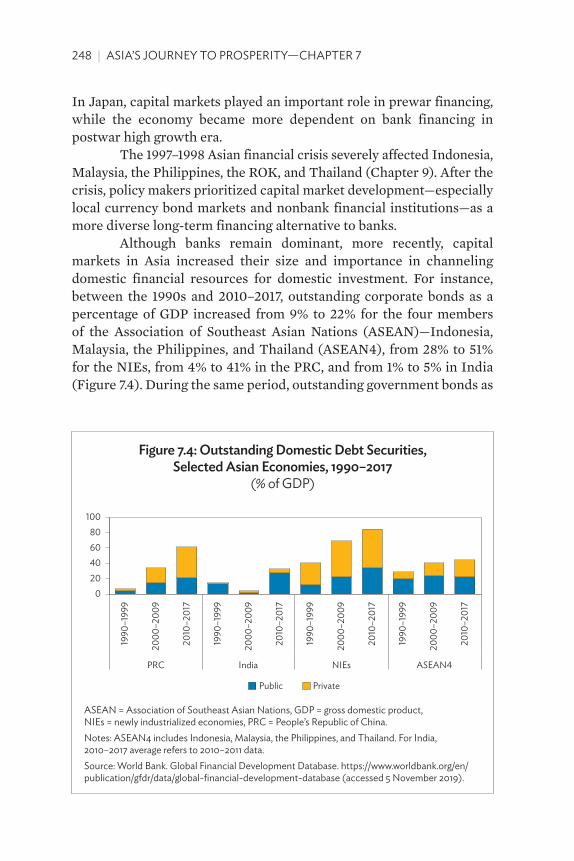
Although banks remain dominant, more recently, capital markets in Asia increased their size and importance in channeling domestic financial resources for domestic investment. For instance, between the 1990s and 2010–2017, outstanding corporate bonds as a percentage of GDP increased from 9% to 22% for the four members of the Association of Southeast Asian Nations (ASEAN)—Indonesia, Malaysia, the Philippines, and Thailand (ASEAN4), from 28% to 51% for the NIEs, from 4% to 41% in the PRC, and from 1% to 5% in India (Figure 7.4). During the same period, outstanding government bonds as
Figure 7.4: outstanding Domestic Debt securities, selected asian economies, 1990–2017
(% of GDP)
020406080
100
1990
–199
9
2000
–200
9
2010
–201
7
ASEAN4
1990
–199
9
2000
–200
9
2010
–201
7
NIEs
1990
–199
9
2000
–200
9
2010
–201
7
PRC
1990
–199
9
2000
–200
9
2010
–201
7
India
Public Private
ASeAN = Association of Southeast Asian Nations, GDP = gross domestic product, NIes = newly industrialized economies, PRC = People’s Republic of China.Notes: ASeAN4 includes Indonesia, Malaysia, the Philippines, and Thailand. For India, 2010–2017 average refers to 2010–2011 data.Source: world Bank. Global Financial Development Database. https://www.worldbank.org/en/publication/gfdr/data/global-financial-development-database (accessed 5 November 2019).
INVeSTMeNT, SAVINGS, AND FINANCe | 249
a percentage of GDP increased from 20% to 22% for the ASEAN4, 12% to 34% for the NIEs, 4% to 21% in the PRC, and 14% to 28% in India.
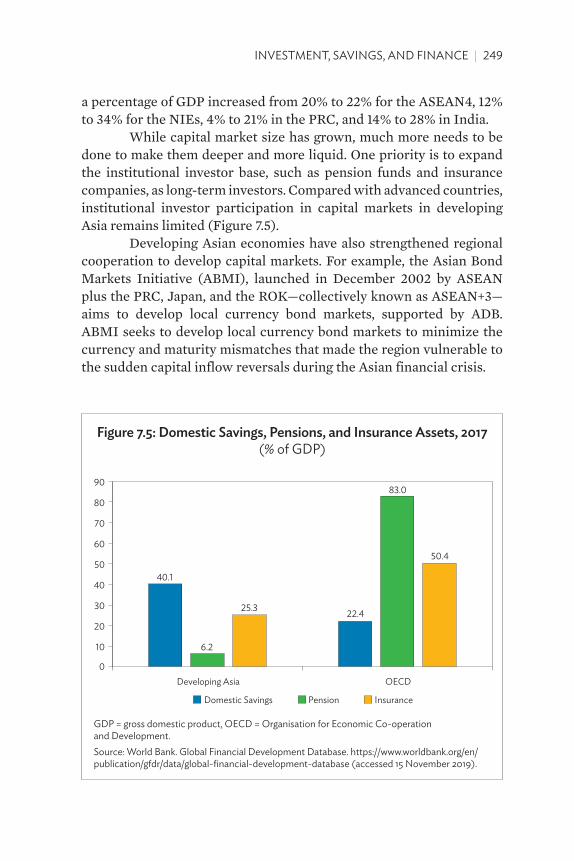
While capital market size has grown, much more needs to be done to make them deeper and more liquid. One priority is to expand the institutional investor base, such as pension funds and insurance companies, as long-term investors. Compared with advanced countries, institutional investor participation in capital markets in developing Asia remains limited (Figure 7.5).
Developing Asian economies have also strengthened regional cooperation to develop capital markets. For example, the Asian Bond Markets Initiative (ABMI), launched in December 2002 by ASEAN plus the PRC, Japan, and the ROK—collectively known as ASEAN+3—aims to develop local currency bond markets, supported by ADB. ABMI seeks to develop local currency bond markets to minimize the currency and maturity mismatches that made the region vulnerable to the sudden capital inflow reversals during the Asian financial crisis.
Figure 7.5: Domestic savings, Pensions, and insurance assets, 2017(% of GDP)
40.1
22.4
6.2
83.0
25.3
50.4
0
10
20
30
40
50
60
70
80
90
Developing Asia OECD
Domestic Savings Pension Insurance
GDP = gross domestic product, OeCD = Organisation for economic Co-operation and Development.Source: world Bank. Global Financial Development Database. https://www.worldbank.org/en/publication/gfdr/data/global-financial-development-database (accessed 15 November 2019).
250 | ASIA’S JOURNeY TO PROSPeRITY—CHAPTeR 7
Since its launch, ABMI has (i) supported governments to strengthen regulations for bond markets, (ii) established the Credit Guarantee and Investment Facility (CGIF) in 2010 to provide credit enhancement to regional corporate bond issuers, (iii) launched the AsianBondsOnline website to disseminate data and information on ASEAN+3 bond markets, and (iv) facilitated the development of cross-border bond market infrastructure by establishing the ASEAN+3 Bond Market Forum and Cross-Border Settlement Infrastructure Forum.
Promoting small and medium-sized enterprise access to finance
Broadening access to finance by SMEs is key to boosting inclusive economic growth. SMEs are the backbone of most Asian economies. They create jobs, promote competition, and stimulate domestic demand. However, poor access to finance is often a critical constraint to their growth in developing Asia. A recent ADB report on SME finance (covering 20 developing Asian economies) states that, while SMEs made up an average 96% of registered firms, employed 62% of the labor force, and contributed 42% of economic output, they only received 19% of total bank loans in 2014.
Limited access to bank credit is a structural problem for SMEs, mainly because of the asymmetric information between banks and borrowers. This leads to high collateral and guarantee requirements and adds to transaction costs. Developing Asian countries have taken various measures in recent years to promote SME access to finance. For example, Papua New Guinea and Solomon Islands made it easier for companies to borrow using movable assets as collateral. Thailand expanded the guarantee of SME loans by the state-owned Thai Credit Guarantee Corporation. Indonesia and the Philippines introduced mandatory bank lending quotas for SMEs. An increasing number of countries are supporting SME finance through fintech and digital solutions as part of national strategies for financial inclusion. Extension of credit to micro and small enterprises managed by women is also a priority in many countries. ADB has been supporting this area including through legal reform to provide land titles to women in some countries.
INVeSTMeNT, SAVINGS, AND FINANCe | 251
7.6 looking ahead
Future policy challenges regarding investment and savings for Asian economies are multifaceted and depend on country situations—such as demographics, resource endowment, policies, and institutions.
For example, countries with high investment and savings rates, such as the PRC, need to increase domestic consumption. Policy measures may include promoting consumer credit and strengthening social protection. For countries with low savings rates, low investment rates, and persistent current account deficits—often with low per capita income—governments should introduce policies to increase domestic savings, including government savings through raising tax revenues. They can also more effectively use external financing from FDI, remittances, and bilateral and multilateral development finance.
Regarding financial systems, future priorities include (i) developing and deepening capital markets and supporting greater participation by institutional investors; (ii) increasing the financial sector efficiency, by allowing greater competition; (iii) promoting financial inclusion by improving access to underserved groups such as SMEs, women, and low-income households; (iv) strengthening financial regulation to safeguard the financial system, protecting consumers, and addressing money laundering; and (v) embracing financial innovation.