Embed Size (px)
Citation preview

January 2017
Investment Report - 2017
2
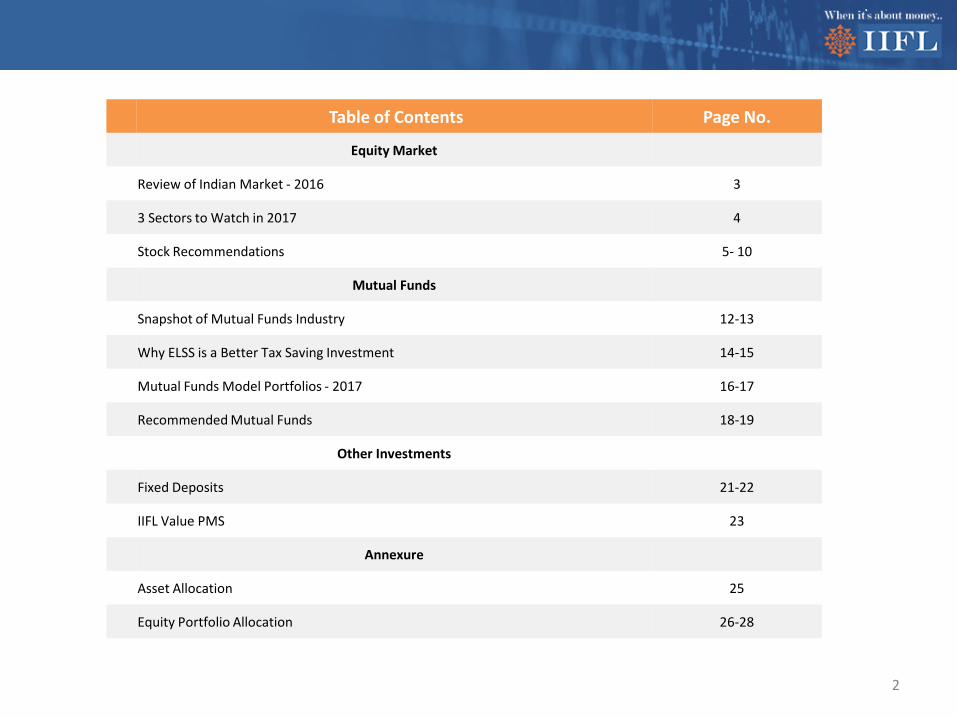
Table of Contents Page No.
Equity Market
Review of Indian Market - 2016 3
3 Sectors to Watch in 2017 4
Stock Recommendations 5- 10
Mutual Funds
Snapshot of Mutual Funds Industry 12-13
Why ELSS is a Better Tax Saving Investment 14-15
Mutual Funds Model Portfolios - 2017 16-17
Recommended Mutual Funds 18-19
Other Investments
Fixed Deposits 21-22
IIFL Value PMS 23
Annexure
Asset Allocation 25
Equity Portfolio Allocation 26-28

2016 was a tepid year with full of surprises for investors. In thelatter half of 2016, the Indian equity market was under pressureas the market was taken aback by Brexit, US presidential electionresults and the demonetisation decision of the Modigovernment. The BSE Sensex closed modestly up by ~2% from31st December, 2015 levels.
FII’s continue to be the net buyers in Indian equity marketdespite enormous outflows of ~Rs 30,000 cr in the last 3 monthsof 2016. However they are net sellers in the Indian debt marketbecause of net outflow of ~Rs 46,000 cr in the last 3 months of2016. The domestic mutual funds also continue to be net buyersin equity and debt market in 2016. However, the quantum ofinvestment is less as compared to 2015.
3
Indian Market Change (%)
30-Dec-16 1 M 1 Y
S&P BSE Sensex 26,626 -0.1 1.9
Nifty 50 8,186 -0.5 3.0
Nifty Bank 18,117 -2.7 7.1
S&P BSE Mid-Cap 12,031 -3.7 8.0
S&P BSE Small-Cap 12,046 -2.3 1.8
Developed Markets Change (%)
30-Dec-16 1 M 1 Y
Dow Jones 19,763 3.3 13.4
Nasdaq 5,383 1.1 7.5
S&P 500 2,239 1.8 9.5
Hang Seng 22,001 -3.5 0.4
Nikkei 225 19,114 4.4 0.4
13056 15781
49253
-32887-40000
-20000
0
20000
40000
60000
2015 2016
FIIs Net Flows
Equity Net Flows (Rs cr) Debt Net Flows (Rs cr)
71000 44611
447275
332031
0
100000
200000
300000
400000
500000
2015 2016
Domestic Mutual Funds Net Flows
Equity Net Flows (Rs cr) Debt Net Flows (Rs cr)
*figures and returns as on December 30, 2016. Note: Net FII flows and net MF flows for 2016 are as of December 29, 2016 for FIIs and December 27. 2016 for Domestic mutual funds
Review of Indian Market - 2016
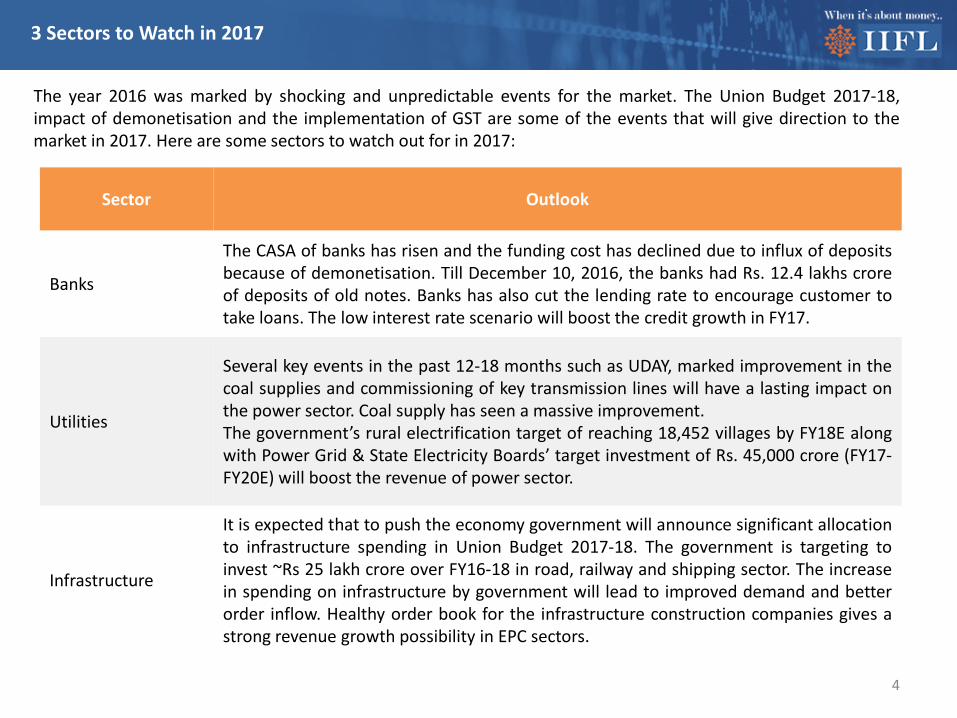
3 Sectors to Watch in 2017
4
The year 2016 was marked by shocking and unpredictable events for the market. The Union Budget 2017-18,impact of demonetisation and the implementation of GST are some of the events that will give direction to themarket in 2017. Here are some sectors to watch out for in 2017:
Sector Outlook
Banks
The CASA of banks has risen and the funding cost has declined due to influx of depositsbecause of demonetisation. Till December 10, 2016, the banks had Rs. 12.4 lakhs croreof deposits of old notes. Banks has also cut the lending rate to encourage customer totake loans. The low interest rate scenario will boost the credit growth in FY17.
Utilities
Several key events in the past 12-18 months such as UDAY, marked improvement in thecoal supplies and commissioning of key transmission lines will have a lasting impact onthe power sector. Coal supply has seen a massive improvement.The government’s rural electrification target of reaching 18,452 villages by FY18E alongwith Power Grid & State Electricity Boards’ target investment of Rs. 45,000 crore (FY17-FY20E) will boost the revenue of power sector.
Infrastructure
It is expected that to push the economy government will announce significant allocationto infrastructure spending in Union Budget 2017-18. The government is targeting toinvest ~Rs 25 lakh crore over FY16-18 in road, railway and shipping sector. The increasein spending on infrastructure by government will lead to improved demand and betterorder inflow. Healthy order book for the infrastructure construction companies gives astrong revenue growth possibility in EPC sectors.

Stock Recommendations
Stock CMP Target Price Upside
1 CESC Rs 637 Rs 760 22%
2 ONGC Rs 191.45 Rs 230 21%
3 Maruti Suzuki India Ltd Rs 5,323 Rs 6,175 16%
4 Power Grid Corporation of India Rs 183 Rs 210 15%
5 City Union Bank Rs 129 Rs 155 20%
5*CMP as on December 30, 2016.
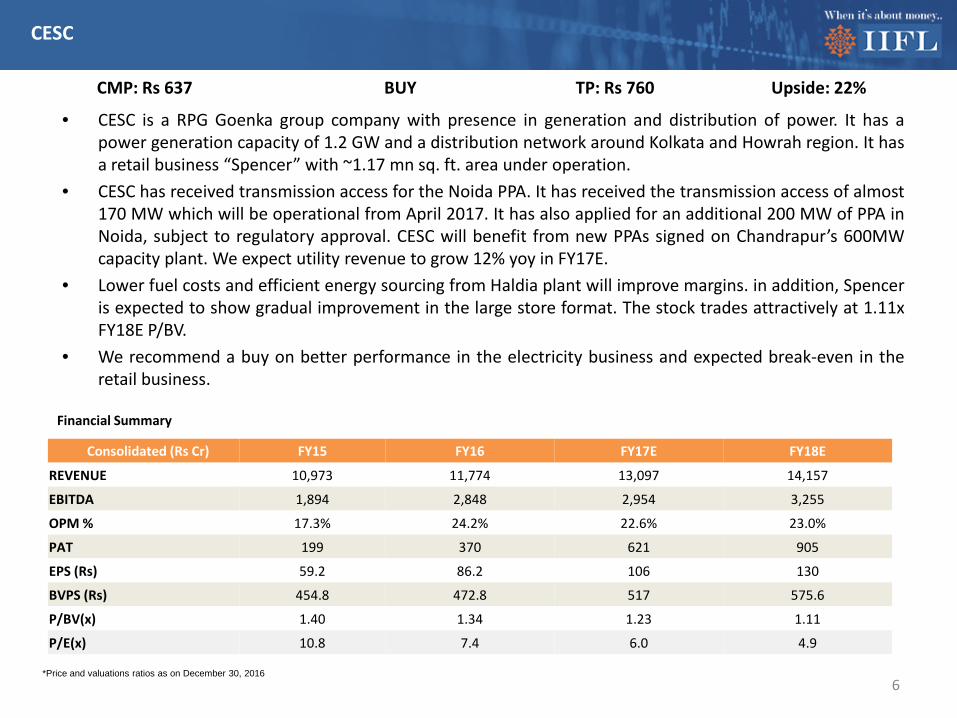
• CESC is a RPG Goenka group company with presence in generation and distribution of power. It has apower generation capacity of 1.2 GW and a distribution network around Kolkata and Howrah region. It hasa retail business “Spencer” with ~1.17 mn sq. ft. area under operation.
• CESC has received transmission access for the Noida PPA. It has received the transmission access of almost170 MW which will be operational from April 2017. It has also applied for an additional 200 MW of PPA inNoida, subject to regulatory approval. CESC will benefit from new PPAs signed on Chandrapur’s 600MWcapacity plant. We expect utility revenue to grow 12% yoy in FY17E.
• Lower fuel costs and efficient energy sourcing from Haldia plant will improve margins. in addition, Spenceris expected to show gradual improvement in the large store format. The stock trades attractively at 1.11xFY18E P/BV.
• We recommend a buy on better performance in the electricity business and expected break-even in theretail business.
6
CMP: Rs 637 BUY TP: Rs 760 Upside: 22%
Consolidated (Rs Cr) FY15 FY16 FY17E FY18E
REVENUE 10,973 11,774 13,097 14,157
EBITDA 1,894 2,848 2,954 3,255
OPM % 17.3% 24.2% 22.6% 23.0%
PAT 199 370 621 905
EPS (Rs) 59.2 86.2 106 130
BVPS (Rs) 454.8 472.8 517 575.6
P/BV(x) 1.40 1.34 1.23 1.11
P/E(x) 10.8 7.4 6.0 4.9
Financial Summary
CESC
*Price and valuations ratios as on December 30, 2016
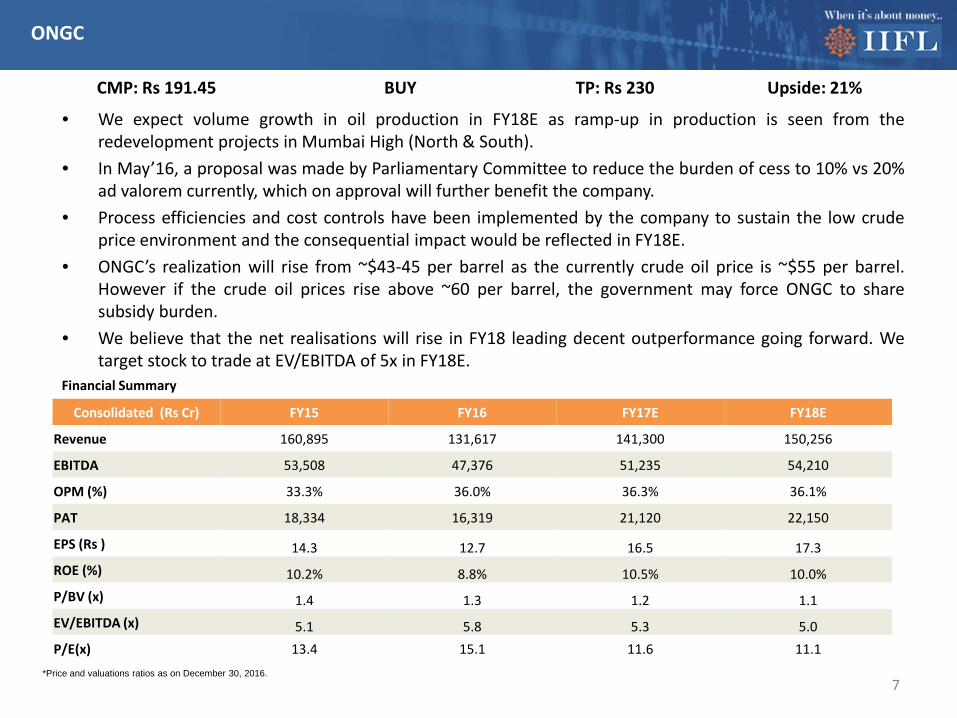
• We expect volume growth in oil production in FY18E as ramp-up in production is seen from theredevelopment projects in Mumbai High (North & South).
• In May’16, a proposal was made by Parliamentary Committee to reduce the burden of cess to 10% vs 20%ad valorem currently, which on approval will further benefit the company.
• Process efficiencies and cost controls have been implemented by the company to sustain the low crudeprice environment and the consequential impact would be reflected in FY18E.
• ONGC’s realization will rise from ~$43-45 per barrel as the currently crude oil price is ~$55 per barrel.However if the crude oil prices rise above ~60 per barrel, the government may force ONGC to sharesubsidy burden.
• We believe that the net realisations will rise in FY18 leading decent outperformance going forward. Wetarget stock to trade at EV/EBITDA of 5x in FY18E.
7
CMP: Rs 191.45 BUY TP: Rs 230 Upside: 21%
Consolidated (Rs Cr) FY15 FY16 FY17E FY18E
Revenue 160,895 131,617 141,300 150,256
EBITDA 53,508 47,376 51,235 54,210
OPM (%) 33.3% 36.0% 36.3% 36.1%
PAT 18,334 16,319 21,120 22,150
EPS (Rs ) 14.3 12.7 16.5 17.3ROE (%) 10.2% 8.8% 10.5% 10.0%P/BV (x) 1.4 1.3 1.2 1.1EV/EBITDA (x) 5.1 5.8 5.3 5.0P/E(x) 13.4 15.1 11.6 11.1
Financial Summary
ONGC
*Price and valuations ratios as on December 30, 2016.
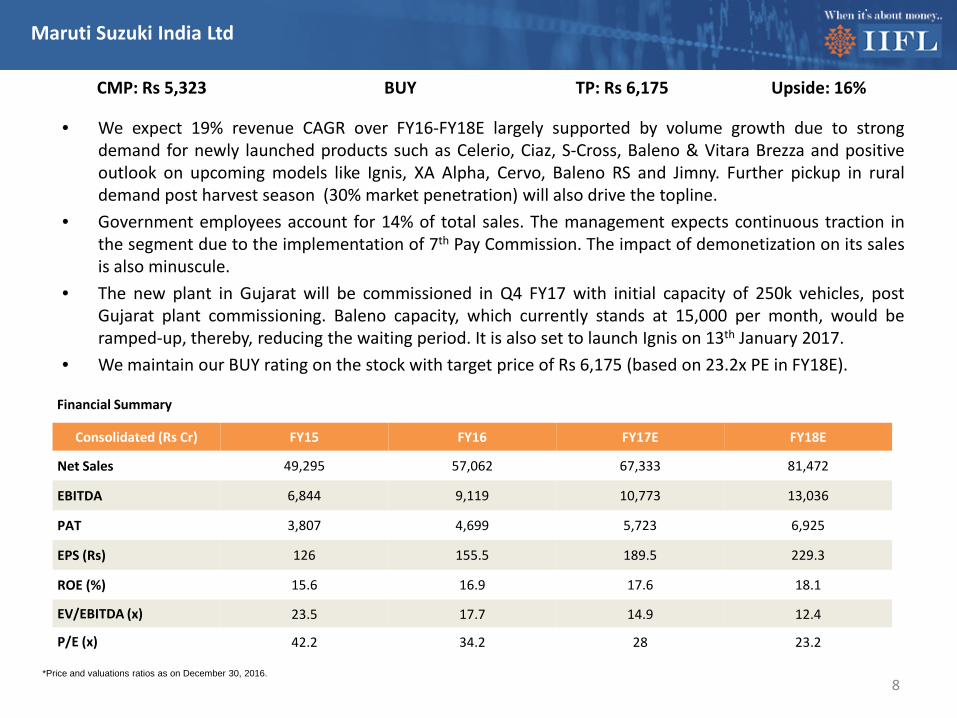
• We expect 19% revenue CAGR over FY16-FY18E largely supported by volume growth due to strongdemand for newly launched products such as Celerio, Ciaz, S-Cross, Baleno & Vitara Brezza and positiveoutlook on upcoming models like Ignis, XA Alpha, Cervo, Baleno RS and Jimny. Further pickup in ruraldemand post harvest season (30% market penetration) will also drive the topline.
• Government employees account for 14% of total sales. The management expects continuous traction inthe segment due to the implementation of 7th Pay Commission. The impact of demonetization on its salesis also minuscule.
• The new plant in Gujarat will be commissioned in Q4 FY17 with initial capacity of 250k vehicles, postGujarat plant commissioning. Baleno capacity, which currently stands at 15,000 per month, would beramped-up, thereby, reducing the waiting period. It is also set to launch Ignis on 13th January 2017.
• We maintain our BUY rating on the stock with target price of Rs 6,175 (based on 23.2x PE in FY18E).
8
CMP: Rs 5,323 BUY TP: Rs 6,175 Upside: 16%
Consolidated (Rs Cr) FY15 FY16 FY17E FY18E
Net Sales 49,295 57,062 67,333 81,472
EBITDA 6,844 9,119 10,773 13,036
PAT 3,807 4,699 5,723 6,925
EPS (Rs) 126 155.5 189.5 229.3
ROE (%) 15.6 16.9 17.6 18.1
EV/EBITDA (x) 23.5 17.7 14.9 12.4
P/E (x) 42.2 34.2 28 23.2
Financial Summary
Maruti Suzuki India Ltd
*Price and valuations ratios as on December 30, 2016.

• PGCIL is India’s Central Transmission Utility (CTU) owned by the Government of India (57.9% stake). PGCILhas transmission networks spanning over 125,000 circuit kms. Currently, it carries 45% of India’s totalgenerated electricity. PGCIL has telecom and consulting business (<5% of revenue).
• We expect project execution momentum to sustain beyond FY17E, given a strong pipeline of projectsworth Rs 1.44 trn that are likely to commission over the next 4-5 years. It expects to award projects worthRs 45,000 Cr over the next 12-24 months. Revenues are expected to grow 17% yoy in FY17E.
• Ramp up in project commissions going forward will drive up operating profits. Commissioning projects willbe at the core of transmission earnings. ROE will rise on the back of strong bottom-line because increasein top-line will rise and stable OPM.
• Given strong outlook on execution, we see 22% earnings CAGR through FY16-18ii. With one of thestrongest earnings growth across the sectors, receding regulatory and sectorial risks, and inexpensivevaluations at 1.7x FY18E P/BV imply significant scope for the valuation multiples to expand.
9
CMP: Rs 183 BUY TP: Rs 210 Upside: 15%
Financial Summary
Power Grid Corporation of India
*Price and valuations ratios as on December 30, 2016.
Consolidated (Rs Cr) FY15 FY16 FY17E FY18E
REVENUE 17,177 20,802 25,740 29,612
EBITDA 14,798 18,280 22,781 26,273
OPM % 86.2% 87.9% 89.9% 89.4%
PAT 5,026 5,962 7,601 8,781
EPS (Rs) 19 23 29 33
BVPS (Rs) 73 82 93 105
P/BV(x) 2.5 2.2 1.9 1.7
P/E(x) 9.6 8.0 6.3 5.5
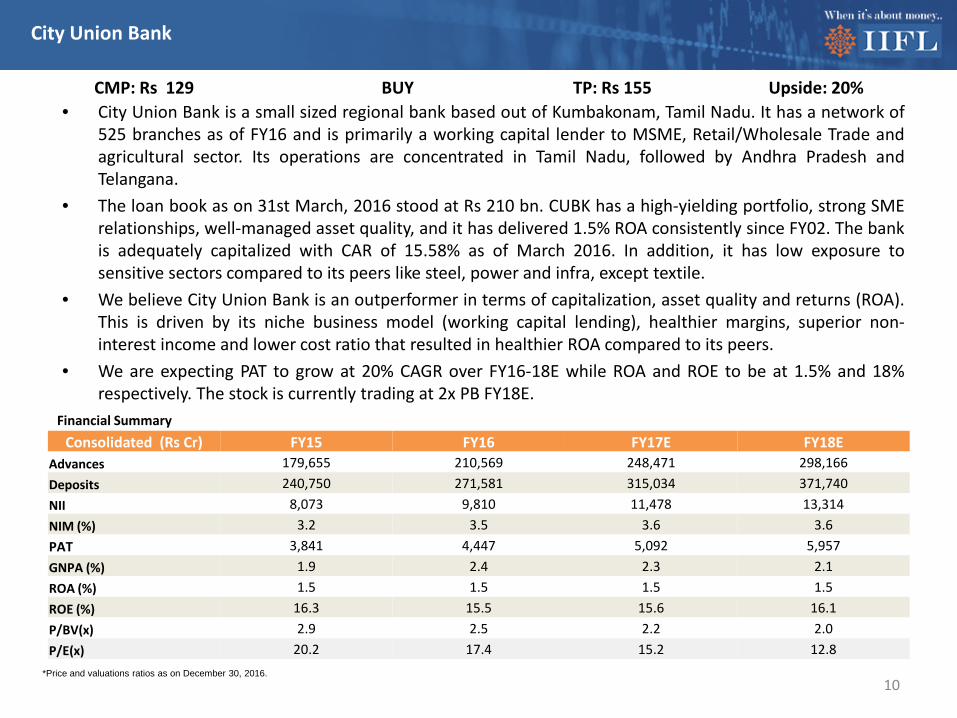
• City Union Bank is a small sized regional bank based out of Kumbakonam, Tamil Nadu. It has a network of525 branches as of FY16 and is primarily a working capital lender to MSME, Retail/Wholesale Trade andagricultural sector. Its operations are concentrated in Tamil Nadu, followed by Andhra Pradesh andTelangana.
• The loan book as on 31st March, 2016 stood at Rs 210 bn. CUBK has a high-yielding portfolio, strong SMErelationships, well-managed asset quality, and it has delivered 1.5% ROA consistently since FY02. The bankis adequately capitalized with CAR of 15.58% as of March 2016. In addition, it has low exposure tosensitive sectors compared to its peers like steel, power and infra, except textile.
• We believe City Union Bank is an outperformer in terms of capitalization, asset quality and returns (ROA).This is driven by its niche business model (working capital lending), healthier margins, superior non-interest income and lower cost ratio that resulted in healthier ROA compared to its peers.
• We are expecting PAT to grow at 20% CAGR over FY16-18E while ROA and ROE to be at 1.5% and 18%respectively. The stock is currently trading at 2x PB FY18E.
10
CMP: Rs 129 BUY TP: Rs 155 Upside: 20%
Financial Summary
City Union Bank
*Price and valuations ratios as on December 30, 2016.
Consolidated (Rs Cr) FY15 FY16 FY17E FY18EAdvances 179,655 210,569 248,471 298,166Deposits 240,750 271,581 315,034 371,740NII 8,073 9,810 11,478 13,314NIM (%) 3.2 3.5 3.6 3.6PAT 3,841 4,447 5,092 5,957GNPA (%) 1.9 2.4 2.3 2.1ROA (%) 1.5 1.5 1.5 1.5ROE (%) 16.3 15.5 15.6 16.1P/BV(x) 2.9 2.5 2.2 2.0P/E(x) 20.2 17.4 15.2 12.8
Mutual Funds
11
Type (Rs thousand cr) Nov-16 Nov-15 Change
(yoy)
Hybrid Funds 188 144 31%
Debt Funds 1,058 817 30%
Equity Funds 452 398 14%
Commodity Funds 8 7 9%
Total 1,706 1,366 25%
12
Category (Rs thousand cr) Nov-16 Nov-15 Change
(yoy)Income 364 270 35%
Diversified 330 294 13%
Liquid 296 259 15%
Ultra Short Term Plan 217 144 51%
Balanced Funds 120 84 42%
Fixed Maturity Plans 110 86 28%
Equity Linked Savings Scheme 53 45 17%
Floating Rate 43 30 43%
Arbitrage Funds 35 32 11%
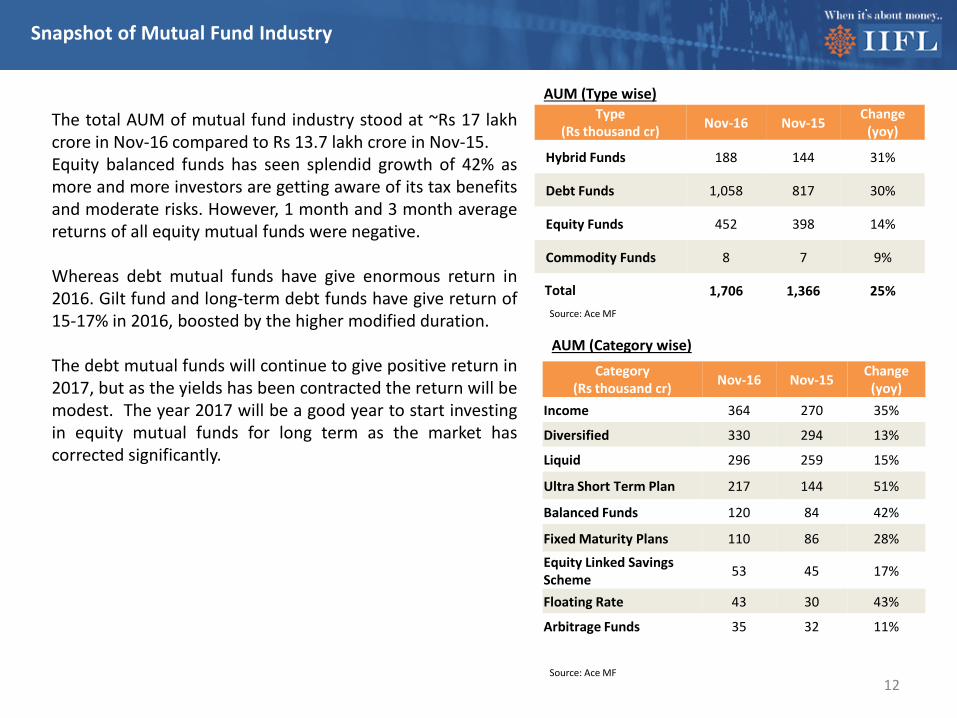
The total AUM of mutual fund industry stood at ~Rs 17 lakhcrore in Nov-16 compared to Rs 13.7 lakh crore in Nov-15.Equity balanced funds has seen splendid growth of 42% asmore and more investors are getting aware of its tax benefitsand moderate risks. However, 1 month and 3 month averagereturns of all equity mutual funds were negative.
Whereas debt mutual funds have give enormous return in2016. Gilt fund and long-term debt funds have give return of15-17% in 2016, boosted by the higher modified duration.
The debt mutual funds will continue to give positive return in2017, but as the yields has been contracted the return will bemodest. The year 2017 will be a good year to start investingin equity mutual funds for long term as the market hascorrected significantly.
AUM (Type wise)
AUM (Category wise)
Snapshot of Mutual Fund Industry
Source: Ace MF
Source: Ace MF

13
Equity Mutual Funds Category Returns
Category 1 M (%) 3 M (%) 6 M (%) 1 Y (%) 3 Y (%) 5 Y (%)Liquid funds 0.5 1.6 3.4 7.4 8.1 8.6Ultra-short term funds 0.2 1.8 4.2 8.6 8.7 8.9Short-term funds -0.4 2.0 5.2 9.8 9.4 9.1Medium-term Funds -0.6 2.2 5.9 10.6 10.0 9.5Long-term funds -1.5 2.3 7.0 12.0 10.6 9.4Gilt Funds -2.0 2.9 8.7 14.6 12.1 10.1MIP -1.5 0.4 5.3 10.2 11.6 10.6Crisil Liquid Fund Index 0.5 1.6 3.4 7.5 8.3 8.5Crisil Composite Bond Fund -1.3 2.5 7.6 12.9 12.0 9.7
Debt Mutual Funds Category Returns
Category-wise Return of Mutual Funds
Category 1 M (%) 3 M (%) 6 M (%) 1 Y (%) 3 Y (%) 5 Y (%)Balanced - Equity-Oriented -1.7 -3.6 2.5 6.9 15.5 16.1ELSS -1.9 -6.5 0.7 4.7 17.3 17.6Large-cap -1.7 -6.2 0.3 4.2 13.6 14.6Mid-cap -3.0 -7.1 1.7 5.0 25.3 23.7Multi-cap -1.8 -5.5 2.2 6.6 18.5 17.9Small-cap -1.9 -4.4 2.9 7.0 29.7 26.7S&P BSE SENSEX -0.1 -4.4 -1.4 2.6 8.0 11.5S&P BSE Mid-Cap -3.7 -8.6 2.7 8.3 21.8 18.5S&P BSE Small-Cap -2.3 -5.7 2.1 2.3 22.6 16.7
Returns less than 1 year are absolute; Returns greater then 1 year are CAGR. Returns and Ratios as on December 30, 2016Source: ACE MF

Why ELSS is a Better Tax Saving Investment
14
Tax saving is a priority of every salaried/self-employed individual with new financial year around the corner. Aninvestor is eligible for tax deduction up to Rs 1.5 lakh p.a. u/s 80c of the income tax act 1961. ELSS is a betterway to save tax and create wealth in long term. Besides, the long-term capital gain and dividend earned in ELSSscheme are tax-free. However, an investor should analyse the different ELSS schemes before investing based onhis needs and risk appetite.
Suppose, if a person has an annual income of Rs 12 lakhs. Total tax to be paid will be ~Rs 1.91 lakhs. However, ifhe invests in tax saving scheme u/s 80C, he can save tax of Rs 46,350 (30% tax bracket) and is required to pay~Rs 1.44 lakh as a total tax.
Particulars Amount
Annual Income Rs 12,00,000
Tax before investing in tax saving scheme u/s 80C Rs 1,90,550
Tax after investing in tax saving scheme u/s 80C Rs 1,44,200
Tax saved Rs 46,350

Why ELSS is a Better Tax Saving Investment
15
Benefits Explanation
Less lock-in period ELSS has the shortest lock-in period of 3 years as compared to other tax saving instrument.
Creates wealth in long run
Historically, ELSS has given average return of 12% p.a. Whereas, other instruments such as FDs andPPF have given a return of ~8 to 9% p.a.
Gives investment option
ELSS offers two investment options - dividend option and growth option to investors. In growthoption, the dividend is not paid to investor by an ELSS scheme. On the other hand, in dividendoption investors get the dividend whenever declared by an ELSS scheme.
Dividends are tax-free
In dividend option, dividends earned are tax-free in the hands of the customer right from the yearof investment. In addition, the long-term capital gains from the investment are also tax-free.
Below mentioned are ELSS schemes are best in the industry as they have given enormous returns in long-term.
Equity Linked Saving Schemes Category FundManager
Corpus (Rs Cr)
1 M (%)
6 M (%)
1 Y (%)
3 Y (%)
5 Y (%) Beta
Axis LT Equity Fund(G) ELSS Jinesh Gopani 10,999 -2.9 -3.5 -0.1 20.8 22.3 0.84
Birla SL Tax Relief '96(G) ELSS Mahesh Patil 2,541 0.0 0.4 4.2 20.7 21.0 0.28
Reliance Tax Saver (ELSS) Fund(G) ELSS AshwaniKumar 5,792 -2.4 2.2 4.7 22.9 22.8 1.09
Returns less than 1 year are absolute; Returns greater then 1 year are CAGR. Corpus as on : Nov 2016 ; Returns and Ratios as on December 30, 2016Source: ACE MF

Mutual Funds Model Portfolios - 2017
16
Conservative Model Portfolio
Sr. No. Scheme Category Sub-Category Corpus (Rs Cr)
Allocation(%) 1 Y (%) 3 Y (%) 5 Y (%)
1 ICICI Pru Income Opportunities Fund(G) Debt Long Term 3,737 20 11.4 11.5 9.9
2 HDFC Medium Term Opportunities Fund(G) Debt Medium
Term 8,968 20 10.7 10.1 9.6
3 ICICI Pru Balanced Fund(G) Balanced Funds
Equity Oriented 4,627 20 14.0 19.1 19.4
4 Reliance Growth Fund(G) Equity Large-cap 5,501 20 4.0 19.6 18.05 SBI BlueChip Fund-Reg(G) Equity Large-cap 9,735 20 5.4 18.8 20.0
Moderate Model Portfolio
Sr. No. Scheme Category Sub-Category Corpus (Rs Cr)
Allocation(%) 1 Y (%) 3 Y (%) 5 Y (%)
1 ICICI Pru Income Opportunities Fund(G) Debt Long Term 3,737 25 11.4 11.5 9.9
2 HDFC Prudence Fund(G) Balanced Funds
Equity-Oriented 14,636 20 9.6 18.6 17.2
3 ICICI Pru Balanced Fund(G) Balanced Funds
Equity Oriented 4,627 25 14.0 19.1 19.4
4 SBI BlueChip Fund-Reg(G) Equity Large-cap 9,735 15 5.4 18.8 20.05 IIFL India Growth Fund-Reg(G) Equity Multi-cap 243 15 10.5 NA NA
Returns less than 1 year are absolute; Returns greater then 1 year are CAGR. Corpus as on : Nov 2016 ; Returns and Ratios as on December 30, 2016Source: ACE MF
Mutual Funds Model Portfolios - 2017
17
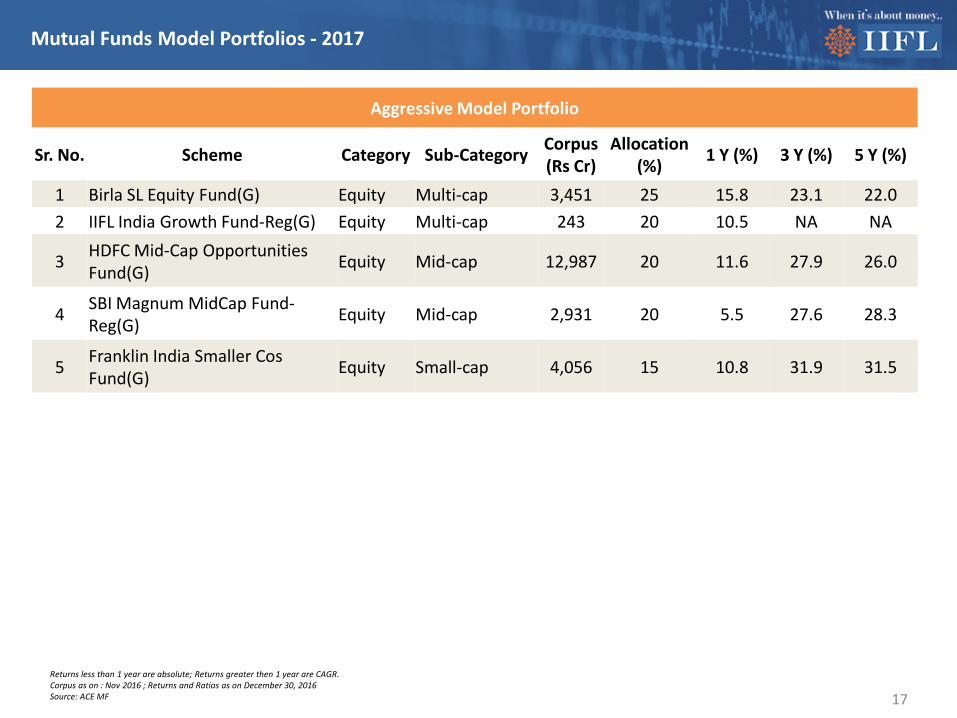
Aggressive Model Portfolio
Sr. No. Scheme Category Sub-Category Corpus (Rs Cr)
Allocation(%) 1 Y (%) 3 Y (%) 5 Y (%)
1 Birla SL Equity Fund(G) Equity Multi-cap 3,451 25 15.8 23.1 22.02 IIFL India Growth Fund-Reg(G) Equity Multi-cap 243 20 10.5 NA NA
3 HDFC Mid-Cap Opportunities Fund(G) Equity Mid-cap 12,987 20 11.6 27.9 26.0
4 SBI Magnum MidCap Fund-Reg(G) Equity Mid-cap 2,931 20 5.5 27.6 28.3
5 Franklin India Smaller Cos Fund(G) Equity Small-cap 4,056 15 10.8 31.9 31.5
Returns less than 1 year are absolute; Returns greater then 1 year are CAGR. Corpus as on : Nov 2016 ; Returns and Ratios as on December 30, 2016Source: ACE MF

Recommended Mutual Funds
18
Diversified Equity Mutual Funds Category Fund Manager Corpus (Rs Cr)
1 M (%)
6 M (%)
1 Y (%)
3 Y (%)
5 Y (%) Beta
Reliance Growth Fund(G) Large Cap Sunil Singhania 5,501 -2.9 1.5 4 19.6 18 0.98
SBI BlueChip Fund-Reg(G) Large Cap Sohini Andani 9,735 -2.1 -1.1 5.4 18.8 20 0.90
Birla SL Equity Fund(G) Multi-cap Anil Shah 3,451 -2.3 8.4 15.8 23.1 22 0.97
IIFL India Growth Fund-Reg(G) Multi-cap Prashasta Seth 243 -2.9 5.3 10.5 NA NA 0.90
HDFC Mid-Cap Opportunities Fund(G) Mid-cap Chirag Setalvad 12,987 -2.8 5.7 11.6 27.9 26 0.85
SBI Magnum MidCap Fund-Reg(G) Mid-cap Sohini Andani 2,931 -3.5 -1 5.5 27.6 28.3 0.78
Franklin India Smaller Cos Fund(G) Small-cap R. Janakiraman 4,056 -2.3 1.6 10.8 31.9 31.5 0.81
Reliance Small Cap Fund(G) Small-cap Sunil Singhania 2,628 -1.7 6.6 6.1 34.1 30.6 1.00
Returns less than 1 year are absolute; Returns greater then 1 year are CAGR. Corpus as on : Nov 2016 ; Returns and Ratios as on December 30, 2016Source: ACE MF

Recommended Mutual Funds
19
Hybrid Mutual Funds Category Fund Manager Corpus (Rs Cr)
1 M (%)
6 M (%)
1 Y (%)
3 Y (%)
5 Y (%) Beta
HDFC Prudence Fund(G) Balanced Fund -equity oriented Prashant Jain 14,636 -3 6.1 9.6 18.6 17.2 0.31
ICICI Pru Balanced Fund(G) Balanced Fund -equity oriented
Sankaran Naren 4,627 -0.8 7.6 14 19.1 19.4 0.26
ICICI Pru Equity-Arbitrage Fund(G)
Arbitrage Funds-equity oriented Kayzad Eghlim 6,107 0.4 3.3 6.8 7.6 8.5 0.00
Reliance Arbitrage Advantage Fund(G)
Arbitrage Funds-equity oriented Payal Kaipunjal 3,817 0.5 3.3 6.5 7.5 8.4 0.01
Debt Mutual Funds Category Fund Manager Corpus (Rs Cr)
1 M (%)
6 M (%)
1 Y (%)
3 Y (%)
5 Y (%) Beta
ICICI Pru Income Opportunities Fund(G) Long-term Manish
Banthia 3,527 -1 6.9 11.4 11.5 9.9 0.23
HDFC Medium Term Opportunities Fund(G) Medium Term Anupam Joshi 8,382 -0.6 5.7 10.7 10.1 9.6 0.14
HDFC STP(G) Short-term Anil Bamboli 3,679 0 5.3 10.3 10.2 9.5 0.08
Reliance Money Manager Fund(G)
Ultra-Short Term Plan Amit Tripathi 15,382 0.3 4.1 8.6 8.7 9 0.04
Returns less than 1 year are absolute; Returns greater then 1 year are CAGR. Corpus as on : Nov 2016 ; Returns and Ratios as on December 30, 2016Source: ACE MF

Other Investments
20

Fixed Deposits
Shiriram Unnati Fixed Deposits
21
Fixed Deposit Rate Matrix
Normal SchemeNon-Cumulative Scheme Rates (p.a.) Cumulative Scheme Rates (p.a.)
Period (Years) Monthly Quarterly Half Yearly Yearly
Rate % p.a.Compounded
monthly
EffectiveInterest
rates
Maturity value of Rs 5,000
1 7.72% 7.77% 7.85% 8.00% 7.72% 8.00% Rs 5,4002 7.81% 7.86% 7.94% 8.10% 7.81% 8.10% Rs 5,8423 7.95% 8.00% 8.08% 8.25% 7.95% 8.25% Rs 6,3424 8.14% 8.20% 8.28% 8.45% 8.14% 8.45% Rs 6,9175 8.19% 8.25% 8.33% 8.50% 8.19% 8.50% Rs 7,520
Key Features Rating : FAAA Stable by CRISIL & MAA+/ Stable by ICRA Minimum Investment: Rs 10,000 for non-cumulative deposits and Rs 5,000 for cumulative deposits. Additional deposits in multiples of Rs 1,000. Additional interest of 0.23-0.25% for senior citizens**. Cumulative deposits can be renewed at maturity value.
*Terms and conditions applyInterest rates w.e.f. 10th October 2016

DHFL Health2Wealth
22
Fixed Deposit Rate Matrix
Normal Scheme (Deposits below Rs 50 lakh)Non-Cumulative Scheme Rates (p.a.) Cumulative Scheme Rates (p.a.)
Period (Years) Monthly Quarterly Half Yearly Yearly
Rate % p.a.Compounded
monthly
EffectiveInterest
rates
Maturity value of
Rs 25,0001 7.90% 8.00% 8.05% 8.25% 8.25% 8.57% Rs 27,1422 7.95% 8.00% 8.05% 8.30% 8.30% 8.62% Rs 29,4973 8.30% 8.00% 8.05% 8.30% 8.30% 8.62% Rs 32,041
4-10 8.50% 8.20% 8.30% 8.50% 8.50% 8.84% Rs 35,082 -Rs 58,316
Key Features: Rating : Brickwork FAAA and CARE AAA (FD) Minimum deposit: Rs 25,000, thereafter in multiples of Rs 1,000. Interest Cashless access to empanelled hospitals/diagnostic centers* Compounded half yearly. Free of premium Rs 1 lakh accidental death insurance to every individual depositor of first depositor
incase of joint holding. Additional interest of 0.25% for privilege customers** Additional interest rate of 0.25% deposits equal to or above Rs 50 lakh.
*Terms and conditions apply**Privilege customers: Senior Citizens, existing DHFl home loan / SME loan/ mortgage loan borrowers, armed forces personnel, widows (appropriate Proof should be attached)
Fixed Deposits

IIFL Value PMS
Investment Objective• To generate capital appreciation from a medium to long term perspective.
Investment Philosophy • Emphasis on fundamentally sound, well researched companies perceived to be undervalued
considering their medium to long term growth prospects.• Focus will be on medium to large capitalization companies
– Companies which have a proven track record or earning capability, quality management, leadership status in sectors or potential to achieve such status.
– Companies which have potential to deliver growth over the long term.
23
Return 1 month 3 months 6 months 1 yearPortfolio -1.3% -3.9% 6.3% 9.3%Benchmark – CNX Nifty 50 -0.5% -4.9% -1.2% 3.7%
Outperformance (Alpha) -0.8% 1.1% 7.6% 5.7%* Returns as on December 30, 2016
Fee Structure
Annual Management Fee (charged upfront) Fees
Rs 25 lakh to Rs 1 crore 1.50%Above Rs 1 crore 1.00%
• An exit load of 2% will be charged if the fund is withdrawn within 1 year of activation. No exit load after 1 year.• Transaction charges is 0.50%, as charged by broker.• 10% annual profit sharing on total profit above the hurdle rate of 10%.
Annexure • Asset Allocation• Equity Portfolio Allocation
24
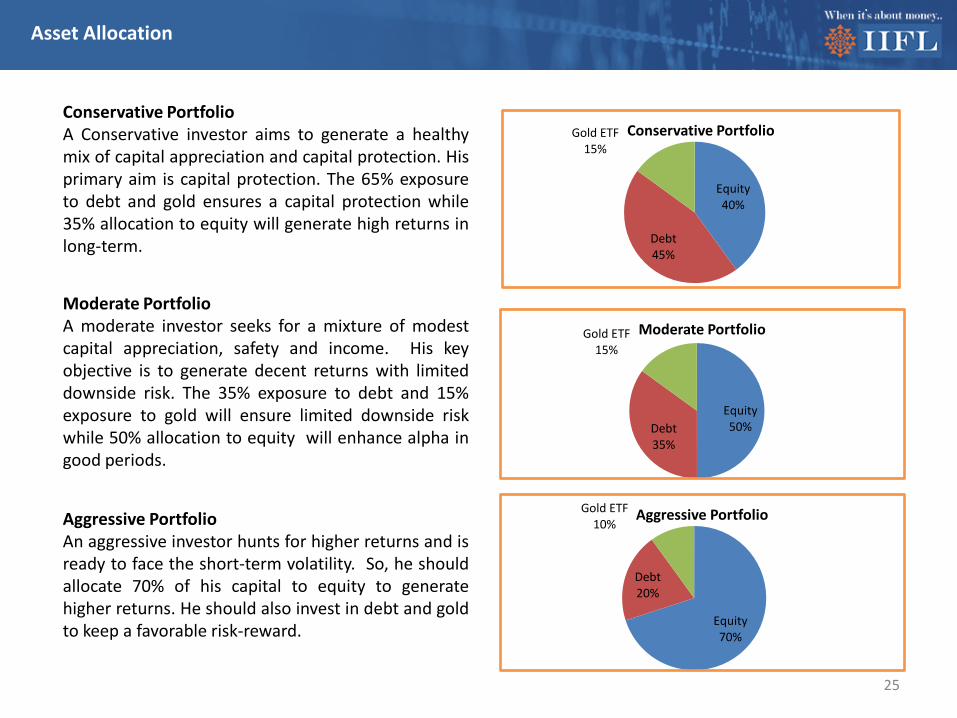
Asset Allocation
Equity40%
Debt45%
Gold ETF15%
Conservative Portfolio
25
Equity50%Debt
35%
Gold ETF15%
Moderate Portfolio
Equity70%
Debt20%
Gold ETF10%
Aggressive Portfolio
Conservative PortfolioA Conservative investor aims to generate a healthymix of capital appreciation and capital protection. Hisprimary aim is capital protection. The 65% exposureto debt and gold ensures a capital protection while35% allocation to equity will generate high returns inlong-term.
Moderate PortfolioA moderate investor seeks for a mixture of modestcapital appreciation, safety and income. His keyobjective is to generate decent returns with limiteddownside risk. The 35% exposure to debt and 15%exposure to gold will ensure limited downside riskwhile 50% allocation to equity will enhance alpha ingood periods.
Aggressive PortfolioAn aggressive investor hunts for higher returns and isready to face the short-term volatility. So, he shouldallocate 70% of his capital to equity to generatehigher returns. He should also invest in debt and goldto keep a favorable risk-reward.
Equity Portfolios Allocation
Conservative Portfolio
Sr. No. Stocks Sector Allocation
1 Tata Motors DVR Auto 9%
2 Motheson Sumi Auto 8%
3 HDFC Bank Bank & NBFC 9%
4 PFC Bank & NBFC 8%
5 Tata Power Power 10%
6 HPCL Oil & Gas 8%
7 Britannia FMCG 7%
8 Persistent IT 7%
9 ONGC Oil & Gas 8%
10 Lupin Pharma 8%
11 Wipro IT 8%
12 Power Grid Power 10%
Total 100%
26
Equity Portfolios Allocation
27
Moderate Portfolio
Sr. No. Stocks Sector Allocation
1 Tata Motors DVR Auto 8%
2 Motherson Sumi Auto 7%
3 Maruti Suzuki Auto 7%
4 SBI Bank BFSI 8%
5 HDFC Bank BFSI 9%
6 City Union Bank BFSI 6%
7 ONGC Oil & Gas 8%
8 KEC International Capital Goods 8%
9 CESC Power 8%
10 Tech Mahindra IT 7%
11 HPCL Oil & Gas 8%
12 Sunpharma Pharma 8%
13 Power Grid Power 8%
Total 100%

Equity Portfolios Allocation
28
Aggressive Portfolio
Sr. No. Stocks Sector Allocation
1 Tata Motors DVR Auto 7%
2 Bank of Baroda BFSI 8%
3 SBI Bank BFSI 8%
4 Kotak Mahindra Bank BFSI 7%
5 City Union Bank BFSI 7%
6 Maruti Suzuki Auto 7%
7 KEC International Capital Goods 9%
8 Carborundum Universal Capital Goods 9%
9 HCL Tech IT 8%
10 Navneet Education Miscelleneous 7%
11 CESC Power 8%
12 ICICI Prudential Life Insurance Insurance 6%
13 Arvind Ltd Textiles 9%
Total 100%
Disclosure
• Mutual Fund investments are subject to market risks, read all scheme related documents carefully.• Nothing in this document constitutes investment, legal, accounting or tax advice or a representation that any investment or strategy is suitable or appropriate to the investor's specific
circumstances. The details included are based on information obtained from public sources and sources believed to be reliable, but no independent verification has been made nor is its accuracy or completeness guaranteed.
• Investors should consult their financial advisers if in doubt about whether the product is suitable for them. The fund may or may not be suitable for all investors, who must make their own investment decisions, based on their own investment objectives, financial positions and needs. This document may not be taken in substitution for the exercise of independent judgment by any investor. The investor should independently evaluate the investment risks.
• India Infoline Ltd. or any of its director/s or principal officer/employees and associate companies (IIFL) does not assure/give guarantee for accuracy of any of the facts/interpretations in this document, and shall not be liable to any person including the beneficiary for any claim or demand for damages or otherwise in relation to this opinion or its contents.
• The aimed returns mentioned anywhere in this document are purely indicative and are not promised or guaranteed in any manner. Returns are dependent on prevalent market factors, liquidity and credit conditions. Instrument returns depicted are in the current context and may be significantly different in the future.
• The group company of India Infoline Limited, IIFL Wealth Management Limited is the Sponsor of IIFL Mutual Fund and holding company of the Investment Manager & Trustee Company of IIFL Mutual Fund.
• IIFL or its subsidiaries & affiliates may be holding all or any of the units of the scheme(s), referred in the document. The information contained herein is strictly confidential and meant solely for the selected recipient and may not be altered in any way, transmitted to, copied or distributed, in part or in whole, to any other person or to the media or reproduced in any form, without prior written consent of IIFL. While due care has been taken in preparing this document, IIFL and its affiliates accept no liabilities for any loss or damage of any kind arising out of any inaccurate, delayed or incomplete information nor for any actions taken in reliance thereon.
• This document is not directed or intended for distribution to, or use by, any person or entity who is a citizen or resident of or located in any locality, state, country or other jurisdiction, where such distribution, publication, availability or use would be contrary to law, regulation or which would subject IIFL or its affiliates to any registration or licensing requirement within such jurisdiction. IIFL and/or its associates receive compensation/ commission for distribution of Mutual Funds from various Asset Management Companies (AMCs).
• IIFL hosts the details of the commission rates earned by IIFL from Mutual Fund houses on our website https://ttweb.indiainfoline.com/trade/downloads/brokerage%20file.pdf. Hence, IIFL or its associates may have received compensation from AMCs whose funds are mentioned in the report during the period preceding twelve months from the date of this report for distribution of Mutual Funds or for providing marketing advertising support to these AMCs. IIFL group, associate and subsidiary companies are engaged in providing various financial services and for the said services (including the service for acquiring and sourcing the units of the fund) may earn fees or remuneration in form of arranger fees, referral fees, advisory fees, management fees, trustee fees, Commission, brokerage, transaction charges, underwriting charges, issue management fees and other fees.
• Please refer to http://www.indiainfoline.com/research/disclaimer for additional recommendation parameter, analyst disclaimer and other disclosures. • Published in 2016. © India Infoline Ltd 2016• India Infoline Limited (Formerly “India Infoline Distribution Company Limited”), CIN No.: U99999MH1996PLC132983, Corporate Office – IIFL Centre, Kamala City, Senapati Bapat Marg, Lower Parel,
Mumbai – 400013 Tel: (91-22) 4249 9000 Fax: (91-22) 40609049, Regd. Office – IIFL House, Sun Infotech Park, Road No. 16V, Plot No. B-23, MIDC, Thane Industrial Area, Wagle Estate, Thane –400604 Tel: (91-22) 25806650 Fax: (91-22) 25806654, E-mail: [email protected], Website: www.indiainfoline.com, refer www.indiainfoline.com for detail of Associates.
• National Stock Exchange of India Ltd. SEBI Regn. No. : INB231097537/ INF231097537/ INE231097537, BSE Ltd. SEBI Regn. No.:INB011097533/ INF011097533/ BSE-Currency, MCX Stock Exchange Ltd. SEBI Regn. No.: INB261097530/ INF261097530/ INE261097537, PMS SEBI Regn. No. INP000002213, IA SEBI Regn. No. INA000000623, SEBI RA Regn.:- INH000000248, ARN No.47791
• For Research related queries, write at [email protected] • For Sales and Account related information, write to customer care: [email protected] or call on 91-22 4007 1000
29


![CERVO. [Título do Livro] - Caps. 1 a 4](https://img.pdfslide.us/doc/110x75/55cf9d3c550346d033acce30/cervo-titulo-do-livro-caps-1-a-4.jpg)