Embed Size (px)
Citation preview
Investment Performance Report
Periods ended 06/30/2017
Singing River Health System Employees' Retirement Plan & Trust
Market Commentary Page 1
Total Plan Analysis Page 15
Investment Manager Analysis Page 33
MetWest Total Return Bond Page 34
III Credit Opportunities Page 36
Invesco Global Real Estate Page 38
Coho Partners Page 40
Schwab S&P 500 Index Fund Page 42
Sustainable Growth Advisers Page 44
Wedge Capital Mid Value Page 46
Disciplined Growth Mid Growth Page 48
Westfield Capital Small Growth Page 50
First Eagle Overseas Page 52
Lazard Emerging Markets Page 54
Appendix Page 56
Hybrid Composite History Page 57
Report Disclosures Page 58
Glossary Page 59
Table Of Contents
Market Commentary
Page 1
Joyland1
8/14/17 Copyright © 2017 FiduciaryVest, LLC. All rights reserved. This publication is not a suitable basis for investment decisions.
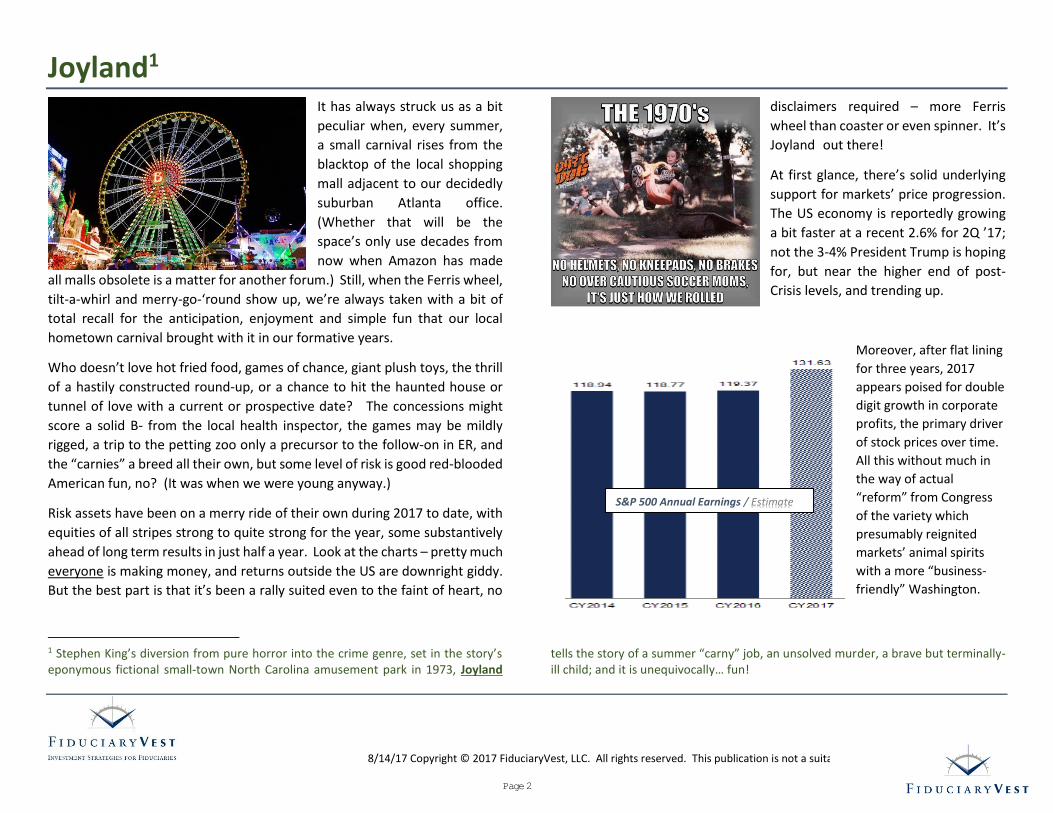
It has always struck us as a bit
peculiar when, every summer,
a small carnival rises from the
blacktop of the local shopping
mall adjacent to our decidedly
suburban Atlanta office.
(Whether that will be the
space’s only use decades from
now when Amazon has made
all malls obsolete is a matter for another forum.) Still, when the Ferris wheel,
tilt-a-whirl and merry-go-‘round show up, we’re always taken with a bit of
total recall for the anticipation, enjoyment and simple fun that our local
hometown carnival brought with it in our formative years.
Who doesn’t love hot fried food, games of chance, giant plush toys, the thrill
of a hastily constructed round-up, or a chance to hit the haunted house or
tunnel of love with a current or prospective date? The concessions might
score a solid B- from the local health inspector, the games may be mildly
rigged, a trip to the petting zoo only a precursor to the follow-on in ER, and
the “carnies” a breed all their own, but some level of risk is good red-blooded
American fun, no? (It was when we were young anyway.)
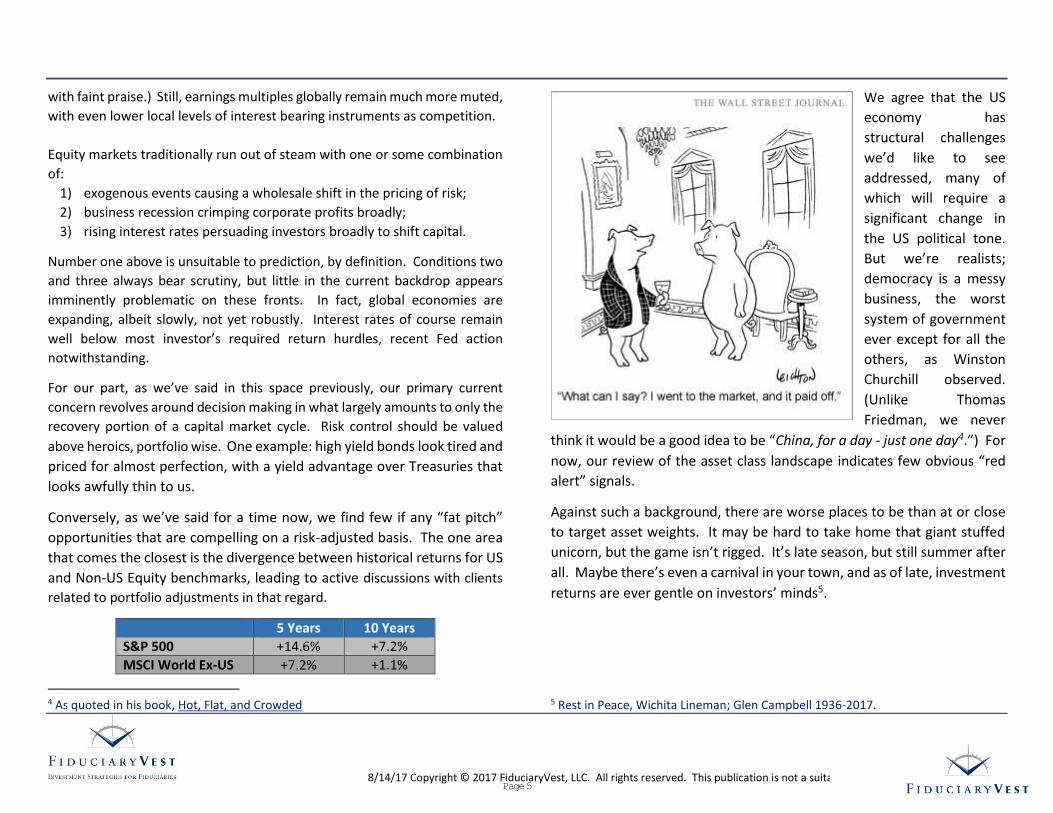
Risk assets have been on a merry ride of their own during 2017 to date, with
equities of all stripes strong to quite strong for the year, some substantively
ahead of long term results in just half a year. Look at the charts – pretty much
everyone is making money, and returns outside the US are downright giddy.
But the best part is that it’s been a rally suited even to the faint of heart, no
1 Stephen King’s diversion from pure horror into the crime genre, set in the story’s eponymous fictional small-town North Carolina amusement park in 1973, Joyland
disclaimers required – more Ferris
wheel than coaster or even spinner. It’s
Joyland1 out there!
At first glance, there’s solid underlying
support for markets’ price progression.
The US economy is reportedly growing
a bit faster at a recent 2.6% for 2Q ’17;
not the 3-4% President Trump is hoping
for, but near the higher end of post-
Crisis levels, and trending up.
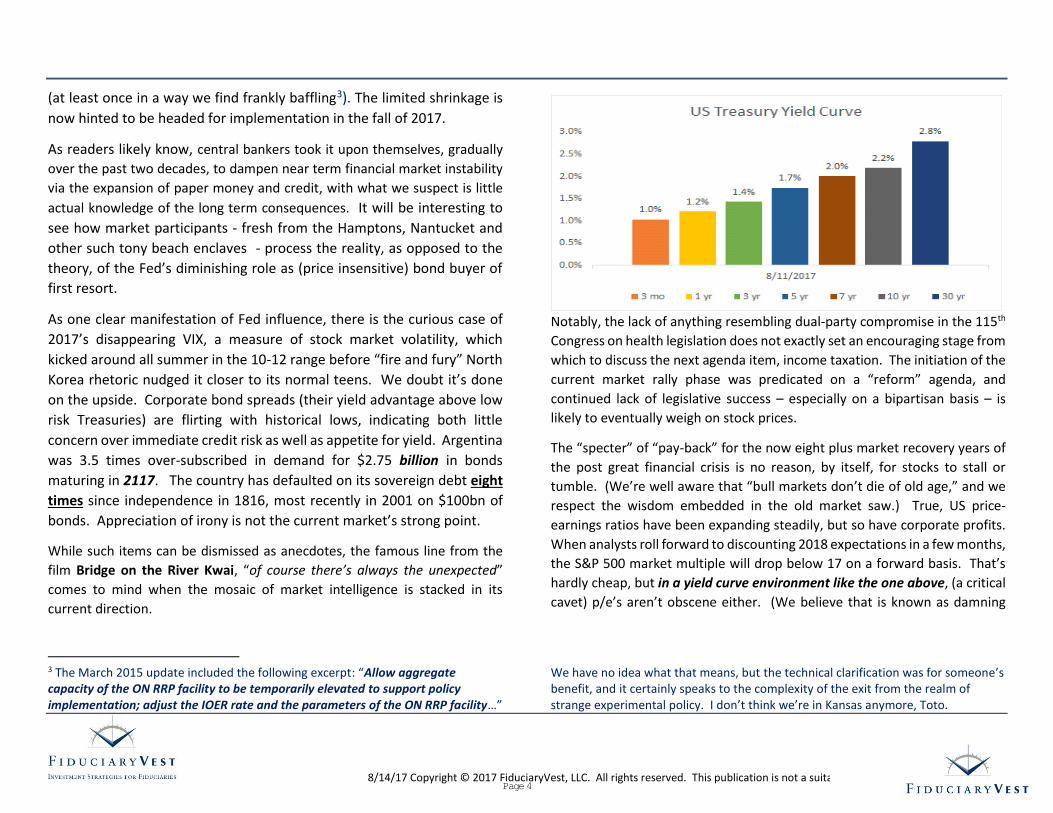
Moreover, after flat lining
for three years, 2017
appears poised for double
digit growth in corporate
profits, the primary driver
of stock prices over time.
All this without much in
the way of actual
“reform” from Congress
of the variety which
presumably reignited
markets’ animal spirits
with a more “business-
friendly” Washington.
tells the story of a summer “carny” job, an unsolved murder, a brave but terminally-ill child; and it is unequivocally… fun!
S&P 500 Annual Earnings / Estimate
Page 2
8/14/17 Copyright © 2017 FiduciaryVest, LLC. All rights reserved. This publication is not a suitable basis for investment decisions.
Our nexus of
summer
amusements with
recent returns is
the sometimes
invisible risks
lurking beneath
the surface of an
otherwise easy
season for
investment
returns. Stephen
King being who he
is, a healthy dose of peril and misfortune are inherently embedded in the
thrill-ride crime novel that inspired our title. Joyland’s fictional amusement
park’s owner asks, “Do you know what we sell here? We sell fun.” Wall
Street sells fun too, yet there is mystery and danger afoot in both contexts
as well. Clichés are often thus for good reason, and the hackneyed Wall
Street expression that bull markets climb a “wall of worry,” assuredly
applies.
There seem to us to be a handful of easy to recognize, but hard-to-quantify
reasons to worry. The most obvious example is that as we type, the markets
have been largely shrugging off (-1.4% week ended 8/11/17) the first public
dialogue about a realistic possibility of nuclear weapons exchange we can
recall since, well, the 1980s, which President Obama as recently as 2012
observed “called and wanted their foreign policy back.” If one client is
inquiring about investing in gold as, in effect, “disaster insurance,” thirty
others are likely thinking it and not asking, and that seems new to us, again a
throwback to when a fictional screen star rather than a reality one occupied
2Fed Press Release On Balance Sheet Reduction 2017
the West Wing. All this around the Hiroshima / Nagasaki anniversaries. Scary
stuff.
On a more mundane level,
we confess admiration for
the market’s ability thus far
to adjust to an altered state
for Federal Reserve interest
rate policy. The Fed’s moves
are still rather muted, and
rates remain far, far below
what most readers would consider a “normal” interest rate/monetary
environment. But so far it’s a much different reaction than early 2016, when
markets fell out of bed over the December 2015 rate hike; that January
posted mid to high single digit losses, in one month. With discretion the
better part of valor, the Fed chose not to raise just weeks ago, and markets
currently discount moves at the fall meetings as unlikely.
The longer term issue as we’ve indicated in this space many times is the
divergence between market participants’ obsession over the minute
increments of Federal Reserve fed funds rate tinkering, oddly juxtaposed
with much less concern over how same Fed might unwind the $3+
TRILLION dollars in securities that have ballooned its assets and thereby
surreptitiously expanded the supply of US dollars.
Lo and behold, the Fed in mid-June reiterated its plans to “shrink” its
balance sheet via a limited plan of not reinvesting maturities and
prepayments on the securities it owns.2 (Until recently, the Fed had been
in what we in the South might call “fxin’ to get ready” mode.) The
guidelines were first promulgated in June 2014 and updated twice since
Date Action (New) Fed
Funds Target
12/2016 +0.25%; 0.5% to 0.75%
06/2017 +0.25%; 1% to 1.25%
07/2017 None 1% to 1.25% 0.0%
5.0%
10.0%
15.0%
20.0%
2017 YTD thru July
Market Benchmarks
S&P 500 Index Russell 2000
MSCI ACWI (ex-US) MSCI Emerging Markets
Page 3
8/14/17 Copyright © 2017 FiduciaryVest, LLC. All rights reserved. This publication is not a suitable basis for investment decisions.
(at least once in a way we find frankly baffling3). The limited shrinkage is
now hinted to be headed for implementation in the fall of 2017.
As readers likely know, central bankers took it upon themselves, gradually
over the past two decades, to dampen near term financial market instability
via the expansion of paper money and credit, with what we suspect is little
actual knowledge of the long term consequences. It will be interesting to
see how market participants - fresh from the Hamptons, Nantucket and
other such tony beach enclaves - process the reality, as opposed to the
theory, of the Fed’s diminishing role as (price insensitive) bond buyer of
first resort.
As one clear manifestation of Fed influence, there is the curious case of
2017’s disappearing VIX, a measure of stock market volatility, which
kicked around all summer in the 10-12 range before “fire and fury” North
Korea rhetoric nudged it closer to its normal teens. We doubt it’s done
on the upside. Corporate bond spreads (their yield advantage above low
risk Treasuries) are flirting with historical lows, indicating both little
concern over immediate credit risk as well as appetite for yield. Argentina
was 3.5 times over-subscribed in demand for $2.75 billion in bonds
maturing in 2117. The country has defaulted on its sovereign debt eight
times since independence in 1816, most recently in 2001 on $100bn of
bonds. Appreciation of irony is not the current market’s strong point.
While such items can be dismissed as anecdotes, the famous line from the
film Bridge on the River Kwai, “of course there’s always the unexpected”
comes to mind when the mosaic of market intelligence is stacked in its
current direction.
3 The March 2015 update included the following excerpt: “Allow aggregate capacity of the ON RRP facility to be temporarily elevated to support policy implementation; adjust the IOER rate and the parameters of the ON RRP facility…”
Notably, the lack of anything resembling dual-party compromise in the 115th
Congress on health legislation does not exactly set an encouraging stage from
which to discuss the next agenda item, income taxation. The initiation of the
current market rally phase was predicated on a “reform” agenda, and
continued lack of legislative success – especially on a bipartisan basis – is
likely to eventually weigh on stock prices.
The “specter” of “pay-back” for the now eight plus market recovery years of
the post great financial crisis is no reason, by itself, for stocks to stall or
tumble. (We’re well aware that “bull markets don’t die of old age,” and we
respect the wisdom embedded in the old market saw.) True, US price-
earnings ratios have been expanding steadily, but so have corporate profits.
When analysts roll forward to discounting 2018 expectations in a few months,
the S&P 500 market multiple will drop below 17 on a forward basis. That’s
hardly cheap, but in a yield curve environment like the one above, (a critical
cavet) p/e’s aren’t obscene either. (We believe that is known as damning
We have no idea what that means, but the technical clarification was for someone’s benefit, and it certainly speaks to the complexity of the exit from the realm of strange experimental policy. I don’t think we’re in Kansas anymore, Toto.
Page 4
8/14/17 Copyright © 2017 FiduciaryVest, LLC. All rights reserved. This publication is not a suitable basis for investment decisions.
with faint praise.) Still, earnings multiples globally remain much more muted,
with even lower local levels of interest bearing instruments as competition.
Equity markets traditionally run out of steam with one or some combination
of:
1) exogenous events causing a wholesale shift in the pricing of risk;
2) business recession crimping corporate profits broadly;
3) rising interest rates persuading investors broadly to shift capital.
Number one above is unsuitable to prediction, by definition. Conditions two
and three always bear scrutiny, but little in the current backdrop appears
imminently problematic on these fronts. In fact, global economies are
expanding, albeit slowly, not yet robustly. Interest rates of course remain
well below most investor’s required return hurdles, recent Fed action
notwithstanding.
For our part, as we’ve said in this space previously, our primary current
concern revolves around decision making in what largely amounts to only the
recovery portion of a capital market cycle. Risk control should be valued
above heroics, portfolio wise. One example: high yield bonds look tired and
priced for almost perfection, with a yield advantage over Treasuries that
looks awfully thin to us.
Conversely, as we’ve said for a time now, we find few if any “fat pitch”
opportunities that are compelling on a risk-adjusted basis. The one area
that comes the closest is the divergence between historical returns for US
and Non-US Equity benchmarks, leading to active discussions with clients
related to portfolio adjustments in that regard.
5 Years 10 Years
S&P 500 +14.6% +7.2%
MSCI World Ex-US +7.2% +1.1%
4 As quoted in his book, Hot, Flat, and Crowded
We agree that the US
economy has
structural challenges
we’d like to see
addressed, many of
which will require a
significant change in
the US political tone.
But we’re realists;
democracy is a messy
business, the worst
system of government
ever except for all the
others, as Winston
Churchill observed.
(Unlike Thomas
Friedman, we never
think it would be a good idea to be “China, for a day - just one day4.”) For
now, our review of the asset class landscape indicates few obvious “red
alert” signals.
Against such a background, there are worse places to be than at or close
to target asset weights. It may be hard to take home that giant stuffed
unicorn, but the game isn’t rigged. It’s late season, but still summer after
all. Maybe there’s even a carnival in your town, and as of late, investment
returns are ever gentle on investors’ minds5.
5 Rest in Peace, Wichita Lineman; Glen Campbell 1936-2017.
Page 5
8/14/17 Copyright © 2017 FiduciaryVest, LLC. All rights reserved. This publication is not a suitable basis for investment decisions.
COMMENTARY
Commentary was prepared for clients and prospective clients of
FiduciaryVest LLC. It may not be suitable for others, and should not be
disseminated without written permission. FiduciaryVest does not make
any representation or warranties as to the accuracy or merit of the
discussion, analysis, or opinions contained in commentaries as a basis for
investment decision making. Any comments or general market related
observations are based on information available at the time of writing, are
for informational purposes only, are not intended as individual or specific
advice, may not represent the opinions of the entire firm and should not
be relied upon as a basis for making investment decisions.
All information contained herein is believed to be correct, though
complete accuracy cannot be guaranteed. This information is subject to
change without notice as market conditions change, will not be updated
for subsequent events or changes in facts or opinion, and is not intended
to predict the performance of any manager, individual security, market
sector, or portfolio.
This information may concur or may conflict with activities of any clients’
underlying portfolio managers or with actions taken by individual clients
or clients collectively of FiduciaryVest for a variety of reasons, including
but not limited to differences between and among their investment
objectives. Investors are advised to consult with their investment
professional about their specific financial needs and goals before making
any investment decisions.
INVESTMENT RISK
FiduciaryVest does not represent, warrant, or imply that the services or
methods of analysis employed can or will predict future results,
successfully identify market tops or bottoms, or insulate client portfolios
from losses due to market corrections or declines. Investment risks
involve but are not limited to the following: systematic risk, interest rate
risk, inflation risk, currency risk, liquidity risk, sociopolitical risk,
management risk, and credit risk. In addition to general risks associated
with investing, certain products also pose additional risks. This and other
important information is contained in the product prospectus or offering
materials.
Page 6
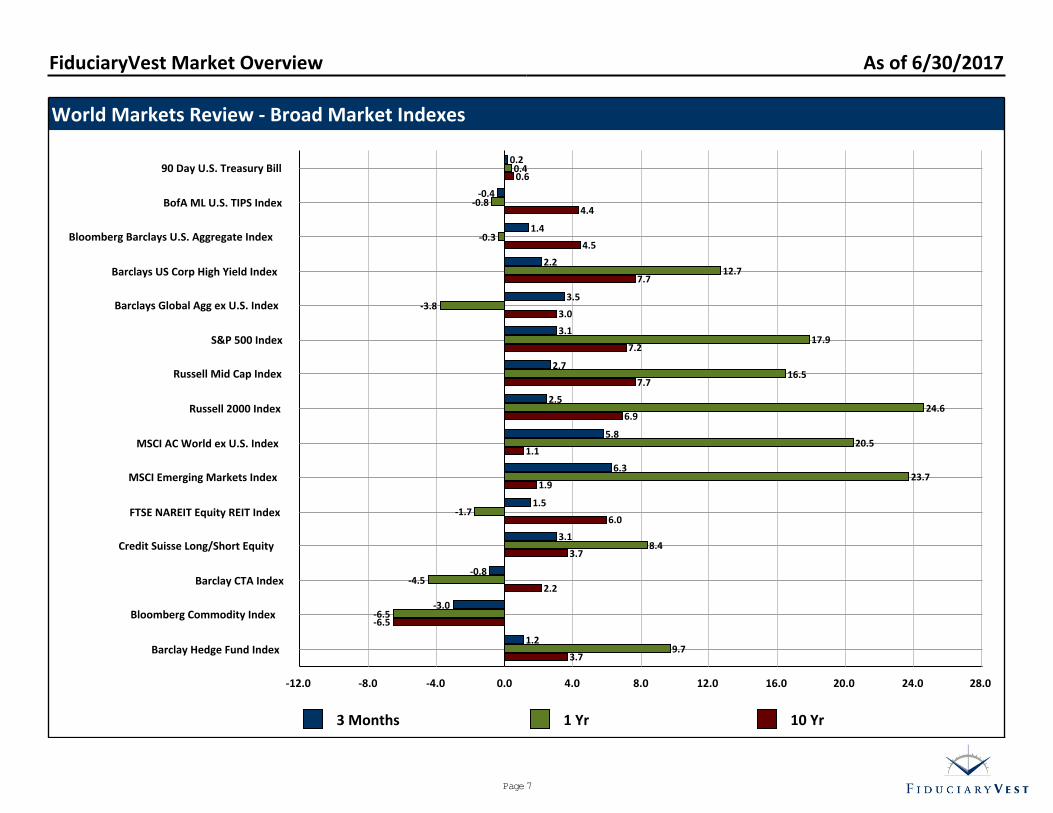
World Markets Review - Broad Market Indexes
3 Months 1 Yr 10 Yr
0.0 4.0 8.0 12.0 16.0 20.0 24.0 28.0-4.0-8.0-12.0
Barclay Hedge Fund Index
Bloomberg Commodity Index
Barclay CTA Index
Credit Suisse Long/Short Equity
FTSE NAREIT Equity REIT Index
MSCI Emerging Markets Index
MSCI AC World ex U.S. Index
Russell 2000 Index
Russell Mid Cap Index
S&P 500 Index
Barclays Global Agg ex U.S. Index
Barclays US Corp High Yield Index
Bloomberg Barclays U.S. Aggregate Index
BofA ML U.S. TIPS Index
90 Day U.S. Treasury Bill
1.2
-3.0
-0.8
3.1
1.5
6.3
5.8
2.5
2.7
3.1
3.5
2.2
1.4
-0.4
0.2
9.7
-6.5
-4.5
8.4
-1.7
23.7
20.5
24.6
16.5
17.9
-3.8
12.7
-0.3
-0.8
0.4
3.7
-6.5
2.2
3.7
6.0
1.9
1.1
6.9
7.7
7.2
3.0
7.7
4.5
4.4
0.6
FiduciaryVest Market Overview As of 6/30/2017
Page 7
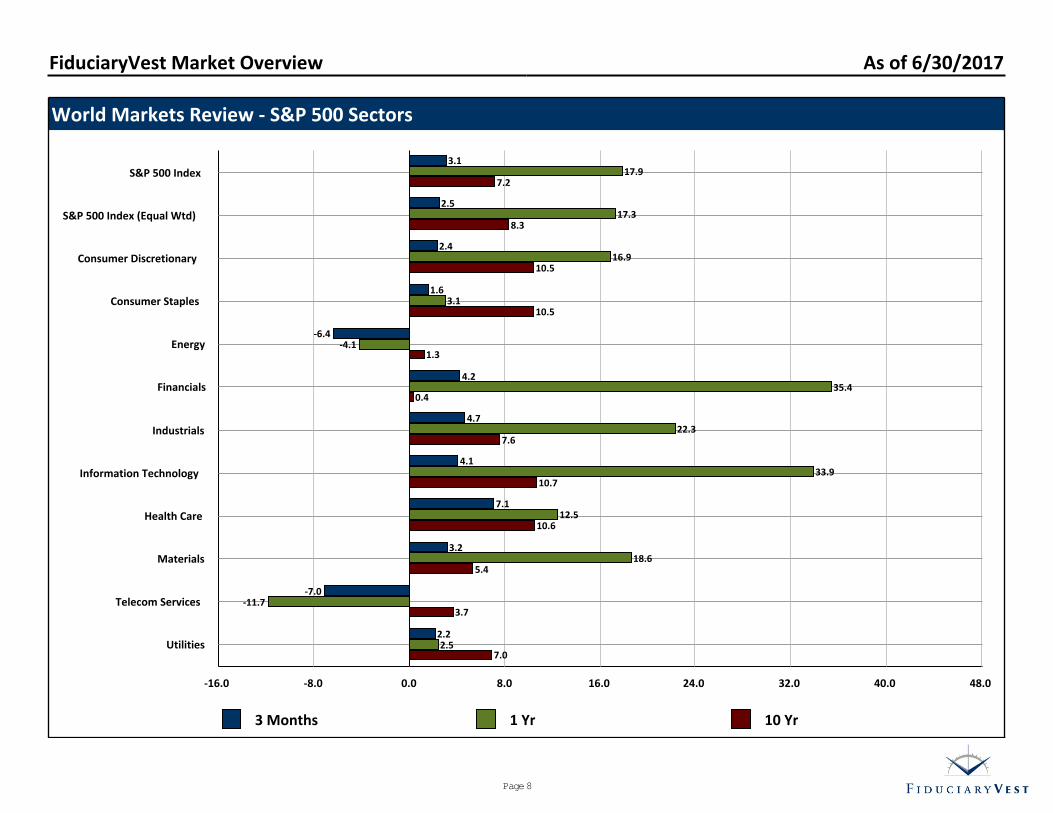
World Markets Review - S&P 500 Sectors
3 Months 1 Yr 10 Yr
0.0 8.0 16.0 24.0 32.0 40.0 48.0-8.0-16.0
Utilities
Telecom Services
Materials
Health Care
Information Technology
Industrials
Financials
Energy
Consumer Staples
Consumer Discretionary
S&P 500 Index (Equal Wtd)
S&P 500 Index
2.2
-7.0
3.2
7.1
4.1
4.7
4.2
-6.4
1.6
2.4
2.5
3.1
2.5
-11.7
18.6
12.5
33.9
22.3
35.4
-4.1
3.1
16.9
17.3
17.9
7.0
3.7
5.4
10.6
10.7
7.6
0.4
1.3
10.5
10.5
8.3
7.2
FiduciaryVest Market Overview As of 6/30/2017
Page 8

MSCI Developed International Markets
3 Mo 1 Yr 10 Yr
0.0 3.0 6.0 9.0 12.0 15.0 18.0 21.0 24.0 27.0 30.0 33.0-3.0-6.0
MSCI EAFE Index
United Kingdom Index
Switzerland Index
Japan Index
Hong Kong Index
Germany Index
France Index
Canada Index
Australia Index
MSCI AC World ex U.S. Index
6.1
4.7
9.4
5.2
7.2
6.9
9.9
0.8
-1.8
5.8
20.3
13.4
17.5
19.6
23.8
29.5
29.3
12.5
18.5
20.5
1.0
0.3
5.4
1.4
7.1
2.4
1.1
1.8
2.8
1.1
FiduciaryVest Market Commentary As of 6/30/2017
Page 9
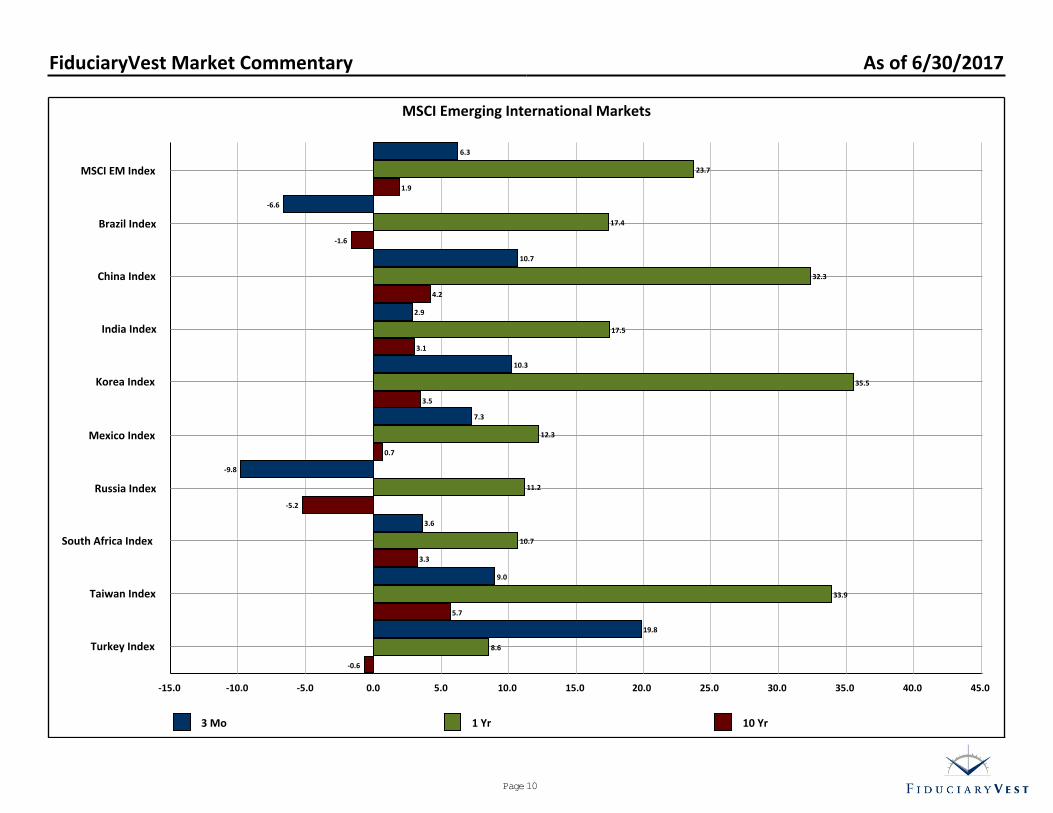
MSCI Emerging International Markets
3 Mo 1 Yr 10 Yr
0.0 5.0 10.0 15.0 20.0 25.0 30.0 35.0 40.0 45.0-5.0-10.0-15.0
Turkey Index
Taiwan Index
South Africa Index
Russia Index
Mexico Index
Korea Index
India Index
China Index
Brazil Index
MSCI EM Index
19.8
9.0
3.6
-9.8
7.3
10.3
2.9
10.7
-6.6
6.3
8.6
33.9
10.7
11.2
12.3
35.5
17.5
32.3
17.4
23.7
-0.6
5.7
3.3
-5.2
0.7
3.5
3.1
4.2
-1.6
1.9
FiduciaryVest Market Commentary As of 6/30/2017
Page 10
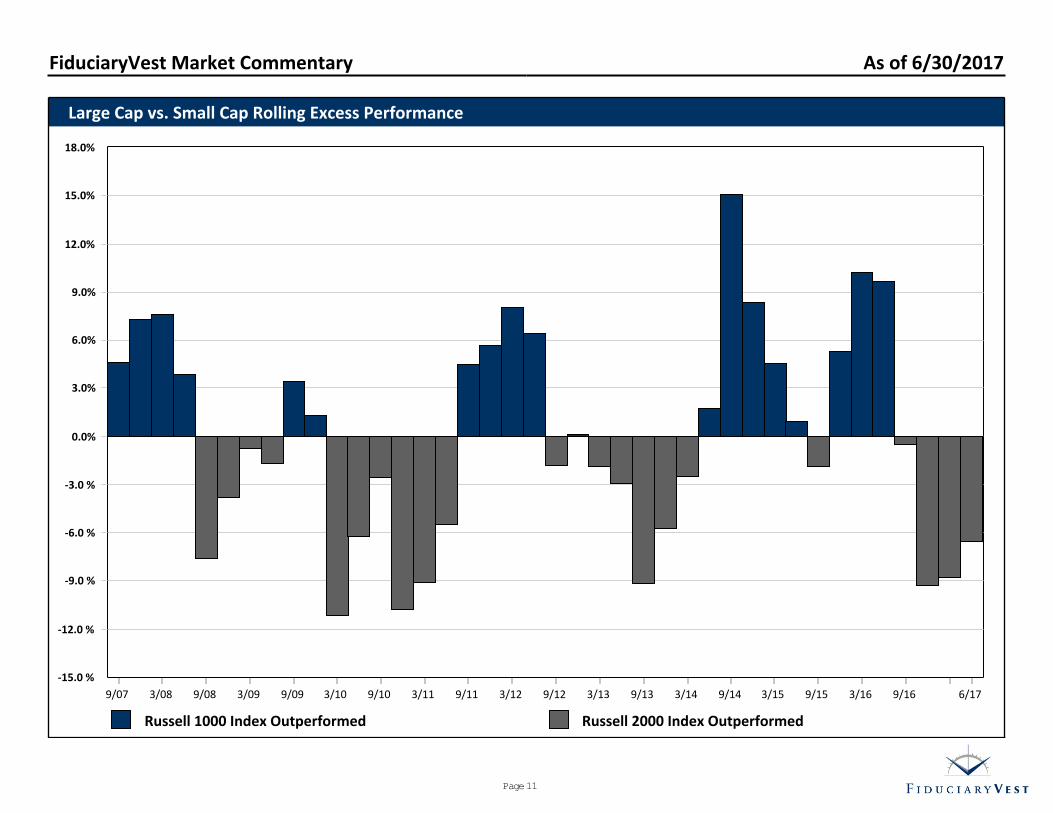
Large Cap vs. Small Cap Rolling Excess Performance
Russell 1000 Index Outperformed Russell 2000 Index Outperformed
0.0%
3.0%
6.0%
9.0%
12.0%
15.0%
18.0%
-3.0 %
-6.0 %
-9.0 %
-12.0 %
-15.0 %
9/07 3/08 9/08 3/09 9/09 3/10 9/10 3/11 9/11 3/12 9/12 3/13 9/13 3/14 9/14 3/15 9/15 3/16 9/16 6/17
FiduciaryVest Market Commentary As of 6/30/2017
Page 11
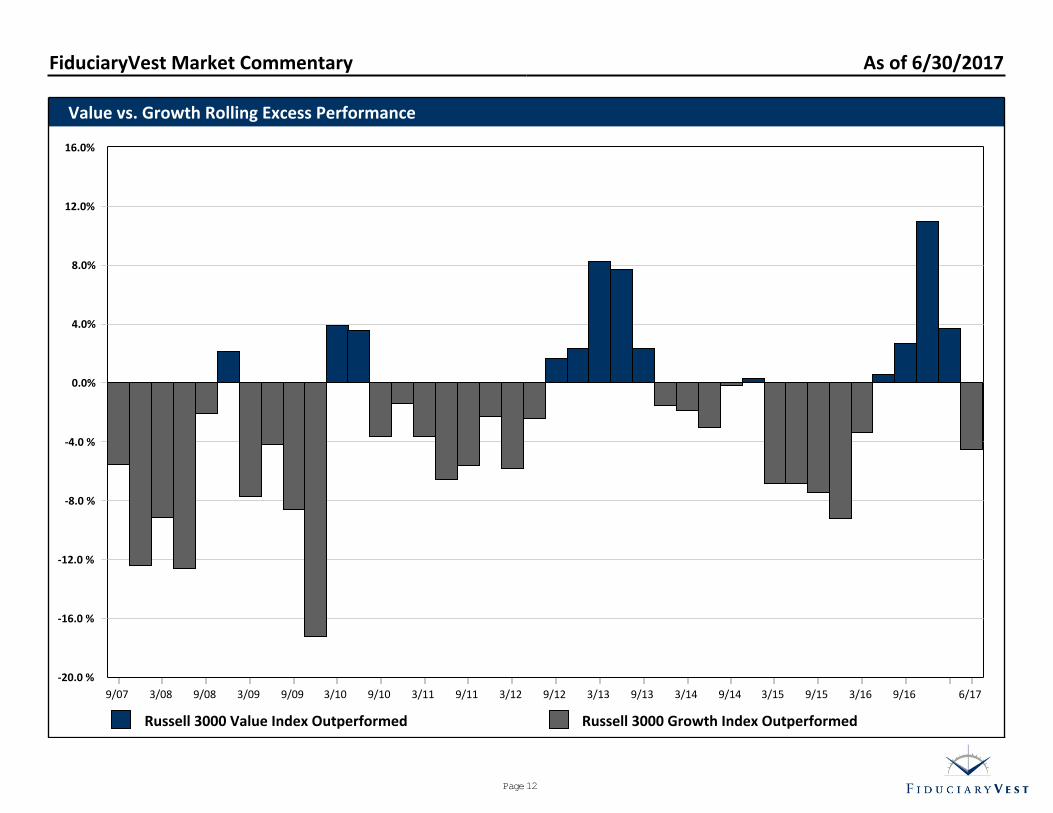
Value vs. Growth Rolling Excess Performance
Russell 3000 Value Index Outperformed Russell 3000 Growth Index Outperformed
0.0%
4.0%
8.0%
12.0%
16.0%
-4.0 %
-8.0 %
-12.0 %
-16.0 %
-20.0 %
9/07 3/08 9/08 3/09 9/09 3/10 9/10 3/11 9/11 3/12 9/12 3/13 9/13 3/14 9/14 3/15 9/15 3/16 9/16 6/17
FiduciaryVest Market Commentary As of 6/30/2017
Page 12
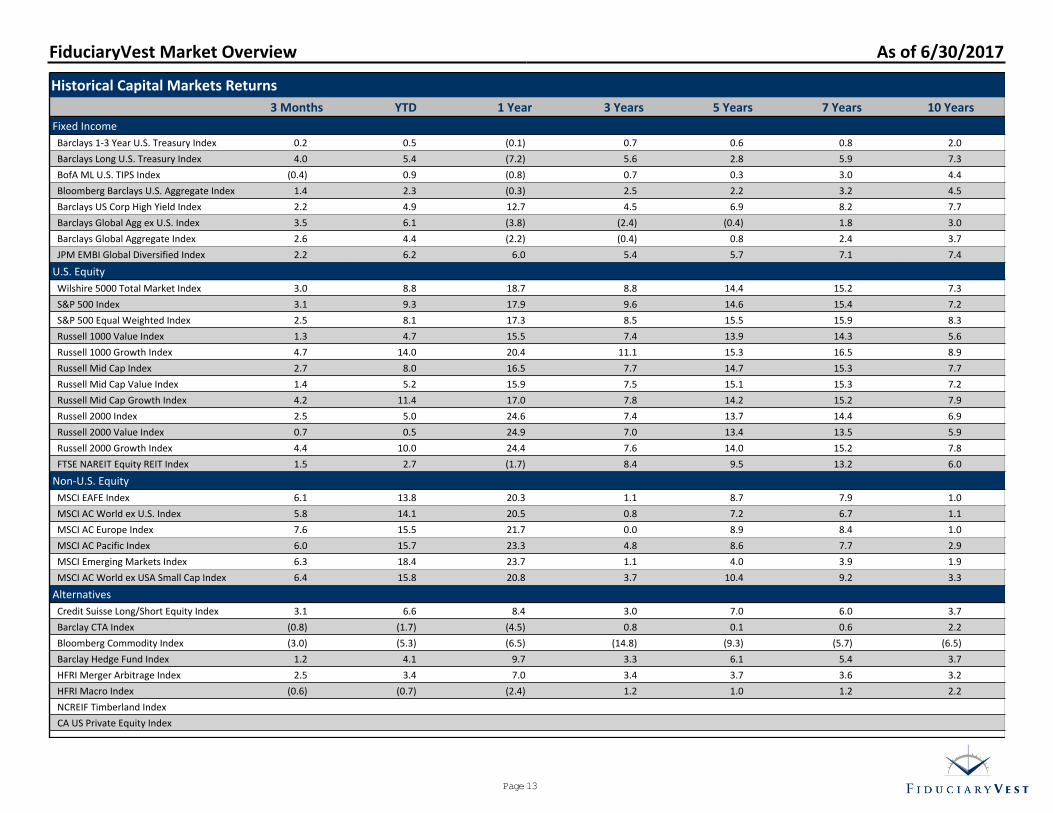
Historical Capital Markets Returns
3 Months YTD 1 Year 3 Years 5 Years 7 Years 10 Years
Fixed Income
Barclays 1-3 Year U.S. Treasury Index 0.2 0.5 (0.1) 0.7 0.6 0.8 2.0
Barclays Long U.S. Treasury Index 4.0 5.4 (7.2) 5.6 2.8 5.9 7.3
BofA ML U.S. TIPS Index (0.4) 0.9 (0.8) 0.7 0.3 3.0 4.4
Bloomberg Barclays U.S. Aggregate Index 1.4 2.3 (0.3) 2.5 2.2 3.2 4.5
Barclays US Corp High Yield Index 2.2 4.9 12.7 4.5 6.9 8.2 7.7
Barclays Global Agg ex U.S. Index 3.5 6.1 (3.8) (2.4) (0.4) 1.8 3.0
Barclays Global Aggregate Index 2.6 4.4 (2.2) (0.4) 0.8 2.4 3.7
JPM EMBI Global Diversified Index 2.2 6.2 6.0 5.4 5.7 7.1 7.4
U.S. Equity
Wilshire 5000 Total Market Index 3.0 8.8 18.7 8.8 14.4 15.2 7.3
S&P 500 Index 3.1 9.3 17.9 9.6 14.6 15.4 7.2
S&P 500 Equal Weighted Index 2.5 8.1 17.3 8.5 15.5 15.9 8.3
Russell 1000 Value Index 1.3 4.7 15.5 7.4 13.9 14.3 5.6
Russell 1000 Growth Index 4.7 14.0 20.4 11.1 15.3 16.5 8.9
Russell Mid Cap Index 2.7 8.0 16.5 7.7 14.7 15.3 7.7
Russell Mid Cap Value Index 1.4 5.2 15.9 7.5 15.1 15.3 7.2
Russell Mid Cap Growth Index 4.2 11.4 17.0 7.8 14.2 15.2 7.9
Russell 2000 Index 2.5 5.0 24.6 7.4 13.7 14.4 6.9
Russell 2000 Value Index 0.7 0.5 24.9 7.0 13.4 13.5 5.9
Russell 2000 Growth Index 4.4 10.0 24.4 7.6 14.0 15.2 7.8
FTSE NAREIT Equity REIT Index 1.5 2.7 (1.7) 8.4 9.5 13.2 6.0
Non-U.S. Equity
MSCI EAFE Index 6.1 13.8 20.3 1.1 8.7 7.9 1.0
MSCI AC World ex U.S. Index 5.8 14.1 20.5 0.8 7.2 6.7 1.1
MSCI AC Europe Index 7.6 15.5 21.7 0.0 8.9 8.4 1.0
MSCI AC Pacific Index 6.0 15.7 23.3 4.8 8.6 7.7 2.9
MSCI Emerging Markets Index 6.3 18.4 23.7 1.1 4.0 3.9 1.9
MSCI AC World ex USA Small Cap Index 6.4 15.8 20.8 3.7 10.4 9.2 3.3
Alternatives
Credit Suisse Long/Short Equity Index 3.1 6.6 8.4 3.0 7.0 6.0 3.7
Barclay CTA Index (0.8) (1.7) (4.5) 0.8 0.1 0.6 2.2
Bloomberg Commodity Index (3.0) (5.3) (6.5) (14.8) (9.3) (5.7) (6.5)
Barclay Hedge Fund Index 1.2 4.1 9.7 3.3 6.1 5.4 3.7
HFRI Merger Arbitrage Index 2.5 3.4 7.0 3.4 3.7 3.6 3.2
HFRI Macro Index (0.6) (0.7) (2.4) 1.2 1.0 1.2 2.2
NCREIF Timberland Index
CA US Private Equity Index
FiduciaryVest Market Overview As of 6/30/2017
Page 13

2003 2004 2005 2006 2007 2008 2009 2010 2011 2012 2013 2014 2015 2016 YTD
Best
EmergingMarkets55.8 %
REITs31.6 %
EmergingMarkets34.0 %
REITs35.0 %
EmergingMarkets39.4 %
ManagedFutures14.1 %
EmergingMarkets78.5 %
REITs27.9 %
TIPS14.1 %
EmergingMarkets18.2 %
Small CapEquity38.8 %
REITs30.1 %
L/S Equity3.6 %
Small CapEquity21.3 %
EmergingMarkets18.4 %
5 Small CapEquity47.3 %
EmergingMarkets25.6 %
Commodity21.4 %
EmergingMarkets32.2 %
Non-USEquity16.7 %
Core Bonds5.2 %
High Yield58.2 %
Small CapEquity26.9 %
REITs8.3 %
REITs18.1 %
Mid CapEquity34.8 %
S&P 50013.7 %
REITs3.2 %
High Yield17.1 %
Non-USEquity14.1 %
Non-USEquity40.8 %
Non-USEquity20.9 %
Non-USEquity16.6 %
Non-USEquity26.7 %
Commodity16.2 %
Non-USBonds4.4 %
Non-USEquity41.4 %
Mid CapEquity25.5 %
Core Bonds7.8 %
Mid CapEquity17.3 %
S&P 50032.4 %
Mid CapEquity13.2 %
S&P 5001.4 %
Mid CapEquity13.8 %
S&P 5009.3 %
Mid CapEquity40.1 %
Mid CapEquity20.2 %
Mid CapEquity12.7 %
Small CapEquity18.4 %
L/S Equity13.7 %
90 Day T-Bill2.1 %
Mid CapEquity40.5 %
EmergingMarkets18.9 %
High Yield5.0 %
Non-USEquity16.8 %
L/S Equity17.7 %
ManagedFutures7.6 %
Core Bonds0.5 %
S&P 50012.0 %
Mid CapEquity8.0 %
REITs37.1 %
Small CapEquity18.3 %
REITs12.2 %
S&P 50015.8 %
TIPS11.6 %
TIPS(1.1 ) %
REITs28.0 %
Commodity16.8 %
Non-USBonds4.4 %
Small CapEquity16.3 %
Non-USEquity15.3 %
Core Bonds6.0 %
90 Day T-Bill0.0 %
Commodity11.7 %
L/S Equity6.6 %
High Yield29.0 %
Non-USBonds12.5 %
L/S Equity9.7 %
Mid CapEquity15.3 %
Non-USBonds11.0 %
L/S Equity(19.7 ) %
Small CapEquity27.2 %
High Yield15.1 %
S&P 5002.1 %
S&P 50016.0 %
High Yield7.4 %
L/S Equity5.5 %
ManagedFutures(1.5 ) %
EmergingMarkets11.2 %
Non-USBonds6.1 %
S&P 50028.7 %
L/S Equity11.6 %
S&P 5004.9 %
L/S Equity14.4 %
ManagedFutures7.7 %
High Yield(26.2 ) %
S&P 50026.5 %
S&P 50015.1 %
90 Day T-Bill0.1 %
High Yield15.8 %
REITs2.5 %
Small CapEquity4.9 %
TIPS(1.7 ) %
REITs8.5 %
Small CapEquity5.0 %
Commodity23.9 %
High Yield11.1 %
Small CapEquity4.6 %
High Yield11.9 %
Core Bonds7.0 %
Small CapEquity
(33.8 ) %
L/S Equity19.5 %
Non-USEquity11.2 %
Mid CapEquity
(1.5 ) %
L/S Equity8.2 %
90 Day T-Bill0.0 %
TIPS4.5 %
Mid CapEquity
(2.4 ) %
TIPS4.8 %
High Yield4.9 %
Non-USBonds19.4 %
S&P 50010.9 %
90 Day T-Bill2.9 %
Non-USBonds8.2 %
Mid CapEquity5.6 %
Commodity(35.6 ) %
Commodity18.9 %
L/S Equity9.3 %
ManagedFutures(3.1 ) %
TIPS7.3 %
ManagedFutures(1.5 ) %
High Yield2.5 %
Small CapEquity
(4.4 ) %
Non-USEquity4.5 %
REITs2.7 %
L/S Equity17.3 %
Commodity9.1 %
TIPS2.8 %
90 Day T-Bill4.8 %
S&P 5005.5 %
S&P 500(37.0 ) %
TIPS10.0 %
ManagedFutures7.0 %
Small CapEquity
(4.2 ) %
Core Bonds4.2 %
Core Bonds(2.0 ) %
90 Day T-Bill0.0 %
High Yield(4.5 ) %
Core Bonds2.6 %
Core Bonds2.3 %
ManagedFutures8.7 %
TIPS8.5 %
High Yield2.7 %
Core Bonds4.3 %
90 Day T-Bill4.9 %
REITs(37.7 ) %
Non-USBonds7.5 %
Core Bonds6.5 %
L/S Equity(7.3 ) %
Non-USBonds4.1 %
EmergingMarkets(2.6 ) %
EmergingMarkets(2.2 ) %
Non-USEquity
(5.7 ) %
Non-USBonds1.5 %
TIPS0.9 %
TIPS8.3 %
Core Bonds4.3 %
Core Bonds2.4 %
ManagedFutures3.6 %
High Yield1.9 %
Mid CapEquity
(41.5 ) %
Core Bonds5.9 %
TIPS6.3 %
Commodity(13.3 ) %
90 Day T-Bill0.1 %
Non-USBonds
(3.1 ) %
Non-USBonds
(3.1 ) %
Non-USBonds
(6.0 ) %
90 Day T-Bill0.3 %
90 Day T-Bill0.3 %
6
Core Bonds4.1 %
ManagedFutures3.3 %
ManagedFutures1.7 %
Commodity2.1 %
Small CapEquity
(1.6 ) %
Non-USEquity
(45.5 ) %
90 Day T-Bill0.2 %
Non-USBonds4.9 %
Non-USEquity
(13.7 ) %
Commodity(1.1 ) %
TIPS(9.4 ) %
Non-USEquity
(3.9 ) %
EmergingMarkets(14.9 ) %
ManagedFutures(1.2 ) %
ManagedFutures(1.7 ) %
Worst 90 Day T-Bill1.1 %
90 Day T-Bill1.1 %
Non-USBonds
(8.7 ) %
TIPS0.5 %
REITs(15.7 ) %
EmergingMarkets(53.3 ) %
ManagedFutures(0.1 ) %
90 Day T-Bill0.1 %
EmergingMarkets(18.4 ) %
ManagedFutures(1.7 ) %
Commodity(9.5 ) %
Commodity(17.0 ) %
Commodity(24.7 ) %
L/S Equity(3.4 ) %
Commodity(5.3 ) %
FiduciaryVest Market Overview
Returns for Key Indexes (previous 15 periods)
As of 6/30/2017
Notes: 90 Day T-Bill represented by 90 Day U.S. T-Bill Index. TIPS represented by BofA ML U.S. Treasuries Infl-Linked Index. Core Bonds represented by Bloomberg BarclaysAggregate Index. High Yield represented by Bloomberg Barclays U.S. High Yield Index. Non-US Bonds represented by Bloomberg Barclays Global Aggregate ex U.S. Index.S&P 500 represented by S&P 500 Index. Mid Cap Equity represented by Russell Mid Cap Index. Small Cap Equity represented by Russell 2000 Index. Non-US Equityrepresented by MSCI World ex U.S. Index. Emerging Markets represented by MSCI Emerging Markets Index. L/S Equity represented by Credit Suisse Long/Short EquityIndex. Managed Futures represented by Bloomberg Barclay CTA Index. Commodity represented by Bloomberg Commodity Index.
Page 14
Total Plan Analysis
Page 15
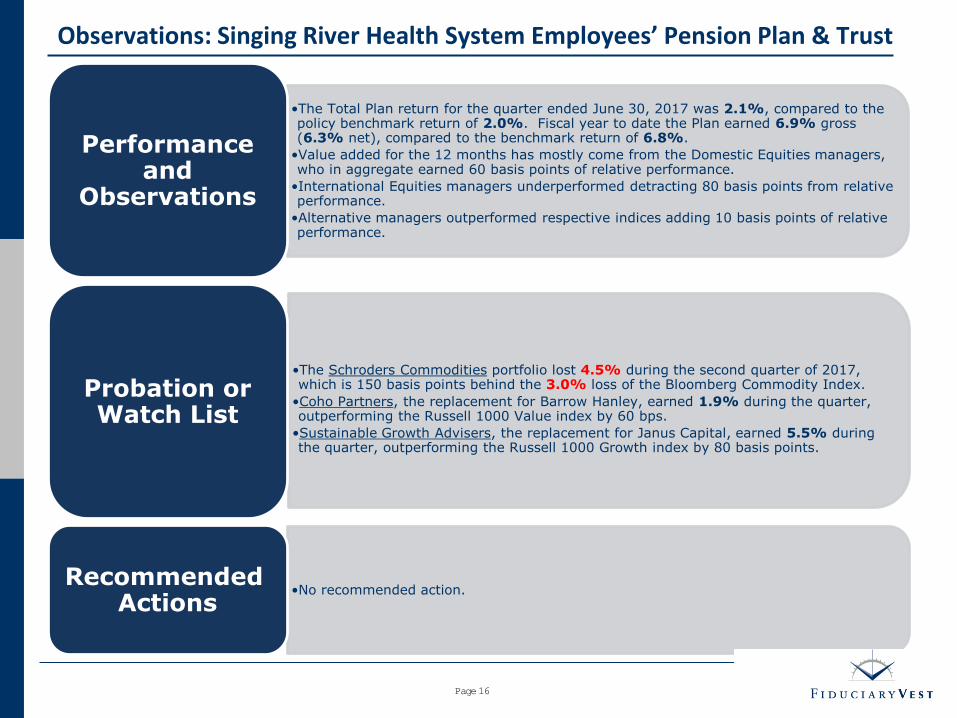
Observations: Singing River Health System Employees’ Pension Plan & Trust
•The Total Plan return for the quarter ended June 30, 2017 was 2.1%, compared to the policy benchmark return of 2.0%. Fiscal year to date the Plan earned 6.9% gross (6.3% net), compared to the benchmark return of 6.8%.
•Value added for the 12 months has mostly come from the Domestic Equities managers, who in aggregate earned 60 basis points of relative performance.
•International Equities managers underperformed detracting 80 basis points from relative performance.
•Alternative managers outperformed respective indices adding 10 basis points of relative performance.
Performance and
Observations
•The Schroders Commodities portfolio lost 4.5% during the second quarter of 2017, which is 150 basis points behind the 3.0% loss of the Bloomberg Commodity Index.
•Coho Partners, the replacement for Barrow Hanley, earned 1.9% during the quarter, outperforming the Russell 1000 Value index by 60 bps.
•Sustainable Growth Advisers, the replacement for Janus Capital, earned 5.5% during the quarter, outperforming the Russell 1000 Growth index by 80 basis points.
Probation or Watch List
•No recommended action. Recommended
Actions
Page 16
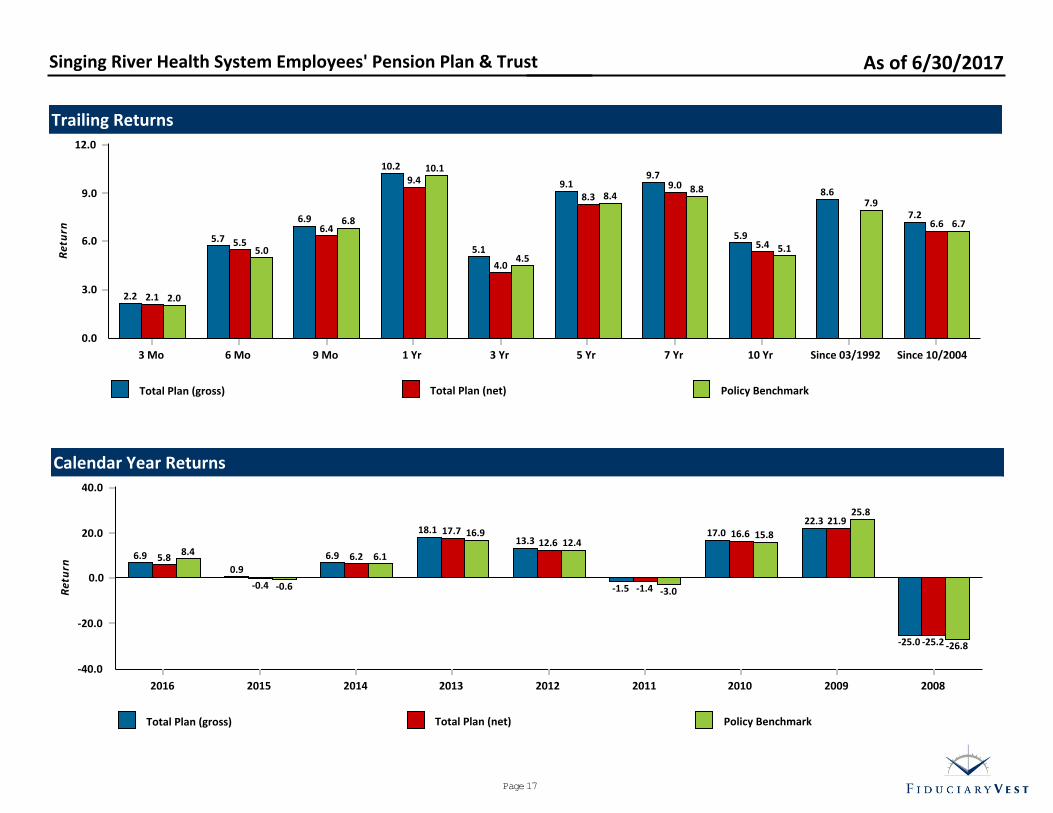
Trailing Returns
Total Plan (gross) Total Plan (net) Policy Benchmark
0.0
3.0
6.0
9.0
12.0
Ret
urn
3 Mo 6 Mo 9 Mo 1 Yr 3 Yr 5 Yr 7 Yr 10 Yr Since 03/1992 Since 10/2004
2.0
5.0
6.8
10.1
4.5
8.48.8
5.1
7.9
6.7
2.1
5.5
6.4
9.4
4.0
8.39.0
5.4
6.6
2.2
5.7
6.9
10.2
5.1
9.19.7
5.9
8.6
7.2
Calendar Year Returns
Total Plan (gross) Total Plan (net) Policy Benchmark
0.0
20.0
40.0
-20.0
-40.0
Ret
urn
2016 2015 2014 2013 2012 2011 2010 2009 2008
8.4
-0.6
6.1
16.912.4
-3.0
15.8
25.8
-26.8
5.8
-0.4
6.2
17.712.6
-1.4
16.621.9
-25.2
6.9
0.9
6.9
18.113.3
-1.5
17.022.3
-25.0
Singing River Health System Employees' Pension Plan & Trust As of 6/30/2017
Page 17

Rolling Three-Year Return
Total Plan Policy Benchmark 6.5% Assumed Rate of Return
-10.0
0.0
10.0
20.0
30.0
Ret
urn
3/95 6/96 9/97 12/98 3/00 6/01 9/02 12/03 3/05 6/06 9/07 12/08 3/10 6/11 9/12 12/13 3/15 6/16 6/17
Rolling Three Year Standard Deviation
Total Plan Policy Benchmark
0.0
5.0
10.0
15.0
20.0
Sta
nd
ard
Dev
iati
on
3/95 6/96 9/97 12/98 3/00 6/01 9/02 12/03 3/05 6/06 9/07 12/08 3/10 6/11 9/12 12/13 3/15 6/16 6/17
Singing River Health System Employees' Pension Plan & Trust As of 6/30/2017
Page 18

Risk/Return since Inception
Total Plan Policy Benchmark
0.0
2.0
4.0
6.0
8.0
10.0
Ret
urn
0.0 0.7 1.4 2.1 2.8 3.5 4.2 4.9 5.6 6.3 7.0 7.7 8.4 9.1 9.8
Standard Deviation
Performance & Risk Statistics since Inception
ReturnStandardDeviation
Alpha BetaSharpeRatio
BestQuarter
WorstQuarter
UpMarketCapture
DownMarketCapture
InceptionDate
Total Plan 8.6 9.6 1.6 0.9 0.6 19.3 (21.5) 94.2 81.9 3/1/1992
Policy Benchmark 7.9 9.5 0.0 1.0 0.6 20.4 (24.8) 100.0 100.0 3/1/1992
90 Day U.S. Treasury Bill 2.6 0.6 2.6 0.0 - 1.8 0.0 10.2 (9.2) 3/1/1992
Singing River Health System Employees' Pension Plan & Trust As of 6/30/2017
Page 19

Plan Sponsor Peer Group AnalysisAll Public Plans-Total Fund
2.0
4.0
6.0
8.0
10.0
12.0 Return
2.0
4.0
6.0
8.0
10.0
12.0
14.0
StandardDeviation
0.0
0.4
0.8
1.2
1.6
2.0
2.4
SharpeRatio
3 Years 5 Years 10 Years 3 Years 5 Years 10 Years 3 Years 5 Years 10 Years
Total Plan 5.1 (61) 9.1 (42) 5.9 (31) 4.0 (94) 4.6 (80) 10.7 (34) 1.2 (22) 1.9 (16) 0.5 (47)¢
Policy Benchmark 4.5 (80) 8.4 (67) 5.1 (80) 4.1 (92) 4.6 (80) 11.8 (10) 1.1 (50) 1.8 (39) 0.4 (88)�
5th Percentile 6.8 10.5 6.7 6.2 6.1 12.3 1.4 2.0 0.7
1st Quartile 5.9 9.5 6.0 5.4 5.5 11.1 1.2 1.8 0.6
Median 5.4 8.9 5.6 5.0 5.1 10.2 1.0 1.7 0.5
3rd Quartile 4.7 8.1 5.2 4.6 4.7 9.6 0.9 1.5 0.5
95th Percentile 3.6 6.9 4.3 3.8 3.9 7.1 0.7 1.3 0.4
Population 484 476 404 484 476 404 484 476 404
Singing River Health System Employees' Pension Plan & Trust As of 6/30/2017
Parentheses contain percentile rankings.Calculation based on quarterly periodicity.
Page 20
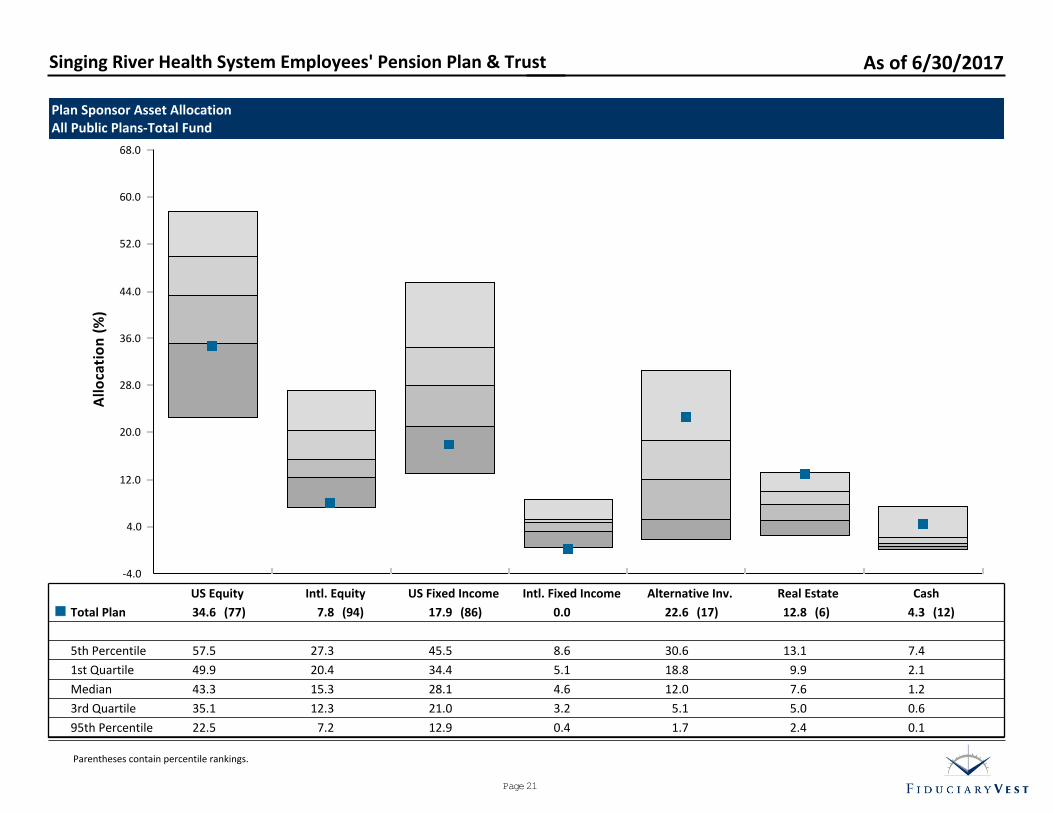
Plan Sponsor Asset AllocationAll Public Plans-Total Fund
-4.0
4.0
12.0
20.0
28.0
36.0
44.0
52.0
60.0
68.0
Allo
cati
on
(%)
US Equity Intl. Equity US Fixed Income Intl. Fixed Income Alternative Inv. Real Estate Cash
Total Plan 34.6 (77) 7.8 (94) 17.9 (86) 0.0 22.6 (17) 12.8 (6) 4.3 (12)¢
5th Percentile 57.5 27.3 45.5 8.6 30.6 13.1 7.4
1st Quartile 49.9 20.4 34.4 5.1 18.8 9.9 2.1
Median 43.3 15.3 28.1 4.6 12.0 7.6 1.2
3rd Quartile 35.1 12.3 21.0 3.2 5.1 5.0 0.6
95th Percentile 22.5 7.2 12.9 0.4 1.7 2.4 0.1
Singing River Health System Employees' Pension Plan & Trust As of 6/30/2017
Parentheses contain percentile rankings.
Page 21
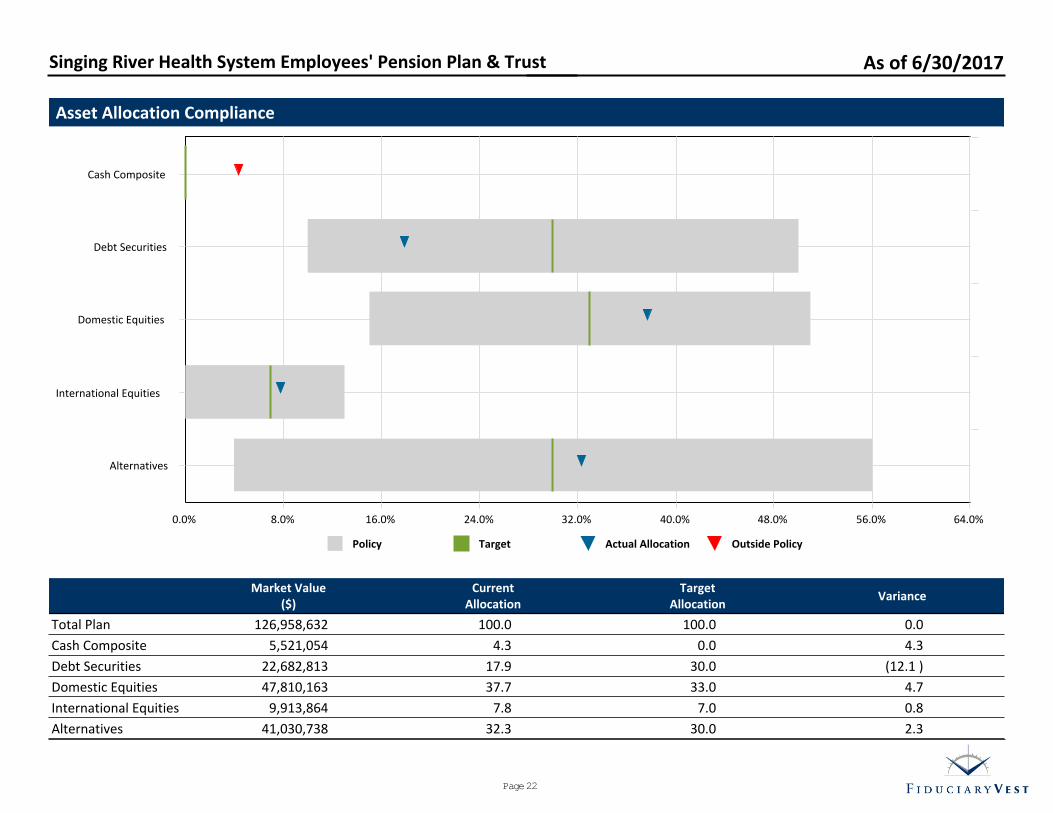
Asset Allocation Compliance
Policy Target Actual Allocation Outside Policy
0.0% 8.0% 16.0% 24.0% 32.0% 40.0% 48.0% 56.0% 64.0%
Alternatives
International Equities
Domestic Equities
Debt Securities
Cash Composite
Market Value($)
CurrentAllocation
TargetAllocation
Variance
Total Plan 126,958,632 100.0 100.0 0.0
Cash Composite 5,521,054 4.3 0.0 4.3
Debt Securities 22,682,813 17.9 30.0 (12.1 )
Domestic Equities 47,810,163 37.7 33.0 4.7
International Equities 9,913,864 7.8 7.0 0.8
Alternatives 41,030,738 32.3 30.0 2.3
Singing River Health System Employees' Pension Plan & Trust As of 6/30/2017
Page 22
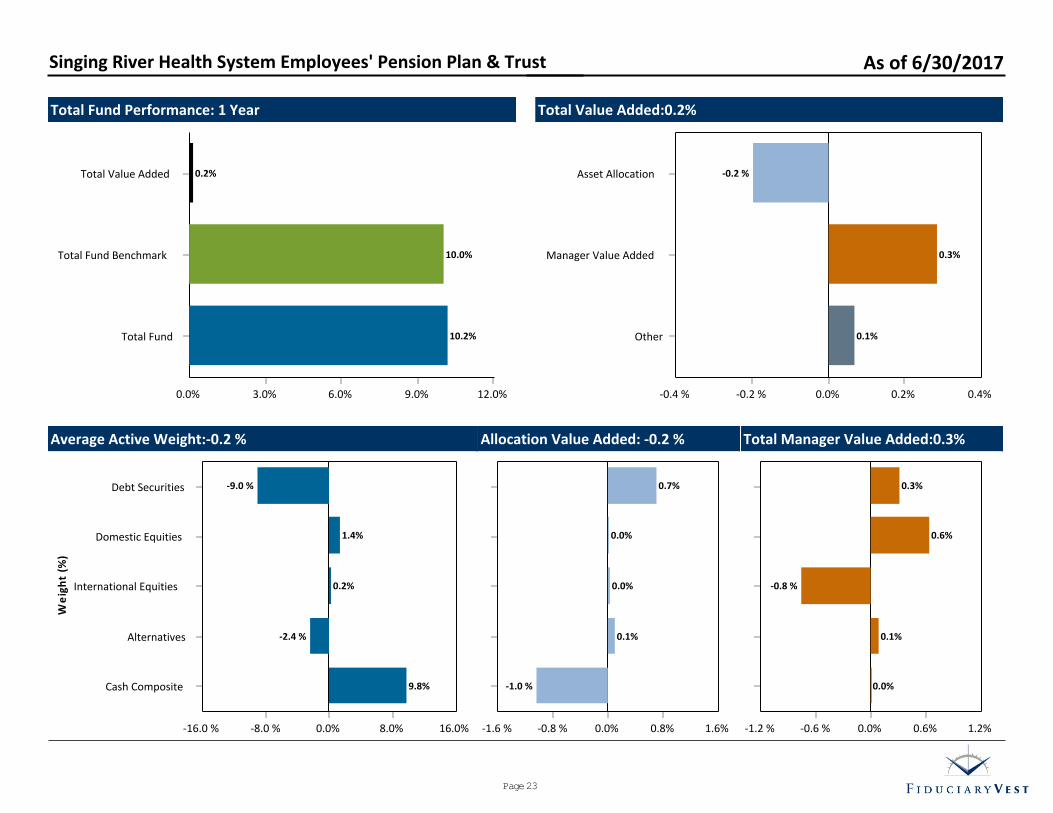
Total Fund Performance: 1 Year
0.0% 3.0% 6.0% 9.0% 12.0%
Total Fund
Total Fund Benchmark
Total Value Added
10.2%
10.0%
0.2%
Total Value Added:0.2%
0.0% 0.2% 0.4%-0.2 %-0.4 %
Other
Manager Value Added
Asset Allocation
0.1%
0.3%
-0.2 %
Average Active Weight:-0.2 %
0.0% 8.0% 16.0%-8.0 %-16.0 %
Cash Composite
Alternatives
International Equities
Domestic Equities
Debt Securities
We
igh
t
(%)
9.8%
-2.4 %
0.2%
1.4%
-9.0 %
Allocation Value Added: -0.2 %
0.0% 0.8% 1.6%-0.8 %-1.6 %
-1.0 %
0.1%
0.0%
0.0%
0.7%
Total Manager Value Added:0.3%
0.0% 0.6% 1.2%-0.6 %-1.2 %
0.0%
0.1%
-0.8 %
0.6%
0.3%
Singing River Health System Employees' Pension Plan & Trust As of 6/30/2017
Page 23
Since Inception in Portfolio
Allocation
MarketValue
$%
Performance(%)
3 Mo 1 Yr 2 Yr 3 Yr 5 Yr 7 Yr 10 YrSince
InceptionInception
Date
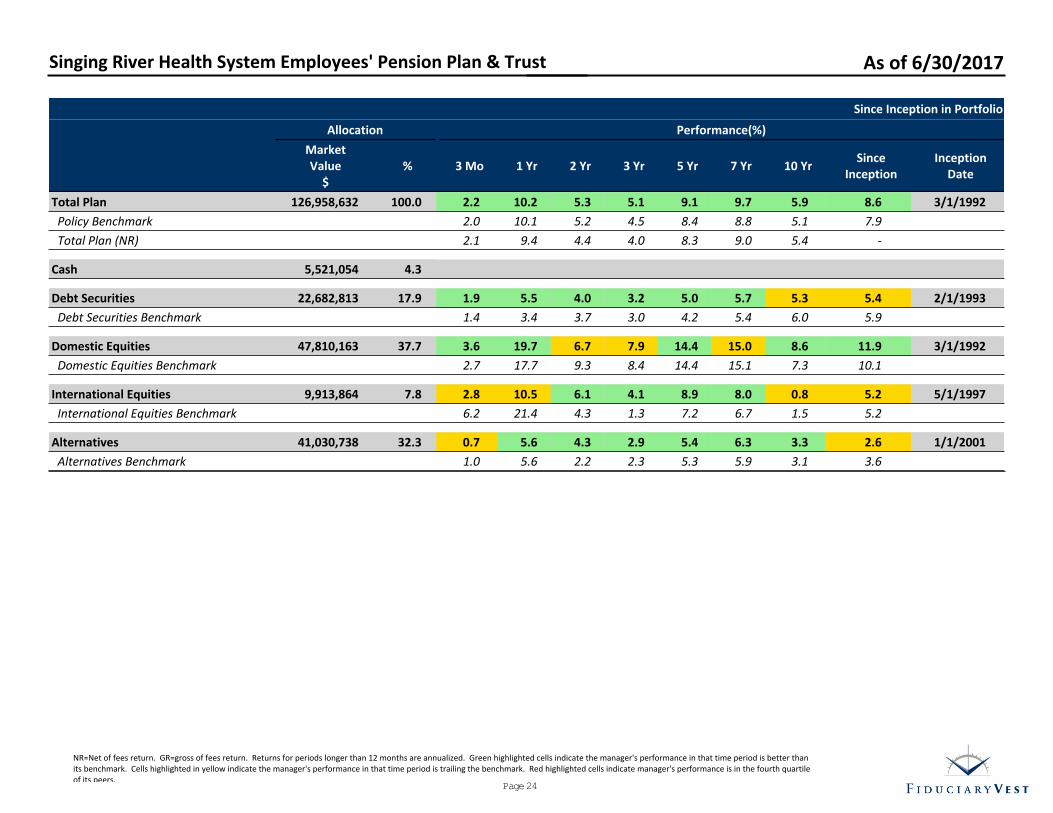
Total Plan 126,958,632 100.0 2.2 10.2 5.3 5.1 9.1 9.7 5.9 8.6 3/1/1992
Policy Benchmark 2.0 10.1 5.2 4.5 8.4 8.8 5.1 7.9
Total Plan (NR) 2.1 9.4 4.4 4.0 8.3 9.0 5.4 -
Cash 5,521,054 4.3
Debt Securities 22,682,813 17.9 1.9 5.5 4.0 3.2 5.0 5.7 5.3 5.4 2/1/1993
Debt Securities Benchmark 1.4 3.4 3.7 3.0 4.2 5.4 6.0 5.9
Domestic Equities 47,810,163 37.7 3.6 19.7 6.7 7.9 14.4 15.0 8.6 11.9 3/1/1992
Domestic Equities Benchmark 2.7 17.7 9.3 8.4 14.4 15.1 7.3 10.1
International Equities 9,913,864 7.8 2.8 10.5 6.1 4.1 8.9 8.0 0.8 5.2 5/1/1997
International Equities Benchmark 6.2 21.4 4.3 1.3 7.2 6.7 1.5 5.2
Alternatives 41,030,738 32.3 0.7 5.6 4.3 2.9 5.4 6.3 3.3 2.6 1/1/2001
Alternatives Benchmark 1.0 5.6 2.2 2.3 5.3 5.9 3.1 3.6
Singing River Health System Employees' Pension Plan & Trust As of 6/30/2017
NR=Net of fees return. GR=gross of fees return. Returns for periods longer than 12 months are annualized. Green highlighted cells indicate the manager's performance in that time period is better thanits benchmark. Cells highlighted in yellow indicate the manager's performance in that time period is trailing the benchmark. Red highlighted cells indicate manager's performance is in the fourth quartileof its peers.
Page 24
Since Inception in Portfolio
Allocation
MarketValue
$%
Performance(%)
3 Mo 1 Yr 3 Yr 5 Yr 7 Yr 10 YrSince
InceptionInception
Date
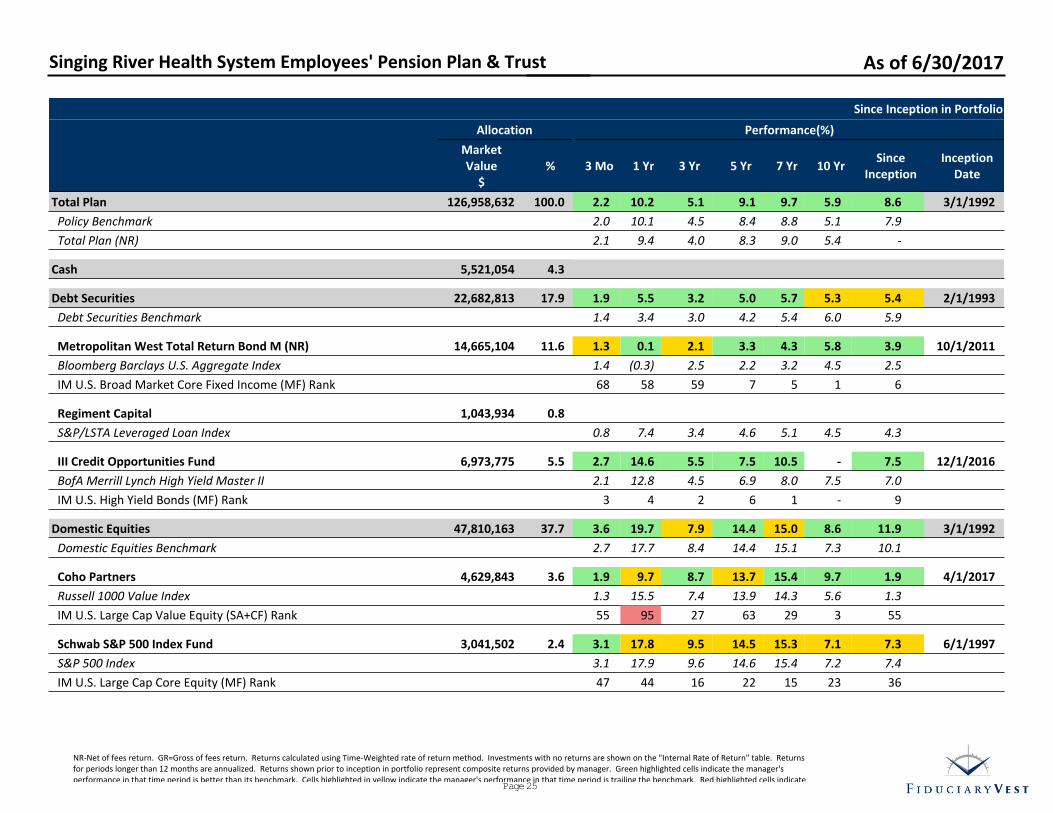
Total Plan 126,958,632 100.0 2.2 10.2 5.1 9.1 9.7 5.9 8.6 3/1/1992
Policy Benchmark 2.0 10.1 4.5 8.4 8.8 5.1 7.9
Total Plan (NR) 2.1 9.4 4.0 8.3 9.0 5.4 -
Cash 5,521,054 4.3
Debt Securities 22,682,813 17.9 1.9 5.5 3.2 5.0 5.7 5.3 5.4 2/1/1993
Debt Securities Benchmark 1.4 3.4 3.0 4.2 5.4 6.0 5.9
Metropolitan West Total Return Bond M (NR) 14,665,104 11.6 1.3 0.1 2.1 3.3 4.3 5.8 3.9 10/1/2011
Bloomberg Barclays U.S. Aggregate Index 1.4 (0.3) 2.5 2.2 3.2 4.5 2.5
IM U.S. Broad Market Core Fixed Income (MF) Rank 68 58 59 7 5 1 6
Regiment Capital 1,043,934 0.8
S&P/LSTA Leveraged Loan Index 0.8 7.4 3.4 4.6 5.1 4.5 4.3
III Credit Opportunities Fund 6,973,775 5.5 2.7 14.6 5.5 7.5 10.5 - 7.5 12/1/2016
BofA Merrill Lynch High Yield Master II 2.1 12.8 4.5 6.9 8.0 7.5 7.0
IM U.S. High Yield Bonds (MF) Rank 3 4 2 6 1 - 9
Domestic Equities 47,810,163 37.7 3.6 19.7 7.9 14.4 15.0 8.6 11.9 3/1/1992
Domestic Equities Benchmark 2.7 17.7 8.4 14.4 15.1 7.3 10.1
Coho Partners 4,629,843 3.6 1.9 9.7 8.7 13.7 15.4 9.7 1.9 4/1/2017
Russell 1000 Value Index 1.3 15.5 7.4 13.9 14.3 5.6 1.3
IM U.S. Large Cap Value Equity (SA+CF) Rank 55 95 27 63 29 3 55
Schwab S&P 500 Index Fund 3,041,502 2.4 3.1 17.8 9.5 14.5 15.3 7.1 7.3 6/1/1997
S&P 500 Index 3.1 17.9 9.6 14.6 15.4 7.2 7.4
IM U.S. Large Cap Core Equity (MF) Rank 47 44 16 22 15 23 36
Singing River Health System Employees' Pension Plan & Trust As of 6/30/2017
NR-Net of fees return. GR=Gross of fees return. Returns calculated using Time-Weighted rate of return method. Investments with no returns are shown on the "Internal Rate of Return" table. Returnsfor periods longer than 12 months are annualized. Returns shown prior to inception in portfolio represent composite returns provided by manager. Green highlighted cells indicate the manager'sperformance in that time period is better than its benchmark. Cells highlighted in yellow indicate the manager's performance in that time period is trailing the benchmark. Red highlighted cells indicate
Page 25
Singing River Health System Employees' Pension Plan & Trust As of 6/30/2017
Allocation
MarketValue
$%
Performance(%)
3 Mo 1 Yr 3 Yr 5 Yr 7 Yr 10 YrSince
InceptionInception
Date
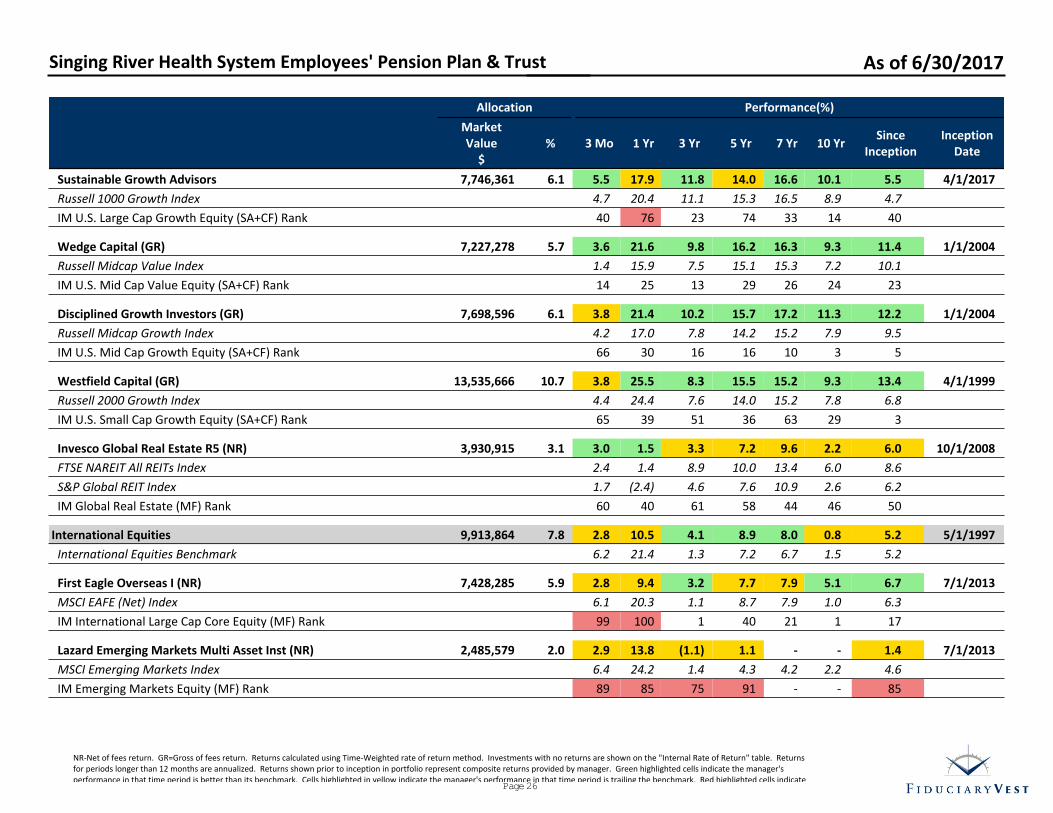
Sustainable Growth Advisors 7,746,361 6.1 5.5 17.9 11.8 14.0 16.6 10.1 5.5 4/1/2017
Russell 1000 Growth Index 4.7 20.4 11.1 15.3 16.5 8.9 4.7
IM U.S. Large Cap Growth Equity (SA+CF) Rank 40 76 23 74 33 14 40
Wedge Capital (GR) 7,227,278 5.7 3.6 21.6 9.8 16.2 16.3 9.3 11.4 1/1/2004
Russell Midcap Value Index 1.4 15.9 7.5 15.1 15.3 7.2 10.1
IM U.S. Mid Cap Value Equity (SA+CF) Rank 14 25 13 29 26 24 23
Disciplined Growth Investors (GR) 7,698,596 6.1 3.8 21.4 10.2 15.7 17.2 11.3 12.2 1/1/2004
Russell Midcap Growth Index 4.2 17.0 7.8 14.2 15.2 7.9 9.5
IM U.S. Mid Cap Growth Equity (SA+CF) Rank 66 30 16 16 10 3 5
Westfield Capital (GR) 13,535,666 10.7 3.8 25.5 8.3 15.5 15.2 9.3 13.4 4/1/1999
Russell 2000 Growth Index 4.4 24.4 7.6 14.0 15.2 7.8 6.8
IM U.S. Small Cap Growth Equity (SA+CF) Rank 65 39 51 36 63 29 3
Invesco Global Real Estate R5 (NR) 3,930,915 3.1 3.0 1.5 3.3 7.2 9.6 2.2 6.0 10/1/2008
FTSE NAREIT All REITs Index 2.4 1.4 8.9 10.0 13.4 6.0 8.6
S&P Global REIT Index 1.7 (2.4) 4.6 7.6 10.9 2.6 6.2
IM Global Real Estate (MF) Rank 60 40 61 58 44 46 50
International Equities 9,913,864 7.8 2.8 10.5 4.1 8.9 8.0 0.8 5.2 5/1/1997
International Equities Benchmark 6.2 21.4 1.3 7.2 6.7 1.5 5.2
First Eagle Overseas I (NR) 7,428,285 5.9 2.8 9.4 3.2 7.7 7.9 5.1 6.7 7/1/2013
MSCI EAFE (Net) Index 6.1 20.3 1.1 8.7 7.9 1.0 6.3
IM International Large Cap Core Equity (MF) Rank 99 100 1 40 21 1 17
Lazard Emerging Markets Multi Asset Inst (NR) 2,485,579 2.0 2.9 13.8 (1.1) 1.1 - - 1.4 7/1/2013
MSCI Emerging Markets Index 6.4 24.2 1.4 4.3 4.2 2.2 4.6
IM Emerging Markets Equity (MF) Rank 89 85 75 91 - - 85
NR-Net of fees return. GR=Gross of fees return. Returns calculated using Time-Weighted rate of return method. Investments with no returns are shown on the "Internal Rate of Return" table. Returnsfor periods longer than 12 months are annualized. Returns shown prior to inception in portfolio represent composite returns provided by manager. Green highlighted cells indicate the manager'sperformance in that time period is better than its benchmark. Cells highlighted in yellow indicate the manager's performance in that time period is trailing the benchmark. Red highlighted cells indicate
Page 26
Singing River Health System Employees' Pension Plan & Trust As of 6/30/2017
Allocation
MarketValue
$%
Performance(%)
3 Mo 1 Yr 3 Yr 5 Yr 7 Yr 10 YrSince
InceptionInception
Date
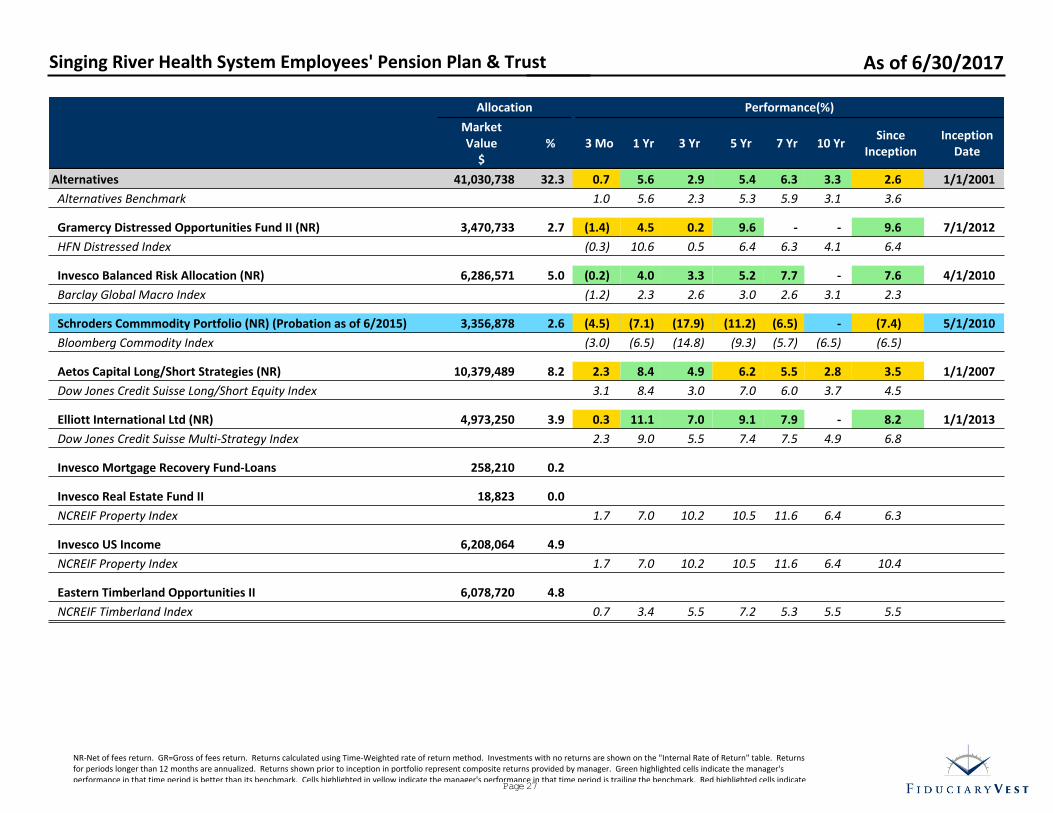
Alternatives 41,030,738 32.3 0.7 5.6 2.9 5.4 6.3 3.3 2.6 1/1/2001
Alternatives Benchmark 1.0 5.6 2.3 5.3 5.9 3.1 3.6
Gramercy Distressed Opportunities Fund II (NR) 3,470,733 2.7 (1.4) 4.5 0.2 9.6 - - 9.6 7/1/2012
HFN Distressed Index (0.3) 10.6 0.5 6.4 6.3 4.1 6.4
Invesco Balanced Risk Allocation (NR) 6,286,571 5.0 (0.2) 4.0 3.3 5.2 7.7 - 7.6 4/1/2010
Barclay Global Macro Index (1.2) 2.3 2.6 3.0 2.6 3.1 2.3
Schroders Commmodity Portfolio (NR) (Probation as of 6/2015) 3,356,878 2.6 (4.5) (7.1) (17.9) (11.2) (6.5) - (7.4) 5/1/2010
Bloomberg Commodity Index (3.0) (6.5) (14.8) (9.3) (5.7) (6.5) (6.5)
Aetos Capital Long/Short Strategies (NR) 10,379,489 8.2 2.3 8.4 4.9 6.2 5.5 2.8 3.5 1/1/2007
Dow Jones Credit Suisse Long/Short Equity Index 3.1 8.4 3.0 7.0 6.0 3.7 4.5
Elliott International Ltd (NR) 4,973,250 3.9 0.3 11.1 7.0 9.1 7.9 - 8.2 1/1/2013
Dow Jones Credit Suisse Multi-Strategy Index 2.3 9.0 5.5 7.4 7.5 4.9 6.8
Invesco Mortgage Recovery Fund-Loans 258,210 0.2
Invesco Real Estate Fund II 18,823 0.0
NCREIF Property Index 1.7 7.0 10.2 10.5 11.6 6.4 6.3
Invesco US Income 6,208,064 4.9
NCREIF Property Index 1.7 7.0 10.2 10.5 11.6 6.4 10.4
Eastern Timberland Opportunities II 6,078,720 4.8
NCREIF Timberland Index 0.7 3.4 5.5 7.2 5.3 5.5 5.5
NR-Net of fees return. GR=Gross of fees return. Returns calculated using Time-Weighted rate of return method. Investments with no returns are shown on the "Internal Rate of Return" table. Returnsfor periods longer than 12 months are annualized. Returns shown prior to inception in portfolio represent composite returns provided by manager. Green highlighted cells indicate the manager'sperformance in that time period is better than its benchmark. Cells highlighted in yellow indicate the manager's performance in that time period is trailing the benchmark. Red highlighted cells indicate
Page 27
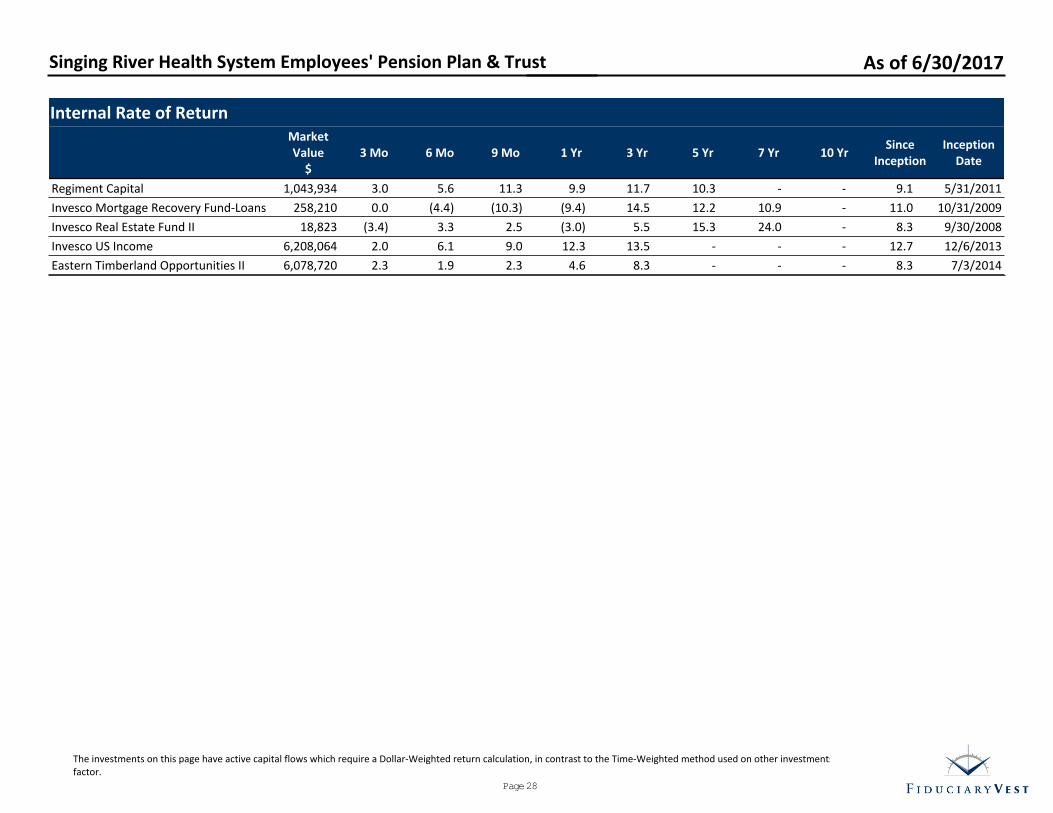
Internal Rate of ReturnMarketValue
$3 Mo 6 Mo 9 Mo 1 Yr 3 Yr 5 Yr 7 Yr 10 Yr
SinceInception
InceptionDate
Regiment Capital 1,043,934 3.0 5.6 11.3 9.9 11.7 10.3 - - 9.1 5/31/2011
Invesco Mortgage Recovery Fund-Loans 258,210 0.0 (4.4) (10.3) (9.4) 14.5 12.2 10.9 - 11.0 10/31/2009
Invesco Real Estate Fund II 18,823 (3.4) 3.3 2.5 (3.0) 5.5 15.3 24.0 - 8.3 9/30/2008
Invesco US Income 6,208,064 2.0 6.1 9.0 12.3 13.5 - - - 12.7 12/6/2013
Eastern Timberland Opportunities II 6,078,720 2.3 1.9 2.3 4.6 8.3 - - - 8.3 7/3/2014
Singing River Health System Employees' Pension Plan & Trust As of 6/30/2017
The investments on this page have active capital flows which require a Dollar-Weighted return calculation, in contrast to the Time-Weighted method used on other investments where cash flows are not afactor.
Page 28

Mark to Market Accounting Summary: 1 Quarter (in 000s)Beginning
Market ValueDeposits Withdrawals
NetTransfers
Fees IncomeAsset Value
ChangeEnding Market
Value
Total Portfolio 128,128 16 (3,777) - (89) 264 2,438 126,959
Cash 1,637 - - (6) - 3 - 1,634
Distributed Cash 939 5 - 2,943 - - - 3,887
Metropolitan West Total Return Bond M 18,241 4 (3,773) - - - 199 14,665
Bradford & Marzec High Yield - - - - - - - -
Private Advisors Distressed Opportunities - - - - - - - -
Regiment Capital 1,046 - - (34) (3) 29 5 1,044
III Credit Opportunities Fund 6,794 - - - (33) 122 97 6,974
Barrow Hanley 7,569 - - (7,538) - - (30) -
Janus Capital 7,342 3 - (7,342) (5) - 2 -
Coho Partners - - - 4,538 - 26 66 4,630
Schwab S&P 500 Index Fund - - - 3,000 - - 41 3,042
Sustainable Growth Advisors - - (1) 7,342 - 23 383 7,746
Disciplined Growth Investors 7,420 - - - - - 279 7,699
Wedge Capital 6,983 4 - - (13) 33 221 7,227
Westfield Capital 13,063 - - - (23) 23 474 13,536
Invesco Global Real Estate R5 4,497 - - (700) - - 134 3,931
First Eagle Overseas I 7,230 - - - - - 199 7,428
Lazard Emerging Markets Multi Asset Inst 2,417 - - - - - 69 2,486
Gramercy Distressed Opportunities Fund II 3,519 - - 1 - - (49) 3,471
Invesco Balanced Risk Allocation 8,051 - (3) (1,748) (6) - (8) 6,287
Schroders Commmodity Portfolio 3,514 - - 1 (7) 6 (156) 3,357
Aetos Capital Long/Short Strategies 10,146 - - - - - 235 10,379
Pointer L.P. - - - - - - - -
Elliott International Ltd 4,958 - - - - - 15 4,973
Invesco Mortgage Recovery Fund-Loans 643 - - (385) - - - 258
Invesco Real Estate Fund II 19 - - - - - (1) 19
Invesco US Income 6,157 - - (74) - - 125 6,208
Eastern Timberland Opportunities II 5,940 - - 2 - - 137 6,079
Singing River Health System Employees' Pension Plan & Trust As of 6/30/2017
Page 29
Mark to Market Accounting Summary: 3 Quarters (in 000s)Beginning
Market ValueDeposits Withdrawals
NetTransfers
Fees IncomeAsset Value
ChangeEnding Market
Value
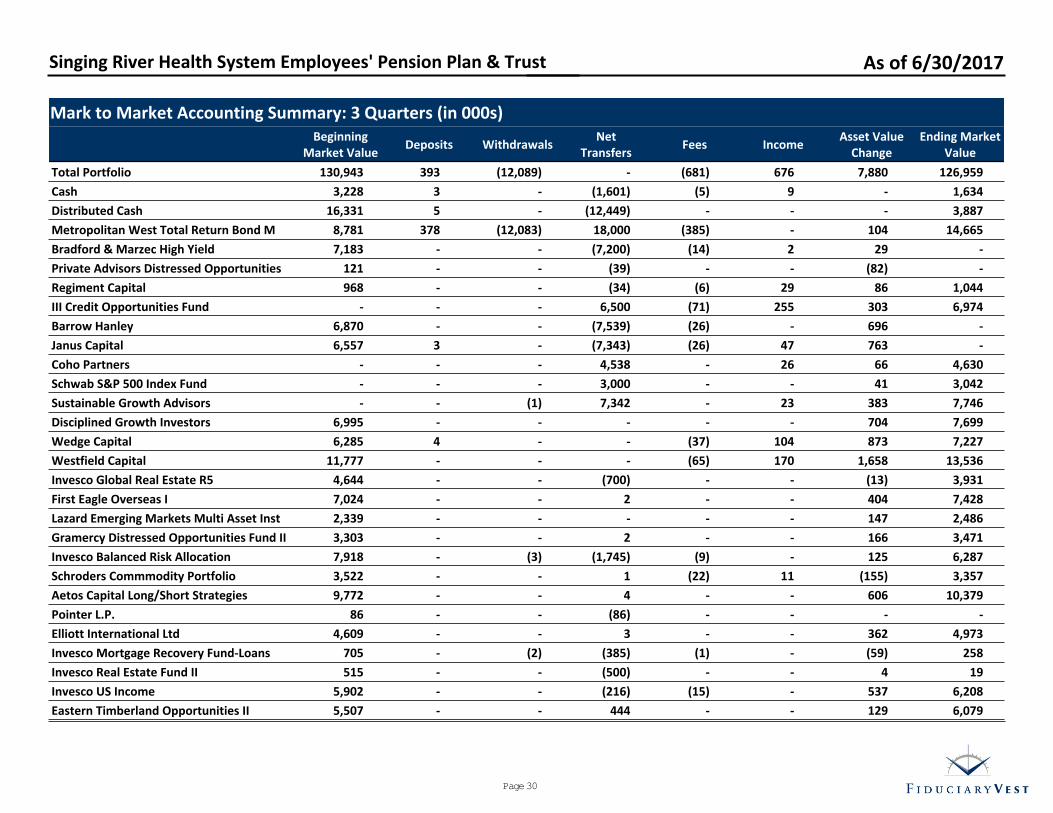
Total Portfolio 130,943 393 (12,089) - (681) 676 7,880 126,959
Cash 3,228 3 - (1,601) (5) 9 - 1,634
Distributed Cash 16,331 5 - (12,449) - - - 3,887
Metropolitan West Total Return Bond M 8,781 378 (12,083) 18,000 (385) - 104 14,665
Bradford & Marzec High Yield 7,183 - - (7,200) (14) 2 29 -
Private Advisors Distressed Opportunities 121 - - (39) - - (82) -
Regiment Capital 968 - - (34) (6) 29 86 1,044
III Credit Opportunities Fund - - - 6,500 (71) 255 303 6,974
Barrow Hanley 6,870 - - (7,539) (26) - 696 -
Janus Capital 6,557 3 - (7,343) (26) 47 763 -
Coho Partners - - - 4,538 - 26 66 4,630
Schwab S&P 500 Index Fund - - - 3,000 - - 41 3,042
Sustainable Growth Advisors - - (1) 7,342 - 23 383 7,746
Disciplined Growth Investors 6,995 - - - - - 704 7,699
Wedge Capital 6,285 4 - - (37) 104 873 7,227
Westfield Capital 11,777 - - - (65) 170 1,658 13,536
Invesco Global Real Estate R5 4,644 - - (700) - - (13) 3,931
First Eagle Overseas I 7,024 - - 2 - - 404 7,428
Lazard Emerging Markets Multi Asset Inst 2,339 - - - - - 147 2,486
Gramercy Distressed Opportunities Fund II 3,303 - - 2 - - 166 3,471
Invesco Balanced Risk Allocation 7,918 - (3) (1,745) (9) - 125 6,287
Schroders Commmodity Portfolio 3,522 - - 1 (22) 11 (155) 3,357
Aetos Capital Long/Short Strategies 9,772 - - 4 - - 606 10,379
Pointer L.P. 86 - - (86) - - - -
Elliott International Ltd 4,609 - - 3 - - 362 4,973
Invesco Mortgage Recovery Fund-Loans 705 - (2) (385) (1) - (59) 258
Invesco Real Estate Fund II 515 - - (500) - - 4 19
Invesco US Income 5,902 - - (216) (15) - 537 6,208
Eastern Timberland Opportunities II 5,507 - - 444 - - 129 6,079
Singing River Health System Employees' Pension Plan & Trust As of 6/30/2017
Page 30
Liquidity Schedule
InvestmentsMarket Value
$Daily
$Monthly
$Quarterly
$Annually
$Illiquid
$
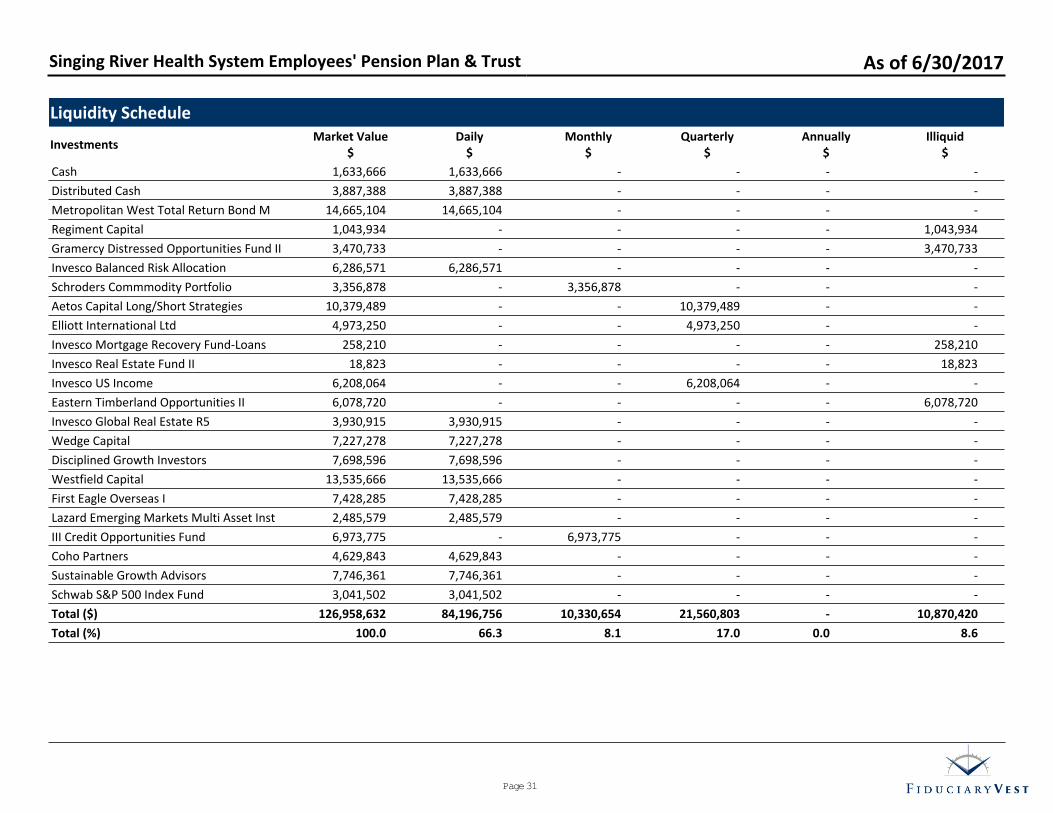
Cash 1,633,666 1,633,666 - - - -
Distributed Cash 3,887,388 3,887,388 - - - -
Metropolitan West Total Return Bond M 14,665,104 14,665,104 - - - -
Regiment Capital 1,043,934 - - - - 1,043,934
Gramercy Distressed Opportunities Fund II 3,470,733 - - - - 3,470,733
Invesco Balanced Risk Allocation 6,286,571 6,286,571 - - - -
Schroders Commmodity Portfolio 3,356,878 - 3,356,878 - - -
Aetos Capital Long/Short Strategies 10,379,489 - - 10,379,489 - -
Elliott International Ltd 4,973,250 - - 4,973,250 - -
Invesco Mortgage Recovery Fund-Loans 258,210 - - - - 258,210
Invesco Real Estate Fund II 18,823 - - - - 18,823
Invesco US Income 6,208,064 - - 6,208,064 - -
Eastern Timberland Opportunities II 6,078,720 - - - - 6,078,720
Invesco Global Real Estate R5 3,930,915 3,930,915 - - - -
Wedge Capital 7,227,278 7,227,278 - - - -
Disciplined Growth Investors 7,698,596 7,698,596 - - - -
Westfield Capital 13,535,666 13,535,666 - - - -
First Eagle Overseas I 7,428,285 7,428,285 - - - -
Lazard Emerging Markets Multi Asset Inst 2,485,579 2,485,579 - - - -
III Credit Opportunities Fund 6,973,775 - 6,973,775 - - -
Coho Partners 4,629,843 4,629,843 - - - -
Sustainable Growth Advisors 7,746,361 7,746,361 - - - -
Schwab S&P 500 Index Fund 3,041,502 3,041,502 - - - -
Total ($) 126,958,632 84,196,756 10,330,654 21,560,803 - 10,870,420
Total (%) 100.0 66.3 8.1 17.0 0.0 8.6
Singing River Health System Employees' Pension Plan & Trust As of 6/30/2017
Page 31
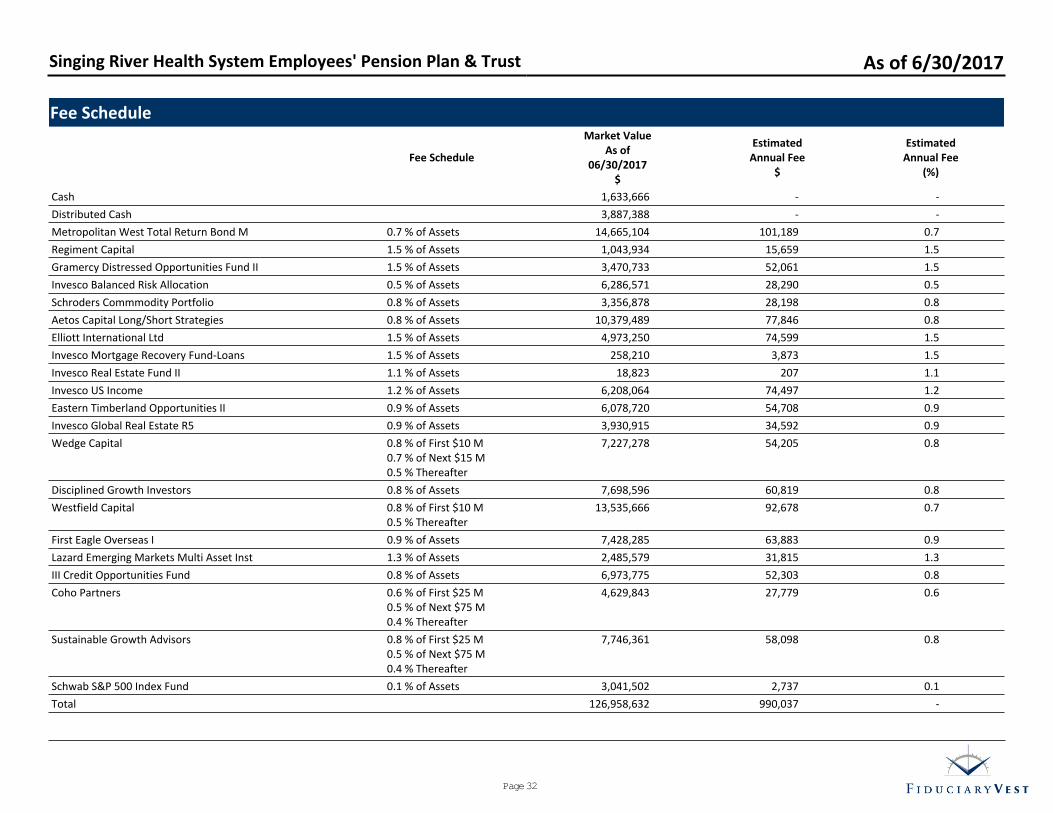
Fee Schedule
Fee Schedule
Market ValueAs of
06/30/2017$
EstimatedAnnual Fee
$
EstimatedAnnual Fee
(%)
Cash 1,633,666 - -
Distributed Cash 3,887,388 - -
Metropolitan West Total Return Bond M 0.7 % of Assets 14,665,104 101,189 0.7
Regiment Capital 1.5 % of Assets 1,043,934 15,659 1.5
Gramercy Distressed Opportunities Fund II 1.5 % of Assets 3,470,733 52,061 1.5
Invesco Balanced Risk Allocation 0.5 % of Assets 6,286,571 28,290 0.5
Schroders Commmodity Portfolio 0.8 % of Assets 3,356,878 28,198 0.8
Aetos Capital Long/Short Strategies 0.8 % of Assets 10,379,489 77,846 0.8
Elliott International Ltd 1.5 % of Assets 4,973,250 74,599 1.5
Invesco Mortgage Recovery Fund-Loans 1.5 % of Assets 258,210 3,873 1.5
Invesco Real Estate Fund II 1.1 % of Assets 18,823 207 1.1
Invesco US Income 1.2 % of Assets 6,208,064 74,497 1.2
Eastern Timberland Opportunities II 0.9 % of Assets 6,078,720 54,708 0.9
Invesco Global Real Estate R5 0.9 % of Assets 3,930,915 34,592 0.9
Wedge Capital 0.8 % of First $10 M0.7 % of Next $15 M0.5 % Thereafter
7,227,278 54,205 0.8
Disciplined Growth Investors 0.8 % of Assets 7,698,596 60,819 0.8
Westfield Capital 0.8 % of First $10 M0.5 % Thereafter
13,535,666 92,678 0.7
First Eagle Overseas I 0.9 % of Assets 7,428,285 63,883 0.9
Lazard Emerging Markets Multi Asset Inst 1.3 % of Assets 2,485,579 31,815 1.3
III Credit Opportunities Fund 0.8 % of Assets 6,973,775 52,303 0.8
Coho Partners 0.6 % of First $25 M0.5 % of Next $75 M0.4 % Thereafter
4,629,843 27,779 0.6
Sustainable Growth Advisors 0.8 % of First $25 M0.5 % of Next $75 M0.4 % Thereafter
7,746,361 58,098 0.8
Schwab S&P 500 Index Fund 0.1 % of Assets 3,041,502 2,737 0.1
Total 126,958,632 990,037 -
Singing River Health System Employees' Pension Plan & Trust As of 6/30/2017
Page 32
Investment Manager Analysis
Page 33

Fund Snapshot
Ticker : MWTRX
Peer Group : IM U.S. Broad Market CoreFixed Income (MF)
Benchmark : Bloomberg Barclays U.S.Aggregate Index
Total Assets : $14,542 Million
Fund Inception : 3/31/1997
Portfolio Manager : Team Managed
Net Expense : 0.67%
Turnover : 313%
Investment Strategy
The Fund seeks to maximize long-term total return by investing at least 80% of its assets in a diversified portfolio of fixed-income securities ofvarying maturities, issued by domestic and foreign corporations and governments with portfolio duration of two to eight years.
Performance Relative to Peer Group
-25.0
-20.0
-15.0
-10.0
-5.0
0.0
5.0
10.0
15.0
20.0
25.0
Re
turn
YTD 2016 2015 2014 2013 2012 2011 2010 2009 2008
Trailing Returns
Metropolitan West Total Return Bond M
Bloomberg Barclays U.S. Aggregate Index
0.0 2.0 4.0 6.0 8.0-2.0
10 Yr
5 Yr
3 Yr
1 Yr
6 Mo
3 Mo
5.8
3.3
2.1
0.1
2.1
1.3
4.5
2.2
2.5
-0.3
2.3
1.4
Calendar Year Returns
YTD 2016 2015 2014 2013 2012 2011 2010 2009 2008
Fund 2.1 (77) 2.3 (76) 0.0 (52) 5.8 (35) 0.2 (3) 11.4 (1) 5.2 (85) 11.5 (2) 17.1 (18) (1.5) (42)
Benchmark 2.3 2.6 0.5 6.0 (2.0) 4.2 7.8 6.5 5.9 5.2
Peer Group Median 2.4 2.9 0.0 5.5 (2.0) 6.0 6.7 7.2 12.1 (3.4)
Population 510 496 481 472 470 469 475 482 482 517
Metropolitan West Total Return Bond M As of June 30, 2017
Page 34
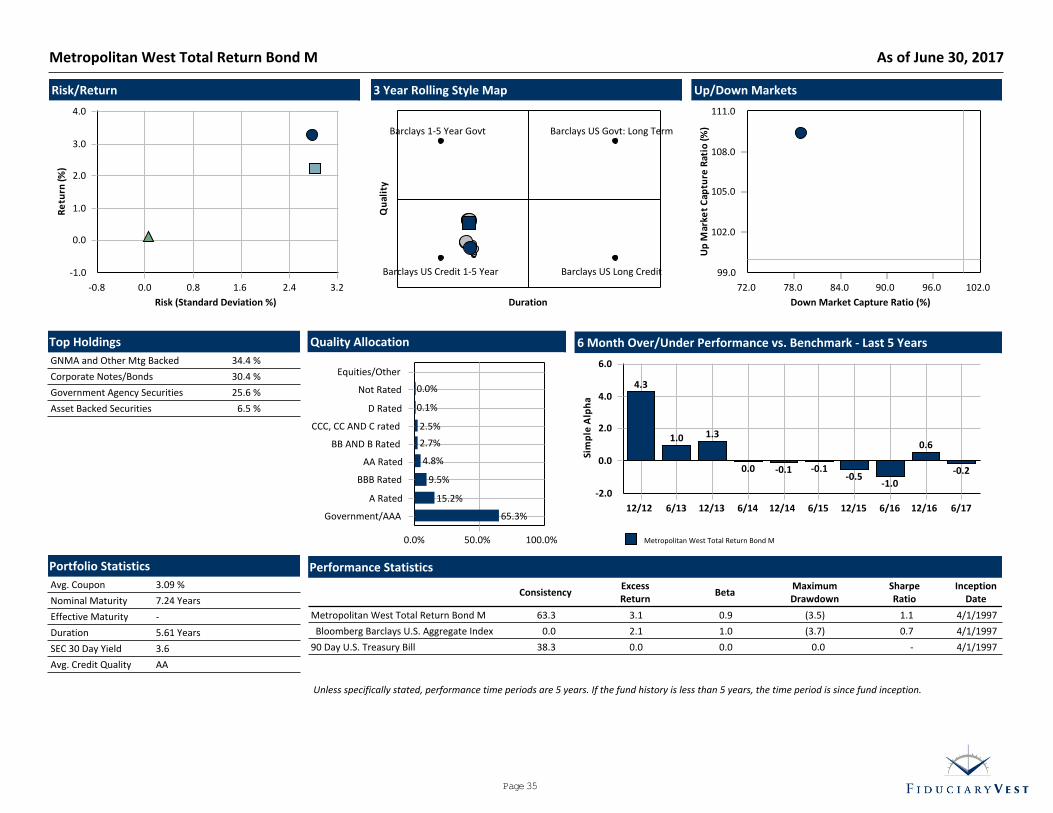
Unless specifically stated, performance time periods are 5 years. If the fund history is less than 5 years, the time period is since fund inception.
3 Year Rolling Style Map
Qu
alit
y
Duration
Barclays US Govt: Long Term
Barclays US Long CreditBarclays US Credit 1-5 Year
Barclays 1-5 Year Govt
Up/Down Markets
99.0
102.0
105.0
108.0
111.0
Up
Mar
ket
C
aptu
re R
atio
(%)
72.0 78.0 84.0 90.0 96.0 102.0
Down Market Capture Ratio (%)
Risk/Return
-1.0
0.0
1.0
2.0
3.0
4.0
Re
turn
(%)
-0.8 0.0 0.8 1.6 2.4 3.2
Risk (Standard Deviation %)
6 Month Over/Under Performance vs. Benchmark - Last 5 Years
Metropolitan West Total Return Bond M
0.0
2.0
4.0
6.0
-2.0
Sim
ple
Alp
ha
12/12 6/13 12/13 6/14 12/14 6/15 12/15 6/16 12/16 6/17
4.3
1.0 1.3
0.0 -0.1 -0.1-0.5
-1.0
0.6
-0.2
Quality Allocation
0.0% 50.0% 100.0%
Government/AAA
A Rated
BBB Rated
AA Rated
BB AND B Rated
CCC, CC AND C rated
D Rated
Not Rated
Equities/Other
65.3%
15.2%
9.5%
4.8%
2.7%
2.5%
0.1%
0.0%
Top Holdings
GNMA and Other Mtg Backed 34.4 %
Corporate Notes/Bonds 30.4 %
Government Agency Securities 25.6 %
Asset Backed Securities 6.5 %
Portfolio Statistics
Avg. Coupon 3.09 %
Nominal Maturity 7.24 Years
Effective Maturity -
Duration 5.61 Years
SEC 30 Day Yield 3.6
Avg. Credit Quality AA
Performance Statistics
ConsistencyExcessReturn
BetaMaximumDrawdown
SharpeRatio
InceptionDate
Metropolitan West Total Return Bond M 63.3 3.1 0.9 (3.5) 1.1 4/1/1997
Bloomberg Barclays U.S. Aggregate Index 0.0 2.1 1.0 (3.7) 0.7 4/1/1997
90 Day U.S. Treasury Bill 38.3 0.0 0.0 0.0 - 4/1/1997
Metropolitan West Total Return Bond M As of June 30, 2017
Page 35
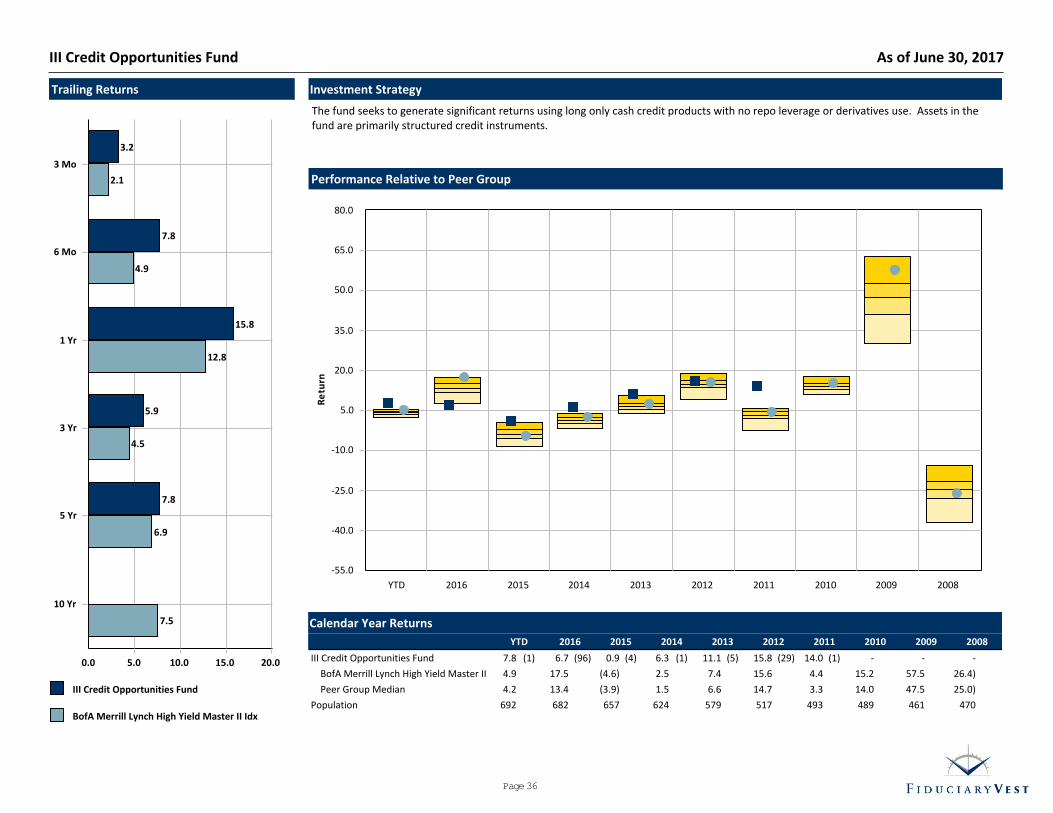
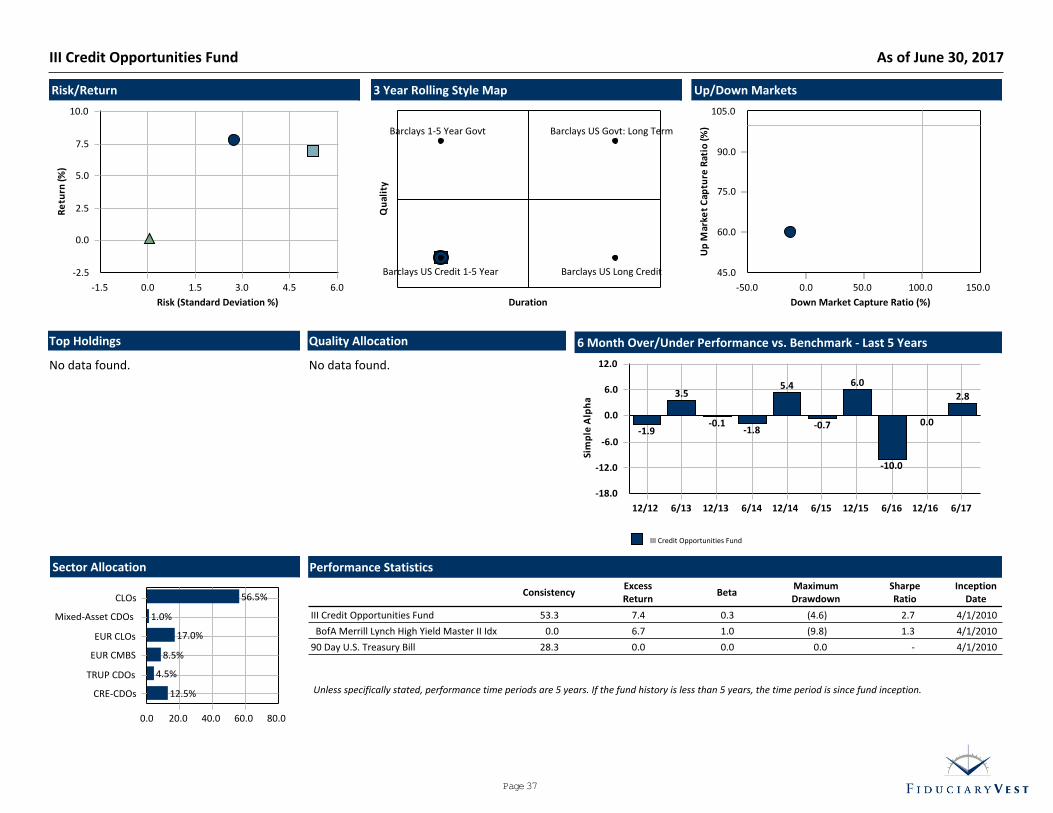
Investment Strategy
The fund seeks to generate significant returns using long only cash credit products with no repo leverage or derivatives use. Assets in thefund are primarily structured credit instruments.
Trailing Returns
III Credit Opportunities Fund
BofA Merrill Lynch High Yield Master II Idx
0.0 5.0 10.0 15.0 20.0
10 Yr
5 Yr
3 Yr
1 Yr
6 Mo
3 Mo
7.8
5.9
15.8
7.8
3.2
7.5
6.9
4.5
12.8
4.9
2.1 Performance Relative to Peer Group
-55.0
-40.0
-25.0
-10.0
5.0
20.0
35.0
50.0
65.0
80.0
Re
turn
YTD 2016 2015 2014 2013 2012 2011 2010 2009 2008
Calendar Year Returns
YTD 2016 2015 2014 2013 2012 2011 2010 2009 2008
III Credit Opportunities Fund 7.8 (1) 6.7 (96) 0.9 (4) 6.3 (1) 11.1 (5) 15.8 (29) 14.0 (1) - - -
BofA Merrill Lynch High Yield Master II 4.9 17.5 (4.6) 2.5 7.4 15.6 4.4 15.2 57.5 (26.4)
Peer Group Median 4.2 13.4 (3.9) 1.5 6.6 14.7 3.3 14.0 47.5 (25.0)
Population 692 682 657 624 579 517 493 489 461 470
III Credit Opportunities Fund As of June 30, 2017
Page 36
Unless specifically stated, performance time periods are 5 years. If the fund history is less than 5 years, the time period is since fund inception.
3 Year Rolling Style Map
Qu
alit
y
Duration
Barclays US Govt: Long Term
Barclays US Long CreditBarclays US Credit 1-5 Year
Barclays 1-5 Year Govt
Up/Down Markets
45.0
60.0
75.0
90.0
105.0
Up
Mar
ket
C
aptu
re R
atio
(%)
-50.0 0.0 50.0 100.0 150.0
Down Market Capture Ratio (%)
Risk/Return
-2.5
0.0
2.5
5.0
7.5
10.0
Re
turn
(%)
-1.5 0.0 1.5 3.0 4.5 6.0
Risk (Standard Deviation %)
6 Month Over/Under Performance vs. Benchmark - Last 5 Years
III Credit Opportunities Fund
0.0
6.0
12.0
-6.0
-12.0
-18.0
Sim
ple
Alp
ha
12/12 6/13 12/13 6/14 12/14 6/15 12/15 6/16 12/16 6/17
-1.9
3.5
-0.1-1.8
5.4
-0.7
6.0
-10.0
0.0
2.8
Quality Allocation
No data found.
Top Holdings
No data found.
Sector Allocation
0.0 20.0 40.0 60.0 80.0
CRE-CDOs
TRUP CDOs
EUR CMBS
EUR CLOs
Mixed-Asset CDOs
CLOs
12.5%
4.5%
8.5%
17.0%
1.0%
56.5%
Performance Statistics
ConsistencyExcessReturn
BetaMaximumDrawdown
SharpeRatio
InceptionDate
III Credit Opportunities Fund 53.3 7.4 0.3 (4.6) 2.7 4/1/2010
BofA Merrill Lynch High Yield Master II Idx 0.0 6.7 1.0 (9.8) 1.3 4/1/2010
90 Day U.S. Treasury Bill 28.3 0.0 0.0 0.0 - 4/1/2010
III Credit Opportunities Fund As of June 30, 2017
Page 37

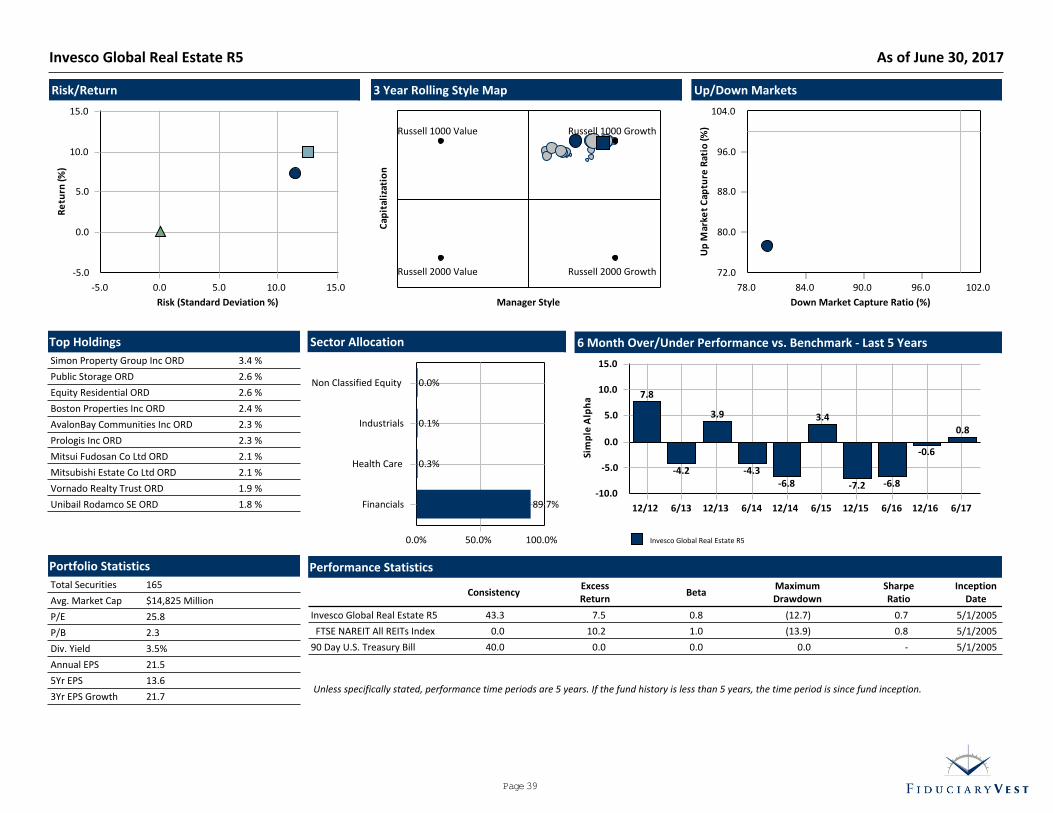
Investment Strategy
The Fund seeks high total return through growth of capital and current income. The Fund seeks to meet its objective by investing at least80% of its assets in securities of real estate and real estate-related companies.
Fund Snapshot
Ticker : IGREX
Peer Group : IM Global Real Estate (MF)
Benchmark : FTSE NAREIT All REITsIndex
Total Assets : $269 Million
Fund Inception : 4/29/2005
Portfolio Manager : Team Managed
Net Expense : 0.91%
Turnover : 57%
Performance Relative to Peer Group
-55.0
-40.0
-25.0
-10.0
5.0
20.0
35.0
50.0
65.0
Re
turn
YTD 2016 2015 2014 2013 2012 2011 2010 2009 2008
Trailing Returns
Invesco Global Real Estate R5
FTSE NAREIT All REITs Index
0.0 3.0 6.0 9.0 12.0
10 Yr
5 Yr
3 Yr
1 Yr
6 Mo
3 Mo
2.2
7.2
3.3
1.5
6.3
3.0
6.0
10.0
8.9
1.4
5.4
2.4
Calendar Year Returns
YTD 2016 2015 2014 2013 2012 2011 2010 2009 2008
Fund 6.3 (28) 2.1 (62) (1.1) (68) 14.8 (38) 3.0 (58) 28.4 (46) (6.5) (50) 17.7 (63) 31.3 (71) (44.7) (39)
Benchmark 5.4 9.3 2.3 27.1 3.2 20.1 7.3 27.6 27.4 (37.3)
Peer Group Median 5.3 2.8 (0.3) 14.3 3.2 28.2 (6.6) 18.8 34.1 (45.3)
Population 181 179 164 139 115 108 102 107 92 92
Invesco Global Real Estate R5 As of June 30, 2017
Page 38
Unless specifically stated, performance time periods are 5 years. If the fund history is less than 5 years, the time period is since fund inception.
3 Year Rolling Style Map
Cap
ital
izat
ion
Manager Style
Russell 1000 Growth
Russell 2000 GrowthRussell 2000 Value
Russell 1000 Value
Up/Down Markets
72.0
80.0
88.0
96.0
104.0
Up
Mar
ket
C
aptu
re R
atio
(%)
78.0 84.0 90.0 96.0 102.0
Down Market Capture Ratio (%)
Risk/Return
-5.0
0.0
5.0
10.0
15.0
Re
turn
(%)
-5.0 0.0 5.0 10.0 15.0
Risk (Standard Deviation %)
6 Month Over/Under Performance vs. Benchmark - Last 5 Years
Invesco Global Real Estate R5
0.0
5.0
10.0
15.0
-5.0
-10.0
Sim
ple
Alp
ha
12/12 6/13 12/13 6/14 12/14 6/15 12/15 6/16 12/16 6/17
7.8
-4.2
3.9
-4.3-6.8
3.4
-7.2 -6.8
-0.6
0.8
Sector Allocation
0.0% 50.0% 100.0%
Financials
Health Care
Industrials
Non Classified Equity
89.7%
0.3%
0.1%
0.0%
Top Holdings
Simon Property Group Inc ORD 3.4 %
Public Storage ORD 2.6 %
Equity Residential ORD 2.6 %
Boston Properties Inc ORD 2.4 %
AvalonBay Communities Inc ORD 2.3 %
Prologis Inc ORD 2.3 %
Mitsui Fudosan Co Ltd ORD 2.1 %
Mitsubishi Estate Co Ltd ORD 2.1 %
Vornado Realty Trust ORD 1.9 %
Unibail Rodamco SE ORD 1.8 %
Portfolio Statistics
Total Securities 165
Avg. Market Cap $14,825 Million
P/E 25.8
P/B 2.3
Div. Yield 3.5%
Annual EPS 21.5
5Yr EPS 13.6
3Yr EPS Growth 21.7
Performance Statistics
ConsistencyExcessReturn
BetaMaximumDrawdown
SharpeRatio
InceptionDate
Invesco Global Real Estate R5 43.3 7.5 0.8 (12.7) 0.7 5/1/2005
FTSE NAREIT All REITs Index 0.0 10.2 1.0 (13.9) 0.8 5/1/2005
90 Day U.S. Treasury Bill 40.0 0.0 0.0 0.0 - 5/1/2005
Invesco Global Real Estate R5 As of June 30, 2017
Page 39
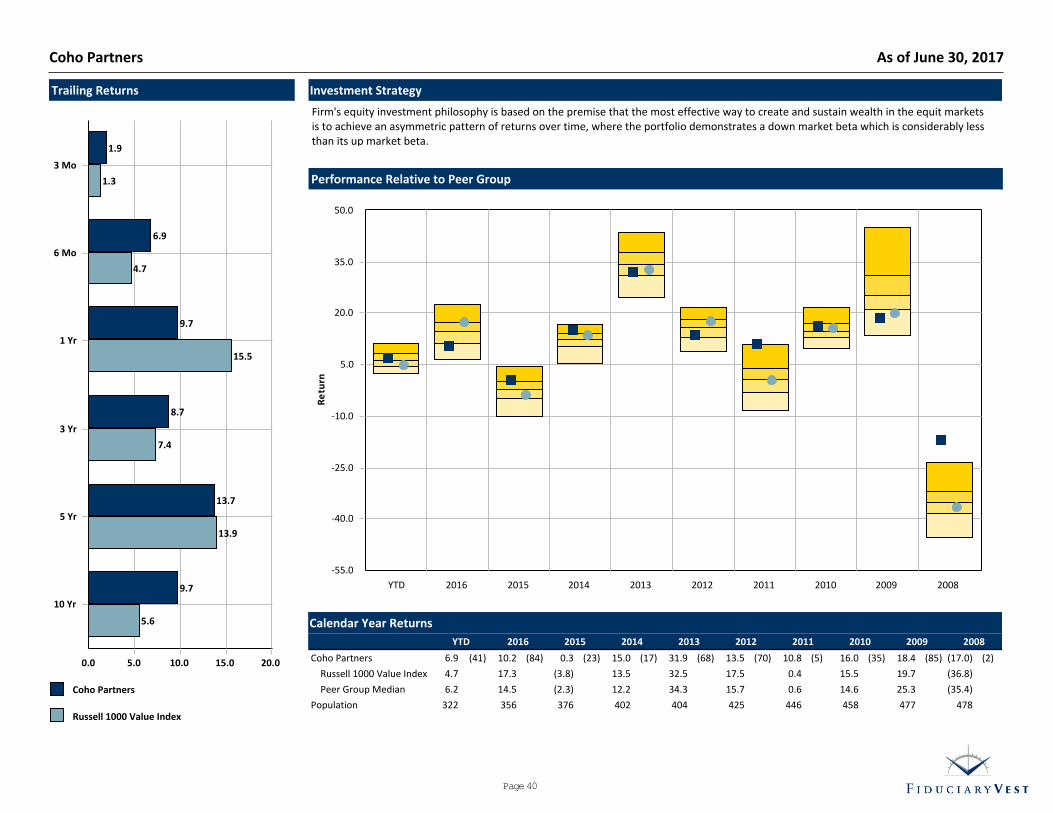
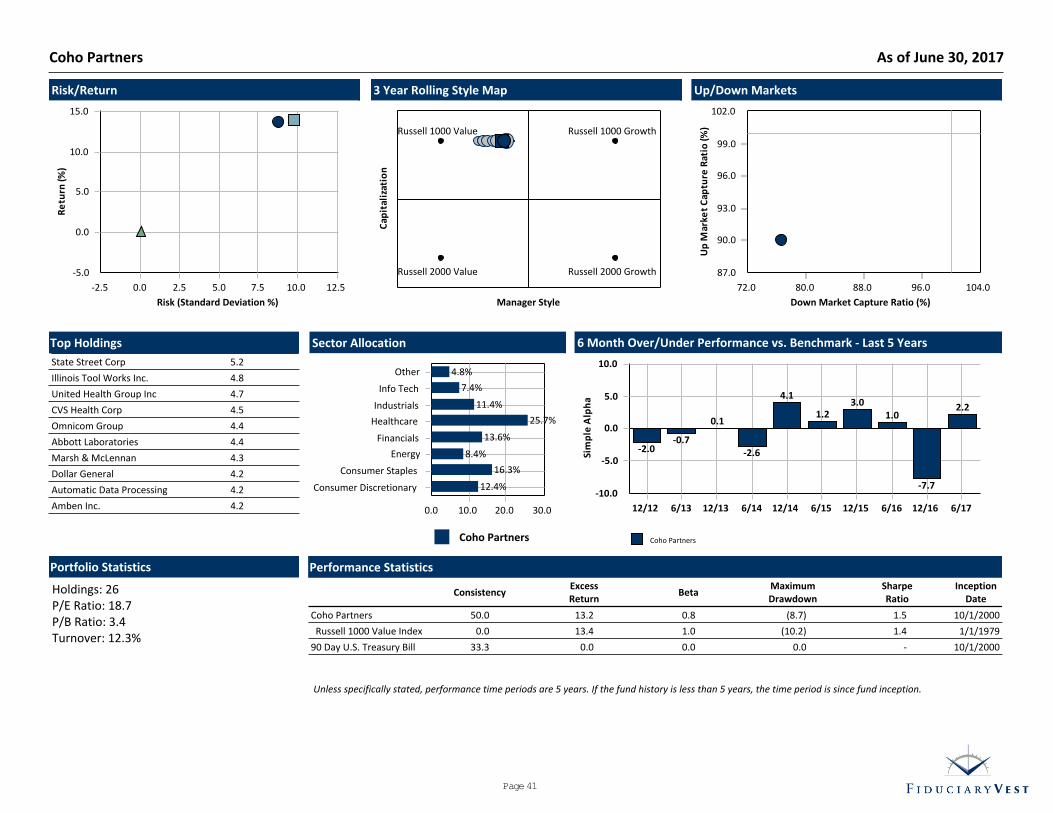
Investment Strategy
Firm's equity investment philosophy is based on the premise that the most effective way to create and sustain wealth in the equit marketsis to achieve an asymmetric pattern of returns over time, where the portfolio demonstrates a down market beta which is considerably lessthan its up market beta.
Trailing Returns
Coho Partners
Russell 1000 Value Index
0.0 5.0 10.0 15.0 20.0
10 Yr
5 Yr
3 Yr
1 Yr
6 Mo
3 Mo
9.7
13.7
8.7
9.7
6.9
1.9
5.6
13.9
7.4
15.5
4.7
1.3 Performance Relative to Peer Group
-55.0
-40.0
-25.0
-10.0
5.0
20.0
35.0
50.0
Re
turn
YTD 2016 2015 2014 2013 2012 2011 2010 2009 2008
Calendar Year Returns
YTD 2016 2015 2014 2013 2012 2011 2010 2009 2008
Coho Partners 6.9 (41) 10.2 (84) 0.3 (23) 15.0 (17) 31.9 (68) 13.5 (70) 10.8 (5) 16.0 (35) 18.4 (85) (17.0) (2)
Russell 1000 Value Index 4.7 17.3 (3.8) 13.5 32.5 17.5 0.4 15.5 19.7 (36.8)
Peer Group Median 6.2 14.5 (2.3) 12.2 34.3 15.7 0.6 14.6 25.3 (35.4)
Population 322 356 376 402 404 425 446 458 477 478
Coho Partners As of June 30, 2017
Page 40
Unless specifically stated, performance time periods are 5 years. If the fund history is less than 5 years, the time period is since fund inception.
3 Year Rolling Style Map
Cap
ital
izat
ion
Manager Style
Russell 1000 Growth
Russell 2000 GrowthRussell 2000 Value
Russell 1000 Value
Up/Down Markets
87.0
90.0
93.0
96.0
99.0
102.0
Up
Mar
ket
C
aptu
re R
atio
(%)
72.0 80.0 88.0 96.0 104.0
Down Market Capture Ratio (%)
Risk/Return
-5.0
0.0
5.0
10.0
15.0
Re
turn
(%)
-2.5 0.0 2.5 5.0 7.5 10.0 12.5
Risk (Standard Deviation %)
6 Month Over/Under Performance vs. Benchmark - Last 5 Years
Coho Partners
0.0
5.0
10.0
-5.0
-10.0
Sim
ple
Alp
ha
12/12 6/13 12/13 6/14 12/14 6/15 12/15 6/16 12/16 6/17
-2.0-0.7
0.1
-2.6
4.1
1.23.0
1.0
-7.7
2.2
Sector Allocation
Coho Partners
0.0 10.0 20.0 30.0
Consumer Discretionary
Consumer Staples
Energy
Financials
Healthcare
Industrials
Info Tech
Other
12.4%
16.3%
8.4%
13.6%
25.7%
11.4%
7.4%
4.8%
Top Holdings
State Street Corp 5.2
Illinois Tool Works Inc. 4.8
United Health Group Inc 4.7
CVS Health Corp 4.5
Omnicom Group 4.4
Abbott Laboratories 4.4
Marsh & McLennan 4.3
Dollar General 4.2
Automatic Data Processing 4.2
Amben Inc. 4.2
Portfolio Statistics
Holdings: 26P/E Ratio: 18.7P/B Ratio: 3.4Turnover: 12.3%
Performance Statistics
ConsistencyExcessReturn
BetaMaximumDrawdown
SharpeRatio
InceptionDate
Coho Partners 50.0 13.2 0.8 (8.7) 1.5 10/1/2000
Russell 1000 Value Index 0.0 13.4 1.0 (10.2) 1.4 1/1/1979
90 Day U.S. Treasury Bill 33.3 0.0 0.0 0.0 - 10/1/2000
Coho Partners As of June 30, 2017
Page 41
Investment Strategy
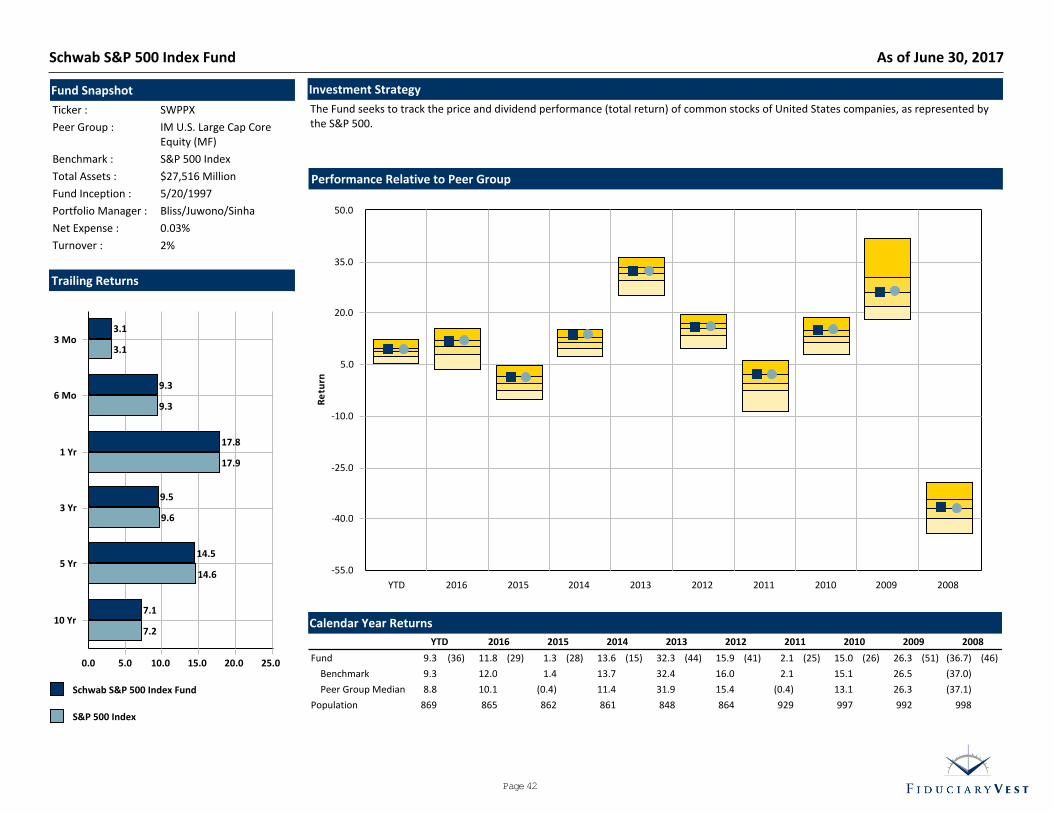
The Fund seeks to track the price and dividend performance (total return) of common stocks of United States companies, as represented bythe S&P 500.
Fund Snapshot
Ticker : SWPPX
Peer Group : IM U.S. Large Cap CoreEquity (MF)
Benchmark : S&P 500 Index
Total Assets : $27,516 Million
Fund Inception : 5/20/1997
Portfolio Manager : Bliss/Juwono/Sinha
Net Expense : 0.03%
Turnover : 2%
Performance Relative to Peer Group
-55.0
-40.0
-25.0
-10.0
5.0
20.0
35.0
50.0
Re
turn
YTD 2016 2015 2014 2013 2012 2011 2010 2009 2008
Trailing Returns
Schwab S&P 500 Index Fund
S&P 500 Index
0.0 5.0 10.0 15.0 20.0 25.0
10 Yr
5 Yr
3 Yr
1 Yr
6 Mo
3 Mo
7.1
14.5
9.5
17.8
9.3
3.1
7.2
14.6
9.6
17.9
9.3
3.1
Calendar Year Returns
YTD 2016 2015 2014 2013 2012 2011 2010 2009 2008
Fund 9.3 (36) 11.8 (29) 1.3 (28) 13.6 (15) 32.3 (44) 15.9 (41) 2.1 (25) 15.0 (26) 26.3 (51) (36.7) (46)
Benchmark 9.3 12.0 1.4 13.7 32.4 16.0 2.1 15.1 26.5 (37.0)
Peer Group Median 8.8 10.1 (0.4) 11.4 31.9 15.4 (0.4) 13.1 26.3 (37.1)
Population 869 865 862 861 848 864 929 997 992 998
Schwab S&P 500 Index Fund As of June 30, 2017
Page 42
Unless specifically stated, performance time periods are 5 years. If the fund history is less than 5 years, the time period is since fund inception.
3 Year Rolling Style Map
Cap
ital
izat
ion
Manager Style
Russell 1000 Growth
Russell 2000 GrowthRussell 2000 Value
Russell 1000 Value
Up/Down Markets
99.4
99.6
99.8
100.0
100.2
Up
Mar
ket
C
aptu
re R
atio
(%)
99.9 100.0 100.1
Down Market Capture Ratio (%)
Risk/Return
-5.0
0.0
5.0
10.0
15.0
20.0
Re
turn
(%)
-2.5 0.0 2.5 5.0 7.5 10.0 12.5
Risk (Standard Deviation %)
6 Month Over/Under Performance vs. Benchmark - Last 5 Years
Schwab S&P 500 Index Fund
-0.2
-0.1
0.0
Sim
ple
Alp
ha
12/12 6/13 12/13 6/14 12/14 6/15 12/15 6/16 12/16 6/17
-0.1
-0.1
0.0
-0.10.0 0.0 0.0
-0.1 -0.1
0.0
Sector Allocation
0.0% 15.0% 30.0%
Financials
Information Technology
Consumer Discretionary
Health Care
Industrials
Consumer Staples
Energy
Utilities
Telecommunication Services
Materials
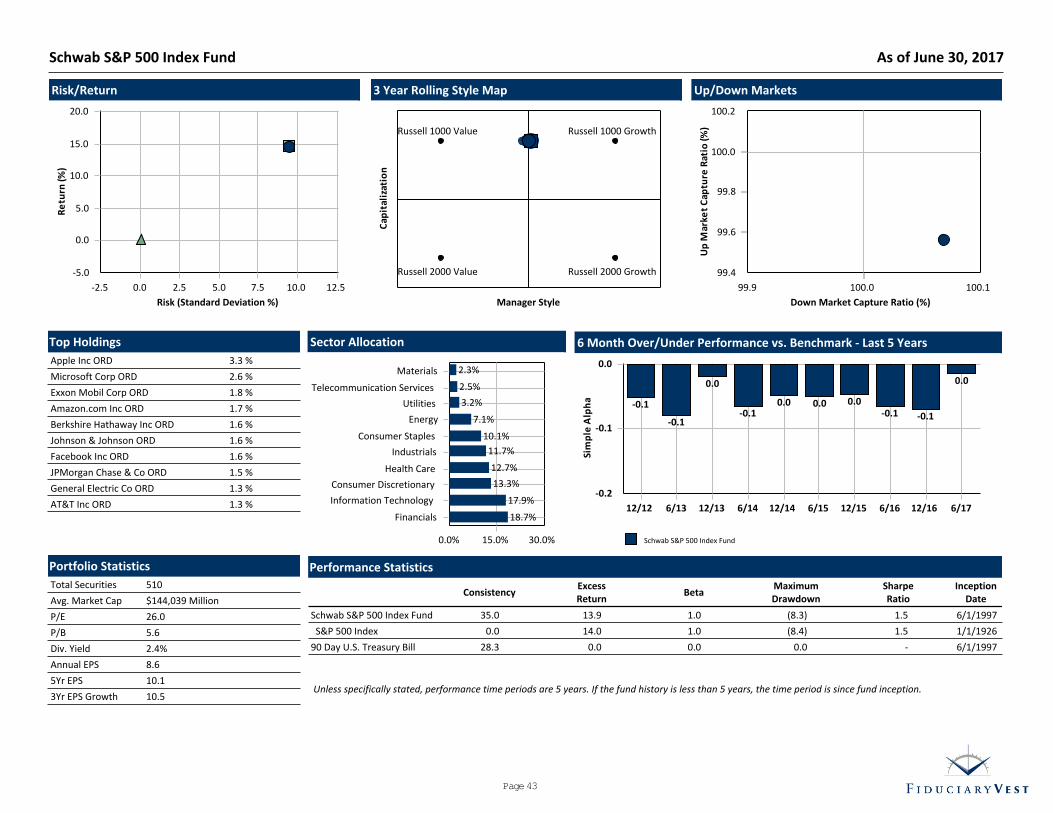
18.7%
17.9%
13.3%
12.7%
11.7%
10.1%
7.1%
3.2%
2.5%
2.3%
Top Holdings
Apple Inc ORD 3.3 %
Microsoft Corp ORD 2.6 %
Exxon Mobil Corp ORD 1.8 %
Amazon.com Inc ORD 1.7 %
Berkshire Hathaway Inc ORD 1.6 %
Johnson & Johnson ORD 1.6 %
Facebook Inc ORD 1.6 %
JPMorgan Chase & Co ORD 1.5 %
General Electric Co ORD 1.3 %
AT&T Inc ORD 1.3 %
Portfolio Statistics
Total Securities 510
Avg. Market Cap $144,039 Million
P/E 26.0
P/B 5.6
Div. Yield 2.4%
Annual EPS 8.6
5Yr EPS 10.1
3Yr EPS Growth 10.5
Performance Statistics
ConsistencyExcessReturn
BetaMaximumDrawdown
SharpeRatio
InceptionDate
Schwab S&P 500 Index Fund 35.0 13.9 1.0 (8.3) 1.5 6/1/1997
S&P 500 Index 0.0 14.0 1.0 (8.4) 1.5 1/1/1926
90 Day U.S. Treasury Bill 28.3 0.0 0.0 0.0 - 6/1/1997
Schwab S&P 500 Index Fund As of June 30, 2017
Page 43
Investment Strategy
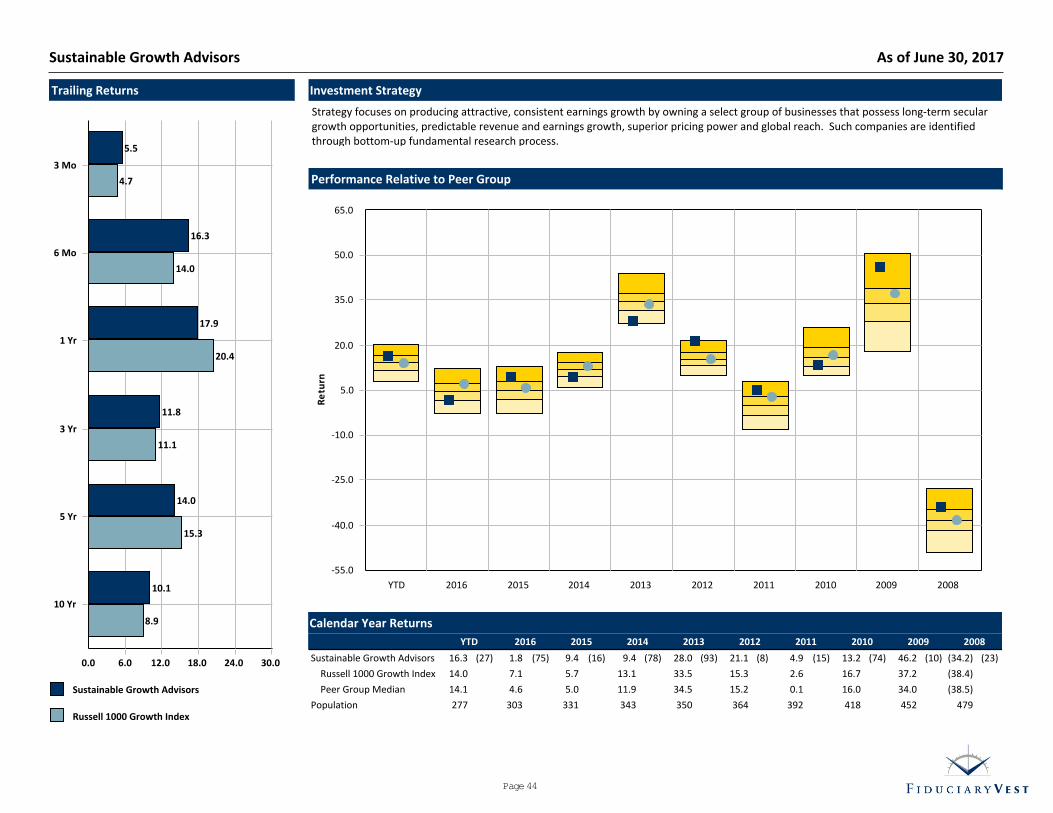
Strategy focuses on producing attractive, consistent earnings growth by owning a select group of businesses that possess long-term seculargrowth opportunities, predictable revenue and earnings growth, superior pricing power and global reach. Such companies are identifiedthrough bottom-up fundamental research process.
Trailing Returns
Sustainable Growth Advisors
Russell 1000 Growth Index
0.0 6.0 12.0 18.0 24.0 30.0
10 Yr
5 Yr
3 Yr
1 Yr
6 Mo
3 Mo
10.1
14.0
11.8
17.9
16.3
5.5
8.9
15.3
11.1
20.4
14.0
4.7 Performance Relative to Peer Group
-55.0
-40.0
-25.0
-10.0
5.0
20.0
35.0
50.0
65.0
Re
turn
YTD 2016 2015 2014 2013 2012 2011 2010 2009 2008
Calendar Year Returns
YTD 2016 2015 2014 2013 2012 2011 2010 2009 2008
Sustainable Growth Advisors 16.3 (27) 1.8 (75) 9.4 (16) 9.4 (78) 28.0 (93) 21.1 (8) 4.9 (15) 13.2 (74) 46.2 (10) (34.2) (23)
Russell 1000 Growth Index 14.0 7.1 5.7 13.1 33.5 15.3 2.6 16.7 37.2 (38.4)
Peer Group Median 14.1 4.6 5.0 11.9 34.5 15.2 0.1 16.0 34.0 (38.5)
Population 277 303 331 343 350 364 392 418 452 479
Sustainable Growth Advisors As of June 30, 2017
Page 44
Unless specifically stated, performance time periods are 5 years. If the fund history is less than 5 years, the time period is since fund inception.
3 Year Rolling Style Map
Cap
ital
izat
ion
Manager Style
Russell 1000 Growth
Russell 2000 GrowthRussell 2000 Value
Russell 1000 Value
Up/Down Markets
92.0
94.0
96.0
98.0
100.0
102.0
Up
Mar
ket
C
aptu
re R
atio
(%)
94.0 96.0 98.0 100.0 102.0
Down Market Capture Ratio (%)
Risk/Return
-5.0
0.0
5.0
10.0
15.0
20.0
Re
turn
(%)
-2.5 0.0 2.5 5.0 7.5 10.0 12.5
Risk (Standard Deviation %)
6 Month Over/Under Performance vs. Benchmark - Last 5 Years
Sustainable Growth Advisors
0.0
4.0
8.0
-4.0
-8.0
Sim
ple
Alp
ha
12/12 6/13 12/13 6/14 12/14 6/15 12/15 6/16 12/16 6/17
1.6
-3.9
-0.8
-4.7
1.4
-0.7
4.3
-0.9
-4.3
2.4
Sector Allocation
0.0 15.0 30.0 45.0
Consumer Discretionary
Consumer Staples
Energy
Financials
Healthcare
Industrials
Info Tech
Materials
Real Estate
Other
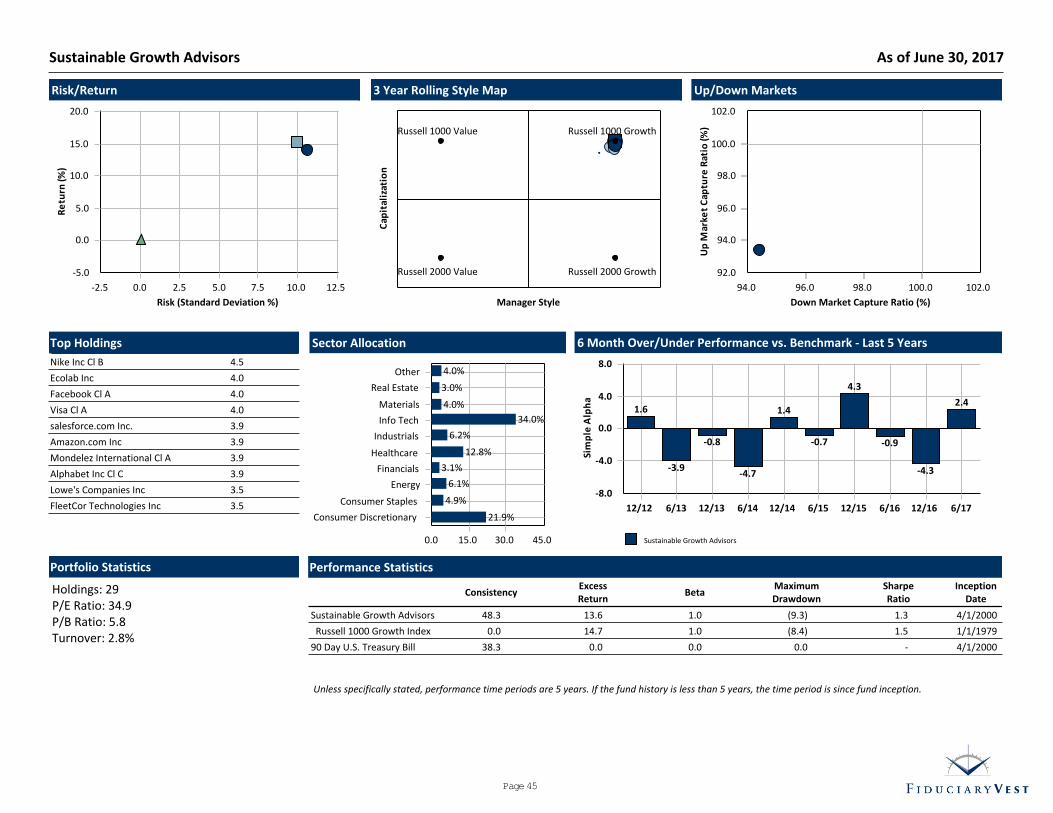
21.9%
4.9%
6.1%
3.1%
12.8%
6.2%
34.0%
4.0%
3.0%
4.0%
Top Holdings
Nike Inc Cl B 4.5
Ecolab Inc 4.0
Facebook Cl A 4.0
Visa Cl A 4.0
salesforce.com Inc. 3.9
Amazon.com Inc 3.9
Mondelez International Cl A 3.9
Alphabet Inc Cl C 3.9
Lowe's Companies Inc 3.5
FleetCor Technologies Inc 3.5
Portfolio Statistics
Holdings: 29P/E Ratio: 34.9P/B Ratio: 5.8Turnover: 2.8%
Performance Statistics
ConsistencyExcessReturn
BetaMaximumDrawdown
SharpeRatio
InceptionDate
Sustainable Growth Advisors 48.3 13.6 1.0 (9.3) 1.3 4/1/2000
Russell 1000 Growth Index 0.0 14.7 1.0 (8.4) 1.5 1/1/1979
90 Day U.S. Treasury Bill 38.3 0.0 0.0 0.0 - 4/1/2000
Sustainable Growth Advisors As of June 30, 2017
Page 45

Investment Strategy
Wedge Mid Cap Value concentrates on companies with market capitalizations between $1 billion and $20 billion. The fund's research-driven approach to value investing and portfolio construction defines their traditional equity platform.
Trailing Returns
Wedge Capital
Russell Midcap Value Index
0.0 6.0 12.0 18.0 24.0 30.0
10 Yr
5 Yr
3 Yr
1 Yr
6 Mo
3 Mo
9.3
16.2
9.8
21.6
9.8
3.6
7.2
15.1
7.5
15.9
5.2
1.4 Performance Relative to Peer Group
-55.0
-40.0
-25.0
-10.0
5.0
20.0
35.0
50.0
65.0
Re
turn
YTD 2016 2015 2014 2013 2012 2011 2010 2009 2008
Calendar Year Returns
YTD 2016 2015 2014 2013 2012 2011 2010 2009 2008
Wedge Capital 9.8 (9) 16.3 (70) (5.9) (74) 18.7 (2) 35.4 (54) 22.0 (10) (0.8) (48) 23.3 (43) 39.5 (30) (33.6) (29)
Russell Midcap Value Index 5.2 20.0 (4.8) 14.7 33.5 18.5 (1.4) 24.8 34.2 (38.4)
Peer Group Median 5.8 18.2 (3.2) 11.6 36.0 17.1 (0.9) 22.6 34.9 (36.6)
Population 74 79 85 85 88 92 95 94 99 114
Wedge Capital As of June 30, 2017
Page 46

Unless specifically stated, performance time periods are 5 years. If the fund history is less than 5 years, the time period is since fund inception.
3 Year Rolling Style Map
Cap
ital
izat
ion
Manager Style
Russell 1000 Growth
Russell 2000 GrowthRussell 2000 Value
Russell 1000 Value
Up/Down Markets
98.0
100.0
102.0
104.0
106.0
Up
Mar
ket
C
aptu
re R
atio
(%)
99.2 99.6 100.0 100.4
Down Market Capture Ratio (%)
Risk/Return
-5.0
0.0
5.0
10.0
15.0
20.0
Re
turn
(%)
-5.0 0.0 5.0 10.0 15.0
Risk (Standard Deviation %)
6 Month Over/Under Performance vs. Benchmark - Last 5 Years
Wedge Capital
0.0
4.0
8.0
12.0
-4.0
-8.0
Sim
ple
Alp
ha
12/12 6/13 12/13 6/14 12/14 6/15 12/15 6/16 12/16 6/17
-0.3
1.2 0.5
-3.3
6.9
-0.2 -0.9
-3.9
0.6
4.6
Sector Allocation
Wedge Capital
0.0 8.0 16.0 24.0 32.0
Cons. Discr.Cons. Staples
Energy
FinancialsHealth Care
IndustrialsIT
MaterialsOther
Utilities
20.0%
0.0%
10.0%27.0%
11.0%
3.5%10.0%10.0%
0.0%
8.5%
Top Holdings
Transdigm Group 4.0
EQT Corp 3.9
Universal Health ServicesInc
3.9
Zimmer Biomet Holdings Inc 3.7
Great Plains Energy Inc 3.4
Ally Financial Inc 3.3
Murphy Oil Corp 3.1
Wyndham Worldwide Corp 3.1
Pinnacle West Capital Corp 3.1
Fidelity Nat'l Financial Corp 2.9
Portfolio Statistics
Number of Holdings: 44P/E Ratio: 15.3P/B Ratio: 2.05Turnover: 30.0%
Performance Statistics
ConsistencyExcessReturn
BetaMaximumDrawdown
SharpeRatio
InceptionDate
Wedge Capital 56.7 15.6 1.0 (17.3) 1.4 1/1/2004
Russell Midcap Value Index 0.0 14.6 1.0 (12.7) 1.4 1/1/2004
90 Day U.S. Treasury Bill 30.0 0.0 0.0 0.0 - 1/1/2004
Wedge Capital As of June 30, 2017
Page 47
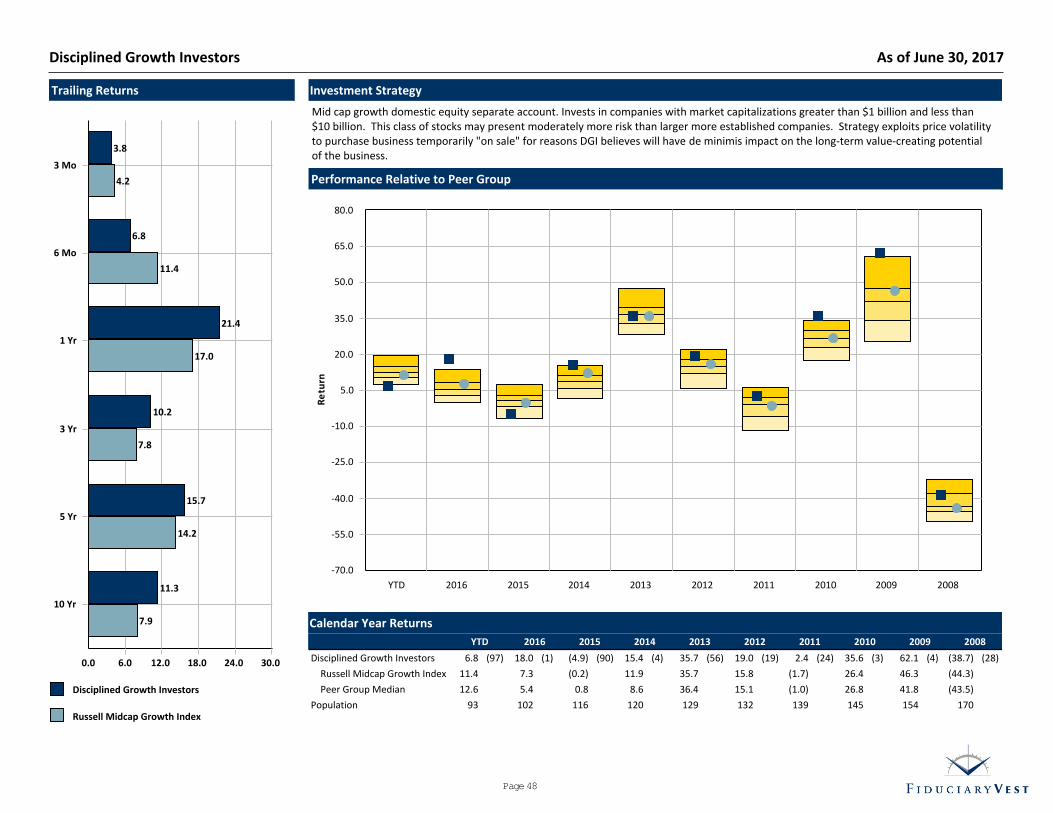
Investment Strategy
Mid cap growth domestic equity separate account. Invests in companies with market capitalizations greater than $1 billion and less than$10 billion. This class of stocks may present moderately more risk than larger more established companies. Strategy exploits price volatilityto purchase business temporarily "on sale" for reasons DGI believes will have de minimis impact on the long-term value-creating potentialof the business.
Trailing Returns
Disciplined Growth Investors
Russell Midcap Growth Index
0.0 6.0 12.0 18.0 24.0 30.0
10 Yr
5 Yr
3 Yr
1 Yr
6 Mo
3 Mo
11.3
15.7
10.2
21.4
6.8
3.8
7.9
14.2
7.8
17.0
11.4
4.2 Performance Relative to Peer Group
-70.0
-55.0
-40.0
-25.0
-10.0
5.0
20.0
35.0
50.0
65.0
80.0
Re
turn
YTD 2016 2015 2014 2013 2012 2011 2010 2009 2008
Calendar Year Returns
YTD 2016 2015 2014 2013 2012 2011 2010 2009 2008
Disciplined Growth Investors 6.8 (97) 18.0 (1) (4.9) (90) 15.4 (4) 35.7 (56) 19.0 (19) 2.4 (24) 35.6 (3) 62.1 (4) (38.7) (28)
Russell Midcap Growth Index 11.4 7.3 (0.2) 11.9 35.7 15.8 (1.7) 26.4 46.3 (44.3)
Peer Group Median 12.6 5.4 0.8 8.6 36.4 15.1 (1.0) 26.8 41.8 (43.5)
Population 93 102 116 120 129 132 139 145 154 170
Disciplined Growth Investors As of June 30, 2017
Page 48
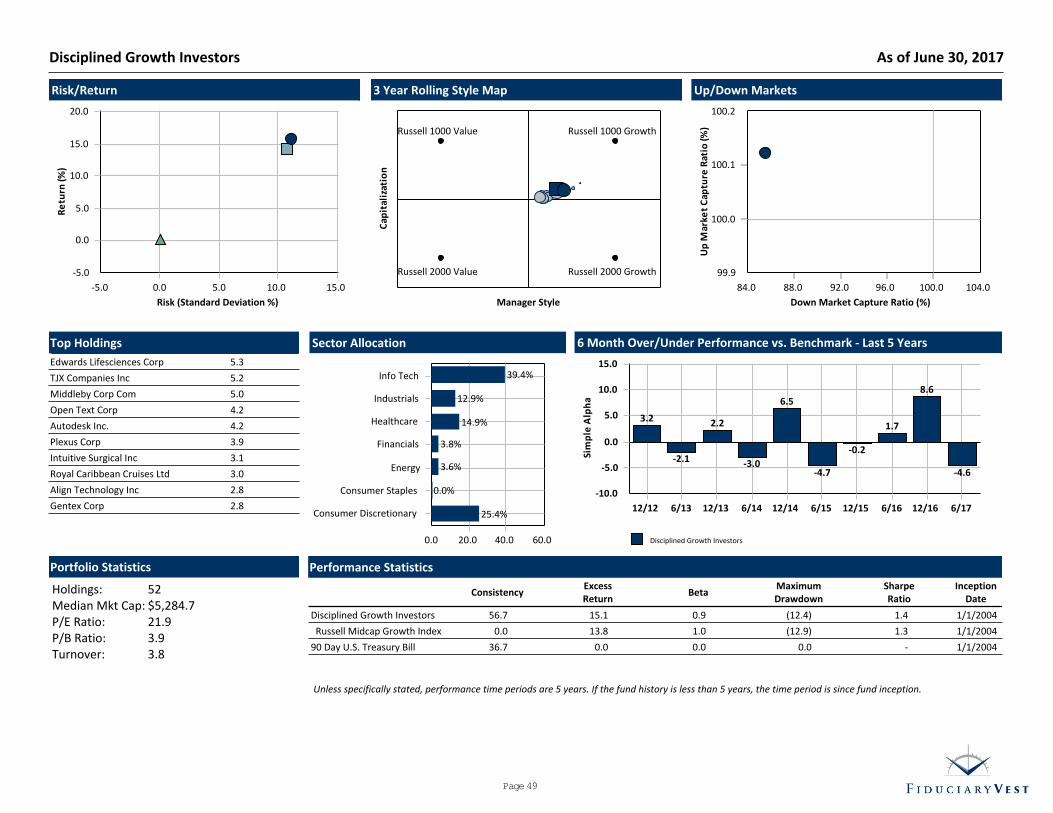
Unless specifically stated, performance time periods are 5 years. If the fund history is less than 5 years, the time period is since fund inception.
3 Year Rolling Style Map
Cap
ital
izat
ion
Manager Style
Russell 1000 Growth
Russell 2000 GrowthRussell 2000 Value
Russell 1000 Value
Up/Down Markets
99.9
100.0
100.1
100.2
Up
Mar
ket
C
aptu
re R
atio
(%)
84.0 88.0 92.0 96.0 100.0 104.0
Down Market Capture Ratio (%)
Risk/Return
-5.0
0.0
5.0
10.0
15.0
20.0
Re
turn
(%)
-5.0 0.0 5.0 10.0 15.0
Risk (Standard Deviation %)
6 Month Over/Under Performance vs. Benchmark - Last 5 Years
Disciplined Growth Investors
0.0
5.0
10.0
15.0
-5.0
-10.0
Sim
ple
Alp
ha
12/12 6/13 12/13 6/14 12/14 6/15 12/15 6/16 12/16 6/17
3.2
-2.1
2.2
-3.0
6.5
-4.7
-0.2
1.7
8.6
-4.6
Sector Allocation
0.0 20.0 40.0 60.0
Consumer Discretionary
Consumer Staples
Energy
Financials
Healthcare
Industrials
Info Tech
25.4%
0.0%
3.6%
3.8%
14.9%
12.9%
39.4%
Top Holdings
Edwards Lifesciences Corp 5.3
TJX Companies Inc 5.2
Middleby Corp Com 5.0
Open Text Corp 4.2
Autodesk Inc. 4.2
Plexus Corp 3.9
Intuitive Surgical Inc 3.1
Royal Caribbean Cruises Ltd 3.0
Align Technology Inc 2.8
Gentex Corp 2.8
Portfolio Statistics
Holdings: 52Median Mkt Cap: $5,284.7P/E Ratio: 21.9P/B Ratio: 3.9Turnover: 3.8
Performance Statistics
ConsistencyExcessReturn
BetaMaximumDrawdown
SharpeRatio
InceptionDate
Disciplined Growth Investors 56.7 15.1 0.9 (12.4) 1.4 1/1/2004
Russell Midcap Growth Index 0.0 13.8 1.0 (12.9) 1.3 1/1/2004
90 Day U.S. Treasury Bill 36.7 0.0 0.0 0.0 - 1/1/2004
Disciplined Growth Investors As of June 30, 2017
Page 49
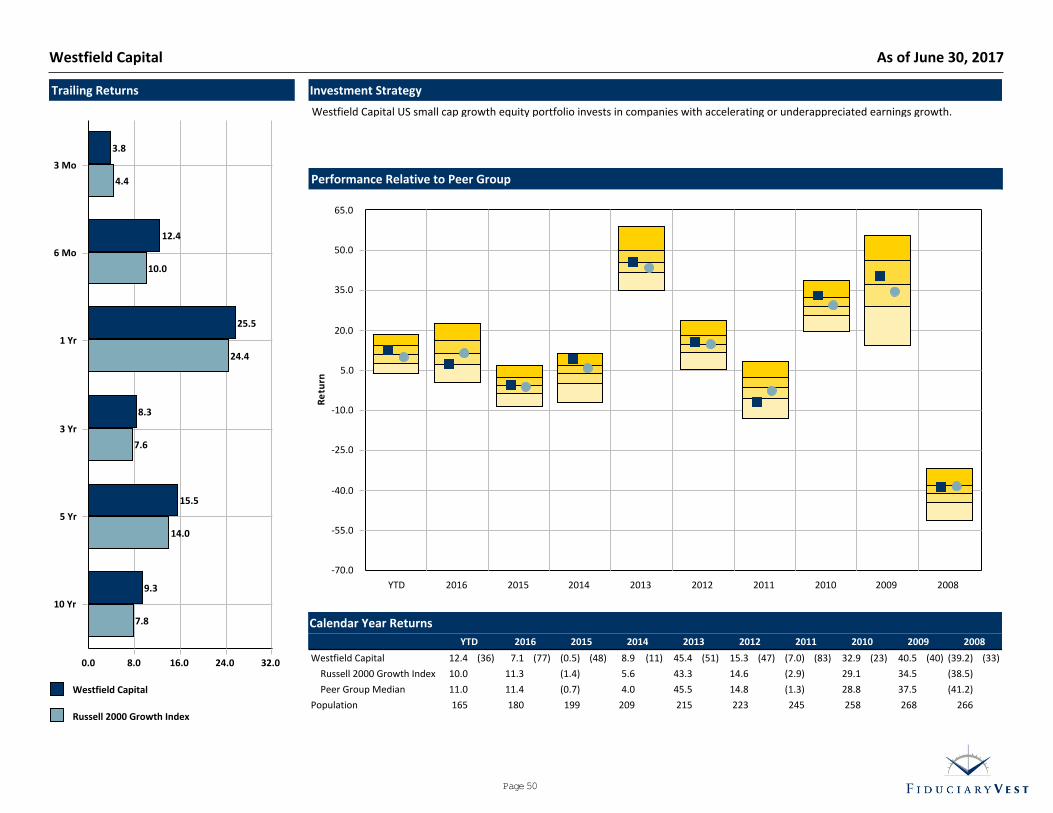
Investment Strategy
Westfield Capital US small cap growth equity portfolio invests in companies with accelerating or underappreciated earnings growth.
Trailing Returns
Westfield Capital
Russell 2000 Growth Index
0.0 8.0 16.0 24.0 32.0
10 Yr
5 Yr
3 Yr
1 Yr
6 Mo
3 Mo
9.3
15.5
8.3
25.5
12.4
3.8
7.8
14.0
7.6
24.4
10.0
4.4 Performance Relative to Peer Group
-70.0
-55.0
-40.0
-25.0
-10.0
5.0
20.0
35.0
50.0
65.0
Re
turn
YTD 2016 2015 2014 2013 2012 2011 2010 2009 2008
Calendar Year Returns
YTD 2016 2015 2014 2013 2012 2011 2010 2009 2008
Westfield Capital 12.4 (36) 7.1 (77) (0.5) (48) 8.9 (11) 45.4 (51) 15.3 (47) (7.0) (83) 32.9 (23) 40.5 (40) (39.2) (33)
Russell 2000 Growth Index 10.0 11.3 (1.4) 5.6 43.3 14.6 (2.9) 29.1 34.5 (38.5)
Peer Group Median 11.0 11.4 (0.7) 4.0 45.5 14.8 (1.3) 28.8 37.5 (41.2)
Population 165 180 199 209 215 223 245 258 268 266
Westfield Capital As of June 30, 2017
Page 50
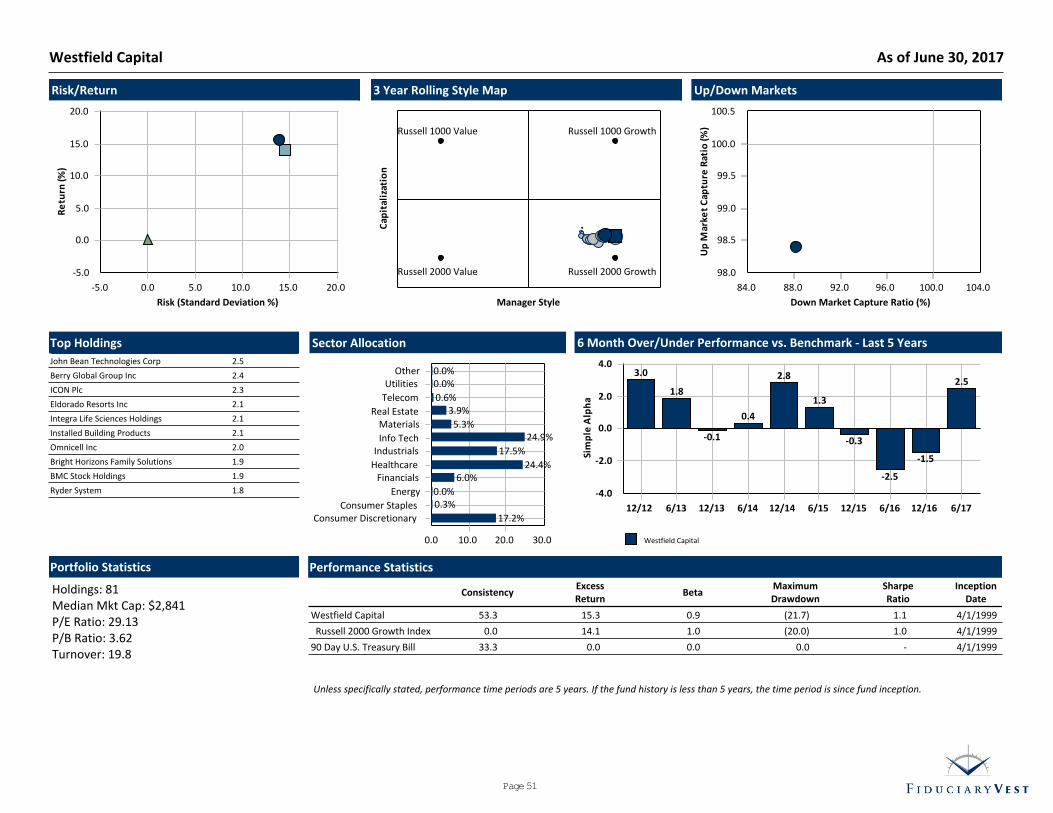
Unless specifically stated, performance time periods are 5 years. If the fund history is less than 5 years, the time period is since fund inception.
3 Year Rolling Style Map
Cap
ital
izat
ion
Manager Style
Russell 1000 Growth
Russell 2000 GrowthRussell 2000 Value
Russell 1000 Value
Up/Down Markets
98.0
98.5
99.0
99.5
100.0
100.5
Up
Mar
ket
C
aptu
re R
atio
(%)
84.0 88.0 92.0 96.0 100.0 104.0
Down Market Capture Ratio (%)
Risk/Return
-5.0
0.0
5.0
10.0
15.0
20.0
Re
turn
(%)
-5.0 0.0 5.0 10.0 15.0 20.0
Risk (Standard Deviation %)
6 Month Over/Under Performance vs. Benchmark - Last 5 Years
Westfield Capital
0.0
2.0
4.0
-2.0
-4.0
Sim
ple
Alp
ha
12/12 6/13 12/13 6/14 12/14 6/15 12/15 6/16 12/16 6/17
3.0
1.8
-0.1
0.4
2.8
1.3
-0.3
-2.5
-1.5
2.5
Sector Allocation
0.0 10.0 20.0 30.0
Consumer DiscretionaryConsumer Staples
Energy
FinancialsHealthcare
IndustrialsInfo Tech
MaterialsReal Estate
Telecom
UtilitiesOther
17.2%
0.3%0.0%
6.0%24.4%
17.5%
24.9%5.3%
3.9%0.6%
0.0%0.0%
Top Holdings
John Bean Technologies Corp 2.5
Berry Global Group Inc 2.4
ICON Plc 2.3
Eldorado Resorts Inc 2.1
Integra Life Sciences Holdings 2.1
Installed Building Products 2.1
Omnicell Inc 2.0
Bright Horizons Family Solutions 1.9
BMC Stock Holdings 1.9
Ryder System 1.8
Portfolio Statistics
Holdings: 81Median Mkt Cap: $2,841P/E Ratio: 29.13P/B Ratio: 3.62Turnover: 19.8
Performance Statistics
ConsistencyExcessReturn
BetaMaximumDrawdown
SharpeRatio
InceptionDate
Westfield Capital 53.3 15.3 0.9 (21.7) 1.1 4/1/1999
Russell 2000 Growth Index 0.0 14.1 1.0 (20.0) 1.0 4/1/1999
90 Day U.S. Treasury Bill 33.3 0.0 0.0 0.0 - 4/1/1999
Westfield Capital As of June 30, 2017
Page 51

Investment Strategy
The Fund seeks to track the performance of the MSCI All Country World ex USA Investable Market Index. This Underlying Index is designed tomeasure the investment return of stocks issued by companies located in developed and emerging markets, excluding the U.S.
Fund Snapshot
Ticker : SGOIX
Peer Group : IM International Large CapCore Equity (MF)
Benchmark : MSCI EAFE (Net) Index
Total Assets : $13,261 Million
Fund Inception : 7/31/1998
Portfolio Manager : McLennan/Brooker,Jr.
Net Expense : 0.87%
Turnover : 9%
Performance Relative to Peer Group
-55.0
-40.0
-25.0
-10.0
5.0
20.0
35.0
50.0
Re
turn
YTD 2016 2015 2014 2013 2012 2011 2010 2009 2008
Trailing Returns
First Eagle Overseas I
MSCI EAFE (Net) Index
0.0 6.0 12.0 18.0 24.0 30.0
10 Yr
5 Yr
3 Yr
1 Yr
6 Mo
3 Mo
5.1
7.7
3.2
9.4
9.4
2.8
1.0
8.7
1.1
20.3
13.8
6.1
Calendar Year Returns
YTD 2016 2015 2014 2013 2012 2011 2010 2009 2008
Fund 9.4 (97) 5.9 (9) 2.6 (2) (0.7) (12) 11.9 (82) 14.3 (80) (5.4) (6) 19.5 (1) 20.9 (95) (20.8) (1)
Benchmark 13.8 1.0 (0.8) (4.9) 22.8 17.3 (12.1) 7.8 31.8 (43.4)
Peer Group Median 14.2 1.7 (2.3) (5.9) 20.0 17.7 (13.3) 7.3 29.9 (42.6)
Population 119 109 97 97 113 105 126 133 143 141
First Eagle Overseas I As of June 30, 2017
Page 52
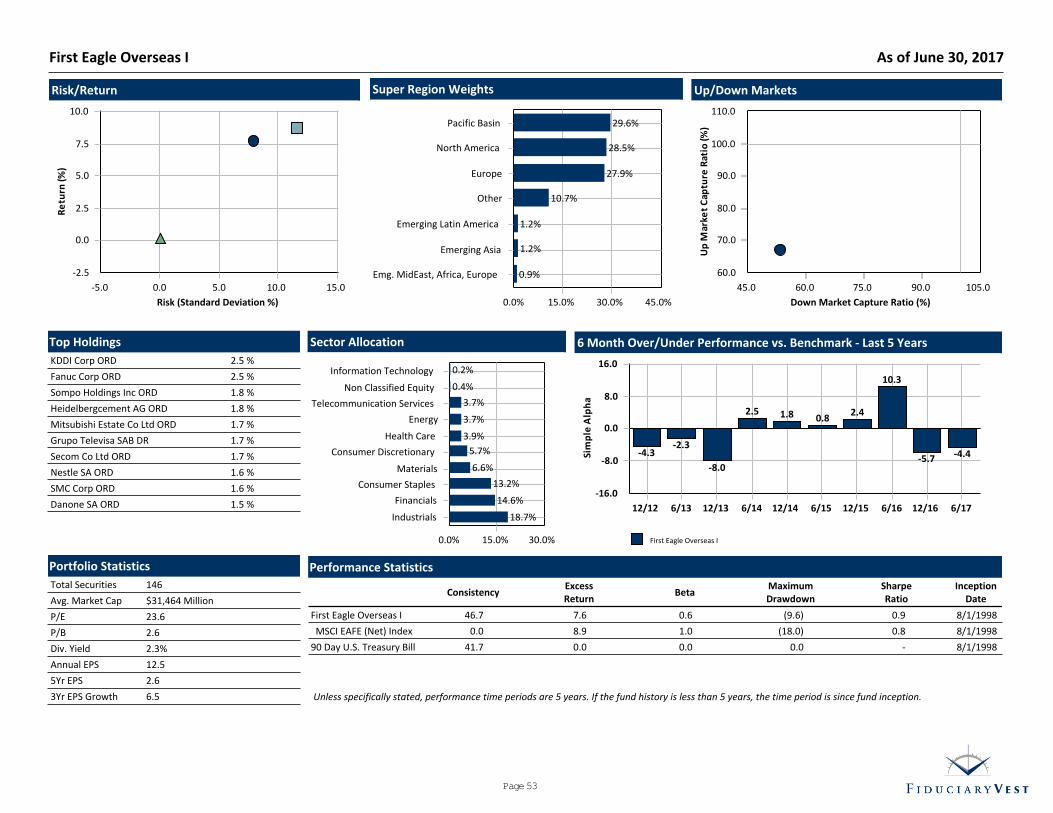
Unless specifically stated, performance time periods are 5 years. If the fund history is less than 5 years, the time period is since fund inception.
Up/Down Markets
60.0
70.0
80.0
90.0
100.0
110.0
Up
Mar
ket
C
aptu
re R
atio
(%)
45.0 60.0 75.0 90.0 105.0
Down Market Capture Ratio (%)
Risk/Return
-2.5
0.0
2.5
5.0
7.5
10.0
Re
turn
(%)
-5.0 0.0 5.0 10.0 15.0
Risk (Standard Deviation %)
Super Region Weights
0.0% 15.0% 30.0% 45.0%
Emg. MidEast, Africa, Europe
Emerging Asia
Emerging Latin America
Other
Europe
North America
Pacific Basin
0.9%
1.2%
1.2%
10.7%
27.9%
28.5%
29.6%
6 Month Over/Under Performance vs. Benchmark - Last 5 Years
First Eagle Overseas I
0.0
8.0
16.0
-8.0
-16.0
Sim
ple
Alp
ha
12/12 6/13 12/13 6/14 12/14 6/15 12/15 6/16 12/16 6/17
-4.3-2.3
-8.0
2.5 1.8 0.82.4
10.3
-5.7 -4.4
Sector Allocation
0.0% 15.0% 30.0%
Industrials
Financials
Consumer Staples
Materials
Consumer Discretionary
Health Care
Energy
Telecommunication Services
Non Classified Equity
Information Technology
18.7%
14.6%
13.2%
6.6%
5.7%
3.9%
3.7%
3.7%
0.4%
0.2%
Top Holdings
KDDI Corp ORD 2.5 %
Fanuc Corp ORD 2.5 %
Sompo Holdings Inc ORD 1.8 %
Heidelbergcement AG ORD 1.8 %
Mitsubishi Estate Co Ltd ORD 1.7 %
Grupo Televisa SAB DR 1.7 %
Secom Co Ltd ORD 1.7 %
Nestle SA ORD 1.6 %
SMC Corp ORD 1.6 %
Danone SA ORD 1.5 %
Portfolio Statistics
Total Securities 146
Avg. Market Cap $31,464 Million
P/E 23.6
P/B 2.6
Div. Yield 2.3%
Annual EPS 12.5
5Yr EPS 2.6
3Yr EPS Growth 6.5
Performance Statistics
ConsistencyExcessReturn
BetaMaximumDrawdown
SharpeRatio
InceptionDate
First Eagle Overseas I 46.7 7.6 0.6 (9.6) 0.9 8/1/1998
MSCI EAFE (Net) Index 0.0 8.9 1.0 (18.0) 0.8 8/1/1998
90 Day U.S. Treasury Bill 41.7 0.0 0.0 0.0 - 8/1/1998
First Eagle Overseas I As of June 30, 2017
Page 53
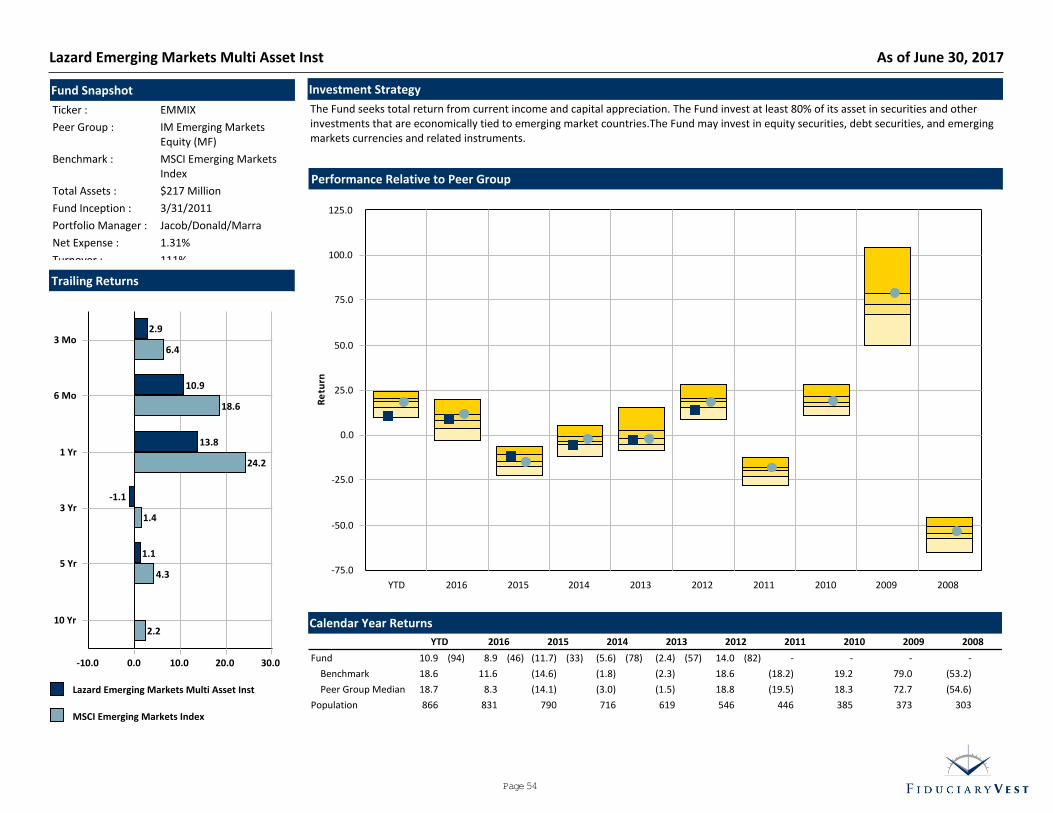
Investment Strategy
The Fund seeks total return from current income and capital appreciation. The Fund invest at least 80% of its asset in securities and otherinvestments that are economically tied to emerging market countries.The Fund may invest in equity securities, debt securities, and emergingmarkets currencies and related instruments.
Fund Snapshot
Ticker : EMMIX
Peer Group : IM Emerging MarketsEquity (MF)
Benchmark : MSCI Emerging MarketsIndex
Total Assets : $217 Million
Fund Inception : 3/31/2011
Portfolio Manager : Jacob/Donald/Marra
Net Expense : 1.31%
Turnover : 111%
Performance Relative to Peer Group
-75.0
-50.0
-25.0
0.0
25.0
50.0
75.0
100.0
125.0
Re
turn
YTD 2016 2015 2014 2013 2012 2011 2010 2009 2008
Trailing Returns
Lazard Emerging Markets Multi Asset Inst
MSCI Emerging Markets Index
0.0 10.0 20.0 30.0-10.0
10 Yr
5 Yr
3 Yr
1 Yr
6 Mo
3 Mo
1.1
-1.1
13.8
10.9
2.9
2.2
4.3
1.4
24.2
18.6
6.4
Calendar Year Returns
YTD 2016 2015 2014 2013 2012 2011 2010 2009 2008
Fund 10.9 (94) 8.9 (46) (11.7) (33) (5.6) (78) (2.4) (57) 14.0 (82) - - - -
Benchmark 18.6 11.6 (14.6) (1.8) (2.3) 18.6 (18.2) 19.2 79.0 (53.2)
Peer Group Median 18.7 8.3 (14.1) (3.0) (1.5) 18.8 (19.5) 18.3 72.7 (54.6)
Population 866 831 790 716 619 546 446 385 373 303
Lazard Emerging Markets Multi Asset Inst As of June 30, 2017
Page 54

Unless specifically stated, performance time periods are 5 years. If the fund history is less than 5 years, the time period is since fund inception.
Up/Down Markets
60.0
70.0
80.0
90.0
100.0
110.0
Up
Mar
ket
C
aptu
re R
atio
(%)
72.0 78.0 84.0 90.0 96.0 102.0
Down Market Capture Ratio (%)
Risk/Return
-1.5
0.0
1.5
3.0
4.5
6.0
Re
turn
(%)
-5.0 0.0 5.0 10.0 15.0 20.0
Risk (Standard Deviation %)
Super Region Weights
0.0% 15.0% 30.0%
Pacific Basin
Europe
Other
Emerging Latin America
Emg. MidEast, Africa, Europe
North America
Emerging Asia
2.8%
5.1%
12.9%
13.9%
15.2%
24.4%
26.4%
6 Month Over/Under Performance vs. Benchmark - Last 5 Years
Lazard Emerging Markets Multi Asset Inst
0.0
5.0
10.0
-5.0
-10.0
Sim
ple
Alp
ha
12/12 6/13 12/13 6/14 12/14 6/15 12/15 6/16 12/16 6/17
-6.2
2.5
-3.0 -2.3 -1.5-3.3
5.7
-0.5-2.1
-7.7
Sector Allocation
0.0% 10.0% 20.0%
Financials
Information Technology
Consumer Staples
Industrials
Energy
Consumer Discretionary
Materials
Telecommunication Services
Health Care
Utilities
15.9%
10.4%
8.0%
5.7%
4.5%
4.2%
2.9%
2.8%
1.4%
0.3%
Top Holdings
State Street Institutional Treas 14.4 %
Samsung Electronics Co Ltd ORD 2.2 %
Taiwan Semiconductor Manufacturing 1.5 %
Baidu Inc DR 1.4 %
NetEase Inc DR 1.2 %
China Construction Bank Corp ORD 1.1 %
Sberbank Rossii PAO DR 1.1 %
Axis Bank Ltd ORD 1.1 %
Banco do Brasil SA ORD 1.0 %
Tencent Holdings Ltd ORD 1.0 %
Portfolio Statistics
Total Securities 322
Avg. Market Cap $55,036 Million
P/E 20.9
P/B 3.6
Div. Yield 2.5%
Annual EPS 19.1
5Yr EPS 13.0
3Yr EPS Growth 15.3
Performance Statistics
ConsistencyExcessReturn
BetaMaximumDrawdown
SharpeRatio
InceptionDate
Lazard Emerging Markets Multi Asset Inst 41.7 1.6 0.7 (25.1) 0.1 4/1/2011
MSCI Emerging Markets Index 0.0 5.1 1.0 (29.4) 0.4 4/1/2011
90 Day U.S. Treasury Bill 41.7 0.0 0.0 0.0 - 4/1/2011
Lazard Emerging Markets Multi Asset Inst As of June 30, 2017
Page 55
Appendix
Page 56

Policy Benchmark Weight (%)
Dec-2016Bloomberg Barclays U.S. Aggregate Index 15.0
Bloomberg Commodity Index Total Return 4.0
Dow Jones Credit Suisse Long/Short Equity 8.0
Dow Jones Credit Suisse Multi-Strategy 8.0
FTSE NAREIT All Equity REITs 3.0
MSCI EAFE (Net) Index 5.0
MSCI Emerging Markets Index 2.0
Russell 2000 Index 10.0
Russell Midcap Index 10.0
S&P 500 Index 10.0
S&P/LSTA Leveraged Loan Index 5.0
Barclay Global Macro Index 5.0
BofA Merrill Lynch High Yield Master II 5.0
HFN Distressed Index 3.0
NCREIF Property Index 4.0
NCREIF Timberland Index 3.0
Debt Securities Benchmark Weight (%)
Dec-2016
Bloomberg Barclays U.S. Aggregate Index 60.0
BofA Merrill Lynch High Yield Master II 20.0
S&P/LSTA Leveraged Loan Index 20.0
Domestic Equities Benchmark Weight (%)
Apr-2016FTSE NAREIT All Equity REITs 10.0
Russell 2000 Index 30.0
Russell Midcap Index 30.0
S&P 500 Index 30.0
International Equities Benchmark Weight (%)
Apr-2016MSCI EAFE (Net) Index 71.0
MSCI Emerging Markets Index 29.0
Alternatives Benchmark Weight (%)
Apr-2016Bloomberg Commodity Index Total Return 11.0
Dow Jones Credit Suisse Long/Short Equity 23.0
Dow Jones Credit Suisse Multi-Strategy 23.0
Barclay Global Macro Index 14.0
HFN Distressed Index 9.0
NCREIF Property Index 11.0
NCREIF Timberland Index 9.0
Singing River Health System As of 6/30/2017
Page 57
Disclosures
CLIENT REPORTS VERSUS CUSTODY STATEMENTSAny client report provided by FiduciaryVest LLC is not intended to replace your brokerage / custody / partnership statement(s), which should be considered your official record for all pertinent account information. It is important to receive and review such statements. Please notify your custodian(s) promptly if you do not receive statements (at least on a quarterly basis). The statistical analysis in your client report was prepared by FiduciaryVest, LLC from data provided by: (a) third-party investment institutions performing under service agreements made directly with FiduciaryVest’s clients and/or (b) other custodians who report such data to said client-contracted custodians and/or (c) one or more investment database provider-organizations, under service agreements between FiduciaryVest and those providers. FiduciaryVest does not audit, or independently verify the accuracy of such third party-provided data; in addition to statistics, “data” may include, but is not limited to the reported existence of, valuation of, and accounting for client-owned investment assets. Accordingly, although FiduciaryVest endeavors to deal exclusively with competent, reputable third-party data providers and takes reasonable care to prepare accurate statistical reports to its clients, FiduciaryVest disclaims responsibility for any errors, inaccuracies, or derived damages caused by incomplete or inaccurate data, or other information received from such sources.
COMMENTARYCommentary was prepared for clients and prospective clients of FiduciaryVest LLC. It may not be suitable for others, and may not be disseminated without written permission. FiduciaryVest does not make any representation or warranties as to the accuracy or merit of the discussion, analysis, or opinions contained in commentaries as a basis for investment decision making. Any comments or general market related observations are based on information available at the time of writing, are for informational purposes only, are not intended as individual or specific advice, may not represent the opinions of the entire firm and should not be relied upon as a basis for making investment decisions. All information contained herein is believed to be correct, though complete accuracy cannot be guaranteed. This information is subject to change without notice as market conditions change, will not be updated for subsequent events or changes in facts or opinion, and is not intended to predict the performance of any manager, individual security, market sector, or portfolio. This information may coincide or may conflict with activities of any client’s underlying portfolio managers or with actions taken by individual clients or clients collectively of FiduciaryVest for a variety of reasons, including but not limited to differences between and among their investment objectives. Investors are advised to consult with their investment professional about their specific financial needs and goals before making any investment decisions.
HOLDINGSThe information provided in this report should not be considered a recommendation to purchase or sell any particular security, pursue any particular investment approach or strategy, or engage a particular investment manager and is intended for informational purposes only.
INDEXES/BENCHMARKSFiduciaryVest uses commercially available, subscription databases, in order to obtain data on market indexes and to research and evaluate mutual funds, investment management firms and their products. FiduciaryVest takes reasonable care to utilize industry appropriate market benchmarks for the asset class shown.
INVESTMENT PERFORMANCEPast performance is not necessarily indicative of future results. The performance information reported herein may be for a variety of products which have different methods of presenting performance data. Generally, mutual fund returns are reported net of operating expenses; separate account manager and total portfolio returns are reported gross of fees. The fee and expense information for a specific holding is contained in the product prospectus or offering materials. The cumulative effect of fees and expenses may substantially reduce the return earned relative to that indicated herein. Please visit the Employee Benefit Security Administration (EBSA) website for an example demonstrating the long-term effect of fees and expenses.
INVESTMENT RISKFiduciaryVest does not represent, warrant, or imply that the services or methods of analysis employed can or will predict future results, successfully identify market tops or bottoms, or insulate client portfolios from losses due to market corrections or declines. Investment risks involve but are not limited to the following: systematic risk, interest rate risk, inflation risk, currency risk, liquidity risk, sociopolitical risk, management risk, and credit risk. In addition to general risks associated with investing, certain products also pose additional risks. This and other important information is contained in the product prospectus or offering materials.
Page 58
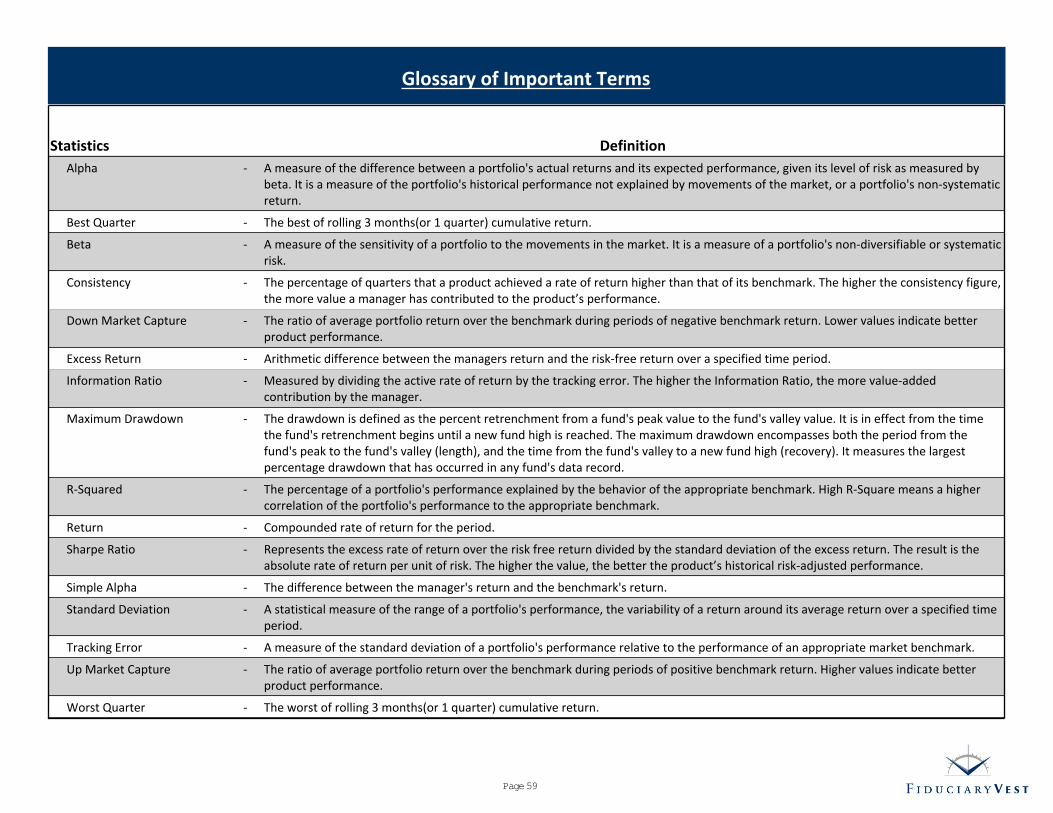
Statistics Definition
Alpha - A measure of the difference between a portfolio's actual returns and its expected performance, given its level of risk as measured bybeta. It is a measure of the portfolio's historical performance not explained by movements of the market, or a portfolio's non-systematicreturn.
Best Quarter - The best of rolling 3 months(or 1 quarter) cumulative return.
Beta - A measure of the sensitivity of a portfolio to the movements in the market. It is a measure of a portfolio's non-diversifiable or systematicrisk.
Consistency - The percentage of quarters that a product achieved a rate of return higher than that of its benchmark. The higher the consistency figure,the more value a manager has contributed to the product’s performance.
Down Market Capture - The ratio of average portfolio return over the benchmark during periods of negative benchmark return. Lower values indicate betterproduct performance.
Excess Return - Arithmetic difference between the managers return and the risk-free return over a specified time period.
Information Ratio - Measured by dividing the active rate of return by the tracking error. The higher the Information Ratio, the more value-addedcontribution by the manager.
Maximum Drawdown - The drawdown is defined as the percent retrenchment from a fund's peak value to the fund's valley value. It is in effect from the timethe fund's retrenchment begins until a new fund high is reached. The maximum drawdown encompasses both the period from thefund's peak to the fund's valley (length), and the time from the fund's valley to a new fund high (recovery). It measures the largestpercentage drawdown that has occurred in any fund's data record.
R-Squared - The percentage of a portfolio's performance explained by the behavior of the appropriate benchmark. High R-Square means a highercorrelation of the portfolio's performance to the appropriate benchmark.
Return - Compounded rate of return for the period.
Sharpe Ratio - Represents the excess rate of return over the risk free return divided by the standard deviation of the excess return. The result is theabsolute rate of return per unit of risk. The higher the value, the better the product’s historical risk-adjusted performance.
Simple Alpha - The difference between the manager's return and the benchmark's return.
Standard Deviation - A statistical measure of the range of a portfolio's performance, the variability of a return around its average return over a specified timeperiod.
Tracking Error - A measure of the standard deviation of a portfolio's performance relative to the performance of an appropriate market benchmark.
Up Market Capture - The ratio of average portfolio return over the benchmark during periods of positive benchmark return. Higher values indicate betterproduct performance.
Worst Quarter - The worst of rolling 3 months(or 1 quarter) cumulative return.
Glossary of Important Terms
Page 59