Embed Size (px)
Citation preview

136
CHAPTER: V
Investment pattern of LICI and its impact in NER
5.1 Pattern of Investment
5.2 Pattern of Investment of Life Insurance Corporation of India
5.3 Analysis of Investment of LICI
Sector wise distribution of investments in India
Loans advanced for various development activities
Investments of LICI as per IRDA Guidelines
Investments of LICI in North Eastern Region

137
CHAPTER: V
In the broad and customary sense of the term, an investment is an
asset or property rights acquired or held for the purpose of wealth
acquisition or income generation. From the point of view of investors or
suppliers of capital, investment is the placement of present funds and
resources for the purpose of acquiring future incomes in the form of interest,
dividends, rent or retirement benefits, or in the form of an appreciation in
the value of the principal. The financial and economic meanings of
‘investment’ though distinguished from economic meaning are related to
each other because investment is a part of the savings of individuals which
flow into the capital market either directly or through institutions. Investors
as ‘suppliers’ and investors as ‘user’ of long-term funds find a meeting
place in the market.16
As such investment depends on the capacity of
individuals to save. The savings and investments, therefore, become two
important aspects of any socioeconomic development Investment is both
important and useful in the context of present day conditions. Some factors
that have made investment decision increasingly important are: larger life
expectancy, high rate of inflation, increasing rates of taxation, high interest
rates, larger income and availability of a complex number of investment
outlets.17
After having discussed the concept of investment it is essential to
point out the factors which are favorable for the growth of investments. The
investment market should have a favorable environment to be able to
function effectively. In India where all business activities are marked by
16
Dougall ,Herbert E., Investments, prentice-hall, inc., Engleswood
cliffs,new jersey, 1968,p.2. 17
Singh, Preeti, investment management, Himalaya publication house,
Delhi, 1986, p. 4

138
social, economic and political considerations, it is important that the
political and economic institutions are congenial for economic investments.
Generally there are three basic considerations which foster growth and bring
opportunities for investment. These are: legal safeguards, existence of
financial institutions to aid savings and form of business organization.
A stable government which frames adequate legal safeguards
encourages accumulation of savings and investments. Investors will be
willing to invest their funds if they have the assurance of protection of their
contractual and property rights. In India the investors have the dual
advantage of free enterprise and Government control. Freedom, efficiency
and growth are ensured from the competitive forces of private enterprise,
the political climate is conducive to invest as Government controls provide
a sense of stability to the capital market.
The presence of financial institutions which encourages savings and
directs them to productive uses helps the investment market to grow. The
financial institutions generally in existence in most countries are the
commercial banks, life insurance companies and investment companies. In
the United States there are merchant bankers and mortgage bankers.
Investment bankers are merchants of securities. They buy bonds and stocks
of corporations and Government bodies for re-sale to investors. The
investment bankers are distinguished from security brokers who act as
agents in buying and sellings already issued securities for a commission.
Mortgage bankers sometimes act as merchants and sometimes as agents on
mortgage loans generally on residential properties. They serve as
middlemen between investors and borrowers and perform collateral services
in connection with loans. Commercial banks and financial institutions also
139
act as mortgage bankers in giving mortgage loans and in servicing the
loans18
.
In India, the presences of a large number of financial institutions
under the Central Government and State Governments and Rural bodies
have encouraged the growth of savings and investments. They offer a wide
variety of schemes for savings and give tax benefits also. Apart from these,
there is a well organized network of development banks such as Industrial
Development Bank of India (I.D.B.I), Industrial Credit Investment
Corporation of India (I.C.I.C.I), Industrial Finance Corporation of India
(I.F.C.I), Export-import Bank of India (Exim Bank) etc. At the State level
there are State Financial Corporations, and in rural areas and agriculture, the
National Bank for Agriculture and Rural Development (NABARD). These
financial institutions and development banks offer a wide variety of policies
for encouraging savings and for investment. These institutions serve as an
element of strength to the capital market and promote discipline while
encouraging growth.
The form of business organization which is permanent in existence
aids savings and investment. The public limited companies have been said
to be the best form of organization. The three characteristics of the joint
stock form of business organization which have been very useful for
investors are limited liability of shareholders, perpetual succession and
transferability and divisibility of stocks and shares. The public limited
company with the ability to continue its business irrespective of members
comprising it, gives longevity and strength to its business activity. In
contrast to public limited company whose shareholders have limited
liability, the sole proprietor or partners in a partnership firm are liable for all
18
Singh, Preeti, Investment Management, Op. cit., p.8

140
the debts of the firm to the full extent of his personal wealth19
. In these
conditions, investors are hesitant to risk their savings in these forms of
organizations. Besides, unlimited liability the partnership and proprietor
also suffer from the short life of the organization. With the death or
retirement of any of the partners, a partnership firm is dissolved. Similarly,
a sole proprietor carries on business only during his lifetime. The public
limited companies also have the characteristic of transferability of shares
which is a guarantee for the liquidity of the company. In contrast, the
partnership restricts stability and transferability freely from person to
person. The public limited company, therefore, is a popular form of
investment as the investors benefit from liquidity, convenience and
longevity.
Until now we have discussed the importance and principles of
investment in general terms, in the pages that follow our endeavor will be to
analyze and examine the pattern of investment of the LICI and its impact in
North Eastern Region of India.
5.1 PATTERN OF INVESTMENT
According to the accepted principles of investment, the LICI should
invest funds in such a way that maximum yield is available consistent with
safety of capital. The problem of investment assumes great importance in
the case of this Corporation because huge sums are available by way of
premiums. Since these funds are not required to fully meet the liabilities, the
life insurance business should invest a major portion of the total assets and
earn a reasonable rate of interest which can be used in reducing the cost of
insurance. In this context, the Life Insurance Corporation is guided by
certain basic principles, such as safety, security, yield, convertibility,
19
.Singh, B.P., Chhabra, T.N., Business Organisation and Management, Kitab Mahal Agencies, Allahabad,
p.115.

141
diversification etc.. A safe investment is one which offers reasonable
protection against the risk of capital loss20
. The Life Insurance Corporation
must give due regard to safety of capital in making investment mainly
because its primary business is to pay claims, as and when they arise. Since
in this matter, the position of the Corporation has been that of a trustee, it
has to choose between the safeties and yield in as much as there is neither
total nor partial loss of capital. The security of capital is essential to enable
insurers to serve as true collectors of funds for paying the claims. As far as
possible, investments of high denomination should be held for the life
insurance funds and in the safest possible channels.
In addition to the security of capital, the adequacy of yield too is an
important factor. The insurer should bring about a proper coordination
between the two elements –safety and yield. The funds should be invested
in such a way that they should get at least that rate of interest which has
been assumed in arriving at the net premium. Interest is a factor taken into
consideration while calculating premiums. On account of the security of
capital and adequacy of yield, bonds and debentures of Public Sector
Corporation and the Government Companies are better than the shares of
Joint Stock Companies. Diversification is the most important consideration
in insurance investments which may take different forms. It means that the
life insurance funds should be distributed both geographically and among
different classes of investments. It is considered a sound policy no to rely
excessively on a single class of investment or a sectional investment. This is
based on the maxim: “Do not have all eggs in one basket” but reduce the
risk by dispersal of funds among different types of securities and
investments. The LIC has been continuously providing funds to a large
20
. Grewal, S.S., Grewal Narjot, Successful Stock Market Investing, Vision Books, Incorporating Orient
Paperbacks, New Delhi, 1987,p.1.

142
number of Indian industries through the purchase of their securities i.e.,
debentures, preference and equity shares. The choice of the Corporation to
invest the growing volume of life fund in Government securities and in
establishing concerns has resulted in concentration of investments in a few
industries and a few companies. The cement, cotton, textiles, electrical and
electrical goods, engineering, iron and steel and minerals which are the
oldest industries have attracted 60 per cent of the total LIC’s investment in
shares and debentures21
. In the context of planned economic development of
India, the investment of the LIC funds is of major importance. A well
conceived, integrated and diversified investment plan, while furthering the
interests of more than one crores of policyholders, has great potentialities of
effecting a balanced development of the country. Diversification may
further be assumed by having numerous securities of fixed as well as of
variable yield. The corporate, Government and Semi-Government securities
should be purchased in such proportion as to have a harmonious
combination of security and yield. If all the funds are invested in industrials
and commercials, a huge amount of taxes will have to be given. It will be a
great problem, especially when the tax rates are too high today. Hence a
considerable portion of the securities must be invested in tax-free securities.
Convertibility of investment is one of the basic principles of investment. It
means the ability with which investment are converted into cash without
undue loss of capital and without much inconvenience. Normally, the
present income on account of interest and premiums is sufficient to meet the
future claims. But on certain occasions, the convertibility of investment into
cash is a ‘must’ in order to pay cash for surrender values, to grant loans on
demand and to meet the claims, if the funds in hand are not sufficient.
Hence, in usual circumstances, ready convertibility is not a necessary
21
Khan, M.A., Theory and Practice of insurance, Aligarh, A.M.U.,p.247

143
quality of an investment but from the long-range point of view, particularly,
to meet the needs of maturing obligations it is a must22
. The Corporation
may also keep a portion of these funds in cash or in such securities which
can be realized without delay and loss. The liquidity consideration should
also be kept in mind in order to avail of an exceptionally favorable
investment opportunity, which requires selling of the existing securities and
purchasing of a new series of securities having better terms and conditions.
Thus, all the above guiding principles must be kept in view by the
LIC while investing its funds in different securities. Great care has to be
taken in selecting suitable channels of investments and supervising them.
With the help of financial forecasting based on a well thought-out analysis
of economic, political and financial conditions, the financial experts select
that form and type of investment which gives the maximum return. It may
be added, however, that keeping in view the above principles of investment,
the investment policy must promote and help the life insurance business in
various ways. On the one hand, these investments should reduce the cost of
insurance and tempt others to have it at a lower cost and on the other; these
investments should be utilized for socioeconomic needs of the country.
5.2 PATTERN OF INVESTMENT OF LIFE INSURANCE
CORPORATION OF INDIA
Life Insurance Corporation of India is an investment as well as a
development institution. Its primary aim is to spread the message of life
insurance and while pursuing this objective, the premium form
policyholders are received which are in the nature of trust funds invested
and administered in the best interest of policyholders as per guidelines of
22
Khan, M.A., Theory and Practice of Insurance, Op.cit., p.233.

144
the Government23
. The investment of the Corporation's fund is governed by
section 27A of the Insurance Act, 1938 and subsequent
guidelines/instructions issued by the Government of India from time to
time. These investments are regulated by the government to benefit the
people at large by providing basic amenities like water, drainage, sanitation,
power, housing, transportation, etc. The modified section 27A of the Indian
Insurance Act, 1938, prescribes percentage-wise ceiling of maximum limit
in different categories of investment. These have been modified from time
to time with a view to pre-empting an increasing proportion of its funds in
Government/Government guaranteed / approved / socially oriented
investments. The LIC has been directed to concentrate more on the
financing of the socially-oriented investments. LIC is one of the largest
investors in government securities, infrastructure and social sector. The
corporation helps to boost up the industrial growth in the country. It helps
the small scale and medium scale industries by granting loans for setting up
cooperative industrial estates. The corporation assists state level financial
corporations and all India Financial Corporations like IDBI, IFCI, ICICI,
etc. by way of subscription to bonds/debentures issued by such institutions.
It also makes investment in the corporate sector in the form of long, medium
and short term loans to companies/corporations.
PRE-NATIONALIZATION INVESTMENT PATTERN
Before the setting up of LIC in 1956, through the nationalization and
amalgamation of 245 companies, life insurance companies were governed
by section 27 and27A of the Indian Insurance Act, 1938. According to the
Act, every insurance Company was required to invest as follows.
23
P.V.Kulkarni, Corporation Finance Principles and Problems, Himalaya Publishing House, Delhi, p.846.
145
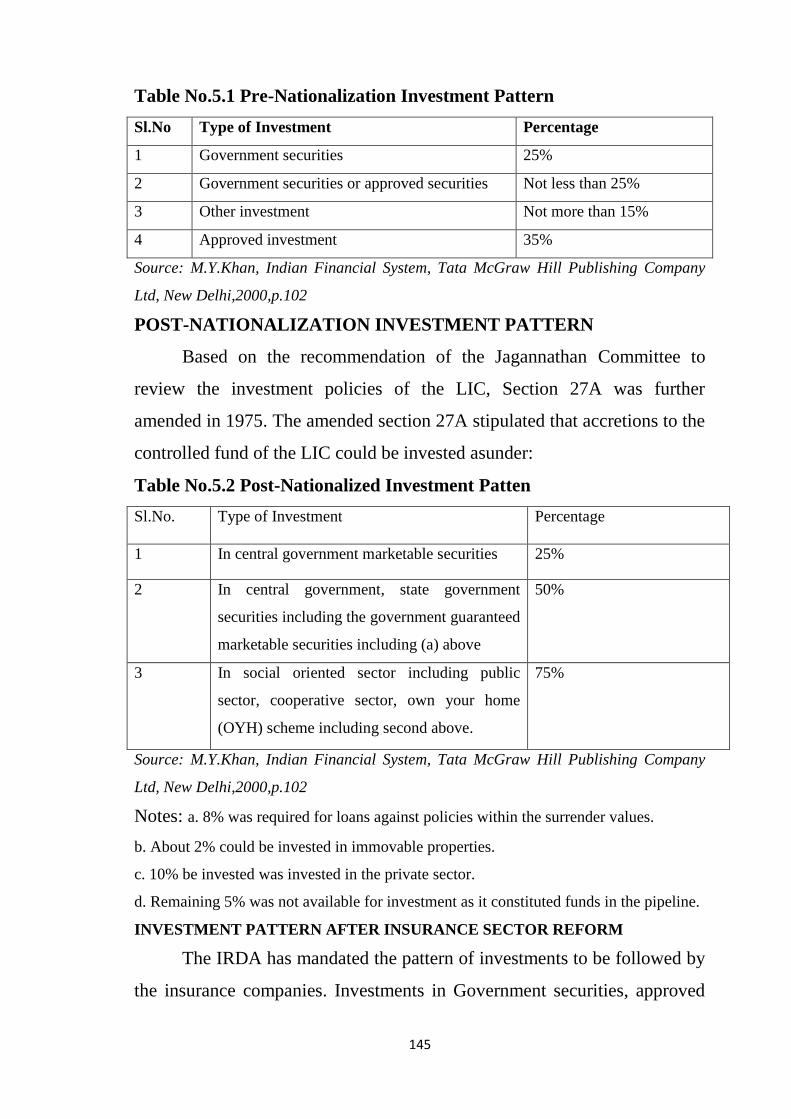
Table No.5.1 Pre-Nationalization Investment Pattern
Sl.No Type of Investment Percentage
1 Government securities 25%
2 Government securities or approved securities Not less than 25%
3 Other investment Not more than 15%
4 Approved investment 35%
Source: M.Y.Khan, Indian Financial System, Tata McGraw Hill Publishing Company
Ltd, New Delhi,2000,p.102
POST-NATIONALIZATION INVESTMENT PATTERN
Based on the recommendation of the Jagannathan Committee to
review the investment policies of the LIC, Section 27A was further
amended in 1975. The amended section 27A stipulated that accretions to the
controlled fund of the LIC could be invested asunder:
Table No.5.2 Post-Nationalized Investment Patten
Sl.No. Type of Investment Percentage
1 In central government marketable securities 25%
2 In central government, state government
securities including the government guaranteed
marketable securities including (a) above
50%
3 In social oriented sector including public
sector, cooperative sector, own your home
(OYH) scheme including second above.
75%
Source: M.Y.Khan, Indian Financial System, Tata McGraw Hill Publishing Company
Ltd, New Delhi,2000,p.102
Notes: a. 8% was required for loans against policies within the surrender values.
b. About 2% could be invested in immovable properties.
c. 10% be invested was invested in the private sector.
d. Remaining 5% was not available for investment as it constituted funds in the pipeline.
INVESTMENT PATTERN AFTER INSURANCE SECTOR REFORM
The IRDA has mandated the pattern of investments to be followed by
the insurance companies. Investments in Government securities, approved

146
securities, approved investments and in infrastructure and social sectors
have been prescribed in the Insurance Act, 1938. The Authority has also
specified that every insurer carrying on the business of life insurance shall
invest and at all times keep invested his controlled fund (other than funds
relating to pension and general annuity business and unit-linked life
insurance business) in the following manner:
Table No.5.3(i) PATTERN OF INVESTMENTS SPECIFIED BY IRDA - Life
Insurance
S.No Type of Investment Percentage
i) Government Securities 25%,
ii) Government Securities or other approved securities (including (i) above)
Not less than 50%,
iii) Approved Investments as specified in Schedule-1
a) Infrastructure and Social Sector Not less than 15%
b) Others to be governed by Exposure Norms. (Investments in 'Other than in Not
exceeding 35% Approved Investments' in no case exceed 15% of the Fund).
In the case with pension and general annuity business every insurer shall
invest and at all times keep invested funds in the following manner:
Table No.5.3(ii) PATTERN OF INVESTMENTS SPECIFIED BY IRDA - Pension
and General Annuity
S.No Type of Investment Percentage
i) Government securities, being not less than 20%
Ii) Government Securities or other approved securities 40%
inclusive of (i) above, being not less than
iii) Balance to be invested in Approved Investments and to be Not exceeding 60%
governed by Exposure/ Prudential Norms

147
And in the case with unit linked life insurance business every insurer shall
invest and at all times keep invested his segregated fund in unit linked life
insurance business as per pattern of investment offered to and approved by
policyholders. Unit linked policies may only be offered where the units are
linked to categories of assets which are both marketable and easily
realizable. However, the total investment in other than the approved
category of investments shall at no time exceed 25% of the fund.
Table No.5.3(iii) PATTERN OF INVESTMENTS SPECIFIED
BY IRDA – Linked Life Insurance Business
S.No Type of Investment Percentage
i) Approved Investments Not less than 75%
Ii) Other approved securities Not more than 25%
5.3 ANALYSIS OF INVESTMENT OF LICI
In order to evaluate the investment portfolio of LIC, the analysis has
been made on the basis of the following variables:
Sector wise distribution of investments in India.
Loans advanced for various development activities.
Investments of LICI as per IRDA Guidelines
Investments of LICI in North Eastern Region
ANALYSIS OF SECTOR WISE DISTRIBUTION OF INVESTMENTS IN INDIA
Over the years LIC has helped to spread up the tempo of economic
development of our country by making investment in public, private and
cooperative sector. In fact the huge fund at the disposal of LIC has proved
to be that drop of useful oil, which greases and smoothen to the wheels of
economic development of our country. The analysis has been done in order
to see the sector wise distribution of investment in each sector and the

148
growth in investment in each sector has been calculated for the study period.
Table 5.4 depicts the broad distribution of sector wise investment of LIC in
India. The book value of investments in India is considered as on 31st March
of every year.
Table 5.4 Analysis of Sector wise Distribution of investment in India
Private Sector Public Sector
Co-operative
Sector Total
Year
Amount
(` in
Crores)
%
share
Amount
(` in
Crores)
%
share
Amount
(` in
Crores)
%
share
Investment
(` in
Crores)
%
growth
over
previous
year
1996-97 10078.8 12.93 65917.4 84.6 1941.8 2.5 77938.0
1997-98 12334.3 13.18 79235.7 84.7 2030.3 2.2 93600.3 20.10
1998-99 15597.7 13.67 96410.5 84.5 2094.5 1.8 114102.7 21.90
1999-00 19843.9 14.27 117059.0 84.2 2129.3 1.5 139032.2 21.85
2000-01 23579.2 14.12 141256.2 84.6 2168.4 1.3 167003.8 20.12
2001-02 24500.6 11.82 180574.1 87.1 2128.6 1.0 207203.3 24.07
2002-03 30091.3 11.95 219596.7 87.2 2082.3 0.8 251770.3 21.51
2003-04 52883.2 16.19 271778.5 83.2 2079.5 0.6 326741.2 29.78
2004-05 69754.6 17.74 322021.8 81.9 1408.2 0.4 393184.6 20.34
2005-06 107063.5 21.97 378807.2 77.7 1356.5 0.3 487227.2 23.92
2006-07 84369.2 16.17 433810.3 83.1 3555.1 0.7 521734.6 7.08
2007-08 128541.5 20.22 503388.4 79.2 3817.6 0.6 635747.5 21.85
2008-09 187212.5 24.54 572050.3 75.0 3628.9 0.5 762891.7 20.00
2009-10 236205.5 25.73 678374.5 73.9 3336.5 0.4 917916.5 20.32
2010-11 265880.3 25.43 775992.5 74.2 3666.6 0.4 1045539.4 13.90
CAGR 24.33% 17.90% 4.54% 18.94%
Source: RBI- Handbook of Statistics on the Indian Economy for the year 2010-11

149
Chart 5.4 Analysis of Sector wise Distribution of investment in India
Table 5.4 show the sector wise investment of LIC in India. The book
value of the investments of the corporation was ` 77938.0 crores in 1996-
97 which increased to ` 1045539.4 crores in 2010-11. Thus, the figure
shows the tremendous growth in the investment and it has been raised by
more than thirteen times during the study period. During the study period
the percentage growth over the previous year lies between 7 % and 30 %.
The highest growth rate has been observed 29.78 % in the year 2003-04.
The lowest growth rate has been observed 7.08 % in the year 2006-07. In
1996-97 the total investment of LIC was ` 77938.0 crores which increased
to ` 93600.3 crores in 1997-98 with 20.10% growth, ` 114102.7 crores in
1998-99 with 21.90%, ` 139032.2 crores in1999- 2000 with 21.85%, `
167003.8 crores in 2000-01 with 20.12%, ` 207203.3 crores in 2001-02
with 24.07%, ` 251770.3 crores in 2002- 03 with 21.51%, ` 326741.2
crores in 2003-04 with 29.78%, ` 393184.6 crores in 2004-05 with 20.34%,
` 487227.2 crores in 2005-06 with 23.92%, ` 521734.6 crores in 2006-07
0
200000
400000
600000
800000
1000000
1200000
19
96
-97
19
97
-98
19
98
-99
19
99
-00
20
00
-01
20
01
-02
20
02
-03
20
03
-04
20
04
-05
20
05
-06
20
06
-07
20
07
-08
20
08
-09
20
09
-10
20
10
-11
Inve
stm
en
t (`
in C
rore
s)
Year
Private Sector (` in Crores)
Public Sector (` in Crores)
Co-operative Sector (` in Crores)
Total Investment (` in Crores)

150
with 7.08%, ` 635747.5 crores in 2007-08 with 21.85%, ` 762891.7 crores
in 2008-09 with 20.00%, ` 917916.5 crores in 2009-10 with 20.32%,and
lastly it increased to ` 1045539.4 crores in 2010-11 with the growth rate of
13.90%. The annual compound growth rate of total investment was 18.90%
which is a welcome trend. During the study period, it has been observed that
for a couple of years the growth rate was below the annual compound
growth rate and for thirteen years the growth rate was above the annual
compound growth rate.
Now considering the amount of funds invested in three different
sectors of the economy. The share of investments in public sector has been
greater throughout the study period. Among the three sectors major
investment has been made in the public sector by the LIC and then comes
the private sector and the least share in the co-operative sector. It is clear
from the table that there has been a constant increase in the investments of
the corporation in the public sector throughout the study period. The
investment in the public sector was ` 65917.41crores in 1996-97 which
increased to ` 775992.5 crores in 2010-11. Thus, the investment in public
sector rises by more than 11times during the study period. During the study
period the percentage share of investment in the public sector to the total
investment lies between 73.9% and 87.2%. The highest percentage share of
investment has been observed 87.22% in 2002-03 and the lowest percentage
share of investment has been observed 73.9% in 2009-10. The average
percentage share of investment in the public sector was 81.7% during the
study period. During the study period it has been observed that for five
years the percentage share of investment in the public sector was below the
average percentage share of investment and for ten years the percentage
share of investment in the public sector was above the average percentage
share of investment. The percentage growth over the previous year of the

151
investment in public sector lies between 14% and 28%. The highest growth
rate has been observed 27.8% in 2001-02 and the lowest growth rate has
been observed 14.4% in 2010-11.
In 1996-97 the total investment in public sector was ` 65917.4 crores
which increased to ` 79235.7crores in 1997-98 with 20.20% growth, `
96410.5 crores in 1998-99 with 21.7%, ` 117059 crores in1999-2000 with
21.4%, ` 141256.2 crores in 2000-01 with 20.7%, ` 180574.1 crores in
2001-02 with 27.8 %, ` 219596.7 crores in 2002-03 with 21.6 %, `
271778.5 crores in 2003-04 with 23.8%, ` 322021.8 crores in 2004-05 with
18.5%, ` 378807.2 crores in 2005-06 with 17.6%, ` 433810.3 crores in
2006-07 with 14.5%, ` 503388.4 crores in 2007-08 with 16 %, ` 572050.3
crores in 2008-09 with 13.6%, ` 678374.5 crores in 2009-10 with
18.6%,and lastly it increased to ` 775992.5 crores in 2010-11 with the
growth rate of 14.4%. The annual compound growth rate of investment in
the public sector was 17.87% which is a welcome trend. During the study
period, it has been observed that for five years the growth rate was below
the annual compound growth rate and for seven years the growth rate was
above the annual compound growth rate.
In case of investments in private sector, it is clear from the table that
there has been a constant increase in the investments of the corporation
throughout the study period. The investment in the private sector was `
10078.8 crores in 1996-97 which increased to ` 265880.3 crores in 2010-11.
Thus, the investment in private sector rises by more than 26 times during the
study period. During the study period the percentage share of investment in
the private sector to the total investment lies between 11% and 26 %. The
highest percentage share of investment has been observed 25.73 % in 2009-
10 and the lowest percentage share of investment has been observed 11.82

152
% in 2001-02. The average percentage share of investment in the private
sector was 17.33 % during the study period. During the study period it has
been observed that for nine years the percentage share of investment in the
private sector was below the average percentage share of investment and for
six years the percentage share of investment in the private sector was above
the average percentage share of investment. The percentage growth over the
previous year of the investment in private sector lies between 12% and 76%
except in 2001-02 and 2006-07. The highest growth rate has been observed
75.74 % in 2003-04 and the lowest (negative) growth rate has been
observed -21.20 % in 2006-07. In 1996-97 the total investment in private
sector was ` 10078.8 crores which increased to ` 12334.3 crores in 1997-98
with 22.38 % growth, ` 15597.7 crores in 1998-99 with 26.46 %, ` 19843.9
crores in1999-2000 with 27.22 %, ` 23579.2 crores in 2000-01 with 18.82
%, ` 24500.6 crores in 2001-02 with 3.91 %, ` 30091.3 crores in 2002-03
with 22.82 %, ` 52883.2 crores in 2003-04 with 75.74 %, ` 69754.6 crores
in 2004-05 with 31.90 %, ` 107063.5 crores in 2005-06 with 53.49 %, `
84369.2 crores in 2006-07 with negative growth of -21.20%, ` 128541.5
crores in 2007-08 with 52.36 %, ` 187212.5 crores in 2008-09 with 45.64
%, ` 236205.5 crores in 2009-10 with 26.17 %,and lastly it increased to `
265880.3 crores in 2010-11 with the growth rate of 12.56 %. The annual
compound growth rate of investment in the private sector was 24.38 %
which is a welcome trend. During the study period, it has been observed that
for six years the growth rate was below the annual compound growth rate
and for nine years the growth rate was above the annual compound growth
rate.
In case of investments in co-operative sector, it is clear from the table
that there hasn’t been a constant increase in the investments of the
corporation throughout the study period. It has been seen that sometimes

153
there was a fall registered in the investment also. The investment in the co-
operative sector was ` 1941.8 crores in 1996-97 which increased to `
3666.6 crores in 2010-11. During the study period the percentage share of
investment in cooperative sector to the total investment lies between 0.30 %
and 2.50 %. The highest percentage share of investment has been observed
2.50 % in 1996-97 and the lowest percentage share of investment has been
observed 0.30% in 2005-06.
The average percentage share of investment in the co-operative sector
was 1% during the study period. During the study period it has been
observed that for nine years the percentage share of investment in
cooperative sector was below the average percentage share of investment
and for six years the percentage share of investment in the co-operative
sector was above the average percentage share of investment. The
percentage growth over the previous year of the investment in the co-
operative sector lies between -32% and 10%.The highest growth rate has
been observed 4.6 % in 1997-98 and the lowest growth rate has been
observed -32.3% in 2004-05. In 1996-97 the total investment in the co-
operative sector was ` 1941.8 crores which increased to ` 2030.3 crores in
1997-98 with 4.6 % growth, ` 2094.5 crores in 1998-99 with 3.2 %, `
2129.3 crores in1999-2000 with 1.7 %, and ` 2168.4 crores in 2000-01 with
1.8%. Then it decreased to ` 2128.6 crores in 2001-02 with -1.8%, ` 2082.3
crores in 2002-03 with -2.2%, ` 2079.5 crores in 2003-04 with -0.1%, `
1408.2 crores in 2004-05 with -32.3%, ` 1356.5 crores in 2004-05 with -3.7
%, in 2006-07 there is sudden growth to ` 3555.1 crores with 162.1 %
growth, ` 3817.6 crores in 2007-08 with 7.4 %. Then, further again it
decreased to ` 3628.9 crores with -4.9%, ` 3336.5 crores with -8.1 %. But
in 2010-11 the investment in the co-operative sector increased to ` 3666.6
crores with a 9.9% growth rate. The annual compound growth rate of

154
investment in the co-operative sector was 4.33 %. During the study period,
it has been observed that for ten years the growth rate was below the annual
compound growth rate and for five years the growth rate was above the
annual compound growth rate.
ANALAYSIS OF LOANS ADVANCED FOR VARIOUS DEVELOPMENT
ACTIVITIES
Loans continued to constitute one of the major avenues of investment
for the corporation’s funds. It has been the constant endeavor of the
Corporation to provide security to as many people as possible and to
channelize the savings mobilized for the welfare of the people at large. To
meet this end, the Corporation is granting the loans for promoting Social
Welfare through investments in Infrastructure and Social Sector which
includes:
* Projects/Schemes for generation and transmission of Power,
* Housing Sector,
* Water Supply and Sewerage Projects/Schemes,
* Development of Roads, Bridges & Road Transport.
Thus, the data related to the loans advanced in the different years has been
gathered and shown in the form of a table in order to make proper analysis
as well as comparison with various developmental activities like Electricity,
housing, water supply and sewerage, transport, industrial development.
The details of the development activities for which loans are advanced by
LIC have been given below:
Table 5.5 Details of Development Activities
Developmental Activities Details
Electricity State Electricity Boards/ Electric Power Corporations,
i.e. SEBs /EPC.
Housing a. State Govt. for Housing Schemes

155
b. Apex cooperative housing finance societies
c. LIC Housing Finance Ltd.
d. Housing and Urban Development
e. National Housing Bank
Water Supply and Sewerage a. Municiapal Committees/ Water supply and Sewerage
Boards
b. Zilla parishads for Rural Piped Water Supply
Schemes
c. Irrigation
Transport State Road Transport Corporation
Other infrastructure Joint Stock Companies
The detailed information regarding the loans advanced for various
development activities from 1996-97 to 2010-11 is given below.
Table 5.6 Loans advanced for various development activities
Amount Advanced during the year (in ` Crores)
YE
AR
EL
EC
TR
ICIT
Y
% S
HA
RE
HO
US
ING
% S
HA
RE
WA
TE
R S
UP
PL
Y
& S
EW
ER
AG
E
% S
HA
RE
TR
AN
SP
OR
T
% S
HA
RE
OT
HE
R
INF
RA
ST
RU
CT
U
RE
% S
HA
RE
TO
TA
L
1996-97 676.34 24.03 1146.17 40.72 146.86 5.22 62.94 2.24 782.40 27.80 2814.71
1997-98 965.10 31.97 1180.15 39.10 236.00 7.82 11.75 0.39 625.62 20.73 3018.62
1998-99 1479.23 37.24 1769.56 44.54 243.96 6.14 119.24 3.00 360.66 9.08 3972.65
1999-00 1366.11 34.76 1651.10 42.01 488.52 12.43 65.29 1.66 358.96 9.13 3929.98
2000-01 470.82 13.50 2113.31 60.58 526.82 15.10 48.05 1.38 329.47 9.44 3488.47
2001-02 1045.46 35.62 1056.25 35.99 342.87 11.68 108.84 3.71 381.31 12.99 2934.73
2002-03 1060.93 32.49 890.07 27.26 570.33 17.47 465.00 14.24 278.68 8.54 3265.01
2003-04 297.00 3.78 749.81 9.55 2511.22 31.98 15.00 0.19 4279.21 54.50 7852.24
2004-05* 4272.90 43.66 2726.83 27.86 383.01 3.91 233.22 2.38 2170.44 22.18 9786.40
2005-06 8471.90 61.17 4463.97 32.23 26.16 0.19 128.00 0.92 760.81 5.49 13850.84
2006-07 9615.25 55.59 3968.91 22.95 65.34 0.38 601.82 3.48 3045.86 17.61 17297.18
2007-08 7022.00 41.88 3935.00 23.47 14.00 0.08 45.00 0.27 5749.00 34.29 16765.00
2008-09 6689.11 30.72 6734.87 30.93 118.31 0.54 227.73 1.05 8005.55 36.76 21775.57
2009-10
13044.7
4 62.69 4034.77 19.39 47.00 0.23 680.87 3.27 3001.36 14.42 20808.74
2010-11 7616.61 49.99 4481.75 29.42 24.78 0.16 685.58 4.50 2427.22 15.93 15235.94
CAGR 21.89% 11.78% -18.50% 17.87% 19.30% 16.69%
Average
37.27
32.40
7.56
2.85
19.93
Source: Annual Reports of LIC & IRDA Various Issues

156
Chart 5.6 Loans advanced for various development activities
Table 5.6 and Chart 5.6 give the detailed information regarding the
loans advanced for various development activities. It can be seen that the
total amount of loans advanced for various developmental activities showed
an increasing trend from 1996-97 to 1998-99. The amount of loans
advanced was ` 2814.71 crores in 1996-97 which reached to ` 3929.98
crores in 1999-00. After the entry of private players in the insurance sector,
the loan amount started dealing. But in 2002, IRDA issued new regulations
for investment which lead to a huge increase in the amount of loans
advanced to various authorities. Thus, in 2003-04, the amount of loans was
` 7852.24 cores and increased to ` 17297.18 crores in 2006-07. After it
decreased to ` 16765 crores in 2007-08 and further increased to ` 21775.57
crores in 2008-09. During the last couple of years of the study period it
declined to ` 20808.74 in 2009-10 further to ` 15235.94 crores in 2010-11.
The compound annual growth rate of the total amount of loans advanced for
the entire period of study is 16.69%.
The percentage share of each development activity to the total loan
amount, Housing holds the major share of loans advanced throughout from
1996-97 to 2000-01. The second major share goes to electricity, followed by
other infrastructure and water supply sewerage. Thus the least share is to
0.00
5000.00
10000.00
15000.00
20000.00
25000.00
LOA
NS
AD
VA
NC
ED `
in
cro
re
Year
OTHER INFRASTRUCTURE
TRANSPORT
WATER SUPPLY & SEWERAGE
HOUSING
ELECTRICITY

157
transport from 1996-97 to 2000-01. There has been an extreme change in
the percentage share of the amount of loans advancement of various
activities from 2000 onwards. In 2000-01, Housing holds 60.58% share then
comes water supply and sewerage with 15.10% share, after this comes 9.445
Electricity with 13.5% share, then other infrastructure with 9.44% share and
the least share is to transport with 1.38%. In 2001-02 and 2002-03 there is
not much difference in the percentage share of total loans for various
development activities. As the new regulations were issued in 2002 by
IRDA, LIC made a change in the amount of loans advanced to various
development activities. In 2003-04 huge amount of the loan was provided to
irrigation as well as for the infrastructure development. In 2005-06 the more
than 90% of loans advanced share by Electricity and Housing. In 2007-08
the percentage share of loans advanced to Electricity by 41.88%, housing by
23.47%, other infrastructure with 34.29% and share of transport and water
supply & sewerage with 0.27% and 0.08% respectively. In the last year of
study period electricity and housing share about 80% share of total loans
advanced. Considering the average percentage share of each development
activity to the total loan amount during the study period, Electricity holds
the major share of 37.27% of total loans advanced, second major share
goes to housing with 32.40% followed by other infrastructure with 19.93%,
water supply & sewerage with 7.56% and transport with 2.85%. The
compound annual growth rate of electricity is 21.89%, other infrastructure is
19.30%, transport is 17.87%, housing is 11.78% and water supply &
sewerage showing a negative rate of -18.50%.
On the basis of above analysis, it is concluded that there is huge
increased in the total amount of loan advanced for various development
activities after the issue of new investment regulations by IRDA in 2002.

158
COMPOSITION OF INVESTMENTS AS PER IRDA GUIDELINES
The Life Insurance Corporation of India has been a nation builder
since its formation in 1956. True to the objectives of nationalization, the
LIC has mobilized the funds invested by the people in life insurance for the
benefit of the community at large. The corporation has deployed the funds
to the best advantage of the policyholders as well as the community as a
whole, true to the spirit of nationalization. National priorities and obligation
of reasonable returns to the policy holders are the main criteria of our
investments. The total investments of the Corporation amounted to `
12,66,539.04 crore as at 31st March, 2011. The investment of the
Corporation’s funds is governed by Section 27A of the insurance Act, 1938,
subsequent guidelines / instructions issued thereunder by the Government of
India from time to time, and the IRDA by way of regulations. As per the
prescribed investment pattern approved by IRDA, the controlled funds are
invested as follows:-
Not less than 50% is invested in Govt. Securities or other approved
Investments.
Not less than 15% is invested in infrastructural and social sector
Investments.
Not exceeding 35% in others to be governed by exposure prudential
norms.
The analysis has been done in order to see the investment pattern of
LIC as per IRDA regulations. Thus, controlled funds are divided into three
prescribed categories of investment, i.e. 1) Central Govt. Securities 2) State
Govt. & Other Govt. Guaranteed Marketable Securities and 3) Infrastructure
and Social Sector Investment. The percentage of an amount of investments
in each category has been calculated for the period 1996-97 to 2010-11.

159
Table 5.7 depicts the composition of investments of LIC for the different
years.
Table 5.7 COMPOSITION OF INVESTMENTS AS PER IRDA GUIDELINES
Sl. No.
1 2 3. Infrastructure and Social Sector
Investment
Typ
e of
inves
tmen
t
Cen
tral
Govt.
Sec
uri
ties
Sta
te G
ovt.
&
Oth
er G
ovt.
Gu
ara
nte
ed
Mark
etab
le
Sec
uri
ties
S
UB
TO
TA
L (
A)
a) H
ousi
ng
b)
P
ow
er
c) Ir
rigat
ion/
Wat
er
Supply
& S
ewer
age
d)
Road
, R
ailw
ays,
Port
& B
ridges
e) O
ther
s
(Incl
udin
g T
elec
om
)
SU
B T
OT
AL
(B
)
TO
TA
L (
A+
B)
31.3.9
7 54.84 13.08 67.93
16.1
8
12.0
7 2.98 0 0.85 32.0
7 100
31.3.9
8 56.68 12.94 69.61
15.1
8
11.6
5 2.80 0.03 0.73 30.3
9 100
31.3.9
9 57.33 13.19 70.52
14.5
4
11.6
2 2.56 0.03 0.73 29.4
8 100
31.3.0
0 59.83 12.01 71.84
13.5
1
11.3
7 2.54 0.07 0.66 28.1
6 100
31.3.0
1 60.88 12.78 73.65
12.8
9
10.0
2 2.61 0.23 0.59 26.3
5 100
31.3.0
2 63.41 12.38 75.79
11.0
2 9.95 2.31 0.39 0.55 24.2
1 100
31.3.0
3 64.30 13.58 77.88 9.36 9.66 2.07 0.37 0.66 22.1
2 100
31.3.0
4 65.18 14.60 79.79 8.10 8.28 2.78 0.5 0.56 20.2
1 100
31.3.0
5 65.72 16.88 82.59 5.45 7.38 2.9 0.27 1.41 17.4
1 100
31.3.0
6 66.12 16.44 82.56 5.53 8.3 2.31 0.2 1.10 17.4
4 100
31.3.0
7 66.38 15.66 82.04 5.47 9.23 1.83 0.37 1.07 17.9
6 100
31.3.0
8 63.50 19.02 82.52 5.18 8.76 1.42 0.25 1.87 17.4
8 100
31.3.0
9 60.11 20.88 80.99 6.45 9.07 1.14 1.36 0.99 19.0
1 100
31.3.1
0 55.45 21.74 77.19 6.19
11.9
4 0.81 1.24 2.63 22.8
1 100
31.3.1
1 54.45 23.52 77.97 5.78
10.7
0 0.57 1.31 3.67 22.0
3 100
CAG
R
-2.47 3.99 0.92 -
6.63
-0.8 -10.44 30.9
6
10.24 -
2.47
Source: compiled from LIC annual reports various issues, LIC diaries.

160
Chart 5.7 COMPOSITION OF INVESTMENTS AS PER IRDA GUIDELINES
Table 5.7 reveals the investment pattern of controlled funds of LIC.
As per the regulations approved by IRDA, there must be minimum 50%
investment in government securities or other approved securities. It is clear
from Table 5.7 that from 1996-97 to 2010-11, there has been more than
50% of investment of the Corporation in this category. The figures of
various years show an increasing trend of investment up to 2004-05 and
afterwards there is a slight decline in every year. During the study period the
percentage share of investments in Central Government Securities and State
Government & other government guaranteed marketable Securities lies
between 67 % to 83 %. The highest percentage share of investment has been
observed 82.59% in 2004-05 and the lowest percentage share of investment
has been observed 67.93% in 1996-97. In 1996-97 the percentage share of
investment in Government Securities or other approved securities was
67.93% which increased to 69.61%, 70.52%, 71.84%, 73.65%, 75.79%,
82.59% in 1997-98,1998-99,1999-00,2000-01,2001-02,2002-03,2003-
04,2004-05 respectively showing an increasing trend. Then a slight decline
came in a couple of years in 2005-06 and 2006-07 when percentage share
Central Govt. Securities
61%
State Govt. & Other Govt. Guaranteed
Marketable Securities
16%
Housing 9%
Power 10%
Irrigation/ Water supply &
sewerage 2%
Roads,Railways, Ports & Bridges
1%
Others (including Telecom)
1%
Infrastructure and Social Sector Investment
23%

161
down to 82.56% and 82.04%. Again it increased to 82.52% in 2007-08.
Then in the last three years of the study it declines to 80.99%, 77.19%, and
77.97% in 2008-09,2009-10 and 2010-11 respectively. The average
percentage share of investment in government securities or other approved
securities was 76.86% during the study period of fifteen year. During the
study period it has been observed that for six years the percentage share of
investment in central government securities below the average percentage
share of investment and for nine years the percentage share of investment in
government securities or other approved securities was above the average
percentage share of investment.
As per IRDA guidelines the approved investment in infrastructure &
social sector should not less than 15% and others to be governed by
Exposure norms not exceeding 35% of total investment. Looking at the
figures of this category, it is concluded that LIC has failed on this front. For
the entire study period the percentage share of investment in this category
did satisfy the investment norms given by IRDA. During the study period
the percentage share of investment in infrastructure and social sector lies
between 17% and 33%. The highest percentage share of investment has
been observed 32.07% in 1996-97 and the lowest percentage share of
investment has been observed 17.41% in 2004-05. In 1996-97 the
percentage share of investment in infrastructure and social sector was
32.07% which decreased to 30.39%, 29.48%, 28.16%, 26.35%, 24.21%,
22.12%, 20.21% and 17.41% in 1997-98, 1998-99, 1999-2000, 2001-
02,2002-03,2003-04 and 2004-05 respectively. Then it increased to 17.44%
in 2005-06 and 17.96% in 2006-07.Afterwards there is a slight decline to
17.48% in 2007-08 then increased for a couple of years to 19.01% and
22.81% in 2008-09 and 2009-10 respectively. In the last year of the study
period there is decline to 22.03% i.e., in 2010-11. The average percentage

162
share of investment in infrastructure and social sector was 23.14% during
the study period. During the study period of fifteen years it has been
observed that for nine years the percentage share of investment in
infrastructure and social sector was below the average percentage share of
investment and for six years the percentage share of investment in
infrastructure and social sector was above the average percentage share of
investment.
INVESTMENTS OF LIC IN NORTH EASTERN REGION
One of the principal aims of our planning is to correct regional
imbalances in our economy and to bring about a balanced growth of all
regions. This is necessary to achieve economic, social and political stability.
We have to examine here the role that the LIC plays in fulfillment of this
objective. The Life Insurance Corporation of India is a business
organization. It should adopt and it has adopted the policy of diversification
in order to ensure security and steady returns for its investments. It can
invest in backward regions only when it finds that such investments are
profitable from the business point of view. Between regions offering equal
investment opportunities and satisfying all its canons of investment it may
be expected to invest in backward regions. Because of its legal restraints
and even otherwise, it is not in a position to pioneer new ventures and new
industries and hence its contribution to remove existing regional imbalances
is extremely limited. That will be hardly consistent with its primary duty to
the policyholders in making sound investments of the life fund. Moreover, it
is too much to expect from the corporation to assume the responsibility of
the Central and State Governments which alone are competent to take
effective steps to correct regional imbalances in the economy.24
24
Bajpai, O.P., Life insurance finance in india, op. cit.,p.253.

163
Moreover, geographic diversification of investment depends upon the
industrial and economic development of the States and regions and since it
is uneven, the opportunities for investment therein are correspondingly
unequal. So far as stock-exchange securities are concerned they are
purchased from all the exchanges in the country subject to the availability of
suitable scripts, but that does not serve the purpose beyond which the
Corporation cannot go. In this context, the former Finance minister’s.25
Observations regarding studies diversification are quite significant. He said:
“it (LIC) will take no parochial view. Its funds are drawn from all over India
and they will as far as practicable considerations allow, be invested for the
good of the entire country. Thus there will be a studied diversification of its
investible funds which is an essential requirement of any insurer,
particularly the sole insurer of a country”. Attention has been drawn by the
Reserve Bank of India 26
to the limited role the country’s financial
institutions can play in correcting regional economic imbalances and
removing backwardness. Financial institutions can facilitate and stimulate
development but they cannot initiate it. They can only finance viable and
self-contained projects. In each area the programme of development has to
be based on its potentialities and possibilities. It is taken as granted that
development means the setting up of large scale industries. The LIC helps
State Electricity Boards but even there the magnitude of the resources
needed for power programme is so large for financial institutions to be in a
position to make anything but a marginal contribution.
The North Eastern Region, a fascinating part of our vast country,
needs to be developed and that too rapidly is accepted by one and all.
However, to place the matter in a proper perspective, let us look at a few
25
Parliamentary Debates, 1958. 26
Reserve Bank of India – Note to the Committee of National Development Council, September 1986.

164
statistics. The north east comprises nearly 7.9 percent of the total land mass
of India but has merely 4 per cent of the total population. However, the net
domestic product of the north eastern states constituted a bare 2 percent of
the country’s net domestic product, thus the wealth generated per capital in
our region is far less than the Indian average.27
Unless an accelerated growth
of the region is ensured in all spheres over the next few years, North East
will continue to languish behind other parts of the country. Considering that
the per capita income of India itself is far less than that of many other
countries, the task of developing North East becomes at once urgent and
important. The topic is indeed vast and all comprehensive. When we talk
about the development of a Region, we have in view at least three broad
facets and they are: infrastructure, agriculture, and industries.
For financing industrial development of the Region, three groups
should get deeply involved and they are:
Governments of State and Centre;
Industrialists and Entrepreneurs; and
Banks and Financial Institutions.
All these agencies/ groups should play a mutually supportive and
complementary role. Each one of them is important in its own respect but,
unless all the three moves jointly in unison, development, even if it takes
place, can at best be lopsided. Fiscal space for making investments in
physical and social infrastructure depends on the generation of revenue and
the committed expenditure for administration, interest payments and
calamity relief. A Significant proportion of the expenditure on social
services falls within the revenue account and so also the expenditure on
maintenance of physical infrastructure. Capital expenditure on physical
infrastructure depends on the surplus generated in the revenue account and
27
nedfidatabank

165
the volume of borrowing. The latter comprises of market borrowing, which
is determined by the Central Government (in consultation with the Reserve
Bank of India), the share of small savings collections and Central
Government loans to the states. The practice of Central Government directly
lending to the states has been discontinued since 2005-06. In addition to
these, the State Government borrows indirectly through special purpose
vehicles (public enterprises) from the Housing and Urban Development
Corporation (HUDCO), Life Insurance Corporation (LIC), NABARD and
other similar institutions. In the case of the North Eastern states, each
Central Government Department is required to earmark 10 per cent of its
plan budget for the region and the unspent balance of it, if any, is credited to
the non-lapsable fund. This fund is used for infrastructure development in
the North East States through the Ministry of DoNER. It is supplemented by
a separate budgetary provision for NEC for development projects/ schemes
in NER. In addition, there is direct spending by the Central Government
departments including those of the Border Roads Organization.
To analysis the investment LICI and its impact in North Eastern
Region by using the following parameter:
Loan sanction by LICI to North Eastern Region
State-wise Assistance Disbursed to Corporate Sector by LIC of India
State-wise Assistance Sanctioned to Corporate Sector by LIC of
India
The data for loans sanction by LICI to northeastern states for the year
2010-11 is not available so analysis is done for 1996-97 to 2009-10. Table
5.8 and Chart 5.8 give the detailed information regarding the loan sanction
by LICI to North Eastern Region for various development activities is given
below.

166
Table 5.8 LOANS SANCTION BY LICI TO NORTH EASTERN REGION
` in lakh
States
Arunachal
Pradesh Assam
Man
ipur
Megha
laya
Mizora
m
Nagalan
d
Sikki
m
Tripu
ra
Total:
N.E.
Region
Total:
All
India
1996-97 0 0 280 0 313 1000 0 990 2583 23020
1997-98 0 39 280 0 860 500 0 1000 2679 34475
1998-99 0 13 349 0 2598 1400 0 2120 6480 60847
1999-00 0 0 0 0 4098 1600 0 4544 10242 100495
2000-01 7 0 0 0 3811 500 0 6016 10334 126214
2001-02 7 0 0 0 4385 750 1606 7467 14215 105933
2002-03 0 0 0 0 4712 1224 964 5991 12891 180642
2003-04 0 0 0 0 4609 1500 964 7977 15050 277239
2004-05 0 0 0 0 900 964 2183 4047 386698
2005-06 95 -39 0 0 4396 2477 964 0 7893 129389
2006-07 113 0 0 0 4918 3040 964 0 9035 76126
2007-08 0 0 0 0 1991 895 964 0 3850 58136
2008-09 0 0 0 0 2000 0 1008 0 3008 57008
2009-10 0 0 0 0 2000 0 1008 0 3008 47008
CAGR
-1.60% 3.71%
Source: Handbook of Statistics on State Government Finances (www.rbi.org.in)
CHART 5.8 LOANS SANCTION BY LICI TO NORTH EASTERN REGION
All India 94%
Arunachal Pradesh 0%
Assam 0%
Manipur 0%
Meghalaya 0%
Mizoram 2%
Nagaland 1%
Sikkim 1%
Tripura 2%
NER 6%

167
It can be seen from Table 5.8 that the total amount of loans given to
NER showed an increasing trend from 1996-97 to 2001-02. The amount of
loans advanced was ` 2583 lakh in 1996-97 which reached to ` 14215 lakh
in 2001-02. After the entry of private players in the insurance sector, the
loan amount started decreasing. But in 2002, IRDA issued new regulations
for investment which lead to a huge increase in the amount of loans
advanced to NER. Thus, in 2003-04, the amount of loans was ` 15050 lakh
which is the highest amount of loan sanction to NER during the study
period. After that there was a huge decline in the amount of loans to ` 4047
lakh in 2004-05 with negative growth rate of -73.11% over the previous
year. In the next couple of years there was increased in the amount of loans
in the region of ` 7893 in 2005-06 and ` 9035 lakh in 2006-07. During the
last 3 years there huge decline in the amount of loans to ` 3850 lakh in
2007-08, ` 3008 lakh in 2008-09 & 2009-10. The compound annual growth
rate of the total amount of loans advanced for the entire period showing a
negative growth rate of -1.60% whereas at all India basis the compound
annual growth rate was 3.71%. On average basis the percentage share of the
total amount of loan sanction by LICI to the region is only 6%. Within NER
share of Mizoram & Tripura share is about 2% each , the percentage share
of Nagaland & Sikkim is about 1% each and the remaining states of the
region share is nil.
On the basis of above analysis, it is concluded that there is an increase
in the total amount of loans advanced to NER upto 2003-04 but after that
there is a huge decline in the amount of loans advanced to NER which is a
matter of concern. While in the advanced states, getting loan for projects
with reasonable feasibility outlook is not a problem and venture capital
funds have mushroomed, this is not true in NER. If term loan is difficult

168
then working capital loan is almost impossible to get. LICI pointed to low
recovery rate as the main obstacle.
Assistance sanctioned and disbursed by LICI to the northeastern
region is shown in the table 5.9(i) & (ii). Analysis was done for the year
1998-99 to 2004-05 as information was not available.
Table 5.9(i) Assistance Sanctioned to Corporate Sector by LIC to NER
` in crore
States/UTs Arunachal
Pradesh Assam
Mani
pur
Megha
laya
Mizora
m
Nagala
nd
Sikk
im
Trip
ura NER India
1998-99 20 0 0 0 0 0 0 0 20 4829.6
1999-00 0 78 0 0 0 0 0 0 78 6810.5
2000-01 0 0 0 0 0 0 0 0 0 10862.3
2001-02 0 0 0 0 0 0 0 0 0 6741.5
2002-03 0 0 0 0 0 0 0 0 0 4341.5
2003-04 0 0 0 0 0 0 50 0 50 27748
2004-05 2 59.3 60 2 0 0 0 1 124.
3 17373.2
Average 3.14 19.61 8.57 0.29 0.00 0.00 7.14 0.14 38.9
0 11243.80
Table 5.9(ii) Assistance Disbursed to Corporate Sector by LIC to NER
` in
crore
States/UT
s
Arunach
al
Pradesh
Assa
m
Manipu
r
Meghalay
a
Mizora
m
Nagal
and
Sikki
m
Tripur
a NER India
1998-99 5.8 0 0 0 0 0 0 0 5.8 4825
1999-00 0 0.4 0 0 0 0 0 0 0.4 5611.4
2000-01 0 0.4 0 0 0 0 0 0 0.4 7090
2001-02 0 0 50 0 0 0 0 205 255 8914.2
2002-03 0 0 0 0 0 0 0 0 0 6205.8
2003-04 0 0 0 20 0 0 0 0 20 15781.6
2004-05 0 32 2 1 0.2 0 8 5.7 48.9 15617.2
Average 0.83 4.69 7.43 3.00 0.03 0.00 1.14 30.10 47.21 9149.31
Source: indiastat.com
Note : LIC's short-term loans/unsecured short-term deposits are excluded.

169
Chart 5.9(i) Assistance Sanctioned to Corporate Sector by LIC to NER
Chart 5.9(ii) Assistance Disbursed to Corporate Sector by LIC to NER
It can be seen from Table 5.9 (i) & (ii) and Chart 5.9 (i) & (ii) that the
assistance sanctioned and disbursed by LICI to corporate secotr to NER .
Asstistance sanctioned by LICI to showed an increasing trend from 1998-
India, 11243.8
Arunachal Pradesh, 3.14
Assam, 19.61
Manipur, 8.57
Meghalaya, 0.29
Mizoram, 0
Nagaland, 0
Sikkim, 7.14
Tripura, 0.14 NER
0.35%
India, 9149.31
Arunachal Pradesh, 0.83
Assam, 4.69
Manipur, 7.43
Meghalaya, 3
Mizoram, 0.03
Nagaland, 0
Sikkim, 1.14
Tripura, 30.1
NER(0.52%), 47.22

170
99 to 1999-00 for two years with ` 20 crores and 78 crores respectively to
the corporate sector. In 1998-99 only LICI sanctioned loans to Arunachal
Pradesh with ` 20 crores and disbursed only ` 5.8 crores and rest of the
northeastern region the corporation neither sanctioned nor disbursed any
loans to the corporate sector. In 1999-00 the corporation only sanctioned
loans to Assam with ` 78 crores and disbursed only ` 0.4 crores in the years
1999-00 and ` 0.4 in the year 2000-01. During the years 2000-01 to 2002-
03 LICI have not sanctioned any loans to the corporate sector in the region.
In the years 2001-02 the LICI disbursed ` 50 crores to Manipur and ` 205
crores to Tripura. In the year 2002-03 the corporation have not disbursed
any loans to the regions. In the year 2003-04 assistance sanctioned by the
corporation was `50 to Sikkim only in the regions and disbursed `20 crores
to Meghalaya. In the years 2004-05 the corporation sanctioned ` 2 crores to
Arunachal Pradesh, ` 59.3 crores to Assam, ` 60 crores to Manipur, ` crores
to Meghalaya, ` 1 crores to Tripura with a total sanctioned amounted to `
124.3 crores to NER. In the years 2004-05 the corporation disbursed ` 32
crores to Assam, ` 2 crores to Manipur, ` 1 crores to Meghalaya, ` 0.2
crores to Mizoram, ` 8 crores to Sikkim and ` 5.7 crores to Tripura with a
total assistance disbursed to corporate sector in the region was ` 47.21
crores. During the seven years of study the average assistance sanctioned to
corporate sector in the region was ` 38.90 crores. When we compare to all
india level on average the NER share is about 0.35% which is very
negligiable amount. Within the NER on average basis Assam share the
highest with 50.42% followed by Manipur share with 22.03%, Sikkim share
with 18.36%, Arunachal Pradesh share with 8.08%, Meghalaya share with
0.73% and Tripura share with only 0.35%. To Mizoram and Nagaland the
corporation have not sanctioned any loan to the corporate sector. As far as
Assistance disbursed to corporate sector by LICI during the seven years the

171
NER received only ` 47.21 crores on average basis. When compared to all
India level on average the NER share is about 0.52% which is very much
negligiable amount. Within the NER on average basis Tripura share the
highest with 30.10% followed by Manipur with 4.69%, Assam share with
4.69%, Meghalaya share with 3%, Sikkim share with 1.14%, Arunachal
Pradesh share with 0.83% and Miroram share with 0.03%. The corporation
have not disbursed any amount to Nagaland. Statewise break-up of
assistance provided by financial institutions reveals considerable
concentration among few developed and large states despite some reduction
during eighties. North-Eastern states have been almost completely neglected
by all financial institutions.
On the basis of above analysis, it is concluded that the performance of
the corporation has been satisfactory but there is need to invest more
controlled funds in infrastructure and social sector as it leads to the growth
of economy and generation of employment opportunities. LICI should also
increase its exposure in investment in the corporate sector as it is less than
the prescribed norms so that it can get better returns. As far as NER is
concerned the corporations have been almost completely neglected. The
assistance provided by LICI reveals considerable concentration among few
developed and large states despite some reduction.
**************************************************