Embed Size (px)
Citation preview

Investment Outlook: December 2019
Investment Outlook
December 2019
2Investment Outlook: December 2019
02 Contents
03 Introduction Soft landing will support share prices
04 Summary by asset class
05 Risk exposure and allocation We are slightly underweighted in equities
06 Macro and other market drivers Reduced recession risks due to soft landing
09 Fixed income investments Return requirements necessitate risk-taking
11 Global equities New record highs despite gloomy economic signals
14 Nordic equities Recovery for cyclical shares
17 Theme: Artificial intelligence – Solving human problems
21 Theme: Forest products – Green growth boosts forest sector
26 Contact information
Contents
3Investment Outlook: December 2019
• Global economic growth is slowing, but we expect a soft landing.
• Stock markets keep climbing due to decreased recession risk, continued low interest rates/bond yields and a lack of alternatives.
• Challenging valuations and muted corporate earnings growth will limit stock market potential, though.
• Areas with their own growth dynamic will benefit – these include digitisation and urgent sustainability-related work.
Introduction Soft landing will support share prices
Growth is decelerating and corporate earnings forecasts are being lowered, but stock markets are climbing to new record highs. This is not entirely easy to understand. All else being equal, it suggests that caution is advisable.
Yet this autumn’s share price gains are supported by a number of positive forces. The international situation is stabilising, with progress in US-Chinese trade talks, bright spots in the Brexit gloom and – especially − central banks that are rushing to rescue growth by means of key interest rate cuts and bond purchases.
This medicine seems to be working. The most recent statistics show signs of positive change. We expect recession to be avoided, due to a soft landing in growth. Meanwhile interest rates and yields will remain low for a long time. Slower growth will of course mean lower earnings increases, but a still fairly bright background situation for the stock market. This year’s sharp share price upturns nevertheless imply that much of the good news is already priced in. This normally limits upside potential and opens the way for price declines. But with investors paying attention to the acronyms TINA (there is no alternative) and FOMO (fear of missing out), the upturn may be justified. Ultra-low interest rates and yields also explain higher valuations, but they make it increasingly difficult to remain optimistic. Share prices may very well keep rising, but the risk picture should make prudent investors cautious. At present, we are operating on the basis of this principle, with equities making up a proportion of our portfolios that is somewhat below neutral.
In times of slower growth in the world economy, there is reason to look for areas where growth and earnings are driven by internal dynamics, where society is undergoing changes. The increased urgency of dealing with sustainability issues should also influence investment decisions, including those of a purely financial nature as capital flows are redirected. The above reasoning affects our choice of theme articles in this issue of Investment Outlook. We examine artificial intelligence (AI) – part of today’s powerful digitisation trend − and take a close look at the forest product industry, focusing on its sustainable qualities and especially on the use of forest-based raw materials as alternatives to plastics, concrete and other environmental villains. Digitisation and a focus on sustainability are trends that will continue to reshape our society for many years. Their potential for good investment returns is an added benefit.
Wishing you enjoyable reading, Kai Svensson, Acting Chief Investment Officer Johan Hagbarth, Economist Investment Strategy
4Investment Outlook: December 2019
Nordic equities
• A strong recovery for cyclical shares in recent months.• Continued historically high discounts on cyclical shares
compared to defensive shares.• So far, lower rates and yields have only had a visible
impact on portions of the stock market. • Keep an eye out for green stimulus packages.
Return expectations, %, next 12 months (SEK)
Equities Return Risk
Advanced economies 7.0% 13.8%
Emerging markets (local currencies) 7.7% 14.2%
Sweden 8.0% 14.7%
Fixed income investments Return Risk
Government bonds -0.3% 1.3%
Corporate bonds, investment grade (Europe, IG)
2.1% 3.3%
Corporate bonds, high yield (Europe/US 50/50, HY)
3.0% 4.2%
Emerging market debt (local currencies, EMD)
6.7% 8.0%
Alternative investments Return Risk
Hedge funds 3.5% 6.0%Source: SEB, forecasts Nov 2019
Fixed income investments
• Bond yields are rebounding after a year-long downward trend.
• The ECB delivered a less stimulative message than expected.
• The Federal Reserve delivered the interest rate cuts that had been priced in.
• Sweden’s Riksbank surprised markets by signalling a key rate hike to zero in December.
• Corporate credits are preferable to government and mortgage-backed bonds, given low absolute returns.
• Balance between supply and demand, limited company defaults and good capacity to pay interest costs.
• Emerging market debt (EMD) is benefiting from improved government finances (current account balances) and lower inflation.
Alternative investments
• Clear fixed income and stock market tendencies will pro-vide support for trend-following hedge fund strategies.
• Stock market volatility will create potential for equity long/short hedge funds.
• The central banks’ policy U-turn will create some difficul-ties for macro fund managers.
• Most hedge fund managers are generating absolute returns, though to varying degrees.
Thanks to accommodative central banks and indicators signal-ling that economic conditions are close to bottoming out, the mood in the investor community has improved this past quarter.The probability of a no-deal Brexit (British withdrawal from the European Union) has decreased, and the US and China seem to be moving towards a Phase 1 agreement in their trade conflict. Rising long-term yields and a steeper yield curve are confirming a turnaround in the negative macroeconomic trend. Share pric-es are sharply higher, with the upturn being led by the cyclical sectors of the stock market. Against all odds, the MSCI World Index is up 20 per cent in local currencies this year, despite non-existent corporate earnings growth.
The trend of revisions in analysts’ earnings forecasts has been negative all year and seems unlikely to rebound yet. We also as-sume that earnings forecasts for 2020 will need to be adjusted lower. Current stock market valuations thus look too high.
Global equities
• Stock markets are reaching new record highs despite weak macroeconomic statistics and gloomy purchasing managers.
• The quarterly corporate report period has surprised on the upside, compared to low expectations.
• Shares of cyclical companies have surged higher.• Better economic conditions are largely discounted, limit-
ing short-term upside stock market potential.
Summary by asset class
Investor positioning is more aggressive than for a long time, and the proportion of cash holdings has fallen. Safe bonds have been sold and replaced with riskier investments. Various sen-timent indicators point towards ever-increasing greed among investors who are afraid of missing out on the stock market rally. High valuations and greater willingness to take risks − as well as an economic recovery that has not yet been confirmed − are reasons why we are slightly underweighted in equities.
There are few alternatives to equities, since investors must accept a greater or lesser degree of risk in order to earn positive returns. We are supplementing equities with carefully balanced corporate credit portfolios in which we have relative-ly short duration holdings, as well as hedge funds with different management styles and strategies, in order to optimise our risk-adjusted returns.
5Investment Outlook: December 2019
Real economic performance and stock market performance do not always go hand in hand. Their divergence has been especially wide during the past two years. Corporate earnings were fantastic in the US during 2018, when tax cuts coupled with generally strong economic conditions contributed to a 22 per cent surge in the after-tax earnings of S&P 500 companies. That same year, the S&P 500 index fell by 5 per cent after a dismal year-end. In 2019 we expect a marginal increase in profits for the same companies. Earnings forecasts have been gradually adjusted downward during the year, while share pric-es have climbed − resulting in a sizeable expansion in multiples. Valuations are thus at historically high levels.
So far, 2019 has been a fantastic year for both equities and bonds, but the starting point was low because of the stock market slide at the end of 2018. The MSCI World Index in local currencies is up 20 per cent this year, while a broad bond index in local currencies is up more than 6 per cent. Late in the summer, long-term yields reached their low point. Since then they have rebounded sharply, causing government bonds to fall in value. Higher-risk corporate bonds have performed better, thanks to narrower yield spreads between corporate credit bonds and government bonds. The narrower gap has compen-sated for the general upturn in yields.
The stock market has interpreted the turnaround in bond yields and the steeper yield curve as signs of an approaching eco-nomic improvement. Cyclical sectors have been the best stock market performers since the summer, while defensive sectors have lagged behind. Since large portions of the fixed income market consist of bonds with negative or only marginal yields,
investors have gradually shifted to stable, bond-like companies in the stock market, so-called bond proxies. These companies are found in sectors like electricity, water and gas distribution, consumer staples and real estate. This trend has been under way ever since the financial crisis a decade ago, and the valu-ation gap against volume-dependent cyclical companies has thus had time to widen. The valuation gap has narrowed but remains historically wide. Compared to the date of our previous Investment Outlook (September 2019), the price-earnings ratio of the defensive company Nestlé has fallen from 25 to 23, while that of the cyclical Caterpillar has climbed from 10 to 13.
We believe that the recession risk is lower than before, partly due to the resolute action of the US Federal Reserve. Yet we are adjusting our global growth forecast lower, along with our corporate earnings forecast. Meanwhile share prices have surged to historically high valuations, but low interest rates are a mitigating factor when we assess stock market valuations.
Overall, we think that the stock market has moved ahead of events and is excessively optimistic. Low interest rates and yields are one reason why we are only slightly underweighted in equities. Within equities, we have also increased the propor-tion of low-valued companies and decreased the proportion of high-valued companies. We have reduced our regional exposure to the US and Europe, while we have increased the proportion of emerging market equities, mainly for valuation reasons. Our fixed income exposure is dominated by corporate bonds with short maturities, since we believe that risk-taking on longer maturities is not worthwhile. In addition, we have a broad portfolio of alternative investments that balance our risk.
Risk exposure and allocation We are slightly underweighted in equities
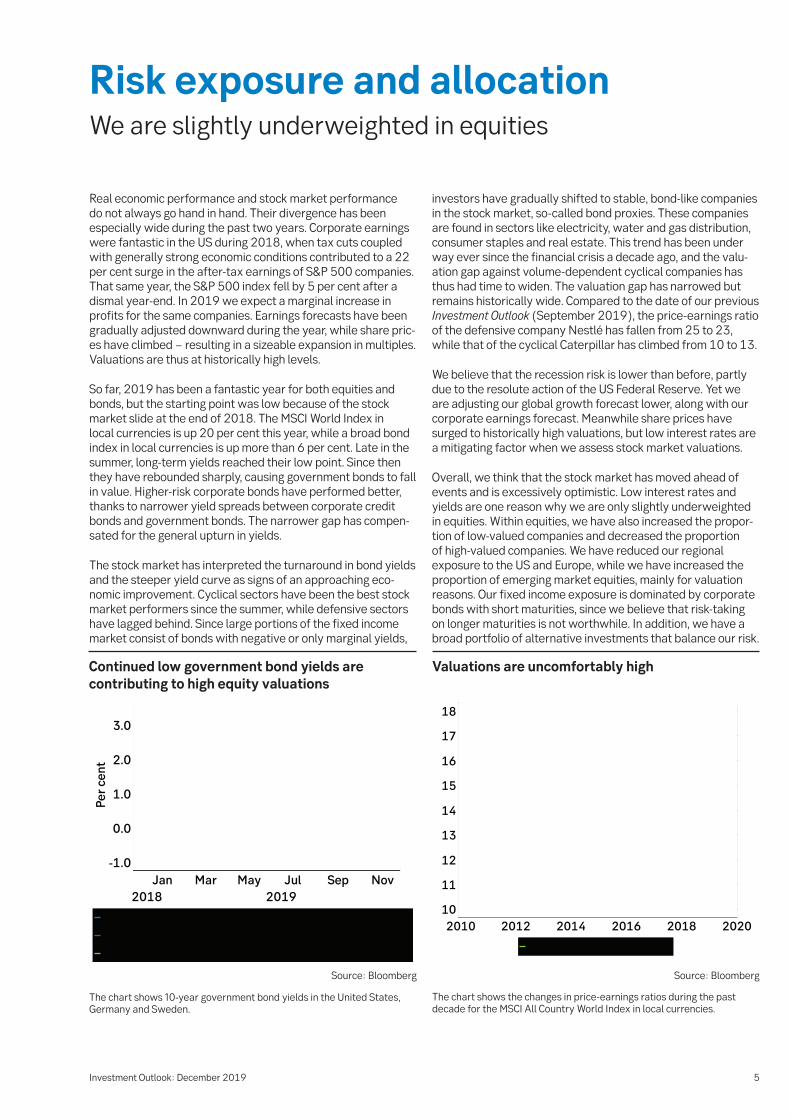
The chart shows 10-year government bond yields in the United States, Germany and Sweden.
Source: Bloomberg
Valuations are uncomfortably high
The chart shows the changes in price-earnings ratios during the past decade for the MSCI All Country World Index in local currencies.
Source: Bloomberg
Continued low government bond yields are contributing to high equity valuations
6Investment Outlook: December 2019
Macro During 2019 the world economy has been characterised by a slowdown, led by the manufacturing sector − among other things via a downturn in global trade due to the US-Chinese trade war. The auto industry and parts of the technology sector, especially the semiconductor industry, have also con-tributed to the slowdown. The auto industry is facing a major shift as legal requirements and the demand situation change the playing field by increasing the focus on fossil-free fuels. As for the semiconductor industry, the slowdown is likely to be explained by a maturing and partially saturated market for such products as mobile phones in China.
All of this has also contributed to a faster deceleration than we had previously expected in the Chinese economy, as well as in some other countries in the emerging market (EM) sphere that are sensitive to volume changes in global trade, given their large export dependence. During the autumn, there was growing concern that manufacturing sector weak-ness would also pull down the service sector. As purchasing managers’ indices (PMIs) for the manufacturing sector fell towards recession levels − in Germany they have reached it − we have also seen a clear slowdown in the service sector, which has fuelled worries about a more significant decelera-tion in the overall economy.
However, the very latest economic signals indicate a levelling out, or even a cautious increase in momentum. So far, this is most clearly visible in the manufacturing sector PMIs of var-ious EM countries as well as in the US, especially in the order bookings sub-index, but the latest service sector PMI in the US also showed positive movement.
Active monetary policy is probably also contributing to this trend. The US Federal Reserve (Fed) has cut its key interest rate three times since July. The Fed has clearly signalled that this shift in monetary policy should not be viewed as the beginning of a lengthy rate-cutting cycle, but as a “mid cycle correction”. The Fed did the same thing in 1995 and 1998 when the economy showed signs of weakness. On those occasions the outcome was considered good; the period of economic growth was prolonged, which appears likely to happen this time around as well.
In addition to the Fed, the European Central Bank (ECB) has also provided stimulus measures, both by once again mar-ginally lowering its already negative key interest rate and by resuming its bond purchases. Various other central banks have also cut interest rates this year, especially among the EM countries. Although Sweden’s Riksbank is signalling a December key interest rate hike to zero, after that it does not plan to change the key rate for a long time.
Aside from central banks rushing to the rescue during the growth slump, some of the other economic storm clouds have also been dispersed, or at least thinned out. Both the auto and semiconductor sectors appear close to bottoming out, al-though the mood of the latter is significantly more optimistic. Worries about Brexit have also receded, at least temporarily during the current extension of the United Kingdom’s with-drawal date, but somewhat greater willingness to seek new solutions is also reducing the risk of a no-deal withdrawal (“hard Brexit”).
Macro and other market driversReduced recession risks due to soft landing
GDP forecasts, year-on-year percentage growth
Market 2018 2019 2020 2021 Comments
United States 2.9 2.2 1.7 1.9 Resource shortages will slow growth, but no recession.
Japan 0.8 1.2 0.7 0.5 Structural headwinds will squeeze growth.
Germany 1.5 0.5 0.6 1.1 Weak manufacturing, but the bottom may be past.
China 6.6 6.1 5.7 5.9 Stimulus and trade progress will provide support.
United Kingdom 1.4 1.3 1.4 1.5 Bright spots in Brexit gloom, but uncertainty persists.
Euro area 1.9 1.0 1.1 1.3 Sluggish exports, but ECB stimulus is helping.
Sweden 2.4 1.2 1.2 1.7 Hesitant industry and households, fiscal stimulus.
Baltic countries 4.2 3.4 2.3 2.4 Growth is decelerating.
OECD 2.3 1.6 1.4 1.6 Central banks, EM and consumers are helping a bit.
Emerging markets 4.7 4.0 4.2 4.5 Taking off after their slump.
World, PPP* 3.6 2.9 3.0 3.3 Economic soft landing, decreased recession risks.Source: OECD, IMF, SEB *Purchasing power parities
7Investment Outlook: December 2019
Progress in trade talks Also important to the optimistic mood is that we have seen what can be described as fairly clear progress in the US-China trade talks, illustrated by both sides saying they are close to a “Phase 1” agreement. Although this is one step along the way, the issues are large and complex. A more definitive solution is likely to take a long time, if it is ever achieved. But at least the two sides seem to have become considerably more careful about making aggressive declarations and threats that scare businesses, consumers and financial markets. This more cau-tious attitude is probably driven by concerns that the impact of the trade conflict on economic growth has been bigger than many observers, including us at SEB, had anticipated. It is also partly driven by political considerations, especially the immi-nent US election year. The risk of disruptive actions persists but hopefully has decreased.
Strong labour markets With fewer dark clouds in the sky, let us look at the underlying growth forces: supply and demand in the real economy. The strong labour market trend is continuing in more advanced economies. Unemployment is at a 40-year low and although the decline has levelled off, so far we see no signs of a trend reversal. Labour shortages in parts of the economy are affect-ing growth potential, especially in the US where we expect a continued deceleration in growth. However, we do not expect this slowdown to be so powerful that it becomes an outright recession. Driven by such factors as the long period of good economic conditions and continued low interest rates, efforts to bring back people who previously chose to leave the labour market appear likely to succeed. This will improve the growth dynamic.
In recent months, the trend toward slightly accelerating pay increases has somewhat surprisingly stopped. This strength-ens our belief that inflation will remain at levels just below central bank targets of around 2 per cent, thereby keeping interest rates low. Strong labour markets, low interest rates and rising asset prices suggest continued robust demand from households. However, their willingness to consume is not quite as strong as economic conditions indicate. Instead, the household savings ratio has increased somewhat.
Slower pace of business investment Businesses have responded to the recent slowdown, greater political uncertainty and subdued consumer behaviour by decreasing their pace of investment. Due to a lower economic growth rate ahead, demand will not increase so rapidly that large investments will be required. On the other hand, com-pany margins are at healthy levels, and the corporate sector is in generally good shape, at least as long as continued low interest rates offset the cost effects of increased borrowing.
Better growth in 2020-2021 All in all, the continued slowdown this autumn has led us to lower our growth forecasts for this year and next even fur-ther, mainly due to slower growth in the EM sphere. We now expect the world economy to grow by 2.9 per cent this year and by 3.0 per cent in 2020 and then speed up a bit to 3.3 per cent in 2021.
As mentioned, the US slowdown will continue. Growth will fall to less than 2 per cent, which is below average but not an outright recession. In Europe, growth is projected to stabilise at just over 1 per cent and eventually turn up slightly. Mean-
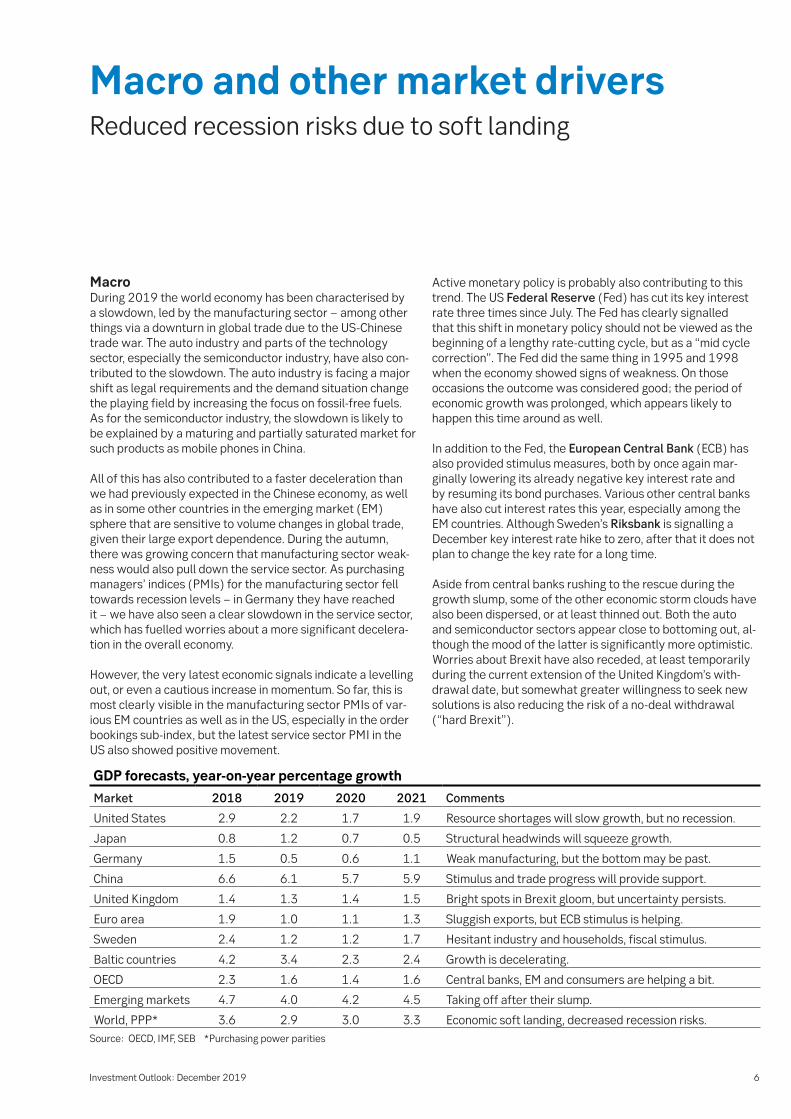
Global manufacturers are leading the deceleration
The chart shows that the purchasing managers' index for the manufac-turing sector has decelerated significantly in the past year, driven by such factors as worries about the international trade situation and led by Germany. The service sector has been more resilient but has weakened. The latest statistics provide hope for a rebound, however.
Source: Macrobond
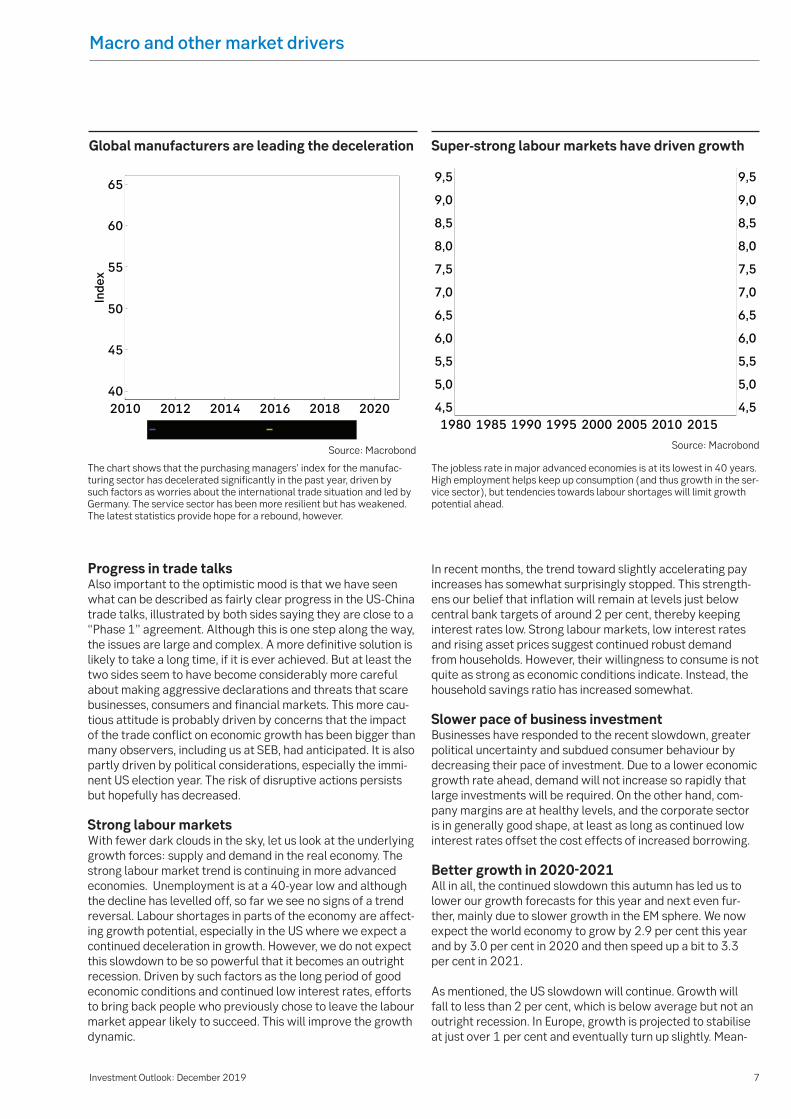
The jobless rate in major advanced economies is at its lowest in 40 years. High employment helps keep up consumption (and thus growth in the ser-vice sector), but tendencies towards labour shortages will limit growth potential ahead.
Source: Macrobond
Super-strong labour markets have driven growth
Macro and other market drivers

8Investment Outlook: December 2019
while the EM sphere, after bottoming out at 4 per cent growth this year, will accelerate significantly over the next couple of years.
High but justifiable valuations Today’s historically low interest rates make valuation param-eters difficult to interpret. Because of the increased presence of central banks in the fixed income market via quantitative easing and their extremely low key rates, interest rates and bond yields are artificially low. When analysing equities, com-panies' cash flows are discounted by a risk premium and a risk-free interest rate. All else being equal, projected earnings are thus higher when interest rates fall.
Price-earnings (P/E) ratios are historically high. In theory, however, today's P/E ratios can be justified by low interest rates if the risk premium is left constant. But this assumes that future earnings will be about as expected. Our assess-ment is that consensus forecasts of the corporate earnings trend for 2020 are too high. This is one reason why we are now slightly underweighted in equities.
In the fixed income market, valuations are higher for safe securities such as government bonds, while valuations are lower further out on the risk curve. The general spread between high-yield bonds and risk-free securities is currently below 5 percent. We have chosen to position ourselves with low interest rate risk and high, but balanced credit risk.
Macro and other market drivers
Historically high risk appetite Risk appetite has increased during the past quarter and is at historically high levels. Risk appetite is determined by the strength and breadth − as well as the momentum − of the stock market, the relationship between buy and sell options, volatility, demand for safe assets such as government bonds and demand for junk bonds. We can note that investors are selling holdings in safer (and more expensive) geographic stock markets such as the US and increasing their weight in Europe and emerging markets, which have a higher correla-tion with economic growth. They are buying into cyclically sensitive sectors while phasing out defensive positions. Mon-ey is moving from the bond market and cash into the stock market. Investors are again overweighted in equities. The reasoning behind this increased risk appetite is lower risk of a no-deal Brexit, reduced trade friction between the US and China, steepening yield curves and a quarterly report period that was not as bad as the market had feared.
Aggressive positioning a negative factor We believe that aggressive positioning by the investor com-munity is generally negative. Any reversals in the economic cycle or in trade talks will then hurt risk assets more. High risk appetite and aggressive positioning are contributing to our cautious view of risk assets.
9Investment Outlook: December 2019
After sharp declines earlier this year, long-term yields and interest rates have now turned upward, although they are still historically low. With low or even negative expected returns for government bonds, investors must look to instruments further out on the risk scale for return potential.
We prefer credits (corporate bonds) with a higher risk to government bonds and corporate bonds with a lower risk. Investments in emerging markets are also attractive.
Government bonds (excl emerging markets)
Somewhat more positive signals in the US-China trade war, less likelihood of a hard Brexit and economic data that admit-tedly signal decelerating economic growth but also a lower chance of recession have all contributed to higher yields during the autumn.
The fact that central banks have provided less stimulus than market players had expected has also pushed government bond yields higher. The European Central Bank (ECB) cut its deposit rate to -0.5 per cent and announced that it would resume its bond purchases; the market had expected more.
Since the announcement, expectations of future rate cuts have decreased. The ECB’s Governing Council is also appar-ently divided over the effects of further monetary stimulus measures. In our view, any disagreement mainly concerns the bond-buying programme, and we are sticking to our forecast that the ECB will lower its key rate next March to -0.60 per cent.
The US Federal Reserve (Fed) lowered its key interest rate to a range of 1.5-1.75 per cent. The cut was expected; what surprised the market was that the Fed’s forecasts now indicate no further rate cuts. Our forecast is one more cut in January, after which rates will remain unchanged.
Central banks that have gone against the tide are Norges Bank, which hiked its key interest rate, and Sweden’s Riks-bank, which is still indicating a planned hike to 0 per cent in December. The fact that the Riksbank is sticking to a rate hike despite low inflation and worse economic prospects surprised the market, with yields rising as a result. The Riksbank is clear, however, that after a potential hike in December, it will not touch its key rate for several years.
All in all, the market does not expect such strong stimulus measures going forward, and investors have to some extent started to question how much lower interest rates and yields can go. However, after the recent upswing in the government securities market, our view is that there is still room for yields to fall from current levels.
Fixed income investmentsReturn requirements necessitate risk-taking
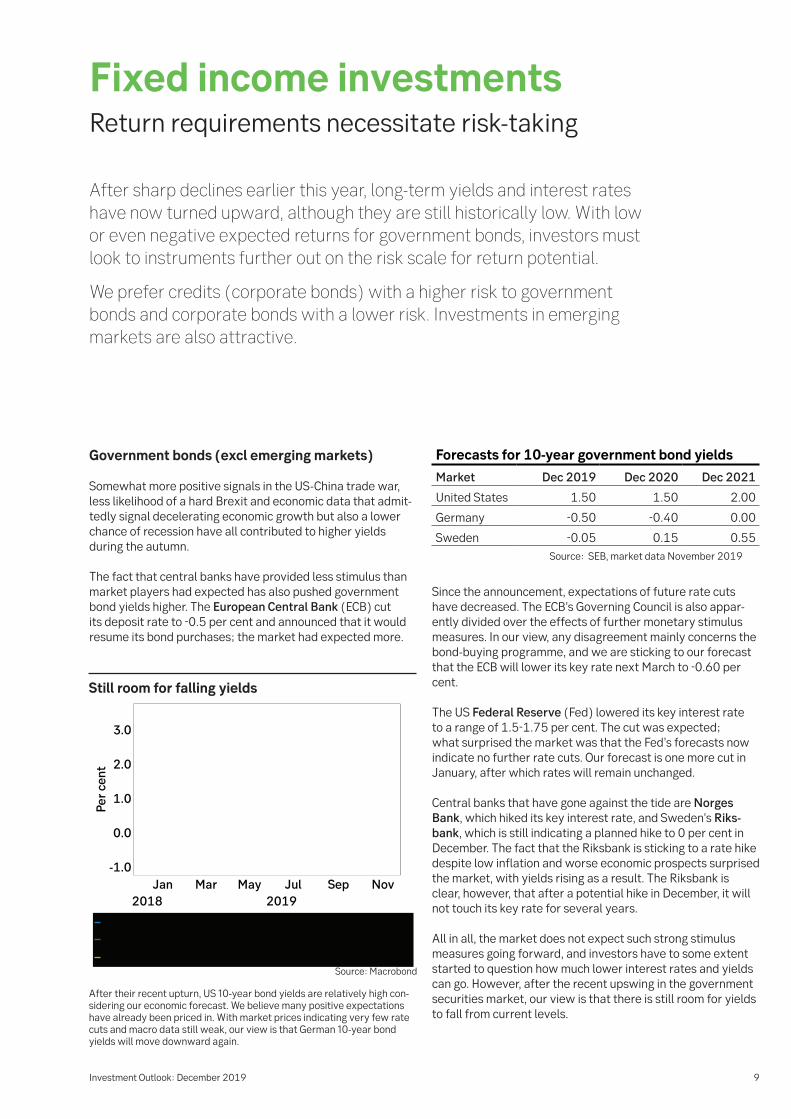
Still room for falling yields
After their recent upturn, US 10-year bond yields are relatively high con-sidering our economic forecast. We believe many positive expectations have already been priced in. With market prices indicating very few rate cuts and macro data still weak, our view is that German 10-year bond yields will move downward again.
Source: Macrobond
Forecasts for 10-year government bond yields
Market Dec 2019 Dec 2020 Dec 2021
United States 1.50 1.50 2.00
Germany -0.50 -0.40 0.00
Sweden -0.05 0.15 0.55 Source: SEB, market data November 2019
10Investment Outlook: December 2019
Corporate bonds – Investment grade (IG) and high yield (HY) Despite fears of deteriorating global economic growth, corpo-rate bonds have had a somewhat stable performance lately. However, returns have been mixed, as bonds with better credit quality (investment grade) have performed somewhat worse than bonds with lower credit quality (high yield).
The default rate on bonds is low, companies have good interest coverage on their debt, and investors are looking for higher returns, which are three factors offsetting negative economic signals. During this lengthy period of low yields and interest rates, many companies have taken the opportunity to extend their bond maturities and thus reduce interest expenses, which is beneficial. The credit ratings agency Moody’s expects the de-fault rate to remain low (2.6 per cent) for the rest of the year and then rise to 3.6 per cent in 2020, given the growing share of companies with a negative market outlook combined with a weak macro picture and trade war concerns.
Because of the low-yield environment, many investors are moving out of government and mortgage-backed bonds into safer corporate bonds in order to get higher returns. Higher demand for investment grade bonds, together with the fact that the ECB is also a buyer through its bond purchasing pro-gramme, may further squeeze investment grade bond yields. The upturn in yields over the past month implies higher running yields and the chance of higher bond prices if interest rates and yields fall somewhat, which is our view.
We expect high yield and investment grade bonds to generate better returns than government bonds, although the low-yield environment and narrow yield spreads will to some extent limit return potential. However, changes in yields will have less im-pact on high yield bond prices, although this is the fixed income market segment that is generating relatively good returns in absolute terms. Stimulative central bank monetary policies support this picture for credits − given lower funding costs for companies − although the effects are now more limited than earlier this year. However, we are closely following the trend in yield gaps and default rates and will change the allocation and our recommendations if we believe the risk is becoming too high.
Emerging market bonds More stable government finances in terms of better current account balances and lower inflation have lessened the financial vulnerability of many emerging markets. Despite numerous interest rate cuts in 2019, yields and interest rates in many emerging markets are still much higher than in developed markets, which makes good running returns possible. There are prospects of further rate cuts in a number of emerging markets, which can lead to higher bond prices in those countries. The fact that the Federal Reserve and other central banks are providing stimulus should be beneficial for emerging market (EM) assets for a while longer. Risks include political risk/protectionism and potential investor risk aver-sion. Uncertainty about exchange rate forecasts for emerging market currencies is both a risk and an opportunity.
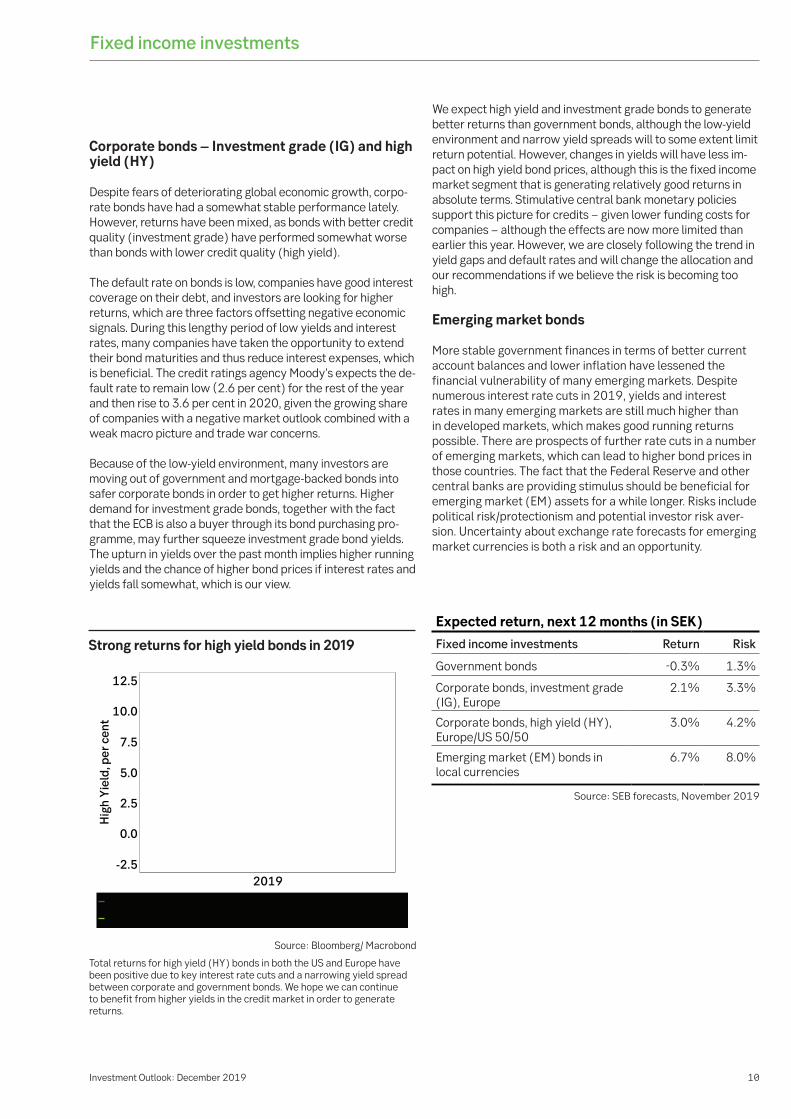
Strong returns for high yield bonds in 2019
Total returns for high yield (HY) bonds in both the US and Europe have been positive due to key interest rate cuts and a narrowing yield spread between corporate and government bonds. We hope we can continue to benefit from higher yields in the credit market in order to generate returns.
Source: Bloomberg/ Macrobond
Fixed income investments
Expected return, next 12 months (in SEK)
Fixed income investments Return Risk
Government bonds -0.3% 1.3%
Corporate bonds, investment grade (IG), Europe
2.1% 3.3%
Corporate bonds, high yield (HY), Europe/US 50/50
3.0% 4.2%
Emerging market (EM) bonds in local currencies
6.7% 8.0%
Source: SEB forecasts, November 2019
11Investment Outlook: December 2019
Stock markets have reached new record highs despite weak macroeconomic statistics and gloomy purchasing managers in manufacturing. The third quarter report period offered upside surprises compared to low market expectations. This has been enough to boost stock markets. A positive mood prevails in financial markets for the moment, but valuations are challengingly high.
New rate cuts have helped sustain equities During the year, the fixed income market has signalled dete-riorating economic conditions via sharply falling long-term yields. The downward trend hit bottom in late summer, when long-term yields in the US, Germany and Japan turned upward in unison. The US Federal Reserve (Fed) has provided stimulus via key interest rate cuts and some expansion in its balance sheet on shorter maturities. The European Central Bank (ECB) has further cut its deposit rate and provided new quantitative easing. The US yield curve (the spread between government and corporate bond yields), which inverted in August − when the yield on 10-year government bonds was lower than the yield on 2-year bonds for the first time since 2007 − has now resumed its positive slope. The bond market is thus signalling a lower risk of recession. Fund managers have subsequently reacted by selling safe assets in the form of government bonds and buying risky assets such as equities.
Upswing for cyclicals, squeeze on banks Cyclical companies have experienced a substantial upswing. Banks, semiconductor companies and industrials have led the way in this upturn since the summer. The upturn in the bank-ing sector is related to the steeper yield curve, which makes it easier for traditional banking operations to earn money – taking short-term deposits and making longer-term loans. However, the banking sector will continue to struggle with profitability, especially in the euro area, since new loans are less profitable than old ones that are gradually maturing. In other words, the battered European banking sector will have to continue focusing on cost-cutting to bolster profits.
Recovery for semiconductor companies Semiconductor companies, which are a highly cyclical con-sumer-related sector, have been in an interim phase after building up inventories. Earnings in the sector fell during the
Global equitiesNew record highs despite gloomy economic signals
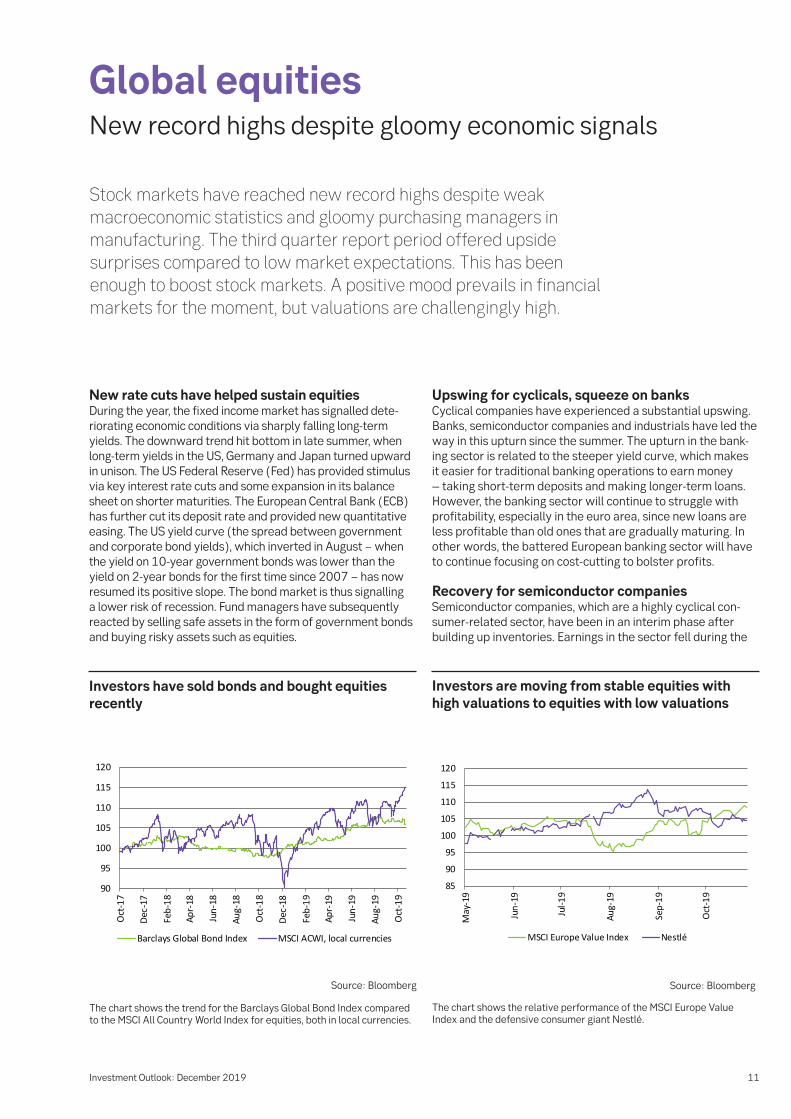
Investors have sold bonds and bought equities recently
The chart shows the trend for the Barclays Global Bond Index compared to the MSCI All Country World Index for equities, both in local currencies.
90
95
100
105
110
115
120
Oct
-17
Dec-
17
Feb-
18
Apr-
18
Jun-
18
Aug-
18
Oct
-18
Dec-
18
Feb-
19
Apr-
19
Jun-
19
Aug-
19
Oct
-19
Barclays Global Bond Index MSCI ACWI, local currencies
Source: Bloomberg
Investors are moving from stable equities with high valuations to equities with low valuations
Source: Bloomberg
The chart shows the relative performance of the MSCI Europe Value Index and the defensive consumer giant Nestlé.
85
90
95
100
105
110
115
120
May
-19
Jun-
19
Jul-1
9
Aug-
19
Sep-
19
Oct
-19
MSCI Europe Value Index Nestlé
12Investment Outlook: December 2019
latest quarter, but reports were far better than expected, and companies are publishing positive outlooks. Meanwhile inventories are gradually shrinking. Leading companies such as Intel and Taiwan Semiconductors exceeded earnings fore-casts by a wide margin, confirming the picture of a recovery. Semiconductors are a crucial component in the new digitised world we have entered at breakneck speed. This boosts their popularity among investors.
Traditional industrials have also performed well in stock markets despite decelerating economic growth and cautious outlooks. Early-cyclical industries such as trucks and passen-ger cars are showing weakness, but this is offset by other manufacturers that have managed to maintain sales and order bookings relatively well. In the traditional sectors that have turned in strong performances recently, these results are explained by a normalisation of the risk premium rather than by upward-revised forecasts of long-term earnings and cash flows.
Apple is buying back shares The American IT giants – Apple, Microsoft, Facebook and Alphabet (Google) – have picked up steam as usual. Of the four, Apple has performed best this year. Operations are chugging along, while the company’s share price has also been boosted by share buybacks as it uses its swelling cash reserves to acquire its own shares. During the first three quar-ters of 2019, Apple bought back about USD 18 billion worth of shares per quarter. Microsoft and Facebook shares have also climbed sharply this year, while Alphabet has performed in line with the broad S&P 500 index. The trend has been a bit more sluggish for Amazon and Netflix. Amazon is entering an investment phase, which is keeping down profitability, while Netflix has been forced to battle strong new competitors in the form of Apple and Amazon, which have joined the stream-ing market.
Cyclical instead of defensive shares The sector rotation from defensive to cyclical stocks has been aggressive and kick-started in connection with the bottom-ing out of long-term yields in late August. Interest in cyclical companies with low valuations, which had been tepid for a decade, has reignited. Reliable non-cyclical companies with challenging valuations have served as a source of funding. The rotation has gone quickly and the movement has been sharp, so the rotation will probably take a breather in the short term while awaiting better economic figures. Howev-er, in the long term, the valuation spread should continue to narrow.
Imbalance between market and economic trends There is an unusually large imbalance between the general economic trend and the stock market trend, which has per-plexed investors. One clear example of this is Germany’s DAX equity index, which has performed strongly recently despite falling industrial production. The main purchasing managers’ index for the US manufacturing sector is signalling contrac-tion while the stock market is setting new records. There is a clear correlation between economic data and corporate earnings. There is also a correlation between earnings and stock markets over time, but since the market discounts future earnings, there are time lags. The stock market has currently priced in an economic recovery, which is reflected in higher share prices.
To confirm the positive stock market trend, we need to see an improved real economy. US corporate earnings have shown virtually zero growth three quarters in a row, and European
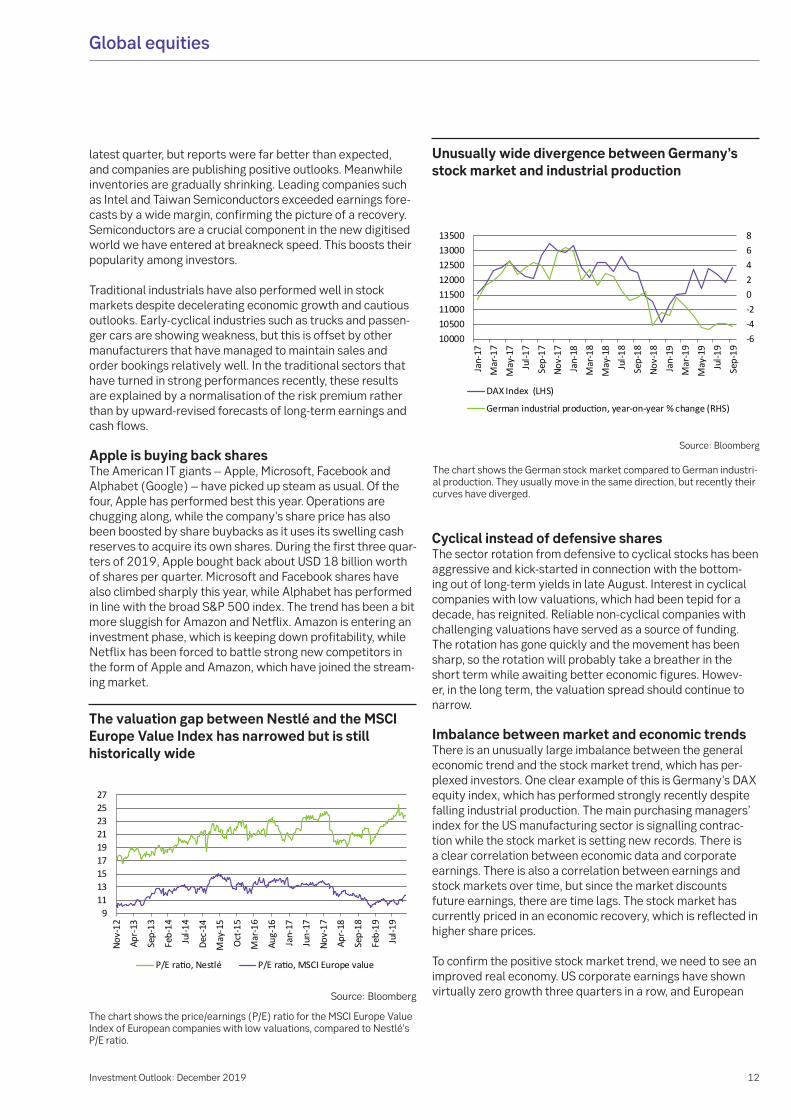
The valuation gap between Nestlé and the MSCI Europe Value Index has narrowed but is still historically wide
The chart shows the price/earnings (P/E) ratio for the MSCI Europe Value Index of European companies with low valuations, compared to Nestlé’s P/E ratio.
9111315171921232527
Nov-
12
Apr-
13
Sep-
13
Feb-
14
Jul-1
4
Dec-
14
May
-15
Oct
-15
Mar
-16
Aug-
16
Jan-
17
Jun-
17
Nov-
17
Apr-
18
Sep-
18
Feb-
19
Jul-1
9
P/E ratio, Nestlé P/E ratio, MSCI Europe value
Source: Bloomberg
Global equities
Unusually wide divergence between Germany’s stock market and industrial production
The chart shows the German stock market compared to German industri-al production. They usually move in the same direction, but recently their curves have diverged.
-6-4-202468
1000010500110001150012000125001300013500
Jan-
17M
ar-1
7M
ay-1
7Ju
l-17
Sep-
17No
v-17
Jan-
18M
ar-1
8M
ay-1
8Ju
l-18
Sep-
18No
v-18
Jan-
19M
ar-1
9M
ay-1
9Ju
l-19
Sep-
19
DAX Index (LHS)
German industrial production, year-on-year % change (RHS)
Source: Bloomberg
13Investment Outlook: December 2019
earnings have shown negative growth during the same peri-od. Taking into account our relatively positive economic out-look, we expect earnings to increase moderately next year, due to low comparative figures and a somewhat stronger real economy.
Valuations limit potential upside That should be sufficient to justify today’s share prices given low interest rates and yields, but the potential upside is limit-ed due to valuations. We believe the aggregate consensus of analysts’ earnings growth forecasts for 2020 of 10 per cent is too high. However, few fund managers have such optimistic earnings forecasts, which should soften the impact on the stock market of downward earnings revisions.
Conclusion In the near term, the stock market appears to be overly optimistic. Sentiment has shifted from pessimistic to highly optimistic in the course of a few months. This is reflected in pricing mechanisms and relative price movements via the relationship between buy and sell options, the strength and breadth of the stock market rally, volatility and demand in dif-ferent bond market segments. It therefore looks like a stock market correction is in the cards. A better economy has large-ly been priced in, which limits upside stock market potential in the near term. For tactical reasons, we thus recommend a smaller proportion of equities than usual.
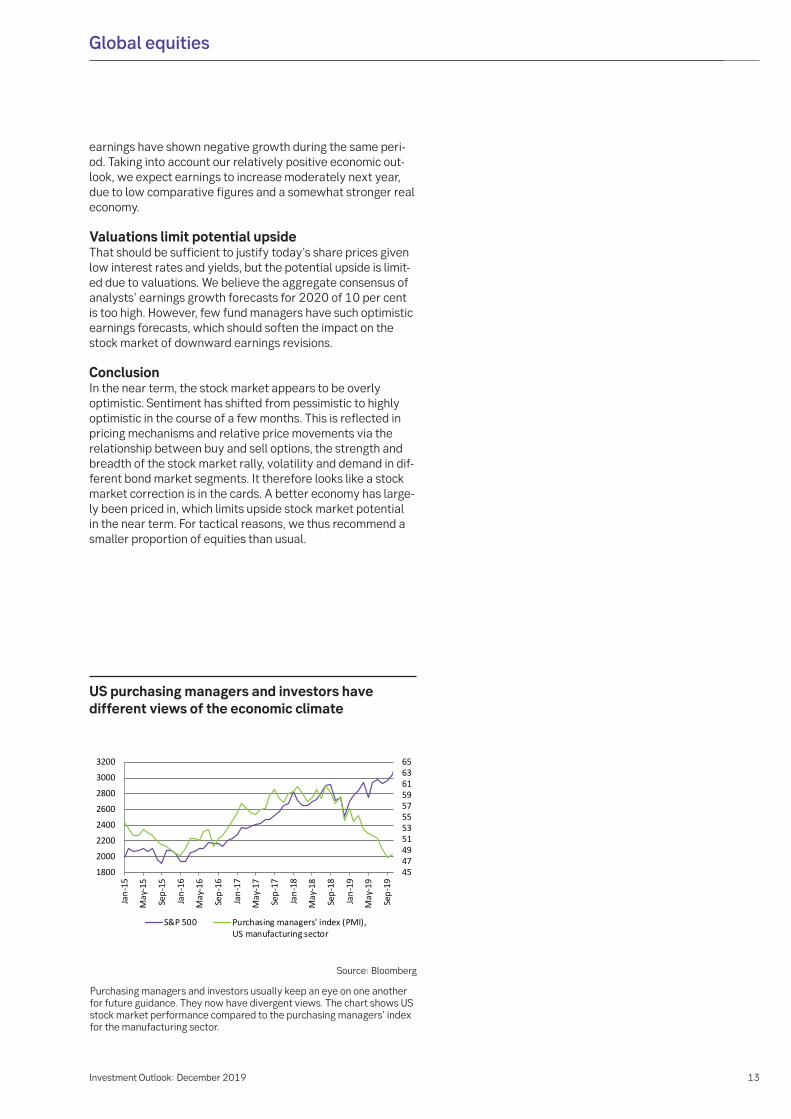
US purchasing managers and investors have different views of the economic climate
Purchasing managers and investors usually keep an eye on one another for future guidance. They now have divergent views. The chart shows US stock market performance compared to the purchasing managers’ index for the manufacturing sector.
4547495153555759616365
1800
2000
2200
2400
2600
2800
3000
3200
Jan-
15
May
-15
Sep-
15
Jan-
16
May
-16
Sep-
16
Jan-
17
May
-17
Sep-
17
Jan-
18
May
-18
Sep-
18
Jan-
19
May
-19
Sep-
19
S&P 500 Purchasing managers' index (PMI),US manufacturing sector
Source: Bloomberg
Global equities
14Investment Outlook: December 2019
The stock market trend in recent months has been characterised by a strong recovery for cyclical shares. Is this a backlash or the start of a trend reversal? One crucial driver behind the recovery is that hope of a mild deceleration in economic growth has been sparked − with the US-Chinese trade war potentially nearing resolution, while the downturn in leading indicators has slowed. Valuations of the most cyclically sensitive companies are still far lower than those of the least sensitive companies. Low yields and interest rates continue to prop up the stock market, but any setbacks in trade talks could quickly suppress risk appetite again.
The past three months have been characterised by a clear recovery for cyclical shares, and many defensive shares have slumped or consolidated. However, this recovery comes after more than a year and a half of an extremely weak relative share price trend, the worst period since the financial crisis of 2008-09. We find some historical support to suggest that this kind of sharp reaction in the opposite direction of what was previously an extended trend can continue for much longer than three months. Alongside the extreme rotation out of cy-clical stocks that probably peaked in August this year, similar sharp movements were also noted in 2009, when investors sold in panic after Lehman Brothers collapsed, and in 2016, when they were worried about the combination of plunging oil prices and a rapidly decelerating downturn in Chinese manufacturing in 2014-16. However, the rotation in conjunc-tion with the euro crisis and subsequent recovery was more prolonged and flat. Naturally, an identical repetition is unlike-ly, but the current situation is more reminiscent of 2016 than of the euro crisis or financial crisis. In our view, the positive relative share price trend for cyclical stocks since September marks a trend reversal. We continue to prefer industrials and commodities over defensive sectors such as real estate and consumer staples.
Stock market upturn driven by interest rates and yields The dramatic decline in interest rates and yields over the past decade has been vital to the stock market upturn. Both the VINX Nordic index and the Stockholm exchange index have surged nearly 190 per cent over the past ten years, in terms of Swedish kronor. Along with the US-China trade war, the rise in US interest rates in 2018 was a crucial factor in the weak stock market performance of late last year. This year, interest rates and interest rate expectations have fallen significantly, which is also the most important reason for this year’s stock market rally until late August. Since then, the Stockholm ex-change index has climbed another 8 per cent, probably most-ly due to hopes that the trade war is headed towards a fairly
positive resolution and that the global economic slowdown will therefore not be as bad as investors had feared just a few months ago. Low interest rates and yields are expected to persist for the foreseeable future. As a result, it is also likely that share valuations overall will be higher than historically. However, a downturn of the magnitude we have now seen, both in 2019 and over the past decade, is clearly unlikely. The strong stock market rally now behind us, driven by interest rates and yields, should NOT be extrapolated into the future,
Nordic equitiesRecovery for cyclical shares
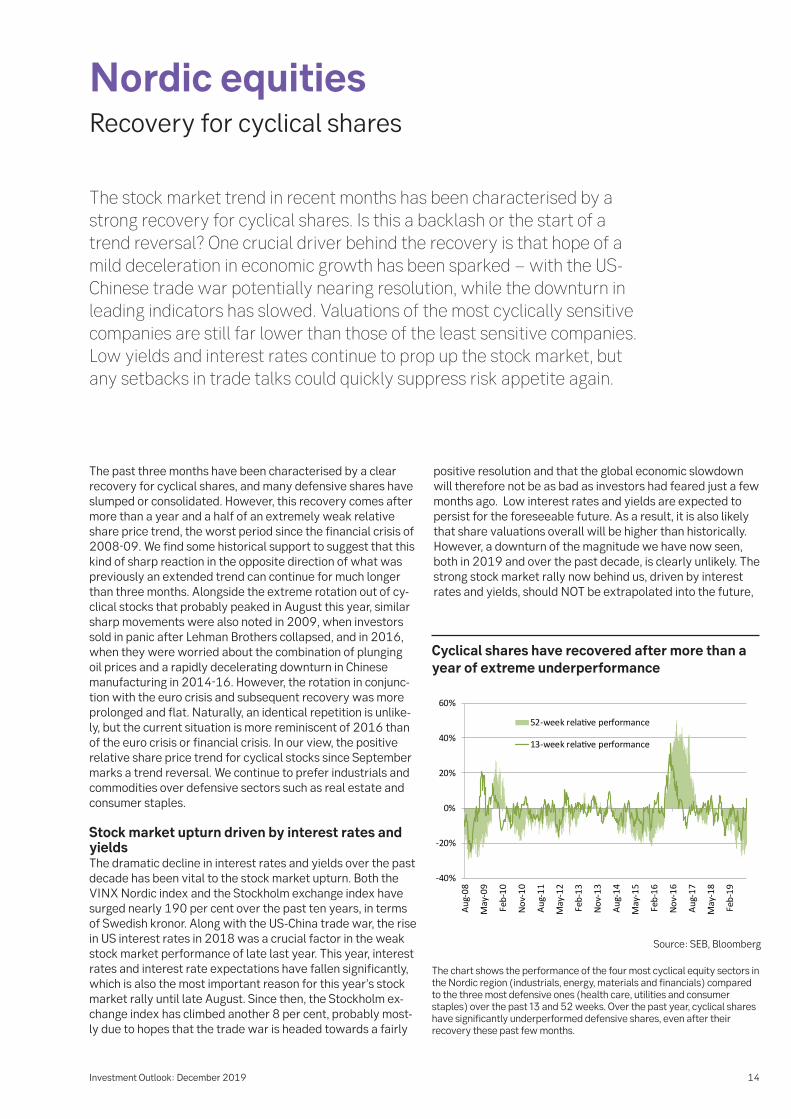
Cyclical shares have recovered after more than a year of extreme underperformance
The chart shows the performance of the four most cyclical equity sectors in the Nordic region (industrials, energy, materials and financials) compared to the three most defensive ones (health care, utilities and consumer staples) over the past 13 and 52 weeks. Over the past year, cyclical shares have significantly underperformed defensive shares, even after their recovery these past few months.
-40%
-20%
0%
20%
40%
60%
Aug-
08
May
-09
Feb-
10
Nov-
10
Aug-
11
May
-12
Feb-
13
Nov-
13
Aug-
14
May
-15
Feb-
16
Nov-
16
Aug-
17
May
-18
Feb-
1952-week relative performance
13-week relative performance
Source: SEB, Bloomberg
15Investment Outlook: December 2019
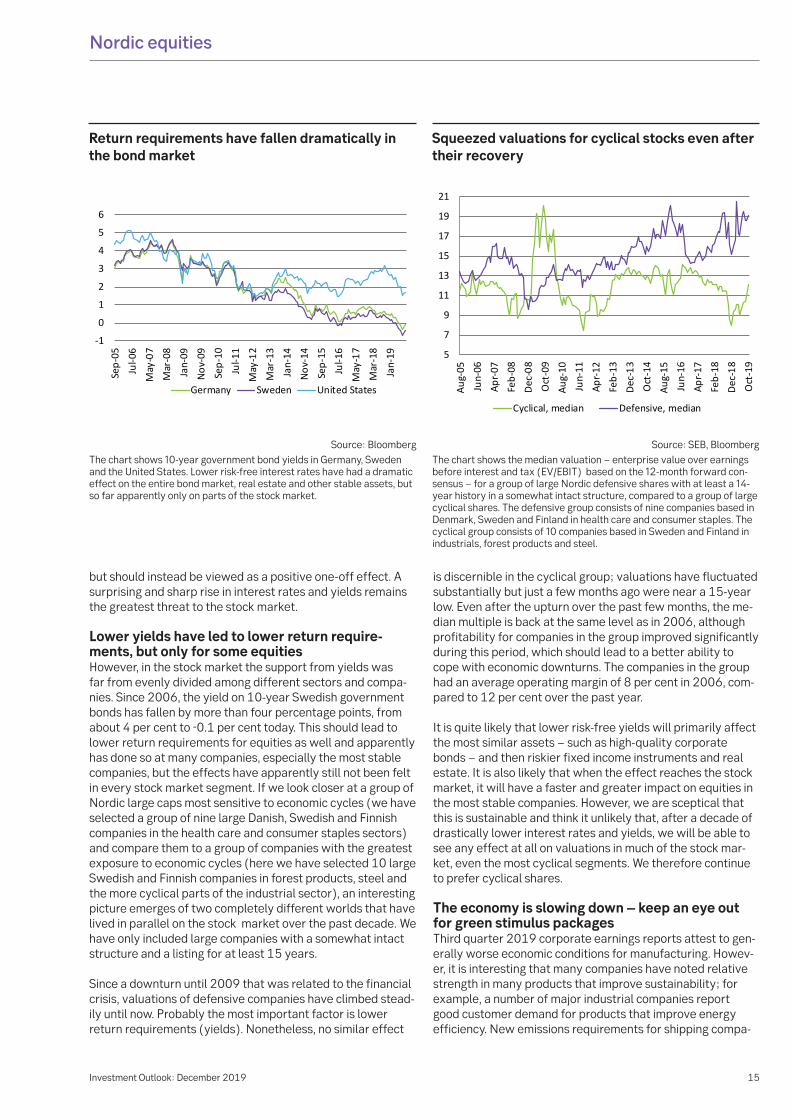
but should instead be viewed as a positive one-off effect. A surprising and sharp rise in interest rates and yields remains the greatest threat to the stock market.
Lower yields have led to lower return require-ments, but only for some equities However, in the stock market the support from yields was far from evenly divided among different sectors and compa-nies. Since 2006, the yield on 10-year Swedish government bonds has fallen by more than four percentage points, from about 4 per cent to -0.1 per cent today. This should lead to lower return requirements for equities as well and apparently has done so at many companies, especially the most stable companies, but the effects have apparently still not been felt in every stock market segment. If we look closer at a group of Nordic large caps most sensitive to economic cycles (we have selected a group of nine large Danish, Swedish and Finnish companies in the health care and consumer staples sectors) and compare them to a group of companies with the greatest exposure to economic cycles (here we have selected 10 large Swedish and Finnish companies in forest products, steel and the more cyclical parts of the industrial sector), an interesting picture emerges of two completely different worlds that have lived in parallel on the stock market over the past decade. We have only included large companies with a somewhat intact structure and a listing for at least 15 years.
Since a downturn until 2009 that was related to the financial crisis, valuations of defensive companies have climbed stead-ily until now. Probably the most important factor is lower return requirements (yields). Nonetheless, no similar effect
is discernible in the cyclical group; valuations have fluctuated substantially but just a few months ago were near a 15-year low. Even after the upturn over the past few months, the me-dian multiple is back at the same level as in 2006, although profitability for companies in the group improved significantly during this period, which should lead to a better ability to cope with economic downturns. The companies in the group had an average operating margin of 8 per cent in 2006, com-pared to 12 per cent over the past year.
It is quite likely that lower risk-free yields will primarily affect the most similar assets − such as high-quality corporate bonds − and then riskier fixed income instruments and real estate. It is also likely that when the effect reaches the stock market, it will have a faster and greater impact on equities in the most stable companies. However, we are sceptical that this is sustainable and think it unlikely that, after a decade of drastically lower interest rates and yields, we will be able to see any effect at all on valuations in much of the stock mar-ket, even the most cyclical segments. We therefore continue to prefer cyclical shares.
The economy is slowing down – keep an eye out for green stimulus packages Third quarter 2019 corporate earnings reports attest to gen-erally worse economic conditions for manufacturing. Howev-er, it is interesting that many companies have noted relative strength in many products that improve sustainability; for example, a number of major industrial companies report good customer demand for products that improve energy efficiency. New emissions requirements for shipping compa-
Nordic equities
Return requirements have fallen dramatically in the bond market
-1
0
1
2
3
4
5
6
Sep-
05Ju
l-06
May
-07
Mar
-08
Jan-
09No
v-09
Sep-
10Ju
l-11
May
-12
Mar
-13
Jan-
14No
v-14
Sep-
15Ju
l-16
May
-17
Mar
-18
Jan-
19Germany Sweden United States
Source: BloombergThe chart shows 10-year government bond yields in Germany, Sweden and the United States. Lower risk-free interest rates have had a dramatic effect on the entire bond market, real estate and other stable assets, but so far apparently only on parts of the stock market.
Source: SEB, Bloomberg
Squeezed valuations for cyclical stocks even after their recovery
5
7
9
11
13
15
17
19
21
Aug-
05Ju
n-06
Apr-0
7Fe
b-08
Dec-
08O
ct-0
9Au
g-10
Jun-
11Ap
r-12
Feb-
13De
c-13
Oct
-14
Aug-
15Ju
n-16
Apr-1
7Fe
b-18
Dec-
18O
ct-1
9
Cyclical, median Defensive, median
The chart shows the median valuation − enterprise value over earnings before interest and tax (EV/EBIT) based on the 12-month forward con-sensus − for a group of large Nordic defensive shares with at least a 14-year history in a somewhat intact structure, compared to a group of large cyclical shares. The defensive group consists of nine companies based in Denmark, Sweden and Finland in health care and consumer staples. The cyclical group consists of 10 companies based in Sweden and Finland in industrials, forest products and steel.
16Investment Outlook: December 2019
nies beginning in January 2020 have triggered an enormous wave of investments in exhaust gas scrubbers from a sector where investments have otherwise been on the back burner. Other companies are seeing strength in the market for water purification and recycling, while forest product companies have indicated that there has never been greater interest from customers in “solving their plastic problems”. Yet we are seeing a general economic slowdown. It is coinciding with considerably greater awareness among political leaders and the general public of the need to improve sustainability in the economy.
The timing is thus right for green stimulus measures, which will benefit some companies while others will be adversely affected by more stringent regulations. In our view, we are only at the beginning of an enormous societal transformation towards better sustainability. Companies that embrace this and try to drive as well as take advantage of this trend have much greater opportunities than those that only reluctantly adapt to new regulations. Fortunately, plenty of Nordic com-panies realised early on that products which improve sustain-ability are an excellent business opportunity and sustainable processes are a long-term competitive advantage. According to the business magazine Corporate Knights, no fewer than 15 of the world’s 100 most sustainable companies are from the Nordic region.
Morgan Stanley estimates that the world needs to invest 50 trillion dollars by 2050 to achieve the Paris Agreement’s goal to curb carbon dioxide emissions. That requires invest-ments in everything from energy-efficiency improvements to carbon capture and storage as well as more climate-smart
technologies such as renewable electricity, energy storage, electric vehicles, green hydrogen and biofuels. Unfortunately, the investment bank also noted that current regulations and pricing of carbon dioxide emissions are far from sufficient for the economy to actually evolve in the direction required for this. Only in some sub-segments is the trend somewhat in line with what is actually needed – for instance, the electrification of the transport sector, which is now taking place at break-neck speed, and investments in solar power and land-based wind power.
A recession may be exactly what is needed for new measures to be presented that both increase employment and contrib-ute to improved sustainability.
Germany announced in early November 2019 that subsidies for new electric cars will be increased 50 per cent to 6,000 euros per vehicle. In September, Chancellor Angela Merkel presented a 54 billion euro climate package of measures from the German federal government for 2020-23. The package includes everything from a carbon emissions tax to subsidies for electric cars and energy-efficient heat pumps to a ban on oil furnaces. The air travel tax will be increased, while the tax on train travel will be lowered. There will also be new investments in renewable energy, with the goal of increasing the role of renewable sources from 38 per cent in 2018 to 65 per cent of electricity production in 2030. In late November, Germany is also expected to present more details on how owners of coal-fired power plants will be compensated if they shut down functioning facilities, in line with the government’s plan to close all coal-fired plants by 2038. The president of the European Commission, Ursula von der Leyen, has also announced she wants to use the European Investment Bank (EIB) to channel 1 trillion euros into investments to fund the transition to a more sustainable EU over the next 10 years.
If a Democrat were to win the US presidential election in 2020, we can probably also expect the US to try to regain lost ground on environmental issues as quickly as possible. Meanwhile the financial services sector, especially in the EU, is being regulated to make capital allocation promote sustainability in a more efficient way. Additional measures are expected going forward. Sustainability will remain important for equity investments.
Conclusion We expect the stock market to remain volatile and believe that the outcome of the US-Chinese trade dispute will be crucial to whether the stock market goes up or down over the next 12 months. We find the most cyclical industries still attractively valued and regard the sector rotation from defen-sive to cyclical stocks since August as a trend reversal rather than a temporary correction. The sustainability trend has only just begun. We prefer shares in companies that will benefit from this societal transformation.
Nordic equities
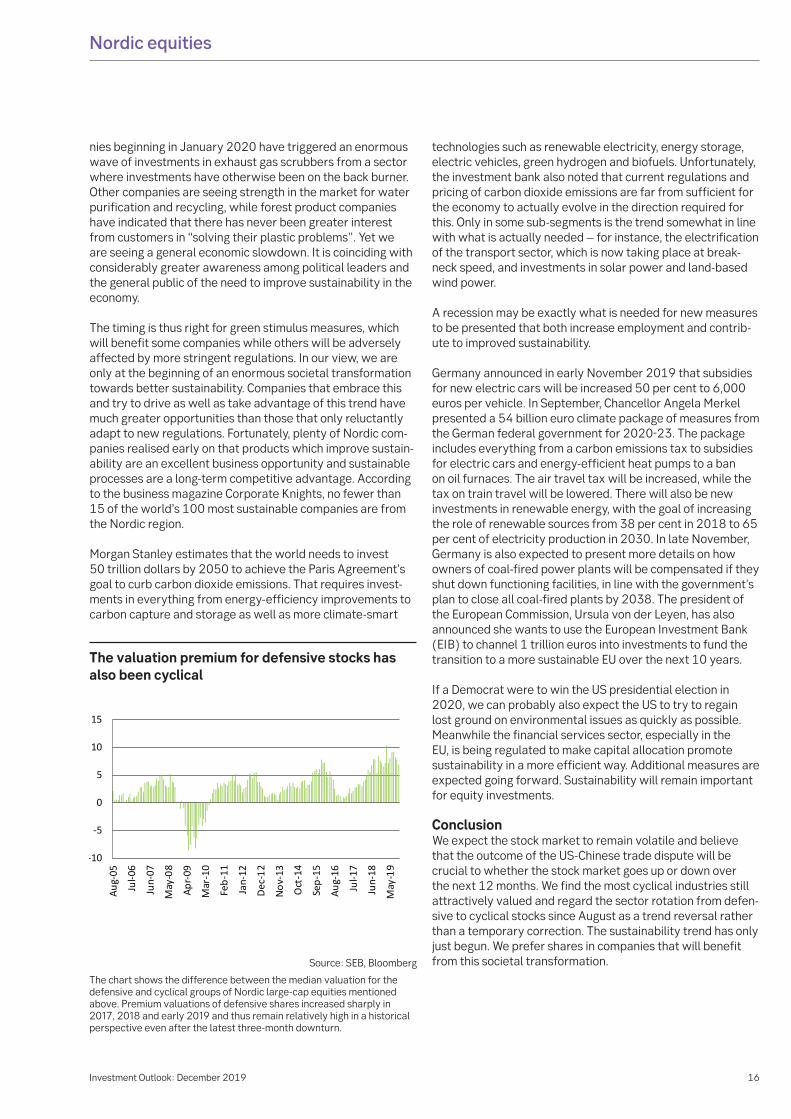
The valuation premium for defensive stocks has also been cyclical
-10
-5
0
5
10
15
Aug-
05
Jul-0
6
Jun-
07
May
-08
Apr-0
9
Mar
-10
Feb-
11
Jan-
12
Dec-
12
Nov-
13
Oct
-14
Sep-
15
Aug-
16
Jul-1
7
Jun-
18
May
-19
Source: SEB, Bloomberg
The chart shows the difference between the median valuation for the defensive and cyclical groups of Nordic large-cap equities mentioned above. Premium valuations of defensive shares increased sharply in 2017, 2018 and early 2019 and thus remain relatively high in a historical perspective even after the latest three-month downturn.
17Investment Outlook: September 2019
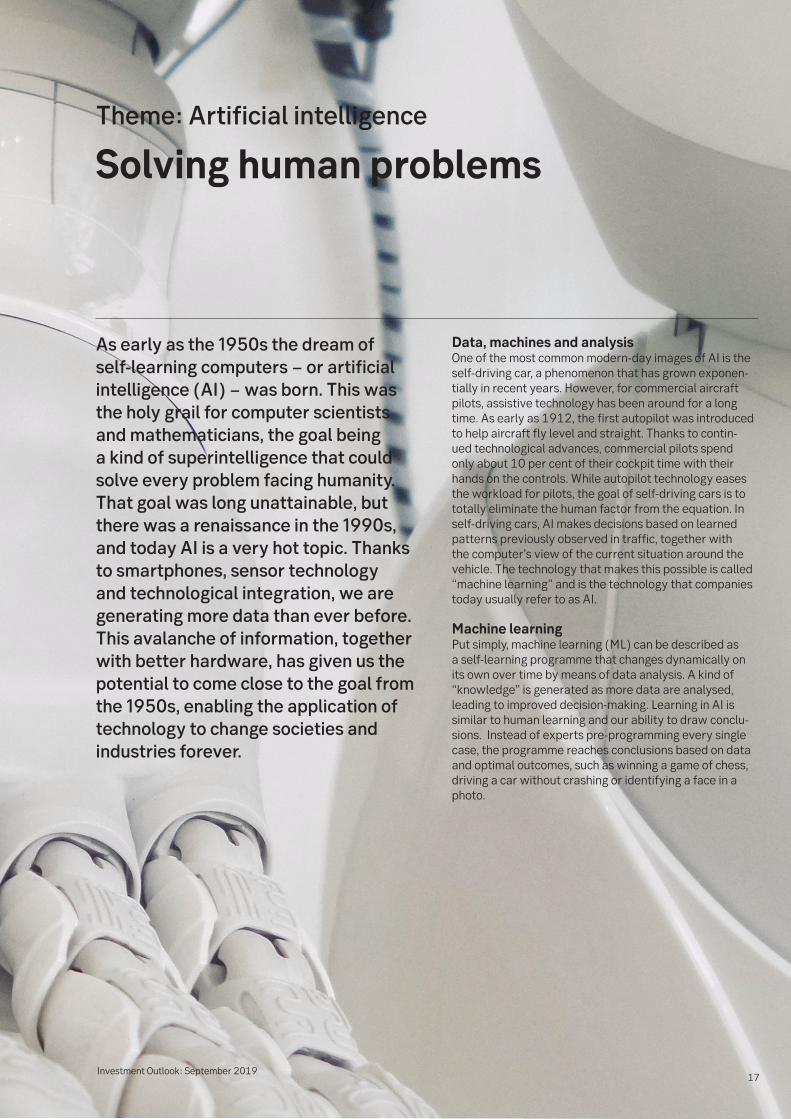
As early as the 1950s the dream of self-learning computers − or artificial intelligence (AI) − was born. This was the holy grail for computer scientists and mathematicians, the goal being a kind of superintelligence that could solve every problem facing humanity. That goal was long unattainable, but there was a renaissance in the 1990s, and today AI is a very hot topic. Thanks to smartphones, sensor technology and technological integration, we are generating more data than ever before. This avalanche of information, together with better hardware, has given us the potential to come close to the goal from the 1950s, enabling the application of technology to change societies and industries forever.
Data, machines and analysis One of the most common modern-day images of AI is the self-driving car, a phenomenon that has grown exponen-tially in recent years. However, for commercial aircraft pilots, assistive technology has been around for a long time. As early as 1912, the first autopilot was introduced to help aircraft fly level and straight. Thanks to contin-ued technological advances, commercial pilots spend only about 10 per cent of their cockpit time with their hands on the controls. While autopilot technology eases the workload for pilots, the goal of self-driving cars is to totally eliminate the human factor from the equation. In self-driving cars, AI makes decisions based on learned patterns previously observed in traffic, together with the computer’s view of the current situation around the vehicle. The technology that makes this possible is called “machine learning” and is the technology that companies today usually refer to as AI.
Machine learning Put simply, machine learning (ML) can be described as a self-learning programme that changes dynamically on its own over time by means of data analysis. A kind of “knowledge” is generated as more data are analysed, leading to improved decision-making. Learning in AI is similar to human learning and our ability to draw conclu-sions. Instead of experts pre-programming every single case, the programme reaches conclusions based on data and optimal outcomes, such as winning a game of chess, driving a car without crashing or identifying a face in a photo.
Theme: Artificial intelligence
Solving human problems
18Investment Outlook: December 2019
Learning can take place in two different ways – supervised or unsupervised. Supervised learning is comparable to a student learning the answers to questions and thereby learning to generalise and reach conclusions. With unsupervised learn-ing, in contrast, questions have no answers; instead the programme learns underlying structures and draws its own conclusions based on these. Without going deeper into the technical details, unsupervised learning is used when the aim is to identify contexts that are not clear to humans. Super-vised learning is for problems where there is a clear picture of the objective. One such example can be to identify whether a spot on someone’s skin is dangerous or not. We can train the programme by showing it pictures of dangerous and harmless skin spots. The programme is trained by analysing millions of data points, ultimately leading to better results and a higher probability that the right decision/diagnosis is made.
One problem, which has been highlighted recently, is deducing how AI makes decisions. Humans can often easily answer how they arrive at a conclusion. It is much harder to explain which data points led to a given decision, since a programme has millions of reference points. This problem has given rise to a number of new fields in AI, where the focus is on visualising the decision-making process. However, today ML is already being used commercially by many companies. With each passing day, the number of potential applications grows and start-ups with new specialisations enter the market.
OK Google, what’s traffic like right now? Thanks to the use of ML, for example, Google has a really good sense of the traffic situation in our cities. With millions of users sending data about their speed, position and destina-
tion, a picture of the current traffic situation can be created using ML that identifies which roads should be avoided and how to best reroute the user. This enormous supply of data is driving the development of AI; the more data is available, the better programmes can be developed.
Thanks to this great supply of data, Facebook’s developers have trained their ML programmes to identify the faces of users in photos not uploaded by the users themselves; all that is necessary is that the users have previously uploaded a photo of themselves. Thanks to robots and AI, the world’s leading online retailer, Amazon, has reduced the time from when a customer buys a product to when it is packed and shipped from 60 to 15 minutes. Spotify, the world’s largest online music service, uses ML to create personal playlists on a weekly basis for its users. The US-based company Arterys has created AI applications − among other things for diagnos-ing cardiovascular diseases − that are up to 30 minutes faster per patient and help visualise potential problems. The farm machinery manufacturer John Deere has embraced AI by both acquiring companies and investing in-house, using AI and satellite data to estimate soya and maize (corn) harvests.
These are just a few examples of companies and applica-tions where AI is already being used today, and advances are continuing at a rapid pace. Last year, Google unveiled a new AI project called Duplex, in which a virtual assistant performs services, such as calling and booking a table at a restaurant or making a haircut appointment. The potential is enormous and there are many applications. The conceivable efficiency gains are persuading companies as well as governments to invest in AI and AI-related research.
Theme: Artificial intelligence
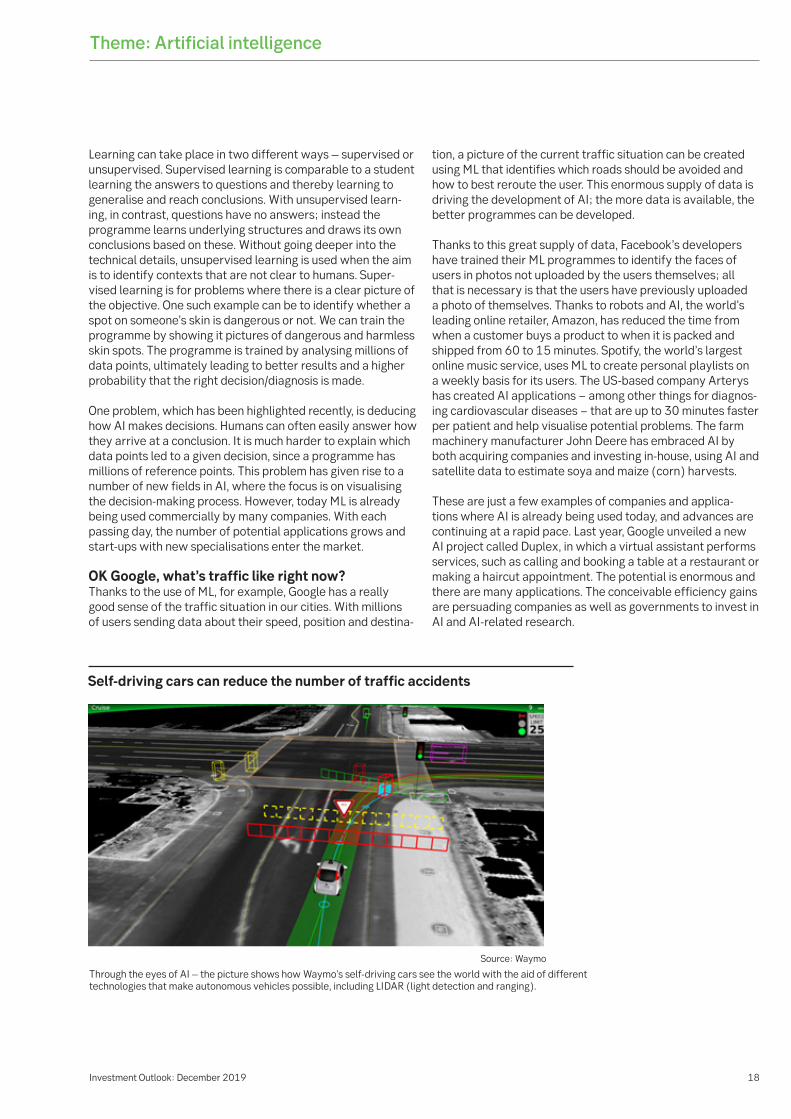
Self-driving cars can reduce the number of traffic accidents
Source: Waymo
Through the eyes of AI – the picture shows how Waymo's self-driving cars see the world with the aid of different technologies that make autonomous vehicles possible, including LIDAR (light detection and ranging).
19Investment Outlook: December 2019
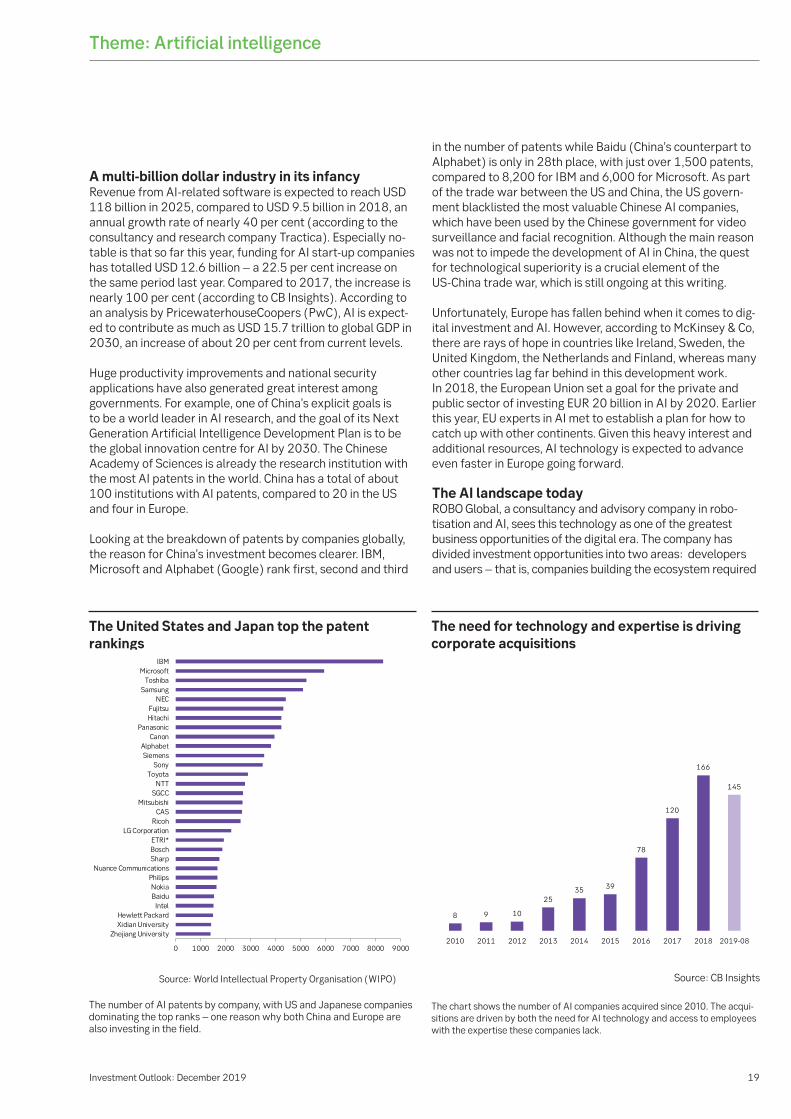
A multi-billion dollar industry in its infancy Revenue from AI-related software is expected to reach USD 118 billion in 2025, compared to USD 9.5 billion in 2018, an annual growth rate of nearly 40 per cent (according to the consultancy and research company Tractica). Especially no-table is that so far this year, funding for AI start-up companies has totalled USD 12.6 billion – a 22.5 per cent increase on the same period last year. Compared to 2017, the increase is nearly 100 per cent (according to CB Insights). According to an analysis by PricewaterhouseCoopers (PwC), AI is expect-ed to contribute as much as USD 15.7 trillion to global GDP in 2030, an increase of about 20 per cent from current levels.
Huge productivity improvements and national security applications have also generated great interest among governments. For example, one of China’s explicit goals is to be a world leader in AI research, and the goal of its Next Generation Artificial Intelligence Development Plan is to be the global innovation centre for AI by 2030. The Chinese Academy of Sciences is already the research institution with the most AI patents in the world. China has a total of about 100 institutions with AI patents, compared to 20 in the US and four in Europe.
Looking at the breakdown of patents by companies globally, the reason for China’s investment becomes clearer. IBM, Microsoft and Alphabet (Google) rank first, second and third
in the number of patents while Baidu (China’s counterpart to Alphabet) is only in 28th place, with just over 1,500 patents, compared to 8,200 for IBM and 6,000 for Microsoft. As part of the trade war between the US and China, the US govern-ment blacklisted the most valuable Chinese AI companies, which have been used by the Chinese government for video surveillance and facial recognition. Although the main reason was not to impede the development of AI in China, the quest for technological superiority is a crucial element of the US-China trade war, which is still ongoing at this writing.
Unfortunately, Europe has fallen behind when it comes to dig-ital investment and AI. However, according to McKinsey & Co, there are rays of hope in countries like Ireland, Sweden, the United Kingdom, the Netherlands and Finland, whereas many other countries lag far behind in this development work. In 2018, the European Union set a goal for the private and public sector of investing EUR 20 billion in AI by 2020. Earlier this year, EU experts in AI met to establish a plan for how to catch up with other continents. Given this heavy interest and additional resources, AI technology is expected to advance even faster in Europe going forward.
The AI landscape today ROBO Global, a consultancy and advisory company in robo-tisation and AI, sees this technology as one of the greatest business opportunities of the digital era. The company has divided investment opportunities into two areas: developers and users – that is, companies building the ecosystem required
Theme: Artificial intelligence
The United States and Japan top the patent rankings
Source: World Intellectual Property Organisation (WIPO)
The number of AI patents by company, with US and Japanese companies dominating the top ranks – one reason why both China and Europe are also investing in the field.
The need for technology and expertise is driving corporate acquisitions
The chart shows the number of AI companies acquired since 2010. The acqui-sitions are driven by both the need for AI technology and access to employees with the expertise these companies lack.
Source: CB Insights
0 1000 2000 3000 4000 5000 6000 7000 8000 9000
Zhejiang UniversityXidian UniversityHewlett Packard
IntelBaiduNokia
PhilipsNuance Communications
SharpBoschETRI*
LG CorporationRicoh
CASMitsubishi
SGCCNTT
ToyotaSony
SiemensAlphabet
CanonPanasonic
HitachiFujitsu
NECSamsung
ToshibaMicrosoft
IBM
8 9 10
2535 39
78
120
166
145
2010 2011 2012 2013 2014 2015 2016 2017 2018 2019-08

20Investment Outlook: December 2019
Theme: Artificial intelligence
for applications and companies that use the technology to update their business models and create competitive advan-tages over more mature, traditional companies. According to a World Economic Forum analysis, nearly 30 per cent of all work in 2018 was done by machines and computers, a figure that is expected to grow to more than 40 per cent over the next three years. This expected increase places great demands on infrastructure and data processing. One clear trend is the shift to cloud services, with Microsoft, Amazon, Alphabet and IBM leading this development. Businesses like US software company Alteryx and its Dutch counterpart Splunk are creating opportunities for companies to analyse enormous quantities of data. Among other operations, Alteryx prepares data for ana-lytics, and Splunk uses ML to understand customer behaviour and thus be able to predict it. As for developing the AI ecosys-tem, UK-based Graphcore is developing the next generation of microprocessors (called intelligence processing units or IPUs) specifically designed for AI. Technological advances are being made at a rapid pace and across a wide range of areas, and the possibilities seem endless.
Creating competitive advantages by using AI requires a com-pany-wide integration and structure centred on the company’s data. Today Spotify focuses primarily on music services, but thanks to integration and data structuring, expanding into related media would not be a big step. Alongside its online music services, the company also has an application for artists which allows them to customise how they want to interact with their listeners and how they want to be profiled. The company recently hired Francois Pachet, a well-known music researcher, to develop AI tools for artists.
Like the EU’s attempt to catch up with leading AI countries by means of investments, corporate acquisitions in the sector have increased significantly in recent years. Such acquisitions were previously made mostly by major technology companies but have now spread to other sectors that are trying to catch up by purchasing technology developed by smaller companies. In the past decade, nearly 650 AI-related corporate acquisi-tions have been carried out, with around 140 of them just this year, according to CB Insights (based on acquisitions of global parent companies). Switzerland-based Roche Holding, McDon-alds and Nike are all examples of major corporations that have acquired companies to gain access to desired technology. This trend looks likely to continue going forward. As AI technology creates greater competitive advantages, traditional compa-nies in financial services, consumer durables, manufacturing, consumer staples and health care will either buy services or buy companies that offer these services in order to remain competitive.
Industrial revolution 4.0 As more and more processes are automated, the current labour landscape will change. According to PwC, admittedly only 3 per cent of today’s jobs will disappear by 2020, but that figure is expected to increase to around 30 per cent in 2030. In the short term, because of the need for AI engineers, programmers and statisticians, companies will need to hire more employees rather than lay them off. People with de-grees in quantitative subjects are in short supply in the labour force today; as a result, salaries at large technology compa-nies are now much higher than in most other sectors.
However, in sectors such as transport, health care, manufac-turing and financial services, a revolution is knocking at the door. Autonomous vehicles, for example, will create enor-mous advantages for those companies in the transport sector that are first to introduce them.
In the manufacturing sector, AI is expected to take over the calibration of production chains and put parts of manufactur-ing on autopilot. As a result, self-learning systems will be able to improve efficiency considerably while reducing the work-load of operators. Suppliers of equipment such as industrial robots are good examples of manufacturers that are integrat-ing and developing AI technology for their products. As part of this task, the Swiss-Swedish conglomerate ABB − which supplies energy and automation technology − has launched its ABB Industrial AI Accelerator programme to support AI start-ups. The programme gives the company access to valu-able technology that can be integrated into its products.
In the health care sector, demographic changes will lead to structural growth, mainly through the increased care needs of an ageing population. AI can provide faster diagnoses and customise patient treatment plans, easing the workload of doctors and nurses and reducing the risk of misdiagnosis. The sector is thus facing a digital transformation, giving medical AI companies room to gain significant market share. One major competitive advantage for this technology is that it requires minimal investment in new diagnostic equipment.
For the financial services sector, which is tightly regulated and data-intensive, AI can be used, for example, in risk control, fraud prevention and capital management as well as to improve the customer experience. The sector has historically had a problematic relationship with technology, and results have not met expectations. Meanwhile, financial service start-ups − or “fintech” companies − are growing exponen-tially. These smaller, more niche-oriented companies have in many cases led the way in AI, thereby creating a difficult competitive situation for larger, less agile companies. There is a great need for AI skills in the financial services sector, both among management and staff, to handle this new situation.
To summarise, many of today’s jobs may be phased out as a consequence of broader implementation of AI. However, just as during earlier industrial revolutions, new jobs will be creat-ed and the labour market will remain in balance.
Conclusion As we generate more data, develop faster hardware and train smarter models, we will find new applications for AI. Compa-nies that want to maintain their competitiveness may very well be forced to invest in AI technology in the years ahead to avoid being overtaken by competitors that take advantage of its economies of scale. As a result, AI technology may soon impact the bottom line of more and more companies in a growing number of sectors. But considering that this will soon provide each of us with a private chauffeur, a virtual assistant to keep track of the mundane details of our lives and much more, it seems like an investment in the future that is worth living with.

21Investment Outlook: December 2019
That forests grow is not news, but it has been a long time since the growth outlook for the forest product indus-try looked as promising as today − at least to those who care to lift their gaze beyond the next few quarters. Consum-ers, businesses and political leaders are revolting against plastic pollution, and public interest in biomaterials has perhaps never been greater, which benefits the forest product sector. For-ests are a very competitive alternative for capturing carbon dioxide from the atmosphere and storing it in solid form.
There are enormous business oppor-tunities. After more than a decade of problems with structurally shrinking sales of printing and fine paper, growth in packaging, pulp, wood products and new applications may lead to entire-ly new developments ahead. We are probably at the beginning of a positive restructuring trend towards greater use of biomaterials in society.
Growing demand for wood and timber The forest product industry is cyclical. After a record-strong 2018, this year has been a steep downward slope, but we believe the current economic cycle is now close to bottom-ing out. Above all, we view structural trends as substantial-ly more attractive from a longer-term investor perspective. We see several reasons to expect a long-term upward trend in demand for forest-based raw materials: rising consump-tion (per capita) of tissue paper and packaging in Asia and a growing market share for cardboard box-intensive e-com-merce. There is also an increasing preference for renewa-ble, recyclable and more environmentally friendly materials in everything from packaging to construction materials and chemicals
Climate-smart construction Morgan Stanley, an investment bank, estimates that the world will need to spend USD 50 trillion on climate-smart technology and solutions over the next 30 years in order to meet the climate target of the Paris Agreement. Unfor-tunately the policy instruments needed to achieve this are not yet in place, but the trend is clear and we can probably expect more and more efforts to steer society in such a direction. This represents enormous business opportunities for companies that are properly positioned. Forest product companies are in an attractive position, mainly from two perspectives: their potential to replace fossil-based ma-terials (polymers/plastics) with bio-based ones, and their potential to absorb atmospheric carbon dioxide by planting more forests and using more wood in construction.
Some industries will continue to require fossil fuels, and a carbon dioxide-neutral society will thus need to offset such operations with carbon dioxide-absorbing solutions, often referred to as “carbon capture and storage” (CCS). Morgan Stanley estimates that USD 2.5 trillion worth of invest-ments will be needed in various industrial CCS solutions by 2050. The problem with currently available industrial CCS solutions is that they are very expensive and/or energy- intensive.
Theme: Forest products
Green growth boosts forest sector
22Investment Outlook: December 2019
An especially cost-effective way of absorbing carbon dioxide from the atmosphere is to plant trees. In order to maximise their positive climate impact, we also need efficient but sus-tainable and long-term forestry – a field in which Sweden is a pioneer and a potential role model for many other countries. Trees absorb more carbon dioxide while they are growing the fastest, so from a climate perspective it is desirable for log-ging to take place before their growth has slowed too much.
One socioeconomic alternative should be to use wood for construction to a substantially greater extent than today. This locks in carbon in solid form for hundreds of years and can, at best, meanwhile replace carbon dioxide-intensive materials such as reinforced concrete. The existing technical limitations on construction with conventional sawn timber products can largely be solved by using more advanced products.
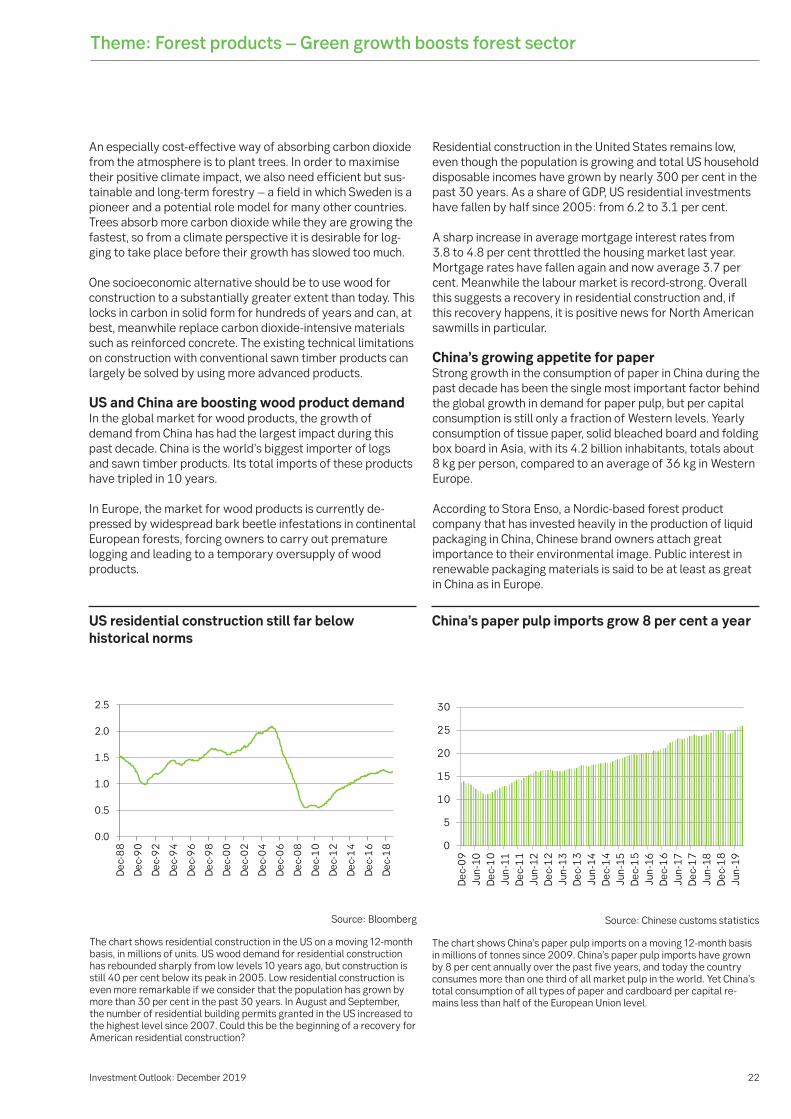
US and China are boosting wood product demand In the global market for wood products, the growth of demand from China has had the largest impact during this past decade. China is the world’s biggest importer of logs and sawn timber products. Its total imports of these products have tripled in 10 years.
In Europe, the market for wood products is currently de-pressed by widespread bark beetle infestations in continental European forests, forcing owners to carry out premature logging and leading to a temporary oversupply of wood products.
Residential construction in the United States remains low, even though the population is growing and total US household disposable incomes have grown by nearly 300 per cent in the past 30 years. As a share of GDP, US residential investments have fallen by half since 2005: from 6.2 to 3.1 per cent.
A sharp increase in average mortgage interest rates from 3.8 to 4.8 per cent throttled the housing market last year. Mortgage rates have fallen again and now average 3.7 per cent. Meanwhile the labour market is record-strong. Overall this suggests a recovery in residential construction and, if this recovery happens, it is positive news for North American sawmills in particular.
China’s growing appetite for paper Strong growth in the consumption of paper in China during the past decade has been the single most important factor behind the global growth in demand for paper pulp, but per capital consumption is still only a fraction of Western levels. Yearly consumption of tissue paper, solid bleached board and folding box board in Asia, with its 4.2 billion inhabitants, totals about 8 kg per person, compared to an average of 36 kg in Western Europe.
According to Stora Enso, a Nordic-based forest product company that has invested heavily in the production of liquid packaging in China, Chinese brand owners attach great importance to their environmental image. Public interest in renewable packaging materials is said to be at least as great in China as in Europe.
Theme: Forest products – Green growth boosts forest sector
US residential construction still far below historical norms
The chart shows residential construction in the US on a moving 12-month basis, in millions of units. US wood demand for residential construction has rebounded sharply from low levels 10 years ago, but construction is still 40 per cent below its peak in 2005. Low residential construction is even more remarkable if we consider that the population has grown by more than 30 per cent in the past 30 years. In August and September, the number of residential building permits granted in the US increased to the highest level since 2007. Could this be the beginning of a recovery for American residential construction?
Source: Bloomberg
China’s paper pulp imports grow 8 per cent a year
The chart shows China’s paper pulp imports on a moving 12-month basis in millions of tonnes since 2009. China’s paper pulp imports have grown by 8 per cent annually over the past five years, and today the country consumes more than one third of all market pulp in the world. Yet China’s total consumption of all types of paper and cardboard per capital re-mains less than half of the European Union level.
Source: Chinese customs statistics
0.0
0.5
1.0
1.5
2.0
2.5
Dec
-88
Dec
-90
Dec
-92
Dec
-94
Dec
-96
Dec
-98
Dec
-00
Dec
-02
Dec
-04
Dec
-06
Dec
-08
Dec
-10
Dec
-12
Dec
-14
Dec
-16
Dec
-18 0
5
10
15
20
25
30
Dec
-09
Jun-
10D
ec-1
0Ju
n-11
Dec
-11
Jun-
12D
ec-1
2Ju
n-13
Dec
-13
Jun-
14D
ec-1
4Ju
n-15
Dec
-15
Jun-
16D
ec-1
6Ju
n-17
Dec
-17
Jun-
18D
ec-1
8Ju
n-19
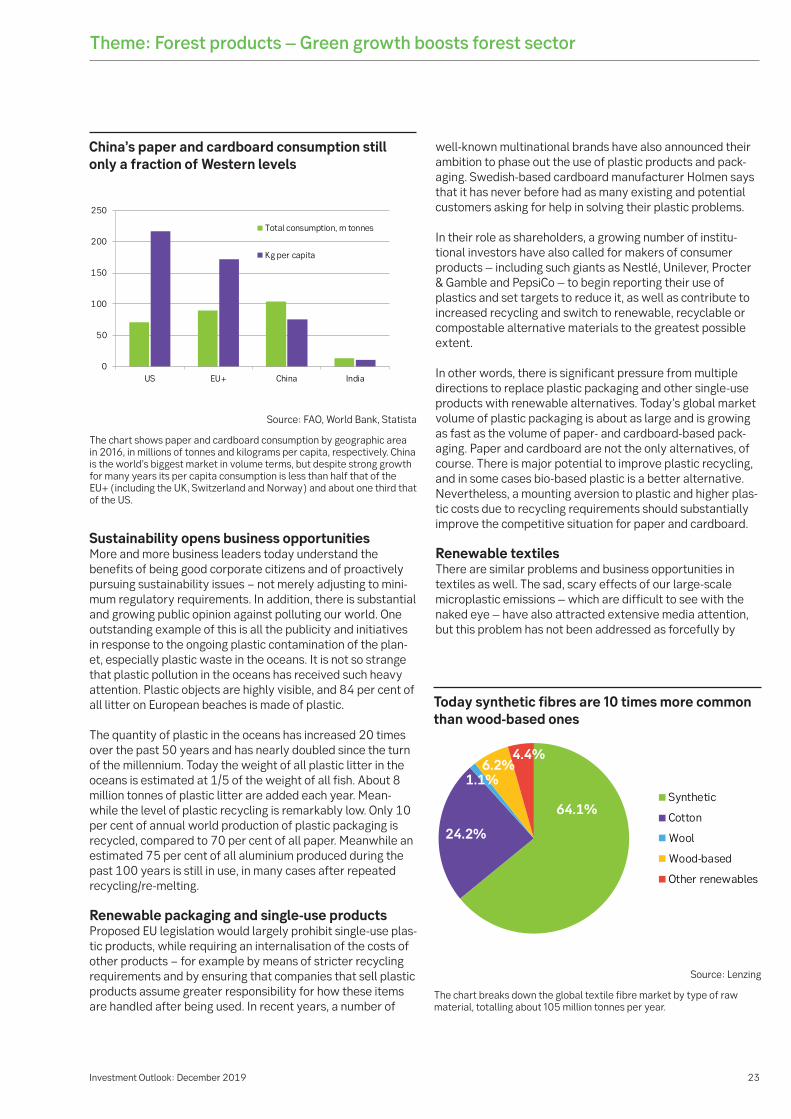
23Investment Outlook: December 2019
Sustainability opens business opportunities More and more business leaders today understand the benefits of being good corporate citizens and of proactively pursuing sustainability issues − not merely adjusting to mini-mum regulatory requirements. In addition, there is substantial and growing public opinion against polluting our world. One outstanding example of this is all the publicity and initiatives in response to the ongoing plastic contamination of the plan-et, especially plastic waste in the oceans. It is not so strange that plastic pollution in the oceans has received such heavy attention. Plastic objects are highly visible, and 84 per cent of all litter on European beaches is made of plastic.
The quantity of plastic in the oceans has increased 20 times over the past 50 years and has nearly doubled since the turn of the millennium. Today the weight of all plastic litter in the oceans is estimated at 1/5 of the weight of all fish. About 8 million tonnes of plastic litter are added each year. Mean-while the level of plastic recycling is remarkably low. Only 10 per cent of annual world production of plastic packaging is recycled, compared to 70 per cent of all paper. Meanwhile an estimated 75 per cent of all aluminium produced during the past 100 years is still in use, in many cases after repeated recycling/re-melting.
Renewable packaging and single-use products Proposed EU legislation would largely prohibit single-use plas-tic products, while requiring an internalisation of the costs of other products − for example by means of stricter recycling requirements and by ensuring that companies that sell plastic products assume greater responsibility for how these items are handled after being used. In recent years, a number of
Theme: Forest products – Green growth boosts forest sector
China’s paper and cardboard consumption still only a fraction of Western levels
The chart shows paper and cardboard consumption by geographic area in 2016, in millions of tonnes and kilograms per capita, respectively. China is the world’s biggest market in volume terms, but despite strong growth for many years its per capita consumption is less than half that of the EU+ (including the UK, Switzerland and Norway) and about one third that of the US.
Source: FAO, World Bank, Statista
well-known multinational brands have also announced their ambition to phase out the use of plastic products and pack-aging. Swedish-based cardboard manufacturer Holmen says that it has never before had as many existing and potential customers asking for help in solving their plastic problems.
In their role as shareholders, a growing number of institu-tional investors have also called for makers of consumer products – including such giants as Nestlé, Unilever, Procter & Gamble and PepsiCo – to begin reporting their use of plastics and set targets to reduce it, as well as contribute to increased recycling and switch to renewable, recyclable or compostable alternative materials to the greatest possible extent.
In other words, there is significant pressure from multiple directions to replace plastic packaging and other single-use products with renewable alternatives. Today’s global market volume of plastic packaging is about as large and is growing as fast as the volume of paper- and cardboard-based pack-aging. Paper and cardboard are not the only alternatives, of course. There is major potential to improve plastic recycling, and in some cases bio-based plastic is a better alternative. Nevertheless, a mounting aversion to plastic and higher plas-tic costs due to recycling requirements should substantially improve the competitive situation for paper and cardboard.
Renewable textiles There are similar problems and business opportunities in textiles as well. The sad, scary effects of our large-scale microplastic emissions – which are difficult to see with the naked eye – have also attracted extensive media attention, but this problem has not been addressed as forcefully by
Today synthetic fibres are 10 times more common than wood-based ones
The chart breaks down the global textile fibre market by type of raw material, totalling about 105 million tonnes per year.
Source: Lenzing
0
50
100
150
200
250
US EU+ China India
Total consumption, m tonnes
Kg per capita
64.1%
24.2%
1.1%6.2%
4.4%
Synthetic
Cotton
Wool
Wood-based
Other renewables
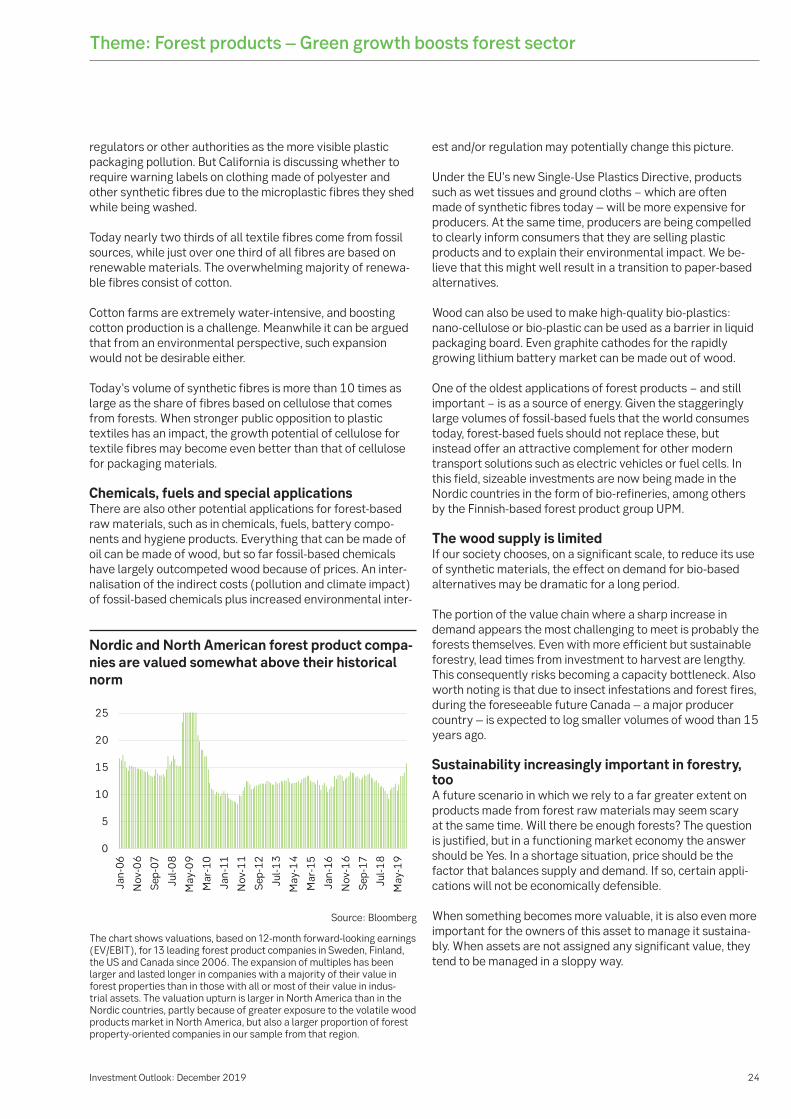
24Investment Outlook: December 2019
Theme: Forest products – Green growth boosts forest sector
regulators or other authorities as the more visible plastic packaging pollution. But California is discussing whether to require warning labels on clothing made of polyester and other synthetic fibres due to the microplastic fibres they shed while being washed.
Today nearly two thirds of all textile fibres come from fossil sources, while just over one third of all fibres are based on renewable materials. The overwhelming majority of renewa-ble fibres consist of cotton.
Cotton farms are extremely water-intensive, and boosting cotton production is a challenge. Meanwhile it can be argued that from an environmental perspective, such expansion would not be desirable either.
Today’s volume of synthetic fibres is more than 10 times as large as the share of fibres based on cellulose that comes from forests. When stronger public opposition to plastic textiles has an impact, the growth potential of cellulose for textile fibres may become even better than that of cellulose for packaging materials.
Chemicals, fuels and special applications There are also other potential applications for forest-based raw materials, such as in chemicals, fuels, battery compo-nents and hygiene products. Everything that can be made of oil can be made of wood, but so far fossil-based chemicals have largely outcompeted wood because of prices. An inter-nalisation of the indirect costs (pollution and climate impact) of fossil-based chemicals plus increased environmental inter-
est and/or regulation may potentially change this picture.
Under the EU’s new Single-Use Plastics Directive, products such as wet tissues and ground cloths − which are often made of synthetic fibres today – will be more expensive for producers. At the same time, producers are being compelled to clearly inform consumers that they are selling plastic products and to explain their environmental impact. We be-lieve that this might well result in a transition to paper-based alternatives.
Wood can also be used to make high-quality bio-plastics: nano-cellulose or bio-plastic can be used as a barrier in liquid packaging board. Even graphite cathodes for the rapidly growing lithium battery market can be made out of wood.
One of the oldest applications of forest products − and still important − is as a source of energy. Given the staggeringly large volumes of fossil-based fuels that the world consumes today, forest-based fuels should not replace these, but instead offer an attractive complement for other modern transport solutions such as electric vehicles or fuel cells. In this field, sizeable investments are now being made in the Nordic countries in the form of bio-refineries, among others by the Finnish-based forest product group UPM.
The wood supply is limited If our society chooses, on a significant scale, to reduce its use of synthetic materials, the effect on demand for bio-based alternatives may be dramatic for a long period.
The portion of the value chain where a sharp increase in demand appears the most challenging to meet is probably the forests themselves. Even with more efficient but sustainable forestry, lead times from investment to harvest are lengthy. This consequently risks becoming a capacity bottleneck. Also worth noting is that due to insect infestations and forest fires, during the foreseeable future Canada – a major producer country – is expected to log smaller volumes of wood than 15 years ago.
Sustainability increasingly important in forestry, too A future scenario in which we rely to a far greater extent on products made from forest raw materials may seem scary at the same time. Will there be enough forests? The question is justified, but in a functioning market economy the answer should be Yes. In a shortage situation, price should be the factor that balances supply and demand. If so, certain appli-cations will not be economically defensible.
When something becomes more valuable, it is also even more important for the owners of this asset to manage it sustaina-bly. When assets are not assigned any significant value, they tend to be managed in a sloppy way.
Nordic and North American forest product compa-nies are valued somewhat above their historical norm
The chart shows valuations, based on 12-month forward-looking earnings (EV/EBIT), for 13 leading forest product companies in Sweden, Finland, the US and Canada since 2006. The expansion of multiples has been larger and lasted longer in companies with a majority of their value in forest properties than in those with all or most of their value in indus-trial assets. The valuation upturn is larger in North America than in the Nordic countries, partly because of greater exposure to the volatile wood products market in North America, but also a larger proportion of forest property-oriented companies in our sample from that region.
Source: Bloomberg
0
5
10
15
20
25
Jan-
06
Nov
-06
Sep-
07
Jul-0
8
May
-09
Mar
-10
Jan-
11
Nov
-11
Sep-
12
Jul-1
3
May
-14
Mar
-15
Jan-
16
Nov
-16
Sep-
17
Jul-1
8
May
-19
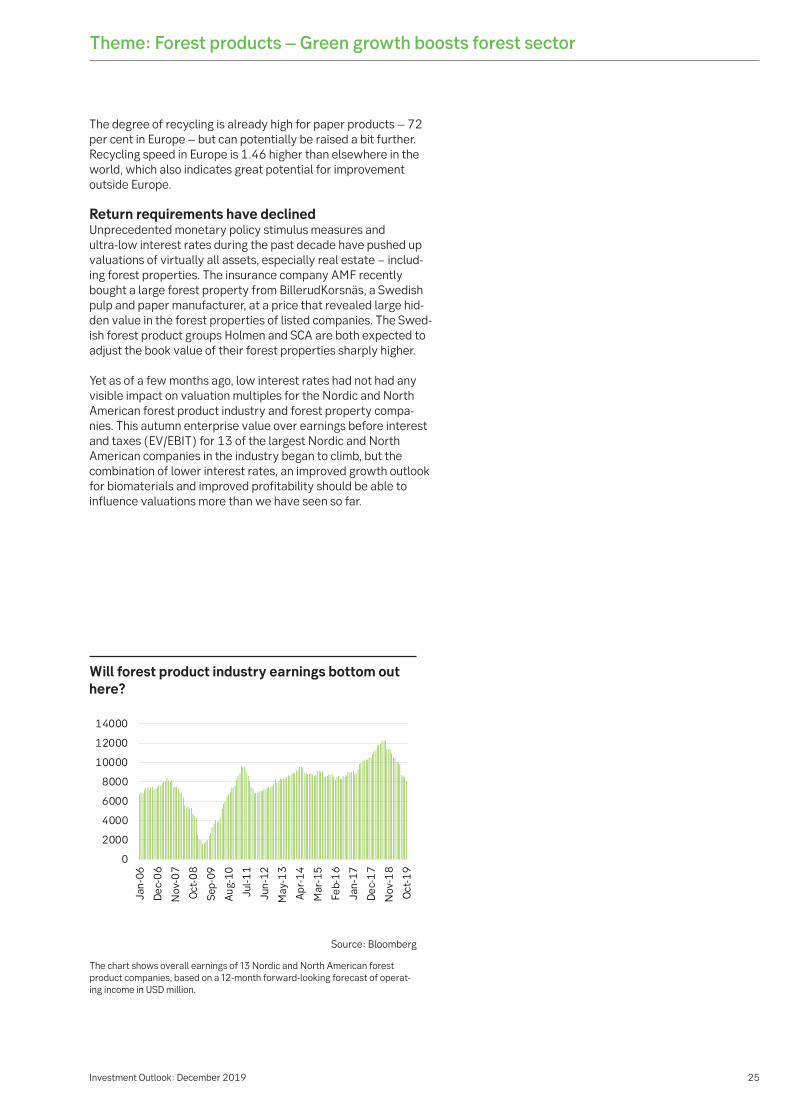
25Investment Outlook: December 2019
Theme: Forest products – Green growth boosts forest sector
Will forest product industry earnings bottom out here?
The chart shows overall earnings of 13 Nordic and North American forest product companies, based on a 12-month forward-looking forecast of operat-ing income in USD million.
Source: Bloomberg
The degree of recycling is already high for paper products – 72 per cent in Europe – but can potentially be raised a bit further. Recycling speed in Europe is 1.46 higher than elsewhere in the world, which also indicates great potential for improvement outside Europe.
Return requirements have declined Unprecedented monetary policy stimulus measures and ultra-low interest rates during the past decade have pushed up valuations of virtually all assets, especially real estate − includ-ing forest properties. The insurance company AMF recently bought a large forest property from BillerudKorsnäs, a Swedish pulp and paper manufacturer, at a price that revealed large hid-den value in the forest properties of listed companies. The Swed-ish forest product groups Holmen and SCA are both expected to adjust the book value of their forest properties sharply higher.
Yet as of a few months ago, low interest rates had not had any visible impact on valuation multiples for the Nordic and North American forest product industry and forest property compa-nies. This autumn enterprise value over earnings before interest and taxes (EV/EBIT) for 13 of the largest Nordic and North American companies in the industry began to climb, but the combination of lower interest rates, an improved growth outlook for biomaterials and improved profitability should be able to influence valuations more than we have seen so far.
0
2000
4000
6000
8000
10000
12000
14000
Jan-
06
Dec
-06
Nov
-07
Oct
-08
Sep-
09
Aug
-10
Jul-1
1
Jun-
12
May
-13
Apr
-14
Mar
-15
Feb-
16
Jan-
17
Dec
-17
Nov
-18
Oct
-19

26Investment Outlook: December 2019
Contributors to this issue of Investment Outlook
This report was published on November 26, 2019. Its contents are based on analysis and information available until November 25, 2019.
Kai Svensson Acting Chief Investment Officer Investment Strategy [email protected]
Louise Lundberg Economist Investment Strategy [email protected]
Stefan Lukacs Portfolio Manager Investment Strategy [email protected]
Esbjörn Lundevall Equity Analyst Investment Strategy [email protected]
Pernilla Busch Investment Communication Mgr Investment Strategy [email protected]
Henrik Larsson Portfolio Manager Investment Strategy [email protected]
Cecilia Kohonen Investment Communication Mgr Investment Strategy [email protected]
Elisabet Törnered Investment Communication Investment Strategy [email protected]
This document produced by SEB contains general marketing information about its investment products. SEB is the global brand name of Skandinaviska Enskilda Banken AB (publ) and its subsidiaries and branches. Neither the material nor the products described herein are intended for distribution or sale in the United States of America or to persons resident in the United States of America, so-called US persons, and any such distribution may be unlawful. Although the content is based on sources judged to be reliable, SEB will not be liable for any omissions or inaccuracies, or for any loss whatsoever which arises from reliance on it. If investment research is referred to, you should if possible read the full report and the disclo-sures contained within it, or read the disclosures relating to specific companies found on www.seb.se/mb/disclaimers. Information relating to taxes may become outdated and may not fit your individual circumstances. Investment products produce a return linked to risk. Their value may fall as well as rise, and historic returns are no guarantee of future returns; in some cases, losses can exceed the initial amount invested. Where either the underlying funds or you invest in funds or securities denominated in a foreign currency, changes in exchange rates can impact the return. You alone are responsible for your investment decisions and you should always obtain detailed information before taking them. For more informa-tion please see inter alia the Key Investor Information Document for funds and the information brochure for funds and for structured products, available at www.seb.se. If necessary, you should seek advice tailored to your individual circumstanc-es from your SEB advisor.
Information about taxation: As a customer of our International Private Banking offices in Luxembourg and Singapore you are obliged to keep yourself informed of the tax rules applicable in the countries of your citizenship, residence or domicile with respect to bank accounts and financial transactions. You must yourself provide concerned authorities with informa-tion as and when required.
Investment StrategySEBSE-106 40 Stockholm
Contact information
Stefan Cederberg Equity Analyst Investment Strategy [email protected]
Johan Hagbarth Economist Investment Strategy [email protected]