Embed Size (px)
Citation preview

INVESTMENT OPPORTUNITY OF UKRAINIAN ORGANIC MARKET
by
Nataliia Soldatenko
A thesis submitted in partial fulfillment of the requirements for the degree of
MA in Business and Financial Economics
Kyiv School of Economics
2019
Thesis Supervisor: Professor: Volodymyr Vakhitov Approved by ___________________________________________________ Head of the KSE Defense Committee, Professor [Type surname, name]
__________________________________________________
__________________________________________________
__________________________________________________
Date _______________________________
iii
TABLE OF CONTENTS
LIST OF FIGURES .......................................................................................................... iv LIST OF TABLES .............................................................................................................. v LIST OF ABBREVIATIONS ........................................................................................ vi Chapter 1. EXECUTIVE SUMMARY .......................................................................... 7 Chapter 2. INDUSTRY ANALYSIS AND RESULTS .............................................. 8
2.1. Industry overview ................................................................................................. 8 2.2. Competitive landscape ....................................................................................... 14 2.3. Product benchmarking ...................................................................................... 15 2.4. Financial performance ....................................................................................... 17 2.5. PEST analysis ...................................................................................................... 20 2.6. SWOT analysis .................................................................................................... 21 2.7. Driving forces analysis ....................................................................................... 24
Chapter 3. CONCLUSIONS AND RECOMMENDATIONS ............................. 27 REFERENCES ................................................................................................................. 29 APPENDIX A ................................................................................................................... 31 APPENDIX B ................................................................................................................... 32 APPENDIX C ................................................................................................................... 33 APPENDIX D .................................................................................................................. 34
iv
LIST OF FIGURES
Figure 1. Global organic food and beverages market (2001-2017), in billions of euros ...... 9 Figure 2. Retail sales in Ukraine, 2008-2017, in millions of euros .......................................... 10 Figure 3. Organic exports of Ukraine in millions of euros ...................................................... 11 Figure 4. Dynamics of organic land area in the world, 2008-2017 ........................................ 12 Figure 5. Dynamics of organic land area in Ukraine, 2008-2017 ........................................... 12 Figure 6. Dynamics of the number of organic producers in Ukraine, 2008-2017 .............. 13 Figure 7. Top agribusinesses in Ukraine by the area of organic land, in thousands of ha. 14 Figure 8. Geography distribution of main organic producers in Ukraine, 2019 ................. 15 Figure 9. Selected European countries: users who buy organic food and drink products
because they think they offer higher animal welfare standards than conventional products (%), 2017 ............................................................................................................ 25
v
LIST OF TABLES
Table 1. The difference between organic, natural and conventional products ...................... 8 Table 2. Summary of organic companies' portfolios ................................................................ 16 Table 3. Key financial ratios of Ethnoproduct .......................................................................... 19

vi
LIST OF ABBREVIATIONS
EU The European Union
FiBL Research Institute of Organic Agriculture
IFOAM - Organics International The International Federation of Organic Agriculture Movements
CAGR Compound Annual Growth Rate
USA The United States of America
ha Hectare
USDA The United States Department of Agriculture
NOP The National Organic Program
R&D Research & Development
ROA Return on assets
ROE Return on equity
CapEx Capital expenditures
FAO Food and Agriculture Organization of the United Nations

7
CHAPTER 1. EXECUTIVE SUMMARY
In the world of high opportunity costs and risks associated with investments in
such developing markets as Ukraine, it might be difficult to find an appropriate way to
address future uncertainty through proper capital allocation. However, taking into account
recent global movements towards sustainable consumption and production, one needs to
analyze whether the development of organic agriculture in Ukraine could become relevant
and profitable niche during the transition to the so-called "green economy" satisfying our
unchangeable demand for food in the resource-constrained world. Further research draws
both on international and local industry data.
Provided industry analysis links the world’s trends in organic agriculture to the ones
taking place in Ukraine and shows the potential of the country to become the key supplier
of unprocessed goods on the EU organic market. Moreover, competitive landscape analysis
reveals a few major players in the Ukrainian organic market, while further product
benchmarking uncovers different attitudes towards product portfolio construction. When
examining the historical financial position of the organic company by comprehensive
horizontal and vertical analysis of the income statement and balance sheet, findings lead to
the fact that agribusiness exhibits strong financial performance. Conducted PEST, SWOT
and driving forces analysis outline the favorable environment of the organic industry.
Therefore, green practices such as organic food production can be one of the best
options to invest since it can be treated as an engine for future economic development.
The steady annual growth of global demand for organic products creates great momentum
for Ukraine to become one of the largest players in the market through setting export-
oriented practices. In the meantime, potential investors may focus on domestic demand
manufacturing more value-added organic products and conducting national campaigns
devoted to widening knowledge concerning the benefits of organic food during the
promotion of healthier lifestyles in new generations of consumers.

8
CHAPTER 2. INDUSTRY ANALYSIS AND RESULTS
2.1. Industry overview
Though organic products became popular through finding their way into store
shelves and then coming right into consumers’ shopping baskets, it still might be confusing
to distinguish them from other products labeled «natural», which use marketing strategy
pretending to be produced without any harm to the environment. Therefore, first of all, it
is crucial to understand the difference between such concepts as organic, bio or eco, natural
and conventional products.
According to Table 1, organic, bio or eco products have the strictest production
and transportation requirements to guarantee their compliance with the law and globally
established standards in producing environmentally friendly products by implementing
best environmental practices. In general, organic, bio or eco are the similar concepts used
in different parts of the world (Eco Madein.md 2018):
Organic – is used for agri-food products in the US and Canada;
Bio or Eco – are the same concepts used in the Franco-German region and
most EU countries.
Table 1. The difference between organic, natural and conventional products
Product Requirements Organic, Bio or Eco
Natural Conventional
The use of synthetic dyes, flavors, preservatives - - +
The use of artificial fertilizers - + +
The use of pesticides, herbicides, fungicides - + +
The use of genetically modified ingredients - + +
Specific soil requirements + - -
Special transport conditions + - -
Marking and special manufacturer requirements + - -
Source: Economichna Pravda (2018)
9
Worldwide, the organic market has constantly expanded fueled by a strong demand
for sustainable products. According to the FiBL and IFOAM - Organics International
cornerstone survey "The World of Organic Agriculture", organic retail sales, the organic
farmland and the number of organic producers continued to grow and reached another all-
time high in 2017, as shown by the data from 181 countries (FiBL & IFOAM – Organics
International 2019).
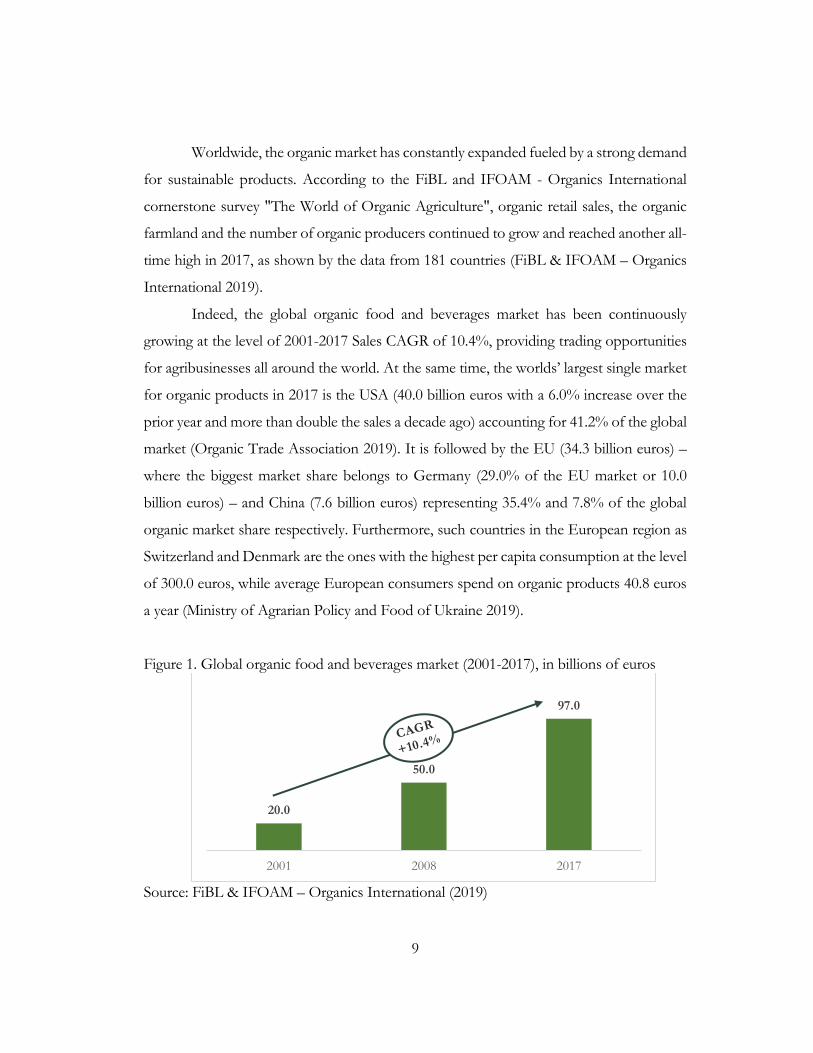
Indeed, the global organic food and beverages market has been continuously
growing at the level of 2001-2017 Sales CAGR of 10.4%, providing trading opportunities
for agribusinesses all around the world. At the same time, the worlds’ largest single market
for organic products in 2017 is the USA (40.0 billion euros with a 6.0% increase over the
prior year and more than double the sales a decade ago) accounting for 41.2% of the global
market (Organic Trade Association 2019). It is followed by the EU (34.3 billion euros) –
where the biggest market share belongs to Germany (29.0% of the EU market or 10.0
billion euros) – and China (7.6 billion euros) representing 35.4% and 7.8% of the global
organic market share respectively. Furthermore, such countries in the European region as
Switzerland and Denmark are the ones with the highest per capita consumption at the level
of 300.0 euros, while average European consumers spend on organic products 40.8 euros
a year (Ministry of Agrarian Policy and Food of Ukraine 2019).
Figure 1. Global organic food and beverages market (2001-2017), in billions of euros
Source: FiBL & IFOAM – Organics International (2019)
20.0
50.0
97.0
2001 2008 2017
10
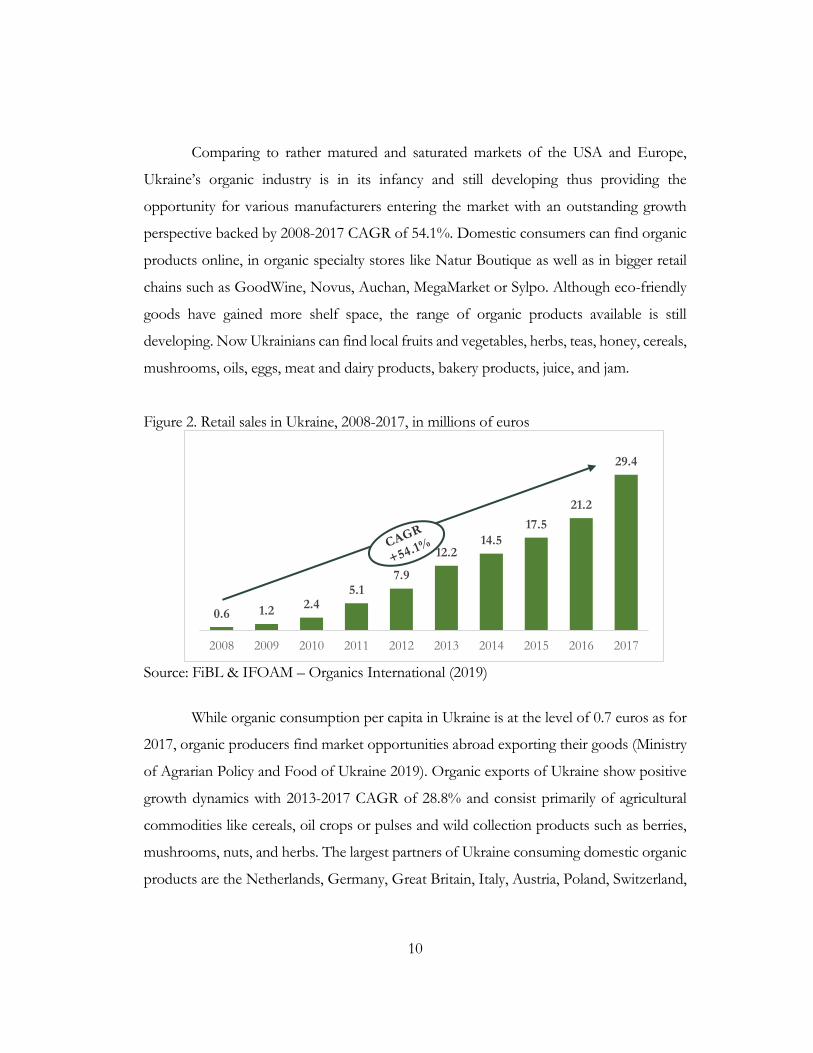
Comparing to rather matured and saturated markets of the USA and Europe,
Ukraine’s organic industry is in its infancy and still developing thus providing the
opportunity for various manufacturers entering the market with an outstanding growth
perspective backed by 2008-2017 CAGR of 54.1%. Domestic consumers can find organic
products online, in organic specialty stores like Natur Boutique as well as in bigger retail
chains such as GoodWine, Novus, Auchan, MegaMarket or Sylpo. Although eco-friendly
goods have gained more shelf space, the range of organic products available is still
developing. Now Ukrainians can find local fruits and vegetables, herbs, teas, honey, cereals,
mushrooms, oils, eggs, meat and dairy products, bakery products, juice, and jam.
Figure 2. Retail sales in Ukraine, 2008-2017, in millions of euros
Source: FiBL & IFOAM – Organics International (2019)
While organic consumption per capita in Ukraine is at the level of 0.7 euros as for
2017, organic producers find market opportunities abroad exporting their goods (Ministry
of Agrarian Policy and Food of Ukraine 2019). Organic exports of Ukraine show positive
growth dynamics with 2013-2017 CAGR of 28.8% and consist primarily of agricultural
commodities like cereals, oil crops or pulses and wild collection products such as berries,
mushrooms, nuts, and herbs. The largest partners of Ukraine consuming domestic organic
products are the Netherlands, Germany, Great Britain, Italy, Austria, Poland, Switzerland,
0.6 1.2 2.4
5.1 7.9
12.2 14.5
17.5
21.2
29.4
2008 2009 2010 2011 2012 2013 2014 2015 2016 2017

11
Belgium, Czech Republic, Bulgaria, Hungary, USA, Canada, Australia, and some Asian
countries (Ministry of Agrarian Policy and Food of Ukraine 2019).
Figure 3. Organic exports of Ukraine in millions of euros
Source: FiBL & IFOAM – Organics International (2019)
Having a share of 95.0%, the EU is the main organic export market for Ukraine.
Moreover, according to the European Commission, Ukraine is the first supplier of the EU
of organic products from the European continent in 2018 (European Commission 2018).
Ukraine is among the Top-5 importers of organic products to the EU, while the volume
of the organic agri-food from the country is 267.0 thousand tons, representing an 8.2%
share of the total volume of the EU imports.
Ukraine exports to the EU primarily consist of commodities including cereals,
other than wheat and rice – 114.0 thousand tons or 42.8% of the total volume, wheat –
76.0 thousand tons or 28.5% and oilseeds – 42.0 thousand tons or 15.8%. The share of
processed goods in Ukrainian exports is insignificant and consists of fruit juices, which
account for 6 thousand tons, or 2.2% of the total volume.
Overall, global demand for food and beverages will continue growing with a
projected 2019-2022 CAGR of 8.9% (The Business Research Company n.d.). This constant
increase is backed by supply-side market participants working in land areas and satisfying
constantly increasing demand.
Concerning the latest available data for 2017, the share of organic land area in the
total global land fund is only 1.4% (FiBL & IFOAM – Organics International 2019).
However, the area of organic land shows the strongest increase in nominal terms so far by
36.0
70.0
50.0 59.0
99.0
2013 2014 2015 2016 2017

12
11.6 million ha or 19.9%: from 58.2 million ha in 2016 to 69.8 million ha in 2017. Half of
the global organic agricultural land or 35.9 million ha belongs to the Oceania region, 35.6
million ha of which are accounted for by Australia alone, while 20.9% or 14.6 million ha –
to Europe (where 12.8 million ha to the EU itself) and 11.5% or 8.0 million ha – to Latin
America.
Figure 4. Dynamics of organic land area in the world, 2008-2017
Source: FiBL & IFOAM – Organics International (2019)
With 0.3 million ha, Ukraine is among the Top-25 countries with the largest area
of organic agricultural land in 2017 and among Top-15 in Europe, where Ukraine takes the
13th place. However, the area of organic agricultural land constitutes only a 0.7% share of
the total agricultural land of Ukraine providing a strong platform for its further continuous
growth.
Figure 5. Dynamics of organic land area in Ukraine, 2008-2017
Source: FiBL & IFOAM – Organics International (2019)
34.5 36.3 35.7 36.7 36.8 43.1 48.8 50.558.2
69.8
0.7%0.8% 0.8% 0.8% 0.8%
0.9%1.0% 1.0%
1.2%1.4%
0.00%
0.50%
1.00%
1.50%
0
20
40
60
80
2008 2009 2010 2011 2012 2013 2014 2015 2016 2017
Organicland area,millions ha
Share oforganicland in thetotal landfund
270.0 270.2 270.2 270.3 272.9
393.4 400.8 410.6 381.2 289.0
0.7% 0.7% 0.7% 0.7% 0.7%
1.0% 1.0% 1.0%0.9%
0.7%
0.00%
0.20%
0.40%
0.60%
0.80%
1.00%
1.20%
0.0
100.0
200.0
300.0
400.0
500.0
2008 2009 2010 2011 2012 2013 2014 2015 2016 2017
Organicland area, inthousandsof ha
Share oforganicland in thetotal landfund

13
The world organic agricultural land areas are being processed by 2.9 million organic
producers, 88.8% or 2.4 million of which are from developing countries and emerging
markets in Asia, Africa and Latin America (FiBL & IFOAM – Organics International
2019). Top-3 countries with the largest number of organic producers are India – 0.8 million,
Uganda and Mexico – 0.2 million each. Comparing to the previously mentioned pace of
growth of farmland managed organically on Figure 4, the number of organic producers
shows a moderate increase of 4.7% from 2016.
Comparing to the moderate growth of organic land areas in Ukraine showed on
Figure 5, the number of organic producers entering the market increases from 118 in 2008
to 304 in 2017 at the pace of 2008-2017 CAGR of 11.1% (FiBL & IFOAM – Organics
International 2019). As of 2019, the total number of organic manufacturers certified by
Organic Standard is 507, showing a rapid increase of 66.8% from 2017. Furthermore, the
biggest share of organic manufacturers produces crops and exports their goods abroad.
Figure 6. Dynamics of the number of organic producers in Ukraine, 2008-2017
Source: FiBL & IFOAM – Organics International (2019)
As of 2019 Kyiv region and Kyiv city itself accumulate the highest number of
organic producers – 92, this area is followed by Vinnytsia and Kharkiv regions with 62 and
35 manufacturers respectively. These key regions represent 37.3% share from the total
number of organic producers spread across the country.
118 121142
155 164175 182
210
294 304
2008 2009 2010 2011 2012 2013 2014 2015 2016 2017
14
2.2. Competitive landscape
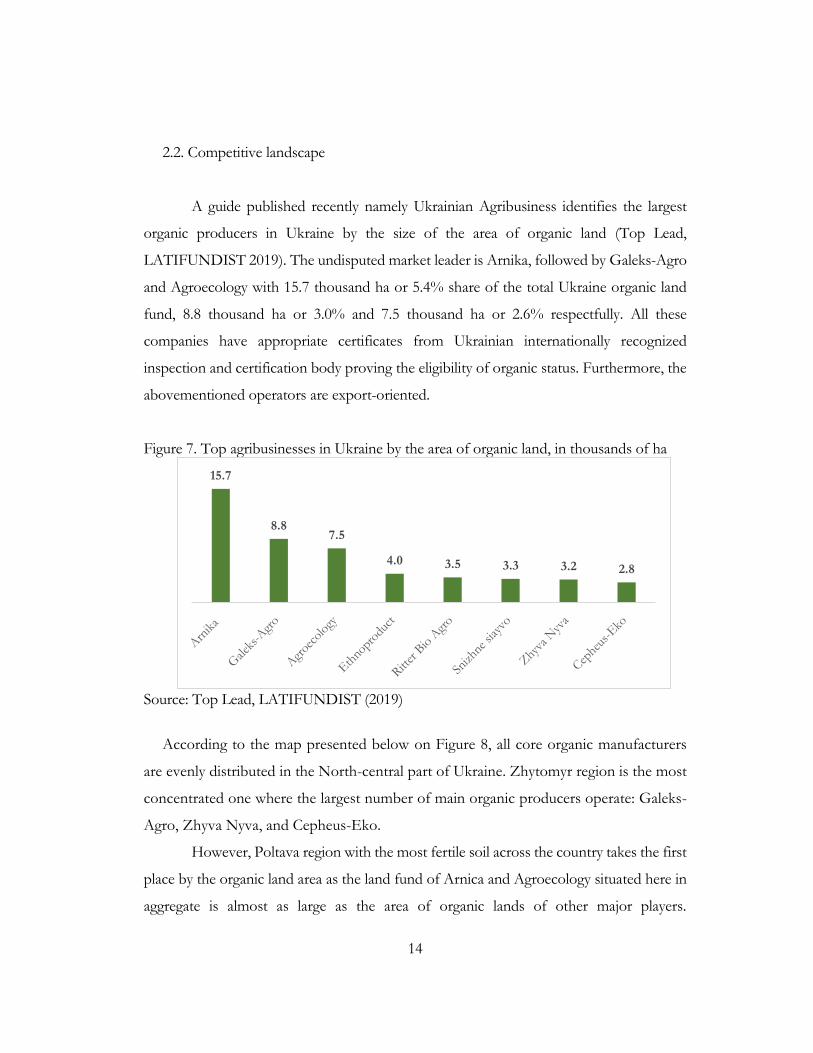
A guide published recently namely Ukrainian Agribusiness identifies the largest
organic producers in Ukraine by the size of the area of organic land (Top Lead,
LATIFUNDIST 2019). The undisputed market leader is Arnika, followed by Galeks-Agro
and Agroecology with 15.7 thousand ha or 5.4% share of the total Ukraine organic land
fund, 8.8 thousand ha or 3.0% and 7.5 thousand ha or 2.6% respectfully. All these
companies have appropriate certificates from Ukrainian internationally recognized
inspection and certification body proving the eligibility of organic status. Furthermore, the
abovementioned operators are export-oriented.
Figure 7. Top agribusinesses in Ukraine by the area of organic land, in thousands of ha
Source: Top Lead, LATIFUNDIST (2019)
According to the map presented below on Figure 8, all core organic manufacturers
are evenly distributed in the North-central part of Ukraine. Zhytomyr region is the most
concentrated one where the largest number of main organic producers operate: Galeks-
Agro, Zhyva Nyva, and Cepheus-Eko.
However, Poltava region with the most fertile soil across the country takes the first
place by the organic land area as the land fund of Arnica and Agroecology situated here in
aggregate is almost as large as the area of organic lands of other major players.
15.7
8.8 7.5
4.0 3.5 3.3 3.2 2.8

15
Ethnoproduct, Ritter Bio Agro and Snizhne siayvo are located in Chernihiv, Rivne and
Kyiv regions accordingly.
Figure 8. Geography distribution of main organic producers in Ukraine, 2019
2.3. Product benchmarking
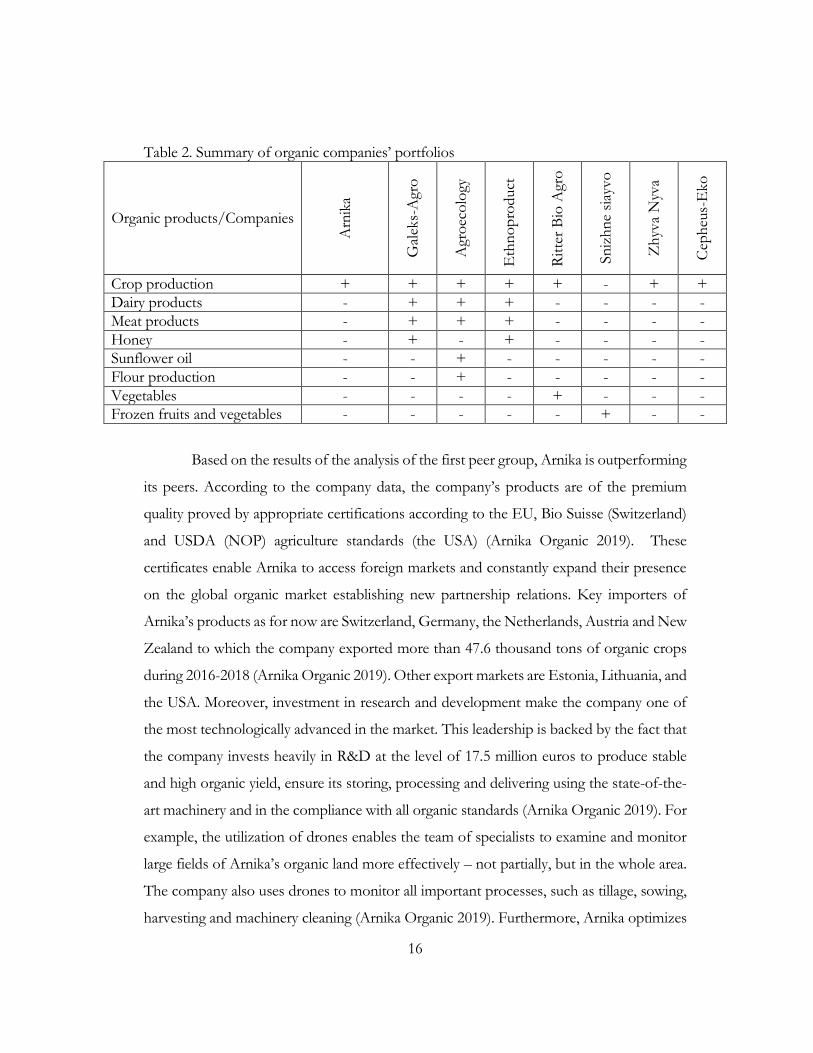
Identifying the key organic producers of Ukraine, the next step is to conduct
product analysis. The Table 2 below summarizes product portfolios of top organic
manufacturers.
The first group of similar companies by the manufactured products includes
Arnika, Zhyva Nyva, Cepheus-Eko as well as Ritter Bio Agro which specialize in the
production of crops and vegetables.
The second group consists of Galeks-Agro, Agroecology, and Ethnoproduct.
Their product portfolios are more diversified and include not only crop production but
also dairy and meat products. Moreover, Galeks-Agro and Ethnoproduct also produce
organic honey, while Agroecology – sunflower oil and flour.
Finally, there are no big competitors for Snizhne siayvo at the frozen fruits and
vegetable segment creating a chance for other companies to fill the market niche and satisfy
increasing demand for organic products.
Sumy Chernihiv
Kyiv
Odesa
Kharkiv Poltava
Luhansk
Donetsk
Zaporizhzhia
Kherson
Autonomous Republic of
Crimea
Mykolaiv
Zhytomyr
Chernivtsi
Vinnytsia
Cherkasy
Kropyvnytskyi Dnipropetrovsk
Volyn
Zakarpattia
Lviv
Ivano-Frankivsk
Ternopil
Rivne
Khmelnytskyi Arnika
Galeks-Agro
Ethnoproduct Ritter Bio Agro
Snizhne siaywo Agroecology
Zhyva Nyva
Cepheus-Eko
16
Table 2. Summary of organic companies’ portfolios
Organic products/Companies
Arn
ika
Gal
eks-
Agr
o
Agr
oec
olo
gy
Eth
no
pro
duct
Rit
ter
Bio
Agr
o
Sn
izh
ne
siay
vo
Zh
yva
Nyv
a
Cep
heu
s-E
ko
Crop production + + + + + - + +
Dairy products - + + + - - - -
Meat products - + + + - - - -
Honey - + - + - - - -
Sunflower oil - - + - - - - -
Flour production - - + - - - - -
Vegetables - - - - + - - -
Frozen fruits and vegetables - - - - - + - -
Based on the results of the analysis of the first peer group, Arnika is outperforming
its peers. According to the company data, the company’s products are of the premium
quality proved by appropriate certifications according to the EU, Bio Suisse (Switzerland)
and USDA (NOP) agriculture standards (the USA) (Arnika Organic 2019). These
certificates enable Arnika to access foreign markets and constantly expand their presence
on the global organic market establishing new partnership relations. Key importers of
Arnika’s products as for now are Switzerland, Germany, the Netherlands, Austria and New
Zealand to which the company exported more than 47.6 thousand tons of organic crops
during 2016-2018 (Arnika Organic 2019). Other export markets are Estonia, Lithuania, and
the USA. Moreover, investment in research and development make the company one of
the most technologically advanced in the market. This leadership is backed by the fact that
the company invests heavily in R&D at the level of 17.5 million euros to produce stable
and high organic yield, ensure its storing, processing and delivering using the state-of-the-
art machinery and in the compliance with all organic standards (Arnika Organic 2019). For
example, the utilization of drones enables the team of specialists to examine and monitor
large fields of Arnika’s organic land more effectively – not partially, but in the whole area.
The company also uses drones to monitor all important processes, such as tillage, sowing,
harvesting and machinery cleaning (Arnika Organic 2019). Furthermore, Arnika optimizes

17
its business processes by special software and hardware complex system for machinery
monitoring updating management with each step of operations and enabling them to make
more well-informed decisions (Arnika Organic 2019).
The second peer group is more homogeneous and presented by similar companies.
All operators are private enterprises apart from Ethnoproduct, which is a private joint-
stock company disclosing its financial results.
Compliance with the requirements set out in the EC regulations 834/2007 and
889/2008, as well as with the Bio Suisse (Switzerland) and Bioland (Germany) standards
have been confirmed by Galeks-Agro. The company exports 75.0% of its products mainly
to Switzerland, Germany, Hungary, Israel, the Netherlands, Italy, Ireland, and the United
Kingdom. Moreover, it opens the first in Ukraine certified dairy plant for the production
of organic dairy products from its raw materials – "Organic Milk" and "Organic meat
product".
Agroecology is one of the pioneers in organic farming practices within Ukraine
since the 1980s. It has developed its organic management system and processing
infrastructure to preserve and increase soil fertility as part of its day-to-day operations.
Agroecology targets both the domestic and the export market of Switzerland, Germany,
Canada, the Netherlands and Austria (ukraine.fibl.org 2017).
In its turn, Ethnoproduct’s core business purpose is producing natural food such
as organic cereals, dairy, and meat products in compliance with international organic
principles and standards. Ethnoproduct’s dairy product portfolio consists of raw milk,
pasteurized milk, sour cream, kefir, and lean yogurt.
2.4. Financial performance
Since Ethnoproduct is a private joint-stock company among other top organic
producers, its results might be treated as barometer of financial performance of the sector.
Sound revenue generation serves as an indicator of the confidence and stability of
the company. In 2017, net sales of the company reached 38.6 million UAH up from 15.3
18
million UAH in 2013 with the corresponding 2013-2017 CAGR of 25.9%. Reasonable cost
reduction policy of the enterprise, such as the establishment of a vertically integrated full-
cycle company along with sharp price drop of crude oil in 2015 – one of the major
component of costs structure – have a positive impact on gross profit margin from 17.8%
in 2013 to 33.4% in 2017.
Net income margin has been rising steadily over the last years. An increase in
marketing expenses from 10.6% of total revenue in 2016 to 18.4% in 2017 affects heavily
the bottom line of the company in 2017 representing a drop of net income margin down
from 21.6% to 8.4%. Such a decision by the company’s management may be the
consequence of the dissemination of implausible information on the brand that occurred
in 2016. The fact is that the public organization "Ukrainian Consumer Rights Protection
Association" posted on its website an article entitled "The Butter – Benefit and Damage,
Facts and Myths about the Product", which stated that the butter "Organic" of the
company Ethnoproduct, 73% of fat, does not meet the requirements of the regulator. The
analyses revealed non-dairy fat, the use of which is prohibited. The company filed a lawsuit
against the Association, as a result of which the court recognized the information posted
as inaccurate and not corresponding to reality, as well as humiliating Ethnoproduct’s
business reputation (YOU CONTROL 2016). Even though the public organization was
obliged to disprove the inaccurate information about the company by the results of the
lawsuit, only falsified articles remained on the web without any further references to
refutation on the Association’s website.
Other operating income like income from changes in the value of assets measured
at fair value or gain on initial recognition of biological assets and agricultural products is
volatile and constitutes 39.9% of the revenue in 2014 down to 14.1% in 2015. However, it
enables the company to cover its operating expenses and ensure a two-digit net income
margin during 2015-2017.
Profitability ratios such as ROA and ROE show how effectively assets and equity
generate a net profit of the company. Ethnoproduct has the peak of return in 2015, with
corresponding stabilization in 2017.

19
The financial health of the company is measured by current and quick ratios
showing a company’s short-term liquidity and ability to generate enough cash to pay off all
debts should they become due at once (Folger 2019). Those ratios have positive dynamics
improving steadily from 2013.
While the abovementioned profitability ratios assess the ability of the company to
generate net profit, asset turnover shows how effectively Ethnoproduct generates revenue.
This indicator improves gradually from 0.8 in 2013 to 1.09 in 2017, making more sales per
1 UAH of assets.
The quick ratio also measures the liquidity of a company by measuring how well its
current assets could cover its current liabilities.
Management of the company attracts external capital at the level of 2.2 million
UAH in 2017 to finance the acquisition of property, plant, and equipment and expand
current operations. Therefore, 2017 Debt to Assets as well as Debt to Equity ratios are of
0.06 and 0.13 correspondingly.
Table 3. Key financial ratios of Ethnoproduct
2013 2014 2015 2016 2017
Profitability Gross profit margin 17.8% 19.1% 38.0% 41.7% 33.4%
Net income margin 0.4% 2.6% 35.4% 44.8% 26.2%
ROA 0.3% 2.2% 28.1% 23.5% 11.4%
ROE 8.9% 38.7% 83.9% 51.4% 23.2%
Liquidity Current ratio 0.64 0.56 0.87 1.37 1.58
Quick ratio 0.48 0.26 0.40 0.48 0.69
Efficiency ratios Asset turnover 0.80 1.07 1.46 0.90 1.09
Solvency ratios Debt/Assets 0.00 0.00 0.00 0.00 0.06
Debt/Equity 0.00 0.00 0.00 0.00 0.13
20
2.5. PEST analysis
Political factors. Organic farming was stated as one of the priority areas within the
2015-2020 strategy document for agriculture and rural development issued by the Ministry
of Agrarian Policy and Food (Ministry of Agrarian Policy and Food of Ukraine 2019).
Moreover, organic exporters from Ukraine benefit strongly from the Association
Agreement signed in June 2014 between the EU and Ukraine, the further implementation
of which has reduced the trade barriers for Ukrainian exporters enable them to become
core suppliers of eco-friendly products to European markets.
Recently, the Law of Ukraine No. 2496 "On the Basic Principles and Requirements
for Organic Production, Handling and Labelling of Organic Products" came into force
protecting bona fide organic producers from those who unreasonably add "eco" and "bio"
prefixes to promote their goods as natural or organic.
Economic factors. Signed Association Agreement between the EU and Ukraine is also
a cornerstone of facilitating and promoting trade and foreign direct investment in
manufacturing of eco-labeled goods and environmental products as well as modernization
of agriculture practices through addressing the related non-tariff barriers (EapGREEN
Partnership for Environment and Growth n.d.).
Organic exports to the EU – the major Ukrainian partner – offer higher price
premiums and a stable source of revenue generation for organic producers.
Moreover, organic agriculture is more labor-intensive than conventional one thus
providing economic benefits to society in the form of a higher rate of employment,
especially in rural areas.
Social factors. Rising awareness about the effects of consuming “fast food” and
popularization of organic products will assist in the development of a healthier lifestyle as
well as establishment a basic understanding of the positive consequences of organic
production spreading.
Organic practices provide long-term benefits in the building up of natural capital,
particularly in soils through excluding any utilization of chemical fertilizers and ensuring

21
regular crop rotation. Such organic principles reduce soil erosion and increase soil fertility
as well as crop yield. Moreover, an indirect consequence of mainstream adoption of organic
agriculture is reduced costs for society in such spheres as water purification or health care.
As it was outlined above, green practices are more labor intensive, so the shortage
of human resources might improve labor conditions.
Technological factors. The country’s grain storage facilities or transportation networks
are designed for conventional agribusiness practices, so that organic producers need to
invest heavily in different equipment and special organic infrastructure to meet strict
organic standards.
In addition to foreign technology, local organic producers present their domestic
techniques such as unique plant protection products, fertilizers as well as innovative agri
IT-projects suitable for organic production in Ukraine (BuyOrganic.in.ua 2019).
2.6. SWOT analysis
Strengths. Ukraine has an advantageous geographical location on the global
agribusiness map concerning the core organic market – the EU. Moreover, the country is
characterized by favorable climatic conditions and access to one of the world’s best black
earths with historically low levels of pesticide and fertilizer use.
Ukrainians are characterized by a historical propensity for agriculture and a great
number of people living in the rural area.
Weaknesses. Organic food and beverages market are characterized by a
concentration of demand since more than 84% of sales come from the USA, the EU, and
China, where at the rest of the world organic products are still treated as luxury goods.
Ukraine’s domestic market, in particular, is undeveloped as for now with limited knowledge
on the positive impact of consumption of organic products among both farmers and the
overall population. Moreover, the prices attached to environmentally-friendly products are
higher than that of conventional alternatives creating a financial barrier for potential
customers. Ukraine’s domestic customers are not ready to pay a higher price for organic
22
food, which prevents local producers from moving from traditional agriculture to organic
practices.
The industry faces an increasing number of compliances. There are over 80
national standards and a higher number of private/voluntary standards for organic
agriculture (FiBL & IFOAM – Organics International 2019).
Trade wars and other geopolitical consequences distort market efficiency,
preventing goods and services move freely across the globe. For example, exports of
agricultural products from the USA to China was suffered due to unstable political
relationships between those two countries.
While organic producers from developed countries receive significant support
from the government, manufacturers from developing ones still have limited access to
capital and instruments hedging them from negative market conditions.
Opportunities. In general, organic goods are sold at a premium preventing domestic
buyers from buying local organic food. Therefore, organic food supply is less than the
global constantly increasing demand for environmentally-friendly products. It creates a
chance for agribusinesses to find prospective vacant market niches. Given the surplus of
organic products available at the domestic market, Ukraine has a strong competitive
positioning exporting the goods abroad. Moreover, given the trend of negative trade
balance of Ukraine, possible currency depreciation creates a favorable momentum for
Ukrainian exporters making their goods cheaper and more attractive for foreign
consumers.
Leading organic processors in the EU tend to move away from China, India, and
South America as sources of organic products, seeking greater product traceability and
reliability of imports from European countries (EapGREEN Partnership for Environment
and Growth n.d.). This tendency provides an opportunity for Ukraine to become a major
source of the EU’s organic imports, outperforming its current top organic suppliers such
as China, Ecuador, and the Dominican Republic.
23
Nevertheless, expansion into new markets including Europe, China, the Middle
East, and the United States ensures increasing growth in the export potential of agricultural
products developing new local businesses and agritourism.
Since organic value chains are labor-intensive comparing to conventional
agricultural practices, they drive further rural development generating positive socio-
economic benefits.
Moreover, organic agribusinesses create a niche market for restaurants following
the green trend and willing to take part in the “value-adding” process further. These
practices would stimulate the local tourism industry and provide an opportunity to boost
the economy nurturing the concept of organic trade.
Threats. The absence of proper regulation of the organic market till August 2019
prohibiting the utilization of the "eco" and "bio" prefixes on the products without
appropriate certification led to customers’ distrust of eco-friendly products and the
necessity to rebuild organic brand image in their minds.
Since potential customers in foreign markets are not familiar with Ukraine’s local
brands, it may be difficult for domestic producers to export finished goods with labels
unknown for consumers abroad. Therefore, organic manufacturers are faced with the
challenge of gaining the loyalty and trust of buyers or building strong marketing networks
with foreign partners.
Different fraud cases arising in the organic industry may distort the Ukrainian track
record as a reliable supplier and lead to an inevitable reputation loss damaging the country’s
image as a trustworthy organic exporter. Besides, recently elected policymakers are a source
of uncertainty and economic instability forcing investors to demand higher returns for
associated risks or to abandon investments into Ukrainian projects at all.
Organic producers need to follow various requirements of the EU to comply with
standards regarding product quality. Small scale organic producers are faced with the
challenge of adhering to these criteria as well as providing evidence to confirm the eligibility
of their products for the EU marketplace (EapGREEN Partnership for Environment and
Growth n.d.). Moreover, few organic trade unions such as Bioland in Germany and
24
association Bio Suisse from Switzerland demand organic producers to obtain not only
European certificate to enter their markets but also to successfully get through the
certification according to the strictest private standards (Arnika Organic 2019).
The most difficult stage for organic companies is a transitional one during the
conversion of their land into organic. This transition takes a few years, and products that
are already manufactured according to organic standards continue to sell at the old prices
until the company is certified. The lack of support from the government or investors may
discourage agribusinesses to adopt organic technologies in the future.
Volatility on the FX market and geopolitical tensions could result in a growing
exchange rate and interest rate risks. Possible tightening of monetary policy in the country
might increase interest rates resulting in appreciation of the national currency and reducing
exports. Therefore, local organic goods may become more expensive and less competitive
comparing to the peers’ products from other countries.
Other possible sources of threats are poor management skills and lack of
experience, inefficient working of suppliers, force majeure.
2.7. Driving forces analysis
In general, demand for organic products is consumer-driven. Generational shifts
resulted in the growing population of millennials – one of the largest demographic spending
groups – and increased ethnic diversity change consumer preferences and fuel the growth
of the organic market. The industry is characterized by increasing health concerns regarding
the use of inorganic food and raising awareness of health benefits from consumption of
functional food, as well as increasing demand for less processed foods, sugar-free and low-
calorie products. Also, increasing health consciousness and awareness regarding the
harmful effects of pesticides among consumers is expected to boost sales of organic
products’ producers. High animal welfare standards will also become part of organic
expectations (Mintel 2018). It is supported by other influential movements like vegan,
vegetarian or flexitarian diets in nutrition launching new products such as vegetable meat
and vegetable milk on the market. Moreover, the industry is characterized by brand-loyalty

25
since more and more consumers are willing to stick to those producers they recognize and
trust.
Figure 9. Selected European countries: users who buy organic food and drink products because they think they offer higher animal welfare standards than conventional products (%), 2017
Source: Mintel (2018)
However, the industry is characterized by supply shortages due to the labor-
intensive type of production and difficulties in achieving economies of scale. Therefore,
increasing investments in R&D for organic farming will enhance organic market growth.
Packaging, for example, is one of the key issues that producers are to consider to be
consistent with the integrity of the organic concept. Green manufacturers all around the
world need to find solutions devoted to replacing conventional plastic packages with ones
made from renewable plant-based materials to meet organic consumer’s wishes and
expectations.
Moreover, the industry is characterized by reliable established regulations and
standards as well as a favorable policy environment with different incentives such as
subsidy schemes and investments in capacity building projects for further agribusinesses
development. Many policymakers in both developed and developing countries have
announced their objectives of increasing organic farming practices (FAO 2012). For
example, some governments are encouraging schools and government canteens to use
organic ingredients (FiBL & IFOAM – Organics International 2019).
52.0%
36.0% 34.0% 32.0%
24.0%
Germany France Spain Italy Poland

26
Organic products also expand their presence in the foodservice sector, with a
constantly increasing number of cafes and restaurants providing an opportunity for the
guests to choose environmentally-friendly service options.

27
Chapter 3. CONCLUSIONS AND RECOMMENDATIONS
The so-called "green economy" has mainstreamed environment in line with robust
economic development and pushed it up on the global agenda. The core issue of this
concept is to build such a society dealing with urgent challenges in energy access, waste,
agriculture as well as sustainable urbanization. Focusing on one of the above-mentioned
aspects, greening the economy with agriculture refers to increasing food security meaning
its availability, access, stability, and utilization, while using fewer natural resources, through
improved efficiencies throughout the food value chain (FAO 2012).
Investors all over the world are to identify this huge paradigm shift away from
culture of consumerism and to follow the global trend concerning an increase in organic
food consumption. It is backed by understanding the vital role of green agriculture in
powering and supporting global economic growth in the most sustainable way.
The development of organic agriculture in Ukraine is driven by constantly
increasing global demand for organic products as well as the high profitability of the sector
due to the price premiums granted to eco-friendly products. At the same time, the number
of producers operating in organic market of Ukraine is not so concentrated, providing the
space for new entrants. Since global demand exceeds supply, domestic agribusinesses are
ready to seize the opportunity and increase their presence on the world organic markets
such as Germany, the Netherlands, Italy, Poland, the UK, Austria, France, Belgium, and
Hungary, as well as the USA, Canada, Australia, and different Asian countries. Moreover,
regions with the highest per capita consumption of organic food – Switzerland and
Denmark – guarantee a solid market place for Ukrainian organic manufacturers.
While Ukrainian export-oriented enterprises gain the trust of foreign customers to
local brands supplying unprocessed goods, other promising areas of investment are
devoted to the development of domestic processed organic food and beverages market
which is in its infancy now. This potential creates a huge opportunity for agribusinesses to
enter the growing market. Therefore, investors in Ukrainian organic market may focus on
such sub-categories of the market as: bread and bakery products, baby food, confectionery

28
products, cereals and snacks, and other packaged foods. This strategic decision will allow
agribusiness to establish a solid business model of organic production with high added
value and sell not only raw materials but also semi-finished and processed organic goods,
with further rapid expansion to foreign markets.
To ensure the stable development of domestic organic market, local agribusinesses
may conduct promotional campaigns to educate the public about the benefits of
consuming organic products and explain why they are worth the premium price. Moreover,
this engaging should focus on schoolchildren rather than adults. Such a strategy is justified
by the fact that children are more demanding about the ethics of consumption and
preservation of the environment as well as more flexible in changing the pattern of their
usual behavior. Furthermore, active marketing efforts of agribusinesses might protect their
brand reputation avoiding dissemination of implausible information and further drop in
sales.
Continuous investments in R&D are one of the key factors of maintaining the
leading position in the organic sector since it allows agribusinesses to react faster than other
competitors to the new challenges arising from constantly changing market environment,
as well as to benefit from increased operational and capital efficiency.
29
REFERENCES
Arnika Organic. 2019. Accessed 2019. https://arnikaorganic.com/en/. BuyOrganic.in.ua. 2019. Organic Ukraine Business Guide. Accessed 2019.
https://issuu.com/aviabrand/docs/oubh_digest_biofach. EapGREEN Partnership for Environment and Growth. n.d. Organic Agriculture in Ukraine.
An Opportunity for Greening the Economy. Accessed 2019. http://www.green-economies-eap.org/ru/resources/Organic-agriculture-Ukraine-UNEP-summary.pdf.
Eco Madein.md. 2018. Labeling of products. What is the difference between bio, eco, organic and natural? August 09. Accessed 2019. https://madein.md/en/news/eco-madein-md/labeling-of-products-what-is-the-difference-between-bio-eco-organic-and-natural.
Epravda.com.ua. 2018. The philosophy of "organic". A successful business project or lifestyle? May 29. Accessed 2019. https://www.epravda.com.ua/rus/publications/2018/05/29/637153/.
European Commission. 2018. Organic imports in the EU. FAO. 2012. Greening the Economy with Agriculture. Accessed 2019.
http://www.fao.org/3/i2745e/i2745e00.pdf. FiBL & IFOAM – Organics International. 2019. The World of Organic Agriculture. Statistics
and Emerging Trends 2019. FiBL. 2009. Organic market and trade. Accessed 2019.
https://www.unido.org/sites/default/files/files/2018-09/module_3_organic_market_and_trade.pdf.
Folger, Jean. 2019. Investopedia. April. Accessed 2019. https://www.investopedia.com/ask/answers/062714/what-are-main-differences-between-current-ratio-and-quick-ratio.asp.
Ministry of Agrarian Policy and Food of Ukraine. 2019. Grow Ukraine. Export for U. Accessed 2019. https://minagro.gov.ua/storage/app/sites/1/for-investors/GrowInUkraine_2019-print.pdf.
—. 2019. Organic production in Ukraine. February. Accessed 2019. https://minagro.gov.ua/en/napryamki/organichne-virobnictvo-v-ukrayini.
Mintel. 2018. The European Organic Market: A Consumer Perspective. Organic Trade Association. 2019. https://ota.com. SMIDA. 2017. Issuer's annual financial statements. Accessed 2019.
https://smida.gov.ua/db/emitent/year/xml/showform/116200/165/templ. The Business Research Company. n.d. Food And Beverages Global Market Report 2019.
Accessed 2019. https://www.thebusinessresearchcompany.com/report/food-and-beverages-global-market-report.
30
Top Lead, LATIFUNDIST. 2019. Ukrainian Agribusiness. Accessed 2019. https://agribusinessinukraine.com.
ukraine.fibl.org. 2017. Accessed 2019. https://ukraine.fibl.org/fileadmin/images-ukraine/Biofach_2017/BioFach2017_National_Pavilion_of_Ukraine_Brochure_.pdf.
YOU CONTROL. 2016. Accessed 2019. https://youcontrol.com.ua/ru/catalog/court-document/63479835/.
31
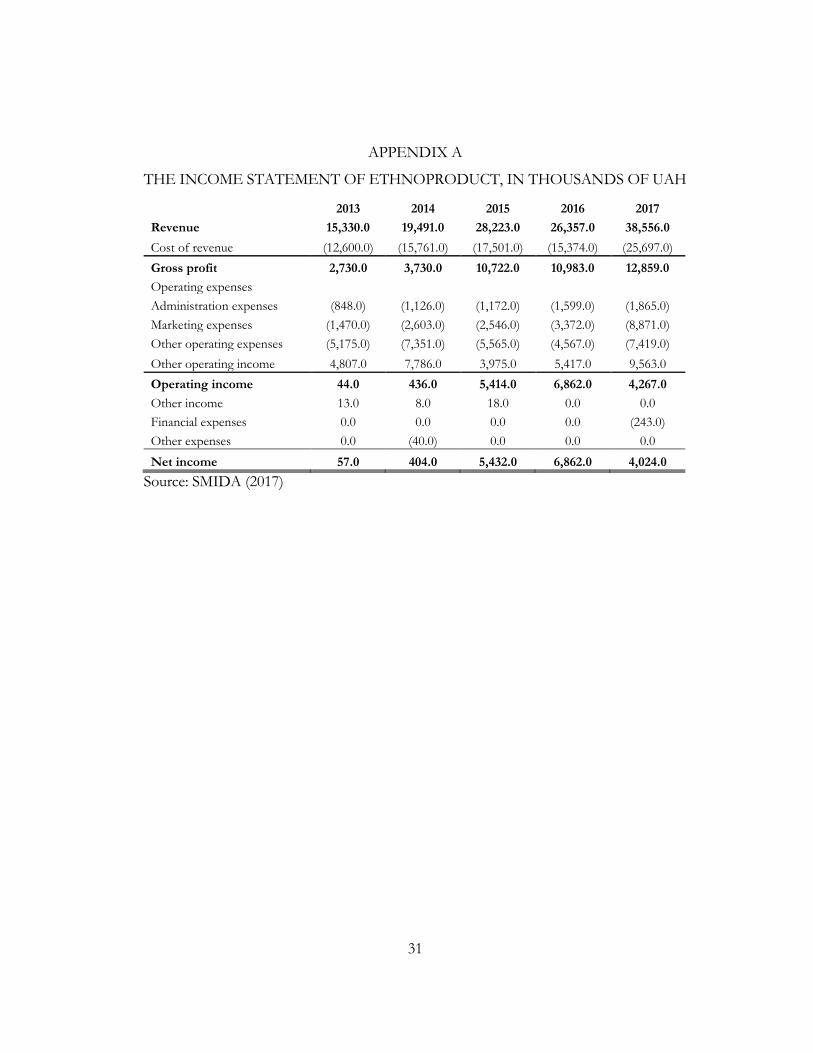
APPENDIX A
THE INCOME STATEMENT OF ETHNOPRODUCT, IN THOUSANDS OF UAH
2013 2014 2015 2016 2017
Revenue 15,330.0 19,491.0 28,223.0 26,357.0 38,556.0
Cost of revenue (12,600.0) (15,761.0) (17,501.0) (15,374.0) (25,697.0)
Gross profit 2,730.0 3,730.0 10,722.0 10,983.0 12,859.0
Operating expenses
Administration expenses (848.0) (1,126.0) (1,172.0) (1,599.0) (1,865.0)
Marketing expenses (1,470.0) (2,603.0) (2,546.0) (3,372.0) (8,871.0)
Other operating expenses (5,175.0) (7,351.0) (5,565.0) (4,567.0) (7,419.0)
Other operating income 4,807.0 7,786.0 3,975.0 5,417.0 9,563.0
Operating income 44.0 436.0 5,414.0 6,862.0 4,267.0
Other income 13.0 8.0 18.0 0.0 0.0
Financial expenses 0.0 0.0 0.0 0.0 (243.0)
Other expenses 0.0 (40.0) 0.0 0.0 0.0
Net income 57.0 404.0 5,432.0 6,862.0 4,024.0
Source: SMIDA (2017)
32
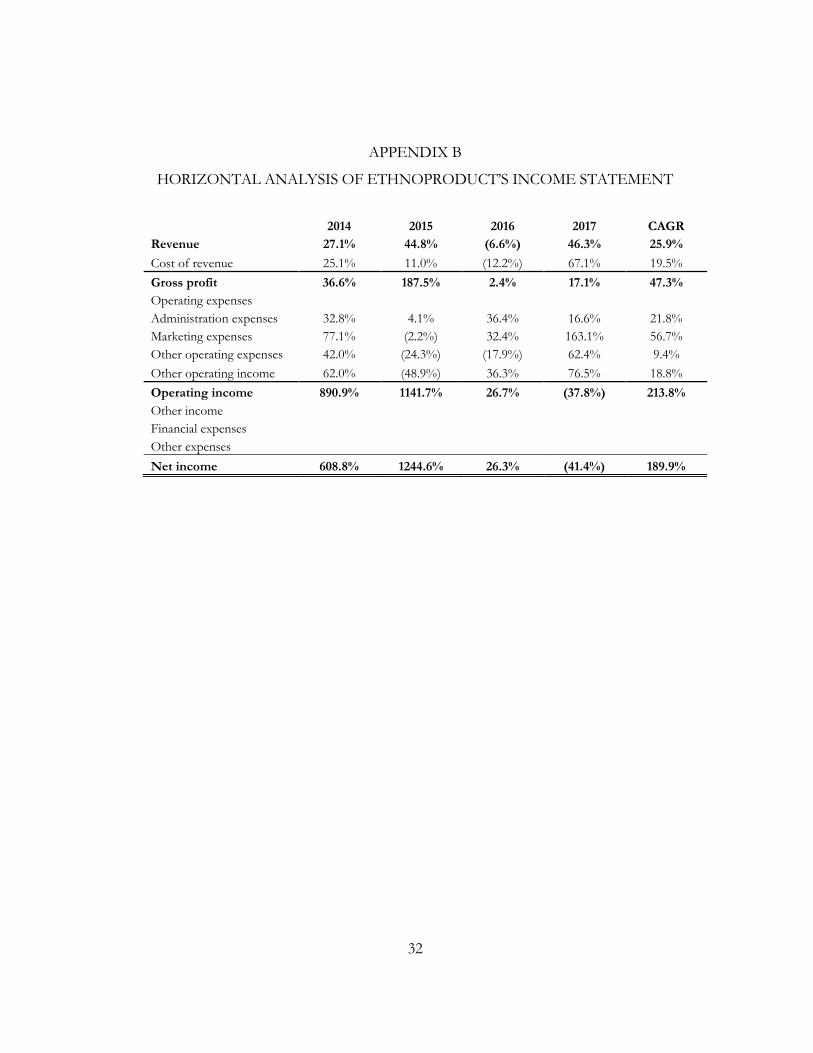
APPENDIX B
HORIZONTAL ANALYSIS OF ETHNOPRODUCT’S INCOME STATEMENT
2014 2015 2016 2017 CAGR
Revenue 27.1% 44.8% (6.6%) 46.3% 25.9%
Cost of revenue 25.1% 11.0% (12.2%) 67.1% 19.5%
Gross profit 36.6% 187.5% 2.4% 17.1% 47.3%
Operating expenses Administration expenses 32.8% 4.1% 36.4% 16.6% 21.8%
Marketing expenses 77.1% (2.2%) 32.4% 163.1% 56.7%
Other operating expenses 42.0% (24.3%) (17.9%) 62.4% 9.4%
Other operating income 62.0% (48.9%) 36.3% 76.5% 18.8%
Operating income 890.9% 1141.7% 26.7% (37.8%) 213.8%
Other income Financial expenses Other expenses
Net income 608.8% 1244.6% 26.3% (41.4%) 189.9%
33
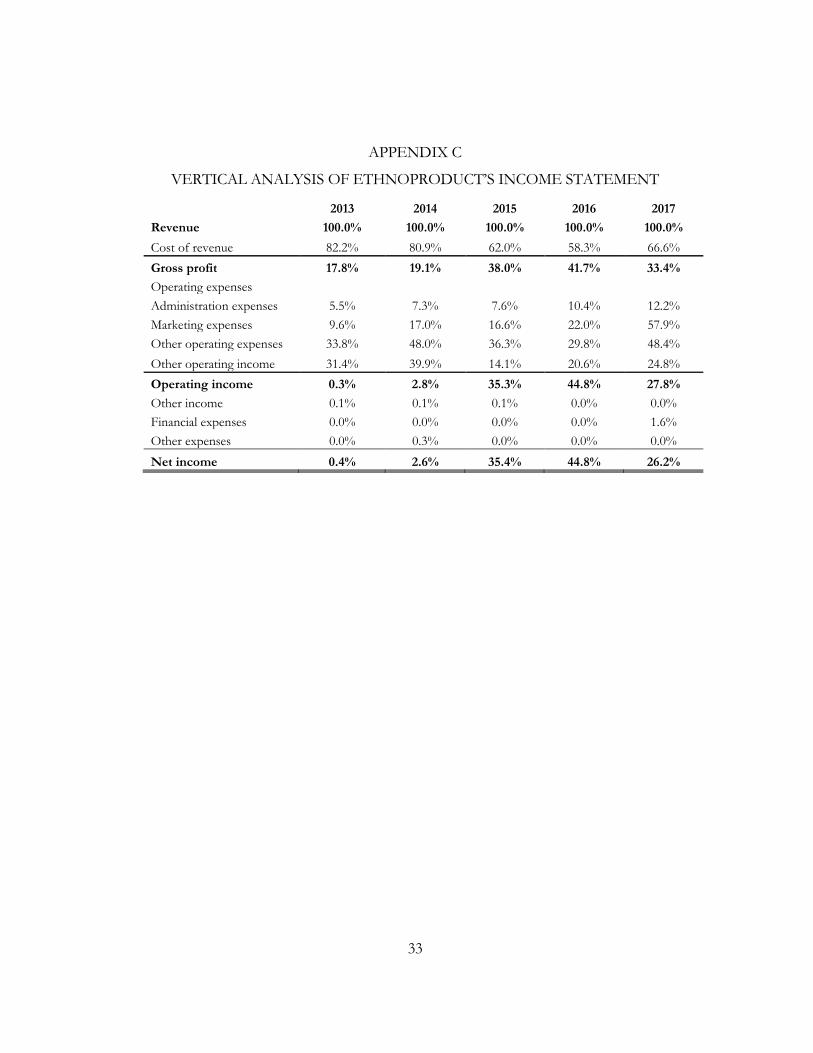
APPENDIX C
VERTICAL ANALYSIS OF ETHNOPRODUCT’S INCOME STATEMENT
2013 2014 2015 2016 2017
Revenue 100.0% 100.0% 100.0% 100.0% 100.0%
Cost of revenue 82.2% 80.9% 62.0% 58.3% 66.6%
Gross profit 17.8% 19.1% 38.0% 41.7% 33.4%
Operating expenses
Administration expenses 5.5% 7.3% 7.6% 10.4% 12.2%
Marketing expenses 9.6% 17.0% 16.6% 22.0% 57.9%
Other operating expenses 33.8% 48.0% 36.3% 29.8% 48.4%
Other operating income 31.4% 39.9% 14.1% 20.6% 24.8%
Operating income 0.3% 2.8% 35.3% 44.8% 27.8%
Other income 0.1% 0.1% 0.1% 0.0% 0.0%
Financial expenses 0.0% 0.0% 0.0% 0.0% 1.6%
Other expenses 0.0% 0.3% 0.0% 0.0% 0.0%
Net income 0.4% 2.6% 35.4% 44.8% 26.2%

34
APPENDIX D
BALANCE SHEET OF ETHNOPRODUCT, IN THOUSANDS OF UAH
2013 2014 2015 2016 2017
Assets
Current assets
Cash and cash equivalents 54.0 70.0 286.0 137.0 89.0
Receivables 2,096.0 1,909.0 2,762.0 4,267.0 4,832.0
Inventories 2,821.0 5,072.0 6,033.0 14,093.0 14,048.0
Deferred expenses 44.0 24.0 104.0 54.0 33.0
Current biological assets 6,644.0 2,459.0 1,932.0 3,176.0 5,807.0
Other current assets 98.0 74.0 5.0 4.0 107.0
Total current assets 11,757.0 9,608.0 11,122.0 21,731.0 24,916.0
Non-current assets
Property, plant and equipment 4,383.0 4,318.0 4,488.0 3,910.0 4,852.0
Gross property, plant and equipment 6,701.0 7,066.0 7,840.0 8,428.0 10,520.0
Accumulated Depreciation 2,318.0 2,748.0 3,352.0 4,518.0 5,668.0
Intangible assets 38.0 38.0 12.0 10.0 8.0
Gross intangible assets 39.0 39.0 39.0 39.0 39.0
Accumulated Depreciation 1.0 1.0 27.0 29.0 31.0
Long-term biological assets 2,672.0 3,948.0 3,456.0 2,979.0 4,975.0
Gross long-term biological assets 2,672.0 3,948.0 3,456.0 2,979.0 4,975.0
Accumulated Depreciation 0.0 0.0 0.0 0.0 0.0
СapEx in progress 246.0 254.0 236.0 559.0 600.0
Total non-current assets 7,339.0 8,558.0 8,192.0 7,458.0 10,435.0
Total assets 19,096.0 18,166.0 19,314.0 29,189.0 35,351.0
Liabilities and stockholders’ equity
Current liabilities
Accounts payable 2,021.0 2,057.0 3,799.0 4,557.0 4,700.0
Other current liabilities 16,435.0 15,065.0 9,039.0 11,294.0 11,066.0
Total current liabilities 18,456.0 17,122.0 12,838.0 15,851.0 15,766.0
Non-current liabilities
Long-term debt 0.0 0.0 0.0 0.0 2,223.0

35
Total non-current liabilities 0.0 0.0 0.0 0.0 2,223.0
Total liabilities 18,456.0 17,122.0 12,838.0 15,851.0 17,989.0
Stockholders’ equity
Common stock 230.0 230.0 230.0 230.0 230.0
Additional paid-in capital 1,332.0 1,332.0 1,332.0 1,332.0 1,332.0
Retained earnings (922.0) (518.0) 4,914.0 11,776.0 15,800.0
Total stockholders’ equity 640.0 1,044.0 6,476.0 13,338.0 17,362.0
Total liabilities and stockholders’ equity 19,096.0 18,166.0 19,314.0 29,189.0 35,351.0
Source: SMIDA (2017)