Embed Size (px)
Citation preview

Audited Financial Statements for the year ended December 31, 2017
Investment Manager Series (IMS) (VIOs)

Dear Valued Investor,
We remain optimistic that equity markets can continue their bull run into 2018. In short, the macro setup is arguably the strongest it’s ever been, despite the U.S. economy growing at a modest rate by historical standards. Global growth is finally synchronized, inflation remains muted and central banks are still broadly supportive, providing the foundation for continued growth in risk assets such as stocks. When the prospect for meaningful tax reform and deregulation south of the border is added to the picture, you are left with a powerfully bullish case for 2018. Stock picking, even within sectors, is much more important in this later stage of the investment cycle.
Factoring in the risks There are always risks to a bullish outlook and some uncertainty exists around whether stock valuations are currently too high. Stock valuations are indeed somewhat elevated, but they are supported by strong profit growth and low interest rates. The U.S. tax reforms are expected to add an additional 10% to already strong profits, resulting in a 2018 S&P500 corporate profit growth anticipated to be approximately 16%. In Canada, corporate profits are heavily influenced by three factors: 1) commodity prices – which are rising with global growth rates, 2) exports, especially to our largest trading partner, the U.S. – which should benefit from increased U.S. growth, as long as NAFTA remains in effect, and 3) the “hot” Canadian housing market and high consumer spending – which we see as a risk. Bear markets are rarely caused by stock valuations, but high valuations may result in deeper declines when the bull market eventually comes to an end.
At ivari, we are also making plans for the future, with the addition of Todd Lawrence as Deputy CEO, to take over as CEO on my retirement later this year. We look forward to serving you into the future under new leadership.
Sincerely yours,
Doug Brooks Chairman, President and Chief Executive Officer
Statements of Financial Position . . . . . . . . . . . . . . . . . . . . . . . . . . . . . . . . . . . . . . . . . . . . . . . . . . . . . . . . . . . . . . . . . . . . . . . . . . . . . . . . . . . . . 36
Statements of Comprehensive Income . . . . . . . . . . . . . . . . . . . . . . . . . . . . . . . . . . . . . . . . . . . . . . . . . . . . . . . . . . . . . . . . . . . . . . . . . . . . . . . 60
Statements of Changes in Net Assets Attributable to Holders of Redeemable Units, and Statements of Cash Flows . . . . . . . . . . 84
Notes to Financial Statements . . . . . . . . . . . . . . . . . . . . . . . . . . . . . . . . . . . . . . . . . . . . . . . . . . . . . . . . . . . . . . . . . . . . . . . . . . . . . . . . . . . . . . 108
Financial Highlights (Unaudited) . . . . . . . . . . . . . . . . . . . . . . . . . . . . . . . . . . . . . . . . . . . . . . . . . . . . . . . . . . . . . . . . . . . . . . . . . . . . . . . . . . . . . 131
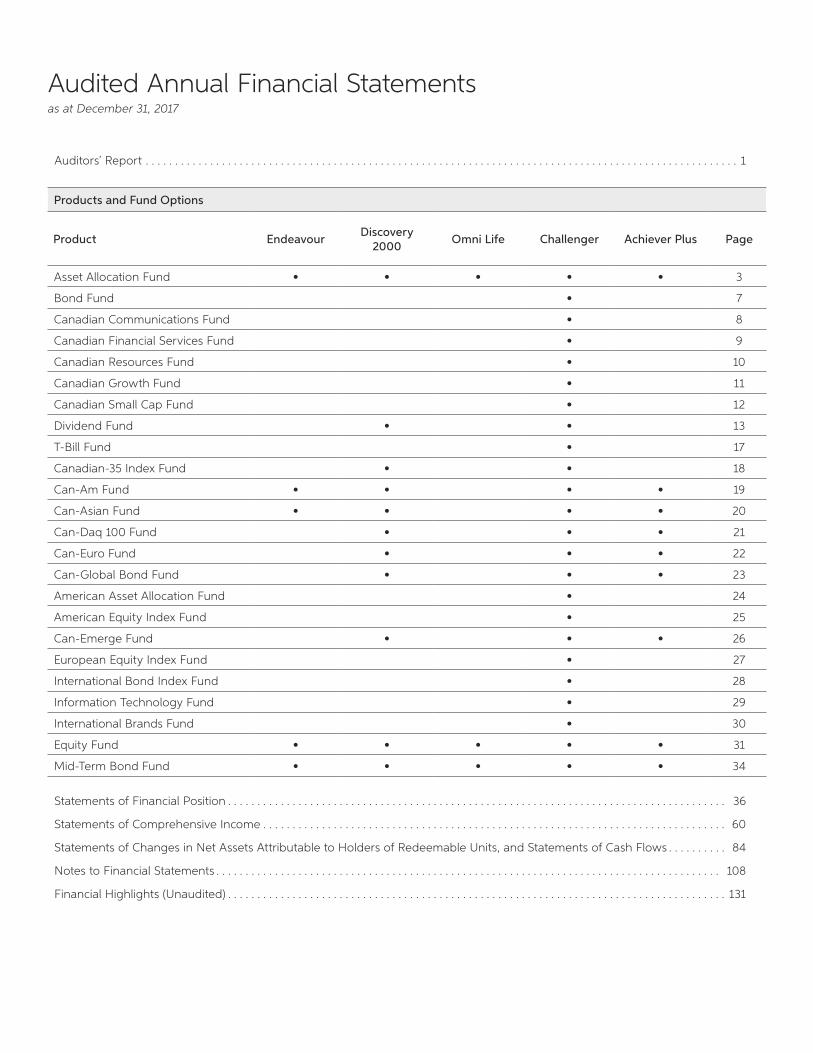
Products and Fund Options
Product Endeavour Discovery 2000 Omni Life Challenger Achiever Plus Page
Asset Allocation Fund • • • • • 3
Bond Fund • 7
Canadian Communications Fund • 8
Canadian Financial Services Fund • 9
Canadian Resources Fund • 10
Canadian Growth Fund • 11
Canadian Small Cap Fund • 12
Dividend Fund • • 13
T-Bill Fund • 17
Canadian-35 Index Fund • • 18
Can-Am Fund • • • • 19
Can-Asian Fund • • • • 20
Can-Daq 100 Fund • • • 21
Can-Euro Fund • • • 22
Can-Global Bond Fund • • • 23
American Asset Allocation Fund • 24
American Equity Index Fund • 25
Can-Emerge Fund • • • 26
European Equity Index Fund • 27
International Bond Index Fund • 28
Information Technology Fund • 29
International Brands Fund • 30
Equity Fund • • • • • 31
Mid-Term Bond Fund • • • • • 34
Auditors’ Report . . . . . . . . . . . . . . . . . . . . . . . . . . . . . . . . . . . . . . . . . . . . . . . . . . . . . . . . . . . . . . . . . . . . . . . . . . . . . . . . . . . . . . . . . . . . . . . . . . . . . 1
Audited Annual Financial Statementsas at December 31, 2017
Independent Auditor’s Report To the Contractholders of the Investment Manager Series Funds: Asset Allocation Fund Bond Fund Canadian Communications Fund Canadian Financial Services Fund Canadian Growth Fund Canadian Resources Fund Canadian Small Cap Fund Canadian-35 Index Fund Can-Am Fund Can-Asian Fund Can-Daq 100 Fund Can-Euro Fund Can-Global Bond Fund Dividend Fund American Asset Allocation Fund T-Bill Fund American Equity Index Fund Can-Emerge Fund International Bond Index Fund European Equity Index Fund Information Technology Fund International Brands Fund Equity Fund Mid-Term Bond Fund (Collectively “the Funds”) We have audited the accompanying financial statements of the Funds, which comprise the Statements of Financial Position as at December 31, 2017, the Statements of Comprehensive Income, Statements of Changes in Net Assets Attributable to Contractholders and the Statements of Cash Flows for the year ended December 31, 2017 and a summary of significant accounting policies and other explanatory information.
Management’s Responsibility for the Financial Statements Management is responsible for the preparation and fair presentation of these financial statements in accordance with International Financial Reporting Standards, and for such internal control as management determines is necessary to enable the preparation of financial statements that are free from material misstatement, whether due to fraud or error.
Deloitte LLP Bay Adelaide East 8 Adelaide Street West Suite 200 Toronto ON M5H 0A9 Canada Tel: 416-601-6150 Fax: 416-601-6151 www.deloitte.ca
1
Auditor’s Responsibility Our responsibility is to express an opinion on these financial statements based on our audit. We conducted our audit in accordance with Canadian Generally Accepted Auditing Standards. Those standards require that we comply with ethical requirements and plan and perform the audit to obtain reasonable assurance about whether the financial statements are free from material misstatement. An audit involves performing procedures to obtain audit evidence about the amounts and disclosures in the financial statements. The procedures selected depend on the auditor’s judgment, including the assessment of the risks of material misstatement of the financial statements, whether due to fraud or error. In making those risk assessments, the auditor considers internal control relevant to the entity’s preparation and fair presentation of the financial statements in order to design audit procedures that are appropriate in the circumstances, but not for the purpose of expressing an opinion on the effectiveness of the entity’s internal control. An audit also includes evaluating the appropriateness of accounting policies used and the reasonableness of accounting estimates made by management, as well as evaluating the overall presentation of the financial statements. We believe that the audit evidence we have obtained is sufficient and appropriate to provide a basis for our audit opinion.
Opinion In our opinion, the financial statements present fairly, in all material respects, the financial position of the Funds as at December 31, 2017, and their financial performance and its cash flows for the year ended December 31, 2017 in accordance with International Financial Reporting Standards.
Chartered Professional Accountants Licensed Public Accountants April 19, 2018
2
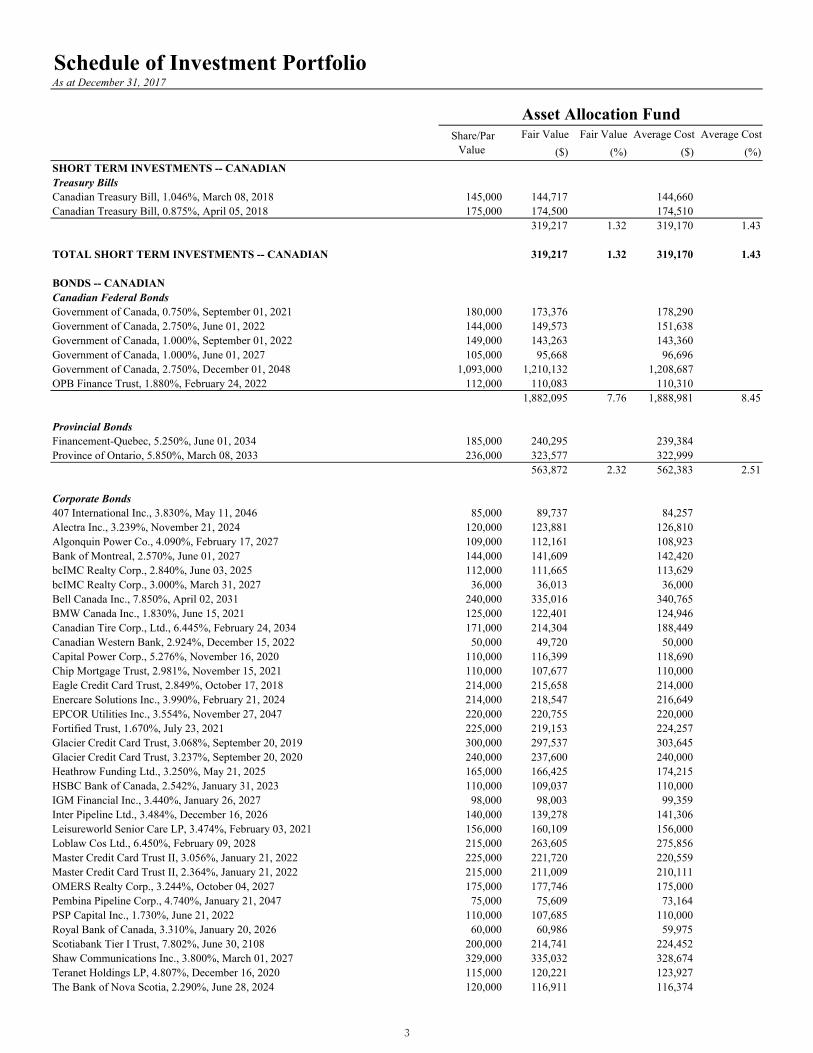
Schedule of Investment Portfolio As at December 31, 2017
Fair Value Fair Value Average Cost Average Cost ($) (%) ($) (%)
SHORT TERM INVESTMENTS -- CANADIANTreasury BillsCanadian Treasury Bill, 1.046%, March 08, 2018 145,000 144,717 144,660 Canadian Treasury Bill, 0.875%, April 05, 2018 175,000 174,500 174,510
319,217 1.32 319,170 1.43
TOTAL SHORT TERM INVESTMENTS -- CANADIAN 319,217 1.32 319,170 1.43
BONDS -- CANADIANCanadian Federal BondsGovernment of Canada, 0.750%, September 01, 2021 180,000 173,376 178,290 Government of Canada, 2.750%, June 01, 2022 144,000 149,573 151,638 Government of Canada, 1.000%, September 01, 2022 149,000 143,263 143,360 Government of Canada, 1.000%, June 01, 2027 105,000 95,668 96,696 Government of Canada, 2.750%, December 01, 2048 1,093,000 1,210,132 1,208,687 OPB Finance Trust, 1.880%, February 24, 2022 112,000 110,083 110,310
1,882,095 7.76 1,888,981 8.45
Provincial BondsFinancement-Quebec, 5.250%, June 01, 2034 185,000 240,295 239,384 Province of Ontario, 5.850%, March 08, 2033 236,000 323,577 322,999
563,872 2.32 562,383 2.51
Corporate Bonds407 International Inc., 3.830%, May 11, 2046 85,000 89,737 84,257 Alectra Inc., 3.239%, November 21, 2024 120,000 123,881 126,810 Algonquin Power Co., 4.090%, February 17, 2027 109,000 112,161 108,923 Bank of Montreal, 2.570%, June 01, 2027 144,000 141,609 142,420 bcIMC Realty Corp., 2.840%, June 03, 2025 112,000 111,665 113,629 bcIMC Realty Corp., 3.000%, March 31, 2027 36,000 36,013 36,000 Bell Canada Inc., 7.850%, April 02, 2031 240,000 335,016 340,765 BMW Canada Inc., 1.830%, June 15, 2021 125,000 122,401 124,946 Canadian Tire Corp., Ltd., 6.445%, February 24, 2034 171,000 214,304 188,449 Canadian Western Bank, 2.924%, December 15, 2022 50,000 49,720 50,000 Capital Power Corp., 5.276%, November 16, 2020 110,000 116,399 118,690 Chip Mortgage Trust, 2.981%, November 15, 2021 110,000 107,677 110,000 Eagle Credit Card Trust, 2.849%, October 17, 2018 214,000 215,658 214,000 Enercare Solutions Inc., 3.990%, February 21, 2024 214,000 218,547 216,649 EPCOR Utilities Inc., 3.554%, November 27, 2047 220,000 220,755 220,000 Fortified Trust, 1.670%, July 23, 2021 225,000 219,153 224,257 Glacier Credit Card Trust, 3.068%, September 20, 2019 300,000 297,537 303,645 Glacier Credit Card Trust, 3.237%, September 20, 2020 240,000 237,600 240,000 Heathrow Funding Ltd., 3.250%, May 21, 2025 165,000 166,425 174,215 HSBC Bank of Canada, 2.542%, January 31, 2023 110,000 109,037 110,000 IGM Financial Inc., 3.440%, January 26, 2027 98,000 98,003 99,359 Inter Pipeline Ltd., 3.484%, December 16, 2026 140,000 139,278 141,306 Leisureworld Senior Care LP, 3.474%, February 03, 2021 156,000 160,109 156,000 Loblaw Cos Ltd., 6.450%, February 09, 2028 215,000 263,605 275,856 Master Credit Card Trust II, 3.056%, January 21, 2022 225,000 221,720 220,559 Master Credit Card Trust II, 2.364%, January 21, 2022 215,000 211,009 210,111 OMERS Realty Corp., 3.244%, October 04, 2027 175,000 177,746 175,000 Pembina Pipeline Corp., 4.740%, January 21, 2047 75,000 75,609 73,164 PSP Capital Inc., 1.730%, June 21, 2022 110,000 107,685 110,000 Royal Bank of Canada, 3.310%, January 20, 2026 60,000 60,986 59,975 Scotiabank Tier I Trust, 7.802%, June 30, 2108 200,000 214,741 224,452 Shaw Communications Inc., 3.800%, March 01, 2027 329,000 335,032 328,674 Teranet Holdings LP, 4.807%, December 16, 2020 115,000 120,221 123,927 The Bank of Nova Scotia, 2.290%, June 28, 2024 120,000 116,911 116,374
Asset Allocation Fund Share/Par
Value
3
Schedule of Investment Portfolio As at December 31, 2017
Fair Value Fair Value Average Cost Average Cost ($) (%) ($) (%)
Asset Allocation Fund Share/Par
Value
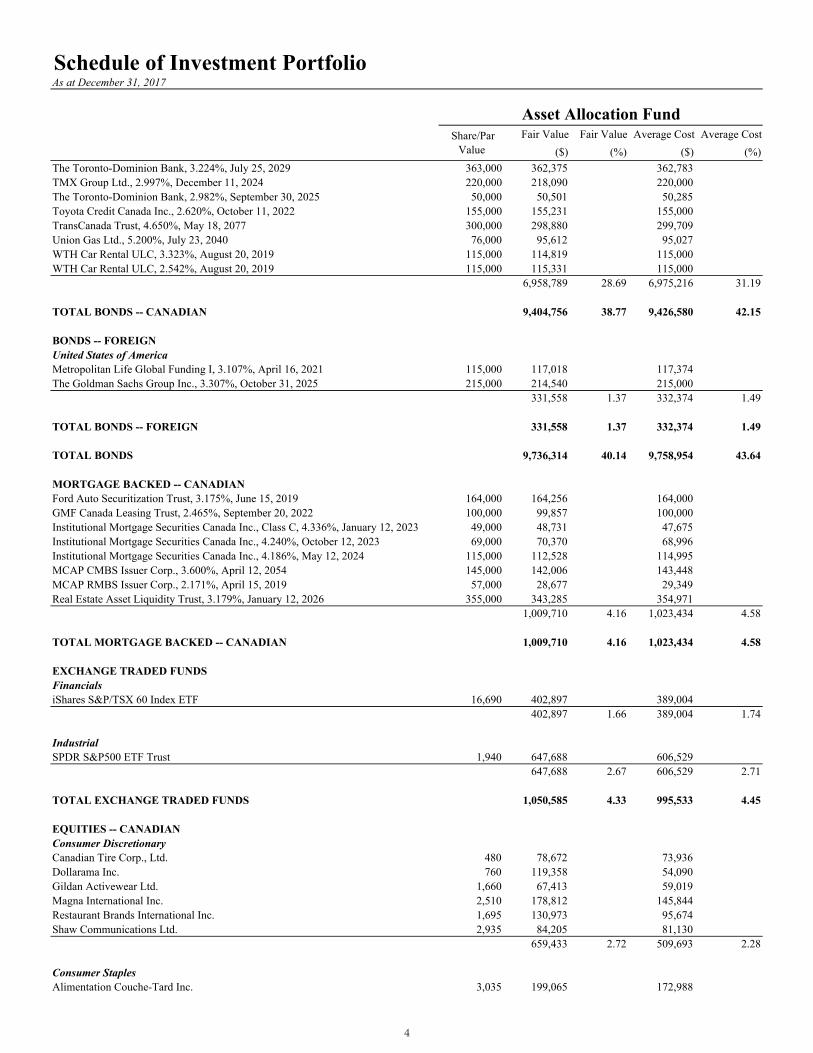
The Toronto-Dominion Bank, 3.224%, July 25, 2029 363,000 362,375 362,783 TMX Group Ltd., 2.997%, December 11, 2024 220,000 218,090 220,000 The Toronto-Dominion Bank, 2.982%, September 30, 2025 50,000 50,501 50,285 Toyota Credit Canada Inc., 2.620%, October 11, 2022 155,000 155,231 155,000 TransCanada Trust, 4.650%, May 18, 2077 300,000 298,880 299,709 Union Gas Ltd., 5.200%, July 23, 2040 76,000 95,612 95,027 WTH Car Rental ULC, 3.323%, August 20, 2019 115,000 114,819 115,000 WTH Car Rental ULC, 2.542%, August 20, 2019 115,000 115,331 115,000
6,958,789 28.69 6,975,216 31.19
TOTAL BONDS -- CANADIAN 9,404,756 38.77 9,426,580 42.15
BONDS -- FOREIGNUnited States of AmericaMetropolitan Life Global Funding I, 3.107%, April 16, 2021 115,000 117,018 117,374 The Goldman Sachs Group Inc., 3.307%, October 31, 2025 215,000 214,540 215,000
331,558 1.37 332,374 1.49
TOTAL BONDS -- FOREIGN 331,558 1.37 332,374 1.49
TOTAL BONDS 9,736,314 40.14 9,758,954 43.64
MORTGAGE BACKED -- CANADIAN Ford Auto Securitization Trust, 3.175%, June 15, 2019 164,000 164,256 164,000 GMF Canada Leasing Trust, 2.465%, September 20, 2022 100,000 99,857 100,000 Institutional Mortgage Securities Canada Inc., Class C, 4.336%, January 12, 2023 49,000 48,731 47,675 Institutional Mortgage Securities Canada Inc., 4.240%, October 12, 2023 69,000 70,370 68,996 Institutional Mortgage Securities Canada Inc., 4.186%, May 12, 2024 115,000 112,528 114,995 MCAP CMBS Issuer Corp., 3.600%, April 12, 2054 145,000 142,006 143,448 MCAP RMBS Issuer Corp., 2.171%, April 15, 2019 57,000 28,677 29,349 Real Estate Asset Liquidity Trust, 3.179%, January 12, 2026 355,000 343,285 354,971
1,009,710 4.16 1,023,434 4.58
TOTAL MORTGAGE BACKED -- CANADIAN 1,009,710 4.16 1,023,434 4.58
EXCHANGE TRADED FUNDSFinancialsiShares S&P/TSX 60 Index ETF 16,690 402,897 389,004
402,897 1.66 389,004 1.74
IndustrialSPDR S&P500 ETF Trust 1,940 647,688 606,529
647,688 2.67 606,529 2.71
TOTAL EXCHANGE TRADED FUNDS 1,050,585 4.33 995,533 4.45
EQUITIES -- CANADIANConsumer DiscretionaryCanadian Tire Corp., Ltd. 480 78,672 73,936 Dollarama Inc. 760 119,358 54,090 Gildan Activewear Ltd. 1,660 67,413 59,019 Magna International Inc. 2,510 178,812 145,844 Restaurant Brands International Inc. 1,695 130,973 95,674 Shaw Communications Ltd. 2,935 84,205 81,130
659,433 2.72 509,693 2.28
Consumer StaplesAlimentation Couche-Tard Inc. 3,035 199,065 172,988
4
Schedule of Investment Portfolio As at December 31, 2017
Fair Value Fair Value Average Cost Average Cost ($) (%) ($) (%)
Asset Allocation Fund Share/Par
Value
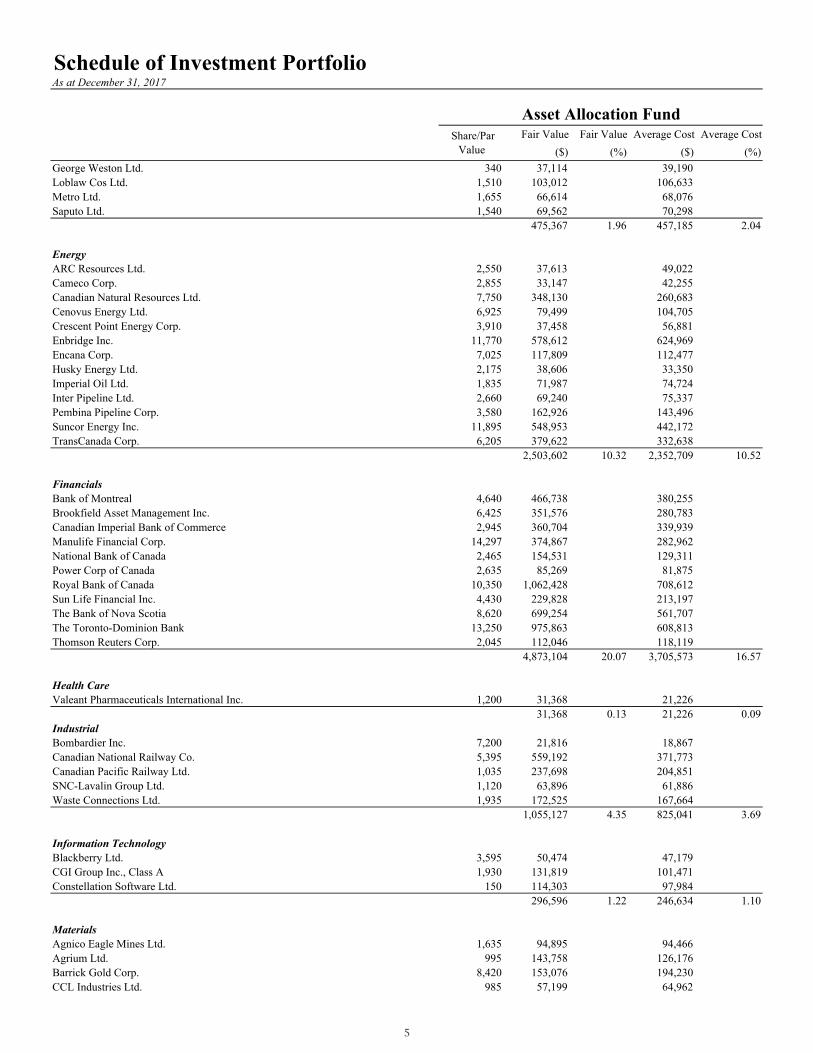
George Weston Ltd. 340 37,114 39,190 Loblaw Cos Ltd. 1,510 103,012 106,633 Metro Ltd. 1,655 66,614 68,076 Saputo Ltd. 1,540 69,562 70,298
475,367 1.96 457,185 2.04
EnergyARC Resources Ltd. 2,550 37,613 49,022 Cameco Corp. 2,855 33,147 42,255 Canadian Natural Resources Ltd. 7,750 348,130 260,683 Cenovus Energy Ltd. 6,925 79,499 104,705 Crescent Point Energy Corp. 3,910 37,458 56,881 Enbridge Inc. 11,770 578,612 624,969 Encana Corp. 7,025 117,809 112,477 Husky Energy Ltd. 2,175 38,606 33,350 Imperial Oil Ltd. 1,835 71,987 74,724 Inter Pipeline Ltd. 2,660 69,240 75,337 Pembina Pipeline Corp. 3,580 162,926 143,496 Suncor Energy Inc. 11,895 548,953 442,172 TransCanada Corp. 6,205 379,622 332,638
2,503,602 10.32 2,352,709 10.52
FinancialsBank of Montreal 4,640 466,738 380,255 Brookfield Asset Management Inc. 6,425 351,576 280,783 Canadian Imperial Bank of Commerce 2,945 360,704 339,939 Manulife Financial Corp. 14,297 374,867 282,962 National Bank of Canada 2,465 154,531 129,311 Power Corp of Canada 2,635 85,269 81,875 Royal Bank of Canada 10,350 1,062,428 708,612 Sun Life Financial Inc. 4,430 229,828 213,197 The Bank of Nova Scotia 8,620 699,254 561,707 The Toronto-Dominion Bank 13,250 975,863 608,813 Thomson Reuters Corp. 2,045 112,046 118,119
4,873,104 20.07 3,705,573 16.57
Health CareValeant Pharmaceuticals International Inc. 1,200 31,368 21,226
31,368 0.13 21,226 0.09IndustrialBombardier Inc. 7,200 21,816 18,867 Canadian National Railway Co. 5,395 559,192 371,773 Canadian Pacific Railway Ltd. 1,035 237,698 204,851 SNC-Lavalin Group Ltd. 1,120 63,896 61,886 Waste Connections Ltd. 1,935 172,525 167,664
1,055,127 4.35 825,041 3.69
Information TechnologyBlackberry Ltd. 3,595 50,474 47,179 CGI Group Inc., Class A 1,930 131,819 101,471 Constellation Software Ltd. 150 114,303 97,984
296,596 1.22 246,634 1.10
MaterialsAgnico Eagle Mines Ltd. 1,635 94,895 94,466 Agrium Ltd. 995 143,758 126,176 Barrick Gold Corp. 8,420 153,076 194,230 CCL Industries Ltd. 985 57,199 64,962
5
Schedule of Investment Portfolio As at December 31, 2017
Fair Value Fair Value Average Cost Average Cost ($) (%) ($) (%)
Asset Allocation Fund Share/Par
Value
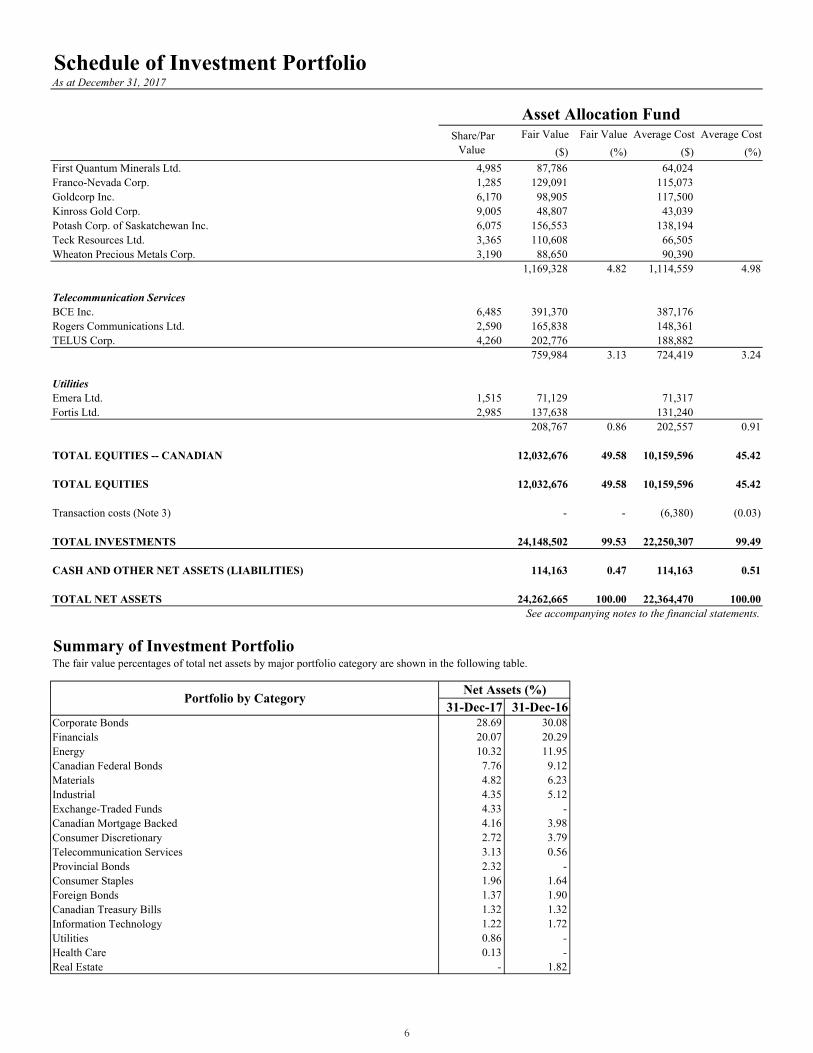
First Quantum Minerals Ltd. 4,985 87,786 64,024 Franco-Nevada Corp. 1,285 129,091 115,073 Goldcorp Inc. 6,170 98,905 117,500 Kinross Gold Corp. 9,005 48,807 43,039 Potash Corp. of Saskatchewan Inc. 6,075 156,553 138,194 Teck Resources Ltd. 3,365 110,608 66,505 Wheaton Precious Metals Corp. 3,190 88,650 90,390
1,169,328 4.82 1,114,559 4.98
Telecommunication ServicesBCE Inc. 6,485 391,370 387,176 Rogers Communications Ltd. 2,590 165,838 148,361 TELUS Corp. 4,260 202,776 188,882
759,984 3.13 724,419 3.24
UtilitiesEmera Ltd. 1,515 71,129 71,317 Fortis Ltd. 2,985 137,638 131,240
208,767 0.86 202,557 0.91
TOTAL EQUITIES -- CANADIAN 12,032,676 49.58 10,159,596 45.42
TOTAL EQUITIES 12,032,676 49.58 10,159,596 45.42
Transaction costs (Note 3) - - (6,380) (0.03)
TOTAL INVESTMENTS 24,148,502 99.53 22,250,307 99.49
CASH AND OTHER NET ASSETS (LIABILITIES) 114,163 0.47 114,163 0.51
TOTAL NET ASSETS 24,262,665 100.00 22,364,470 100.00See accompanying notes to the financial statements.
Summary of Investment PortfolioThe fair value percentages of total net assets by major portfolio category are shown in the following table.
31-Dec-17 31-Dec-16Corporate Bonds 28.69 30.08 Financials 20.07 20.29 Energy 10.32 11.95 Canadian Federal Bonds 7.76 9.12 Materials 4.82 6.23 Industrial 4.35 5.12 Exchange-Traded Funds 4.33 - Canadian Mortgage Backed 4.16 3.98 Consumer Discretionary 2.72 3.79 Telecommunication Services 3.13 0.56 Provincial Bonds 2.32 - Consumer Staples 1.96 1.64 Foreign Bonds 1.37 1.90 Canadian Treasury Bills 1.32 1.32 Information Technology 1.22 1.72 Utilities 0.86 - Health Care 0.13 - Real Estate - 1.82
Portfolio by Category Net Assets (%)
6
Schedule of Investment Portfolio As at December 31, 2017
Fair Value Fair Value Average Cost Average Cost($) (%) ($) (%)
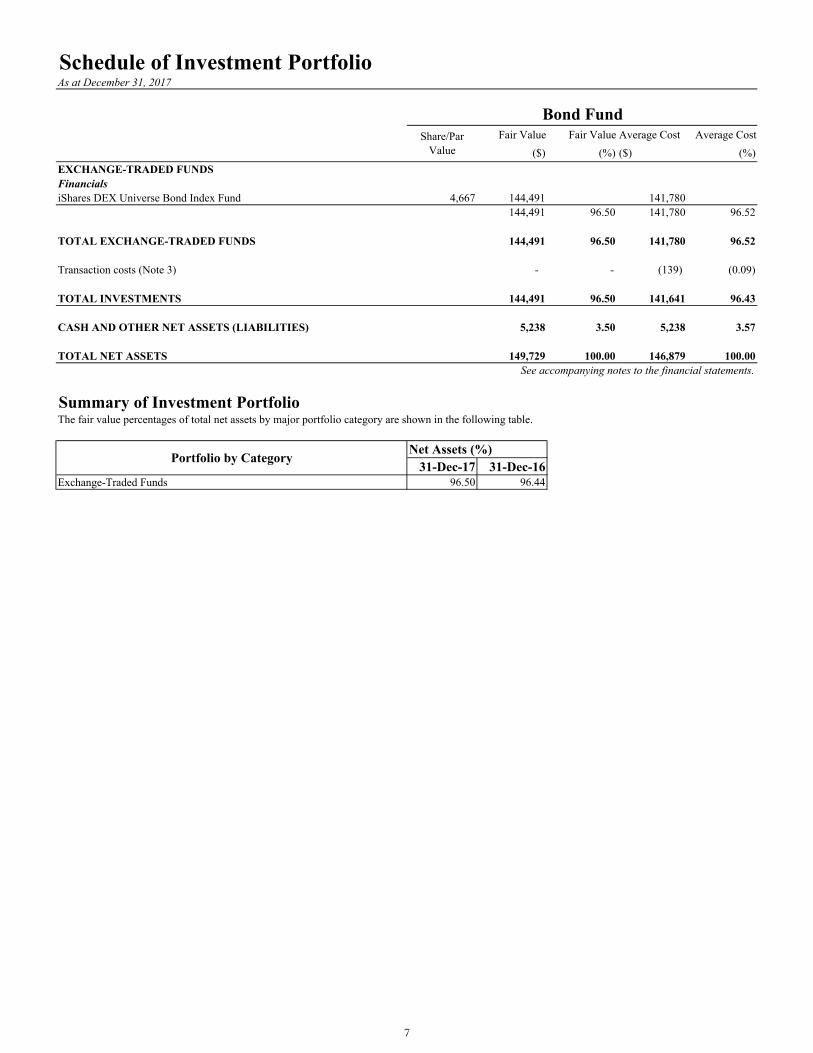
EXCHANGE-TRADED FUNDSFinancialsiShares DEX Universe Bond Index Fund 4,667 144,491 141,780
144,491 96.50 141,780 96.52
TOTAL EXCHANGE-TRADED FUNDS 144,491 96.50 141,780 96.52
Transaction costs (Note 3) - - (139) (0.09)
TOTAL INVESTMENTS 144,491 96.50 141,641 96.43
CASH AND OTHER NET ASSETS (LIABILITIES) 5,238 3.50 5,238 3.57
TOTAL NET ASSETS 149,729 100.00 146,879 100.00See accompanying notes to the financial statements.
Summary of Investment PortfolioThe fair value percentages of total net assets by major portfolio category are shown in the following table.
31-Dec-17 31-Dec-16Exchange-Traded Funds 96.50 96.44
Bond FundShare/Par
Value
Portfolio by Category Net Assets (%)
7
Schedule of Investment Portfolio As at December 31, 2017
Fair Value Fair Value Average Cost Average Cost($) (%) ($) (%)
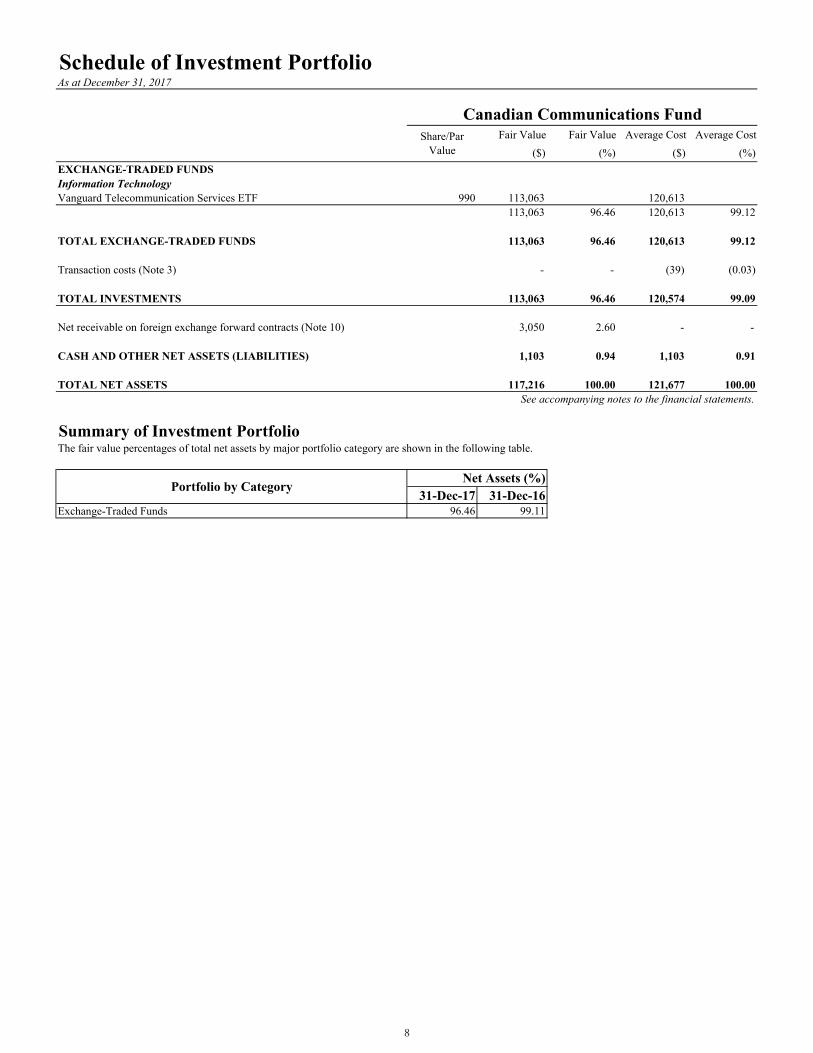
EXCHANGE-TRADED FUNDSInformation TechnologyVanguard Telecommunication Services ETF 990 113,063 120,613
113,063 96.46 120,613 99.12
TOTAL EXCHANGE-TRADED FUNDS 113,063 96.46 120,613 99.12
Transaction costs (Note 3) - - (39) (0.03)
TOTAL INVESTMENTS 113,063 96.46 120,574 99.09
Net receivable on foreign exchange forward contracts (Note 10) 3,050 2.60 - -
CASH AND OTHER NET ASSETS (LIABILITIES) 1,103 0.94 1,103 0.91
TOTAL NET ASSETS 117,216 100.00 121,677 100.00See accompanying notes to the financial statements.
Summary of Investment PortfolioThe fair value percentages of total net assets by major portfolio category are shown in the following table.
31-Dec-17 31-Dec-16Exchange-Traded Funds 96.46 99.11
Canadian Communications FundShare/Par
Value
Portfolio by Category Net Assets (%)
8

Schedule of Investment Portfolio As at December 31, 2017
Fair Value Fair Value Average Cost Average Cost($) (%) ($) (%)
EXCHANGE-TRADED FUNDSFinancialsiShares S&P/TSX Capped Financials Index Fund 9,298 359,275 267,379
359,275 97.56 267,379 96.85
TOTAL EXCHANGE-TRADED FUNDS 359,275 97.56 267,379 96.85
Transaction costs (Note 3) - - (277) (0.10)
TOTAL INVESTMENTS 359,275 97.56 267,102 96.75
CASH AND OTHER NET ASSETS (LIABILITIES) 8,975 2.44 8,975 3.25
TOTAL NET ASSETS 368,250 100.00 276,077 100.00See accompanying notes to the financial statements.
Summary of Investment PortfolioThe fair value percentages of total net assets by major portfolio category are shown in the following table.
31-Dec-17 31-Dec-16Exchange-Traded Funds 97.56 99.57
Canadian Financial Services FundShare/Par
Value
Portfolio by CategoryNet Assets (%)
9
Schedule of Investment Portfolio As at December 31, 2017
Fair Value Fair Value Average Cost Average Cost($) (%) ($) (%)
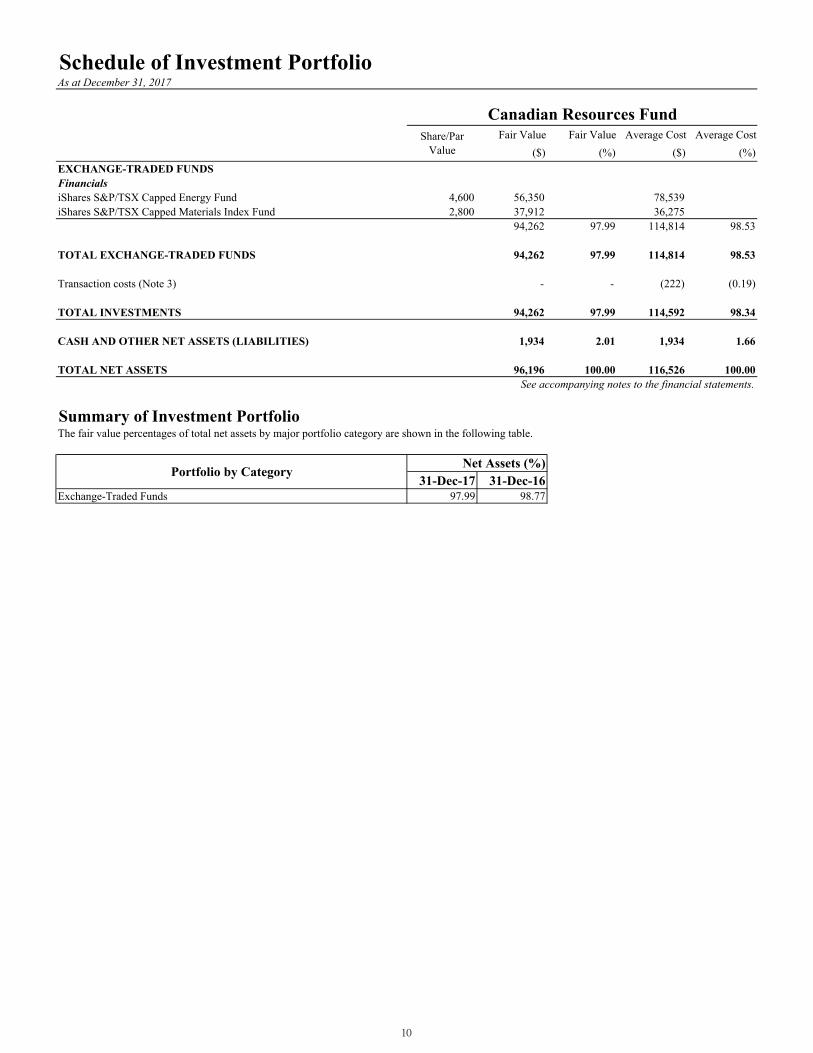
EXCHANGE-TRADED FUNDSFinancialsiShares S&P/TSX Capped Energy Fund 4,600 56,350 78,539 iShares S&P/TSX Capped Materials Index Fund 2,800 37,912 36,275
94,262 97.99 114,814 98.53
TOTAL EXCHANGE-TRADED FUNDS 94,262 97.99 114,814 98.53
Transaction costs (Note 3) - - (222) (0.19)
TOTAL INVESTMENTS 94,262 97.99 114,592 98.34
CASH AND OTHER NET ASSETS (LIABILITIES) 1,934 2.01 1,934 1.66
TOTAL NET ASSETS 96,196 100.00 116,526 100.00See accompanying notes to the financial statements.
Summary of Investment PortfolioThe fair value percentages of total net assets by major portfolio category are shown in the following table.
31-Dec-17 31-Dec-16Exchange-Traded Funds 97.99 98.77
Canadian Resources FundShare/Par
Value
Portfolio by Category Net Assets (%)
10

Schedule of Investment Portfolio As at December 31, 2017
Fair Value Fair Value Average Cost Average Cost($) (%) ($) (%)
EXCHANGE-TRADED FUNDSFinancialsiShares S&P/TSX 60 Index Fund 6,000 144,840 117,227
144,840 98.94 117,227 98.89
TOTAL EXCHANGE-TRADED FUNDS 144,840 98.94 117,227 98.89
Transaction costs (Note 3) - - (231) (0.20)
TOTAL INVESTMENTS 144,840 98.94 116,996 98.69
CASH AND OTHER NET ASSETS (LIABILITIES) 1,548 1.06 1,548 1.31
TOTAL NET ASSETS 146,388 100.00 118,544 100.00See accompanying notes to the financial statements.
Summary of Investment PortfolioThe fair value percentages of total net assets by major portfolio category are shown in the following table.
31-Dec-17 31-Dec-16Exchange-Traded Funds 98.94 96.31
Canadian Growth FundShare/Par
Value
Portfolio by Category Net Assets (%)
11

Schedule of Investment Portfolio As at December 31, 2017
Fair Value Fair Value Average Cost Average Cost($) (%) ($) (%)
EXCHANGE-TRADED FUNDSFinancialsiShares S&P/TSX SmallCap Index Fund 3,750 63,150 57,114
63,150 96.69 57,114 96.54
TOTAL EXCHANGE-TRADED FUNDS 63,150 96.69 57,114 96.54
Transaction costs (Note 3) - - (112) (0.19)
TOTAL INVESTMENTS 63,150 96.69 57,002 96.35
CASH AND OTHER NET ASSETS (LIABILITIES) 2,161 3.31 2,161 3.65
TOTAL NET ASSETS 65,311 100.00 59,163 100.00 See accompanying notes to the financial statements.
Summary of Investment PortfolioThe fair value percentages of total net assets by major portfolio category are shown in the following table.
31-Dec-17 31-Dec-16Exchange-Traded Funds 96.69 98.66
Canadian Small Cap FundShare/Par
Value
Portfolio by Category Net Assets (%)
12
Schedule of Investment Portfolio As at December 31, 2017
Fair Value Fair Value Average Cost Average Cost($) (%) ($) (%)
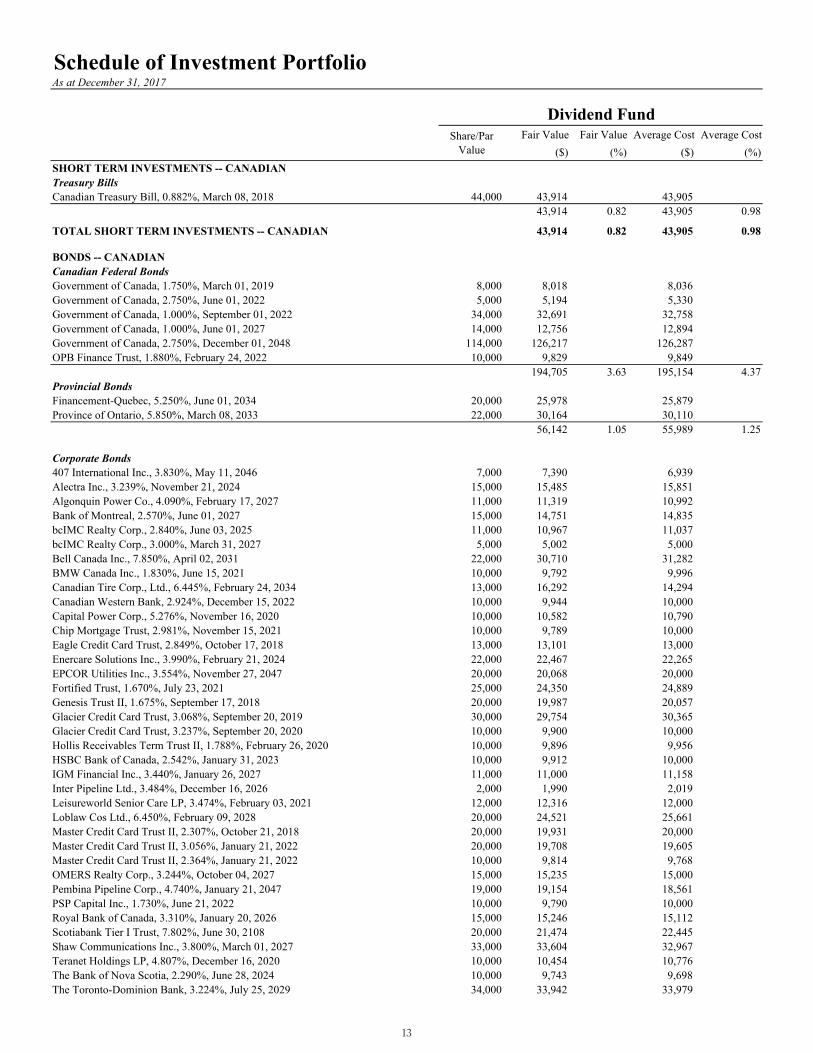
SHORT TERM INVESTMENTS -- CANADIANTreasury BillsCanadian Treasury Bill, 0.882%, March 08, 2018 44,000 43,914 43,905
43,914 0.82 43,905 0.98
TOTAL SHORT TERM INVESTMENTS -- CANADIAN 43,914 0.82 43,905 0.98
BONDS -- CANADIANCanadian Federal BondsGovernment of Canada, 1.750%, March 01, 2019 8,000 8,018 8,036 Government of Canada, 2.750%, June 01, 2022 5,000 5,194 5,330 Government of Canada, 1.000%, September 01, 2022 34,000 32,691 32,758 Government of Canada, 1.000%, June 01, 2027 14,000 12,756 12,894 Government of Canada, 2.750%, December 01, 2048 114,000 126,217 126,287 OPB Finance Trust, 1.880%, February 24, 2022 10,000 9,829 9,849
194,705 3.63 195,154 4.37Provincial BondsFinancement-Quebec, 5.250%, June 01, 2034 20,000 25,978 25,879 Province of Ontario, 5.850%, March 08, 2033 22,000 30,164 30,110
56,142 1.05 55,989 1.25
Corporate Bonds407 International Inc., 3.830%, May 11, 2046 7,000 7,390 6,939 Alectra Inc., 3.239%, November 21, 2024 15,000 15,485 15,851 Algonquin Power Co., 4.090%, February 17, 2027 11,000 11,319 10,992 Bank of Montreal, 2.570%, June 01, 2027 15,000 14,751 14,835 bcIMC Realty Corp., 2.840%, June 03, 2025 11,000 10,967 11,037 bcIMC Realty Corp., 3.000%, March 31, 2027 5,000 5,002 5,000 Bell Canada Inc., 7.850%, April 02, 2031 22,000 30,710 31,282 BMW Canada Inc., 1.830%, June 15, 2021 10,000 9,792 9,996 Canadian Tire Corp., Ltd., 6.445%, February 24, 2034 13,000 16,292 14,294 Canadian Western Bank, 2.924%, December 15, 2022 10,000 9,944 10,000 Capital Power Corp., 5.276%, November 16, 2020 10,000 10,582 10,790 Chip Mortgage Trust, 2.981%, November 15, 2021 10,000 9,789 10,000 Eagle Credit Card Trust, 2.849%, October 17, 2018 13,000 13,101 13,000 Enercare Solutions Inc., 3.990%, February 21, 2024 22,000 22,467 22,265 EPCOR Utilities Inc., 3.554%, November 27, 2047 20,000 20,068 20,000 Fortified Trust, 1.670%, July 23, 2021 25,000 24,350 24,889 Genesis Trust II, 1.675%, September 17, 2018 20,000 19,987 20,057 Glacier Credit Card Trust, 3.068%, September 20, 2019 30,000 29,754 30,365 Glacier Credit Card Trust, 3.237%, September 20, 2020 10,000 9,900 10,000 Hollis Receivables Term Trust II, 1.788%, February 26, 2020 10,000 9,896 9,956 HSBC Bank of Canada, 2.542%, January 31, 2023 10,000 9,912 10,000 IGM Financial Inc., 3.440%, January 26, 2027 11,000 11,000 11,158 Inter Pipeline Ltd., 3.484%, December 16, 2026 2,000 1,990 2,019 Leisureworld Senior Care LP, 3.474%, February 03, 2021 12,000 12,316 12,000 Loblaw Cos Ltd., 6.450%, February 09, 2028 20,000 24,521 25,661 Master Credit Card Trust II, 2.307%, October 21, 2018 20,000 19,931 20,000 Master Credit Card Trust II, 3.056%, January 21, 2022 20,000 19,708 19,605 Master Credit Card Trust II, 2.364%, January 21, 2022 10,000 9,814 9,768 OMERS Realty Corp., 3.244%, October 04, 2027 15,000 15,235 15,000 Pembina Pipeline Corp., 4.740%, January 21, 2047 19,000 19,154 18,561 PSP Capital Inc., 1.730%, June 21, 2022 10,000 9,790 10,000 Royal Bank of Canada, 3.310%, January 20, 2026 15,000 15,246 15,112 Scotiabank Tier I Trust, 7.802%, June 30, 2108 20,000 21,474 22,445 Shaw Communications Inc., 3.800%, March 01, 2027 33,000 33,604 32,967 Teranet Holdings LP, 4.807%, December 16, 2020 10,000 10,454 10,776 The Bank of Nova Scotia, 2.290%, June 28, 2024 10,000 9,743 9,698 The Toronto-Dominion Bank, 3.224%, July 25, 2029 34,000 33,942 33,979
Dividend FundShare/Par
Value
13
Schedule of Investment Portfolio As at December 31, 2017
Fair Value Fair Value Average Cost Average Cost($) (%) ($) (%)
Dividend FundShare/Par
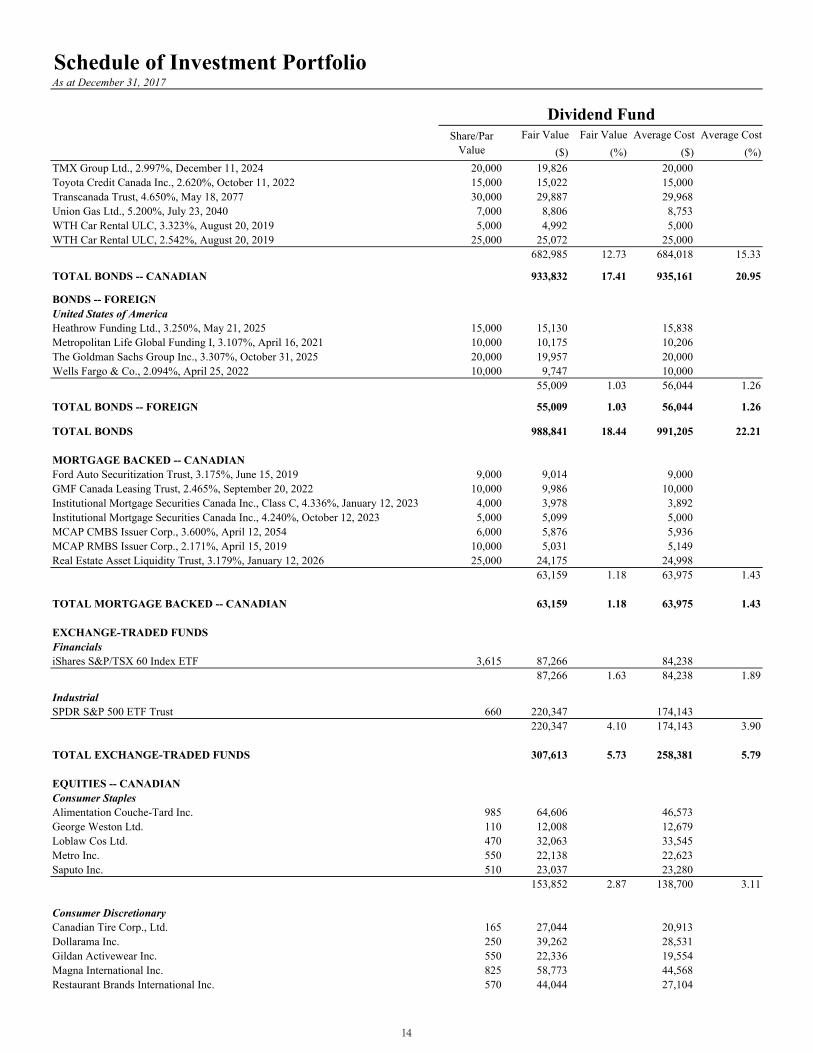
ValueTMX Group Ltd., 2.997%, December 11, 2024 20,000 19,826 20,000 Toyota Credit Canada Inc., 2.620%, October 11, 2022 15,000 15,022 15,000 Transcanada Trust, 4.650%, May 18, 2077 30,000 29,887 29,968 Union Gas Ltd., 5.200%, July 23, 2040 7,000 8,806 8,753 WTH Car Rental ULC, 3.323%, August 20, 2019 5,000 4,992 5,000 WTH Car Rental ULC, 2.542%, August 20, 2019 25,000 25,072 25,000
682,985 12.73 684,018 15.33
TOTAL BONDS -- CANADIAN 933,832 17.41 935,161 20.95
BONDS -- FOREIGNUnited States of AmericaHeathrow Funding Ltd., 3.250%, May 21, 2025 15,000 15,130 15,838 Metropolitan Life Global Funding I, 3.107%, April 16, 2021 10,000 10,175 10,206 The Goldman Sachs Group Inc., 3.307%, October 31, 2025 20,000 19,957 20,000 Wells Fargo & Co., 2.094%, April 25, 2022 10,000 9,747 10,000
55,009 1.03 56,044 1.26
TOTAL BONDS -- FOREIGN 55,009 1.03 56,044 1.26
TOTAL BONDS 988,841 18.44 991,205 22.21
MORTGAGE BACKED -- CANADIAN Ford Auto Securitization Trust, 3.175%, June 15, 2019 9,000 9,014 9,000 GMF Canada Leasing Trust, 2.465%, September 20, 2022 10,000 9,986 10,000 Institutional Mortgage Securities Canada Inc., Class C, 4.336%, January 12, 2023 4,000 3,978 3,892 Institutional Mortgage Securities Canada Inc., 4.240%, October 12, 2023 5,000 5,099 5,000 MCAP CMBS Issuer Corp., 3.600%, April 12, 2054 6,000 5,876 5,936 MCAP RMBS Issuer Corp., 2.171%, April 15, 2019 10,000 5,031 5,149 Real Estate Asset Liquidity Trust, 3.179%, January 12, 2026 25,000 24,175 24,998
63,159 1.18 63,975 1.43
TOTAL MORTGAGE BACKED -- CANADIAN 63,159 1.18 63,975 1.43
EXCHANGE-TRADED FUNDSFinancialsiShares S&P/TSX 60 Index ETF 3,615 87,266 84,238
87,266 1.63 84,238 1.89
IndustrialSPDR S&P 500 ETF Trust 660 220,347 174,143
220,347 4.10 174,143 3.90
TOTAL EXCHANGE-TRADED FUNDS 307,613 5.73 258,381 5.79
EQUITIES -- CANADIANConsumer StaplesAlimentation Couche-Tard Inc. 985 64,606 46,573 George Weston Ltd. 110 12,008 12,679 Loblaw Cos Ltd. 470 32,063 33,545 Metro Inc. 550 22,138 22,623 Saputo Inc. 510 23,037 23,280
153,852 2.87 138,700 3.11
Consumer DiscretionaryCanadian Tire Corp., Ltd. 165 27,044 20,913 Dollarama Inc. 250 39,262 28,531 Gildan Activewear Inc. 550 22,336 19,554 Magna International Inc. 825 58,773 44,568 Restaurant Brands International Inc. 570 44,044 27,104
14
Schedule of Investment Portfolio As at December 31, 2017
Fair Value Fair Value Average Cost Average Cost($) (%) ($) (%)
Dividend FundShare/Par
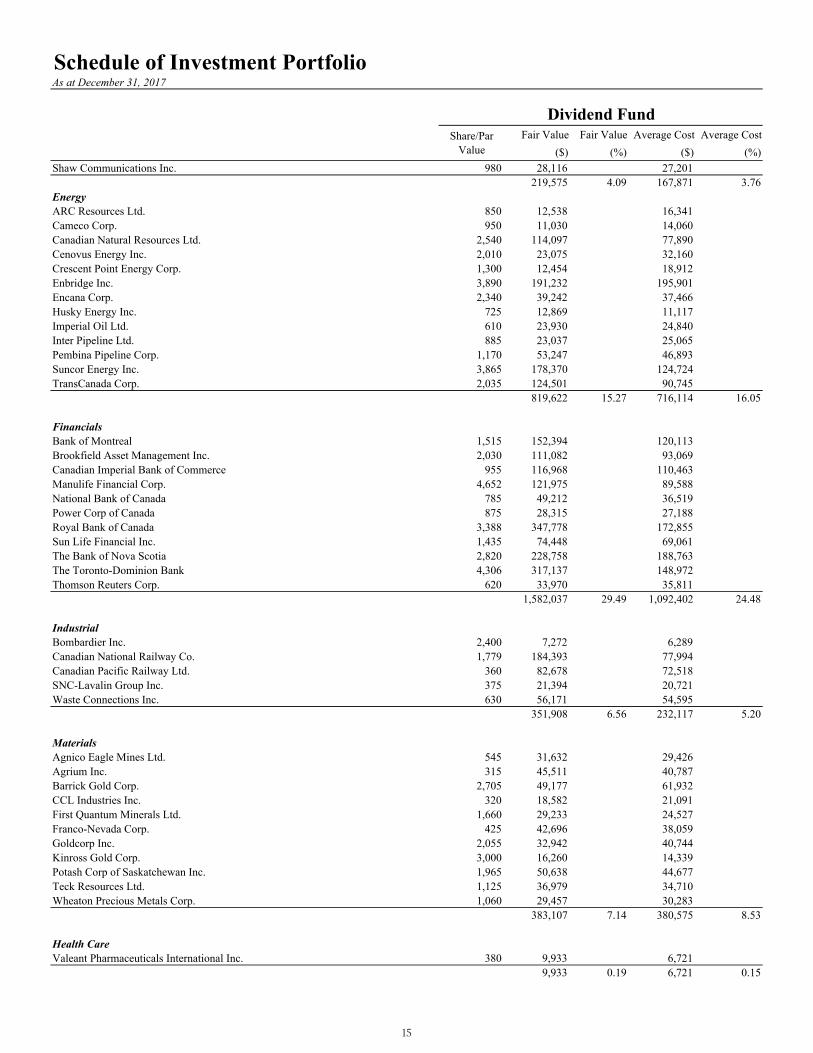
ValueShaw Communications Inc. 980 28,116 27,201
219,575 4.09 167,871 3.76EnergyARC Resources Ltd. 850 12,538 16,341 Cameco Corp. 950 11,030 14,060 Canadian Natural Resources Ltd. 2,540 114,097 77,890 Cenovus Energy Inc. 2,010 23,075 32,160 Crescent Point Energy Corp. 1,300 12,454 18,912 Enbridge Inc. 3,890 191,232 195,901 Encana Corp. 2,340 39,242 37,466 Husky Energy Inc. 725 12,869 11,117 Imperial Oil Ltd. 610 23,930 24,840 Inter Pipeline Ltd. 885 23,037 25,065 Pembina Pipeline Corp. 1,170 53,247 46,893 Suncor Energy Inc. 3,865 178,370 124,724 TransCanada Corp. 2,035 124,501 90,745
819,622 15.27 716,114 16.05
FinancialsBank of Montreal 1,515 152,394 120,113 Brookfield Asset Management Inc. 2,030 111,082 93,069 Canadian Imperial Bank of Commerce 955 116,968 110,463 Manulife Financial Corp. 4,652 121,975 89,588 National Bank of Canada 785 49,212 36,519 Power Corp of Canada 875 28,315 27,188 Royal Bank of Canada 3,388 347,778 172,855 Sun Life Financial Inc. 1,435 74,448 69,061 The Bank of Nova Scotia 2,820 228,758 188,763 The Toronto-Dominion Bank 4,306 317,137 148,972 Thomson Reuters Corp. 620 33,970 35,811
1,582,037 29.49 1,092,402 24.48
IndustrialBombardier Inc. 2,400 7,272 6,289 Canadian National Railway Co. 1,779 184,393 77,994 Canadian Pacific Railway Ltd. 360 82,678 72,518 SNC-Lavalin Group Inc. 375 21,394 20,721 Waste Connections Inc. 630 56,171 54,595
351,908 6.56 232,117 5.20
MaterialsAgnico Eagle Mines Ltd. 545 31,632 29,426 Agrium Inc. 315 45,511 40,787 Barrick Gold Corp. 2,705 49,177 61,932 CCL Industries Inc. 320 18,582 21,091 First Quantum Minerals Ltd. 1,660 29,233 24,527 Franco-Nevada Corp. 425 42,696 38,059 Goldcorp Inc. 2,055 32,942 40,744 Kinross Gold Corp. 3,000 16,260 14,339 Potash Corp of Saskatchewan Inc. 1,965 50,638 44,677 Teck Resources Ltd. 1,125 36,979 34,710 Wheaton Precious Metals Corp. 1,060 29,457 30,283
383,107 7.14 380,575 8.53
Health CareValeant Pharmaceuticals International Inc. 380 9,933 6,721
9,933 0.19 6,721 0.15
15
Schedule of Investment Portfolio As at December 31, 2017
Fair Value Fair Value Average Cost Average Cost($) (%) ($) (%)
Dividend FundShare/Par
Value
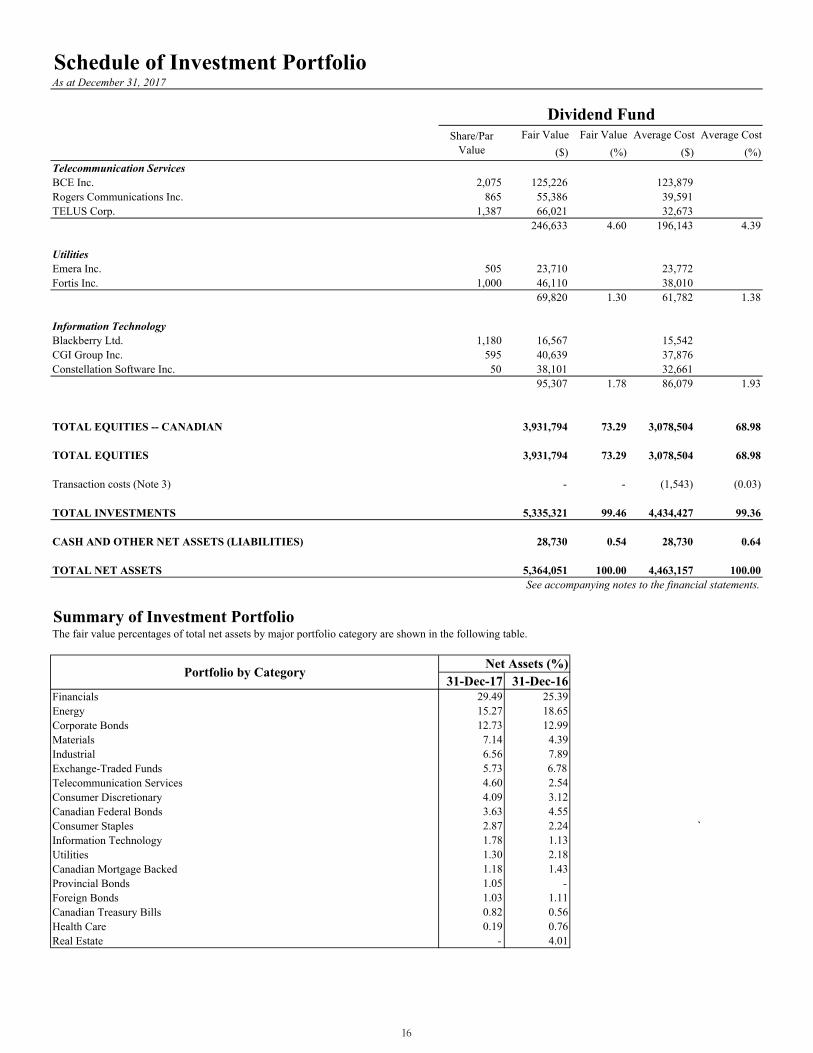
Telecommunication ServicesBCE Inc. 2,075 125,226 123,879 Rogers Communications Inc. 865 55,386 39,591 TELUS Corp. 1,387 66,021 32,673
246,633 4.60 196,143 4.39
UtilitiesEmera Inc. 505 23,710 23,772 Fortis Inc. 1,000 46,110 38,010
69,820 1.30 61,782 1.38
Information TechnologyBlackberry Ltd. 1,180 16,567 15,542 CGI Group Inc. 595 40,639 37,876 Constellation Software Inc. 50 38,101 32,661
95,307 1.78 86,079 1.93
TOTAL EQUITIES -- CANADIAN 3,931,794 73.29 3,078,504 68.98
TOTAL EQUITIES 3,931,794 73.29 3,078,504 68.98
Transaction costs (Note 3) - - (1,543) (0.03)
TOTAL INVESTMENTS 5,335,321 99.46 4,434,427 99.36
CASH AND OTHER NET ASSETS (LIABILITIES) 28,730 0.54 28,730 0.64
TOTAL NET ASSETS 5,364,051 100.00 4,463,157 100.00See accompanying notes to the financial statements.
Summary of Investment PortfolioThe fair value percentages of total net assets by major portfolio category are shown in the following table.
31-Dec-17 31-Dec-16Financials 29.49 25.39Energy 15.27 18.65Corporate Bonds 12.73 12.99Materials 7.14 4.39Industrial 6.56 7.89Exchange-Traded Funds 5.73 6.78 Telecommunication Services 4.60 2.54Consumer Discretionary 4.09 3.12Canadian Federal Bonds 3.63 4.55Consumer Staples 2.87 2.24 `Information Technology 1.78 1.13Utilities 1.30 2.18Canadian Mortgage Backed 1.18 1.43Provincial Bonds 1.05 - Foreign Bonds 1.03 1.11Canadian Treasury Bills 0.82 0.56Health Care 0.19 0.76Real Estate - 4.01
Portfolio by Category Net Assets (%)
16
Schedule of Investment Portfolio As at December 31, 2017
Fair Value Fair Value Average Cost Average Cost($) (%) ($) (%)
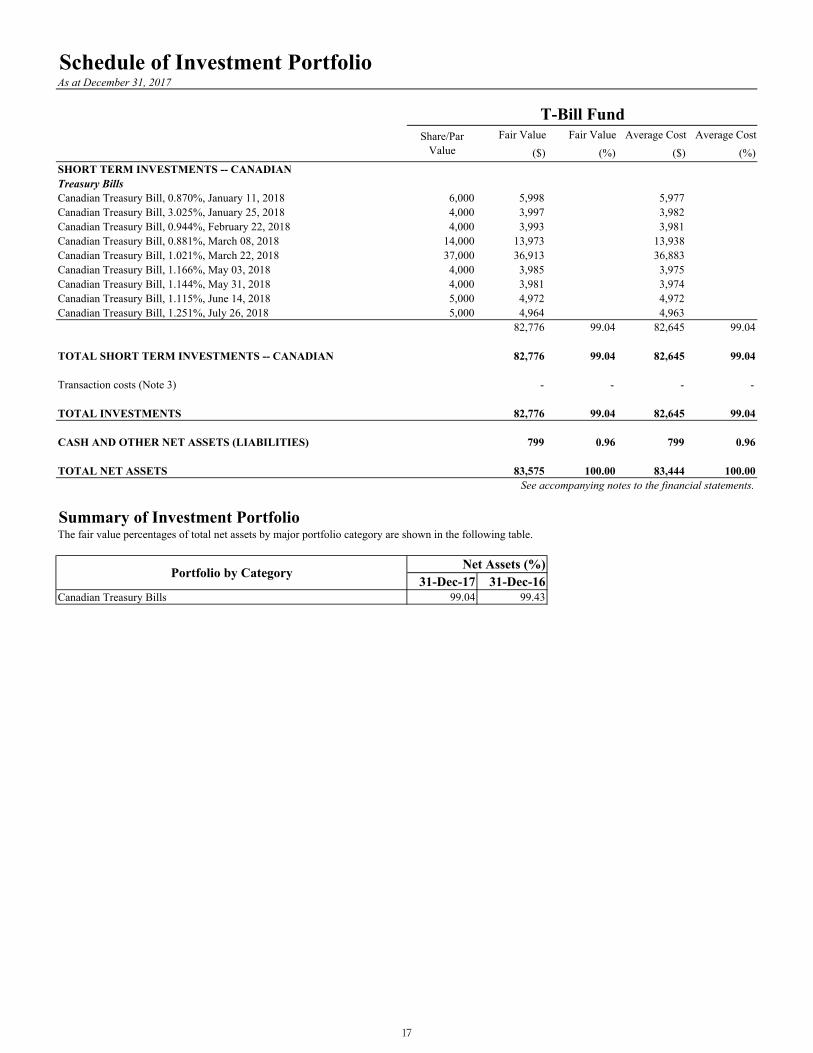
SHORT TERM INVESTMENTS -- CANADIANTreasury BillsCanadian Treasury Bill, 0.870%, January 11, 2018 6,000 5,998 5,977 Canadian Treasury Bill, 3.025%, January 25, 2018 4,000 3,997 3,982 Canadian Treasury Bill, 0.944%, February 22, 2018 4,000 3,993 3,981 Canadian Treasury Bill, 0.881%, March 08, 2018 14,000 13,973 13,938 Canadian Treasury Bill, 1.021%, March 22, 2018 37,000 36,913 36,883 Canadian Treasury Bill, 1.166%, May 03, 2018 4,000 3,985 3,975 Canadian Treasury Bill, 1.144%, May 31, 2018 4,000 3,981 3,974 Canadian Treasury Bill, 1.115%, June 14, 2018 5,000 4,972 4,972 Canadian Treasury Bill, 1.251%, July 26, 2018 5,000 4,964 4,963
82,776 99.04 82,645 99.04
TOTAL SHORT TERM INVESTMENTS -- CANADIAN 82,776 99.04 82,645 99.04
Transaction costs (Note 3) - - - -
TOTAL INVESTMENTS 82,776 99.04 82,645 99.04
CASH AND OTHER NET ASSETS (LIABILITIES) 799 0.96 799 0.96
TOTAL NET ASSETS 83,575 100.00 83,444 100.00See accompanying notes to the financial statements.
Summary of Investment PortfolioThe fair value percentages of total net assets by major portfolio category are shown in the following table.
31-Dec-17 31-Dec-16Canadian Treasury Bills 99.04 99.43
T-Bill FundShare/Par
Value
Portfolio by Category Net Assets (%)
17

Schedule of Investment Portfolio As at December 31, 2017
Fair Value Fair Value Average Cost Average Cost($) (%) ($) (%)
SHORT TERM INVESTMENTS -- CANADIANTreasury BillsCanadian Treasury Bill, 0.884%, March 08, 2018 32,000 31,938 31,930Canadian Treasury Bill, 1.049%, April 05, 2018 100,000 99,714 99,722
131,652 1.06 131,652 1.90
TOTAL SHORT TERM INVESTMENTS -- CANADIAN 131,652 1.06 131,652 1.90
EXCHANGE-TRADED FUNDSFinancialsiShares S&P/TSX 60 Index Fund 510,200 12,316,228 6,795,395
12,316,228 98.82 6,795,395 97.90
TOTAL EXCHANGE-TRADED FUNDS 12,316,228 98.82 6,795,395 97.90
Transaction costs (Note 3) - - (651) (0.01)
TOTAL INVESTMENTS 12,447,880 99.88 6,926,396 99.79
CASH AND OTHER NET ASSETS (LIABILITIES) 14,838 0.12 14,838 0.21
TOTAL NET ASSETS 12,462,718 100.00 6,941,234 100.00 See accompanying notes to the financial statements.
Summary of Investment PortfolioThe fair value percentages of total net assets by major portfolio category are shown in the following table.
31-Dec-17 31-Dec-16Exchange-Traded Funds 98.82 99.48Canadian Treasury Bills 1.06 0.60
Canadian-35 Index FundShare/Par
Value
Portfolio by Category Net Assets (%)
18
Schedule of Investment Portfolio As at December 31, 2017
Fair Value Fair Value Average Cost Average Cost($) (%) ($) (%)
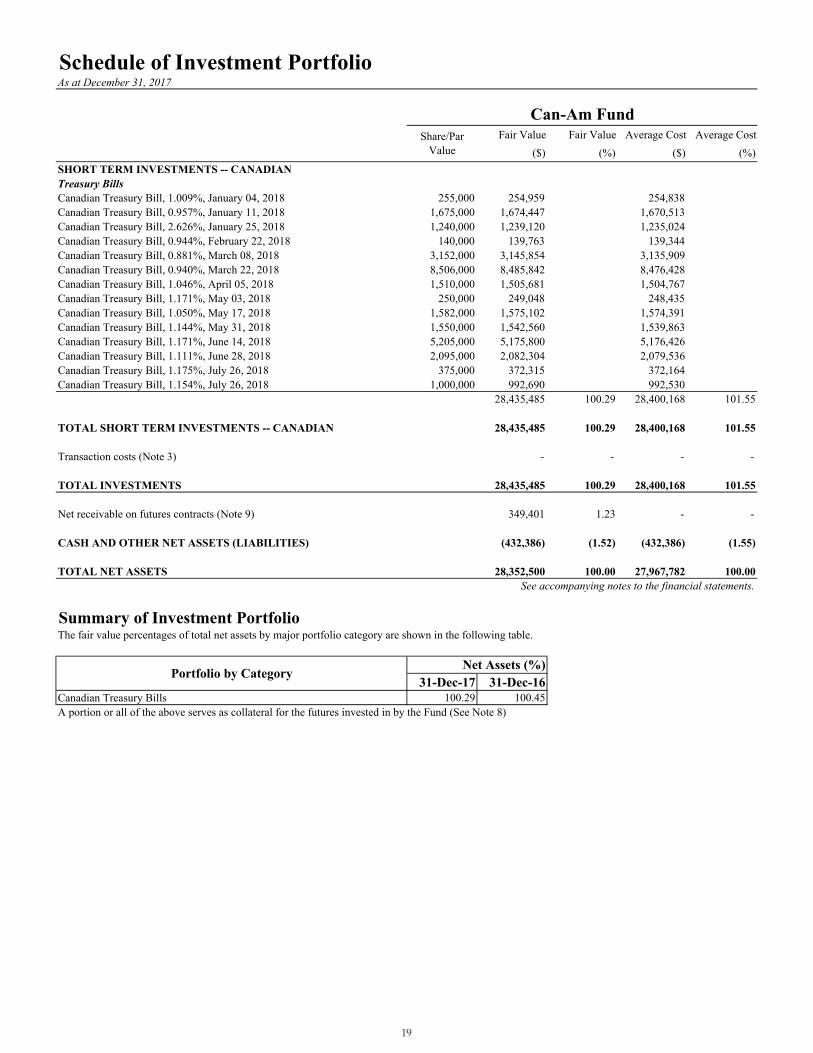
SHORT TERM INVESTMENTS -- CANADIANTreasury BillsCanadian Treasury Bill, 1.009%, January 04, 2018 255,000 254,959 254,838 Canadian Treasury Bill, 0.957%, January 11, 2018 1,675,000 1,674,447 1,670,513 Canadian Treasury Bill, 2.626%, January 25, 2018 1,240,000 1,239,120 1,235,024 Canadian Treasury Bill, 0.944%, February 22, 2018 140,000 139,763 139,344 Canadian Treasury Bill, 0.881%, March 08, 2018 3,152,000 3,145,854 3,135,909 Canadian Treasury Bill, 0.940%, March 22, 2018 8,506,000 8,485,842 8,476,428 Canadian Treasury Bill, 1.046%, April 05, 2018 1,510,000 1,505,681 1,504,767 Canadian Treasury Bill, 1.171%, May 03, 2018 250,000 249,048 248,435 Canadian Treasury Bill, 1.050%, May 17, 2018 1,582,000 1,575,102 1,574,391 Canadian Treasury Bill, 1.144%, May 31, 2018 1,550,000 1,542,560 1,539,863 Canadian Treasury Bill, 1.171%, June 14, 2018 5,205,000 5,175,800 5,176,426 Canadian Treasury Bill, 1.111%, June 28, 2018 2,095,000 2,082,304 2,079,536 Canadian Treasury Bill, 1.175%, July 26, 2018 375,000 372,315 372,164 Canadian Treasury Bill, 1.154%, July 26, 2018 1,000,000 992,690 992,530
28,435,485 100.29 28,400,168 101.55
TOTAL SHORT TERM INVESTMENTS -- CANADIAN 28,435,485 100.29 28,400,168 101.55
Transaction costs (Note 3) - - - -
TOTAL INVESTMENTS 28,435,485 100.29 28,400,168 101.55
Net receivable on futures contracts (Note 9) 349,401 1.23 - -
CASH AND OTHER NET ASSETS (LIABILITIES) (432,386) (1.52) (432,386) (1.55)
TOTAL NET ASSETS 28,352,500 100.00 27,967,782 100.00 See accompanying notes to the financial statements.
Summary of Investment PortfolioThe fair value percentages of total net assets by major portfolio category are shown in the following table.
31-Dec-17 31-Dec-16Canadian Treasury Bills 100.29 100.45A portion or all of the above serves as collateral for the futures invested in by the Fund (See Note 8)
Can-Am FundShare/Par
Value
Portfolio by Category Net Assets (%)
19
Schedule of Investment PortfolioAs at December 31, 2017
Fair Value Fair Value Average Cost Average Cost($) (%) ($) (%)
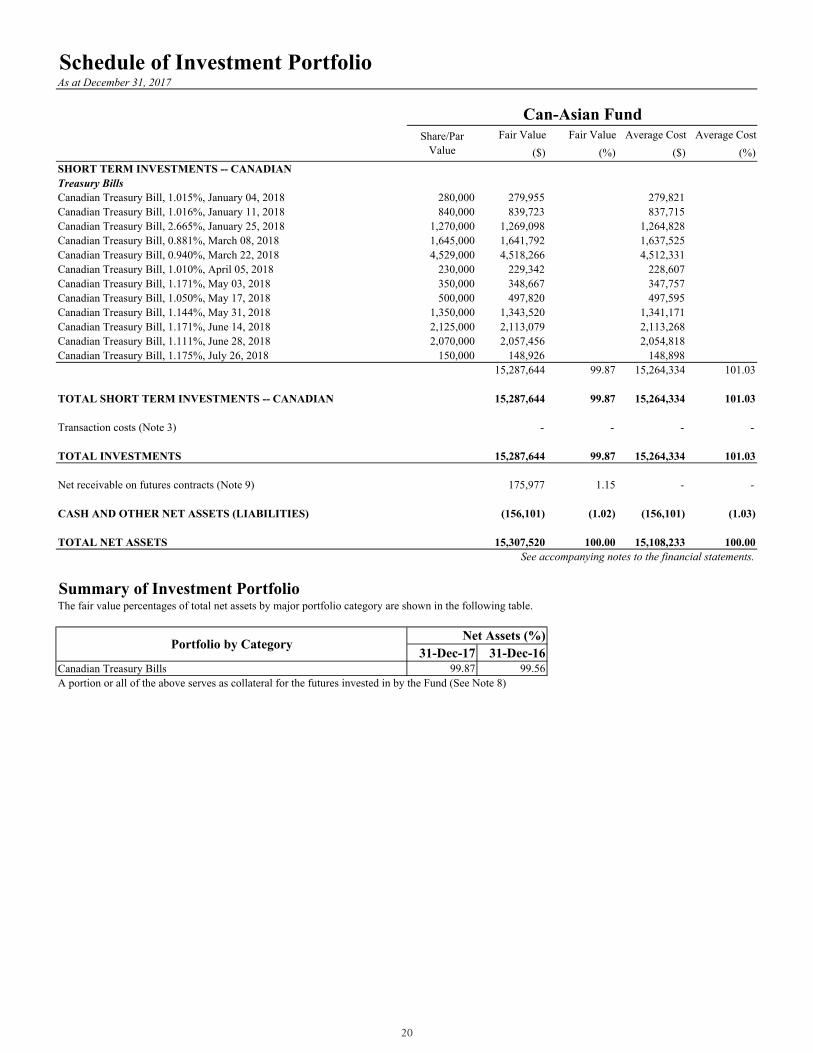
SHORT TERM INVESTMENTS -- CANADIANTreasury BillsCanadian Treasury Bill, 1.015%, January 04, 2018 280,000 279,955 279,821 Canadian Treasury Bill, 1.016%, January 11, 2018 840,000 839,723 837,715 Canadian Treasury Bill, 2.665%, January 25, 2018 1,270,000 1,269,098 1,264,828 Canadian Treasury Bill, 0.881%, March 08, 2018 1,645,000 1,641,792 1,637,525 Canadian Treasury Bill, 0.940%, March 22, 2018 4,529,000 4,518,266 4,512,331 Canadian Treasury Bill, 1.010%, April 05, 2018 230,000 229,342 228,607 Canadian Treasury Bill, 1.171%, May 03, 2018 350,000 348,667 347,757 Canadian Treasury Bill, 1.050%, May 17, 2018 500,000 497,820 497,595 Canadian Treasury Bill, 1.144%, May 31, 2018 1,350,000 1,343,520 1,341,171 Canadian Treasury Bill, 1.171%, June 14, 2018 2,125,000 2,113,079 2,113,268 Canadian Treasury Bill, 1.111%, June 28, 2018 2,070,000 2,057,456 2,054,818 Canadian Treasury Bill, 1.175%, July 26, 2018 150,000 148,926 148,898
15,287,644 99.87 15,264,334 101.03
TOTAL SHORT TERM INVESTMENTS -- CANADIAN 15,287,644 99.87 15,264,334 101.03
Transaction costs (Note 3) - - - -
TOTAL INVESTMENTS 15,287,644 99.87 15,264,334 101.03
Net receivable on futures contracts (Note 9) 175,977 1.15 - -
CASH AND OTHER NET ASSETS (LIABILITIES) (156,101) (1.02) (156,101) (1.03)
TOTAL NET ASSETS 15,307,520 100.00 15,108,233 100.00 See accompanying notes to the financial statements.
Summary of Investment PortfolioThe fair value percentages of total net assets by major portfolio category are shown in the following table.
31-Dec-17 31-Dec-16Canadian Treasury Bills 99.87 99.56A portion or all of the above serves as collateral for the futures invested in by the Fund (See Note 8)
Can-Asian FundShare/Par
Value
Portfolio by Category Net Assets (%)
20
Schedule of Investment Portfolio As at December 31, 2017
Fair Value Fair Value Average Cost Average Cost($) (%) ($) (%)
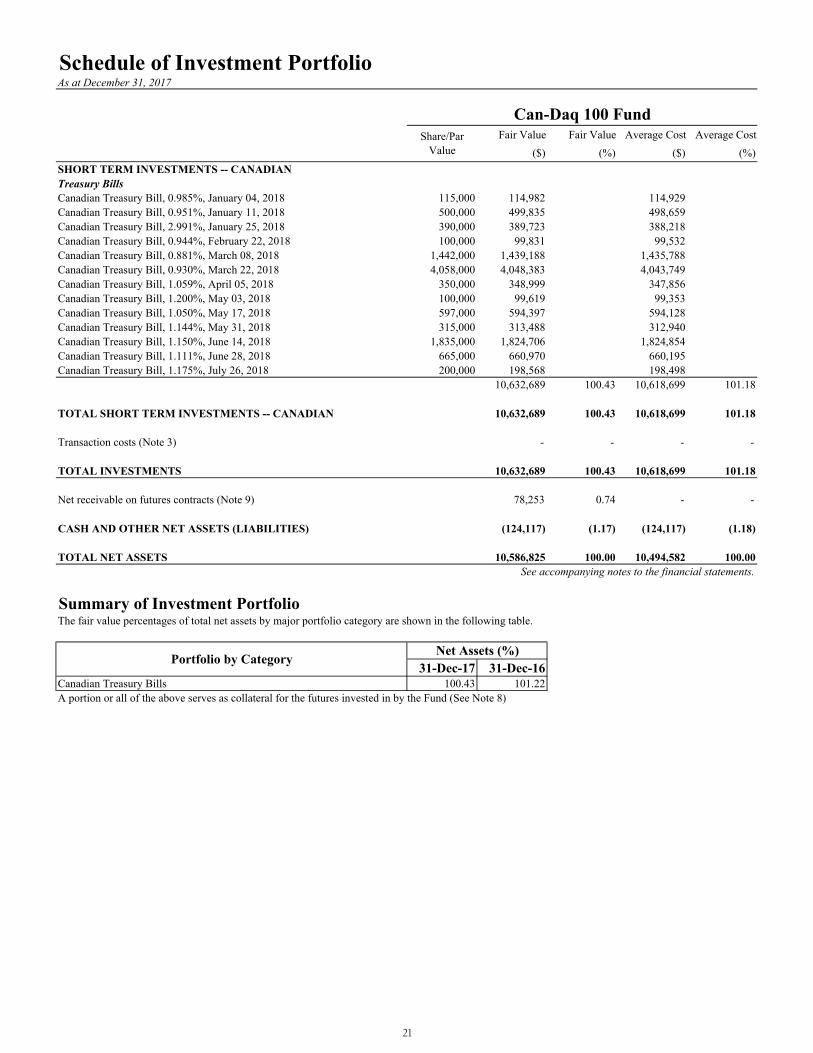
SHORT TERM INVESTMENTS -- CANADIANTreasury BillsCanadian Treasury Bill, 0.985%, January 04, 2018 115,000 114,982 114,929Canadian Treasury Bill, 0.951%, January 11, 2018 500,000 499,835 498,659Canadian Treasury Bill, 2.991%, January 25, 2018 390,000 389,723 388,218Canadian Treasury Bill, 0.944%, February 22, 2018 100,000 99,831 99,532Canadian Treasury Bill, 0.881%, March 08, 2018 1,442,000 1,439,188 1,435,788Canadian Treasury Bill, 0.930%, March 22, 2018 4,058,000 4,048,383 4,043,749Canadian Treasury Bill, 1.059%, April 05, 2018 350,000 348,999 347,856Canadian Treasury Bill, 1.200%, May 03, 2018 100,000 99,619 99,353Canadian Treasury Bill, 1.050%, May 17, 2018 597,000 594,397 594,128Canadian Treasury Bill, 1.144%, May 31, 2018 315,000 313,488 312,940Canadian Treasury Bill, 1.150%, June 14, 2018 1,835,000 1,824,706 1,824,854Canadian Treasury Bill, 1.111%, June 28, 2018 665,000 660,970 660,195Canadian Treasury Bill, 1.175%, July 26, 2018 200,000 198,568 198,498
10,632,689 100.43 10,618,699 101.18
TOTAL SHORT TERM INVESTMENTS -- CANADIAN 10,632,689 100.43 10,618,699 101.18
Transaction costs (Note 3) - - - -
TOTAL INVESTMENTS 10,632,689 100.43 10,618,699 101.18
Net receivable on futures contracts (Note 9) 78,253 0.74 - -
CASH AND OTHER NET ASSETS (LIABILITIES) (124,117) (1.17) (124,117) (1.18)
TOTAL NET ASSETS 10,586,825 100.00 10,494,582 100.00 See accompanying notes to the financial statements.
Summary of Investment PortfolioThe fair value percentages of total net assets by major portfolio category are shown in the following table.
31-Dec-17 31-Dec-16Canadian Treasury Bills 100.43 101.22A portion or all of the above serves as collateral for the futures invested in by the Fund (See Note 8)
Can-Daq 100 FundShare/Par
Value
Portfolio by Category Net Assets (%)
21
Schedule of Investment Portfolio As at December 31, 2017
Fair Value Fair Value Average Cost Average Cost($) (%) ($) (%)
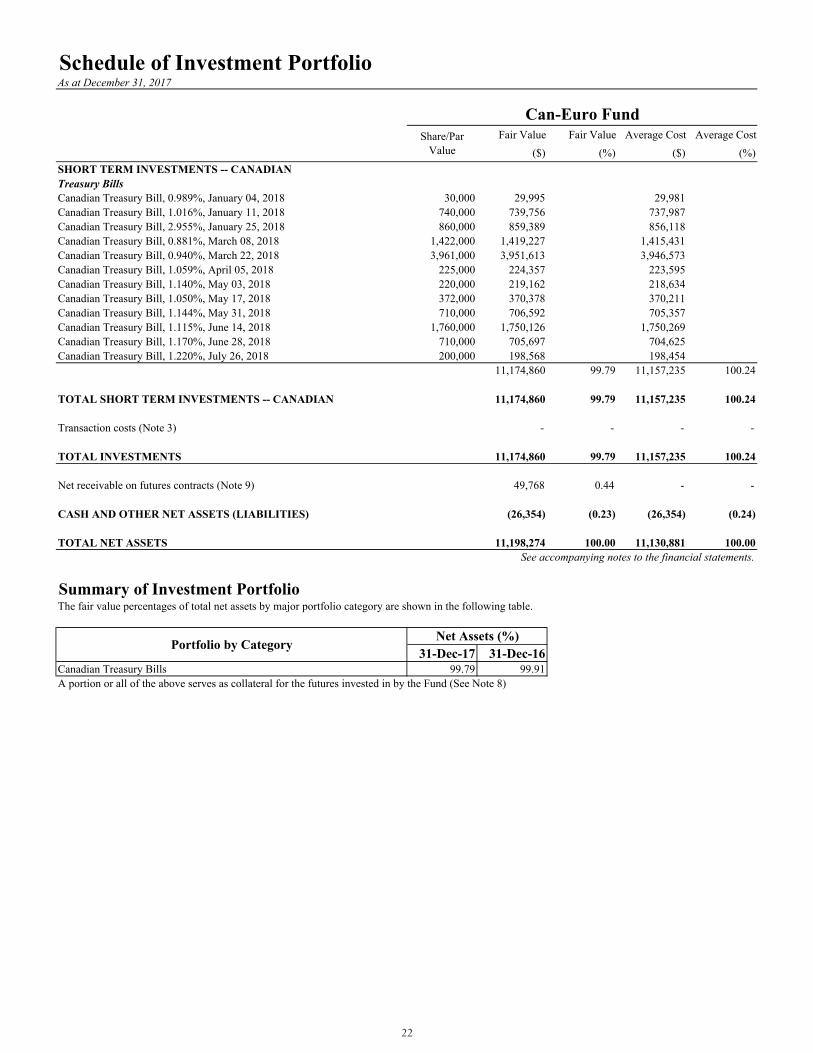
SHORT TERM INVESTMENTS -- CANADIANTreasury BillsCanadian Treasury Bill, 0.989%, January 04, 2018 30,000 29,995 29,981Canadian Treasury Bill, 1.016%, January 11, 2018 740,000 739,756 737,987Canadian Treasury Bill, 2.955%, January 25, 2018 860,000 859,389 856,118Canadian Treasury Bill, 0.881%, March 08, 2018 1,422,000 1,419,227 1,415,431Canadian Treasury Bill, 0.940%, March 22, 2018 3,961,000 3,951,613 3,946,573Canadian Treasury Bill, 1.059%, April 05, 2018 225,000 224,357 223,595Canadian Treasury Bill, 1.140%, May 03, 2018 220,000 219,162 218,634Canadian Treasury Bill, 1.050%, May 17, 2018 372,000 370,378 370,211Canadian Treasury Bill, 1.144%, May 31, 2018 710,000 706,592 705,357Canadian Treasury Bill, 1.115%, June 14, 2018 1,760,000 1,750,126 1,750,269Canadian Treasury Bill, 1.170%, June 28, 2018 710,000 705,697 704,625Canadian Treasury Bill, 1.220%, July 26, 2018 200,000 198,568 198,454
11,174,860 99.79 11,157,235 100.24
TOTAL SHORT TERM INVESTMENTS -- CANADIAN 11,174,860 99.79 11,157,235 100.24
Transaction costs (Note 3) - - - -
TOTAL INVESTMENTS 11,174,860 99.79 11,157,235 100.24
Net receivable on futures contracts (Note 9) 49,768 0.44 - -
CASH AND OTHER NET ASSETS (LIABILITIES) (26,354) (0.23) (26,354) (0.24)
TOTAL NET ASSETS 11,198,274 100.00 11,130,881 100.00 See accompanying notes to the financial statements.
Summary of Investment PortfolioThe fair value percentages of total net assets by major portfolio category are shown in the following table.
31-Dec-17 31-Dec-16Canadian Treasury Bills 99.79 99.91A portion or all of the above serves as collateral for the futures invested in by the Fund (See Note 8)
Share/Par Value
Portfolio by Category
Can-Euro Fund
Net Assets (%)
22
Schedule of Investment Portfolio As at December 31, 2017
Fair Value Fair Value Average Cost Average Cost($) (%) ($) (%)
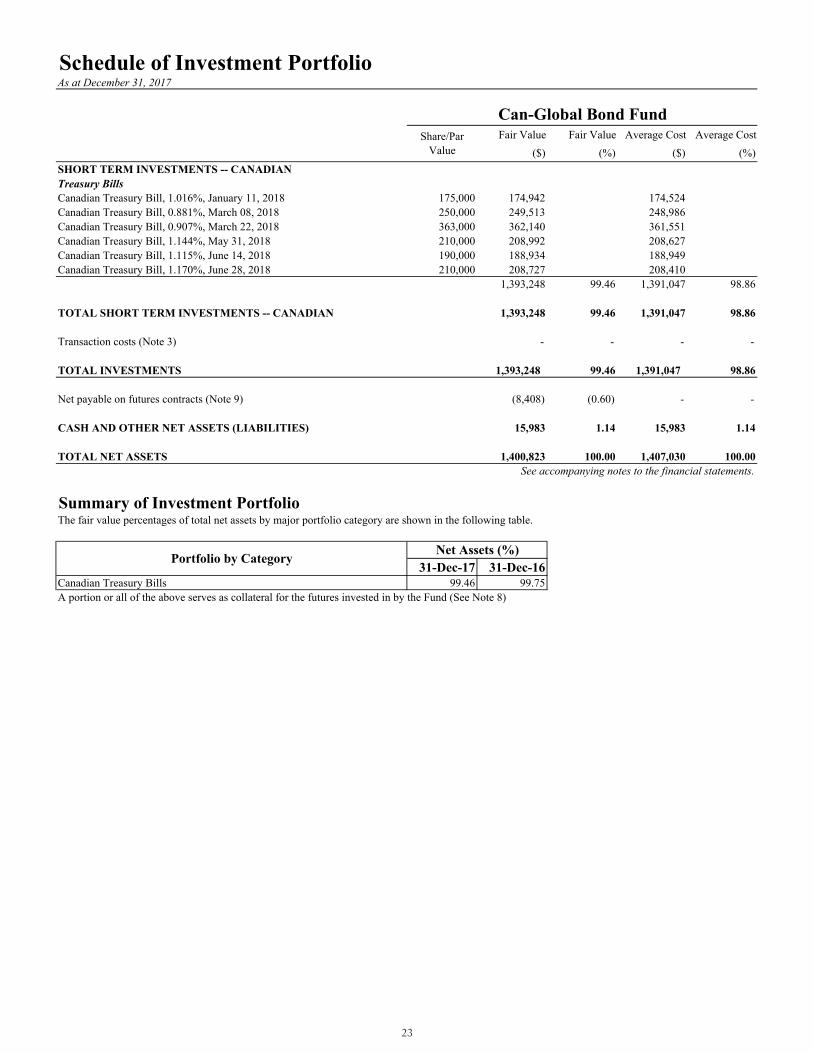
SHORT TERM INVESTMENTS -- CANADIANTreasury BillsCanadian Treasury Bill, 1.016%, January 11, 2018 175,000 174,942 174,524Canadian Treasury Bill, 0.881%, March 08, 2018 250,000 249,513 248,986Canadian Treasury Bill, 0.907%, March 22, 2018 363,000 362,140 361,551Canadian Treasury Bill, 1.144%, May 31, 2018 210,000 208,992 208,627Canadian Treasury Bill, 1.115%, June 14, 2018 190,000 188,934 188,949Canadian Treasury Bill, 1.170%, June 28, 2018 210,000 208,727 208,410
1,393,248 99.46 1,391,047 98.86
TOTAL SHORT TERM INVESTMENTS -- CANADIAN 1,393,248 99.46 1,391,047 98.86
Transaction costs (Note 3) - - - -
TOTAL INVESTMENTS 1,393,248 99.46 1,391,047 98.86
Net payable on futures contracts (Note 9) (8,408) (0.60) - -
CASH AND OTHER NET ASSETS (LIABILITIES) 15,983 1.14 15,983 1.14
TOTAL NET ASSETS 1,400,823 100.00 1,407,030 100.00See accompanying notes to the financial statements.
Summary of Investment PortfolioThe fair value percentages of total net assets by major portfolio category are shown in the following table.
31-Dec-17 31-Dec-16Canadian Treasury Bills 99.46 99.75A portion or all of the above serves as collateral for the futures invested in by the Fund (See Note 8)
Can-Global Bond FundShare/Par
Value
Portfolio by Category Net Assets (%)
23
Schedule of Investment Portfolio As at December 31, 2017
Fair Value Fair Value Average Cost Average Cost($) (%) ($) (%)
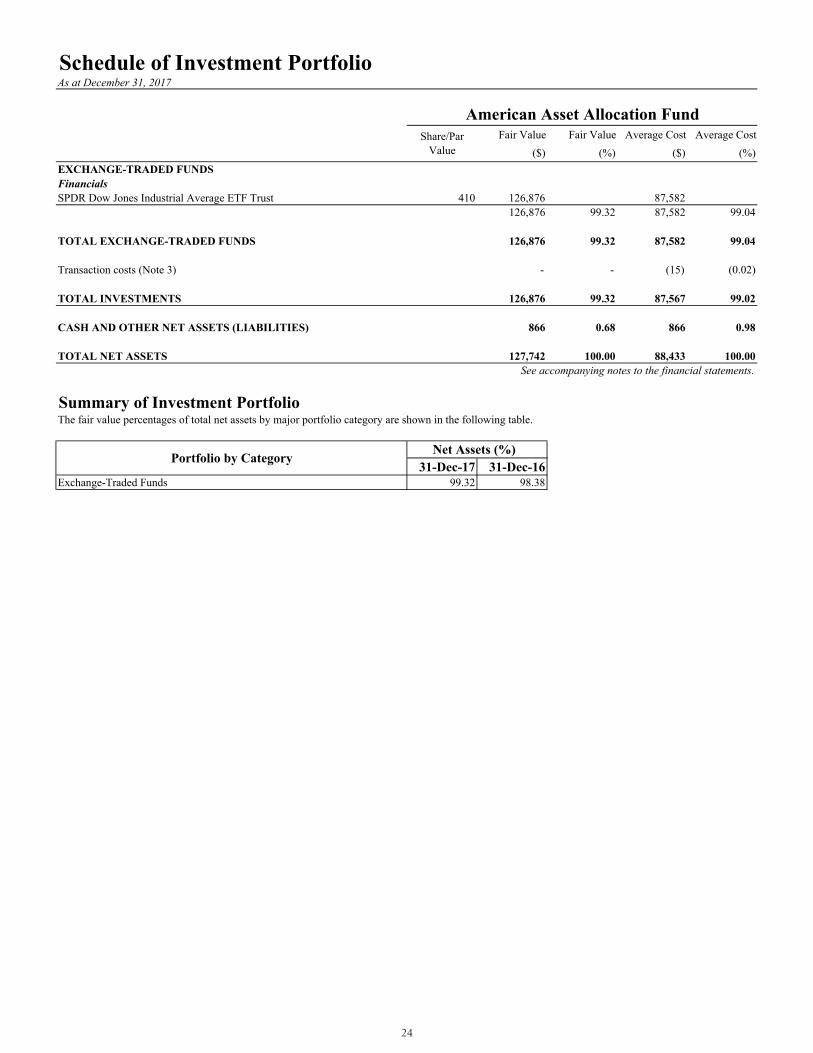
EXCHANGE-TRADED FUNDSFinancialsSPDR Dow Jones Industrial Average ETF Trust 410 126,876 87,582
126,876 99.32 87,582 99.04
TOTAL EXCHANGE-TRADED FUNDS 126,876 99.32 87,582 99.04
Transaction costs (Note 3) - - (15) (0.02)
TOTAL INVESTMENTS 126,876 99.32 87,567 99.02
CASH AND OTHER NET ASSETS (LIABILITIES) 866 0.68 866 0.98
TOTAL NET ASSETS 127,742 100.00 88,433 100.00 See accompanying notes to the financial statements.
Summary of Investment PortfolioThe fair value percentages of total net assets by major portfolio category are shown in the following table.
31-Dec-17 31-Dec-16Exchange-Traded Funds 99.32 98.38
American Asset Allocation FundShare/Par
Value
Portfolio by Category Net Assets (%)
24

Schedule of Investment Portfolio As at December 31, 2017
Fair Value Fair Value Average Cost Average Cost($) (%) ($) (%)
EXCHANGE-TRADED FUNDSIndustrialSPDR S&P 500 ETF Trust 415 138,552 93,407
138,552 98.90 93,407 98.38
TOTAL EXCHANGE-TRADED FUNDS 138,552 98.90 93,407 98.38
Transaction costs (Note 3) - - (1) -
TOTAL INVESTMENTS 138,552 98.90 93,406 98.38
CASH AND OTHER NET ASSETS (LIABILITIES) 1,536 1.10 1,536 1.62
TOTAL NET ASSETS 140,088 100.00 94,942 100.00See accompanying notes to the financial statements.
Summary of Investment PortfolioThe fair value percentages of total net assets by major portfolio category are shown in the following table.
31-Dec-17 31-Dec-16Exchange-Traded Funds 98.90 99.51
American Equity Index FundShare/Par
Value
Portfolio by Category Net Assets (%)
25
Schedule of Investment Portfolio As at December 31, 2017
Fair Value Fair Value Average Cost Average Cost($) (%) ($) (%)
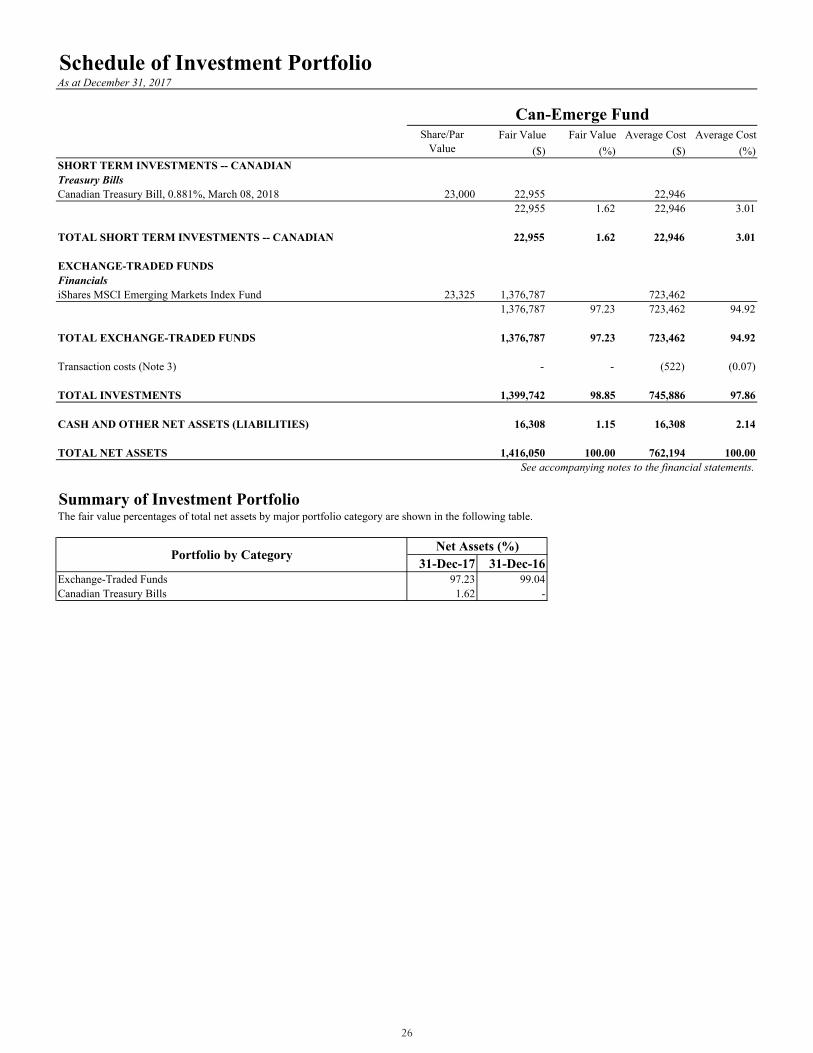
SHORT TERM INVESTMENTS -- CANADIANTreasury BillsCanadian Treasury Bill, 0.881%, March 08, 2018 23,000 22,955 22,946
22,955 1.62 22,946 3.01
TOTAL SHORT TERM INVESTMENTS -- CANADIAN 22,955 1.62 22,946 3.01
EXCHANGE-TRADED FUNDSFinancialsiShares MSCI Emerging Markets Index Fund 23,325 1,376,787 723,462
1,376,787 97.23 723,462 94.92
TOTAL EXCHANGE-TRADED FUNDS 1,376,787 97.23 723,462 94.92
Transaction costs (Note 3) - - (522) (0.07)
TOTAL INVESTMENTS 1,399,742 98.85 745,886 97.86
CASH AND OTHER NET ASSETS (LIABILITIES) 16,308 1.15 16,308 2.14
TOTAL NET ASSETS 1,416,050 100.00 762,194 100.00See accompanying notes to the financial statements.
Summary of Investment PortfolioThe fair value percentages of total net assets by major portfolio category are shown in the following table.
31-Dec-17 31-Dec-16Exchange-Traded Funds 97.23 99.04Canadian Treasury Bills 1.62 -
Can-Emerge FundShare/Par
Value
Portfolio by Category Net Assets (%)
26
Schedule of Investment Portfolio As at December 31, 2017
Fair Value Fair Value Average Cost Average Cost($) (%) ($) (%)
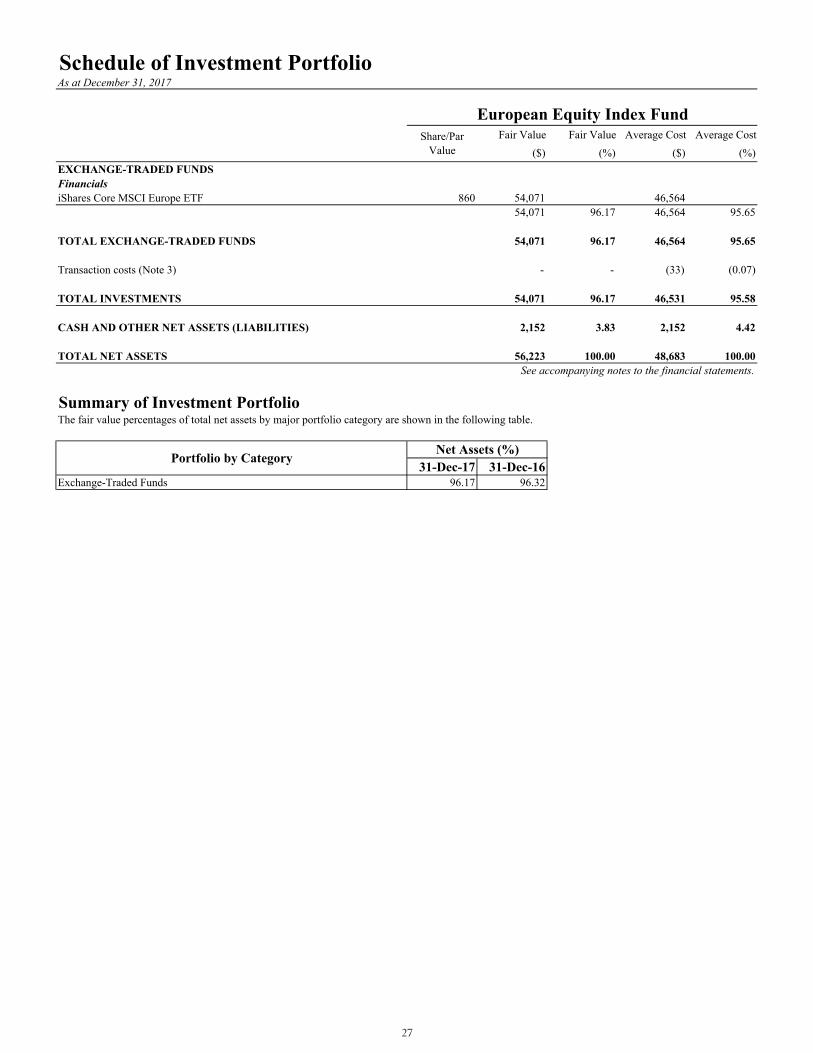
EXCHANGE-TRADED FUNDSFinancialsiShares Core MSCI Europe ETF 860 54,071 46,564
54,071 96.17 46,564 95.65
TOTAL EXCHANGE-TRADED FUNDS 54,071 96.17 46,564 95.65
Transaction costs (Note 3) - - (33) (0.07)
TOTAL INVESTMENTS 54,071 96.17 46,531 95.58
CASH AND OTHER NET ASSETS (LIABILITIES) 2,152 3.83 2,152 4.42
TOTAL NET ASSETS 56,223 100.00 48,683 100.00See accompanying notes to the financial statements.
Summary of Investment Portfolio The fair value percentages of total net assets by major portfolio category are shown in the following table.
31-Dec-17 31-Dec-16Exchange-Traded Funds 96.17 96.32
European Equity Index FundShare/Par
Value
Portfolio by Category Net Assets (%)
27

Schedule of Investment Portfolio As at December 31, 2017
Fair Value Fair Value Average Cost Average Cost($) (%) ($) (%)
EXCHANGE-TRADED FUNDSFinancialsiShares International Treasury Bond Index Fund 1,640 102,577 85,344
102,577 98.02 85,344 97.66
TOTAL EXCHANGE-TRADED FUNDS 102,577 98.02 85,344 97.66
Transaction costs (Note 3) - - (20) (0.02)
TOTAL INVESTMENTS 102,577 98.02 85,324 97.64
CASH AND OTHER NET ASSETS (LIABILITIES) 2,068 1.98 2,068 2.36
TOTAL NET ASSETS 104,645 100.00 87,392 100.00See accompanying notes to the financial statements.
Summary of Investment PortfolioThe fair value percentages of total net assets by major portfolio category are shown in the following table.
31-Dec-17 31-Dec-16Exchange-Traded Funds 98.02 97.35
International Bond Index FundShare/Par
Value
Portfolio by Category Net Assets (%)
28
Schedule of Investment Portfolio As at December 31, 2017
Fair Value Fair Value Average Cost Average Cost($) (%) ($) (%)
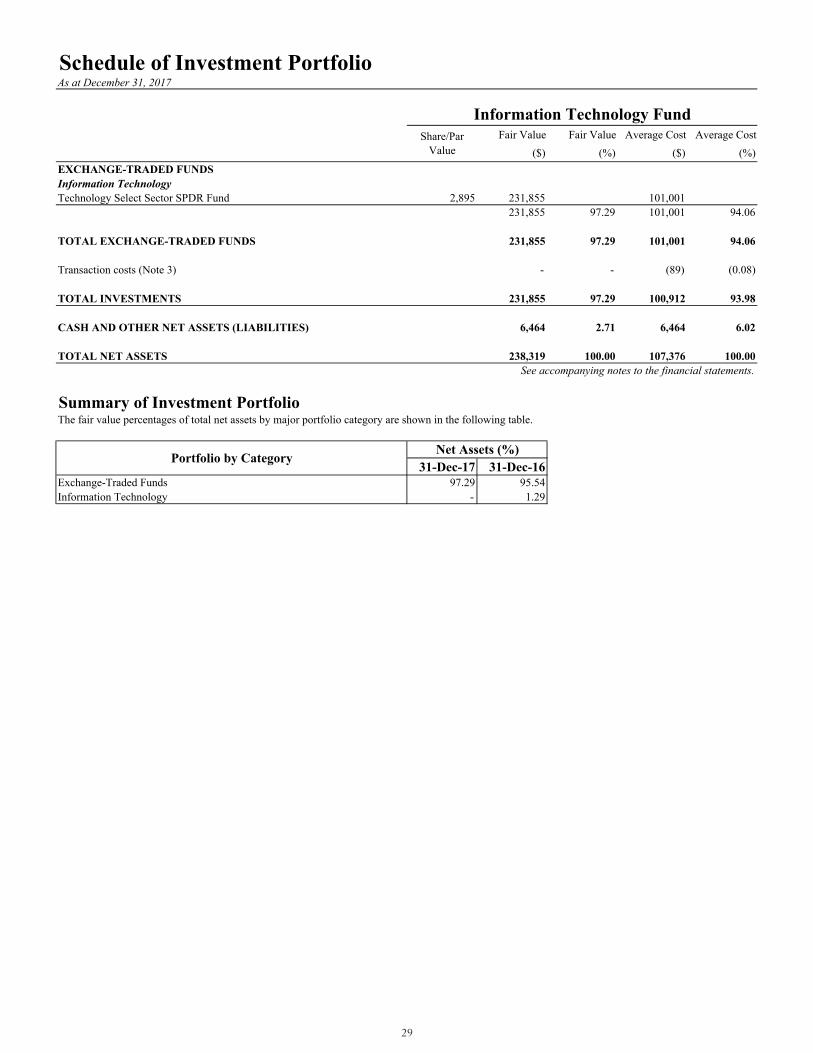
EXCHANGE-TRADED FUNDSInformation TechnologyTechnology Select Sector SPDR Fund 2,895 231,855 101,001
231,855 97.29 101,001 94.06
TOTAL EXCHANGE-TRADED FUNDS 231,855 97.29 101,001 94.06
Transaction costs (Note 3) - - (89) (0.08)
TOTAL INVESTMENTS 231,855 97.29 100,912 93.98
CASH AND OTHER NET ASSETS (LIABILITIES) 6,464 2.71 6,464 6.02
TOTAL NET ASSETS 238,319 100.00 107,376 100.00See accompanying notes to the financial statements.
Summary of Investment PortfolioThe fair value percentages of total net assets by major portfolio category are shown in the following table.
31-Dec-17 31-Dec-16Exchange-Traded Funds 97.29 95.54Information Technology - 1.29
Information Technology FundShare/Par
Value
Portfolio by Category Net Assets (%)
29

Schedule of Investment Portfolio As at December 31, 2017
Fair Value Fair Value Average Cost Average Cost($) (%) ($) (%)
EXCHANGE-TRADED FUNDSIndustrialSPDR S&P 500 ETF Trust 92 30,715 17,947
30,715 98.74 17,947 97.87
TOTAL EXCHANGE-TRADED FUNDS 30,715 98.74 17,947 97.87
Transaction costs (Note 3) - - (3) (0.02)
TOTAL INVESTMENTS 30,715 98.74 17,944 97.85
CASH AND OTHER NET ASSETS (LIABILITIES) 393 1.26 393 2.15
TOTAL NET ASSETS 31,108 100.00 18,337 100.00See accompanying notes to the financial statements.
Summary of Investment PortfolioThe fair value percentages of total net assets by major portfolio category are shown in the following table.
31-Dec-17 31-Dec-16Exchange-Traded Funds 98.74 96.74
International Brands FundShare/Par
Value
Portfolio by Category Net Assets (%)
30
Schedule of Investment Portfolio As at December 31, 2017
Fair Value Fair Value Average Cost Average Cost($) (%) ($) (%)
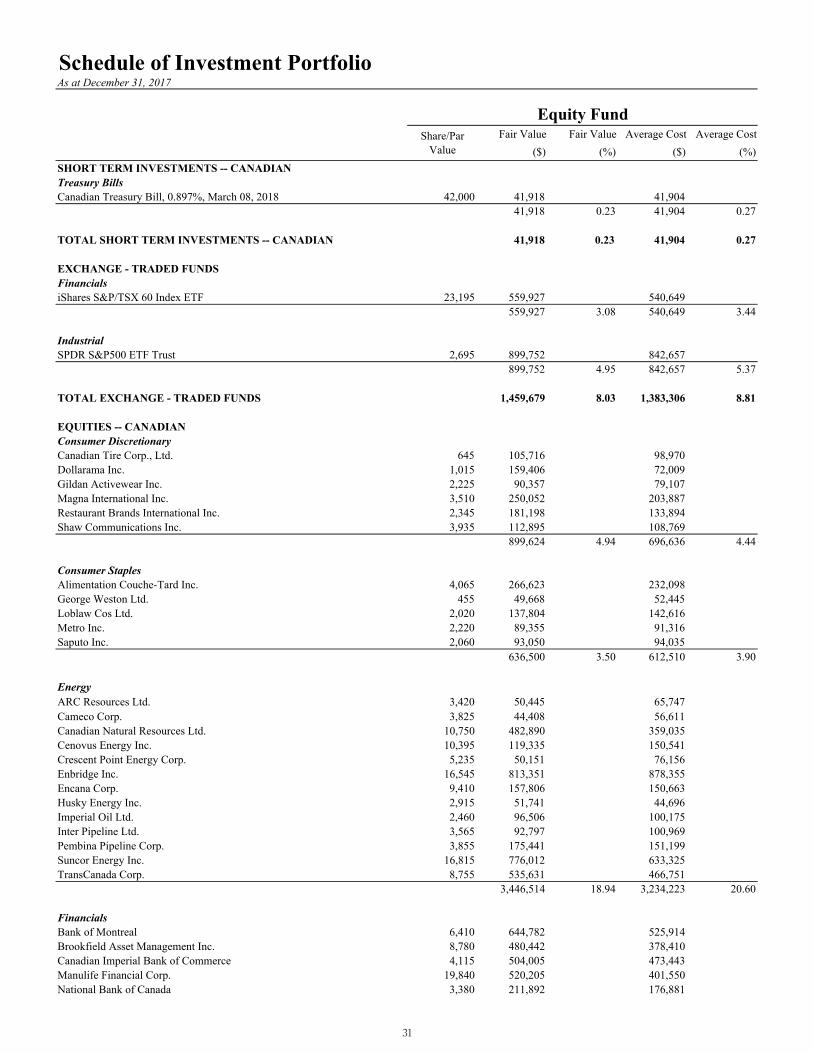
SHORT TERM INVESTMENTS -- CANADIANTreasury BillsCanadian Treasury Bill, 0.897%, March 08, 2018 42,000 41,918 41,904
41,918 0.23 41,904 0.27
TOTAL SHORT TERM INVESTMENTS -- CANADIAN 41,918 0.23 41,904 0.27
EXCHANGE - TRADED FUNDSFinancialsiShares S&P/TSX 60 Index ETF 23,195 559,927 540,649
559,927 3.08 540,649 3.44
IndustrialSPDR S&P500 ETF Trust 2,695 899,752 842,657
899,752 4.95 842,657 5.37
TOTAL EXCHANGE - TRADED FUNDS 1,459,679 8.03 1,383,306 8.81
EQUITIES -- CANADIANConsumer DiscretionaryCanadian Tire Corp., Ltd. 645 105,716 98,970 Dollarama Inc. 1,015 159,406 72,009 Gildan Activewear Inc. 2,225 90,357 79,107 Magna International Inc. 3,510 250,052 203,887 Restaurant Brands International Inc. 2,345 181,198 133,894 Shaw Communications Inc. 3,935 112,895 108,769
899,624 4.94 696,636 4.44
Consumer StaplesAlimentation Couche-Tard Inc. 4,065 266,623 232,098 George Weston Ltd. 455 49,668 52,445 Loblaw Cos Ltd. 2,020 137,804 142,616 Metro Inc. 2,220 89,355 91,316 Saputo Inc. 2,060 93,050 94,035
636,500 3.50 612,510 3.90
EnergyARC Resources Ltd. 3,420 50,445 65,747 Cameco Corp. 3,825 44,408 56,611 Canadian Natural Resources Ltd. 10,750 482,890 359,035 Cenovus Energy Inc. 10,395 119,335 150,541 Crescent Point Energy Corp. 5,235 50,151 76,156 Enbridge Inc. 16,545 813,351 878,355 Encana Corp. 9,410 157,806 150,663 Husky Energy Inc. 2,915 51,741 44,696 Imperial Oil Ltd. 2,460 96,506 100,175 Inter Pipeline Ltd. 3,565 92,797 100,969 Pembina Pipeline Corp. 3,855 175,441 151,199 Suncor Energy Inc. 16,815 776,012 633,325 TransCanada Corp. 8,755 535,631 466,751
3,446,514 18.94 3,234,223 20.60
FinancialsBank of Montreal 6,410 644,782 525,914 Brookfield Asset Management Inc. 8,780 480,442 378,410 Canadian Imperial Bank of Commerce 4,115 504,005 473,443 Manulife Financial Corp. 19,840 520,205 401,550 National Bank of Canada 3,380 211,892 176,881
Equity FundShare/Par
Value
31
Schedule of Investment Portfolio As at December 31, 2017
Fair Value Fair Value Average Cost Average Cost($) (%) ($) (%)
Equity FundShare/Par
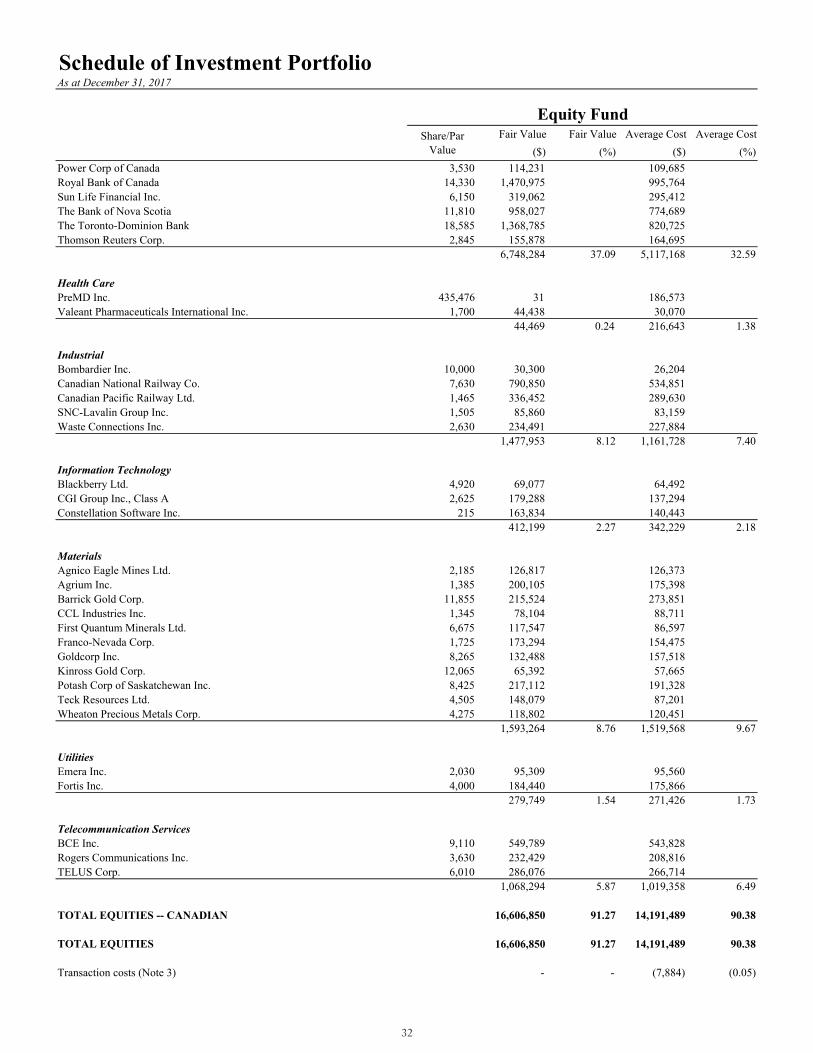
ValuePower Corp of Canada 3,530 114,231 109,685 Royal Bank of Canada 14,330 1,470,975 995,764 Sun Life Financial Inc. 6,150 319,062 295,412 The Bank of Nova Scotia 11,810 958,027 774,689 The Toronto-Dominion Bank 18,585 1,368,785 820,725 Thomson Reuters Corp. 2,845 155,878 164,695
6,748,284 37.09 5,117,168 32.59
Health CarePreMD Inc. 435,476 31 186,573 Valeant Pharmaceuticals International Inc. 1,700 44,438 30,070
44,469 0.24 216,643 1.38
IndustrialBombardier Inc. 10,000 30,300 26,204 Canadian National Railway Co. 7,630 790,850 534,851 Canadian Pacific Railway Ltd. 1,465 336,452 289,630 SNC-Lavalin Group Inc. 1,505 85,860 83,159 Waste Connections Inc. 2,630 234,491 227,884
1,477,953 8.12 1,161,728 7.40
Information TechnologyBlackberry Ltd. 4,920 69,077 64,492 CGI Group Inc., Class A 2,625 179,288 137,294 Constellation Software Inc. 215 163,834 140,443
412,199 2.27 342,229 2.18
MaterialsAgnico Eagle Mines Ltd. 2,185 126,817 126,373 Agrium Inc. 1,385 200,105 175,398 Barrick Gold Corp. 11,855 215,524 273,851 CCL Industries Inc. 1,345 78,104 88,711 First Quantum Minerals Ltd. 6,675 117,547 86,597 Franco-Nevada Corp. 1,725 173,294 154,475 Goldcorp Inc. 8,265 132,488 157,518 Kinross Gold Corp. 12,065 65,392 57,665 Potash Corp of Saskatchewan Inc. 8,425 217,112 191,328 Teck Resources Ltd. 4,505 148,079 87,201 Wheaton Precious Metals Corp. 4,275 118,802 120,451
1,593,264 8.76 1,519,568 9.67
UtilitiesEmera Inc. 2,030 95,309 95,560 Fortis Inc. 4,000 184,440 175,866
279,749 1.54 271,426 1.73
Telecommunication ServicesBCE Inc. 9,110 549,789 543,828 Rogers Communications Inc. 3,630 232,429 208,816 TELUS Corp. 6,010 286,076 266,714
1,068,294 5.87 1,019,358 6.49
TOTAL EQUITIES -- CANADIAN 16,606,850 91.27 14,191,489 90.38
TOTAL EQUITIES 16,606,850 91.27 14,191,489 90.38
Transaction costs (Note 3) - - (7,884) (0.05)
32
Schedule of Investment Portfolio As at December 31, 2017
Fair Value Fair Value Average Cost Average Cost($) (%) ($) (%)
Equity FundShare/Par
Value
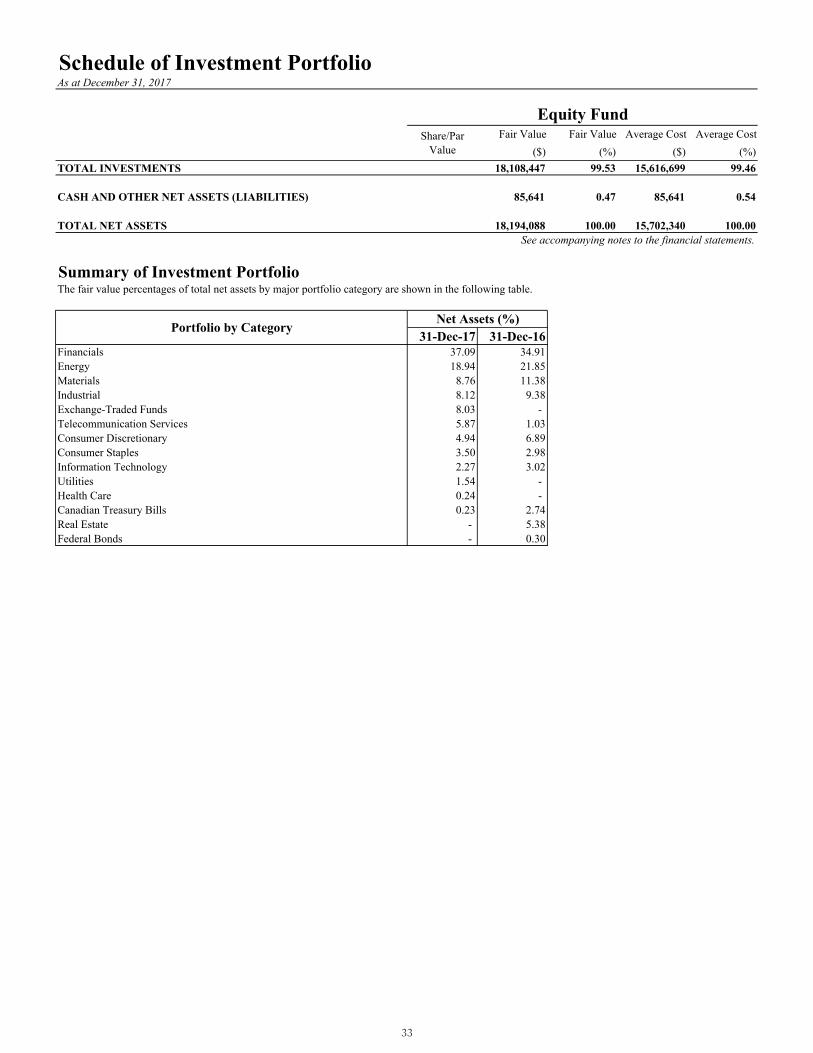
TOTAL INVESTMENTS 18,108,447 99.53 15,616,699 99.46
CASH AND OTHER NET ASSETS (LIABILITIES) 85,641 0.47 85,641 0.54
TOTAL NET ASSETS 18,194,088 100.00 15,702,340 100.00See accompanying notes to the financial statements.
Summary of Investment PortfolioThe fair value percentages of total net assets by major portfolio category are shown in the following table.
31-Dec-17 31-Dec-16Financials 37.09 34.91Energy 18.94 21.85Materials 8.76 11.38Industrial 8.12 9.38Exchange-Traded Funds 8.03 - Telecommunication Services 5.87 1.03Consumer Discretionary 4.94 6.89Consumer Staples 3.50 2.98Information Technology 2.27 3.02Utilities 1.54 - Health Care 0.24 - Canadian Treasury Bills 0.23 2.74Real Estate - 5.38Federal Bonds - 0.30
Portfolio by Category Net Assets (%)
33
Schedule of Investment Portfolio As at December 31, 2017
Fair Value Fair Value Average Cost Average Cost($) (%) ($) (%)
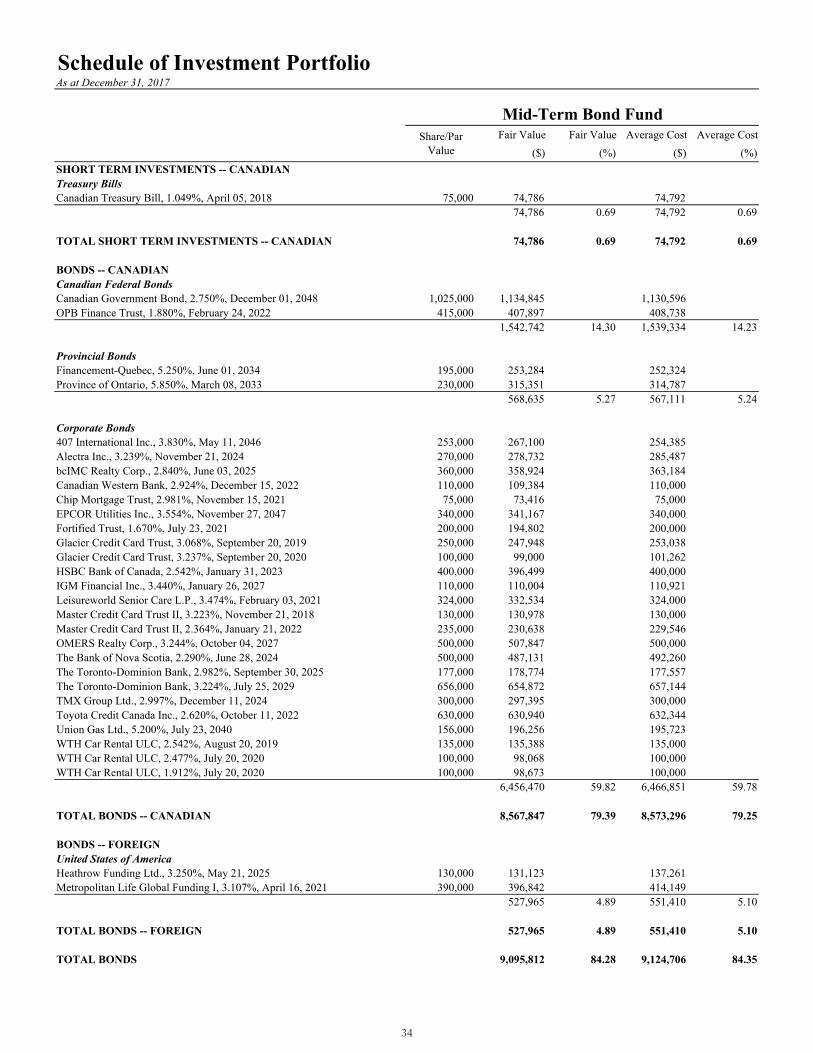
SHORT TERM INVESTMENTS -- CANADIANTreasury BillsCanadian Treasury Bill, 1.049%, April 05, 2018 75,000 74,786 74,792
74,786 0.69 74,792 0.69
TOTAL SHORT TERM INVESTMENTS -- CANADIAN 74,786 0.69 74,792 0.69
BONDS -- CANADIANCanadian Federal BondsCanadian Government Bond, 2.750%, December 01, 2048 1,025,000 1,134,845 1,130,596 OPB Finance Trust, 1.880%, February 24, 2022 415,000 407,897 408,738
1,542,742 14.30 1,539,334 14.23
Provincial BondsFinancement-Quebec, 5.250%, June 01, 2034 195,000 253,284 252,324 Province of Ontario, 5.850%, March 08, 2033 230,000 315,351 314,787
568,635 5.27 567,111 5.24
Corporate Bonds407 International Inc., 3.830%, May 11, 2046 253,000 267,100 254,385 Alectra Inc., 3.239%, November 21, 2024 270,000 278,732 285,487 bcIMC Realty Corp., 2.840%, June 03, 2025 360,000 358,924 363,184 Canadian Western Bank, 2.924%, December 15, 2022 110,000 109,384 110,000 Chip Mortgage Trust, 2.981%, November 15, 2021 75,000 73,416 75,000 EPCOR Utilities Inc., 3.554%, November 27, 2047 340,000 341,167 340,000 Fortified Trust, 1.670%, July 23, 2021 200,000 194,802 200,000 Glacier Credit Card Trust, 3.068%, September 20, 2019 250,000 247,948 253,038 Glacier Credit Card Trust, 3.237%, September 20, 2020 100,000 99,000 101,262 HSBC Bank of Canada, 2.542%, January 31, 2023 400,000 396,499 400,000 IGM Financial Inc., 3.440%, January 26, 2027 110,000 110,004 110,921 Leisureworld Senior Care L.P., 3.474%, February 03, 2021 324,000 332,534 324,000 Master Credit Card Trust II, 3.223%, November 21, 2018 130,000 130,978 130,000 Master Credit Card Trust II, 2.364%, January 21, 2022 235,000 230,638 229,546 OMERS Realty Corp., 3.244%, October 04, 2027 500,000 507,847 500,000 The Bank of Nova Scotia, 2.290%, June 28, 2024 500,000 487,131 492,260 The Toronto-Dominion Bank, 2.982%, September 30, 2025 177,000 178,774 177,557 The Toronto-Dominion Bank, 3.224%, July 25, 2029 656,000 654,872 657,144 TMX Group Ltd., 2.997%, December 11, 2024 300,000 297,395 300,000 Toyota Credit Canada Inc., 2.620%, October 11, 2022 630,000 630,940 632,344 Union Gas Ltd., 5.200%, July 23, 2040 156,000 196,256 195,723 WTH Car Rental ULC, 2.542%, August 20, 2019 135,000 135,388 135,000 WTH Car Rental ULC, 2.477%, July 20, 2020 100,000 98,068 100,000 WTH Car Rental ULC, 1.912%, July 20, 2020 100,000 98,673 100,000
6,456,470 59.82 6,466,851 59.78
TOTAL BONDS -- CANADIAN 8,567,847 79.39 8,573,296 79.25
BONDS -- FOREIGNUnited States of AmericaHeathrow Funding Ltd., 3.250%, May 21, 2025 130,000 131,123 137,261 Metropolitan Life Global Funding I, 3.107%, April 16, 2021 390,000 396,842 414,149
527,965 4.89 551,410 5.10
TOTAL BONDS -- FOREIGN 527,965 4.89 551,410 5.10
TOTAL BONDS 9,095,812 84.28 9,124,706 84.35
Share/Par Value
Mid-Term Bond Fund
34
Schedule of Investment Portfolio As at December 31, 2017
Fair Value Fair Value Average Cost Average Cost($) (%) ($) (%)
Share/Par Value
Mid-Term Bond Fund
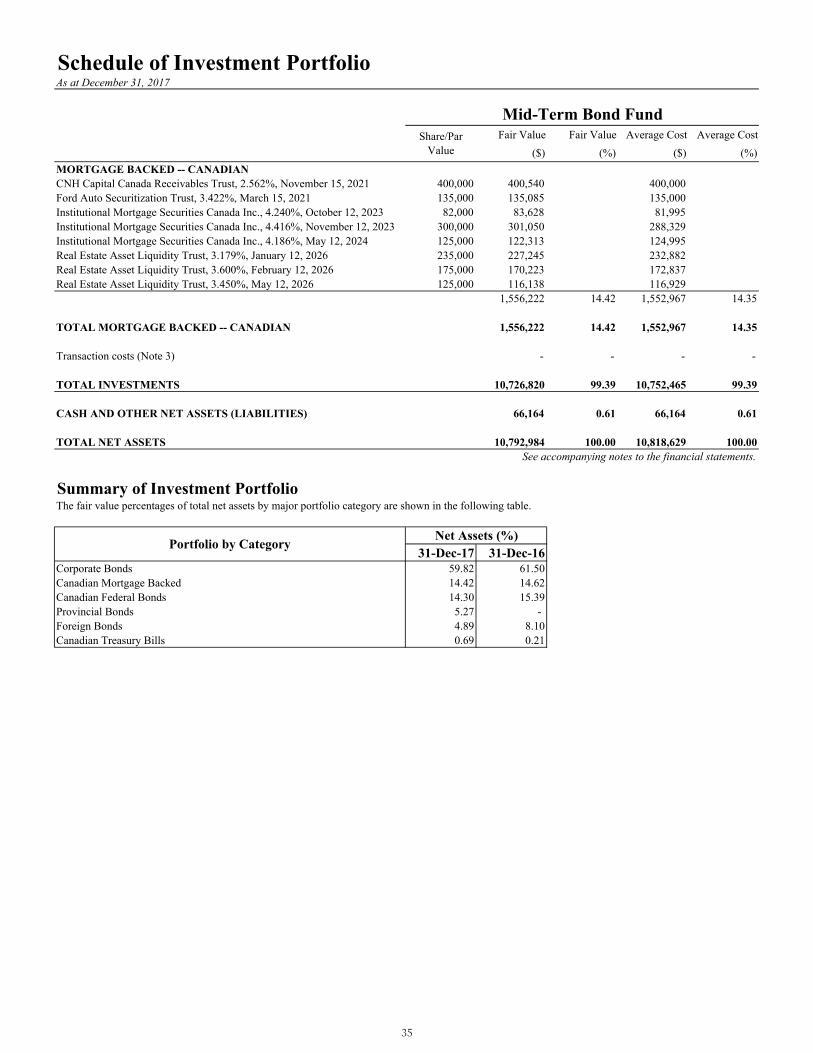
MORTGAGE BACKED -- CANADIAN CNH Capital Canada Receivables Trust, 2.562%, November 15, 2021 400,000 400,540 400,000 Ford Auto Securitization Trust, 3.422%, March 15, 2021 135,000 135,085 135,000 Institutional Mortgage Securities Canada Inc., 4.240%, October 12, 2023 82,000 83,628 81,995 Institutional Mortgage Securities Canada Inc., 4.416%, November 12, 2023 300,000 301,050 288,329 Institutional Mortgage Securities Canada Inc., 4.186%, May 12, 2024 125,000 122,313 124,995 Real Estate Asset Liquidity Trust, 3.179%, January 12, 2026 235,000 227,245 232,882 Real Estate Asset Liquidity Trust, 3.600%, February 12, 2026 175,000 170,223 172,837 Real Estate Asset Liquidity Trust, 3.450%, May 12, 2026 125,000 116,138 116,929
1,556,222 14.42 1,552,967 14.35
TOTAL MORTGAGE BACKED -- CANADIAN 1,556,222 14.42 1,552,967 14.35
Transaction costs (Note 3) - - - -
TOTAL INVESTMENTS 10,726,820 99.39 10,752,465 99.39
CASH AND OTHER NET ASSETS (LIABILITIES) 66,164 0.61 66,164 0.61
TOTAL NET ASSETS 10,792,984 100.00 10,818,629 100.00See accompanying notes to the financial statements.
Summary of Investment PortfolioThe fair value percentages of total net assets by major portfolio category are shown in the following table.
31-Dec-17 31-Dec-16Corporate Bonds 59.82 61.50Canadian Mortgage Backed 14.42 14.62Canadian Federal Bonds 14.30 15.39Provincial Bonds 5.27 - Foreign Bonds 4.89 8.10Canadian Treasury Bills 0.69 0.21
Portfolio by Category Net Assets (%)
35

Statements of Financial Position As at December 31
TCAA
2017 2016AssetsCurrent assets
Non-derivative financial assets at fair value through profit or loss $ 24,148,502 $ 24,776,111 Non-derivative financial assets pledged as collateral at fair value through profit or loss - - Cash and cash equivalents 3,404 15,616 Receivable for investments sold - 25,506 Interest receivable 72,633 79,182 Dividends receivable 34,659 26,038 Derivative assets - - Margin on futures contracts - - Other receivables 6,780 56
24,265,978 24,922,509
LiabilitiesCurrent liabilities
Payable for investments purchased - - Management fees payable 3,313 3,385 Derivative liabilities - - Margin on futures contracts - - Other payable and accrued expenses - 25,049
3,313 28,434
Net assets attributable to contractholders $ 24,262,665 $ 24,894,075
Net assets attributable to contractholders per classVIO $ 8,728,500 $ 8,707,413 VIO2 10,281,189 10,758,420 VIO3 5,252,976 5,428,242 VIO4 - -
Units outstandingVIO 429,967 441,798 VIO2 534,140 571,901 VIO3 267,578 283,380 VIO4 - -
Net assets attributable to contractholders per unit VIO $ 20.30 $ 19.71 VIO2 19.25 18.81 VIO3 19.63 19.16 VIO4 - -
See accompanying notes to the financial statements.
Asset Allocation Fund
36
Statements of Financial Position As at December 31
AssetsCurrent assets
Non-derivative financial assets at fair value through profit or lossNon-derivative financial assets pledged as collateral at fair value through profit or loss Cash and cash equivalentsReceivable for investments soldInterest receivableDividends receivableDerivative assetsMargin on futures contractsOther receivables
LiabilitiesCurrent liabilities
Payable for investments purchasedManagement fees payableDerivative liabilitiesMargin on futures contractsOther payable and accrued expenses
Net assets attributable to contractholders
Net assets attributable to contractholders per classVIOVIO2VIO3VIO4
Units outstandingVIOVIO2VIO3VIO4
Net assets attributable to contractholders per unit VIOVIO2VIO3VIO4
IBO
2017 2016
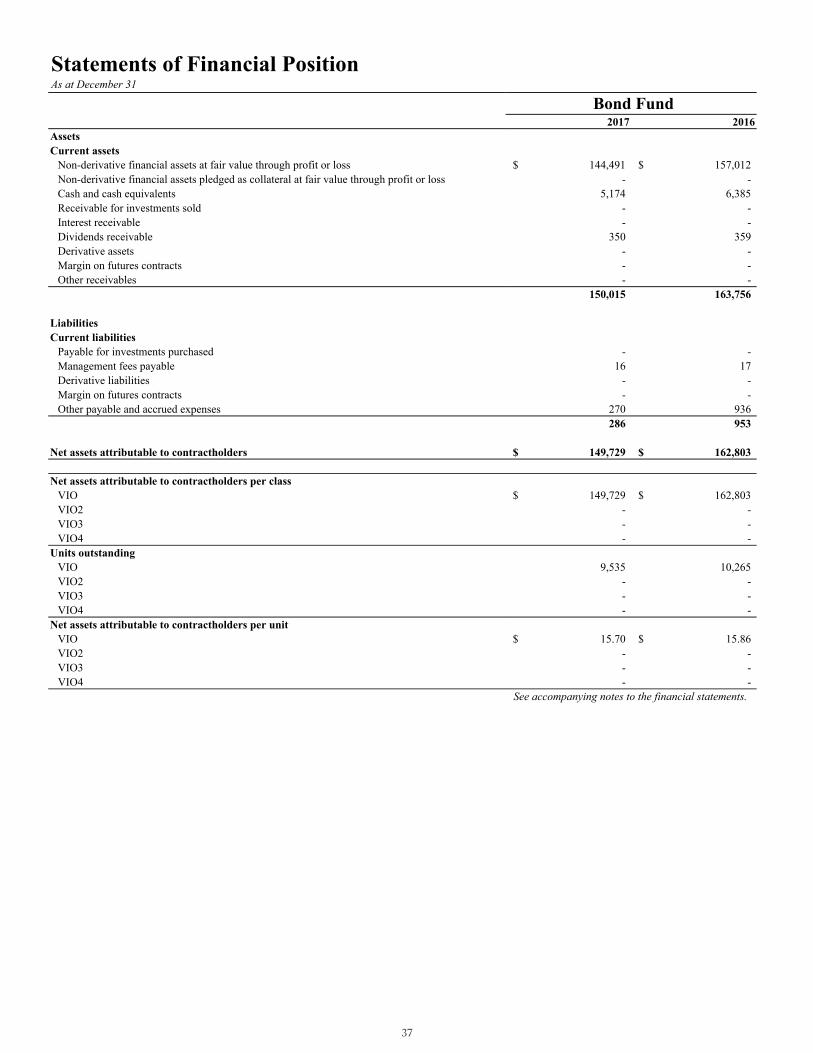
$ 144,491 $ 157,012 - -
5,174 6,385 - - - -
350 359 - - - - - -
150,015 163,756
- - 16 17
- - - -
270 936 286 953
$ 149,729 $ 162,803
$ 149,729 $ 162,803 - - - - - -
9,535 10,265 - - - - - -
$ 15.70 $ 15.86 - - - - - -
See accompanying notes to the financial statements.
Bond Fund
37

Statements of Financial Position As at December 31
AssetsCurrent assets
Non-derivative financial assets at fair value through profit or lossNon-derivative financial assets pledged as collateral at fair value through profit or loss Cash and cash equivalentsReceivable for investments soldInterest receivableDividends receivableDerivative assetsMargin on futures contractsOther receivables
LiabilitiesCurrent liabilities
Payable for investments purchasedManagement fees payableDerivative liabilitiesMargin on futures contractsOther payable and accrued expenses
Net assets attributable to contractholders
Net assets attributable to contractholders per classVIOVIO2VIO3VIO4
Units outstandingVIOVIO2VIO3VIO4
Net assets attributable to contractholders per unit VIOVIO2VIO3VIO4
COM
2017 2016
$ 113,063 $ 126,819 - -
1,326 3,096 - - - - - -
3,050 - - - - -
117,439 129,915
- - 16 18
- 1,277 - -
207 666 223 1,961
$ 117,216 $ 127,954
$ 117,216 $ 127,954 - - - - - -
9,864 9,809 - - - - - -
$ 11.88 $ 13.04 - - - - - -
See accompanying notes to the financial statements.
Canadian Communications Fund
38
Statements of Financial Position As at December 31
AssetsCurrent assets
Non-derivative financial assets at fair value through profit or lossNon-derivative financial assets pledged as collateral at fair value through profit or loss Cash and cash equivalentsReceivable for investments soldInterest receivableDividends receivableDerivative assetsMargin on futures contractsOther receivables
LiabilitiesCurrent liabilities
Payable for investments purchasedManagement fees payableDerivative liabilitiesMargin on futures contractsOther payable and accrued expenses
Net assets attributable to contractholders
Net assets attributable to contractholders per classVIOVIO2VIO3VIO4
Units outstandingVIOVIO2VIO3VIO4
Net assets attributable to contractholders per unit VIOVIO2VIO3VIO4
FIN
2017 2016
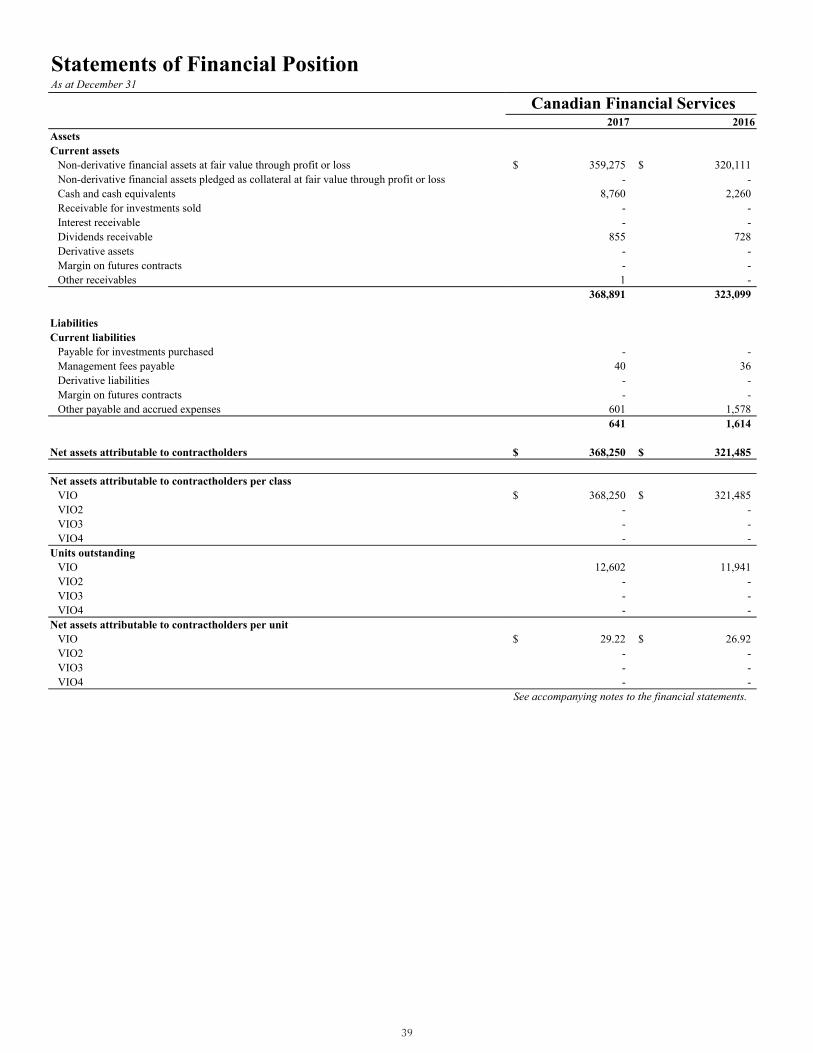
$ 359,275 $ 320,111 - -
8,760 2,260 - - - -
855 728 - - - - 1 -
368,891 323,099
- - 40 36
- - - -
601 1,578 641 1,614
$ 368,250 $ 321,485
$ 368,250 $ 321,485 - - - - - -
12,602 11,941 - - - - - -
$ 29.22 $ 26.92 - - - - - -
See accompanying notes to the financial statements.
Canadian Financial Services
39

Statements of Financial Position As at December 31
AssetsCurrent assets
Non-derivative financial assets at fair value through profit or lossNon-derivative financial assets pledged as collateral at fair value through profit or loss Cash and cash equivalentsReceivable for investments soldInterest receivableDividends receivableDerivative assetsMargin on futures contractsOther receivables
LiabilitiesCurrent liabilities
Payable for investments purchasedManagement fees payableDerivative liabilitiesMargin on futures contractsOther payable and accrued expenses
Net assets attributable to contractholders
Net assets attributable to contractholders per classVIOVIO2VIO3VIO4
Units outstandingVIOVIO2VIO3VIO4
Net assets attributable to contractholders per unit VIOVIO2VIO3VIO4
RES
2017 2016
$ 94,262 $ 106,000 - -
2,000 1,642 - - - -
109 238 - - - - - 1
96,371 107,881
- - 10 12
- - - -
165 550 175 562
$ 96,196 $ 107,319
$ 96,196 $ 107,319 - - - - - -
6,640 6,842 - - - - - -
$ 14.49 $ 15.69 - - - - - -
See accompanying notes to the financial statements.
Canadian Resources Fund
40

Statements of Financial Position As at December 31
AssetsCurrent assets
Non-derivative financial assets at fair value through profit or lossNon-derivative financial assets pledged as collateral at fair value through profit or loss Cash and cash equivalentsReceivable for investments soldInterest receivableDividends receivableDerivative assetsMargin on futures contractsOther receivables
LiabilitiesCurrent liabilities
Payable for investments purchasedManagement fees payableDerivative liabilitiesMargin on futures contractsOther payable and accrued expenses
Net assets attributable to contractholders
Net assets attributable to contractholders per classVIOVIO2VIO3VIO4
Units outstandingVIOVIO2VIO3VIO4
Net assets attributable to contractholders per unit VIOVIO2VIO3VIO4
GRO
2017 2016
$ 144,840 $ 158,480 - -
1,812 6,924 - - - - - - - - - - 1 1
146,653 165,405
- - 19 22
- - - -
246 828 265 850
$ 146,388 $ 164,555
$ 146,388 $ 164,555 - - - - - -
33,449 39,566 - - - - - -
$ 4.38 $ 4.16 - - - - - -
See accompanying notes to the financial statements.
Canadian Growth Fund
41

Statements of Financial Position As at December 31
AssetsCurrent assets
Non-derivative financial assets at fair value through profit or lossNon-derivative financial assets pledged as collateral at fair value through profit or loss Cash and cash equivalentsReceivable for investments soldInterest receivableDividends receivableDerivative assetsMargin on futures contractsOther receivables
LiabilitiesCurrent liabilities
Payable for investments purchasedManagement fees payableDerivative liabilitiesMargin on futures contractsOther payable and accrued expenses
Net assets attributable to contractholders
Net assets attributable to contractholders per classVIOVIO2VIO3VIO4
Units outstandingVIOVIO2VIO3VIO4
Net assets attributable to contractholders per unit VIOVIO2VIO3VIO4
CAP
2017 2016
$ 63,150 $ 69,512 - -
2,126 1,082 - - - -
154 224 - - - - - -
65,430 70,818
- - 7 8 - - - -
112 355 119 363
$ 65,311 $ 70,455
$ 65,311 $ 70,455 - - - - - -
2,826 3,029 - - - - - -
$ 23.11 $ 23.26 - - - - - -
See accompanying notes to the financial statements.
Canadian Small Cap Fund
42

Statements of Financial Position As at December 31
AssetsCurrent assets
Non-derivative financial assets at fair value through profit or lossNon-derivative financial assets pledged as collateral at fair value through profit or loss Cash and cash equivalentsReceivable for investments soldInterest receivableDividends receivableDerivative assetsMargin on futures contractsOther receivables
LiabilitiesCurrent liabilities
Payable for investments purchasedManagement fees payableDerivative liabilitiesMargin on futures contractsOther payable and accrued expenses
Net assets attributable to contractholders
Net assets attributable to contractholders per classVIOVIO2VIO3VIO4
Units outstandingVIOVIO2VIO3VIO4
Net assets attributable to contractholders per unit VIOVIO2VIO3VIO4
DIV
2017 2016
$ 5,335,321 $ 5,322,249 - -
13,665 13,167 - 1,962
7,328 7,436 11,257 13,178
- - - -
17 16 5,367,588 5,358,008
- - 722 722
- - - -
2,815 20,227 3,537 20,949
$ 5,364,051 $ 5,337,059
$ 3,102,936 $ 3,085,246 869,266 811,704
1,391,849 1,440,109 - -
160,503 168,118 41,420 41,275 74,452 80,740
- -
$ 19.33 $ 18.35 20.99 19.67 18.69 17.84
- - See accompanying notes to the financial statements.
Dividend Fund
43

Statements of Financial Position As at December 31
AssetsCurrent assets
Non-derivative financial assets at fair value through profit or lossNon-derivative financial assets pledged as collateral at fair value through profit or loss Cash and cash equivalentsReceivable for investments soldInterest receivableDividends receivableDerivative assetsMargin on futures contractsOther receivables
LiabilitiesCurrent liabilities
Payable for investments purchasedManagement fees payableDerivative liabilitiesMargin on futures contractsOther payable and accrued expenses
Net assets attributable to contractholders
Net assets attributable to contractholders per classVIOVIO2VIO3VIO4
Units outstandingVIOVIO2VIO3VIO4
Net assets attributable to contractholders per unit VIOVIO2VIO3VIO4
TBIL
2017 2016
$ 82,776 $ 55,928 - -
904 632 - - - - - - - - - - - -
83,680 56,560
- - 6 4 - - - -
99 308 105 312
$ 83,575 $ 56,248
$ 83,575 $ 56,248 - - - - - -
84,044 55,583 - - - - - -
$ 0.99 $ 1.01 - - - - - -
See accompanying notes to the financial statements.
T-Bill Fund
44

Statements of Financial Position As at December 31
AssetsCurrent assets
Non-derivative financial assets at fair value through profit or lossNon-derivative financial assets pledged as collateral at fair value through profit or loss Cash and cash equivalentsReceivable for investments soldInterest receivableDividends receivableDerivative assetsMargin on futures contractsOther receivables
LiabilitiesCurrent liabilities
Payable for investments purchasedManagement fees payableDerivative liabilitiesMargin on futures contractsOther payable and accrued expenses
Net assets attributable to contractholders
Net assets attributable to contractholders per classVIOVIO2VIO3VIO4
Units outstandingVIOVIO2VIO3VIO4
Net assets attributable to contractholders per unit VIOVIO2VIO3VIO4
TTSE
2017 2016
$ 12,447,880 $ 12,000,986 - -
16,114 10,656 - - - - - - - - - -
415 29 12,464,409 12,011,671
- - 1,520 1,475
- - - -
171 19,332 1,691 20,807
$ 12,462,718 $ 11,990,864
$ 3,732,891 $ 3,627,640 5,334,414 5,141,757 1,327,473 1,281,365 2,067,940 1,940,102
95,824 98,937 143,845 146,593 35,372 36,035 50,670 50,873
$ 38.96 $ 36.67 37.08 35.08 37.53 35.56 40.81 38.14
See accompanying notes to the financial statements.
Canadian-35 Index Fund
45
Statements of Financial Position As at December 31
AssetsCurrent assets
Non-derivative financial assets at fair value through profit or lossNon-derivative financial assets pledged as collateral at fair value through profit or loss Cash and cash equivalentsReceivable for investments soldInterest receivableDividends receivableDerivative assetsMargin on futures contractsOther receivables
LiabilitiesCurrent liabilities
Payable for investments purchasedManagement fees payableDerivative liabilitiesMargin on futures contractsOther payable and accrued expenses
Net assets attributable to contractholders
Net assets attributable to contractholders per classVIOVIO2VIO3VIO4
Units outstandingVIOVIO2VIO3VIO4
Net assets attributable to contractholders per unit VIOVIO2VIO3VIO4
AMF
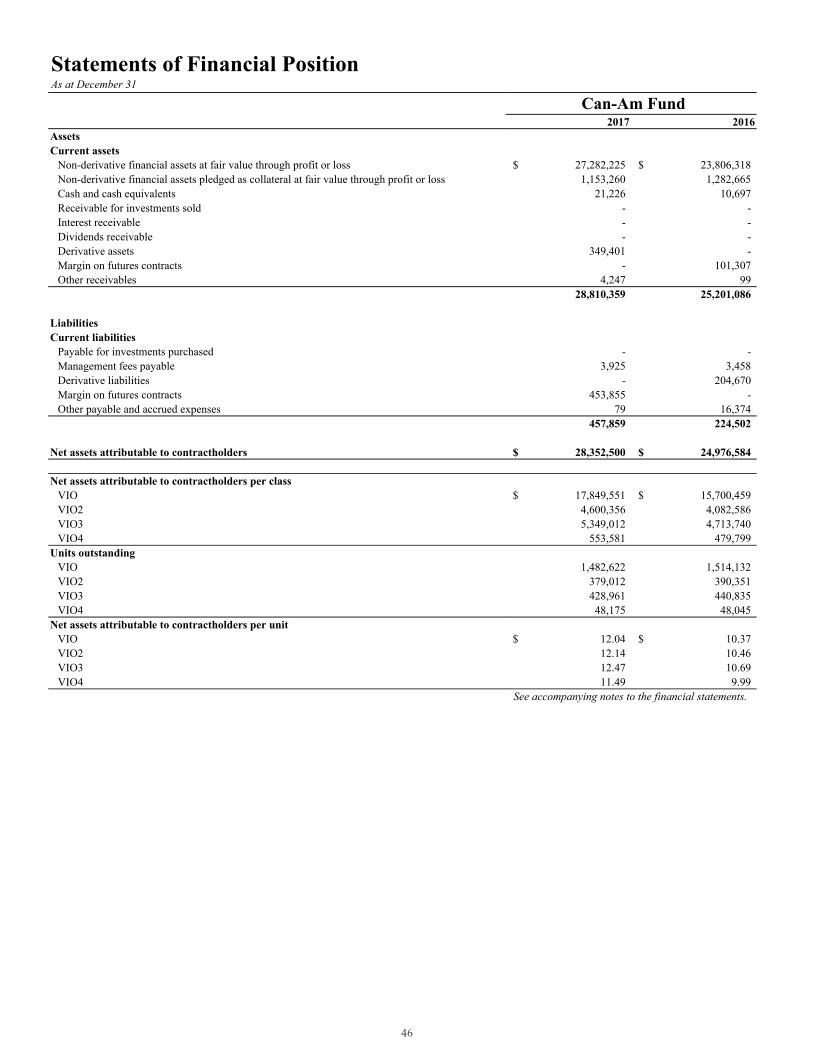
2017 2016
$ 27,282,225 $ 23,806,318 1,153,260 1,282,665
21,226 10,697 - - - - - -
349,401 - - 101,307
4,247 99 28,810,359 25,201,086
- - 3,925 3,458
- 204,670 453,855 -
79 16,374 457,859 224,502
$ 28,352,500 $ 24,976,584
$ 17,849,551 $ 15,700,459 4,600,356 4,082,586 5,349,012 4,713,740
553,581 479,799
1,482,622 1,514,132 379,012 390,351 428,961 440,835 48,175 48,045
$ 12.04 $ 10.37 12.14 10.46 12.47 10.69 11.49 9.99
See accompanying notes to the financial statements.
Can-Am Fund
46

Statements of Financial Position As at December 31
AssetsCurrent assets
Non-derivative financial assets at fair value through profit or lossNon-derivative financial assets pledged as collateral at fair value through profit or loss Cash and cash equivalentsReceivable for investments soldInterest receivableDividends receivableDerivative assetsMargin on futures contractsOther receivables
LiabilitiesCurrent liabilities
Payable for investments purchasedManagement fees payableDerivative liabilitiesMargin on futures contractsOther payable and accrued expenses
Net assets attributable to contractholders
Net assets attributable to contractholders per classVIOVIO2VIO3VIO4
Units outstandingVIOVIO2VIO3VIO4
Net assets attributable to contractholders per unit VIOVIO2VIO3VIO4
ASF
2017 2016
$ 14,375,810 $ 11,481,665 911,834 866,012 32,462 15,483
- - - - - -
175,977 297,112 - -
73 59 15,496,156 12,660,331
- - 2,052 1,660
- - 185,717 245,844
867 11,090 188,636 258,594
$ 15,307,520 $ 12,401,737
$ 12,302,700 $ 9,941,718 2,505,346 2,054,318
360,491 297,797 138,983 107,904
1,391,323 1,421,088 285,827 295,053 39,824 41,691 16,725 16,229
$ 8.84 $ 7.00 8.77 6.96 9.05 7.14 8.31 6.65
See accompanying notes to the financial statements.
Can-Asian Fund
47
Statements of Financial Position As at December 31
AssetsCurrent assets
Non-derivative financial assets at fair value through profit or lossNon-derivative financial assets pledged as collateral at fair value through profit or loss Cash and cash equivalentsReceivable for investments soldInterest receivableDividends receivableDerivative assetsMargin on futures contractsOther receivables
LiabilitiesCurrent liabilities
Payable for investments purchasedManagement fees payableDerivative liabilitiesMargin on futures contractsOther payable and accrued expenses
Net assets attributable to contractholders
Net assets attributable to contractholders per classVIOVIO2VIO3VIO4
Units outstandingVIOVIO2VIO3VIO4
Net assets attributable to contractholders per unit VIOVIO2VIO3VIO4
DAQ
2017 2016
$ 10,170,786 $ 8,398,297 461,903 426,513 17,587 10,536
- - - - - -
78,253 - - -
1,952 40 10,730,481 8,835,386
- - 1,515 1,252
- 52,715 142,136 47,882
5 14,691 143,656 116,540
$ 10,586,825 $ 8,718,846
$ 9,370,475 $ 7,705,972 740,032 597,298 476,318 415,576
- -
777,768 809,206 59,165 60,748 41,387 45,315
- -
$ 12.05 $ 9.52 12.51 9.83 11.51 9.17
- - See accompanying notes to the financial statements.
Can-Daq 100 Fund
48
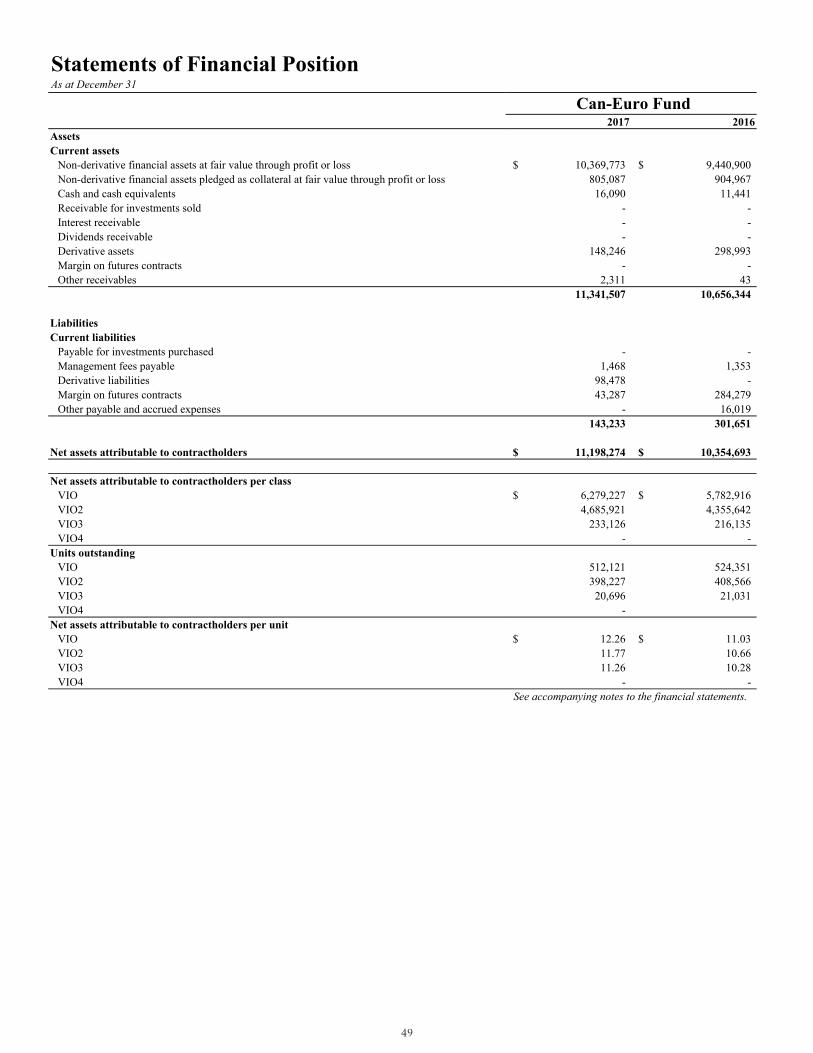
Statements of Financial Position As at December 31
AssetsCurrent assets
Non-derivative financial assets at fair value through profit or lossNon-derivative financial assets pledged as collateral at fair value through profit or loss Cash and cash equivalentsReceivable for investments soldInterest receivableDividends receivableDerivative assetsMargin on futures contractsOther receivables
LiabilitiesCurrent liabilities
Payable for investments purchasedManagement fees payableDerivative liabilitiesMargin on futures contractsOther payable and accrued expenses
Net assets attributable to contractholders
Net assets attributable to contractholders per classVIOVIO2VIO3VIO4
Units outstandingVIOVIO2VIO3VIO4
Net assets attributable to contractholders per unit VIOVIO2VIO3VIO4
EUR
2017 2016
$ 10,369,773 $ 9,440,900 805,087 904,967 16,090 11,441
- - - - - -
148,246 298,993 - -
2,311 43 11,341,507 10,656,344
- - 1,468 1,353
98,478 - 43,287 284,279
- 16,019 143,233 301,651
$ 11,198,274 $ 10,354,693
$ 6,279,227 $ 5,782,916 4,685,921 4,355,642
233,126 216,135 - -
512,121 524,351 398,227 408,566 20,696 21,031
-
$ 12.26 $ 11.03 11.77 10.66 11.26 10.28
- - See accompanying notes to the financial statements.
Can-Euro Fund
49
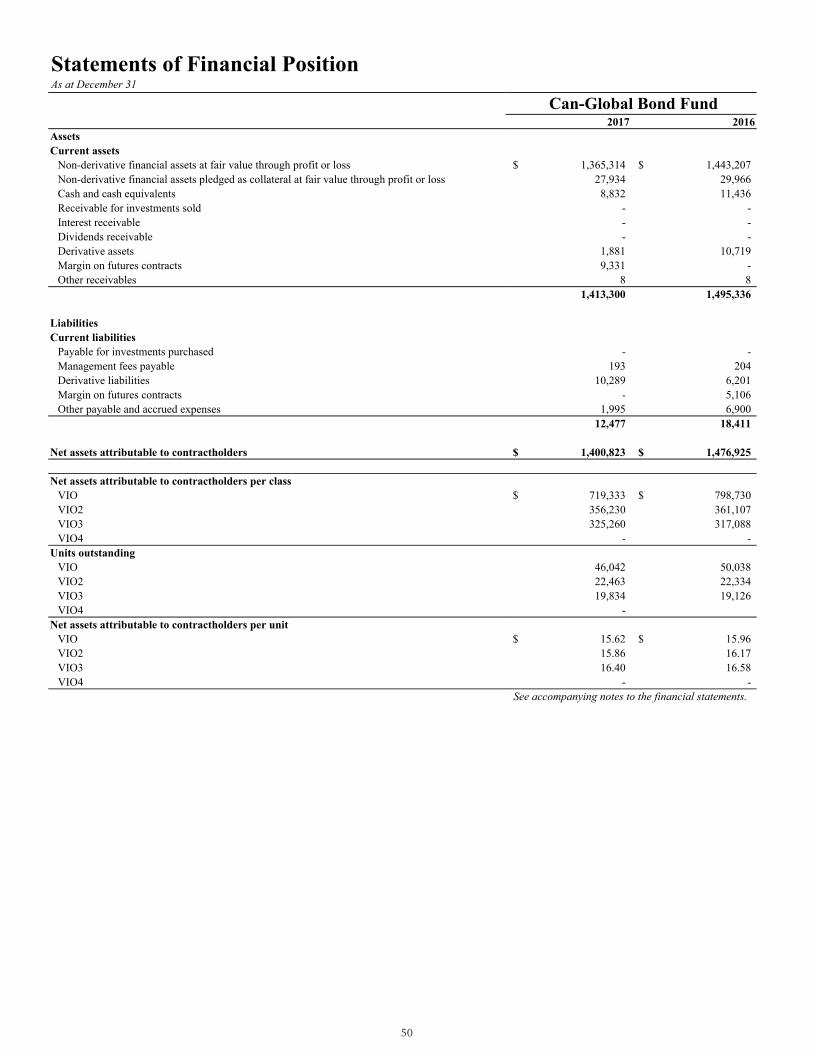
Statements of Financial Position As at December 31
AssetsCurrent assets
Non-derivative financial assets at fair value through profit or lossNon-derivative financial assets pledged as collateral at fair value through profit or loss Cash and cash equivalentsReceivable for investments soldInterest receivableDividends receivableDerivative assetsMargin on futures contractsOther receivables
LiabilitiesCurrent liabilities
Payable for investments purchasedManagement fees payableDerivative liabilitiesMargin on futures contractsOther payable and accrued expenses
Net assets attributable to contractholders
Net assets attributable to contractholders per classVIOVIO2VIO3VIO4
Units outstandingVIOVIO2VIO3VIO4
Net assets attributable to contractholders per unit VIOVIO2VIO3VIO4
GBO
2017 2016
$ 1,365,314 $ 1,443,207 27,934 29,966 8,832 11,436
- - - - - -
1,881 10,719 9,331 -
8 8 1,413,300 1,495,336
- - 193 204
10,289 6,201 - 5,106
1,995 6,900 12,477 18,411
$ 1,400,823 $ 1,476,925
$ 719,333 $ 798,730 356,230 361,107 325,260 317,088
- -
46,042 50,038 22,463 22,334 19,834 19,126
-
$ 15.62 $ 15.96 15.86 16.17 16.40 16.58
- - See accompanying notes to the financial statements.
Can-Global Bond Fund
50

Statements of Financial Position As at December 31
AssetsCurrent assets
Non-derivative financial assets at fair value through profit or lossNon-derivative financial assets pledged as collateral at fair value through profit or loss Cash and cash equivalentsReceivable for investments soldInterest receivableDividends receivableDerivative assetsMargin on futures contractsOther receivables
LiabilitiesCurrent liabilities
Payable for investments purchasedManagement fees payableDerivative liabilitiesMargin on futures contractsOther payable and accrued expenses
Net assets attributable to contractholders
Net assets attributable to contractholders per classVIOVIO2VIO3VIO4
Units outstandingVIOVIO2VIO3VIO4
Net assets attributable to contractholders per unit VIOVIO2VIO3VIO4
AAA
2017 2016
$ 126,876 $ 113,797 - -
840 2,289 - - - -
245 218 - - - - 1 -
127,962 116,304
- - 17 16
- - - -
203 623 220 639
$ 127,742 $ 115,665
$ 127,742 $ 115,665 - - - - - -
6,402 6,619 - - - - - -
$ 19.95 $ 17.47 - - - - - -
See accompanying notes to the financial statements.
American Asset Allocation Fund
51

Statements of Financial Position As at December 31
AssetsCurrent assets
Non-derivative financial assets at fair value through profit or lossNon-derivative financial assets pledged as collateral at fair value through profit or loss Cash and cash equivalentsReceivable for investments soldInterest receivableDividends receivableDerivative assetsMargin on futures contractsOther receivables
LiabilitiesCurrent liabilities
Payable for investments purchasedManagement fees payableDerivative liabilitiesMargin on futures contractsOther payable and accrued expenses
Net assets attributable to contractholders
Net assets attributable to contractholders per classVIOVIO2VIO3VIO4
Units outstandingVIOVIO2VIO3VIO4
Net assets attributable to contractholders per unit VIOVIO2VIO3VIO4
AEI
2017 2016
$ 138,552 $ 121,303 - -
1,192 870 - - - -
597 613 - - - - - -
140,341 122,786
- - 20 17
- - - -
233 866 253 883
$ 140,088 $ 121,903
$ 140,088 $ 121,903 - - - - - -
8,594 8,116 - - - - - -
$ 16.30 $ 15.02 - - - - - -
See accompanying notes to the financial statements.
American Equity Index Fund
52

Statements of Financial Position As at December 31
AssetsCurrent assets
Non-derivative financial assets at fair value through profit or lossNon-derivative financial assets pledged as collateral at fair value through profit or loss Cash and cash equivalentsReceivable for investments soldInterest receivableDividends receivableDerivative assetsMargin on futures contractsOther receivables
LiabilitiesCurrent liabilities
Payable for investments purchasedManagement fees payableDerivative liabilitiesMargin on futures contractsOther payable and accrued expenses
Net assets attributable to contractholders
Net assets attributable to contractholders per classVIOVIO2VIO3VIO4
Units outstandingVIOVIO2VIO3VIO4
Net assets attributable to contractholders per unit VIOVIO2VIO3VIO4
EMR
2017 2016
$ 1,399,742 $ 1,285,339 - -
18,814 19,620 - - - - - - - - - - 6 5
1,418,562 1,304,964
- - 147 138
- - - -
2,365 7,026 2,512 7,164
$ 1,416,050 $ 1,297,800
$ 1,355,753 $ 1,250,648 60,297 47,152
- - - -
154,733 176,650 6,560 6,411
- - - -
$ 8.76 $ 7.08 9.19 7.35
- - - -
See accompanying notes to the financial statements.
Can-Emerge Fund
53
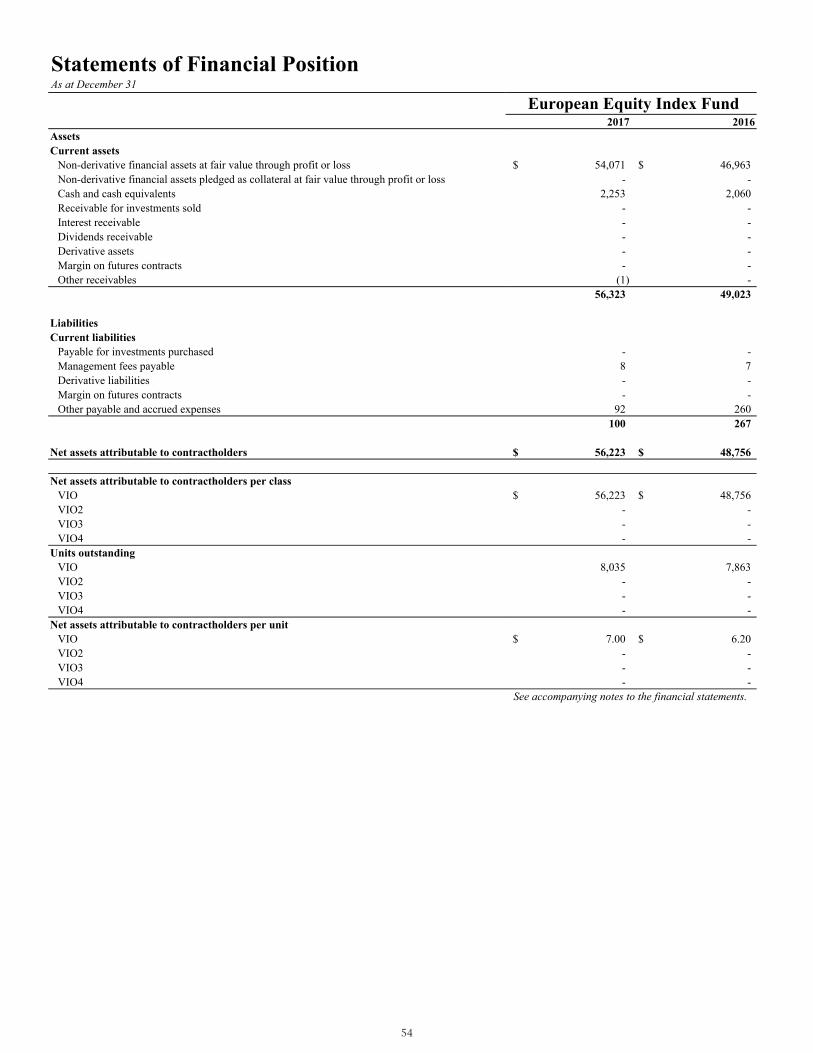
Statements of Financial Position As at December 31
AssetsCurrent assets
Non-derivative financial assets at fair value through profit or lossNon-derivative financial assets pledged as collateral at fair value through profit or loss Cash and cash equivalentsReceivable for investments soldInterest receivableDividends receivableDerivative assetsMargin on futures contractsOther receivables
LiabilitiesCurrent liabilities
Payable for investments purchasedManagement fees payableDerivative liabilitiesMargin on futures contractsOther payable and accrued expenses
Net assets attributable to contractholders
Net assets attributable to contractholders per classVIOVIO2VIO3VIO4
Units outstandingVIOVIO2VIO3VIO4
Net assets attributable to contractholders per unit VIOVIO2VIO3VIO4
EEI
2017 2016
$ 54,071 $ 46,963 - -
2,253 2,060 - - - - - - - - - -
(1) - 56,323 49,023
- - 8 7 - - - -
92 260 100 267
$ 56,223 $ 48,756
$ 56,223 $ 48,756 - - - - - -
8,035 7,863 - - - - - -
$ 7.00 $ 6.20 - - - - - -
See accompanying notes to the financial statements.
European Equity Index Fund
54

Statements of Financial Position As at December 31
AssetsCurrent assets
Non-derivative financial assets at fair value through profit or lossNon-derivative financial assets pledged as collateral at fair value through profit or loss Cash and cash equivalentsReceivable for investments soldInterest receivableDividends receivableDerivative assetsMargin on futures contractsOther receivables
LiabilitiesCurrent liabilities
Payable for investments purchasedManagement fees payableDerivative liabilitiesMargin on futures contractsOther payable and accrued expenses
Net assets attributable to contractholders
Net assets attributable to contractholders per classVIOVIO2VIO3VIO4
Units outstandingVIOVIO2VIO3VIO4
Net assets attributable to contractholders per unit VIOVIO2VIO3VIO4
IBI
2017 2016
$ 102,577 $ 131,897 - -
2,259 4,368 - - - - - - - - - - 1 2
104,837 136,267
- - 12 17
- - - -
180 769 192 786
$ 104,645 $ 135,481
$ 104,645 $ 135,481 - - - - - -
11,395 14,766 - - - - - -
$ 9.18 $ 9.18 - - - - - -
See accompanying notes to the financial statements.
International Bond Index Fund
55

Statements of Financial Position As at December 31
AssetsCurrent assets
Non-derivative financial assets at fair value through profit or lossNon-derivative financial assets pledged as collateral at fair value through profit or loss Cash and cash equivalentsReceivable for investments soldInterest receivableDividends receivableDerivative assetsMargin on futures contractsOther receivables
LiabilitiesCurrent liabilities
Payable for investments purchasedManagement fees payableDerivative liabilitiesMargin on futures contractsOther payable and accrued expenses
Net assets attributable to contractholders
Net assets attributable to contractholders per classVIOVIO2VIO3VIO4
Units outstandingVIOVIO2VIO3VIO4
Net assets attributable to contractholders per unit VIOVIO2VIO3VIO4
ITF
2017 2016
$ 231,855 $ 194,973 - -
6,891 7,438 - - - - - - - - - - 1 1
238,747 202,412
- - 37 31
- - - -
391 1,032 428 1,063
$ 238,319 $ 201,349
$ 238,319 $ 201,349 - - - - - -
32,922 33,233 - - - - - -
$ 7.24 $ 6.06 - - - - - -
See accompanying notes to the financial statements.
Information Technology Fund
56

Statements of Financial Position As at December 31
AssetsCurrent assets
Non-derivative financial assets at fair value through profit or lossNon-derivative financial assets pledged as collateral at fair value through profit or loss Cash and cash equivalentsReceivable for investments soldInterest receivableDividends receivableDerivative assetsMargin on futures contractsOther receivables
LiabilitiesCurrent liabilities
Payable for investments purchasedManagement fees payableDerivative liabilitiesMargin on futures contractsOther payable and accrued expenses
Net assets attributable to contractholders
Net assets attributable to contractholders per classVIOVIO2VIO3VIO4
Units outstandingVIOVIO2VIO3VIO4
Net assets attributable to contractholders per unit VIOVIO2VIO3VIO4
BRN
2017 2016
$ 30,715 $ 27,555 - -
318 933 - - - -
132 139 - - - - - -
31,165 28,627
- - 5 4 - - - -
52 139 57 143
$ 31,108 $ 28,484
$ 31,108 $ 28,484 - - - - - -
2,830 2,808 - - - - - -
$ 10.99 $ 10.14 - - - - - -
See accompanying notes to the financial statements.
International Brands Fund
57

Statements of Financial Position As at December 31
AssetsCurrent assets
Non-derivative financial assets at fair value through profit or lossNon-derivative financial assets pledged as collateral at fair value through profit or loss Cash and cash equivalentsReceivable for investments soldInterest receivableDividends receivableDerivative assetsMargin on futures contractsOther receivables
LiabilitiesCurrent liabilities
Payable for investments purchasedManagement fees payableDerivative liabilitiesMargin on futures contractsOther payable and accrued expenses
Net assets attributable to contractholders
Net assets attributable to contractholders per classVIOVIO2VIO3VIO4
Units outstandingVIOVIO2VIO3VIO4
Net assets attributable to contractholders per unit VIOVIO2VIO3VIO4
ULE
2017 2016
$ 18,108,447 $ 18,040,189 - -
32,364 12,125 - - - -
47,663 34,530 - - - -
8,374 80 18,196,848 18,086,924
- - 2,760 2,711
- - - - - 18,911
2,760 21,622
$ 18,194,088 $ 18,065,302
$ 15,845,602 $ 15,788,401 2,348,486 2,276,901
- - - -
792,926 827,396 111,076 113,590
- - - -
$ 19.98 $ 19.08 21.14 20.04
- - - -
See accompanying notes to the financial statements.
Equity Fund
58
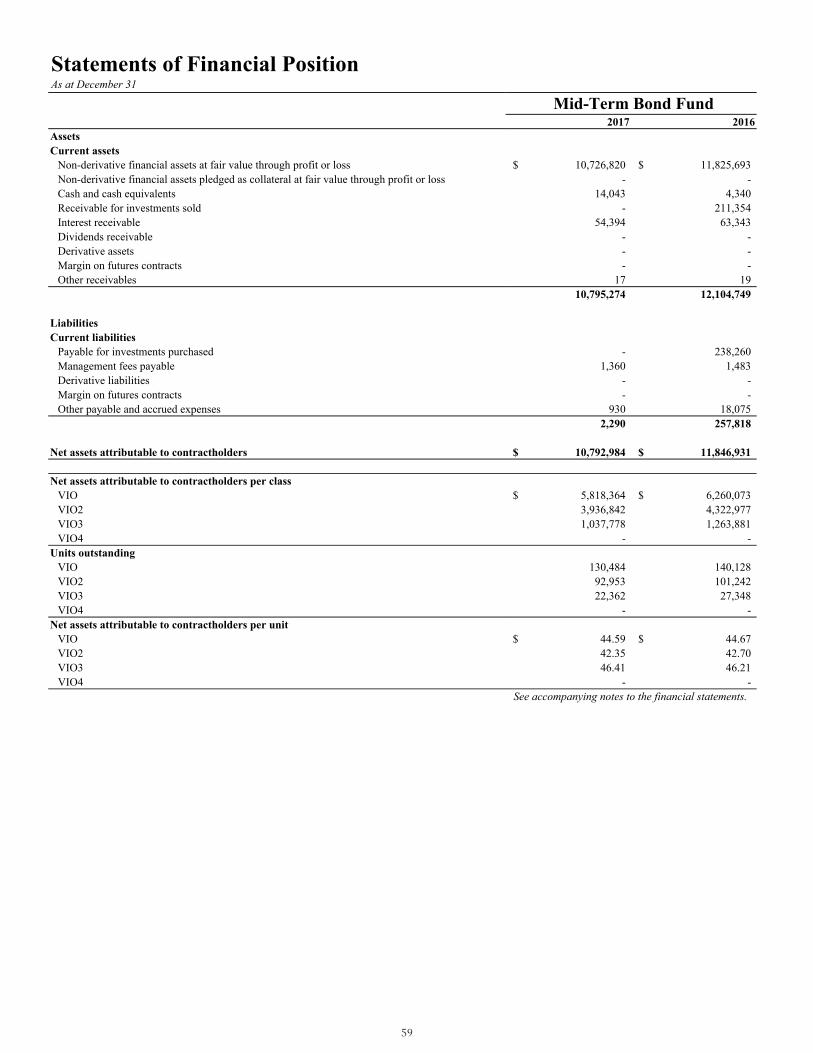
Statements of Financial Position As at December 31
AssetsCurrent assets
Non-derivative financial assets at fair value through profit or lossNon-derivative financial assets pledged as collateral at fair value through profit or loss Cash and cash equivalentsReceivable for investments soldInterest receivableDividends receivableDerivative assetsMargin on futures contractsOther receivables
LiabilitiesCurrent liabilities
Payable for investments purchasedManagement fees payableDerivative liabilitiesMargin on futures contractsOther payable and accrued expenses
Net assets attributable to contractholders
Net assets attributable to contractholders per classVIOVIO2VIO3VIO4
Units outstandingVIOVIO2VIO3VIO4
Net assets attributable to contractholders per unit VIOVIO2VIO3VIO4
ULB
2017 2016
$ 10,726,820 $ 11,825,693 - -
14,043 4,340 - 211,354
54,394 63,343 - - - - - -
17 19 10,795,274 12,104,749
- 238,260 1,360 1,483
- - - -
930 18,075 2,290 257,818
$ 10,792,984 $ 11,846,931
$ 5,818,364 $ 6,260,073 3,936,842 4,322,977 1,037,778 1,263,881
- -
130,484 140,128 92,953 101,242 22,362 27,348
- -
$ 44.59 $ 44.67 42.35 42.70 46.41 46.21
- - See accompanying notes to the financial statements.
Mid-Term Bond Fund
59
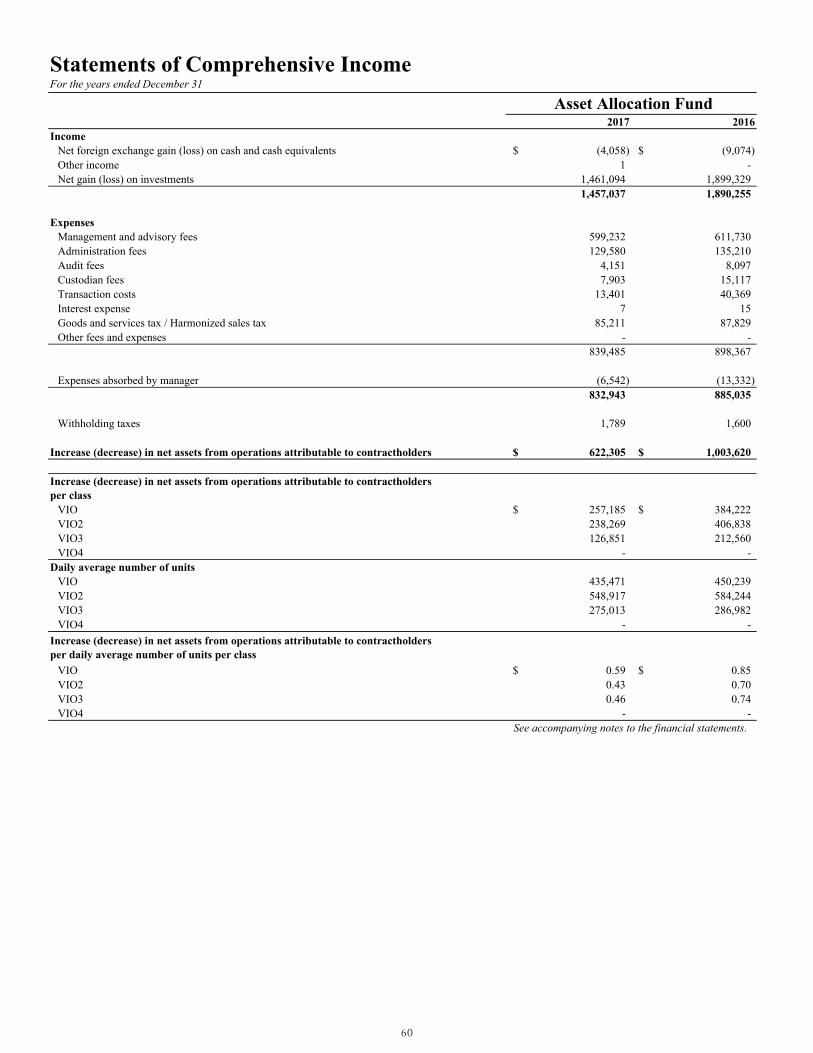
Statements of Comprehensive IncomeFor the years ended December 31
TCAA
2017 2016Income
Net foreign exchange gain (loss) on cash and cash equivalents $ (4,058) $ (9,074) Other income 1 - Net gain (loss) on investments 1,461,094 1,899,329
1,457,037 1,890,255
Expenses Management and advisory fees 599,232 611,730 Administration fees 129,580 135,210 Audit fees 4,151 8,097 Custodian fees 7,903 15,117 Transaction costs 13,401 40,369 Interest expense 7 15 Goods and services tax / Harmonized sales tax 85,211 87,829 Other fees and expenses - -
839,485 898,367
Expenses absorbed by manager (6,542) (13,332) 832,943 885,035
Withholding taxes 1,789 1,600
Increase (decrease) in net assets from operations attributable to contractholders $ 622,305 $ 1,003,620
Increase (decrease) in net assets from operations attributable to contractholders per class
VIO $ 257,185 $ 384,222 VIO2 238,269 406,838 VIO3 126,851 212,560 VIO4 - -
Daily average number of unitsVIO 435,471 450,239 VIO2 548,917 584,244 VIO3 275,013 286,982 VIO4 - -
Increase (decrease) in net assets from operations attributable to contractholders per daily average number of units per class
VIO $ 0.59 $ 0.85 VIO2 0.43 0.70 VIO3 0.46 0.74 VIO4 - -
See accompanying notes to the financial statements.
Asset Allocation Fund
60
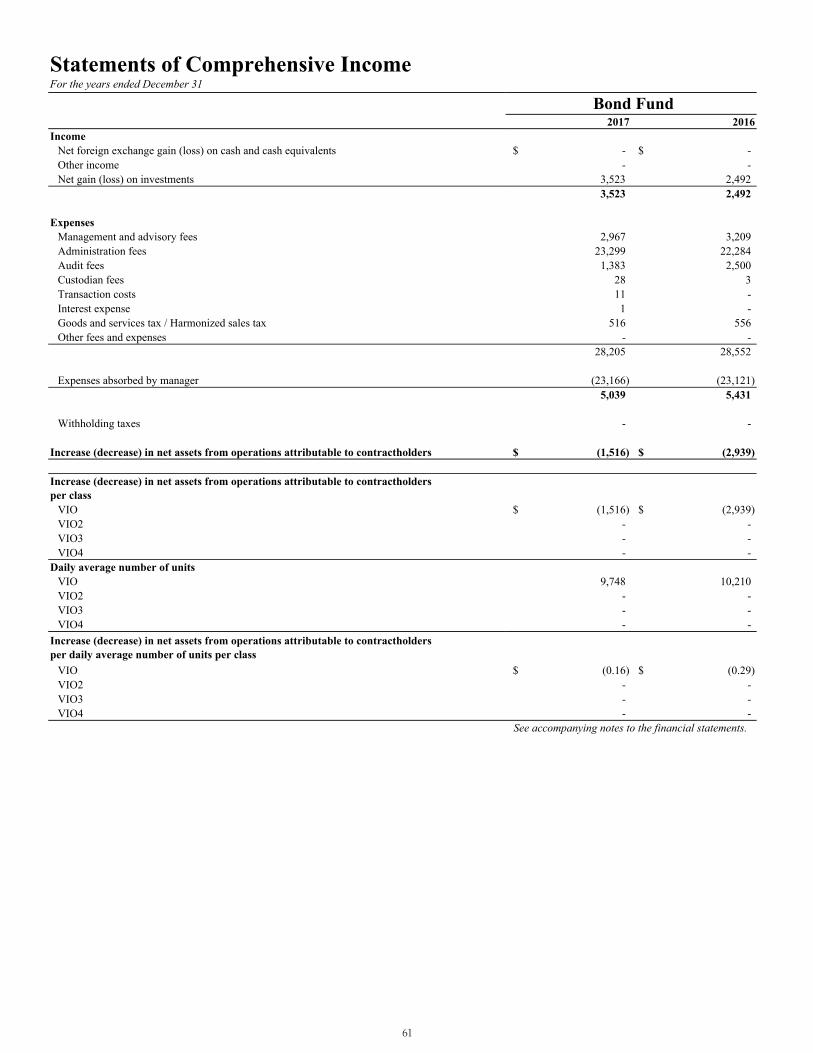
Statements of Comprehensive IncomeFor the years ended December 31
IncomeNet foreign exchange gain (loss) on cash and cash equivalentsOther incomeNet gain (loss) on investments
Expenses Management and advisory feesAdministration feesAudit feesCustodian feesTransaction costs Interest expenseGoods and services tax / Harmonized sales taxOther fees and expenses
Expenses absorbed by manager
Withholding taxes
Increase (decrease) in net assets from operations attributable to contractholders
Increase (decrease) in net assets from operations attributable to contractholders per class
VIOVIO2VIO3VIO4
Daily average number of unitsVIOVIO2VIO3VIO4
Increase (decrease) in net assets from operations attributable to contractholders per daily average number of units per class
VIOVIO2VIO3VIO4
IBO
2017 2016
$ - $ - - -
3,523 2,492 3,523 2,492
2,967 3,209 23,299 22,284 1,383 2,500
28 3 11 - 1 -
516 556 - -
28,205 28,552
(23,166) (23,121) 5,039 5,431
- -
$ (1,516) $ (2,939)
$ (1,516) $ (2,939) - - - - - -
9,748 10,210 - - - - - -
$ (0.16) $ (0.29) - - - - - -
See accompanying notes to the financial statements.
Bond Fund
61
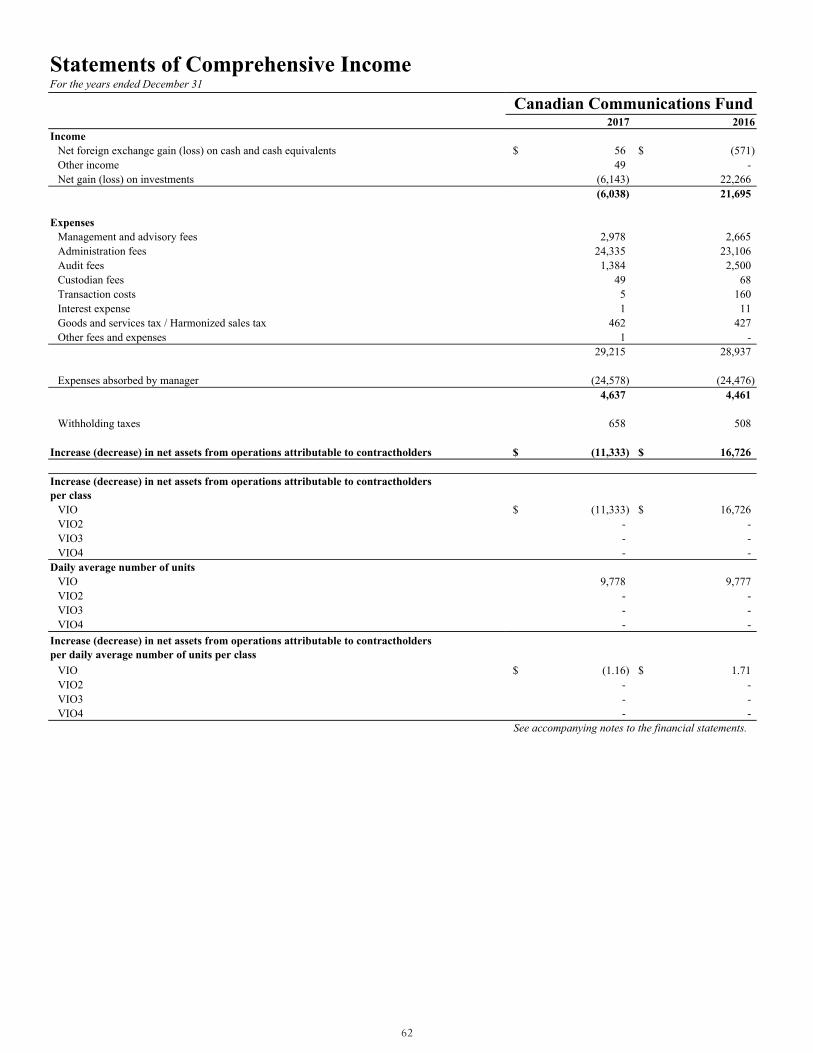
Statements of Comprehensive IncomeFor the years ended December 31
IncomeNet foreign exchange gain (loss) on cash and cash equivalentsOther incomeNet gain (loss) on investments
Expenses Management and advisory feesAdministration feesAudit feesCustodian feesTransaction costs Interest expenseGoods and services tax / Harmonized sales taxOther fees and expenses
Expenses absorbed by manager
Withholding taxes
Increase (decrease) in net assets from operations attributable to contractholders
Increase (decrease) in net assets from operations attributable to contractholders per class
VIOVIO2VIO3VIO4
Daily average number of unitsVIOVIO2VIO3VIO4
Increase (decrease) in net assets from operations attributable to contractholders per daily average number of units per class
VIOVIO2VIO3VIO4
COM
2017 2016
$ 56 $ (571) 49 -
(6,143) 22,266 (6,038) 21,695
2,978 2,665 24,335 23,106 1,384 2,500
49 68 5 160 1 11
462 427 1 -
29,215 28,937
(24,578) (24,476) 4,637 4,461
658 508
$ (11,333) $ 16,726
$ (11,333) $ 16,726 - - - - - -
9,778 9,777 - - - - - -
$ (1.16) $ 1.71 - - - - - -
See accompanying notes to the financial statements.
Canadian Communications Fund
62

Statements of Comprehensive IncomeFor the years ended December 31
IncomeNet foreign exchange gain (loss) on cash and cash equivalentsOther incomeNet gain (loss) on investments
Expenses Management and advisory feesAdministration feesAudit feesCustodian feesTransaction costs Interest expenseGoods and services tax / Harmonized sales taxOther fees and expenses
Expenses absorbed by manager
Withholding taxes
Increase (decrease) in net assets from operations attributable to contractholders
Increase (decrease) in net assets from operations attributable to contractholders per class
VIOVIO2VIO3VIO4
Daily average number of unitsVIOVIO2VIO3VIO4
Increase (decrease) in net assets from operations attributable to contractholders per daily average number of units per class
VIOVIO2VIO3VIO4
FIN
2017 2016
$ - $ - - -
40,511 60,418 40,511 60,418
6,803 5,558 24,200 22,876 1,383 2,500
41 127 20 60
- 13 1,225 1,003
- - 33,672 32,137
(22,207) (22,726) 11,465 9,411
- -
$ 29,046 $ 51,007
$ 29,046 $ 51,007 - - - - - -
12,372 11,704 - - - - - -
$ 2.35 $ 4.36 - - - - - -
See accompanying notes to the financial statements.
Canadian Financial Services
63
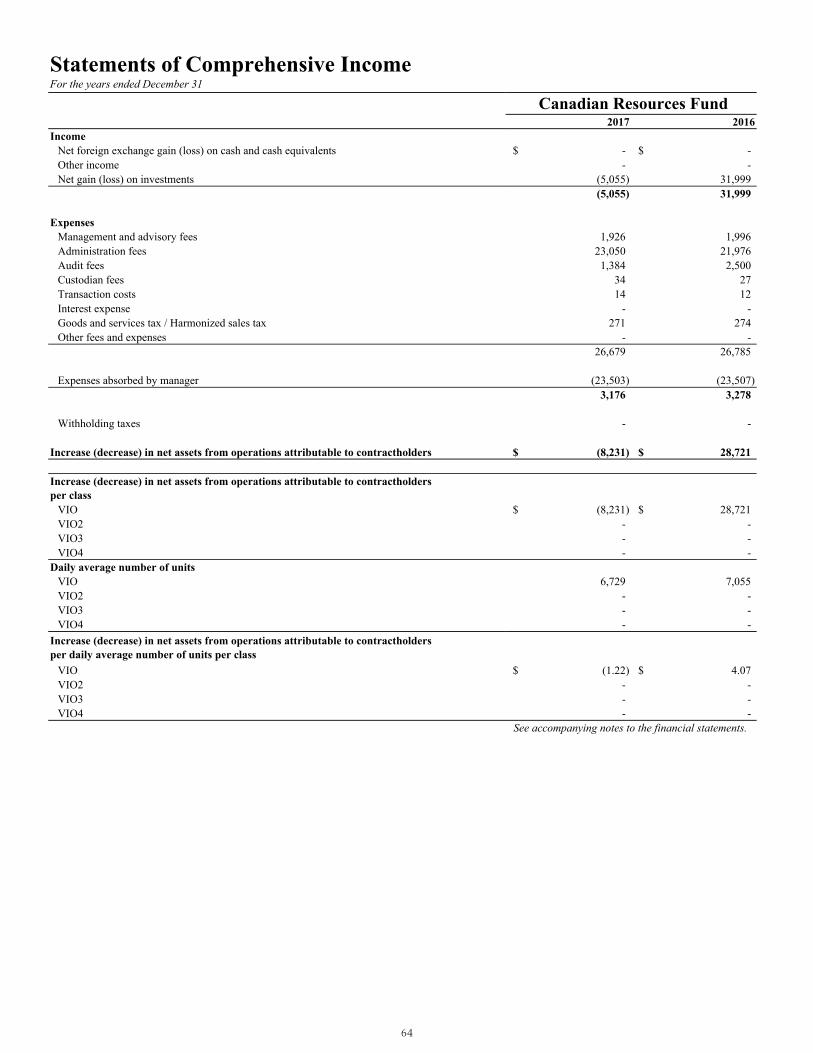
Statements of Comprehensive IncomeFor the years ended December 31
IncomeNet foreign exchange gain (loss) on cash and cash equivalentsOther incomeNet gain (loss) on investments
Expenses Management and advisory feesAdministration feesAudit feesCustodian feesTransaction costs Interest expenseGoods and services tax / Harmonized sales taxOther fees and expenses
Expenses absorbed by manager
Withholding taxes
Increase (decrease) in net assets from operations attributable to contractholders
Increase (decrease) in net assets from operations attributable to contractholders per class
VIOVIO2VIO3VIO4
Daily average number of unitsVIOVIO2VIO3VIO4
Increase (decrease) in net assets from operations attributable to contractholders per daily average number of units per class
VIOVIO2VIO3VIO4
RES
2017 2016
$ - $ - - -
(5,055) 31,999 (5,055) 31,999
1,926 1,996 23,050 21,976 1,384 2,500
34 27 14 12
- - 271 274
- - 26,679 26,785
(23,503) (23,507) 3,176 3,278
- -
$ (8,231) $ 28,721
$ (8,231) $ 28,721 - - - - - -
6,729 7,055 - - - - - -
$ (1.22) $ 4.07 - - - - - -
See accompanying notes to the financial statements.
Canadian Resources Fund
64

Statements of Comprehensive IncomeFor the years ended December 31
IncomeNet foreign exchange gain (loss) on cash and cash equivalentsOther incomeNet gain (loss) on investments
Expenses Management and advisory feesAdministration feesAudit feesCustodian feesTransaction costs Interest expenseGoods and services tax / Harmonized sales taxOther fees and expenses
Expenses absorbed by manager
Withholding taxes
Increase (decrease) in net assets from operations attributable to contractholders
Increase (decrease) in net assets from operations attributable to contractholders per class
VIOVIO2VIO3VIO4
Daily average number of unitsVIOVIO2VIO3VIO4
Increase (decrease) in net assets from operations attributable to contractholders per daily average number of units per class
VIOVIO2VIO3VIO4
GRO
2017 2016
$ - $ - - -
13,444 28,126 13,444 28,126
3,461 3,621 23,251 22,204 1,383 2,500
12 4 30 - 4 -
469 489 - -
28,610 28,818
(23,216) (23,213) 5,394 5,605
- -
$ 8,050 $ 22,521
$ 8,050 $ 22,521 - - - - - -
33,957 39,037 - - - - - -
$ 0.24 $ 0.58 - - - - - -
See accompanying notes to the financial statements.
Canadian Growth Fund
65

Statements of Comprehensive IncomeFor the years ended December 31
IncomeNet foreign exchange gain (loss) on cash and cash equivalentsOther incomeNet gain (loss) on investments
Expenses Management and advisory feesAdministration feesAudit feesCustodian feesTransaction costs Interest expenseGoods and services tax / Harmonized sales taxOther fees and expenses
Expenses absorbed by manager
Withholding taxes
Increase (decrease) in net assets from operations attributable to contractholders
Increase (decrease) in net assets from operations attributable to contractholders per class
VIOVIO2VIO3VIO4
Daily average number of unitsVIOVIO2VIO3VIO4
Increase (decrease) in net assets from operations attributable to contractholders per daily average number of units per class
VIOVIO2VIO3VIO4
CAP
2017 2016
$ - $ - - -
1,546 19,561 1,546 19,561
1,313 1,274 22,917 21,812 1,384 2,500
32 8 29 2 1 -
174 198 - -
25,850 25,794
(23,677) (23,683) 2,173 2,111
- -
$ (627) $ 17,450
$ (627) $ 17,450 - - - - - -
2,908 3,051 - - - - - -
$ (0.22) $ 5.72 - - - - - -
See accompanying notes to the financial statements.
Canadian Small Cap Fund
66

Statements of Comprehensive IncomeFor the years ended December 31
IncomeNet foreign exchange gain (loss) on cash and cash equivalentsOther incomeNet gain (loss) on investments
Expenses Management and advisory feesAdministration feesAudit feesCustodian feesTransaction costs Interest expenseGoods and services tax / Harmonized sales taxOther fees and expenses
Expenses absorbed by manager
Withholding taxes
Increase (decrease) in net assets from operations attributable to contractholders
Increase (decrease) in net assets from operations attributable to contractholders per class
VIOVIO2VIO3VIO4
Daily average number of unitsVIOVIO2VIO3VIO4
Increase (decrease) in net assets from operations attributable to contractholders per daily average number of units per class
VIOVIO2VIO3VIO4
DIV
2017 2016
$ 439 $ (2,356) - 12
476,863 607,786 477,302 605,442
130,177 127,076 48,242 45,260 4,151 8,097 4,670 4,372 1,557 5,459
6 3 19,690 19,146
- - 208,493 209,413
(12,590) (13,887) 195,903 195,526
736 1,183
$ 280,663 $ 408,733
$ 159,609 $ 231,715 54,794 71,346 66,260 105,672
- -
165,192 171,773 41,662 42,286 77,094 83,602
- -
$ 0.97 $ 1.35 1.32 1.69 0.86 1.26
- - See accompanying notes to the financial statements.
Dividend Fund
67

Statements of Comprehensive IncomeFor the years ended December 31
IncomeNet foreign exchange gain (loss) on cash and cash equivalentsOther incomeNet gain (loss) on investments
Expenses Management and advisory feesAdministration feesAudit feesCustodian feesTransaction costs Interest expenseGoods and services tax / Harmonized sales taxOther fees and expenses
Expenses absorbed by manager
Withholding taxes
Increase (decrease) in net assets from operations attributable to contractholders
Increase (decrease) in net assets from operations attributable to contractholders per class
VIOVIO2VIO3VIO4
Daily average number of unitsVIOVIO2VIO3VIO4
Increase (decrease) in net assets from operations attributable to contractholders per daily average number of units per class
VIOVIO2VIO3VIO4
TBIL
2017 2016
$ - $ - - -
365 288 365 288
711 704 22,881 21,578 1,384 2,699
585 610 - - - -
112 113 - -
25,673 25,704
(24,281) (24,324) 1,392 1,380
- -
$ (1,027) $ (1,092)
$ (1,027) $ (1,092) - - - - - -
56,846 55,099 - - - - - -
$ (0.02) $ (0.02) - - - - - -
See accompanying notes to the financial statements.
T-Bill Fund
68
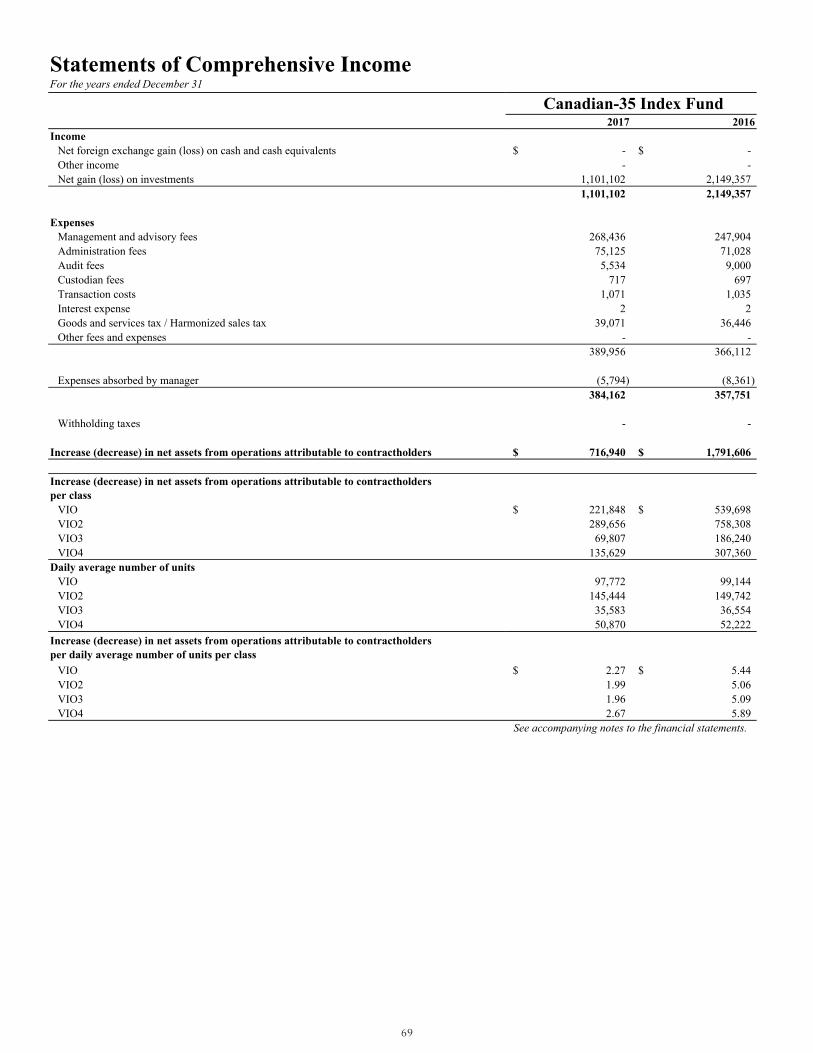
Statements of Comprehensive IncomeFor the years ended December 31
IncomeNet foreign exchange gain (loss) on cash and cash equivalentsOther incomeNet gain (loss) on investments
Expenses Management and advisory feesAdministration feesAudit feesCustodian feesTransaction costs Interest expenseGoods and services tax / Harmonized sales taxOther fees and expenses
Expenses absorbed by manager
Withholding taxes
Increase (decrease) in net assets from operations attributable to contractholders
Increase (decrease) in net assets from operations attributable to contractholders per class
VIOVIO2VIO3VIO4
Daily average number of unitsVIOVIO2VIO3VIO4
Increase (decrease) in net assets from operations attributable to contractholders per daily average number of units per class
VIOVIO2VIO3VIO4
TTSE
2017 2016
$ - $ - - -
1,101,102 2,149,357 1,101,102 2,149,357
268,436 247,904 75,125 71,028 5,534 9,000
717 697 1,071 1,035
2 2 39,071 36,446
- - 389,956 366,112
(5,794) (8,361) 384,162 357,751
- -
$ 716,940 $ 1,791,606
$ 221,848 $ 539,698 289,656 758,308 69,807 186,240
135,629 307,360
97,772 99,144 145,444 149,742 35,583 36,554 50,870 52,222
$ 2.27 $ 5.44 1.99 5.06 1.96 5.09 2.67 5.89
See accompanying notes to the financial statements.
Canadian-35 Index Fund
69
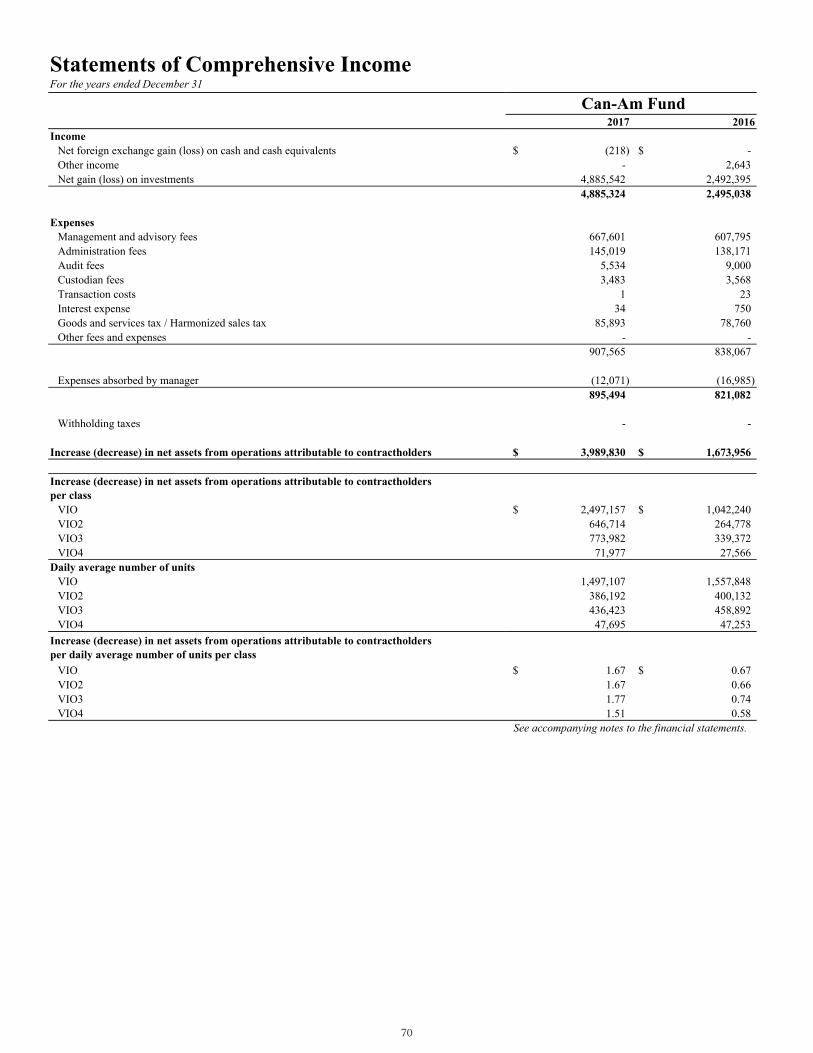
Statements of Comprehensive IncomeFor the years ended December 31
IncomeNet foreign exchange gain (loss) on cash and cash equivalentsOther incomeNet gain (loss) on investments
Expenses Management and advisory feesAdministration feesAudit feesCustodian feesTransaction costs Interest expenseGoods and services tax / Harmonized sales taxOther fees and expenses
Expenses absorbed by manager
Withholding taxes
Increase (decrease) in net assets from operations attributable to contractholders
Increase (decrease) in net assets from operations attributable to contractholders per class
VIOVIO2VIO3VIO4
Daily average number of unitsVIOVIO2VIO3VIO4
Increase (decrease) in net assets from operations attributable to contractholders per daily average number of units per class
VIOVIO2VIO3VIO4
AMF
2017 2016
$ (218) $ - - 2,643
4,885,542 2,492,395 4,885,324 2,495,038
667,601 607,795 145,019 138,171
5,534 9,000 3,483 3,568
1 23 34 750
85,893 78,760 - -
907,565 838,067
(12,071) (16,985) 895,494 821,082
- -
$ 3,989,830 $ 1,673,956
$ 2,497,157 $ 1,042,240 646,714 264,778 773,982 339,372 71,977 27,566
1,497,107 1,557,848 386,192 400,132 436,423 458,892 47,695 47,253
$ 1.67 $ 0.67 1.67 0.66 1.77 0.74 1.51 0.58
See accompanying notes to the financial statements.
Can-Am Fund
70

Statements of Comprehensive IncomeFor the years ended December 31
IncomeNet foreign exchange gain (loss) on cash and cash equivalentsOther incomeNet gain (loss) on investments
Expenses Management and advisory feesAdministration feesAudit feesCustodian feesTransaction costs Interest expenseGoods and services tax / Harmonized sales taxOther fees and expenses
Expenses absorbed by manager
Withholding taxes
Increase (decrease) in net assets from operations attributable to contractholders
Increase (decrease) in net assets from operations attributable to contractholders per class
VIOVIO2VIO3VIO4
Daily average number of unitsVIOVIO2VIO3VIO4
Increase (decrease) in net assets from operations attributable to contractholders per daily average number of units per class
VIOVIO2VIO3VIO4
ASF
2017 2016
$ - $ - - -
3,675,035 166,498 3,675,035 166,498
333,913 287,114 89,003 82,345 5,534 9,000 3,061 3,202
1 8 68 613
41,342 35,711 - -
472,922 417,993
(21,060) (26,897) 451,862 391,096
- -
$ 3,223,173 $ (224,598)
$ 2,594,117 $ (164,352) 523,316 (53,503) 78,222 (3,971) 27,518 (2,772)
1,407,499 1,443,487 290,857 299,752 41,035 41,467 16,530 16,690
$ 1.84 $ (0.11) 1.80 (0.18) 1.91 (0.10) 1.66 (0.17)
See accompanying notes to the financial statements.
Can-Asian Fund
71

Statements of Comprehensive IncomeFor the years ended December 31
IncomeNet foreign exchange gain (loss) on cash and cash equivalentsOther incomeNet gain (loss) on investments
Expenses Management and advisory feesAdministration feesAudit feesCustodian feesTransaction costs Interest expenseGoods and services tax / Harmonized sales taxOther fees and expenses
Expenses absorbed by manager
Withholding taxes
Increase (decrease) in net assets from operations attributable to contractholders
Increase (decrease) in net assets from operations attributable to contractholders per class
VIOVIO2VIO3VIO4
Daily average number of unitsVIOVIO2VIO3VIO4
Increase (decrease) in net assets from operations attributable to contractholders per daily average number of units per class
VIOVIO2VIO3VIO4
DAQ
2017 2016
$ 1 $ - - -
2,614,044 476,828 2,614,045 476,828
254,686 220,595 74,882 68,201 4,151 7,500 2,603 2,891
- 8 18 237
32,421 28,434 1 -
368,762 327,866
(20,638) (23,344) 348,124 304,522
- -
$ 2,265,921 $ 172,306
$ 2,000,945 $ 151,335 161,629 14,996 103,347 5,975
- -
789,232 834,317 60,137 60,856 43,577 45,054
- -
$ 2.54 $ 0.18 2.69 0.25 2.37 0.13
- - See accompanying notes to the financial statements.
Can-Daq 100 Fund
72

Statements of Comprehensive IncomeFor the years ended December 31
IncomeNet foreign exchange gain (loss) on cash and cash equivalentsOther incomeNet gain (loss) on investments
Expenses Management and advisory feesAdministration feesAudit feesCustodian feesTransaction costs Interest expenseGoods and services tax / Harmonized sales taxOther fees and expenses
Expenses absorbed by manager
Withholding taxes
Increase (decrease) in net assets from operations attributable to contractholders
Increase (decrease) in net assets from operations attributable to contractholders per class
VIOVIO2VIO3VIO4
Daily average number of unitsVIOVIO2VIO3VIO4
Increase (decrease) in net assets from operations attributable to contractholders per daily average number of units per class
VIOVIO2VIO3VIO4
EUR
2017 2016
$ - $ - - -
1,467,474 830,510 1,467,474 830,510
259,849 231,244 83,014 78,113 4,151 7,500 2,744 3,005
- 10 47 501
33,656 30,433 - -
383,461 350,806
(22,825) (26,666) 360,636 324,140
- -
$ 1,106,838 $ 506,370
$ 639,756 $ 300,073 446,200 197,296 20,882 9,001
- -
518,004 537,098 402,429 417,636 20,771 20,988
- -
$ 1.24 $ 0.56 1.11 0.47 1.01 0.43
- - See accompanying notes to the financial statements.
Can-Euro Fund
73

Statements of Comprehensive IncomeFor the years ended December 31
IncomeNet foreign exchange gain (loss) on cash and cash equivalentsOther incomeNet gain (loss) on investments
Expenses Management and advisory feesAdministration feesAudit feesCustodian feesTransaction costs Interest expenseGoods and services tax / Harmonized sales taxOther fees and expenses
Expenses absorbed by manager
Withholding taxes
Increase (decrease) in net assets from operations attributable to contractholders
Increase (decrease) in net assets from operations attributable to contractholders per class
VIOVIO2VIO3VIO4
Daily average number of unitsVIOVIO2VIO3VIO4
Increase (decrease) in net assets from operations attributable to contractholders per daily average number of units per class
VIOVIO2VIO3VIO4
GBO
2017 2016
$ - $ - - -
28,099 30,208 28,099 30,208
36,854 39,068 39,041 38,193 4,151 7,500 1,731 1,901
- 2 - 22
4,853 5,183 - -
86,630 91,869
(31,886) (33,689) 54,744 58,180
- -
$ (26,645) $ (27,972)
$ (16,119) $ (17,348) (6,984) (6,841) (3,542) (3,783)
- -
49,167 51,032 22,531 22,664 19,404 18,675
- -
$ (0.33) $ (0.34) (0.31) (0.30) (0.18) (0.20)
- - See accompanying notes to the financial statements.
Can-Global Bond Fund
74

Statements of Comprehensive IncomeFor the years ended December 31
IncomeNet foreign exchange gain (loss) on cash and cash equivalentsOther incomeNet gain (loss) on investments
Expenses Management and advisory feesAdministration feesAudit feesCustodian feesTransaction costs Interest expenseGoods and services tax / Harmonized sales taxOther fees and expenses
Expenses absorbed by manager
Withholding taxes
Increase (decrease) in net assets from operations attributable to contractholders
Increase (decrease) in net assets from operations attributable to contractholders per class
VIOVIO2VIO3VIO4
Daily average number of unitsVIOVIO2VIO3VIO4
Increase (decrease) in net assets from operations attributable to contractholders per daily average number of units per class
VIOVIO2VIO3VIO4
AAA
2017 2016
$ (167) $ (5,462) - -
20,564 16,230 20,397 10,768
2,833 2,766 23,915 22,808 1,383 2,500
81 81 3 14 1 -
425 417 - -
28,641 28,586
(24,216) (24,278) 4,425 4,308
384 323
$ 15,588 $ 6,137
$ 15,588 $ 6,137 - - - - - -
6,351 6,953 - - - - - -
$ 2.45 $ 0.88 - - - - - -
See accompanying notes to the financial statements.
American Asset Allocation Fund
75

Statements of Comprehensive IncomeFor the years ended December 31
IncomeNet foreign exchange gain (loss) on cash and cash equivalentsOther incomeNet gain (loss) on investments
Expenses Management and advisory feesAdministration feesAudit feesCustodian feesTransaction costs Interest expenseGoods and services tax / Harmonized sales taxOther fees and expenses
Expenses absorbed by manager
Withholding taxes
Increase (decrease) in net assets from operations attributable to contractholders
Increase (decrease) in net assets from operations attributable to contractholders per class
VIOVIO2VIO3VIO4
Daily average number of unitsVIOVIO2VIO3VIO4
Increase (decrease) in net assets from operations attributable to contractholders per daily average number of units per class
VIOVIO2VIO3VIO4
AEI
2017 2016
$ (54) $ (4,397) - -
16,415 12,271 16,361 7,874
3,298 3,821 23,980 22,989 1,384 2,500
42 43 2 19 - 6
605 697 - -
29,311 30,075
(24,090) (24,002) 5,221 6,073
372 405
$ 10,768 $ 1,396
$ 10,768 $ 1,396 - - - - - -
8,420 10,779 - - - - - -
$ 1.28 $ 0.13 - - - - - -
See accompanying notes to the financial statements.
American Equity Index Fund
76

Statements of Comprehensive IncomeFor the years ended December 31
IncomeNet foreign exchange gain (loss) on cash and cash equivalentsOther incomeNet gain (loss) on investments
Expenses Management and advisory feesAdministration feesAudit feesCustodian feesTransaction costs Interest expenseGoods and services tax / Harmonized sales taxOther fees and expenses
Expenses absorbed by manager
Withholding taxes
Increase (decrease) in net assets from operations attributable to contractholders
Increase (decrease) in net assets from operations attributable to contractholders per class
VIOVIO2VIO3VIO4
Daily average number of unitsVIOVIO2VIO3VIO4
Increase (decrease) in net assets from operations attributable to contractholders per daily average number of units per class
VIOVIO2VIO3VIO4
EMR
2017 2016
$ (267) $ (420) - -
350,522 88,048 350,255 87,628
27,008 24,720 32,910 29,675 2,767 5,398
182 85 153 78 15 6
4,069 3,815 - -
67,104 63,777
(21,780) (22,300) 45,324 41,477
4,131 3,723
$ 300,800 $ 42,428
$ 288,854 $ 40,771 11,946 1,657
- - - -
170,558 183,646 6,510 6,662
- - - -
$ 1.69 $ 0.22 1.83 0.25
- - - -
See accompanying notes to the financial statements.
Can-Emerge Fund
77
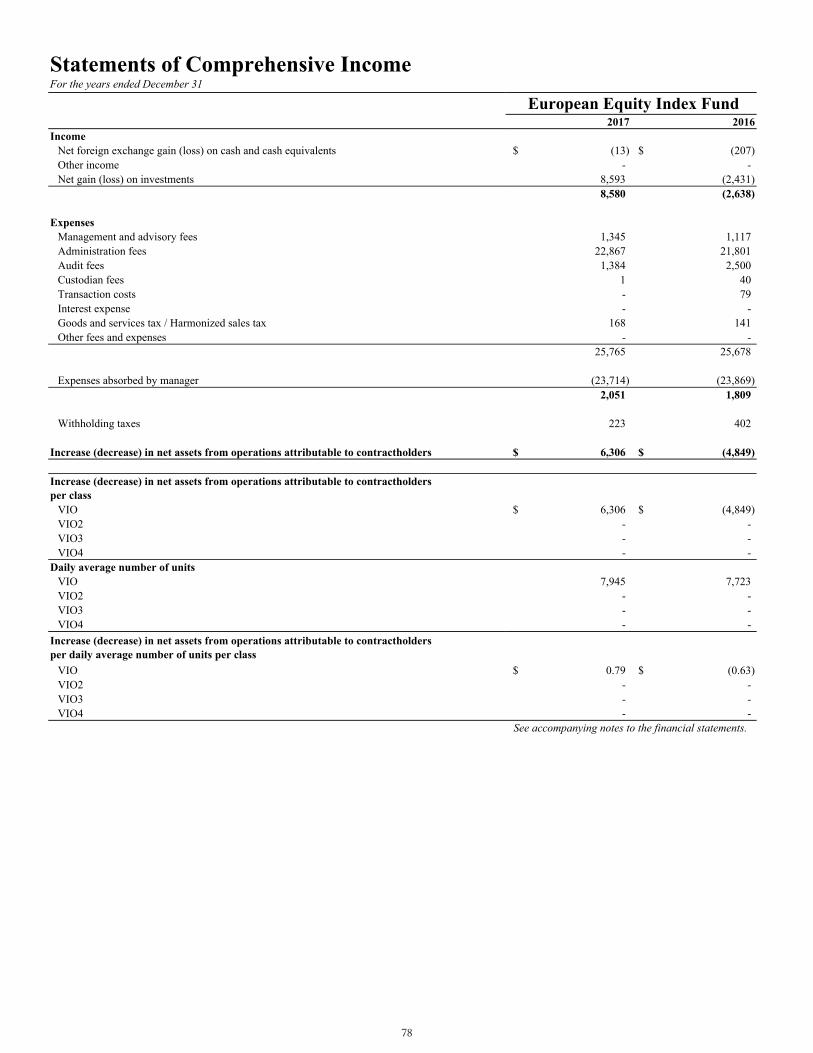
Statements of Comprehensive IncomeFor the years ended December 31
IncomeNet foreign exchange gain (loss) on cash and cash equivalentsOther incomeNet gain (loss) on investments
Expenses Management and advisory feesAdministration feesAudit feesCustodian feesTransaction costs Interest expenseGoods and services tax / Harmonized sales taxOther fees and expenses
Expenses absorbed by manager
Withholding taxes
Increase (decrease) in net assets from operations attributable to contractholders
Increase (decrease) in net assets from operations attributable to contractholders per class
VIOVIO2VIO3VIO4
Daily average number of unitsVIOVIO2VIO3VIO4
Increase (decrease) in net assets from operations attributable to contractholders per daily average number of units per class
VIOVIO2VIO3VIO4
EEI
2017 2016
$ (13) $ (207) - -
8,593 (2,431) 8,580 (2,638)
1,345 1,117 22,867 21,801 1,384 2,500
1 40 - 79 - -
168 141 - -
25,765 25,678
(23,714) (23,869) 2,051 1,809
223 402
$ 6,306 $ (4,849)
$ 6,306 $ (4,849) - - - - - -
7,945 7,723 - - - - - -
$ 0.79 $ (0.63) - - - - - -
See accompanying notes to the financial statements.
European Equity Index Fund
78

Statements of Comprehensive IncomeFor the years ended December 31
IncomeNet foreign exchange gain (loss) on cash and cash equivalentsOther incomeNet gain (loss) on investments
Expenses Management and advisory feesAdministration feesAudit feesCustodian feesTransaction costs Interest expenseGoods and services tax / Harmonized sales taxOther fees and expenses
Expenses absorbed by manager
Withholding taxes
Increase (decrease) in net assets from operations attributable to contractholders
Increase (decrease) in net assets from operations attributable to contractholders per class
VIOVIO2VIO3VIO4
Daily average number of unitsVIOVIO2VIO3VIO4
Increase (decrease) in net assets from operations attributable to contractholders per daily average number of units per class
VIOVIO2VIO3VIO4
IBI
2017 2016
$ (208) $ 70 1 -
3,358 (3,125) 3,151 (3,055)
2,362 3,117 23,902 22,964 1,384 2,500
16 42 12 2 19 -
179 235 - -
27,874 28,860
(24,192) (24,056) 3,682 4,804
32 144
$ (563) $ (8,003)
$ (563) $ (8,003) - - - - - -
11,848 14,774 - - - - - -
$ (0.05) $ (0.54) - - - - - -
See accompanying notes to the financial statements.
International Bond Index Fund
79

Statements of Comprehensive IncomeFor the years ended December 31
IncomeNet foreign exchange gain (loss) on cash and cash equivalentsOther incomeNet gain (loss) on investments
Expenses Management and advisory feesAdministration feesAudit feesCustodian feesTransaction costs Interest expenseGoods and services tax / Harmonized sales taxOther fees and expenses
Expenses absorbed by manager
Withholding taxes
Increase (decrease) in net assets from operations attributable to contractholders
Increase (decrease) in net assets from operations attributable to contractholders per class
VIOVIO2VIO3VIO4
Daily average number of unitsVIOVIO2VIO3VIO4
Increase (decrease) in net assets from operations attributable to contractholders per daily average number of units per class
VIOVIO2VIO3VIO4
ITF
2017 2016
$ (13) $ (24) 42 -
48,995 22,057 49,024 22,033
6,149 5,053 23,590 22,551 1,383 2,500
84 70 5 5 - -
953 782 - -
32,164 30,961
(22,833) (23,291) 9,331 7,670
499 509
$ 39,194 $ 13,854
$ 39,194 $ 13,854 - - - - - -
33,051 33,047 - - - - - -
$ 1.19 $ 0.42 - - - - - -
See accompanying notes to the financial statements.
Information Technology Fund
80
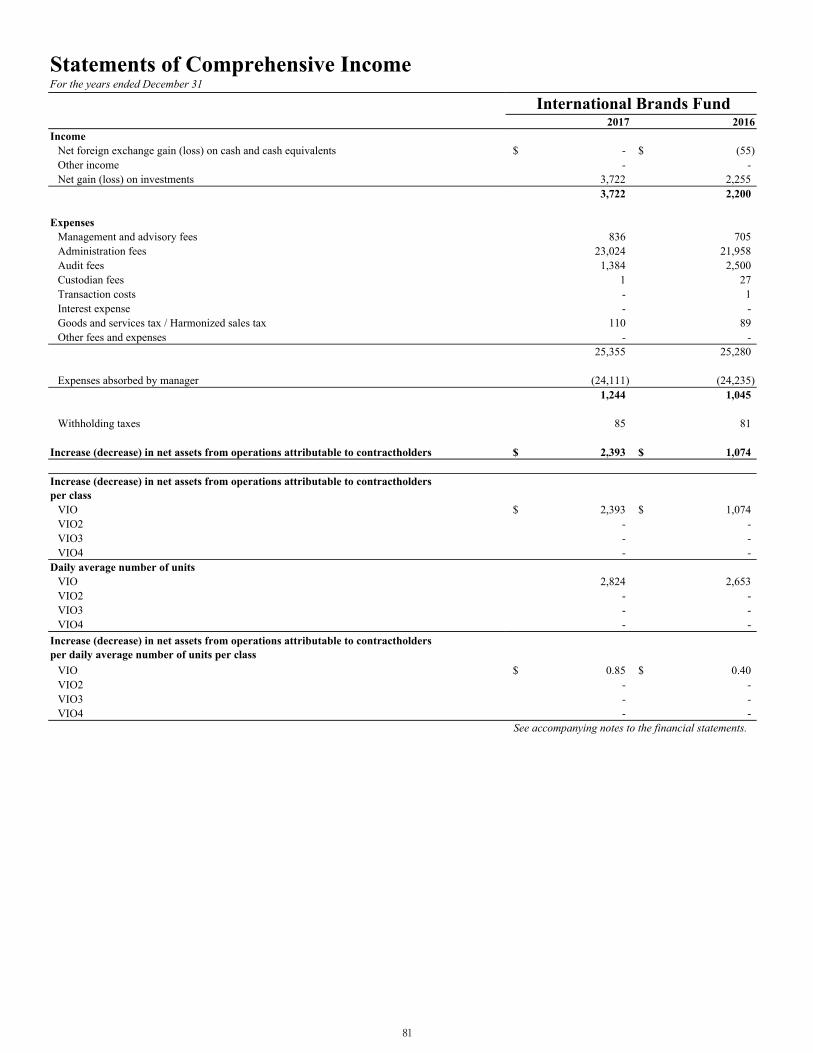
Statements of Comprehensive IncomeFor the years ended December 31
IncomeNet foreign exchange gain (loss) on cash and cash equivalentsOther incomeNet gain (loss) on investments
Expenses Management and advisory feesAdministration feesAudit feesCustodian feesTransaction costs Interest expenseGoods and services tax / Harmonized sales taxOther fees and expenses
Expenses absorbed by manager
Withholding taxes
Increase (decrease) in net assets from operations attributable to contractholders
Increase (decrease) in net assets from operations attributable to contractholders per class
VIOVIO2VIO3VIO4
Daily average number of unitsVIOVIO2VIO3VIO4
Increase (decrease) in net assets from operations attributable to contractholders per daily average number of units per class
VIOVIO2VIO3VIO4
BRN
2017 2016
$ - $ (55) - -
3,722 2,255 3,722 2,200
836 705 23,024 21,958 1,384 2,500
1 27 - 1 - -
110 89 - -
25,355 25,280
(24,111) (24,235) 1,244 1,045
85 81
$ 2,393 $ 1,074
$ 2,393 $ 1,074 - - - - - -
2,824 2,653 - - - - - -
$ 0.85 $ 0.40 - - - - - -
See accompanying notes to the financial statements.
International Brands Fund
81

Statements of Comprehensive IncomeFor the years ended December 31
IncomeNet foreign exchange gain (loss) on cash and cash equivalentsOther incomeNet gain (loss) on investments
Expenses Management and advisory feesAdministration feesAudit feesCustodian feesTransaction costs Interest expenseGoods and services tax / Harmonized sales taxOther fees and expenses
Expenses absorbed by manager
Withholding taxes
Increase (decrease) in net assets from operations attributable to contractholders
Increase (decrease) in net assets from operations attributable to contractholders per class
VIOVIO2VIO3VIO4
Daily average number of unitsVIOVIO2VIO3VIO4
Increase (decrease) in net assets from operations attributable to contractholders per daily average number of units per class
VIOVIO2VIO3VIO4
ULE
2017 2016
$ (4,512) $ (17,027) - -
1,509,564 2,184,863 1,505,052 2,167,836
482,046 473,394 102,889 104,077
2,767 5,398 4,053 10,549
18,168 52,029 5 19
60,967 60,555 - -
670,895 706,021
(12,946) (16,930) 657,949 689,091
2,430 1,988
$ 844,673 $ 1,476,757
$ 721,739 $ 1,279,286 122,934 197,471
- - - -
808,439 847,831 111,935 113,630
- - - -
$ 0.89 $ 1.51 1.10 1.74
- - - -
See accompanying notes to the financial statements.
Equity Fund
82
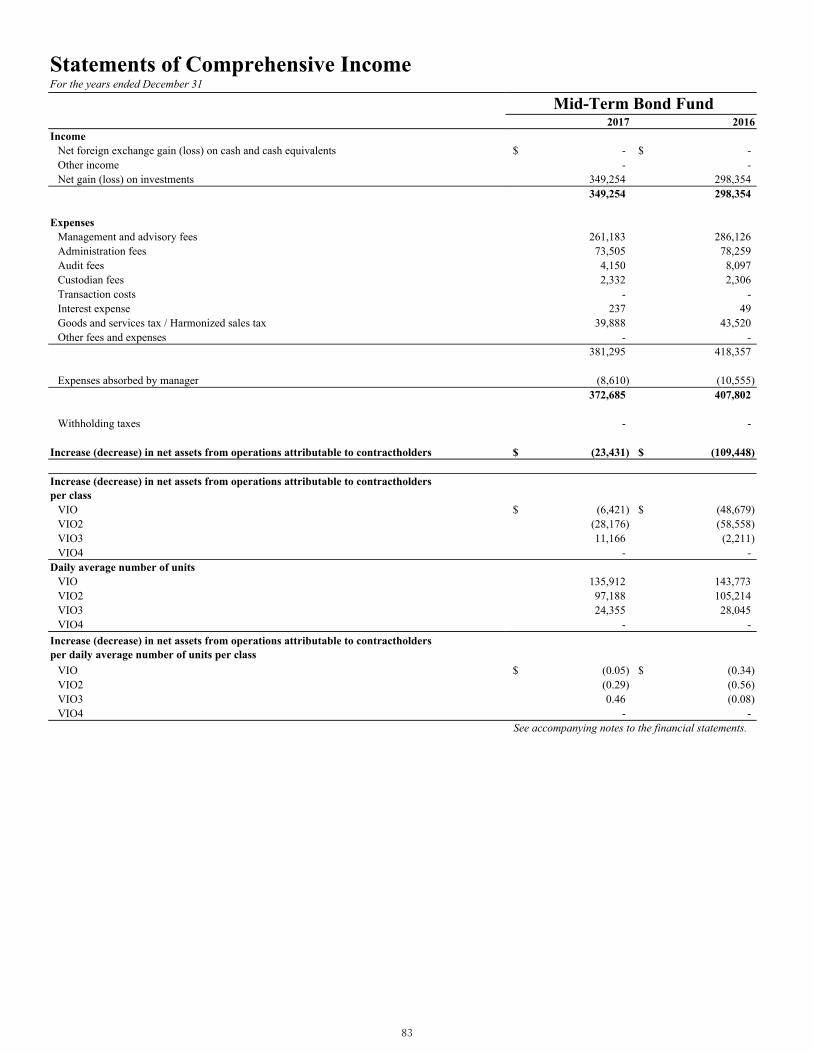
Statements of Comprehensive IncomeFor the years ended December 31
IncomeNet foreign exchange gain (loss) on cash and cash equivalentsOther incomeNet gain (loss) on investments
Expenses Management and advisory feesAdministration feesAudit feesCustodian feesTransaction costs Interest expenseGoods and services tax / Harmonized sales taxOther fees and expenses
Expenses absorbed by manager
Withholding taxes
Increase (decrease) in net assets from operations attributable to contractholders
Increase (decrease) in net assets from operations attributable to contractholders per class
VIOVIO2VIO3VIO4
Daily average number of unitsVIOVIO2VIO3VIO4
Increase (decrease) in net assets from operations attributable to contractholders per daily average number of units per class
VIOVIO2VIO3VIO4
ULB
2017 2016
$ - $ - - -
349,254 298,354 349,254 298,354
261,183 286,126 73,505 78,259 4,150 8,097 2,332 2,306
- - 237 49
39,888 43,520 - -
381,295 418,357
(8,610) (10,555) 372,685 407,802
- -
$ (23,431) $ (109,448)
$ (6,421) $ (48,679) (28,176) (58,558) 11,166 (2,211)
- -
135,912 143,773 97,188 105,214 24,355 28,045
- -
$ (0.05) $ (0.34) (0.29) (0.56) 0.46 (0.08)
- - See accompanying notes to the financial statements.
Mid-Term Bond Fund
83
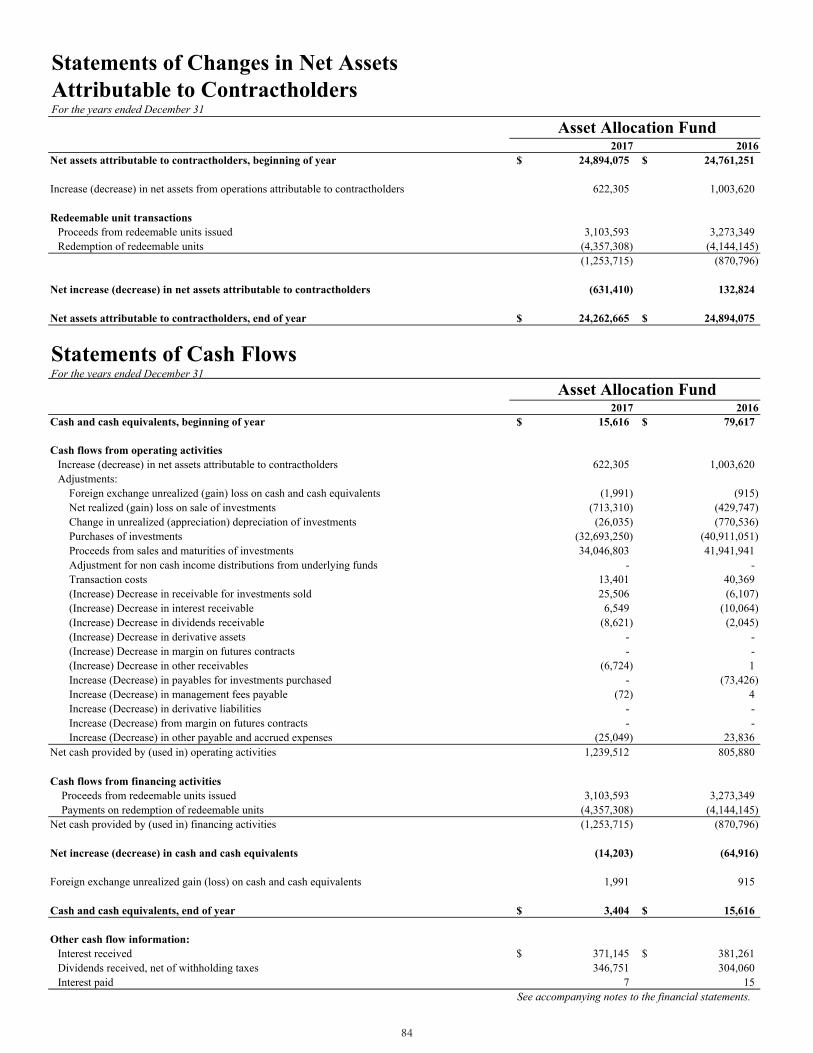
Statements of Changes in Net Assets Attributable to ContractholdersFor the years ended December 31
TCAA
2017 2016Net assets attributable to contractholders, beginning of year $ 24,894,075 $ 24,761,251
Increase (decrease) in net assets from operations attributable to contractholders 622,305 1,003,620
Redeemable unit transactionsProceeds from redeemable units issued 3,103,593 3,273,349 Redemption of redeemable units (4,357,308) (4,144,145)
(1,253,715) (870,796)
Net increase (decrease) in net assets attributable to contractholders (631,410) 132,824
Net assets attributable to contractholders, end of year $ 24,262,665 $ 24,894,075
Statements of Cash FlowsFor the years ended December 31
2017 2016Cash and cash equivalents, beginning of year $ 15,616 $ 79,617
Cash flows from operating activitiesIncrease (decrease) in net assets attributable to contractholders 622,305 1,003,620 Adjustments:
Foreign exchange unrealized (gain) loss on cash and cash equivalents (1,991) (915) Net realized (gain) loss on sale of investments (713,310) (429,747) Change in unrealized (appreciation) depreciation of investments (26,035) (770,536) Purchases of investments (32,693,250) (40,911,051) Proceeds from sales and maturities of investments 34,046,803 41,941,941 Adjustment for non cash income distributions from underlying funds - - Transaction costs 13,401 40,369 (Increase) Decrease in receivable for investments sold 25,506 (6,107) (Increase) Decrease in interest receivable 6,549 (10,064) (Increase) Decrease in dividends receivable (8,621) (2,045) (Increase) Decrease in derivative assets - - (Increase) Decrease in margin on futures contracts - - (Increase) Decrease in other receivables (6,724) 1 Increase (Decrease) in payables for investments purchased - (73,426) Increase (Decrease) in management fees payable (72) 4 Increase (Decrease) in derivative liabilities - - Increase (Decrease) from margin on futures contracts - - Increase (Decrease) in other payable and accrued expenses (25,049) 23,836
Net cash provided by (used in) operating activities 1,239,512 805,880
Cash flows from financing activitiesProceeds from redeemable units issued 3,103,593 3,273,349 Payments on redemption of redeemable units (4,357,308) (4,144,145)
Net cash provided by (used in) financing activities (1,253,715) (870,796)
Net increase (decrease) in cash and cash equivalents (14,203) (64,916)
Foreign exchange unrealized gain (loss) on cash and cash equivalents 1,991 915
Cash and cash equivalents, end of year $ 3,404 $ 15,616
Other cash flow information:Interest received $ 371,145 $ 381,261 Dividends received, net of withholding taxes 346,751 304,060 Interest paid 7 15
See accompanying notes to the financial statements.
Asset Allocation Fund
Asset Allocation Fund
84

Statements of Changes in Net Assets Attributable to ContractholdersFor the years ended December 31
Net assets attributable to contractholders, beginning of year
Increase (decrease) in net assets from operations attributable to contractholders
Redeemable unit transactionsProceeds from redeemable units issuedRedemption of redeemable units
Net increase (decrease) in net assets attributable to contractholders
Net assets attributable to contractholders, end of year
Statements of Cash FlowsFor the years ended December 31
Cash and cash equivalents, beginning of year
Cash flows from operating activitiesIncrease (decrease) in net assets attributable to contractholdersAdjustments:
Foreign exchange unrealized (gain) loss on cash and cash equivalentsNet realized (gain) loss on sale of investmentsChange in unrealized (appreciation) depreciation of investmentsPurchases of investmentsProceeds from sales and maturities of investmentsAdjustment for non cash income distributions from underlying fundsTransaction costs(Increase) Decrease in receivable for investments sold(Increase) Decrease in interest receivable(Increase) Decrease in dividends receivable(Increase) Decrease in derivative assets(Increase) Decrease in margin on futures contracts(Increase) Decrease in other receivablesIncrease (Decrease) in payables for investments purchasedIncrease (Decrease) in management fees payableIncrease (Decrease) in derivative liabilitiesIncrease (Decrease) from margin on futures contractsIncrease (Decrease) in other payable and accrued expenses
Net cash provided by (used in) operating activities
Cash flows from financing activitiesProceeds from redeemable units issuedPayments on redemption of redeemable units
Net cash provided by (used in) financing activities
Net increase (decrease) in cash and cash equivalents
Foreign exchange unrealized gain (loss) on cash and cash equivalents
Cash and cash equivalents, end of year
Other cash flow information:Interest receivedDividends received, net of withholding taxesInterest paid
IBO
2017 2016$ 162,803 $ 165,000
(1,516) (2,939)
18,459 18,195 (30,017) (17,453) (11,558) 742
(13,074) (2,197)
$ 149,729 $ 162,803
2017 2016$ 6,385 $ 5,718
(1,516) (2,939)
- - (264) (153) 988 2,071
- 19 11,786 (19)
- - 11 -
- - - - 9 17 - - - - - - - -
(1) (1) - - - -
(666) 930 10,347 (75)
18,459 18,195 (30,017) (17,453) (11,558) 742
(1,211) 667
- -
$ 5,174 $ 6,385
$ - $ - 4,256 4,427
1 - See accompanying notes to the financial statements.
Bond Fund
Bond Fund
85
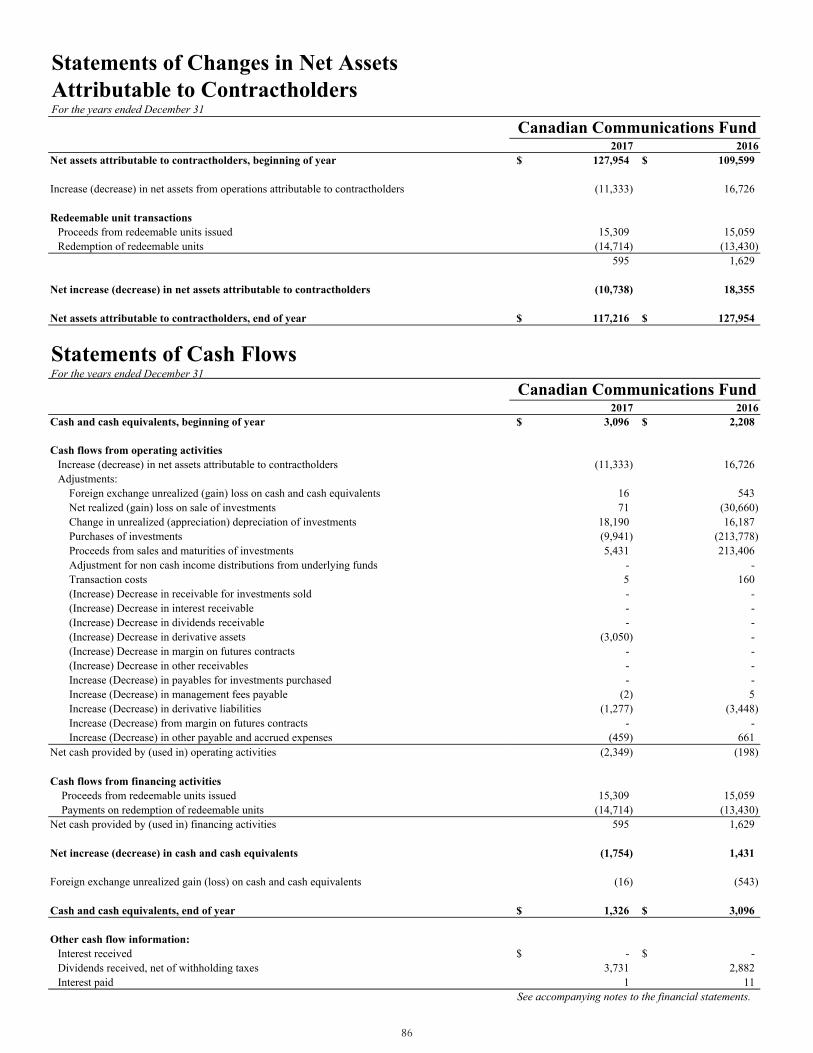
Statements of Changes in Net Assets Attributable to ContractholdersFor the years ended December 31
Net assets attributable to contractholders, beginning of year
Increase (decrease) in net assets from operations attributable to contractholders
Redeemable unit transactionsProceeds from redeemable units issuedRedemption of redeemable units
Net increase (decrease) in net assets attributable to contractholders
Net assets attributable to contractholders, end of year
Statements of Cash FlowsFor the years ended December 31
Cash and cash equivalents, beginning of year
Cash flows from operating activitiesIncrease (decrease) in net assets attributable to contractholdersAdjustments:
Foreign exchange unrealized (gain) loss on cash and cash equivalentsNet realized (gain) loss on sale of investmentsChange in unrealized (appreciation) depreciation of investmentsPurchases of investmentsProceeds from sales and maturities of investmentsAdjustment for non cash income distributions from underlying fundsTransaction costs(Increase) Decrease in receivable for investments sold(Increase) Decrease in interest receivable(Increase) Decrease in dividends receivable(Increase) Decrease in derivative assets(Increase) Decrease in margin on futures contracts(Increase) Decrease in other receivablesIncrease (Decrease) in payables for investments purchasedIncrease (Decrease) in management fees payableIncrease (Decrease) in derivative liabilitiesIncrease (Decrease) from margin on futures contractsIncrease (Decrease) in other payable and accrued expenses
Net cash provided by (used in) operating activities
Cash flows from financing activitiesProceeds from redeemable units issuedPayments on redemption of redeemable units
Net cash provided by (used in) financing activities
Net increase (decrease) in cash and cash equivalents
Foreign exchange unrealized gain (loss) on cash and cash equivalents
Cash and cash equivalents, end of year
Other cash flow information:Interest receivedDividends received, net of withholding taxesInterest paid
COM
2017 2016$ 127,954 $ 109,599
(11,333) 16,726
15,309 15,059 (14,714) (13,430)
595 1,629
(10,738) 18,355
$ 117,216 $ 127,954
2017 2016$ 3,096 $ 2,208
(11,333) 16,726
16 543 71 (30,660)
18,190 16,187 (9,941) (213,778) 5,431 213,406
- - 5 160 - - - - - -
(3,050) - - - - - - -
(2) 5 (1,277) (3,448)
- - (459) 661
(2,349) (198)
15,309 15,059 (14,714) (13,430)
595 1,629
(1,754) 1,431
(16) (543)
$ 1,326 $ 3,096
$ - $ - 3,731 2,882
1 11 See accompanying notes to the financial statements.
Canadian Communications Fund
Canadian Communications Fund
86
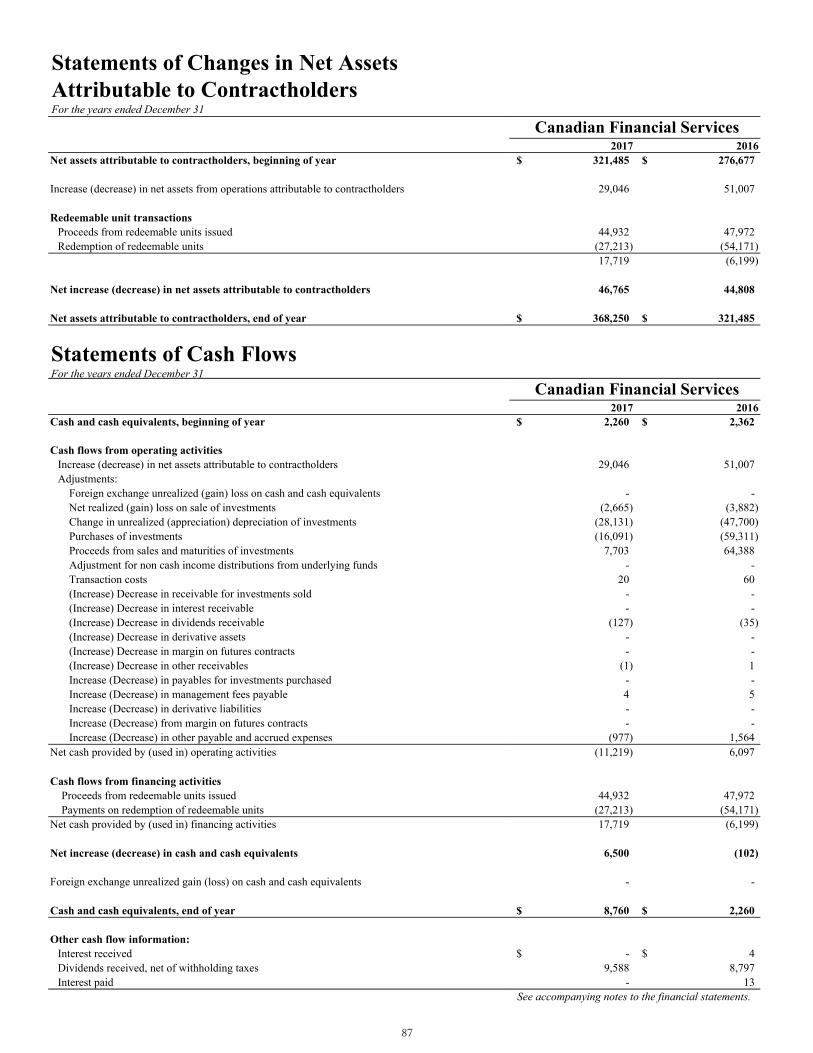
Statements of Changes in Net Assets Attributable to ContractholdersFor the years ended December 31
Net assets attributable to contractholders, beginning of year
Increase (decrease) in net assets from operations attributable to contractholders
Redeemable unit transactionsProceeds from redeemable units issuedRedemption of redeemable units
Net increase (decrease) in net assets attributable to contractholders
Net assets attributable to contractholders, end of year
Statements of Cash FlowsFor the years ended December 31
Cash and cash equivalents, beginning of year
Cash flows from operating activitiesIncrease (decrease) in net assets attributable to contractholdersAdjustments:
Foreign exchange unrealized (gain) loss on cash and cash equivalentsNet realized (gain) loss on sale of investmentsChange in unrealized (appreciation) depreciation of investmentsPurchases of investmentsProceeds from sales and maturities of investmentsAdjustment for non cash income distributions from underlying fundsTransaction costs(Increase) Decrease in receivable for investments sold(Increase) Decrease in interest receivable(Increase) Decrease in dividends receivable(Increase) Decrease in derivative assets(Increase) Decrease in margin on futures contracts(Increase) Decrease in other receivablesIncrease (Decrease) in payables for investments purchasedIncrease (Decrease) in management fees payableIncrease (Decrease) in derivative liabilitiesIncrease (Decrease) from margin on futures contractsIncrease (Decrease) in other payable and accrued expenses
Net cash provided by (used in) operating activities
Cash flows from financing activitiesProceeds from redeemable units issuedPayments on redemption of redeemable units
Net cash provided by (used in) financing activities
Net increase (decrease) in cash and cash equivalents
Foreign exchange unrealized gain (loss) on cash and cash equivalents
Cash and cash equivalents, end of year
Other cash flow information:Interest receivedDividends received, net of withholding taxesInterest paid
FIN
2017 2016$ 321,485 $ 276,677
29,046 51,007
44,932 47,972 (27,213) (54,171) 17,719 (6,199)
46,765 44,808
$ 368,250 $ 321,485
2017 2016$ 2,260 $ 2,362
29,046 51,007
- - (2,665) (3,882)
(28,131) (47,700) (16,091) (59,311)
7,703 64,388 - -
20 60 - - - -
(127) (35) - - - -
(1) 1 - - 4 5 - - - -
(977) 1,564 (11,219) 6,097
44,932 47,972 (27,213) (54,171) 17,719 (6,199)
6,500 (102)
- -
$ 8,760 $ 2,260
$ - $ 4 9,588 8,797
- 13 See accompanying notes to the financial statements.
Canadian Financial Services
Canadian Financial Services
87

Statements of Changes in Net Assets Attributable to ContractholdersFor the years ended December 31
Net assets attributable to contractholders, beginning of year
Increase (decrease) in net assets from operations attributable to contractholders
Redeemable unit transactionsProceeds from redeemable units issuedRedemption of redeemable units
Net increase (decrease) in net assets attributable to contractholders
Net assets attributable to contractholders, end of year
Statements of Cash FlowsFor the years ended December 31
Cash and cash equivalents, beginning of year
Cash flows from operating activitiesIncrease (decrease) in net assets attributable to contractholdersAdjustments:
Foreign exchange unrealized (gain) loss on cash and cash equivalentsNet realized (gain) loss on sale of investmentsChange in unrealized (appreciation) depreciation of investmentsPurchases of investmentsProceeds from sales and maturities of investmentsAdjustment for non cash income distributions from underlying fundsTransaction costs(Increase) Decrease in receivable for investments sold(Increase) Decrease in interest receivable(Increase) Decrease in dividends receivable(Increase) Decrease in derivative assets(Increase) Decrease in margin on futures contracts(Increase) Decrease in other receivablesIncrease (Decrease) in payables for investments purchasedIncrease (Decrease) in management fees payableIncrease (Decrease) in derivative liabilitiesIncrease (Decrease) from margin on futures contractsIncrease (Decrease) in other payable and accrued expenses
Net cash provided by (used in) operating activities
Cash flows from financing activitiesProceeds from redeemable units issuedPayments on redemption of redeemable units
Net cash provided by (used in) financing activities
Net increase (decrease) in cash and cash equivalents
Foreign exchange unrealized gain (loss) on cash and cash equivalents
Cash and cash equivalents, end of year
Other cash flow information:Interest receivedDividends received, net of withholding taxesInterest paid
RES
2017 2016$ 107,319 $ 84,182
(8,231) 28,721
12,028 11,695 (14,920) (17,279) (2,892) (5,584)
(11,123) 23,137
$ 96,196 $ 107,319
2017 2016$ 1,642 $ 2,959
(8,231) 28,721
- - 1,284 217 4,751 (30,916)
- 67 5,551 5,354
138 - 14 12
- - - -
129 264 - - - - 1 (1) - -
(2) 3 - - - -
(385) 546 3,250 4,267
12,028 11,695 (14,920) (17,279) (2,892) (5,584)
358 (1,317)
- -
$ 2,000 $ 1,642
$ - $ - 1,109 1,564
- - See accompanying notes to the financial statements.
Canadian Resources Fund
Canadian Resources Fund
88

Statements of Changes in Net Assets Attributable to ContractholdersFor the years ended December 31
Net assets attributable to contractholders, beginning of year
Increase (decrease) in net assets from operations attributable to contractholders
Redeemable unit transactionsProceeds from redeemable units issuedRedemption of redeemable units
Net increase (decrease) in net assets attributable to contractholders
Net assets attributable to contractholders, end of year
Statements of Cash FlowsFor the years ended December 31
Cash and cash equivalents, beginning of year
Cash flows from operating activitiesIncrease (decrease) in net assets attributable to contractholdersAdjustments:
Foreign exchange unrealized (gain) loss on cash and cash equivalentsNet realized (gain) loss on sale of investmentsChange in unrealized (appreciation) depreciation of investmentsPurchases of investmentsProceeds from sales and maturities of investmentsAdjustment for non cash income distributions from underlying fundsTransaction costs(Increase) Decrease in receivable for investments sold(Increase) Decrease in interest receivable(Increase) Decrease in dividends receivable(Increase) Decrease in derivative assets(Increase) Decrease in margin on futures contracts(Increase) Decrease in other receivablesIncrease (Decrease) in payables for investments purchasedIncrease (Decrease) in management fees payableIncrease (Decrease) in derivative liabilitiesIncrease (Decrease) from margin on futures contractsIncrease (Decrease) in other payable and accrued expenses
Net cash provided by (used in) operating activities
Cash flows from financing activitiesProceeds from redeemable units issuedPayments on redemption of redeemable units
Net cash provided by (used in) financing activities
Net increase (decrease) in cash and cash equivalents
Foreign exchange unrealized gain (loss) on cash and cash equivalents
Cash and cash equivalents, end of year
Other cash flow information:Interest receivedDividends received, net of withholding taxesInterest paid
GRO
2017 2016$ 164,555 $ 137,950
8,050 22,521
20,549 22,696 (46,766) (18,612) (26,217) 4,084
(18,167) 26,605
$ 146,388 $ 164,555
2017 2016$ 6,924 $ 2,364
8,050 22,521
- - (3,841) 233 (5,858) (24,173)
- 233 23,309 (233)
- - 30 -
- - - - - 1,070 - - - - - - - -
(3) 3 - - - -
(582) 822 21,105 476
20,549 22,696 (46,766) (18,612) (26,217) 4,084
(5,112) 4,560
- -
$ 1,812 $ 6,924
$ - $ - 3,745 5,256
4 - See accompanying notes to the financial statements.
Canadian Growth Fund
Canadian Growth Fund
89
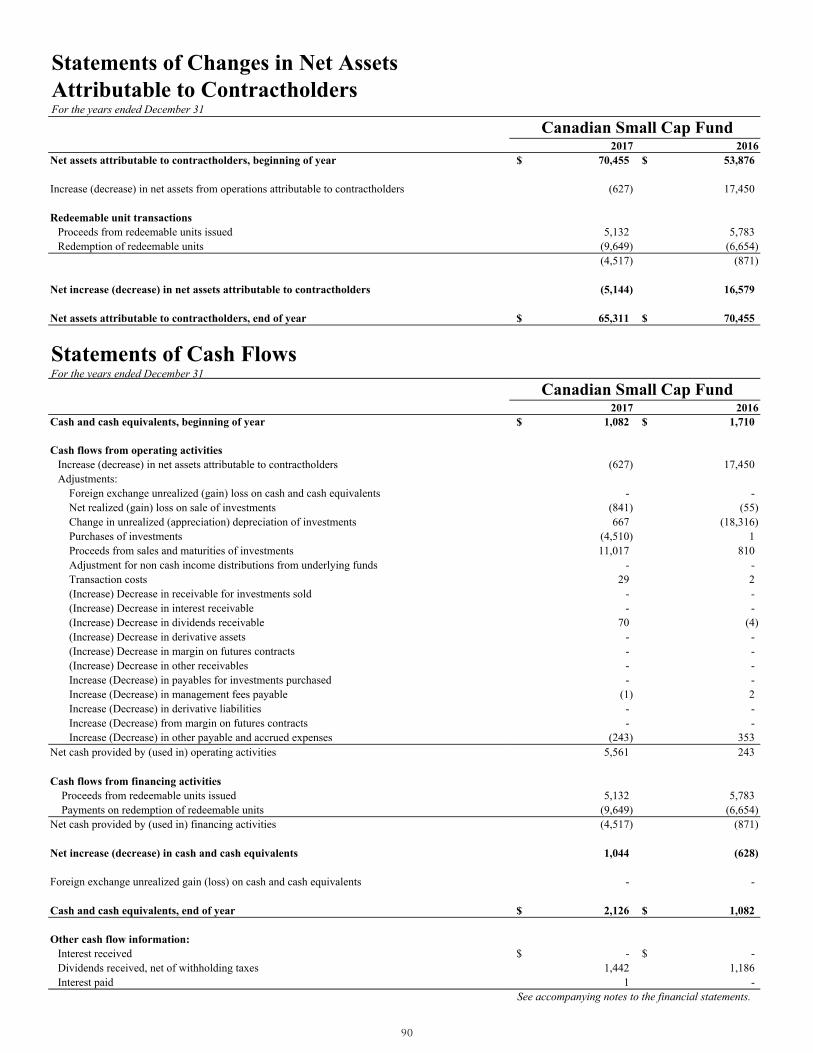
Statements of Changes in Net Assets Attributable to ContractholdersFor the years ended December 31
Net assets attributable to contractholders, beginning of year
Increase (decrease) in net assets from operations attributable to contractholders
Redeemable unit transactionsProceeds from redeemable units issuedRedemption of redeemable units
Net increase (decrease) in net assets attributable to contractholders
Net assets attributable to contractholders, end of year
Statements of Cash FlowsFor the years ended December 31
Cash and cash equivalents, beginning of year
Cash flows from operating activitiesIncrease (decrease) in net assets attributable to contractholdersAdjustments:
Foreign exchange unrealized (gain) loss on cash and cash equivalentsNet realized (gain) loss on sale of investmentsChange in unrealized (appreciation) depreciation of investmentsPurchases of investmentsProceeds from sales and maturities of investmentsAdjustment for non cash income distributions from underlying fundsTransaction costs(Increase) Decrease in receivable for investments sold(Increase) Decrease in interest receivable(Increase) Decrease in dividends receivable(Increase) Decrease in derivative assets(Increase) Decrease in margin on futures contracts(Increase) Decrease in other receivablesIncrease (Decrease) in payables for investments purchasedIncrease (Decrease) in management fees payableIncrease (Decrease) in derivative liabilitiesIncrease (Decrease) from margin on futures contractsIncrease (Decrease) in other payable and accrued expenses
Net cash provided by (used in) operating activities
Cash flows from financing activitiesProceeds from redeemable units issuedPayments on redemption of redeemable units
Net cash provided by (used in) financing activities
Net increase (decrease) in cash and cash equivalents
Foreign exchange unrealized gain (loss) on cash and cash equivalents
Cash and cash equivalents, end of year
Other cash flow information:Interest receivedDividends received, net of withholding taxesInterest paid
CAP
2017 2016$ 70,455 $ 53,876
(627) 17,450
5,132 5,783 (9,649) (6,654) (4,517) (871)
(5,144) 16,579
$ 65,311 $ 70,455
2017 2016$ 1,082 $ 1,710
(627) 17,450
- - (841) (55) 667 (18,316)
(4,510) 1 11,017 810
- - 29 2
- - - -
70 (4) - - - - - - - -
(1) 2 - - - -
(243) 353 5,561 243
5,132 5,783 (9,649) (6,654) (4,517) (871)
1,044 (628)
- -
$ 2,126 $ 1,082
$ - $ - 1,442 1,186
1 - See accompanying notes to the financial statements.
Canadian Small Cap Fund
Canadian Small Cap Fund
90
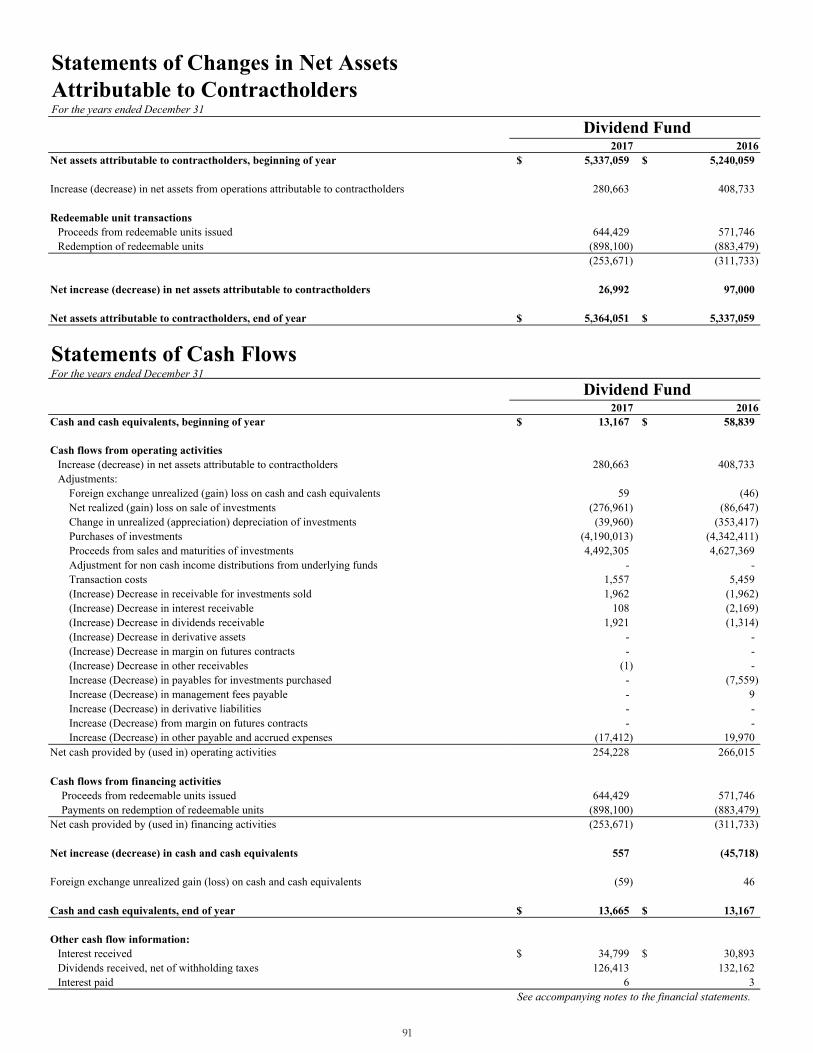
Statements of Changes in Net Assets Attributable to ContractholdersFor the years ended December 31
Net assets attributable to contractholders, beginning of year
Increase (decrease) in net assets from operations attributable to contractholders
Redeemable unit transactionsProceeds from redeemable units issuedRedemption of redeemable units
Net increase (decrease) in net assets attributable to contractholders
Net assets attributable to contractholders, end of year
Statements of Cash FlowsFor the years ended December 31
Cash and cash equivalents, beginning of year
Cash flows from operating activitiesIncrease (decrease) in net assets attributable to contractholdersAdjustments:
Foreign exchange unrealized (gain) loss on cash and cash equivalentsNet realized (gain) loss on sale of investmentsChange in unrealized (appreciation) depreciation of investmentsPurchases of investmentsProceeds from sales and maturities of investmentsAdjustment for non cash income distributions from underlying fundsTransaction costs(Increase) Decrease in receivable for investments sold(Increase) Decrease in interest receivable(Increase) Decrease in dividends receivable(Increase) Decrease in derivative assets(Increase) Decrease in margin on futures contracts(Increase) Decrease in other receivablesIncrease (Decrease) in payables for investments purchasedIncrease (Decrease) in management fees payableIncrease (Decrease) in derivative liabilitiesIncrease (Decrease) from margin on futures contractsIncrease (Decrease) in other payable and accrued expenses
Net cash provided by (used in) operating activities
Cash flows from financing activitiesProceeds from redeemable units issuedPayments on redemption of redeemable units
Net cash provided by (used in) financing activities
Net increase (decrease) in cash and cash equivalents
Foreign exchange unrealized gain (loss) on cash and cash equivalents
Cash and cash equivalents, end of year
Other cash flow information:Interest receivedDividends received, net of withholding taxesInterest paid
DIV
2017 2016$ 5,337,059 $ 5,240,059
280,663 408,733
644,429 571,746 (898,100) (883,479) (253,671) (311,733)
26,992 97,000
$ 5,364,051 $ 5,337,059
2017 2016$ 13,167 $ 58,839
280,663 408,733
59 (46) (276,961) (86,647) (39,960) (353,417)
(4,190,013) (4,342,411) 4,492,305 4,627,369
- - 1,557 5,459 1,962 (1,962)
108 (2,169) 1,921 (1,314)
- - - -
(1) - - (7,559) - 9 - - - -
(17,412) 19,970 254,228 266,015
644,429 571,746 (898,100) (883,479) (253,671) (311,733)
557 (45,718)
(59) 46
$ 13,665 $ 13,167
$ 34,799 $ 30,893 126,413 132,162
6 3 See accompanying notes to the financial statements.
Dividend Fund
Dividend Fund
91
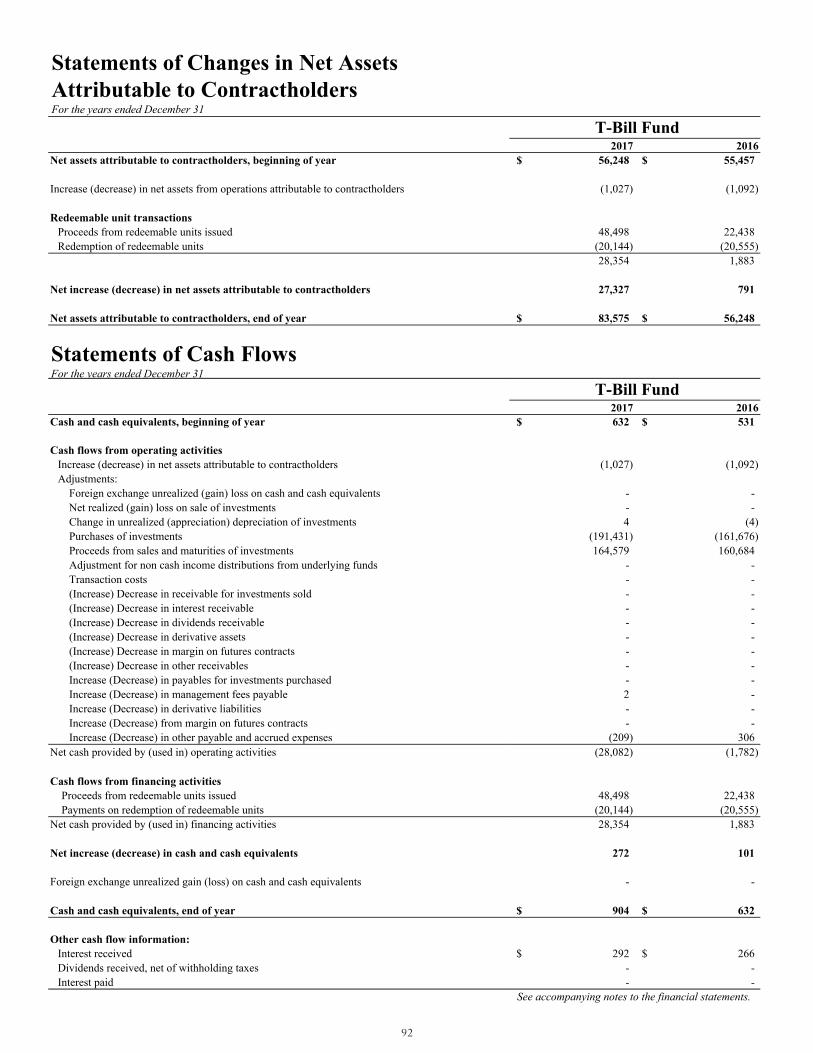
Statements of Changes in Net Assets Attributable to ContractholdersFor the years ended December 31
Net assets attributable to contractholders, beginning of year
Increase (decrease) in net assets from operations attributable to contractholders
Redeemable unit transactionsProceeds from redeemable units issuedRedemption of redeemable units
Net increase (decrease) in net assets attributable to contractholders
Net assets attributable to contractholders, end of year
Statements of Cash FlowsFor the years ended December 31
Cash and cash equivalents, beginning of year
Cash flows from operating activitiesIncrease (decrease) in net assets attributable to contractholdersAdjustments:
Foreign exchange unrealized (gain) loss on cash and cash equivalentsNet realized (gain) loss on sale of investmentsChange in unrealized (appreciation) depreciation of investmentsPurchases of investmentsProceeds from sales and maturities of investmentsAdjustment for non cash income distributions from underlying fundsTransaction costs(Increase) Decrease in receivable for investments sold(Increase) Decrease in interest receivable(Increase) Decrease in dividends receivable(Increase) Decrease in derivative assets(Increase) Decrease in margin on futures contracts(Increase) Decrease in other receivablesIncrease (Decrease) in payables for investments purchasedIncrease (Decrease) in management fees payableIncrease (Decrease) in derivative liabilitiesIncrease (Decrease) from margin on futures contractsIncrease (Decrease) in other payable and accrued expenses
Net cash provided by (used in) operating activities
Cash flows from financing activitiesProceeds from redeemable units issuedPayments on redemption of redeemable units
Net cash provided by (used in) financing activities
Net increase (decrease) in cash and cash equivalents
Foreign exchange unrealized gain (loss) on cash and cash equivalents
Cash and cash equivalents, end of year
Other cash flow information:Interest receivedDividends received, net of withholding taxesInterest paid
TBIL
2017 2016$ 56,248 $ 55,457
(1,027) (1,092)
48,498 22,438 (20,144) (20,555) 28,354 1,883
27,327 791
$ 83,575 $ 56,248
2017 2016$ 632 $ 531
(1,027) (1,092)
- - - - 4 (4)
(191,431) (161,676) 164,579 160,684
- - - - - - - - - - - - - - - - - - 2 - - - - -
(209) 306 (28,082) (1,782)
48,498 22,438 (20,144) (20,555) 28,354 1,883
272 101
- -
$ 904 $ 632
$ 292 $ 266 - - - -
See accompanying notes to the financial statements.
T-Bill Fund
T-Bill Fund
92
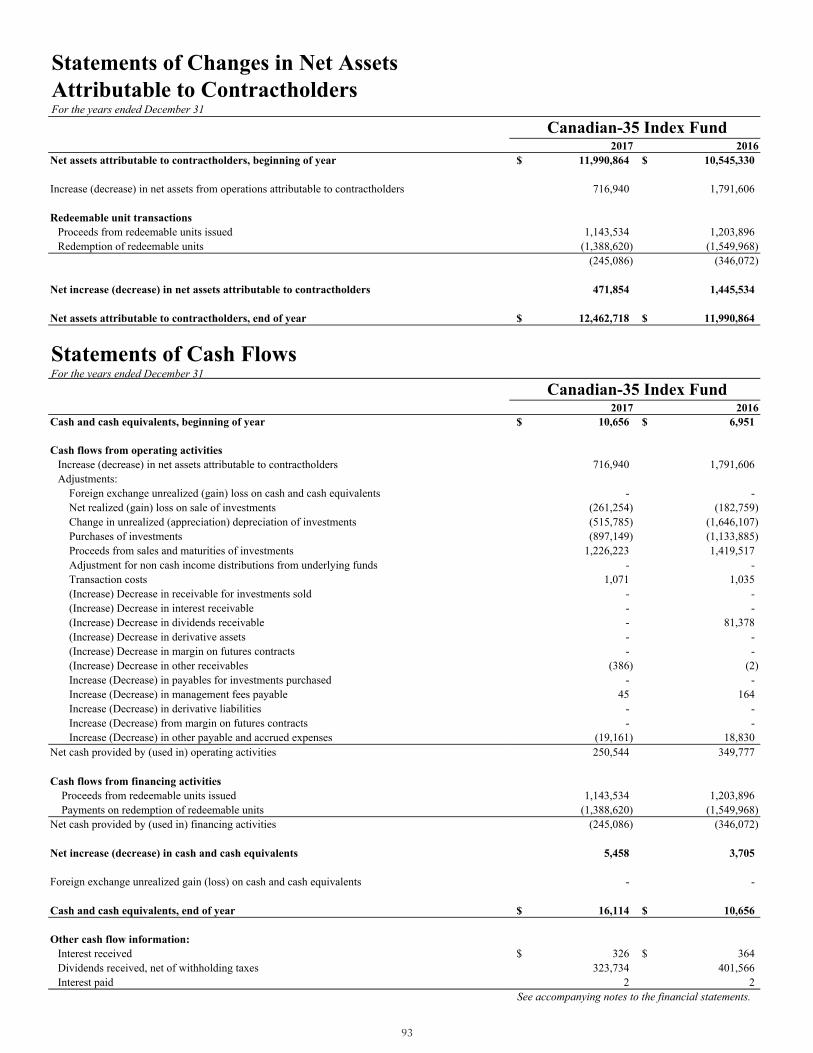
Statements of Changes in Net Assets Attributable to ContractholdersFor the years ended December 31
Net assets attributable to contractholders, beginning of year
Increase (decrease) in net assets from operations attributable to contractholders
Redeemable unit transactionsProceeds from redeemable units issuedRedemption of redeemable units
Net increase (decrease) in net assets attributable to contractholders
Net assets attributable to contractholders, end of year
Statements of Cash FlowsFor the years ended December 31
Cash and cash equivalents, beginning of year
Cash flows from operating activitiesIncrease (decrease) in net assets attributable to contractholdersAdjustments:
Foreign exchange unrealized (gain) loss on cash and cash equivalentsNet realized (gain) loss on sale of investmentsChange in unrealized (appreciation) depreciation of investmentsPurchases of investmentsProceeds from sales and maturities of investmentsAdjustment for non cash income distributions from underlying fundsTransaction costs(Increase) Decrease in receivable for investments sold(Increase) Decrease in interest receivable(Increase) Decrease in dividends receivable(Increase) Decrease in derivative assets(Increase) Decrease in margin on futures contracts(Increase) Decrease in other receivablesIncrease (Decrease) in payables for investments purchasedIncrease (Decrease) in management fees payableIncrease (Decrease) in derivative liabilitiesIncrease (Decrease) from margin on futures contractsIncrease (Decrease) in other payable and accrued expenses
Net cash provided by (used in) operating activities
Cash flows from financing activitiesProceeds from redeemable units issuedPayments on redemption of redeemable units
Net cash provided by (used in) financing activities
Net increase (decrease) in cash and cash equivalents
Foreign exchange unrealized gain (loss) on cash and cash equivalents
Cash and cash equivalents, end of year
Other cash flow information:Interest receivedDividends received, net of withholding taxesInterest paid
TTSE
2017 2016$ 11,990,864 $ 10,545,330
716,940 1,791,606
1,143,534 1,203,896 (1,388,620) (1,549,968)
(245,086) (346,072)
471,854 1,445,534
$ 12,462,718 $ 11,990,864
2017 2016$ 10,656 $ 6,951
716,940 1,791,606
- - (261,254) (182,759) (515,785) (1,646,107) (897,149) (1,133,885)
1,226,223 1,419,517 - -
1,071 1,035 - - - - - 81,378 - - - -
(386) (2) - -
45 164 - - - -
(19,161) 18,830 250,544 349,777
1,143,534 1,203,896 (1,388,620) (1,549,968)
(245,086) (346,072)
5,458 3,705
- -
$ 16,114 $ 10,656
$ 326 $ 364 323,734 401,566
2 2 See accompanying notes to the financial statements.
Canadian-35 Index Fund
Canadian-35 Index Fund
93
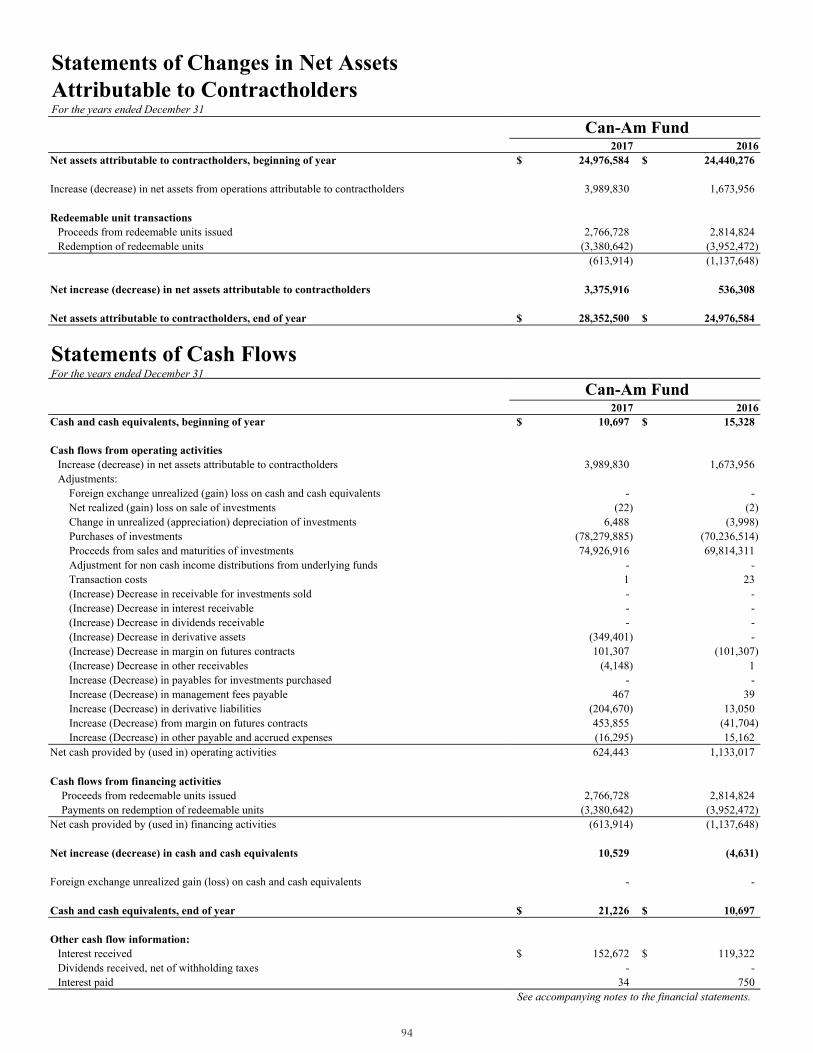
Statements of Changes in Net Assets Attributable to ContractholdersFor the years ended December 31
Net assets attributable to contractholders, beginning of year
Increase (decrease) in net assets from operations attributable to contractholders
Redeemable unit transactionsProceeds from redeemable units issuedRedemption of redeemable units
Net increase (decrease) in net assets attributable to contractholders
Net assets attributable to contractholders, end of year
Statements of Cash FlowsFor the years ended December 31
Cash and cash equivalents, beginning of year
Cash flows from operating activitiesIncrease (decrease) in net assets attributable to contractholdersAdjustments:
Foreign exchange unrealized (gain) loss on cash and cash equivalentsNet realized (gain) loss on sale of investmentsChange in unrealized (appreciation) depreciation of investmentsPurchases of investmentsProceeds from sales and maturities of investmentsAdjustment for non cash income distributions from underlying fundsTransaction costs(Increase) Decrease in receivable for investments sold(Increase) Decrease in interest receivable(Increase) Decrease in dividends receivable(Increase) Decrease in derivative assets(Increase) Decrease in margin on futures contracts(Increase) Decrease in other receivablesIncrease (Decrease) in payables for investments purchasedIncrease (Decrease) in management fees payableIncrease (Decrease) in derivative liabilitiesIncrease (Decrease) from margin on futures contractsIncrease (Decrease) in other payable and accrued expenses
Net cash provided by (used in) operating activities
Cash flows from financing activitiesProceeds from redeemable units issuedPayments on redemption of redeemable units
Net cash provided by (used in) financing activities
Net increase (decrease) in cash and cash equivalents
Foreign exchange unrealized gain (loss) on cash and cash equivalents
Cash and cash equivalents, end of year
Other cash flow information:Interest receivedDividends received, net of withholding taxesInterest paid
AMF
2017 2016$ 24,976,584 $ 24,440,276
3,989,830 1,673,956
2,766,728 2,814,824 (3,380,642) (3,952,472)
(613,914) (1,137,648)
3,375,916 536,308
$ 28,352,500 $ 24,976,584
2017 2016$ 10,697 $ 15,328
3,989,830 1,673,956
- - (22) (2)
6,488 (3,998) (78,279,885) (70,236,514) 74,926,916 69,814,311
- - 1 23 - - - - - -
(349,401) - 101,307 (101,307)
(4,148) 1 - -
467 39 (204,670) 13,050 453,855 (41,704) (16,295) 15,162 624,443 1,133,017
2,766,728 2,814,824 (3,380,642) (3,952,472)
(613,914) (1,137,648)
10,529 (4,631)
- -
$ 21,226 $ 10,697
$ 152,672 $ 119,322 - -
34 750 See accompanying notes to the financial statements.
Can-Am Fund
Can-Am Fund
94
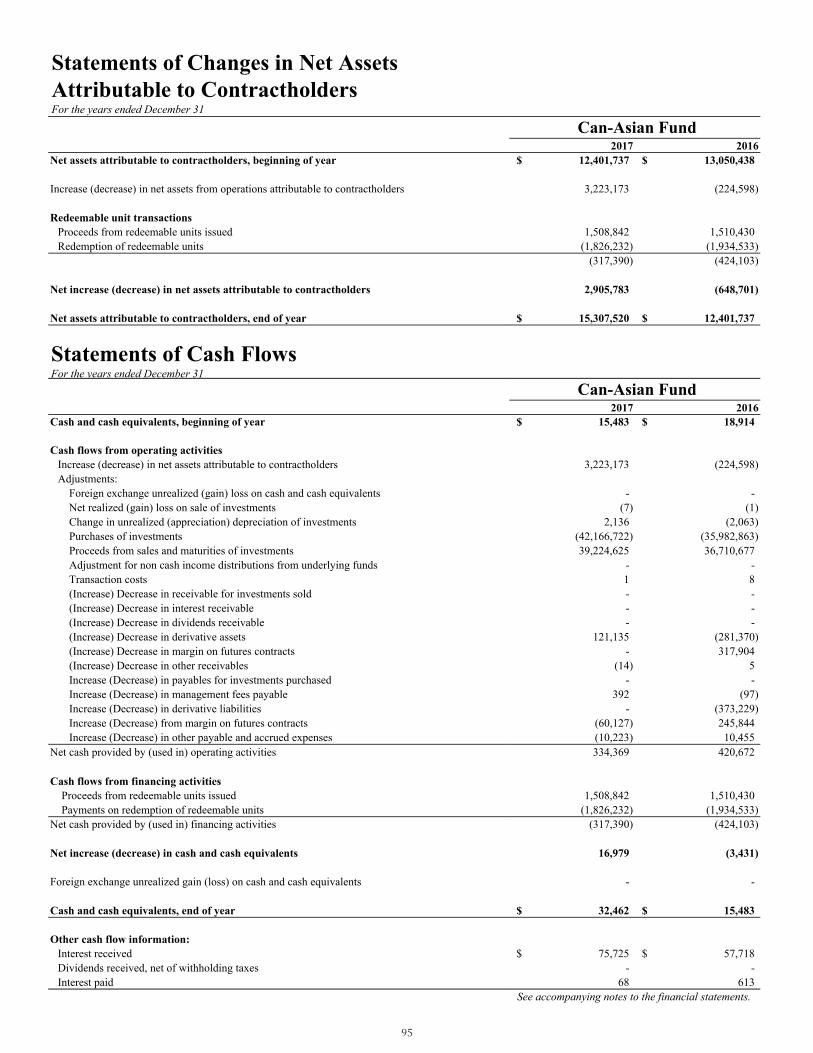
Statements of Changes in Net Assets Attributable to ContractholdersFor the years ended December 31
Net assets attributable to contractholders, beginning of year
Increase (decrease) in net assets from operations attributable to contractholders
Redeemable unit transactionsProceeds from redeemable units issuedRedemption of redeemable units
Net increase (decrease) in net assets attributable to contractholders
Net assets attributable to contractholders, end of year
Statements of Cash FlowsFor the years ended December 31
Cash and cash equivalents, beginning of year
Cash flows from operating activitiesIncrease (decrease) in net assets attributable to contractholdersAdjustments:
Foreign exchange unrealized (gain) loss on cash and cash equivalentsNet realized (gain) loss on sale of investmentsChange in unrealized (appreciation) depreciation of investmentsPurchases of investmentsProceeds from sales and maturities of investmentsAdjustment for non cash income distributions from underlying fundsTransaction costs(Increase) Decrease in receivable for investments sold(Increase) Decrease in interest receivable(Increase) Decrease in dividends receivable(Increase) Decrease in derivative assets(Increase) Decrease in margin on futures contracts(Increase) Decrease in other receivablesIncrease (Decrease) in payables for investments purchasedIncrease (Decrease) in management fees payableIncrease (Decrease) in derivative liabilitiesIncrease (Decrease) from margin on futures contractsIncrease (Decrease) in other payable and accrued expenses
Net cash provided by (used in) operating activities
Cash flows from financing activitiesProceeds from redeemable units issuedPayments on redemption of redeemable units
Net cash provided by (used in) financing activities
Net increase (decrease) in cash and cash equivalents
Foreign exchange unrealized gain (loss) on cash and cash equivalents
Cash and cash equivalents, end of year
Other cash flow information:Interest receivedDividends received, net of withholding taxesInterest paid
ASF
2017 2016$ 12,401,737 $ 13,050,438
3,223,173 (224,598)
1,508,842 1,510,430 (1,826,232) (1,934,533)
(317,390) (424,103)
2,905,783 (648,701)
$ 15,307,520 $ 12,401,737
2017 2016$ 15,483 $ 18,914
3,223,173 (224,598)
- - (7) (1)
2,136 (2,063) (42,166,722) (35,982,863) 39,224,625 36,710,677
- - 1 8 - - - - - -
121,135 (281,370) - 317,904
(14) 5 - -
392 (97) - (373,229)
(60,127) 245,844 (10,223) 10,455 334,369 420,672
1,508,842 1,510,430 (1,826,232) (1,934,533)
(317,390) (424,103)
16,979 (3,431)
- -
$ 32,462 $ 15,483
$ 75,725 $ 57,718 - -
68 613 See accompanying notes to the financial statements.
Can-Asian Fund
Can-Asian Fund
95
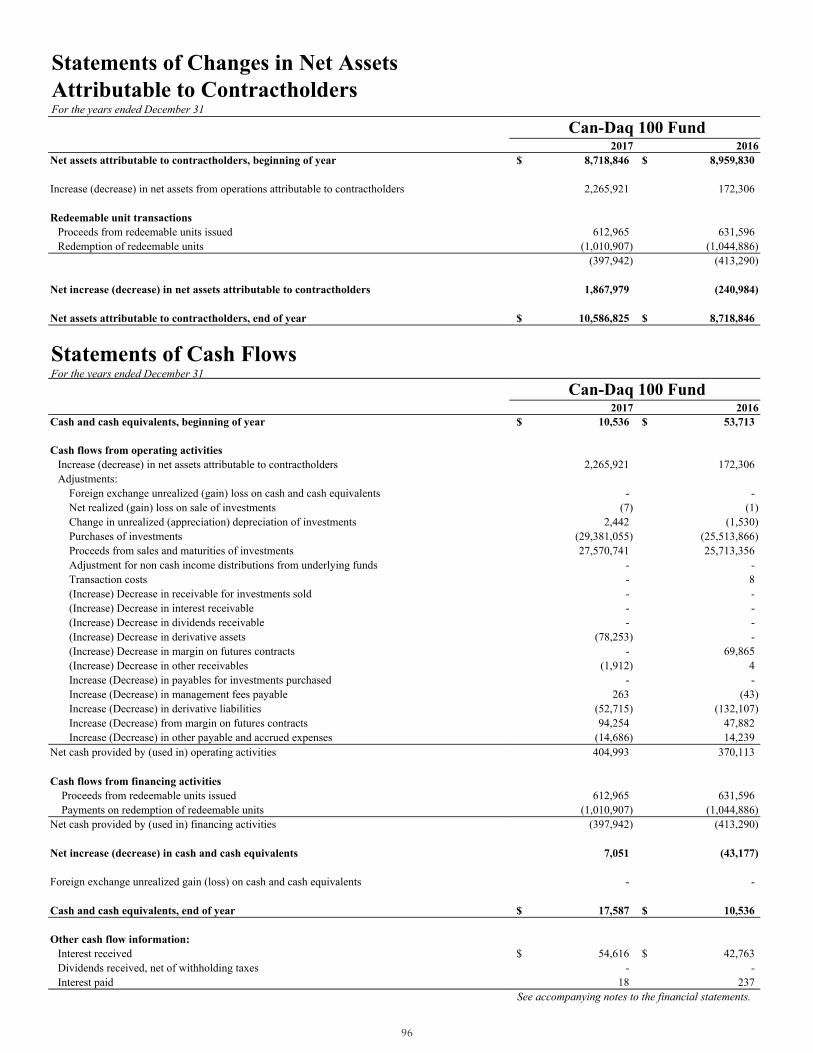
Statements of Changes in Net Assets Attributable to ContractholdersFor the years ended December 31
Net assets attributable to contractholders, beginning of year
Increase (decrease) in net assets from operations attributable to contractholders
Redeemable unit transactionsProceeds from redeemable units issuedRedemption of redeemable units
Net increase (decrease) in net assets attributable to contractholders
Net assets attributable to contractholders, end of year
Statements of Cash FlowsFor the years ended December 31
Cash and cash equivalents, beginning of year
Cash flows from operating activitiesIncrease (decrease) in net assets attributable to contractholdersAdjustments:
Foreign exchange unrealized (gain) loss on cash and cash equivalentsNet realized (gain) loss on sale of investmentsChange in unrealized (appreciation) depreciation of investmentsPurchases of investmentsProceeds from sales and maturities of investmentsAdjustment for non cash income distributions from underlying fundsTransaction costs(Increase) Decrease in receivable for investments sold(Increase) Decrease in interest receivable(Increase) Decrease in dividends receivable(Increase) Decrease in derivative assets(Increase) Decrease in margin on futures contracts(Increase) Decrease in other receivablesIncrease (Decrease) in payables for investments purchasedIncrease (Decrease) in management fees payableIncrease (Decrease) in derivative liabilitiesIncrease (Decrease) from margin on futures contractsIncrease (Decrease) in other payable and accrued expenses
Net cash provided by (used in) operating activities
Cash flows from financing activitiesProceeds from redeemable units issuedPayments on redemption of redeemable units
Net cash provided by (used in) financing activities
Net increase (decrease) in cash and cash equivalents
Foreign exchange unrealized gain (loss) on cash and cash equivalents
Cash and cash equivalents, end of year
Other cash flow information:Interest receivedDividends received, net of withholding taxesInterest paid
DAQ
2017 2016$ 8,718,846 $ 8,959,830
2,265,921 172,306
612,965 631,596 (1,010,907) (1,044,886)
(397,942) (413,290)
1,867,979 (240,984)
$ 10,586,825 $ 8,718,846
2017 2016$ 10,536 $ 53,713
2,265,921 172,306
- - (7) (1)
2,442 (1,530) (29,381,055) (25,513,866) 27,570,741 25,713,356
- - - 8 - - - - - -
(78,253) - - 69,865
(1,912) 4 - -
263 (43) (52,715) (132,107) 94,254 47,882
(14,686) 14,239 404,993 370,113
612,965 631,596 (1,010,907) (1,044,886)
(397,942) (413,290)
7,051 (43,177)
- -
$ 17,587 $ 10,536
$ 54,616 $ 42,763 - -
18 237 See accompanying notes to the financial statements.
Can-Daq 100 Fund
Can-Daq 100 Fund
96
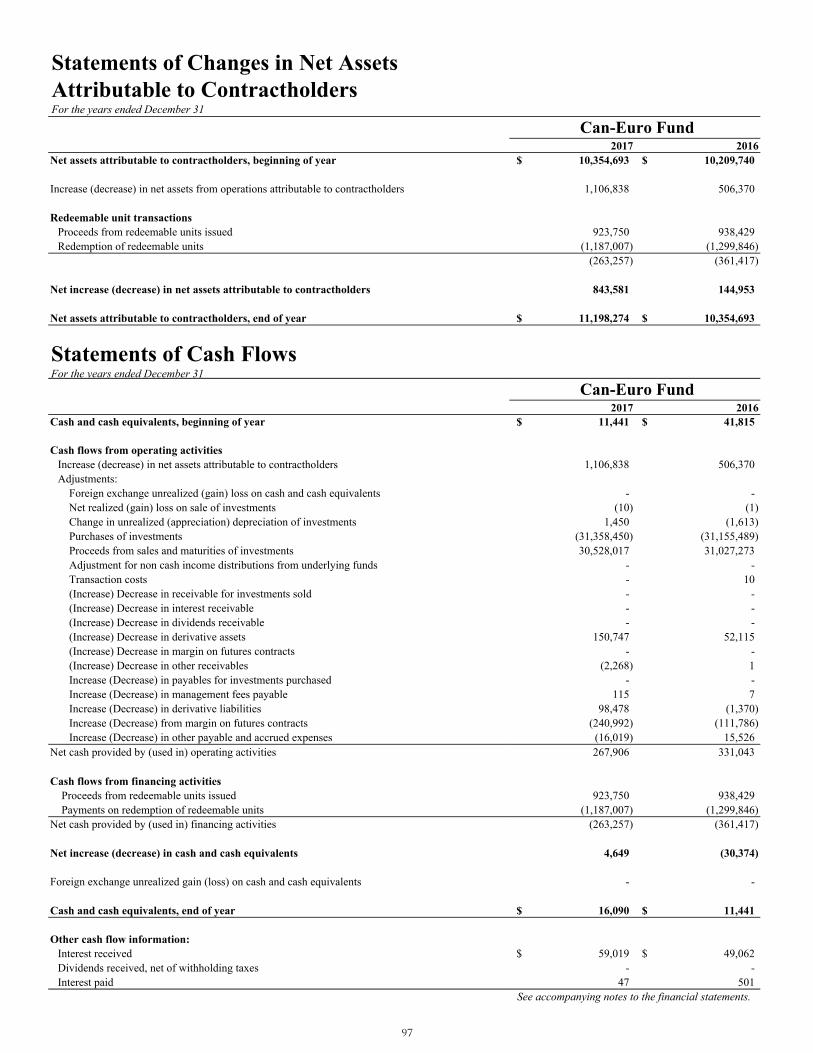
Statements of Changes in Net Assets Attributable to ContractholdersFor the years ended December 31
Net assets attributable to contractholders, beginning of year
Increase (decrease) in net assets from operations attributable to contractholders
Redeemable unit transactionsProceeds from redeemable units issuedRedemption of redeemable units
Net increase (decrease) in net assets attributable to contractholders
Net assets attributable to contractholders, end of year
Statements of Cash FlowsFor the years ended December 31
Cash and cash equivalents, beginning of year
Cash flows from operating activitiesIncrease (decrease) in net assets attributable to contractholdersAdjustments:
Foreign exchange unrealized (gain) loss on cash and cash equivalentsNet realized (gain) loss on sale of investmentsChange in unrealized (appreciation) depreciation of investmentsPurchases of investmentsProceeds from sales and maturities of investmentsAdjustment for non cash income distributions from underlying fundsTransaction costs(Increase) Decrease in receivable for investments sold(Increase) Decrease in interest receivable(Increase) Decrease in dividends receivable(Increase) Decrease in derivative assets(Increase) Decrease in margin on futures contracts(Increase) Decrease in other receivablesIncrease (Decrease) in payables for investments purchasedIncrease (Decrease) in management fees payableIncrease (Decrease) in derivative liabilitiesIncrease (Decrease) from margin on futures contractsIncrease (Decrease) in other payable and accrued expenses
Net cash provided by (used in) operating activities
Cash flows from financing activitiesProceeds from redeemable units issuedPayments on redemption of redeemable units
Net cash provided by (used in) financing activities
Net increase (decrease) in cash and cash equivalents
Foreign exchange unrealized gain (loss) on cash and cash equivalents
Cash and cash equivalents, end of year
Other cash flow information:Interest receivedDividends received, net of withholding taxesInterest paid
EUR
2017 2016$ 10,354,693 $ 10,209,740
1,106,838 506,370
923,750 938,429 (1,187,007) (1,299,846)
(263,257) (361,417)
843,581 144,953
$ 11,198,274 $ 10,354,693
2017 2016$ 11,441 $ 41,815
1,106,838 506,370
- - (10) (1)
1,450 (1,613) (31,358,450) (31,155,489) 30,528,017 31,027,273
- - - 10 - - - - - -
150,747 52,115 - -
(2,268) 1 - -
115 7 98,478 (1,370)
(240,992) (111,786) (16,019) 15,526 267,906 331,043
923,750 938,429 (1,187,007) (1,299,846)
(263,257) (361,417)
4,649 (30,374)
- -
$ 16,090 $ 11,441
$ 59,019 $ 49,062 - -
47 501 See accompanying notes to the financial statements.
Can-Euro Fund
Can-Euro Fund
97
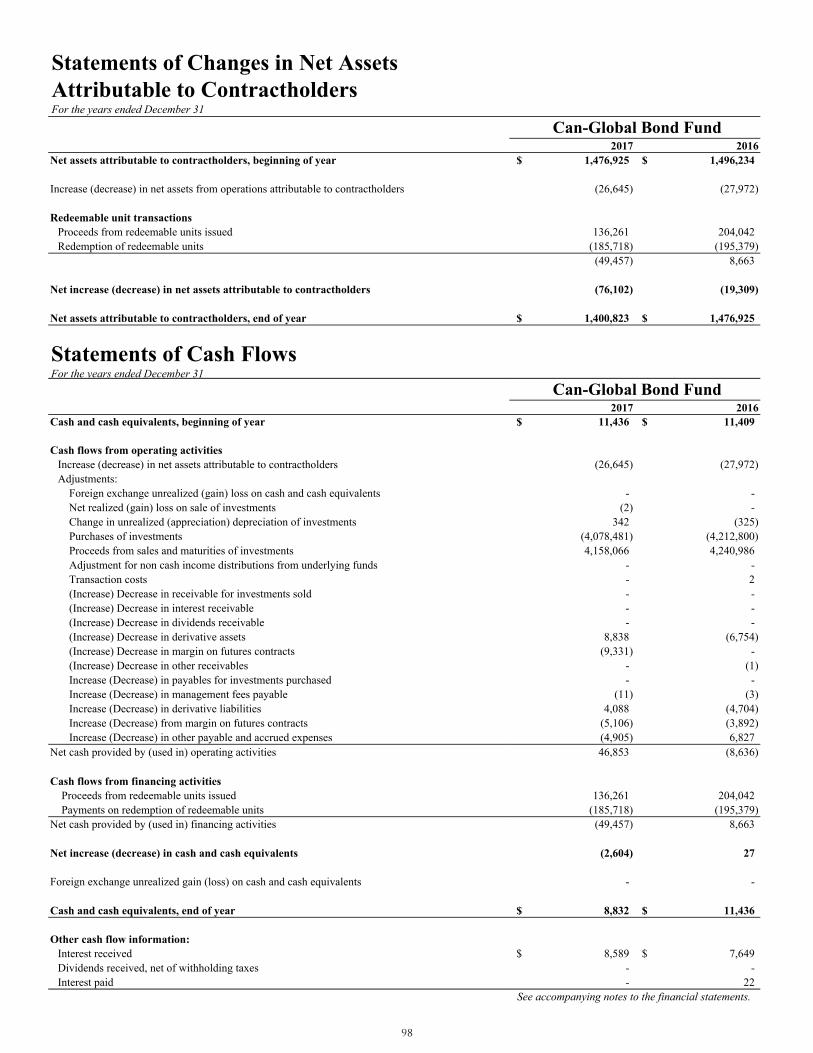
Statements of Changes in Net Assets Attributable to ContractholdersFor the years ended December 31
Net assets attributable to contractholders, beginning of year
Increase (decrease) in net assets from operations attributable to contractholders
Redeemable unit transactionsProceeds from redeemable units issuedRedemption of redeemable units
Net increase (decrease) in net assets attributable to contractholders
Net assets attributable to contractholders, end of year
Statements of Cash FlowsFor the years ended December 31
Cash and cash equivalents, beginning of year
Cash flows from operating activitiesIncrease (decrease) in net assets attributable to contractholdersAdjustments:
Foreign exchange unrealized (gain) loss on cash and cash equivalentsNet realized (gain) loss on sale of investmentsChange in unrealized (appreciation) depreciation of investmentsPurchases of investmentsProceeds from sales and maturities of investmentsAdjustment for non cash income distributions from underlying fundsTransaction costs(Increase) Decrease in receivable for investments sold(Increase) Decrease in interest receivable(Increase) Decrease in dividends receivable(Increase) Decrease in derivative assets(Increase) Decrease in margin on futures contracts(Increase) Decrease in other receivablesIncrease (Decrease) in payables for investments purchasedIncrease (Decrease) in management fees payableIncrease (Decrease) in derivative liabilitiesIncrease (Decrease) from margin on futures contractsIncrease (Decrease) in other payable and accrued expenses
Net cash provided by (used in) operating activities
Cash flows from financing activitiesProceeds from redeemable units issuedPayments on redemption of redeemable units
Net cash provided by (used in) financing activities
Net increase (decrease) in cash and cash equivalents
Foreign exchange unrealized gain (loss) on cash and cash equivalents
Cash and cash equivalents, end of year
Other cash flow information:Interest receivedDividends received, net of withholding taxesInterest paid
GBO
2017 2016$ 1,476,925 $ 1,496,234
(26,645) (27,972)
136,261 204,042 (185,718) (195,379) (49,457) 8,663
(76,102) (19,309)
$ 1,400,823 $ 1,476,925
2017 2016$ 11,436 $ 11,409
(26,645) (27,972)
- - (2) -
342 (325) (4,078,481) (4,212,800) 4,158,066 4,240,986
- - - 2 - - - - - -
8,838 (6,754) (9,331) -
- (1) - -
(11) (3) 4,088 (4,704)
(5,106) (3,892) (4,905) 6,827 46,853 (8,636)
136,261 204,042 (185,718) (195,379) (49,457) 8,663
(2,604) 27
- -
$ 8,832 $ 11,436
$ 8,589 $ 7,649 - - - 22
See accompanying notes to the financial statements.
Can-Global Bond Fund
Can-Global Bond Fund
98
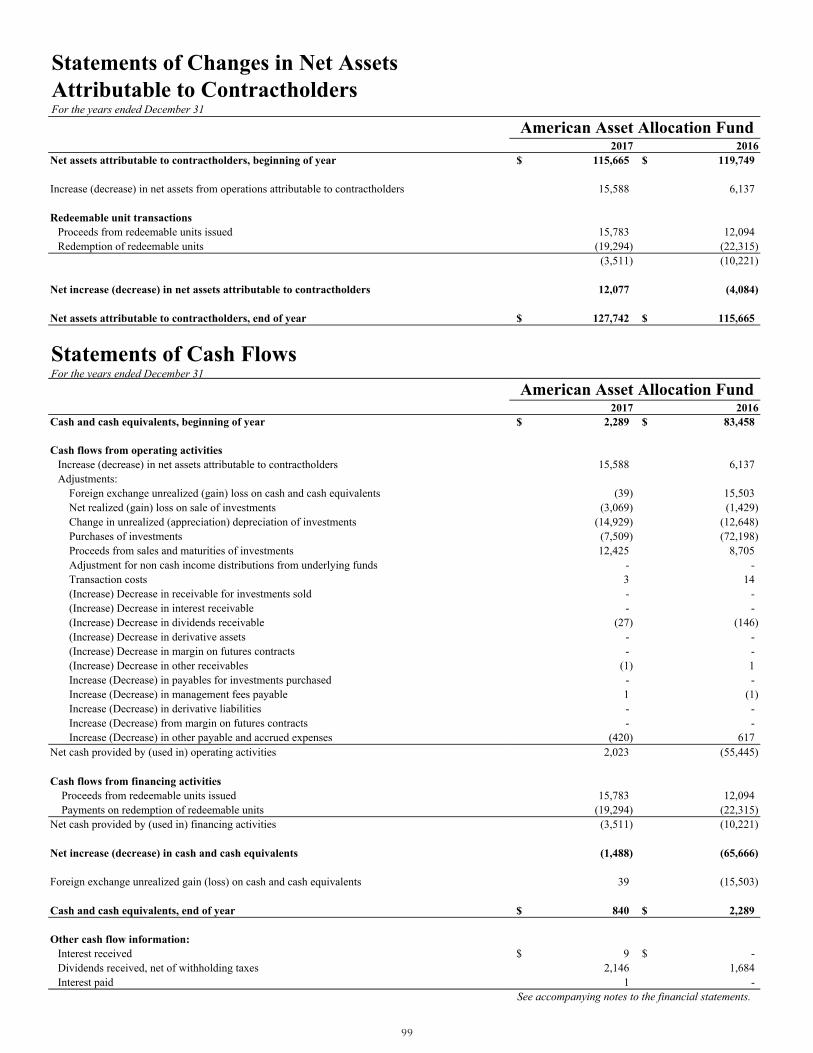
Statements of Changes in Net Assets Attributable to ContractholdersFor the years ended December 31
Net assets attributable to contractholders, beginning of year
Increase (decrease) in net assets from operations attributable to contractholders
Redeemable unit transactionsProceeds from redeemable units issuedRedemption of redeemable units
Net increase (decrease) in net assets attributable to contractholders
Net assets attributable to contractholders, end of year
Statements of Cash FlowsFor the years ended December 31
Cash and cash equivalents, beginning of year
Cash flows from operating activitiesIncrease (decrease) in net assets attributable to contractholdersAdjustments:
Foreign exchange unrealized (gain) loss on cash and cash equivalentsNet realized (gain) loss on sale of investmentsChange in unrealized (appreciation) depreciation of investmentsPurchases of investmentsProceeds from sales and maturities of investmentsAdjustment for non cash income distributions from underlying fundsTransaction costs(Increase) Decrease in receivable for investments sold(Increase) Decrease in interest receivable(Increase) Decrease in dividends receivable(Increase) Decrease in derivative assets(Increase) Decrease in margin on futures contracts(Increase) Decrease in other receivablesIncrease (Decrease) in payables for investments purchasedIncrease (Decrease) in management fees payableIncrease (Decrease) in derivative liabilitiesIncrease (Decrease) from margin on futures contractsIncrease (Decrease) in other payable and accrued expenses
Net cash provided by (used in) operating activities
Cash flows from financing activitiesProceeds from redeemable units issuedPayments on redemption of redeemable units
Net cash provided by (used in) financing activities
Net increase (decrease) in cash and cash equivalents
Foreign exchange unrealized gain (loss) on cash and cash equivalents
Cash and cash equivalents, end of year
Other cash flow information:Interest receivedDividends received, net of withholding taxesInterest paid
AAA
2017 2016$ 115,665 $ 119,749
15,588 6,137
15,783 12,094 (19,294) (22,315) (3,511) (10,221)
12,077 (4,084)
$ 127,742 $ 115,665
2017 2016$ 2,289 $ 83,458
15,588 6,137
(39) 15,503 (3,069) (1,429)
(14,929) (12,648) (7,509) (72,198) 12,425 8,705
- - 3 14 - - - -
(27) (146) - - - -
(1) 1 - - 1 (1) - - - -
(420) 617 2,023 (55,445)
15,783 12,094 (19,294) (22,315) (3,511) (10,221)
(1,488) (65,666)
39 (15,503)
$ 840 $ 2,289
$ 9 $ - 2,146 1,684
1 - See accompanying notes to the financial statements.
American Asset Allocation Fund
American Asset Allocation Fund
99
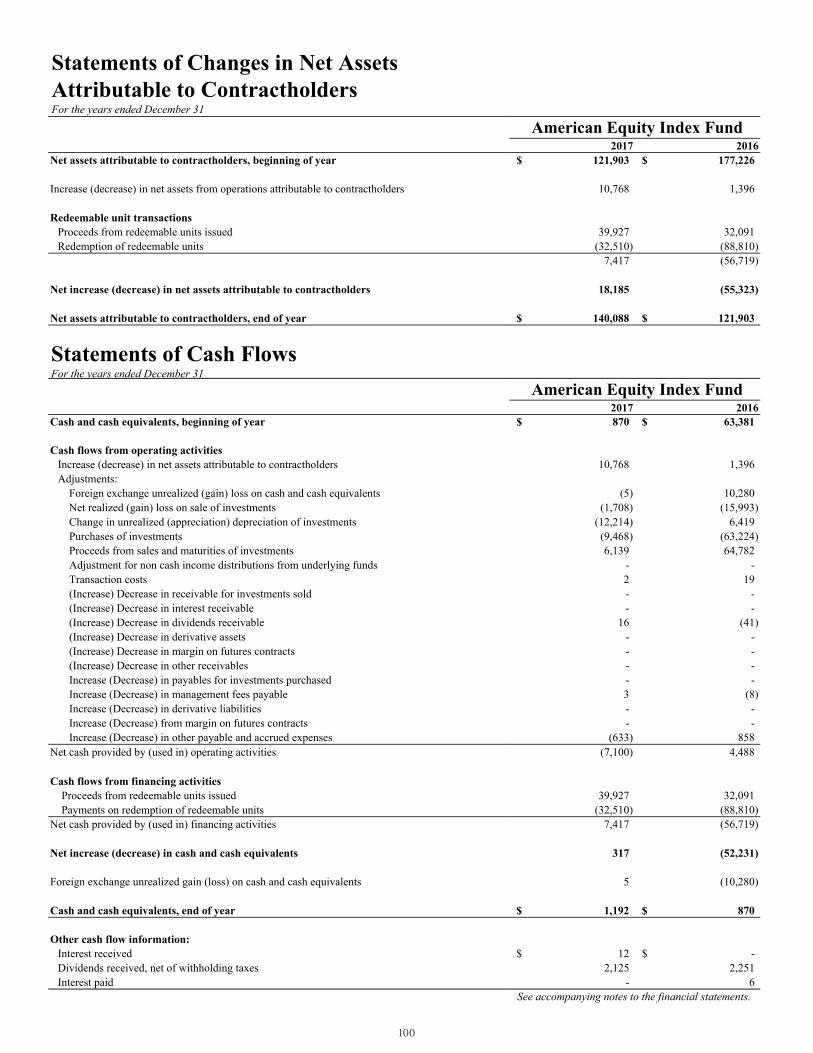
Statements of Changes in Net Assets Attributable to ContractholdersFor the years ended December 31
Net assets attributable to contractholders, beginning of year
Increase (decrease) in net assets from operations attributable to contractholders
Redeemable unit transactionsProceeds from redeemable units issuedRedemption of redeemable units
Net increase (decrease) in net assets attributable to contractholders
Net assets attributable to contractholders, end of year
Statements of Cash FlowsFor the years ended December 31
Cash and cash equivalents, beginning of year
Cash flows from operating activitiesIncrease (decrease) in net assets attributable to contractholdersAdjustments:
Foreign exchange unrealized (gain) loss on cash and cash equivalentsNet realized (gain) loss on sale of investmentsChange in unrealized (appreciation) depreciation of investmentsPurchases of investmentsProceeds from sales and maturities of investmentsAdjustment for non cash income distributions from underlying fundsTransaction costs(Increase) Decrease in receivable for investments sold(Increase) Decrease in interest receivable(Increase) Decrease in dividends receivable(Increase) Decrease in derivative assets(Increase) Decrease in margin on futures contracts(Increase) Decrease in other receivablesIncrease (Decrease) in payables for investments purchasedIncrease (Decrease) in management fees payableIncrease (Decrease) in derivative liabilitiesIncrease (Decrease) from margin on futures contractsIncrease (Decrease) in other payable and accrued expenses
Net cash provided by (used in) operating activities
Cash flows from financing activitiesProceeds from redeemable units issuedPayments on redemption of redeemable units
Net cash provided by (used in) financing activities
Net increase (decrease) in cash and cash equivalents
Foreign exchange unrealized gain (loss) on cash and cash equivalents
Cash and cash equivalents, end of year
Other cash flow information:Interest receivedDividends received, net of withholding taxesInterest paid
AEI
2017 2016$ 121,903 $ 177,226
10,768 1,396
39,927 32,091 (32,510) (88,810)
7,417 (56,719)
18,185 (55,323)
$ 140,088 $ 121,903
2017 2016$ 870 $ 63,381
10,768 1,396
(5) 10,280 (1,708) (15,993)
(12,214) 6,419 (9,468) (63,224) 6,139 64,782
- - 2 19 - - - -
16 (41) - - - - - - - - 3 (8) - - - -
(633) 858 (7,100) 4,488
39,927 32,091 (32,510) (88,810)
7,417 (56,719)
317 (52,231)
5 (10,280)
$ 1,192 $ 870
$ 12 $ - 2,125 2,251
- 6 See accompanying notes to the financial statements.
American Equity Index Fund
American Equity Index Fund
100
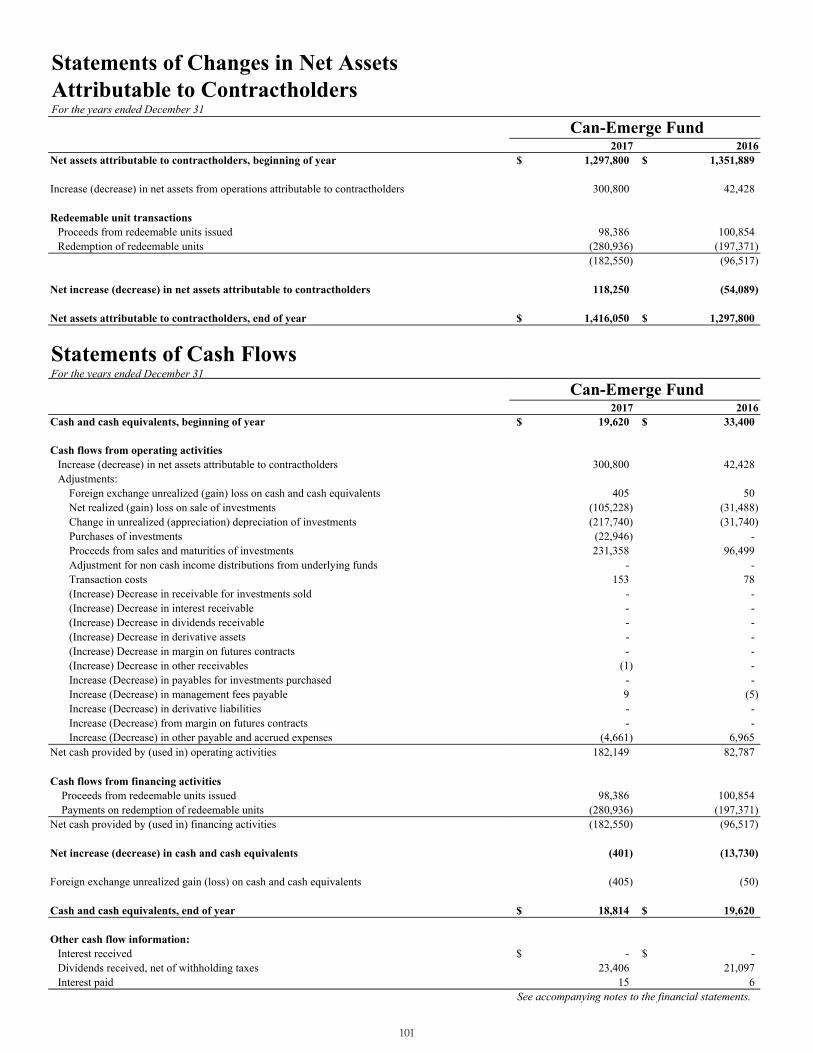
Statements of Changes in Net Assets Attributable to ContractholdersFor the years ended December 31
Net assets attributable to contractholders, beginning of year
Increase (decrease) in net assets from operations attributable to contractholders
Redeemable unit transactionsProceeds from redeemable units issuedRedemption of redeemable units
Net increase (decrease) in net assets attributable to contractholders
Net assets attributable to contractholders, end of year
Statements of Cash FlowsFor the years ended December 31
Cash and cash equivalents, beginning of year
Cash flows from operating activitiesIncrease (decrease) in net assets attributable to contractholdersAdjustments:
Foreign exchange unrealized (gain) loss on cash and cash equivalentsNet realized (gain) loss on sale of investmentsChange in unrealized (appreciation) depreciation of investmentsPurchases of investmentsProceeds from sales and maturities of investmentsAdjustment for non cash income distributions from underlying fundsTransaction costs(Increase) Decrease in receivable for investments sold(Increase) Decrease in interest receivable(Increase) Decrease in dividends receivable(Increase) Decrease in derivative assets(Increase) Decrease in margin on futures contracts(Increase) Decrease in other receivablesIncrease (Decrease) in payables for investments purchasedIncrease (Decrease) in management fees payableIncrease (Decrease) in derivative liabilitiesIncrease (Decrease) from margin on futures contractsIncrease (Decrease) in other payable and accrued expenses
Net cash provided by (used in) operating activities
Cash flows from financing activitiesProceeds from redeemable units issuedPayments on redemption of redeemable units
Net cash provided by (used in) financing activities
Net increase (decrease) in cash and cash equivalents
Foreign exchange unrealized gain (loss) on cash and cash equivalents
Cash and cash equivalents, end of year
Other cash flow information:Interest receivedDividends received, net of withholding taxesInterest paid
EMR
2017 2016$ 1,297,800 $ 1,351,889
300,800 42,428
98,386 100,854 (280,936) (197,371) (182,550) (96,517)
118,250 (54,089)
$ 1,416,050 $ 1,297,800
2017 2016$ 19,620 $ 33,400
300,800 42,428
405 50 (105,228) (31,488) (217,740) (31,740) (22,946) - 231,358 96,499
- - 153 78
- - - - - - - - - -
(1) - - - 9 (5) - - - -
(4,661) 6,965 182,149 82,787
98,386 100,854 (280,936) (197,371) (182,550) (96,517)
(401) (13,730)
(405) (50)
$ 18,814 $ 19,620
$ - $ - 23,406 21,097
15 6 See accompanying notes to the financial statements.
Can-Emerge Fund
Can-Emerge Fund
101
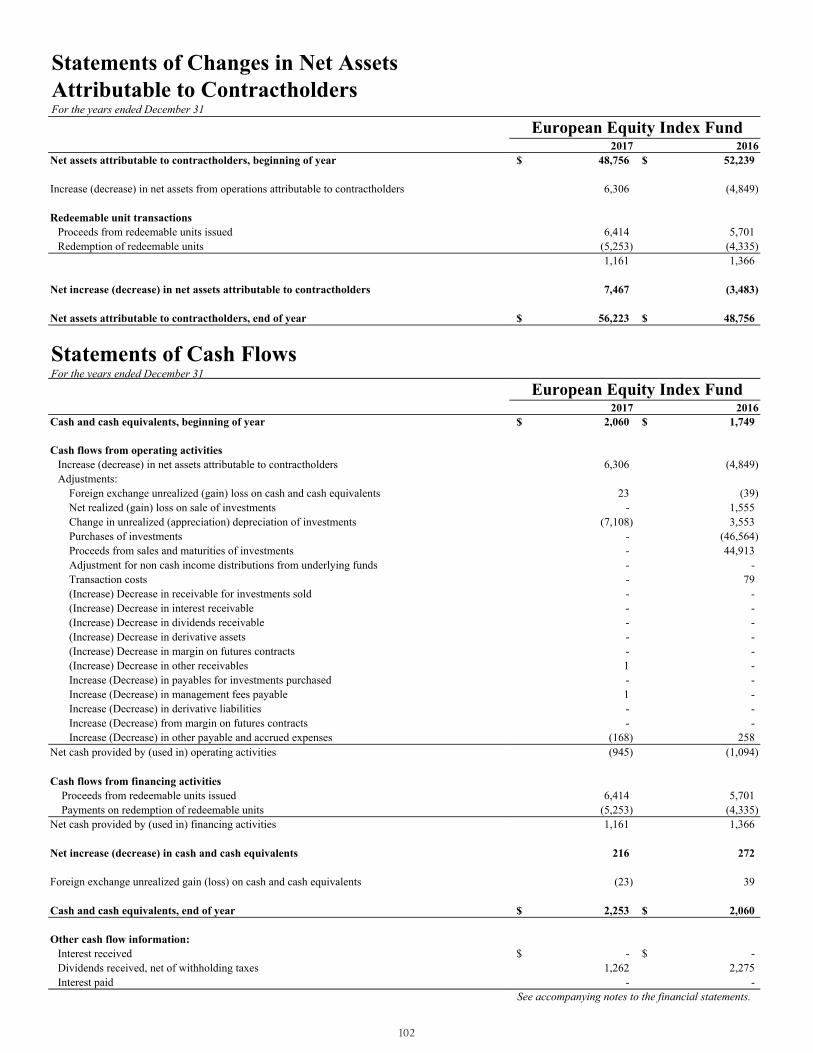
Statements of Changes in Net Assets Attributable to ContractholdersFor the years ended December 31
Net assets attributable to contractholders, beginning of year
Increase (decrease) in net assets from operations attributable to contractholders
Redeemable unit transactionsProceeds from redeemable units issuedRedemption of redeemable units
Net increase (decrease) in net assets attributable to contractholders
Net assets attributable to contractholders, end of year
Statements of Cash FlowsFor the years ended December 31
Cash and cash equivalents, beginning of year
Cash flows from operating activitiesIncrease (decrease) in net assets attributable to contractholdersAdjustments:
Foreign exchange unrealized (gain) loss on cash and cash equivalentsNet realized (gain) loss on sale of investmentsChange in unrealized (appreciation) depreciation of investmentsPurchases of investmentsProceeds from sales and maturities of investmentsAdjustment for non cash income distributions from underlying fundsTransaction costs(Increase) Decrease in receivable for investments sold(Increase) Decrease in interest receivable(Increase) Decrease in dividends receivable(Increase) Decrease in derivative assets(Increase) Decrease in margin on futures contracts(Increase) Decrease in other receivablesIncrease (Decrease) in payables for investments purchasedIncrease (Decrease) in management fees payableIncrease (Decrease) in derivative liabilitiesIncrease (Decrease) from margin on futures contractsIncrease (Decrease) in other payable and accrued expenses
Net cash provided by (used in) operating activities
Cash flows from financing activitiesProceeds from redeemable units issuedPayments on redemption of redeemable units
Net cash provided by (used in) financing activities
Net increase (decrease) in cash and cash equivalents
Foreign exchange unrealized gain (loss) on cash and cash equivalents
Cash and cash equivalents, end of year
Other cash flow information:Interest receivedDividends received, net of withholding taxesInterest paid
EEI
2017 2016$ 48,756 $ 52,239
6,306 (4,849)
6,414 5,701 (5,253) (4,335) 1,161 1,366
7,467 (3,483)
$ 56,223 $ 48,756
2017 2016$ 2,060 $ 1,749
6,306 (4,849)
23 (39) - 1,555
(7,108) 3,553 - (46,564) - 44,913 - - - 79 - - - - - - - - - - 1 - - - 1 - - - - -
(168) 258 (945) (1,094)
6,414 5,701 (5,253) (4,335) 1,161 1,366
216 272
(23) 39
$ 2,253 $ 2,060
$ - $ - 1,262 2,275
- - See accompanying notes to the financial statements.
European Equity Index Fund
European Equity Index Fund
102
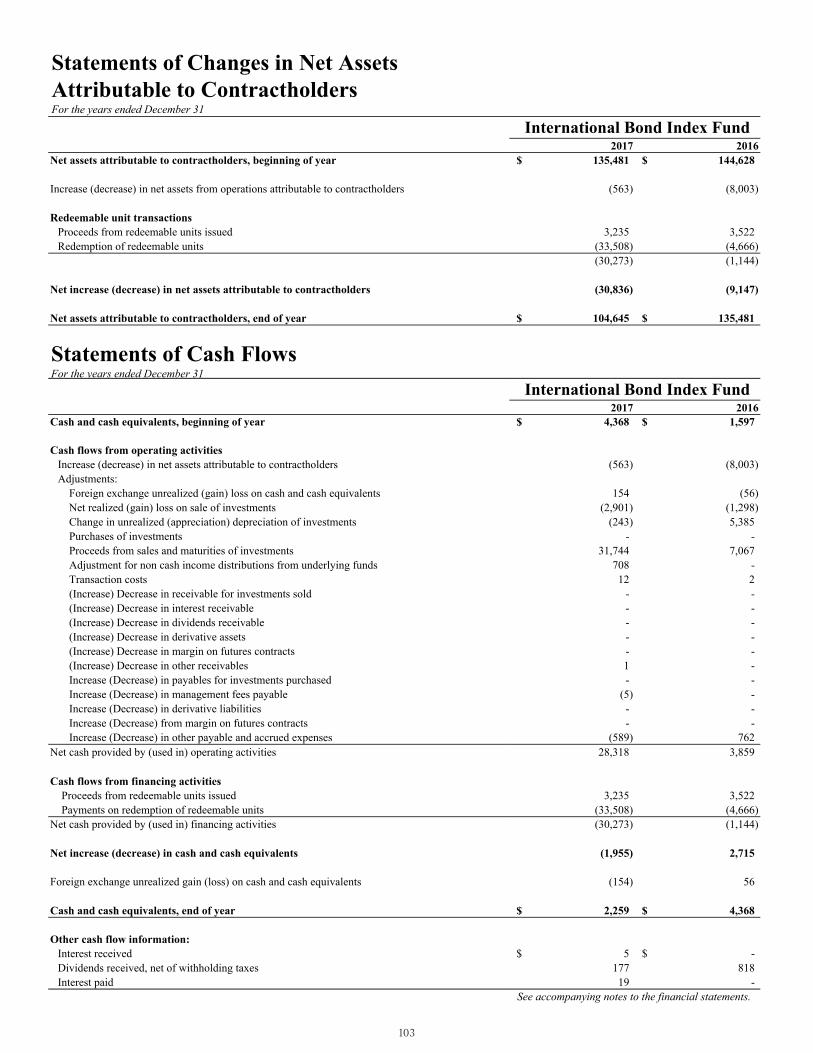
Statements of Changes in Net Assets Attributable to ContractholdersFor the years ended December 31
Net assets attributable to contractholders, beginning of year
Increase (decrease) in net assets from operations attributable to contractholders
Redeemable unit transactionsProceeds from redeemable units issuedRedemption of redeemable units
Net increase (decrease) in net assets attributable to contractholders
Net assets attributable to contractholders, end of year
Statements of Cash FlowsFor the years ended December 31
Cash and cash equivalents, beginning of year
Cash flows from operating activitiesIncrease (decrease) in net assets attributable to contractholdersAdjustments:
Foreign exchange unrealized (gain) loss on cash and cash equivalentsNet realized (gain) loss on sale of investmentsChange in unrealized (appreciation) depreciation of investmentsPurchases of investmentsProceeds from sales and maturities of investmentsAdjustment for non cash income distributions from underlying fundsTransaction costs(Increase) Decrease in receivable for investments sold(Increase) Decrease in interest receivable(Increase) Decrease in dividends receivable(Increase) Decrease in derivative assets(Increase) Decrease in margin on futures contracts(Increase) Decrease in other receivablesIncrease (Decrease) in payables for investments purchasedIncrease (Decrease) in management fees payableIncrease (Decrease) in derivative liabilitiesIncrease (Decrease) from margin on futures contractsIncrease (Decrease) in other payable and accrued expenses
Net cash provided by (used in) operating activities
Cash flows from financing activitiesProceeds from redeemable units issuedPayments on redemption of redeemable units
Net cash provided by (used in) financing activities
Net increase (decrease) in cash and cash equivalents
Foreign exchange unrealized gain (loss) on cash and cash equivalents
Cash and cash equivalents, end of year
Other cash flow information:Interest receivedDividends received, net of withholding taxesInterest paid
IBI
2017 2016$ 135,481 $ 144,628
(563) (8,003)
3,235 3,522 (33,508) (4,666) (30,273) (1,144)
(30,836) (9,147)
$ 104,645 $ 135,481
2017 2016$ 4,368 $ 1,597
(563) (8,003)
154 (56) (2,901) (1,298)
(243) 5,385 - -
31,744 7,067 708 - 12 2
- - - - - - - - - - 1 - - -
(5) - - - - -
(589) 762 28,318 3,859
3,235 3,522 (33,508) (4,666) (30,273) (1,144)
(1,955) 2,715
(154) 56
$ 2,259 $ 4,368
$ 5 $ - 177 818 19 -
See accompanying notes to the financial statements.
International Bond Index Fund
International Bond Index Fund
103

Statements of Changes in Net Assets Attributable to ContractholdersFor the years ended December 31
Net assets attributable to contractholders, beginning of year
Increase (decrease) in net assets from operations attributable to contractholders
Redeemable unit transactionsProceeds from redeemable units issuedRedemption of redeemable units
Net increase (decrease) in net assets attributable to contractholders
Net assets attributable to contractholders, end of year
Statements of Cash FlowsFor the years ended December 31
Cash and cash equivalents, beginning of year
Cash flows from operating activitiesIncrease (decrease) in net assets attributable to contractholdersAdjustments:
Foreign exchange unrealized (gain) loss on cash and cash equivalentsNet realized (gain) loss on sale of investmentsChange in unrealized (appreciation) depreciation of investmentsPurchases of investmentsProceeds from sales and maturities of investmentsAdjustment for non cash income distributions from underlying fundsTransaction costs(Increase) Decrease in receivable for investments sold(Increase) Decrease in interest receivable(Increase) Decrease in dividends receivable(Increase) Decrease in derivative assets(Increase) Decrease in margin on futures contracts(Increase) Decrease in other receivablesIncrease (Decrease) in payables for investments purchasedIncrease (Decrease) in management fees payableIncrease (Decrease) in derivative liabilitiesIncrease (Decrease) from margin on futures contractsIncrease (Decrease) in other payable and accrued expenses
Net cash provided by (used in) operating activities
Cash flows from financing activitiesProceeds from redeemable units issuedPayments on redemption of redeemable units
Net cash provided by (used in) financing activities
Net increase (decrease) in cash and cash equivalents
Foreign exchange unrealized gain (loss) on cash and cash equivalents
Cash and cash equivalents, end of year
Other cash flow information:Interest receivedDividends received, net of withholding taxesInterest paid
ITF
2017 2016$ 201,349 $ 186,012
39,194 13,854
24,013 24,406 (26,237) (22,923) (2,224) 1,483
36,970 15,337
$ 238,319 $ 201,349
2017 2016$ 7,438 $ 2,123
39,194 13,854
14 (18) (6,173) (3,437)
(39,497) (15,229) - -
8,783 7,614 - - 5 5 - - - - - - - - - - - - - - 6 3 - - - -
(641) 1,022 1,691 3,814
24,013 24,406 (26,237) (22,923) (2,224) 1,483
(533) 5,297
(14) 18
$ 6,891 $ 7,438
$ - $ - 2,826 2,882
- - See accompanying notes to the financial statements.
Information Technology Fund
Information Technology Fund
104
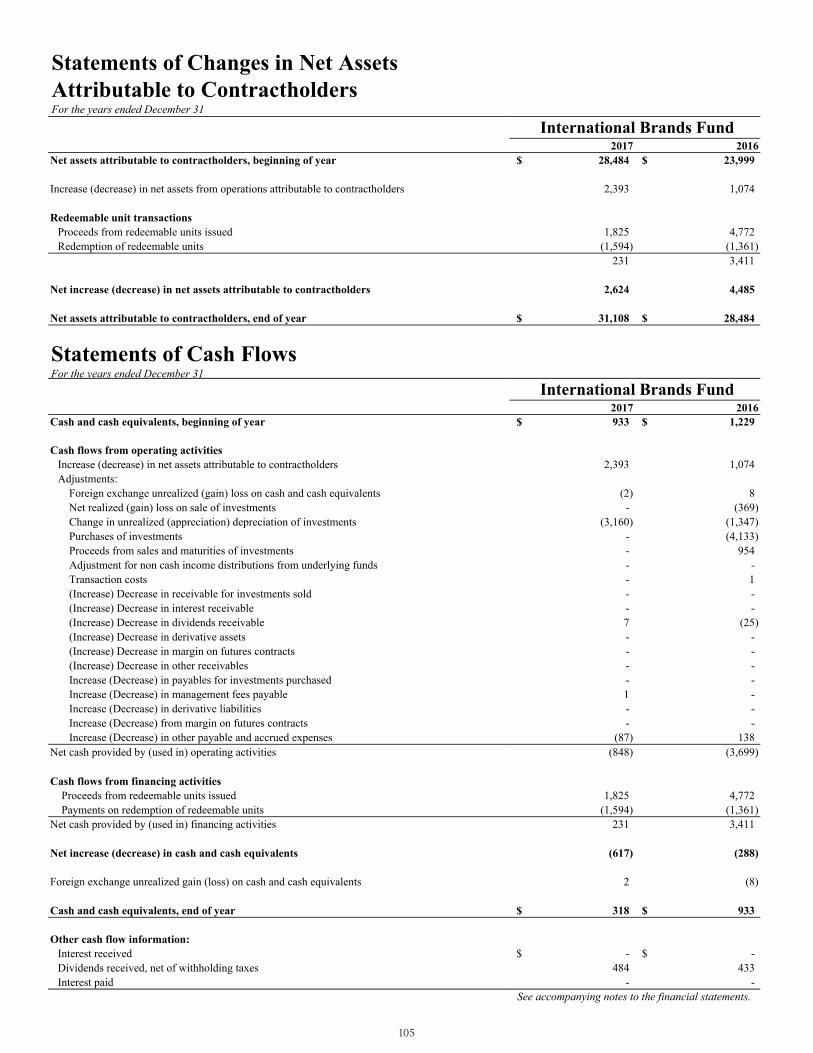
Statements of Changes in Net Assets Attributable to ContractholdersFor the years ended December 31
Net assets attributable to contractholders, beginning of year
Increase (decrease) in net assets from operations attributable to contractholders
Redeemable unit transactionsProceeds from redeemable units issuedRedemption of redeemable units
Net increase (decrease) in net assets attributable to contractholders
Net assets attributable to contractholders, end of year
Statements of Cash FlowsFor the years ended December 31
Cash and cash equivalents, beginning of year
Cash flows from operating activitiesIncrease (decrease) in net assets attributable to contractholdersAdjustments:
Foreign exchange unrealized (gain) loss on cash and cash equivalentsNet realized (gain) loss on sale of investmentsChange in unrealized (appreciation) depreciation of investmentsPurchases of investmentsProceeds from sales and maturities of investmentsAdjustment for non cash income distributions from underlying fundsTransaction costs(Increase) Decrease in receivable for investments sold(Increase) Decrease in interest receivable(Increase) Decrease in dividends receivable(Increase) Decrease in derivative assets(Increase) Decrease in margin on futures contracts(Increase) Decrease in other receivablesIncrease (Decrease) in payables for investments purchasedIncrease (Decrease) in management fees payableIncrease (Decrease) in derivative liabilitiesIncrease (Decrease) from margin on futures contractsIncrease (Decrease) in other payable and accrued expenses
Net cash provided by (used in) operating activities
Cash flows from financing activitiesProceeds from redeemable units issuedPayments on redemption of redeemable units
Net cash provided by (used in) financing activities
Net increase (decrease) in cash and cash equivalents
Foreign exchange unrealized gain (loss) on cash and cash equivalents
Cash and cash equivalents, end of year
Other cash flow information:Interest receivedDividends received, net of withholding taxesInterest paid
BRN
2017 2016$ 28,484 $ 23,999
2,393 1,074
1,825 4,772 (1,594) (1,361)
231 3,411
2,624 4,485
$ 31,108 $ 28,484
2017 2016$ 933 $ 1,229
2,393 1,074
(2) 8 - (369)
(3,160) (1,347) - (4,133) - 954 - - - 1 - - - - 7 (25) - - - - - - - - 1 - - - - -
(87) 138 (848) (3,699)
1,825 4,772 (1,594) (1,361)
231 3,411
(617) (288)
2 (8)
$ 318 $ 933
$ - $ - 484 433
- - See accompanying notes to the financial statements.
International Brands Fund
International Brands Fund
105
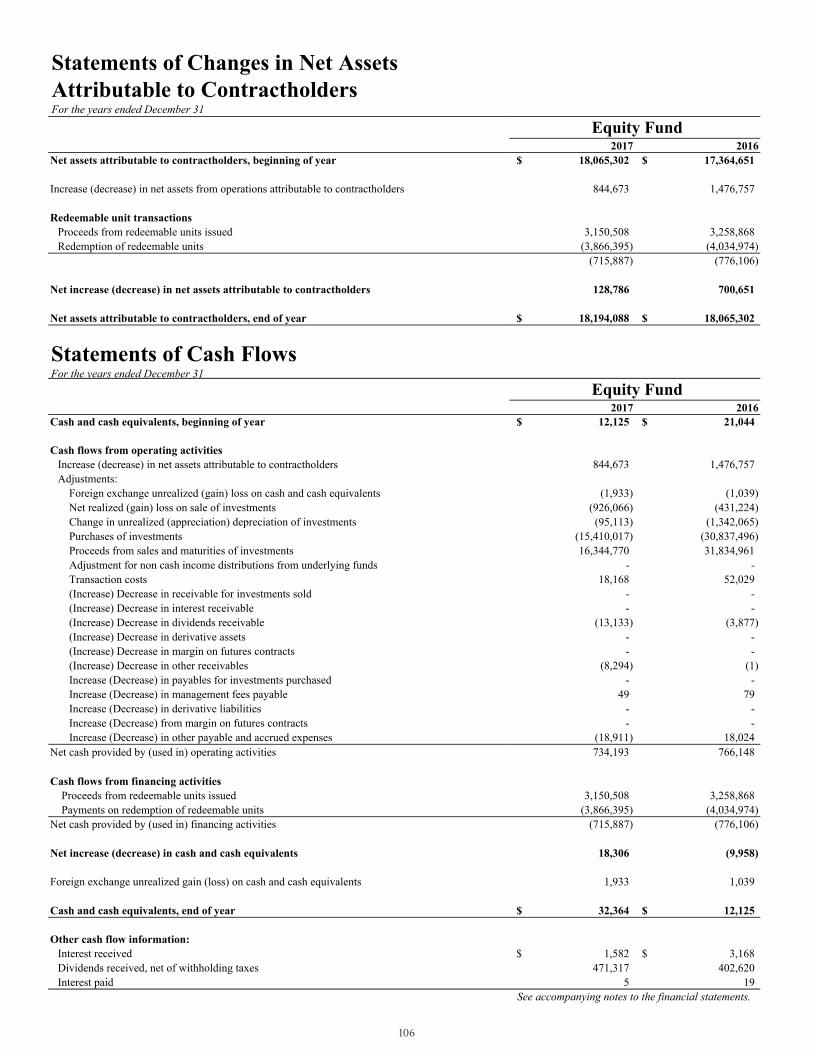
Statements of Changes in Net Assets Attributable to ContractholdersFor the years ended December 31
Net assets attributable to contractholders, beginning of year
Increase (decrease) in net assets from operations attributable to contractholders
Redeemable unit transactionsProceeds from redeemable units issuedRedemption of redeemable units
Net increase (decrease) in net assets attributable to contractholders
Net assets attributable to contractholders, end of year
Statements of Cash FlowsFor the years ended December 31
Cash and cash equivalents, beginning of year
Cash flows from operating activitiesIncrease (decrease) in net assets attributable to contractholdersAdjustments:
Foreign exchange unrealized (gain) loss on cash and cash equivalentsNet realized (gain) loss on sale of investmentsChange in unrealized (appreciation) depreciation of investmentsPurchases of investmentsProceeds from sales and maturities of investmentsAdjustment for non cash income distributions from underlying fundsTransaction costs(Increase) Decrease in receivable for investments sold(Increase) Decrease in interest receivable(Increase) Decrease in dividends receivable(Increase) Decrease in derivative assets(Increase) Decrease in margin on futures contracts(Increase) Decrease in other receivablesIncrease (Decrease) in payables for investments purchasedIncrease (Decrease) in management fees payableIncrease (Decrease) in derivative liabilitiesIncrease (Decrease) from margin on futures contractsIncrease (Decrease) in other payable and accrued expenses
Net cash provided by (used in) operating activities
Cash flows from financing activitiesProceeds from redeemable units issuedPayments on redemption of redeemable units
Net cash provided by (used in) financing activities
Net increase (decrease) in cash and cash equivalents
Foreign exchange unrealized gain (loss) on cash and cash equivalents
Cash and cash equivalents, end of year
Other cash flow information:Interest receivedDividends received, net of withholding taxesInterest paid
ULE
2017 2016$ 18,065,302 $ 17,364,651
844,673 1,476,757
3,150,508 3,258,868 (3,866,395) (4,034,974)
(715,887) (776,106)
128,786 700,651
$ 18,194,088 $ 18,065,302
2017 2016$ 12,125 $ 21,044
844,673 1,476,757
(1,933) (1,039) (926,066) (431,224) (95,113) (1,342,065)
(15,410,017) (30,837,496) 16,344,770 31,834,961
- - 18,168 52,029
- - - -
(13,133) (3,877) - - - -
(8,294) (1) - -
49 79 - - - -
(18,911) 18,024 734,193 766,148
3,150,508 3,258,868 (3,866,395) (4,034,974)
(715,887) (776,106)
18,306 (9,958)
1,933 1,039
$ 32,364 $ 12,125
$ 1,582 $ 3,168 471,317 402,620
5 19 See accompanying notes to the financial statements.
Equity Fund
Equity Fund
106
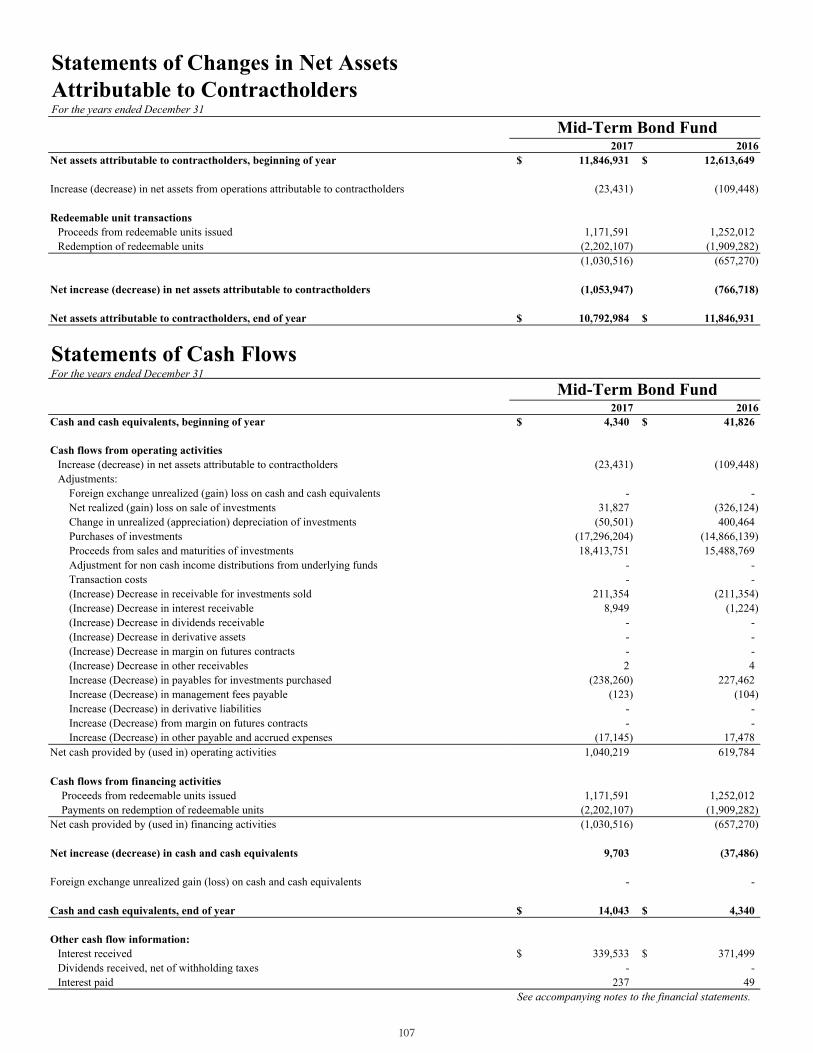
Statements of Changes in Net Assets Attributable to ContractholdersFor the years ended December 31
Net assets attributable to contractholders, beginning of year
Increase (decrease) in net assets from operations attributable to contractholders
Redeemable unit transactionsProceeds from redeemable units issuedRedemption of redeemable units
Net increase (decrease) in net assets attributable to contractholders
Net assets attributable to contractholders, end of year
Statements of Cash FlowsFor the years ended December 31
Cash and cash equivalents, beginning of year
Cash flows from operating activitiesIncrease (decrease) in net assets attributable to contractholdersAdjustments:
Foreign exchange unrealized (gain) loss on cash and cash equivalentsNet realized (gain) loss on sale of investmentsChange in unrealized (appreciation) depreciation of investmentsPurchases of investmentsProceeds from sales and maturities of investmentsAdjustment for non cash income distributions from underlying fundsTransaction costs(Increase) Decrease in receivable for investments sold(Increase) Decrease in interest receivable(Increase) Decrease in dividends receivable(Increase) Decrease in derivative assets(Increase) Decrease in margin on futures contracts(Increase) Decrease in other receivablesIncrease (Decrease) in payables for investments purchasedIncrease (Decrease) in management fees payableIncrease (Decrease) in derivative liabilitiesIncrease (Decrease) from margin on futures contractsIncrease (Decrease) in other payable and accrued expenses
Net cash provided by (used in) operating activities
Cash flows from financing activitiesProceeds from redeemable units issuedPayments on redemption of redeemable units
Net cash provided by (used in) financing activities
Net increase (decrease) in cash and cash equivalents
Foreign exchange unrealized gain (loss) on cash and cash equivalents
Cash and cash equivalents, end of year
Other cash flow information:Interest receivedDividends received, net of withholding taxesInterest paid
ULB
2017 2016$ 11,846,931 $ 12,613,649
(23,431) (109,448)
1,171,591 1,252,012 (2,202,107) (1,909,282) (1,030,516) (657,270)
(1,053,947) (766,718)
$ 10,792,984 $ 11,846,931
2017 2016$ 4,340 $ 41,826
(23,431) (109,448)
- - 31,827 (326,124)
(50,501) 400,464 (17,296,204) (14,866,139) 18,413,751 15,488,769
- - - -
211,354 (211,354) 8,949 (1,224)
- - - - - - 2 4
(238,260) 227,462 (123) (104)
- - - -
(17,145) 17,478 1,040,219 619,784
1,171,591 1,252,012 (2,202,107) (1,909,282) (1,030,516) (657,270)
9,703 (37,486)
- -
$ 14,043 $ 4,340
$ 339,533 $ 371,499 - -
237 49 See accompanying notes to the financial statements.
Mid-Term Bond Fund
Mid-Term Bond Fund
107
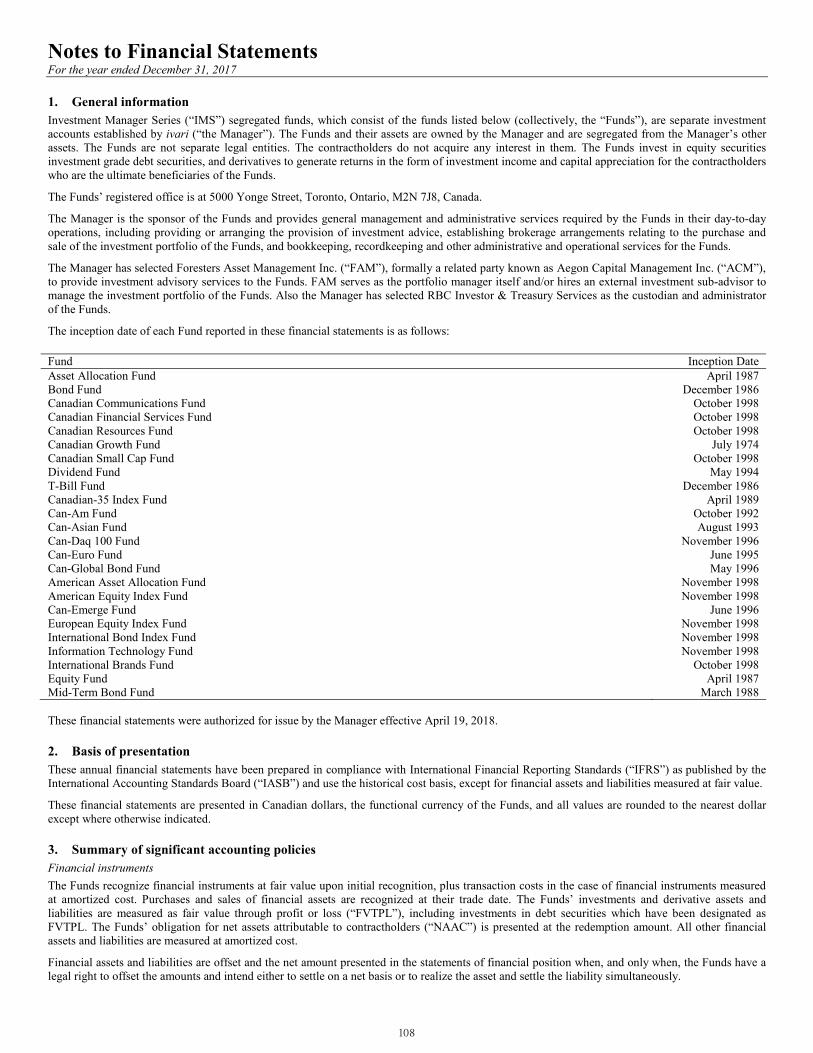
Notes to Financial Statements For the year ended December 31, 2017 1. General information Investment Manager Series (“IMS”) segregated funds, which consist of the funds listed below (collectively, the “Funds”), are separate investment accounts established by ivari (“the Manager”). The Funds and their assets are owned by the Manager and are segregated from the Manager’s other assets. The Funds are not separate legal entities. The contractholders do not acquire any interest in them. The Funds invest in equity securities investment grade debt securities, and derivatives to generate returns in the form of investment income and capital appreciation for the contractholders who are the ultimate beneficiaries of the Funds.
The Funds’ registered office is at 5000 Yonge Street, Toronto, Ontario, M2N 7J8, Canada.
The Manager is the sponsor of the Funds and provides general management and administrative services required by the Funds in their day-to-day operations, including providing or arranging the provision of investment advice, establishing brokerage arrangements relating to the purchase and sale of the investment portfolio of the Funds, and bookkeeping, recordkeeping and other administrative and operational services for the Funds.
The Manager has selected Foresters Asset Management Inc. (“FAM”), formally a related party known as Aegon Capital Management Inc. (“ACM”), to provide investment advisory services to the Funds. FAM serves as the portfolio manager itself and/or hires an external investment sub-advisor to manage the investment portfolio of the Funds. Also the Manager has selected RBC Investor & Treasury Services as the custodian and administrator of the Funds.
The inception date of each Fund reported in these financial statements is as follows:
Fund Inception Date Asset Allocation Fund April 1987 Bond Fund December 1986 Canadian Communications Fund October 1998 Canadian Financial Services Fund October 1998 Canadian Resources Fund October 1998 Canadian Growth Fund July 1974 Canadian Small Cap Fund October 1998 Dividend Fund May 1994 T-Bill Fund December 1986 Canadian-35 Index Fund April 1989 Can-Am Fund October 1992 Can-Asian Fund August 1993 Can-Daq 100 Fund November 1996 Can-Euro Fund June 1995 Can-Global Bond Fund May 1996 American Asset Allocation Fund November 1998 American Equity Index Fund November 1998 Can-Emerge Fund June 1996 European Equity Index Fund November 1998 International Bond Index Fund November 1998 Information Technology Fund November 1998 International Brands Fund October 1998 Equity Fund April 1987 Mid-Term Bond Fund March 1988 These financial statements were authorized for issue by the Manager effective April 19, 2018.
2. Basis of presentation These annual financial statements have been prepared in compliance with International Financial Reporting Standards (“IFRS”) as published by the International Accounting Standards Board (“IASB”) and use the historical cost basis, except for financial assets and liabilities measured at fair value.
These financial statements are presented in Canadian dollars, the functional currency of the Funds, and all values are rounded to the nearest dollar except where otherwise indicated.
3. Summary of significant accounting policies Financial instruments The Funds recognize financial instruments at fair value upon initial recognition, plus transaction costs in the case of financial instruments measured at amortized cost. Purchases and sales of financial assets are recognized at their trade date. The Funds’ investments and derivative assets and liabilities are measured as fair value through profit or loss (“FVTPL”), including investments in debt securities which have been designated as FVTPL. The Funds’ obligation for net assets attributable to contractholders (“NAAC”) is presented at the redemption amount. All other financial assets and liabilities are measured at amortized cost.
Financial assets and liabilities are offset and the net amount presented in the statements of financial position when, and only when, the Funds have a legal right to offset the amounts and intend either to settle on a net basis or to realize the asset and settle the liability simultaneously.
108
Notes to Financial Statements For the year ended December 31, 2017 Valuation of investments Fair value is the price that would be received to sell an asset or paid to transfer a liability in an orderly transaction between market participants at the measurement date. The fair values of financial assets and liabilities traded in active markets (such as publicly traded derivatives and marketable securities) are based on quoted market prices at the close of trading on the reporting date. The Funds use the closing bid prices for financial assets and closing ask prices for financial liabilities. The Funds’ policy is to recognize transfers in and out of the fair value hierarchy levels as at the end of the reporting period for transfers between Level 1 and 2 and as at the date of the transfer for transfers in and out of Level 3.
The Canadian Life and Health Insurance Association (“CLHIA”) requires the Net Asset Value (“NAV”) of a segregated fund for contractholder transactions be based on fair value of the segregated fund’s assets and liabilities, in accordance with the valuation rules set out in the Fund’s information folder. The NAAC per unit and NAV per unit are disclosed in Note 13. The Funds have not changed their methodology with respect to calculating NAV. The fair values of the investments on the schedule of investment portfolio, for reporting NAAC for financial reporting purposes and for calculating daily NAVs, are determined as follows: a) Securities listed on a recognized public stock exchange are stated at their bid prices on the valuation date for reporting NAAC and at their close
prices on the valuation date for determining daily NAV.
b) Securities not listed on a recognized public stock exchange are valued based upon available public quotations in common use or at prices estimated to be fair value as determined by the Manager of the applicable Fund.
c) Short term investments are stated at amortized cost which, given the short term nature of the investments, approximates fair value.
d) Bonds are stated at their bid prices on the valuation date for reporting NAAC. They are valued at the average of the closing bid and ask prices provided by recognized investment dealers on the valuation date for determining daily NAV. For both NAAC and NAV, unlisted convertible debentures are valued at cost, if the underlying security is less than the conversion price; or if the underlying security is greater than the conversion price, at the market value of the underlying security multiplied by the number of shares to be received.
e) Mutual fund units held are priced using the NAV per unit as of the valuation date of the particular fund.
f) Futures contracts are valued at the settlement prices established on each day by the Board of Trade or exchange on which they are traded. The value of a contract is a gain or loss that would be realized upon closure. Gains or losses on open contracts are marked-to-market daily and are recorded in the statements of comprehensive income.
g) Foreign exchange forward contracts are valued at the gain or loss that would arise as a result of closing the position at the valuation date. Gains or losses are marked-to-market daily and recorded in the statements of comprehensive income.
Financial assets and liabilities The Funds’ assets and liabilities may be classified as either FVTPL or held for trading (“HFT”). a) Financial assets and financial liabilities designated as FVTPL
Financial assets and financial liabilities designated as FVTPL are managed and their performance is evaluated on a fair value basis in accordance with the Funds’ documented investment strategy. During 2017 and 2016, the Funds’ financial instruments were all designated as FVTPL.
b) Financial assets and financial liabilities held for trading A financial asset or financial liability is classified as HFT if it is acquired or incurred principally for the purpose of selling or repurchasing in the near term, or if on initial recognition is part of a portfolio of identifiable financial investments that are managed together and for which there is evidence of a recent actual pattern of short term profit taking. In 2017 and 2016, the Funds did not hold securities categorized as HFT.
Investment transactions, income recognition and transaction cost Investment transactions are recorded on the trade date, which is the date on which the Fund commits to purchase or sell the investment. Net gain or loss on investments in the statements of comprehensive income includes the interest for distribution purposes that represents the coupon interest received by the Funds accounted for on an accrual basis. The Funds do not amortize premiums paid or discounts received on the purchase of fixed income securities, except for zero coupon bonds, which are amortized on a straight-line basis. Dividend income from financial assets as FVTPL is recognized when the Fund’s right to receive payments is established. Distributions from underlying funds are recorded on the distribution date. Realized gains and losses from investment transactions are calculated on an average cost basis. Unrealized gains and losses are determined using the difference between the fair value and average cost.
Transaction costs are costs incurred to acquire financial assets or liabilities. They include fees and commissions paid to agents, advisers, brokers and dealers. Transaction costs are included in the cost of investments purchased or are a reduction in the proceeds received on the sale of an investment. These costs are immediately recognized in profit or loss as an expense in the statements of comprehensive income.
Receivable for investments sold / payable for investments purchased Receivable for investments sold and payable for investments purchased represent investment transactions that have been contracted for but not yet settled or delivered on the statements of financial position date respectively. These amounts are recognized initially at fair value and subsequently measured at amortized cost, less provision for impairment for amounts receivable for investments sold. A provision for impairment of amounts receivable for investments sold is established when there is objective
109
Notes to Financial Statements For the year ended December 31, 2017 evidence that the Fund will not be able to collect all amounts due from a specific broker. Significant financial difficulties of the broker, probability that the broker will enter bankruptcy or financial reorganization, and default in payments are considered indicators that the amount due from a specific broker is impaired. If such evidence exists, the Fund recognizes an impairment loss as the difference between the amortized cost of the financial asset and the present value of the estimated future cash flows, discounted using the instrument’s original effective interest rate. Impairment losses on financial assets at amortized cost are reversed in subsequent periods if the amount of the loss decreases and the decrease can be related objectively to an event occurring after the impairment was recognized.
Cash and cash equivalents Cash and cash equivalents include cash in hand, deposits held on call with banks and bank overdrafts. Bank overdrafts are shown in current liabilities in the statements of financial position.
Other assets and liabilities Dividends and interest receivable, receivable for investments sold and other receivables are categorized as loans and receivables and recorded at cost or amortized cost. Management fees payable, payable for investments purchased and other payable and accrued expenses are categorized as other liabilities and recorded at cost or amortized cost. Other assets and liabilities are short term in nature and cost or amortized cost approximates fair value.
Translation of foreign currencies
a) The fair value of investments and other assets and liabilities denominated in foreign currencies are translated into Canadian dollars at the prevailing rates on each valuation date.
b) Purchases and sales of investments, dividends and interest income denominated in foreign currencies are translated into Canadian dollars at the prevailing rates of exchange on the dates of the related transactions.
c) Foreign currency gains and losses resulting from translations are reported in the statements of comprehensive income. Foreign currency gains and losses relating to cash and cash equivalents are presented in the statements of comprehensive income within net foreign exchange gain or loss on cash and cash equivalents. Foreign currency gains and losses relating to financial assets and liabilities carried as FVTPL are presented in the statements of comprehensive income within net gain or loss on investments.
Contractholder transactions For each unit issued, the Funds receive an amount equal to the NAV per unit on the valuation date, which is included in NAAC. Units are redeemable at the option of the contractholder at their NAV per unit on the valuation date as determined in Note 7. For each unit redeemed, NAAC is reduced by the NAV of the unit on the redemption date.
Increase (decrease) in net assets from operations attributable to contractholders Income not distributed is included in NAAC. Movements in NAAC are recognized in the statements of changes in net assets attributable to contractholders.
Increase (decrease) in net assets from operations attributable to contractholders per daily average number of units in the statements of comprehensive income represents the increase (decrease) in NAAC, divided by the average daily number of units outstanding for each class of units.
Unit valuation NAV is calculated on every valuation date for each class of units. A valuation date is each day that the Manager is open for business and on which the Toronto Stock Exchange is open for trading. The NAV of a specific class of units is computed by calculating the value of the class’s proportionate share of the assets and liabilities of the respective fund attributable only to that class. Expenses directly attributable to a class are charged directly to that class. Other expenses, income, and realized and unrealized capital gains and losses are allocated proportionately to each class based on the relative NAV of each class.
Withholding taxes The Funds may incur withholding taxes imposed by certain countries on investment income and capital gains. Such income and gains are recorded on a gross basis and the related withholding taxes are shown separately in the statements of comprehensive income.
Income and expense allocation Where a Fund offers more than one class of units, realized gains (losses), changes in unrealized appreciation (depreciation) on investments, income and expenses that are common to the Fund as a whole are allocated daily to each class based on the proportionate share of the NAV of the class. The proportionate share of each class is determined by adding the current day’s net contractholder transactions of the class to the prior day’s NAV of the class. Any income or expense amounts that are unique to a particular class (for example, management fees) are accounted for separately in that particular class so as not to affect the NAV of the other classes.
Critical accounting estimates and assumptions The preparation of financial statements in compliance with IFRS requires management to exercise its judgment in applying its accounting policies and to make estimates and assumptions about the future. The most significant accounting judgments and estimates that the Funds have made in preparing the financial statements related to the fair values of some financial instruments are as follows:
110
Notes to Financial Statements For the year ended December 31, 2017 a) The Funds may, from time to time, hold financial instruments that are not quoted in active markets, such as over-the-counter derivatives. Fair
values of such instruments are determined using valuation techniques and may be determined using reputable pricing sources (such as pricing agencies) or indicative prices from market makers. Broker quotes as obtained from the pricing sources may be indicative and not executable or binding. Where no market data is available, the Manager may value positions using its own models, which are usually based on valuation methods and techniques generally recognized as standard within the industry. The models used to determine fair values are validated and periodically reviewed by experienced personnel of the Manager, independent of the party that created them. The models used for private equity securities are based mainly on earnings multiples adjusted for lack of marketability and control premiums. The models used for debt securities are based on net present value of estimated future cash flows, adjusted as appropriate for liquidity, and credit and market risk factors.
b) Models use observable data, to the extent practicable. However, areas such as credit risk (both own and counterparty), volatilities and correlations require the Manager to make estimates. Changes in assumptions about these factors could affect the reported fair values of financial instruments.
c) The Manager considers observable data to be market data that is readily available, regularly distributed and updated, reliable and verifiable, not proprietary, and provided by independent sources that are actively involved in the relevant market. Refer to Note 16 for further information about the fair value measurement of the Funds’ financial instruments.
Critical judgments In classifying and measuring financial instruments held by the Funds, the Manager is required to make significant judgments about whether or not the business of the Funds is to invest on a total return basis for the purpose of applying the fair value option for the financial assets under IAS 39, Financial Instruments – Recognition and Measurement (“IAS 39”). The most significant judgment made includes the determination that the fair value option can be applied to financial instruments and there are no financial instruments designated as HFT.
Future accounting policy changes The following standards and amendments will be applicable to the Funds subsequent to 2017:
a) IFRS 9 Financial Instruments In July 2014, the IASB issued the final version of IFRS 9 Financial Instruments to replace IAS 39. IFRS 9 provides guidance on the classification and measurement of financial instruments, impairment of financial assets and hedge accounting. The classification and measurement of financial assets will depend on the financial asset’s contractual cash flow characteristics and the entity’s business model for managing the asset. For financial instruments not measured as FVTPL, IFRS 9 introduces an impairment model that requires recognition of expected loss from possible default events in the near term as well as recognition of lifetime expected loss if certain criteria are met. A new model for hedge accounting aligns hedge accounting more closely with the entity’s risk management activities by increasing the eligibility of both hedged items and hedging instruments, and introducing a more principles-based approach to assess hedging effectiveness. IFRS 9 is effective for annual periods beginning on or after January 1, 2018, with early adoption permitted. The manager is adopting this standard.
b) IFRS 15 Revenue from Contracts with Customers In May 2014, the IASB published a new standard, IFRS 15 Revenue from Contracts with Customers, effective on January 1, 2017, that sets out the principles for when revenue should be recognized and how it should be measured, together with related disclosures. The standard requires a company to recognize revenue that represents the transfer of goods or services to customers, measured at the amounts it expects to receive when the customer has control of the goods or services. Contracts covered by IFRS 9 Financial Instruments (“IFRS 9”) and IFRS 4 are excluded from the scope of this new standard. In September 2015, the IASB deferred the effective date of IFRS 15 Revenue from Contracts with Customers from January 1, 2017 to January 1, 2018. The Manager is is adopting this standard.
4. Charges for investment management and operating expenses Each Fund class pays a management fee for the provision of fund management services. These services include investment advisory and portfolio management services, costs incurred to manage the Funds that are not directly related to a specific Fund such as overhead costs and, for some classes of the Funds, distribution-related expenses. The daily management fee applicable to each Fund class and payable to the Manager is calculated on each valuation date and is equal to the product of the NAV of each Fund class on such date and the number of days lapsed since the last valuation date, multiplied by the Manager’s effective daily management fee rate applicable to each Fund class.
In addition to the management fees payable, each Fund is accountable for its operating expenses, including applicable taxes. Operating expenses include audit fees, trustee and custodial expenses, accounting and record keeping costs, legal expenses, permitted prospectus preparation and filing expenses, bank-related fees and interest charges, contractholder report costs, fund-related administration costs, and other day-to-day operating expenses. The Manager may, at its discretion, pay certain expenses of a Fund and/or may reimburse a Fund for expenses that it has paid.
Several of the expenses incurred by a Fund relate to services provided by third-party, non-affiliated entities. Examples of such services include audit, trustee, custodial, accounting, and banking services. These services are incurred directly by each Fund.
As well, a number of expenses paid by a Fund relate to services provided by the Manager. Such services include mail service, call center services, contractholder record keeping services, financial reporting and financial control services, as well as the Manager’s indirect costs associated with the provision of these services. Indirect costs incurred by the Manager include costs associated with its premises, human resources and management oversight.
111
Notes to Financial Statements For the year ended December 31, 2017 The costs of services provided by the Manager are allocated to each Fund proportionate to the time and effort required to support the Fund’s day- to- day operations. The asset under management is included in determining an appropriate allocation of costs.
The Manager, at its discretion, may waive or absorb a portion of the operating expenses otherwise payable by a Fund class. These waivers may be terminated at any time by the Manager.
Additional information is provided for each fund in the financial highlights (unaudited) section.
5. Soft dollar brokerage commissions on securities transactions Soft dollar brokerage commissions represent the value of payment in-kind provided to securities dealers for their services. There was no soft dollar compensation paid to brokerage firms for the years ended December 31, 2017 and 2016.
6. Brokerage commissions on securities transactions A broker is an individual or party (brokerage firm) that arranges transactions between a buyer and a seller for a commission, typically paid when the transaction is executed. Brokerage commissions paid for the years ended December 31, 2017 and 2016 were as follows:
Fund 2017 2016 Asset Allocation Fund $13,401 $40,369 Bond Fund 11 - Canadian Communications Fund 5 160 Canadian Financial Services Fund 20 60 Canadian Resources Fund 14 12 Canadian Growth Fund 30 - Canadian Small Cap Fund 29 2 Dividend Fund 1,557 5,459 Canadian-35 Index Fund 1,071 1,035 Can-Am Fund 1 23 Can-Asian Fund 1 8 Can-Daq Fund - 8 Can- Euro Fund - 10 Can-Global Bond Fund - 2 American Asset Allocation Fund 3 14 American Equity Index Fund 2 19 Can-Emerge Fund 153 78 European Equity Index Fund - 79 International Bond Index Fund 12 2 Information Technology Fund 5 5 International Brands Fund - 1 Equity Fund 18,168 52,029
7. Redemption of units Contractholders may, on any valuation date, redeem all or any part of their units at the then current NAV per unit as follows: a) Complete a redemption order along with all necessary supporting documentation (“redemption application”) and send the redemption
application to their dealer or broker who will forward it to the Manager; or
b) Place a wire order through a dealer or broker (“redemption request”). The same documents as described above must be provided in order to complete the redemption process.
The NAV per unit is calculated on the same day if the redemption request or redemption application is received at or prior to 4:00 p.m. (ET). Payment for units redeemed will be made by the Funds within three business days from the date the redemption order is processed.
8. Short term investments used to cover margin on futures contracts A number of the Funds have short term investments that are held by an unrelated brokerage company as collateral to cover the initial margins on the futures contracts they hold.
The following chart summarizes, by Fund, the value of short term investments held as collateral as at December 31, 2017.
Fund Par Value (000’s)
Average Cost (000’s)
Fair Value (000’s)
Can-Am Fund $1,156 $1,152 $1,153 Can-Asian Fund 914 911 912 Can-Daq 100 Fund 463 461 462 Can-Euro Fund 807 805 805 Can-Global Bond Fund 28 28 28
112
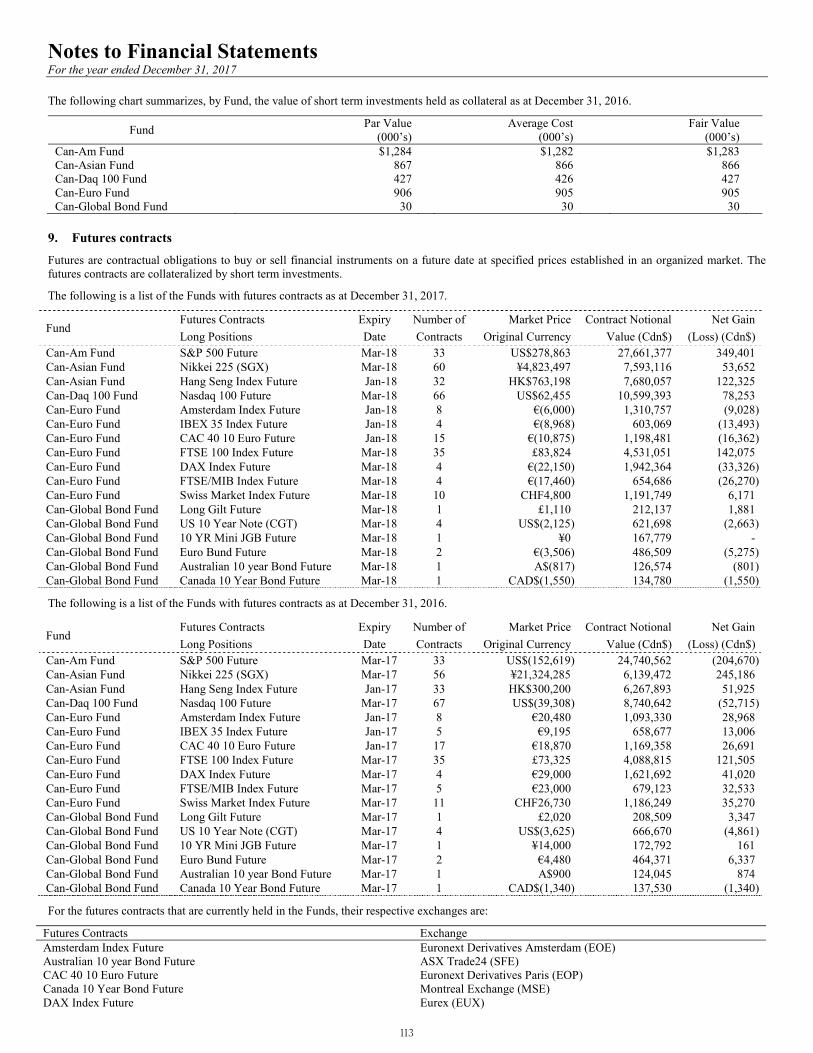
Notes to Financial Statements For the year ended December 31, 2017 The following chart summarizes, by Fund, the value of short term investments held as collateral as at December 31, 2016.
Fund Par Value (000’s)
Average Cost (000’s)
Fair Value (000’s)
Can-Am Fund $1,284 $1,282 $1,283 Can-Asian Fund 867 866 866 Can-Daq 100 Fund 427 426 427 Can-Euro Fund 906 905 905 Can-Global Bond Fund 30 30 30
9. Futures contracts Futures are contractual obligations to buy or sell financial instruments on a future date at specified prices established in an organized market. The futures contracts are collateralized by short term investments.
The following is a list of the Funds with futures contracts as at December 31, 2017.
Fund Futures Contracts Expiry Number of Market Price Contract Notional Net Gain Long Positions Date Contracts Original Currency Value (Cdn$) (Loss) (Cdn$)
Can-Am Fund S&P 500 Future Mar-18 33 US$278,863 27,661,377 349,401 Can-Asian Fund Nikkei 225 (SGX) Mar-18 60 ¥4,823,497 7,593,116 53,652 Can-Asian Fund Hang Seng Index Future Jan-18 32 HK$763,198 7,680,057 122,325 Can-Daq 100 Fund Nasdaq 100 Future Mar-18 66 US$62,455 10,599,393 78,253 Can-Euro Fund Amsterdam Index Future Jan-18 8 €(6,000) 1,310,757 (9,028) Can-Euro Fund IBEX 35 Index Future Jan-18 4 €(8,968) 603,069 (13,493) Can-Euro Fund CAC 40 10 Euro Future Jan-18 15 €(10,875) 1,198,481 (16,362) Can-Euro Fund FTSE 100 Index Future Mar-18 35 £83,824 4,531,051 142,075 Can-Euro Fund DAX Index Future Mar-18 4 €(22,150) 1,942,364 (33,326) Can-Euro Fund FTSE/MIB Index Future Mar-18 4 €(17,460) 654,686 (26,270) Can-Euro Fund Swiss Market Index Future Mar-18 10 CHF4,800 1,191,749 6,171 Can-Global Bond Fund Long Gilt Future Mar-18 1 £1,110 212,137 1,881 Can-Global Bond Fund US 10 Year Note (CGT) Mar-18 4 US$(2,125) 621,698 (2,663) Can-Global Bond Fund 10 YR Mini JGB Future Mar-18 1 ¥0 167,779 - Can-Global Bond Fund Euro Bund Future Mar-18 2 €(3,506) 486,509 (5,275) Can-Global Bond Fund Australian 10 year Bond Future Mar-18 1 A$(817) 126,574 (801) Can-Global Bond Fund Canada 10 Year Bond Future Mar-18 1 CAD$(1,550) 134,780 (1,550)
The following is a list of the Funds with futures contracts as at December 31, 2016.
Fund Futures Contracts Expiry Number of Market Price Contract Notional Net Gain Long Positions Date Contracts Original Currency Value (Cdn$) (Loss) (Cdn$)
Can-Am Fund S&P 500 Future Mar-17 33 US$(152,619) 24,740,562 (204,670) Can-Asian Fund Nikkei 225 (SGX) Mar-17 56 ¥21,324,285 6,139,472 245,186 Can-Asian Fund Hang Seng Index Future Jan-17 33 HK$300,200 6,267,893 51,925 Can-Daq 100 Fund Nasdaq 100 Future Mar-17 67 US$(39,308) 8,740,642 (52,715) Can-Euro Fund Amsterdam Index Future Jan-17 8 €20,480 1,093,330 28,968 Can-Euro Fund IBEX 35 Index Future Jan-17 5 €9,195 658,677 13,006 Can-Euro Fund CAC 40 10 Euro Future Jan-17 17 €18,870 1,169,358 26,691 Can-Euro Fund FTSE 100 Index Future Mar-17 35 £73,325 4,088,815 121,505 Can-Euro Fund DAX Index Future Mar-17 4 €29,000 1,621,692 41,020 Can-Euro Fund FTSE/MIB Index Future Mar-17 5 €23,000 679,123 32,533 Can-Euro Fund Swiss Market Index Future Mar-17 11 CHF26,730 1,186,249 35,270 Can-Global Bond Fund Long Gilt Future Mar-17 1 £2,020 208,509 3,347 Can-Global Bond Fund US 10 Year Note (CGT) Mar-17 4 US$(3,625) 666,670 (4,861) Can-Global Bond Fund 10 YR Mini JGB Future Mar-17 1 ¥14,000 172,792 161 Can-Global Bond Fund Euro Bund Future Mar-17 2 €4,480 464,371 6,337 Can-Global Bond Fund Australian 10 year Bond Future Mar-17 1 A$900 124,045 874 Can-Global Bond Fund Canada 10 Year Bond Future Mar-17 1 CAD$(1,340) 137,530 (1,340)
For the futures contracts that are currently held in the Funds, their respective exchanges are:
Futures Contracts Exchange Amsterdam Index Future Euronext Derivatives Amsterdam (EOE) Australian 10 year Bond Future ASX Trade24 (SFE) CAC 40 10 Euro Future Canada 10 Year Bond Future
Euronext Derivatives Paris (EOP) Montreal Exchange (MSE)
DAX Index Future Eurex (EUX)
113
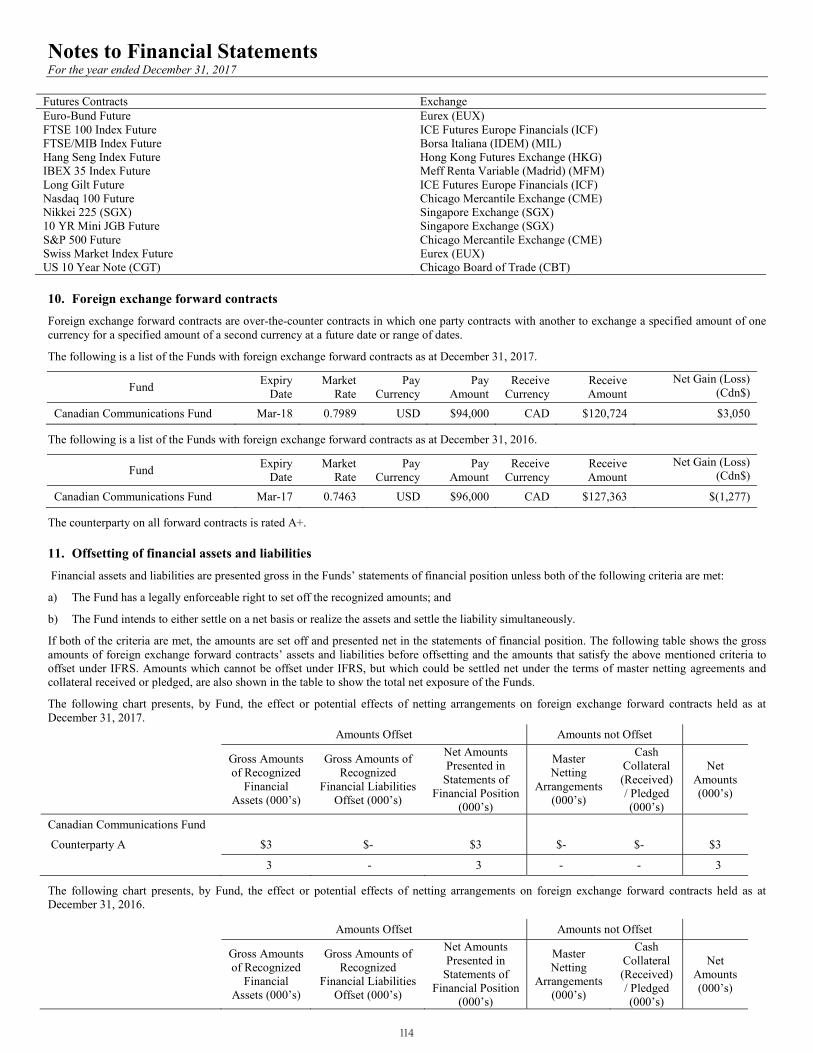
Notes to Financial Statements For the year ended December 31, 2017
Futures Contracts Exchange Euro-Bund Future Eurex (EUX) FTSE 100 Index Future FTSE/MIB Index Future
ICE Futures Europe Financials (ICF) Borsa Italiana (IDEM) (MIL)
Hang Seng Index Future Hong Kong Futures Exchange (HKG) IBEX 35 Index Future Meff Renta Variable (Madrid) (MFM) Long Gilt Future ICE Futures Europe Financials (ICF) Nasdaq 100 Future Chicago Mercantile Exchange (CME) Nikkei 225 (SGX) Singapore Exchange (SGX) 10 YR Mini JGB Future Singapore Exchange (SGX) S&P 500 Future Chicago Mercantile Exchange (CME) Swiss Market Index Future Eurex (EUX) US 10 Year Note (CGT) Chicago Board of Trade (CBT)
10. Foreign exchange forward contracts Foreign exchange forward contracts are over-the-counter contracts in which one party contracts with another to exchange a specified amount of one currency for a specified amount of a second currency at a future date or range of dates.
The following is a list of the Funds with foreign exchange forward contracts as at December 31, 2017.
Fund Expiry Date
Market Rate
Pay Currency
Pay Amount
Receive Currency
Receive Amount
Net Gain (Loss) (Cdn$)
Canadian Communications Fund Mar-18 0.7989 USD $94,000 CAD $120,724 $3,050
The following is a list of the Funds with foreign exchange forward contracts as at December 31, 2016.
Fund Expiry Date
Market Rate
Pay Currency
Pay Amount
Receive Currency
Receive Amount
Net Gain (Loss) (Cdn$)
Canadian Communications Fund Mar-17 0.7463 USD $96,000 CAD $127,363 $(1,277)
The counterparty on all forward contracts is rated A+.
11. Offsetting of financial assets and liabilities Financial assets and liabilities are presented gross in the Funds’ statements of financial position unless both of the following criteria are met:
a) The Fund has a legally enforceable right to set off the recognized amounts; and
b) The Fund intends to either settle on a net basis or realize the assets and settle the liability simultaneously.
If both of the criteria are met, the amounts are set off and presented net in the statements of financial position. The following table shows the gross amounts of foreign exchange forward contracts’ assets and liabilities before offsetting and the amounts that satisfy the above mentioned criteria to offset under IFRS. Amounts which cannot be offset under IFRS, but which could be settled net under the terms of master netting agreements and collateral received or pledged, are also shown in the table to show the total net exposure of the Funds.
The following chart presents, by Fund, the effect or potential effects of netting arrangements on foreign exchange forward contracts held as at December 31, 2017. Amounts Offset Amounts not Offset
Gross Amounts of Recognized
Financial Assets (000’s)
Gross Amounts of Recognized
Financial Liabilities Offset (000’s)
Net Amounts Presented in
Statements of Financial Position
(000’s)
Master Netting
Arrangements (000’s)
Cash Collateral (Received) / Pledged (000’s)
Net Amounts (000’s)
Canadian Communications Fund
Counterparty A $3 $- $3 $- $- $3
3 - 3 - - 3
The following chart presents, by Fund, the effect or potential effects of netting arrangements on foreign exchange forward contracts held as at December 31, 2016.
Amounts Offset Amounts not Offset
Gross Amounts of Recognized
Financial Assets (000’s)
Gross Amounts of Recognized
Financial Liabilities Offset (000’s)
Net Amounts Presented in
Statements of Financial Position
(000’s)
Master Netting
Arrangements (000’s)
Cash Collateral (Received) / Pledged (000’s)
Net Amounts (000’s)
114
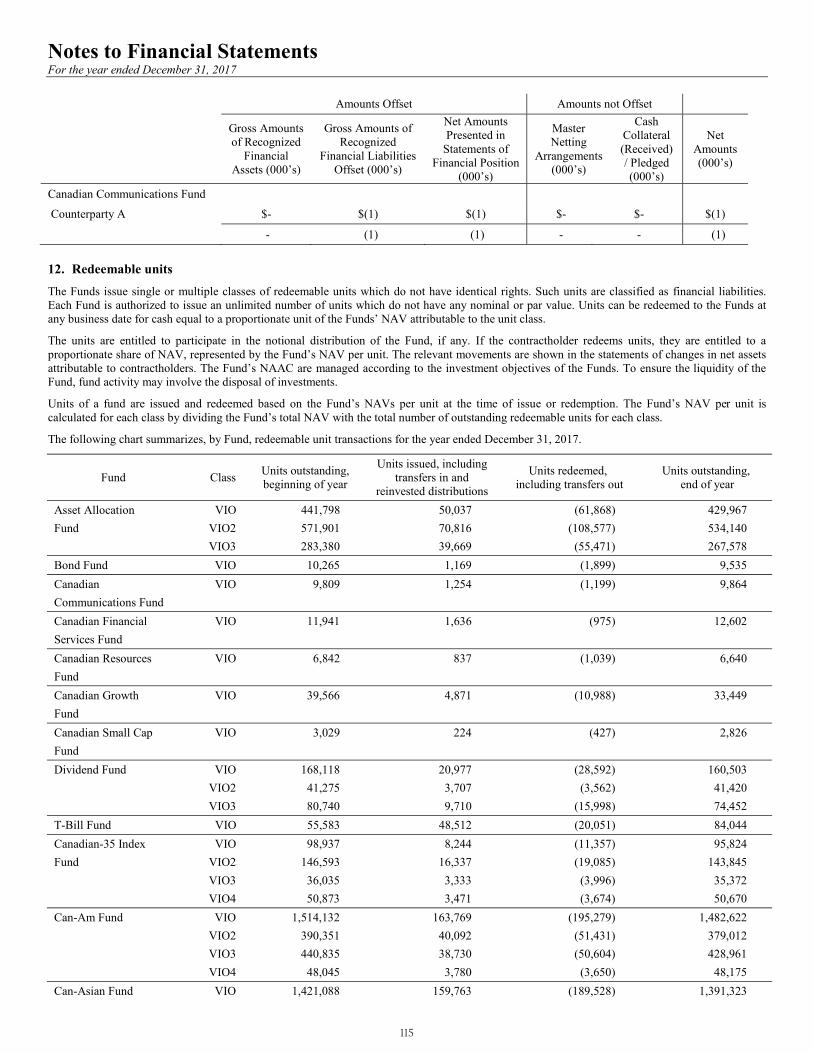
Notes to Financial Statements For the year ended December 31, 2017 Amounts Offset Amounts not Offset
Gross Amounts of Recognized
Financial Assets (000’s)
Gross Amounts of Recognized
Financial Liabilities Offset (000’s)
Net Amounts Presented in
Statements of Financial Position
(000’s)
Master Netting
Arrangements (000’s)
Cash Collateral (Received) / Pledged (000’s)
Net Amounts (000’s)
Canadian Communications Fund
Counterparty A $- $(1) $(1) $- $- $(1)
- (1) (1) - - (1)
12. Redeemable units The Funds issue single or multiple classes of redeemable units which do not have identical rights. Such units are classified as financial liabilities. Each Fund is authorized to issue an unlimited number of units which do not have any nominal or par value. Units can be redeemed to the Funds at any business date for cash equal to a proportionate unit of the Funds’ NAV attributable to the unit class.
The units are entitled to participate in the notional distribution of the Fund, if any. If the contractholder redeems units, they are entitled to a proportionate share of NAV, represented by the Fund’s NAV per unit. The relevant movements are shown in the statements of changes in net assets attributable to contractholders. The Fund’s NAAC are managed according to the investment objectives of the Funds. To ensure the liquidity of the Fund, fund activity may involve the disposal of investments.
Units of a fund are issued and redeemed based on the Fund’s NAVs per unit at the time of issue or redemption. The Fund’s NAV per unit is calculated for each class by dividing the Fund’s total NAV with the total number of outstanding redeemable units for each class.
The following chart summarizes, by Fund, redeemable unit transactions for the year ended December 31, 2017.
Fund Class Units outstanding, beginning of year
Units issued, including transfers in and
reinvested distributions
Units redeemed, including transfers out
Units outstanding, end of year
Asset Allocation VIO 441,798 50,037 (61,868) 429,967 Fund VIO2 571,901 70,816 (108,577) 534,140
VIO3 283,380 39,669 (55,471) 267,578 Bond Fund VIO 10,265 1,169 (1,899) 9,535 Canadian VIO 9,809 1,254 (1,199) 9,864 Communications Fund Canadian Financial VIO 11,941 1,636 (975) 12,602 Services Fund Canadian Resources VIO 6,842 837 (1,039) 6,640 Fund Canadian Growth VIO 39,566 4,871 (10,988) 33,449 Fund Canadian Small Cap VIO 3,029 224 (427) 2,826 Fund Dividend Fund VIO 168,118 20,977 (28,592) 160,503 VIO2 41,275 3,707 (3,562) 41,420 VIO3 80,740 9,710 (15,998) 74,452 T-Bill Fund VIO 55,583 48,512 (20,051) 84,044 Canadian-35 Index VIO 98,937 8,244 (11,357) 95,824 Fund VIO2 146,593 16,337 (19,085) 143,845 VIO3 36,035 3,333 (3,996) 35,372 VIO4 50,873 3,471 (3,674) 50,670 Can-Am Fund VIO 1,514,132 163,769 (195,279) 1,482,622 VIO2 390,351 40,092 (51,431) 379,012 VIO3 440,835 38,730 (50,604) 428,961 VIO4 48,045 3,780 (3,650) 48,175 Can-Asian Fund VIO 1,421,088 159,763 (189,528) 1,391,323
115
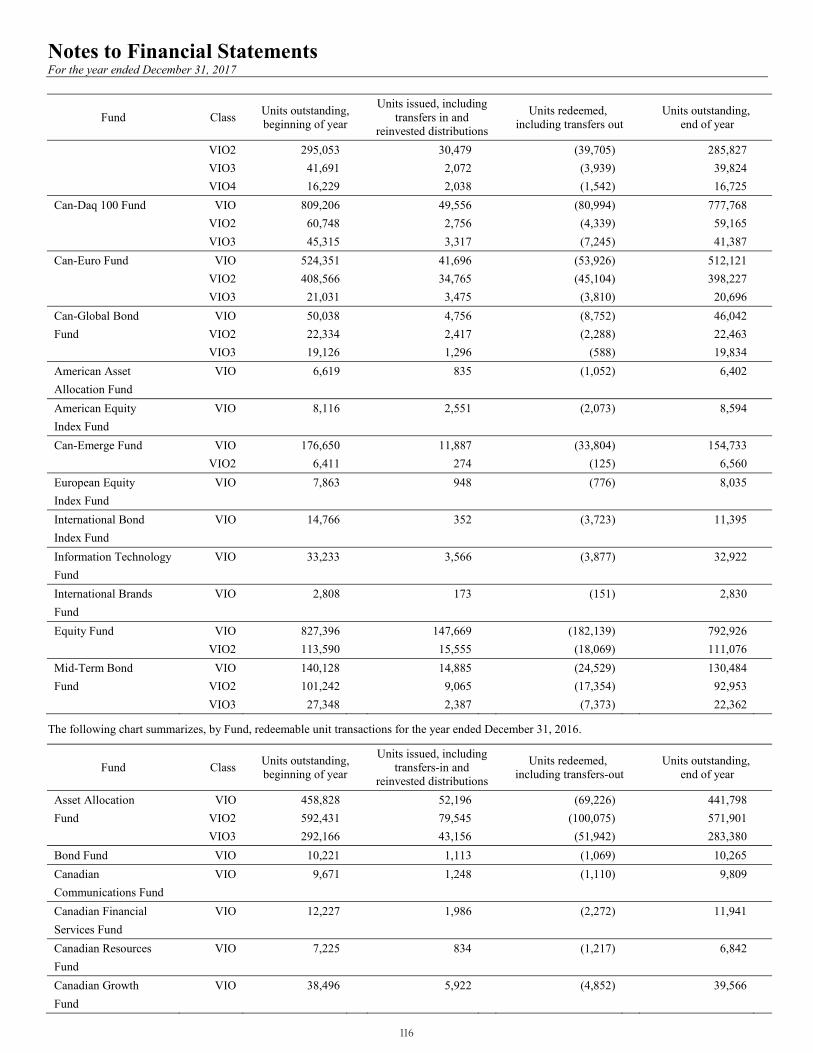
Notes to Financial Statements For the year ended December 31, 2017
Fund Class Units outstanding, beginning of year
Units issued, including transfers in and
reinvested distributions
Units redeemed, including transfers out
Units outstanding, end of year
VIO2 295,053 30,479 (39,705) 285,827 VIO3 41,691 2,072 (3,939) 39,824 VIO4 16,229 2,038 (1,542) 16,725 Can-Daq 100 Fund VIO 809,206 49,556 (80,994) 777,768 VIO2 60,748 2,756 (4,339) 59,165 VIO3 45,315 3,317 (7,245) 41,387 Can-Euro Fund VIO 524,351 41,696 (53,926) 512,121 VIO2 408,566 34,765 (45,104) 398,227 VIO3 21,031 3,475 (3,810) 20,696 Can-Global Bond VIO 50,038 4,756 (8,752) 46,042 Fund VIO2 22,334 2,417 (2,288) 22,463 VIO3 19,126 1,296 (588) 19,834 American Asset VIO 6,619 835 (1,052) 6,402 Allocation Fund American Equity VIO 8,116 2,551 (2,073) 8,594 Index Fund Can-Emerge Fund VIO 176,650 11,887 (33,804) 154,733 VIO2 6,411 274 (125) 6,560 European Equity VIO 7,863 948 (776) 8,035 Index Fund International Bond VIO 14,766 352 (3,723) 11,395 Index Fund Information Technology VIO 33,233 3,566 (3,877) 32,922 Fund International Brands VIO 2,808 173 (151) 2,830 Fund Equity Fund VIO 827,396 147,669 (182,139) 792,926 VIO2 113,590 15,555 (18,069) 111,076 Mid-Term Bond VIO 140,128 14,885 (24,529) 130,484 Fund VIO2 101,242 9,065 (17,354) 92,953 VIO3 27,348 2,387 (7,373) 22,362
The following chart summarizes, by Fund, redeemable unit transactions for the year ended December 31, 2016.
Fund Class Units outstanding, beginning of year
Units issued, including transfers-in and
reinvested distributions
Units redeemed, including transfers-out
Units outstanding, end of year
Asset Allocation VIO 458,828 52,196 (69,226) 441,798 Fund VIO2 592,431 79,545 (100,075) 571,901
VIO3 292,166 43,156 (51,942) 283,380 Bond Fund VIO 10,221 1,113 (1,069) 10,265 Canadian VIO 9,671 1,248 (1,110) 9,809 Communications Fund Canadian Financial VIO 12,227 1,986 (2,272) 11,941 Services Fund Canadian Resources VIO 7,225 834 (1,217) 6,842 Fund Canadian Growth VIO 38,496 5,922 (4,852) 39,566 Fund
116
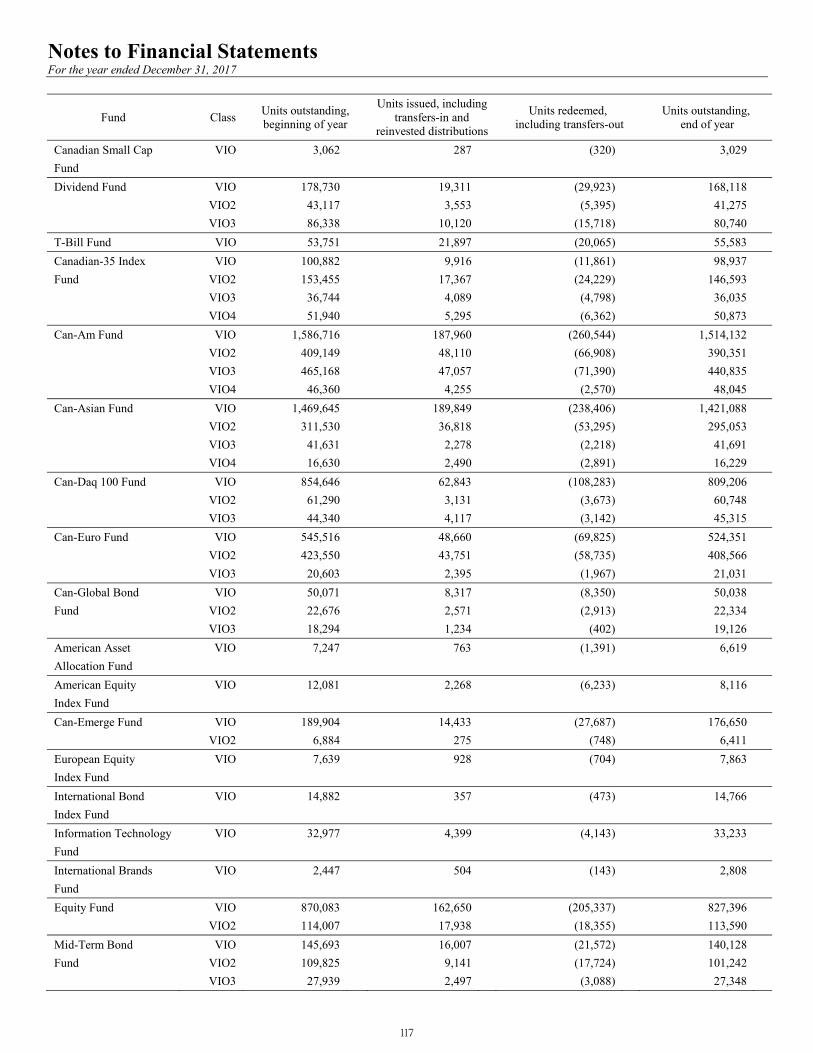
Notes to Financial Statements For the year ended December 31, 2017
Fund Class Units outstanding, beginning of year
Units issued, including transfers-in and
reinvested distributions
Units redeemed, including transfers-out
Units outstanding, end of year
Canadian Small Cap VIO 3,062 287 (320) 3,029 Fund Dividend Fund VIO 178,730 19,311 (29,923) 168,118 VIO2 43,117 3,553 (5,395) 41,275 VIO3 86,338 10,120 (15,718) 80,740 T-Bill Fund VIO 53,751 21,897 (20,065) 55,583 Canadian-35 Index VIO 100,882 9,916 (11,861) 98,937 Fund VIO2 153,455 17,367 (24,229) 146,593 VIO3 36,744 4,089 (4,798) 36,035 VIO4 51,940 5,295 (6,362) 50,873 Can-Am Fund VIO 1,586,716 187,960 (260,544) 1,514,132 VIO2 409,149 48,110 (66,908) 390,351 VIO3 465,168 47,057 (71,390) 440,835 VIO4 46,360 4,255 (2,570) 48,045 Can-Asian Fund VIO 1,469,645 189,849 (238,406) 1,421,088 VIO2 311,530 36,818 (53,295) 295,053 VIO3 41,631 2,278 (2,218) 41,691 VIO4 16,630 2,490 (2,891) 16,229 Can-Daq 100 Fund VIO 854,646 62,843 (108,283) 809,206 VIO2 61,290 3,131 (3,673) 60,748 VIO3 44,340 4,117 (3,142) 45,315 Can-Euro Fund VIO 545,516 48,660 (69,825) 524,351 VIO2 423,550 43,751 (58,735) 408,566 VIO3 20,603 2,395 (1,967) 21,031 Can-Global Bond VIO 50,071 8,317 (8,350) 50,038 Fund VIO2 22,676 2,571 (2,913) 22,334 VIO3 18,294 1,234 (402) 19,126 American Asset VIO 7,247 763 (1,391) 6,619 Allocation Fund American Equity VIO 12,081 2,268 (6,233) 8,116 Index Fund Can-Emerge Fund VIO 189,904 14,433 (27,687) 176,650 VIO2 6,884 275 (748) 6,411 European Equity VIO 7,639 928 (704) 7,863 Index Fund International Bond VIO 14,882 357 (473) 14,766 Index Fund Information Technology VIO 32,977 4,399 (4,143) 33,233 Fund International Brands VIO 2,447 504 (143) 2,808 Fund Equity Fund VIO 870,083 162,650 (205,337) 827,396 VIO2 114,007 17,938 (18,355) 113,590 Mid-Term Bond VIO 145,693 16,007 (21,572) 140,128 Fund VIO2 109,825 9,141 (17,724) 101,242 VIO3 27,939 2,497 (3,088) 27,348
117
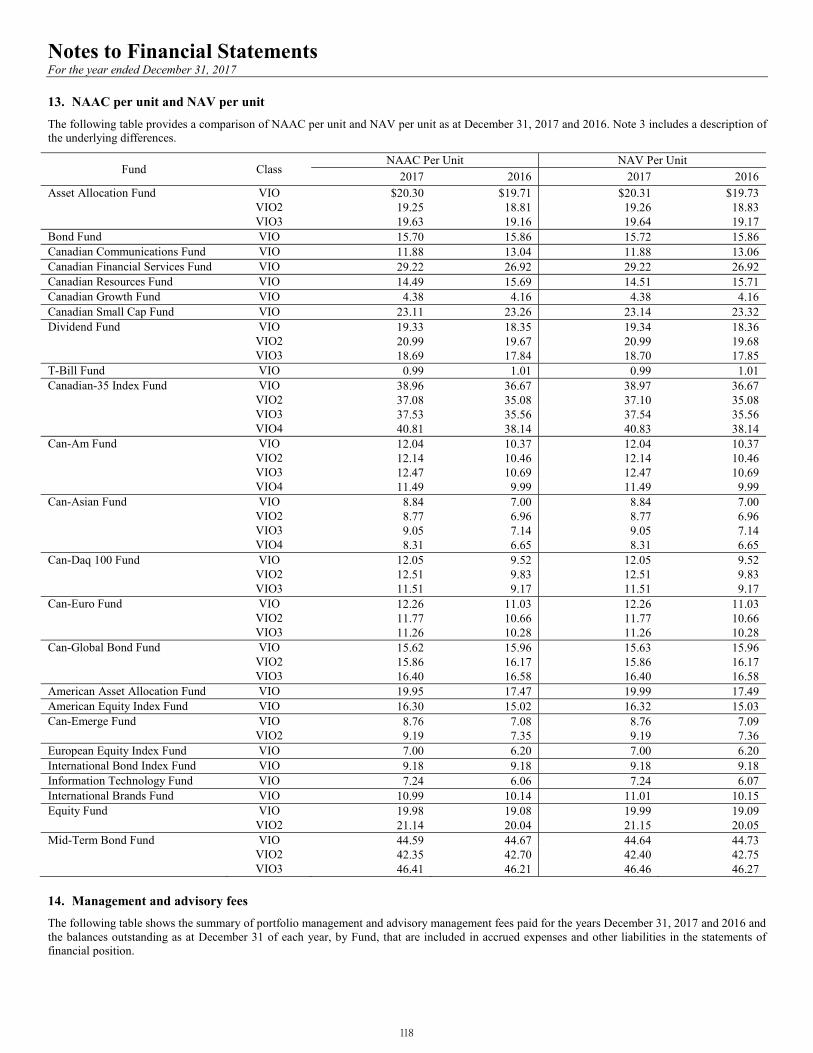
Notes to Financial Statements For the year ended December 31, 2017 13. NAAC per unit and NAV per unit The following table provides a comparison of NAAC per unit and NAV per unit as at December 31, 2017 and 2016. Note 3 includes a description of the underlying differences.
Fund Class NAAC Per Unit NAV Per Unit
2017 2016 2017 2016 Asset Allocation Fund VIO $20.30 $19.71 $20.31 $19.73 VIO2 19.25 18.81 19.26 18.83 VIO3 19.63 19.16 19.64 19.17 Bond Fund VIO 15.70 15.86 15.72 15.86 Canadian Communications Fund VIO 11.88 13.04 11.88 13.06 Canadian Financial Services Fund VIO 29.22 26.92 29.22 26.92 Canadian Resources Fund VIO 14.49 15.69 14.51 15.71 Canadian Growth Fund VIO 4.38 4.16 4.38 4.16 Canadian Small Cap Fund VIO 23.11 23.26 23.14 23.32 Dividend Fund VIO 19.33 18.35 19.34 18.36 VIO2 20.99 19.67 20.99 19.68 VIO3 18.69 17.84 18.70 17.85 T-Bill Fund VIO 0.99 1.01 0.99 1.01 Canadian-35 Index Fund VIO 38.96 36.67 38.97 36.67 VIO2 37.08 35.08 37.10 35.08 VIO3 37.53 35.56 37.54 35.56 VIO4 40.81 38.14 40.83 38.14 Can-Am Fund VIO 12.04 10.37 12.04 10.37 VIO2 12.14 10.46 12.14 10.46 VIO3 12.47 10.69 12.47 10.69 VIO4 11.49 9.99 11.49 9.99 Can-Asian Fund VIO 8.84 7.00 8.84 7.00 VIO2 8.77 6.96 8.77 6.96 VIO3 9.05 7.14 9.05 7.14 VIO4 8.31 6.65 8.31 6.65 Can-Daq 100 Fund VIO 12.05 9.52 12.05 9.52 VIO2 12.51 9.83 12.51 9.83 VIO3 11.51 9.17 11.51 9.17 Can-Euro Fund VIO 12.26 11.03 12.26 11.03 VIO2 11.77 10.66 11.77 10.66 VIO3 11.26 10.28 11.26 10.28 Can-Global Bond Fund VIO 15.62 15.96 15.63 15.96 VIO2 15.86 16.17 15.86 16.17 VIO3 16.40 16.58 16.40 16.58 American Asset Allocation Fund VIO 19.95 17.47 19.99 17.49 American Equity Index Fund VIO 16.30 15.02 16.32 15.03 Can-Emerge Fund VIO 8.76 7.08 8.76 7.09 VIO2 9.19 7.35 9.19 7.36 European Equity Index Fund VIO 7.00 6.20 7.00 6.20 International Bond Index Fund VIO 9.18 9.18 9.18 9.18 Information Technology Fund VIO 7.24 6.06 7.24 6.07 International Brands Fund VIO 10.99 10.14 11.01 10.15 Equity Fund VIO 19.98 19.08 19.99 19.09 VIO2 21.14 20.04 21.15 20.05 Mid-Term Bond Fund VIO 44.59 44.67 44.64 44.73 VIO2 42.35 42.70 42.40 42.75 VIO3 46.41 46.21 46.46 46.27
14. Management and advisory fees The following table shows the summary of portfolio management and advisory management fees paid for the years December 31, 2017 and 2016 and the balances outstanding as at December 31 of each year, by Fund, that are included in accrued expenses and other liabilities in the statements of financial position.
118
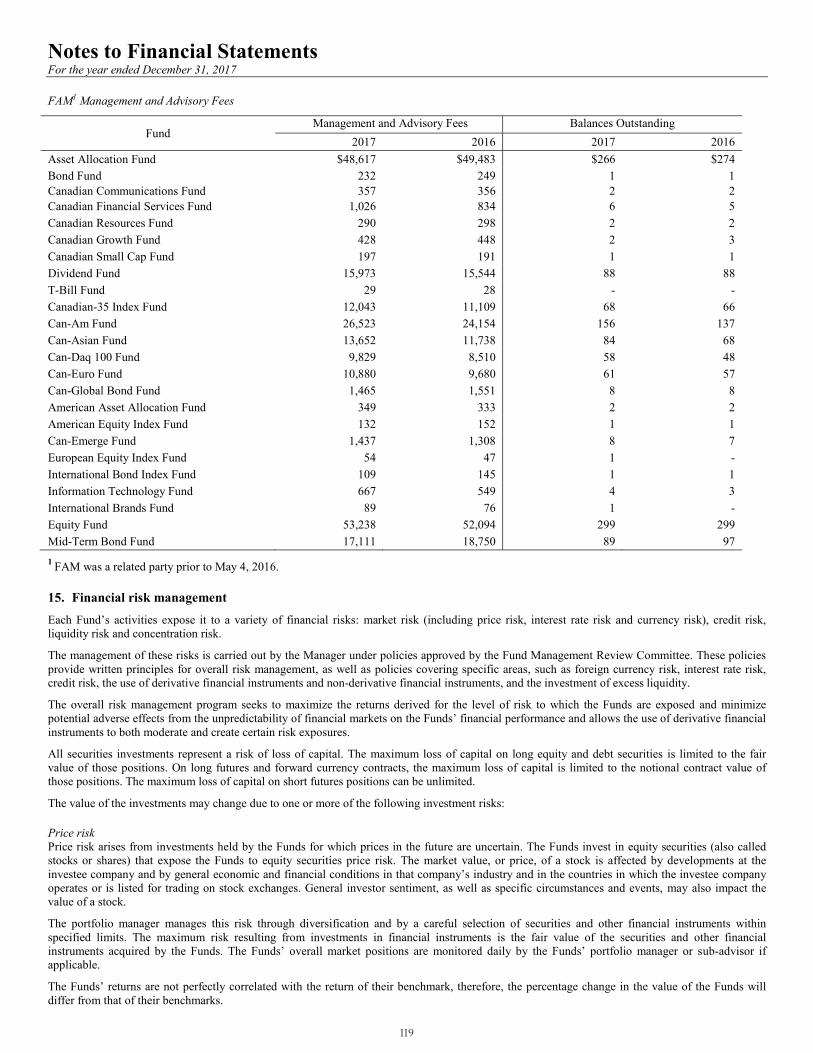
Notes to Financial Statements For the year ended December 31, 2017 FAM1 Management and Advisory Fees
Fund Management and Advisory Fees Balances Outstanding
2017 2016 2017 2016 Asset Allocation Fund $48,617 $49,483 $266 $274 Bond Fund 232 249 1 1 Canadian Communications Fund 357 356 2 2 Canadian Financial Services Fund 1,026 834 6 5 Canadian Resources Fund 290 298 2 2 Canadian Growth Fund 428 448 2 3 Canadian Small Cap Fund 197 191 1 1 Dividend Fund 15,973 15,544 88 88 T-Bill Fund 29 28 - - Canadian-35 Index Fund 12,043 11,109 68 66 Can-Am Fund 26,523 24,154 156 137 Can-Asian Fund 13,652 11,738 84 68 Can-Daq 100 Fund 9,829 8,510 58 48 Can-Euro Fund 10,880 9,680 61 57 Can-Global Bond Fund 1,465 1,551 8 8 American Asset Allocation Fund 349 333 2 2 American Equity Index Fund 132 152 1 1 Can-Emerge Fund 1,437 1,308 8 7 European Equity Index Fund 54 47 1 - International Bond Index Fund 109 145 1 1 Information Technology Fund 667 549 4 3 International Brands Fund 89 76 1 - Equity Fund 53,238 52,094 299 299 Mid-Term Bond Fund 17,111 18,750 89 97 1 FAM was a related party prior to May 4, 2016.
15. Financial risk management Each Fund’s activities expose it to a variety of financial risks: market risk (including price risk, interest rate risk and currency risk), credit risk, liquidity risk and concentration risk.
The management of these risks is carried out by the Manager under policies approved by the Fund Management Review Committee. These policies provide written principles for overall risk management, as well as policies covering specific areas, such as foreign currency risk, interest rate risk, credit risk, the use of derivative financial instruments and non-derivative financial instruments, and the investment of excess liquidity.
The overall risk management program seeks to maximize the returns derived for the level of risk to which the Funds are exposed and minimize potential adverse effects from the unpredictability of financial markets on the Funds’ financial performance and allows the use of derivative financial instruments to both moderate and create certain risk exposures.
All securities investments represent a risk of loss of capital. The maximum loss of capital on long equity and debt securities is limited to the fair value of those positions. On long futures and forward currency contracts, the maximum loss of capital is limited to the notional contract value of those positions. The maximum loss of capital on short futures positions can be unlimited.
The value of the investments may change due to one or more of the following investment risks:
Price risk Price risk arises from investments held by the Funds for which prices in the future are uncertain. The Funds invest in equity securities (also called stocks or shares) that expose the Funds to equity securities price risk. The market value, or price, of a stock is affected by developments at the investee company and by general economic and financial conditions in that company’s industry and in the countries in which the investee company operates or is listed for trading on stock exchanges. General investor sentiment, as well as specific circumstances and events, may also impact the value of a stock.
The portfolio manager manages this risk through diversification and by a careful selection of securities and other financial instruments within specified limits. The maximum risk resulting from investments in financial instruments is the fair value of the securities and other financial instruments acquired by the Funds. The Funds’ overall market positions are monitored daily by the Funds’ portfolio manager or sub-advisor if applicable.
The Funds’ returns are not perfectly correlated with the return of their benchmark, therefore, the percentage change in the value of the Funds will differ from that of their benchmarks.
119
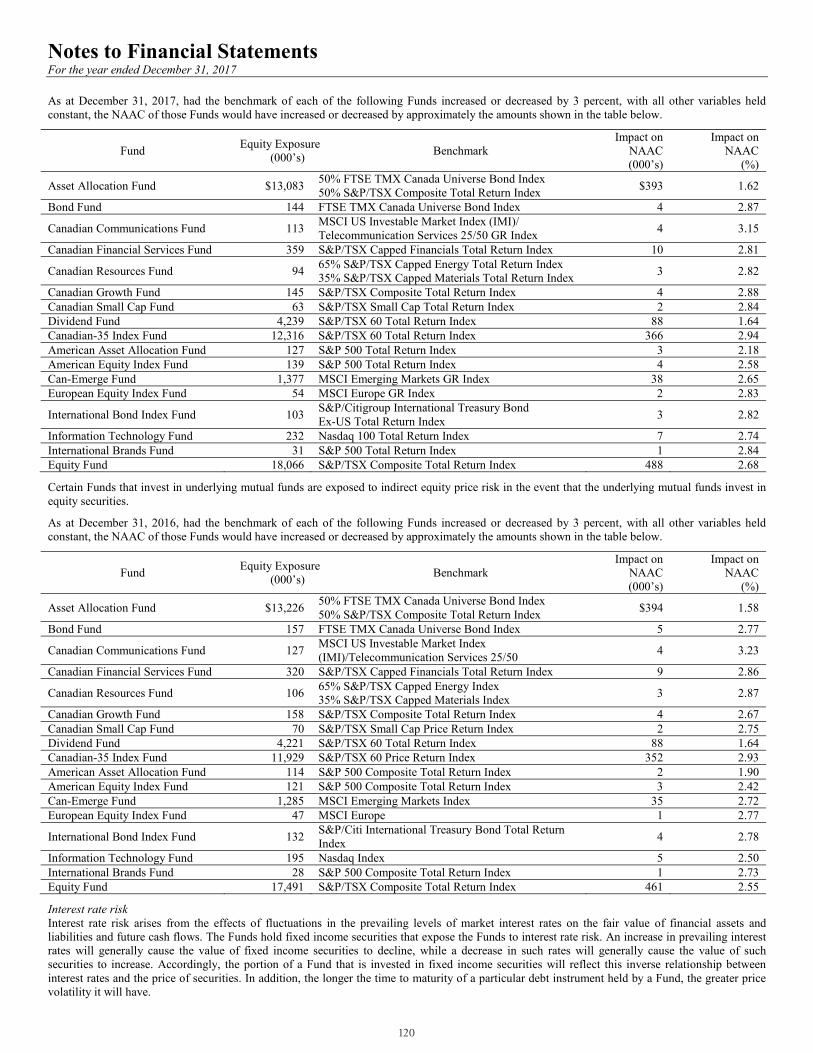
Notes to Financial Statements For the year ended December 31, 2017 As at December 31, 2017, had the benchmark of each of the following Funds increased or decreased by 3 percent, with all other variables held constant, the NAAC of those Funds would have increased or decreased by approximately the amounts shown in the table below.
Fund Equity Exposure
(000’s) Benchmark Impact on
NAAC (000’s)
Impact on NAAC
(%)
Asset Allocation Fund $13,083 50% FTSE TMX Canada Universe Bond Index 50% S&P/TSX Composite Total Return Index $393 1.62
Bond Fund 144 FTSE TMX Canada Universe Bond Index 4 2.87
Canadian Communications Fund 113 MSCI US Investable Market Index (IMI)/ Telecommunication Services 25/50 GR Index 4 3.15
Canadian Financial Services Fund 359 S&P/TSX Capped Financials Total Return Index 10 2.81
Canadian Resources Fund 94 65% S&P/TSX Capped Energy Total Return Index 35% S&P/TSX Capped Materials Total Return Index 3 2.82
Canadian Growth Fund 145 S&P/TSX Composite Total Return Index 4 2.88 Canadian Small Cap Fund 63 S&P/TSX Small Cap Total Return Index 2 2.84 Dividend Fund 4,239 S&P/TSX 60 Total Return Index 88 1.64 Canadian-35 Index Fund 12,316 S&P/TSX 60 Total Return Index 366 2.94 American Asset Allocation Fund 127 S&P 500 Total Return Index 3 2.18 American Equity Index Fund 139 S&P 500 Total Return Index 4 2.58 Can-Emerge Fund 1,377 MSCI Emerging Markets GR Index 38 2.65 European Equity Index Fund 54 MSCI Europe GR Index 2 2.83
International Bond Index Fund 103 S&P/Citigroup International Treasury Bond Ex-US Total Return Index 3 2.82
Information Technology Fund 232 Nasdaq 100 Total Return Index 7 2.74 International Brands Fund 31 S&P 500 Total Return Index 1 2.84 Equity Fund 18,066 S&P/TSX Composite Total Return Index 488 2.68
Certain Funds that invest in underlying mutual funds are exposed to indirect equity price risk in the event that the underlying mutual funds invest in equity securities.
As at December 31, 2016, had the benchmark of each of the following Funds increased or decreased by 3 percent, with all other variables held constant, the NAAC of those Funds would have increased or decreased by approximately the amounts shown in the table below.
Fund Equity Exposure
(000’s) Benchmark Impact on
NAAC (000’s)
Impact on NAAC
(%)
Asset Allocation Fund $13,226 50% FTSE TMX Canada Universe Bond Index 50% S&P/TSX Composite Total Return Index $394 1.58
Bond Fund 157 FTSE TMX Canada Universe Bond Index 5 2.77
Canadian Communications Fund 127 MSCI US Investable Market Index (IMI)/Telecommunication Services 25/50 4 3.23
Canadian Financial Services Fund 320 S&P/TSX Capped Financials Total Return Index 9 2.86
Canadian Resources Fund 106 65% S&P/TSX Capped Energy Index 35% S&P/TSX Capped Materials Index 3 2.87
Canadian Growth Fund 158 S&P/TSX Composite Total Return Index 4 2.67 Canadian Small Cap Fund 70 S&P/TSX Small Cap Price Return Index 2 2.75 Dividend Fund 4,221 S&P/TSX 60 Total Return Index 88 1.64 Canadian-35 Index Fund 11,929 S&P/TSX 60 Price Return Index 352 2.93 American Asset Allocation Fund 114 S&P 500 Composite Total Return Index 2 1.90 American Equity Index Fund 121 S&P 500 Composite Total Return Index 3 2.42 Can-Emerge Fund 1,285 MSCI Emerging Markets Index 35 2.72 European Equity Index Fund 47 MSCI Europe 1 2.77
International Bond Index Fund 132 S&P/Citi International Treasury Bond Total Return Index 4 2.78
Information Technology Fund 195 Nasdaq Index 5 2.50 International Brands Fund 28 S&P 500 Composite Total Return Index 1 2.73 Equity Fund 17,491 S&P/TSX Composite Total Return Index 461 2.55
Interest rate risk Interest rate risk arises from the effects of fluctuations in the prevailing levels of market interest rates on the fair value of financial assets and liabilities and future cash flows. The Funds hold fixed income securities that expose the Funds to interest rate risk. An increase in prevailing interest rates will generally cause the value of fixed income securities to decline, while a decrease in such rates will generally cause the value of such securities to increase. Accordingly, the portion of a Fund that is invested in fixed income securities will reflect this inverse relationship between interest rates and the price of securities. In addition, the longer the time to maturity of a particular debt instrument held by a Fund, the greater price volatility it will have.
120
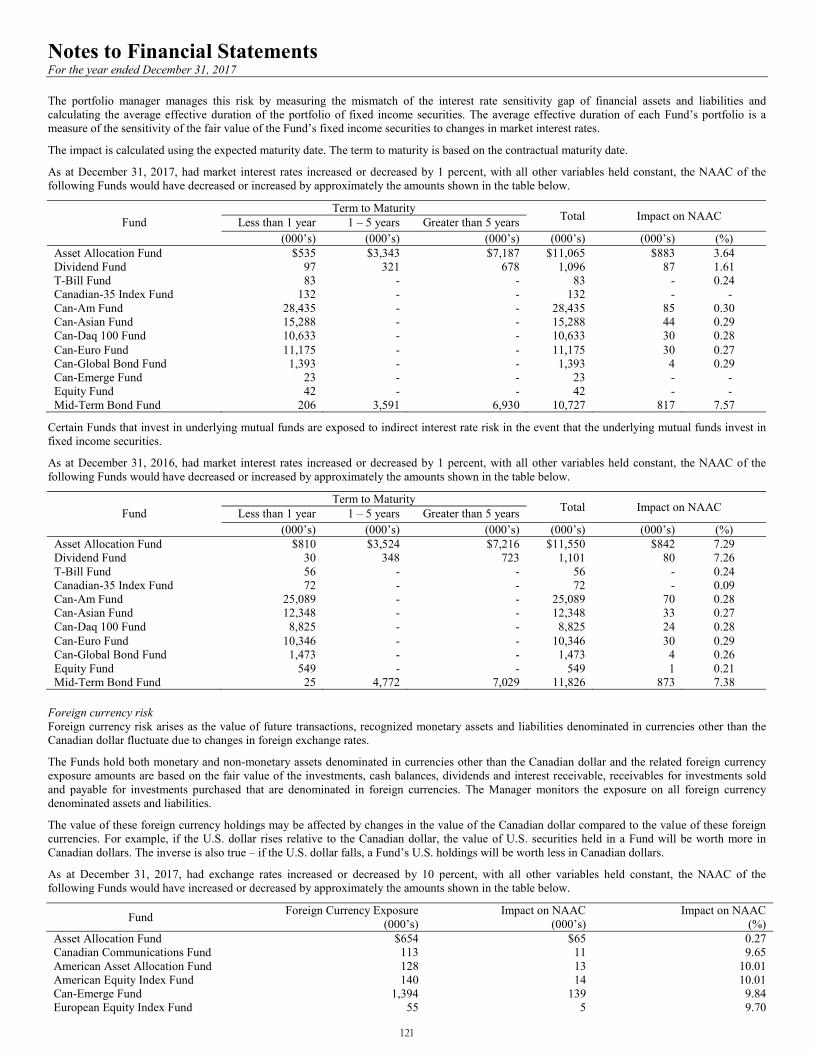
Notes to Financial Statements For the year ended December 31, 2017 The portfolio manager manages this risk by measuring the mismatch of the interest rate sensitivity gap of financial assets and liabilities and calculating the average effective duration of the portfolio of fixed income securities. The average effective duration of each Fund’s portfolio is a measure of the sensitivity of the fair value of the Fund’s fixed income securities to changes in market interest rates.
The impact is calculated using the expected maturity date. The term to maturity is based on the contractual maturity date.
As at December 31, 2017, had market interest rates increased or decreased by 1 percent, with all other variables held constant, the NAAC of the following Funds would have decreased or increased by approximately the amounts shown in the table below.
Term to Maturity Total Impact on NAAC Fund Less than 1 year 1 – 5 years Greater than 5 years
(000’s) (000’s) (000’s) (000’s) (000’s) (%) Asset Allocation Fund $535 $3,343 $7,187 $11,065 $883 3.64 Dividend Fund 97 321 678 1,096 87 1.61 T-Bill Fund 83 - - 83 - 0.24 Canadian-35 Index Fund 132 - - 132 - - Can-Am Fund 28,435 - - 28,435 85 0.30 Can-Asian Fund 15,288 - - 15,288 44 0.29 Can-Daq 100 Fund 10,633 - - 10,633 30 0.28 Can-Euro Fund 11,175 - - 11,175 30 0.27 Can-Global Bond Fund 1,393 - - 1,393 4 0.29 Can-Emerge Fund 23 - - 23 - - Equity Fund 42 - - 42 - - Mid-Term Bond Fund 206 3,591 6,930 10,727 817 7.57
Certain Funds that invest in underlying mutual funds are exposed to indirect interest rate risk in the event that the underlying mutual funds invest in fixed income securities.
As at December 31, 2016, had market interest rates increased or decreased by 1 percent, with all other variables held constant, the NAAC of the following Funds would have decreased or increased by approximately the amounts shown in the table below.
Term to Maturity Total Impact on NAAC Fund Less than 1 year 1 – 5 years Greater than 5 years
(000’s) (000’s) (000’s) (000’s) (000’s) (%) Asset Allocation Fund $810 $3,524 $7,216 $11,550 $842 7.29 Dividend Fund 30 348 723 1,101 80 7.26 T-Bill Fund 56 - - 56 - 0.24 Canadian-35 Index Fund 72 - - 72 - 0.09 Can-Am Fund 25,089 - - 25,089 70 0.28 Can-Asian Fund 12,348 - - 12,348 33 0.27 Can-Daq 100 Fund 8,825 - - 8,825 24 0.28 Can-Euro Fund 10,346 - - 10,346 30 0.29 Can-Global Bond Fund 1,473 - - 1,473 4 0.26 Equity Fund 549 - - 549 1 0.21 Mid-Term Bond Fund 25 4,772 7,029 11,826 873 7.38
Foreign currency risk Foreign currency risk arises as the value of future transactions, recognized monetary assets and liabilities denominated in currencies other than the Canadian dollar fluctuate due to changes in foreign exchange rates.
The Funds hold both monetary and non-monetary assets denominated in currencies other than the Canadian dollar and the related foreign currency exposure amounts are based on the fair value of the investments, cash balances, dividends and interest receivable, receivables for investments sold and payable for investments purchased that are denominated in foreign currencies. The Manager monitors the exposure on all foreign currency denominated assets and liabilities.
The value of these foreign currency holdings may be affected by changes in the value of the Canadian dollar compared to the value of these foreign currencies. For example, if the U.S. dollar rises relative to the Canadian dollar, the value of U.S. securities held in a Fund will be worth more in Canadian dollars. The inverse is also true – if the U.S. dollar falls, a Fund’s U.S. holdings will be worth less in Canadian dollars.
As at December 31, 2017, had exchange rates increased or decreased by 10 percent, with all other variables held constant, the NAAC of the following Funds would have increased or decreased by approximately the amounts shown in the table below.
Fund Foreign Currency Exposure (000’s)
Impact on NAAC (000’s)
Impact on NAAC (%)
Asset Allocation Fund $654 $65 0.27 Canadian Communications Fund 113 11 9.65 American Asset Allocation Fund 128 13 10.01 American Equity Index Fund 140 14 10.01 Can-Emerge Fund 1,394 139 9.84 European Equity Index Fund 55 5 9.70
121
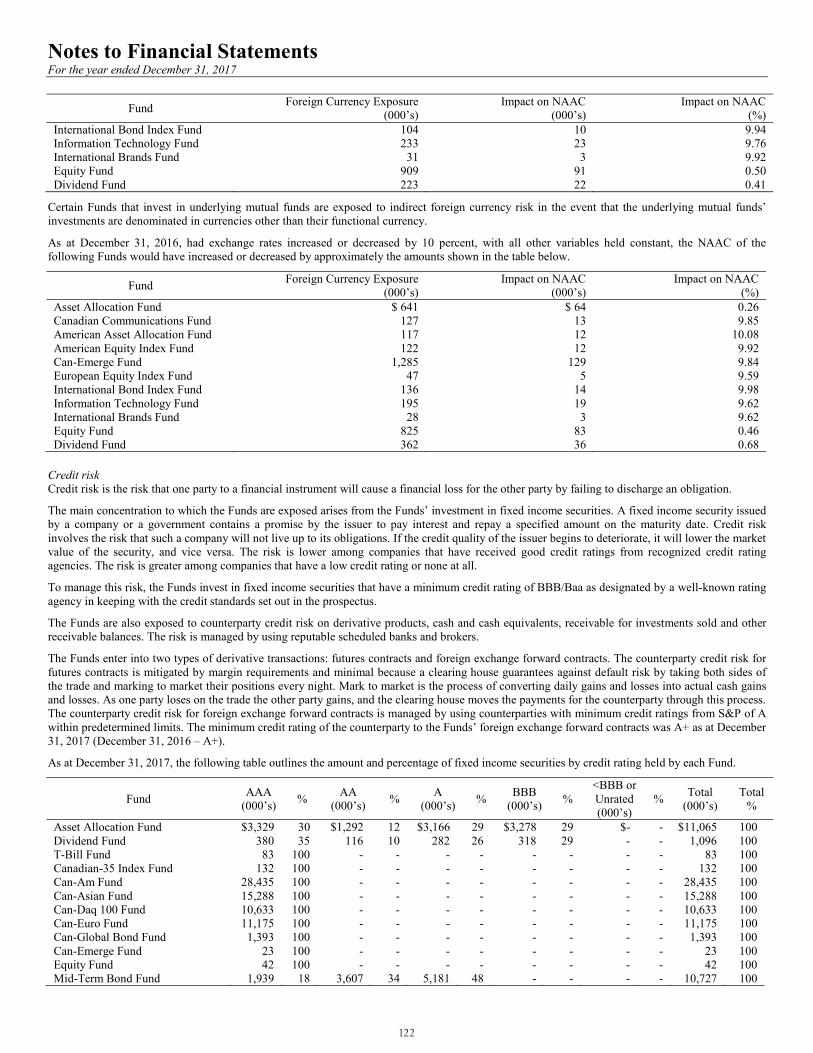
Notes to Financial Statements For the year ended December 31, 2017
Fund Foreign Currency Exposure (000’s)
Impact on NAAC (000’s)
Impact on NAAC (%)
International Bond Index Fund 104 10 9.94 Information Technology Fund 233 23 9.76 International Brands Fund 31 3 9.92 Equity Fund 909 91 0.50 Dividend Fund 223 22 0.41
Certain Funds that invest in underlying mutual funds are exposed to indirect foreign currency risk in the event that the underlying mutual funds’ investments are denominated in currencies other than their functional currency.
As at December 31, 2016, had exchange rates increased or decreased by 10 percent, with all other variables held constant, the NAAC of the following Funds would have increased or decreased by approximately the amounts shown in the table below.
Fund Foreign Currency Exposure (000’s)
Impact on NAAC (000’s)
Impact on NAAC (%)
Asset Allocation Fund $ 641 $ 64 0.26 Canadian Communications Fund 127 13 9.85 American Asset Allocation Fund 117 12 10.08 American Equity Index Fund 122 12 9.92 Can-Emerge Fund 1,285 129 9.84 European Equity Index Fund 47 5 9.59 International Bond Index Fund 136 14 9.98 Information Technology Fund 195 19 9.62 International Brands Fund 28 3 9.62 Equity Fund 825 83 0.46 Dividend Fund 362 36 0.68
Credit risk Credit risk is the risk that one party to a financial instrument will cause a financial loss for the other party by failing to discharge an obligation.
The main concentration to which the Funds are exposed arises from the Funds’ investment in fixed income securities. A fixed income security issued by a company or a government contains a promise by the issuer to pay interest and repay a specified amount on the maturity date. Credit risk involves the risk that such a company will not live up to its obligations. If the credit quality of the issuer begins to deteriorate, it will lower the market value of the security, and vice versa. The risk is lower among companies that have received good credit ratings from recognized credit rating agencies. The risk is greater among companies that have a low credit rating or none at all.
To manage this risk, the Funds invest in fixed income securities that have a minimum credit rating of BBB/Baa as designated by a well-known rating agency in keeping with the credit standards set out in the prospectus.
The Funds are also exposed to counterparty credit risk on derivative products, cash and cash equivalents, receivable for investments sold and other receivable balances. The risk is managed by using reputable scheduled banks and brokers.
The Funds enter into two types of derivative transactions: futures contracts and foreign exchange forward contracts. The counterparty credit risk for futures contracts is mitigated by margin requirements and minimal because a clearing house guarantees against default risk by taking both sides of the trade and marking to market their positions every night. Mark to market is the process of converting daily gains and losses into actual cash gains and losses. As one party loses on the trade the other party gains, and the clearing house moves the payments for the counterparty through this process. The counterparty credit risk for foreign exchange forward contracts is managed by using counterparties with minimum credit ratings from S&P of A within predetermined limits. The minimum credit rating of the counterparty to the Funds’ foreign exchange forward contracts was A+ as at December 31, 2017 (December 31, 2016 – A+).
As at December 31, 2017, the following table outlines the amount and percentage of fixed income securities by credit rating held by each Fund.
Fund AAA (000’s) % AA
(000’s) % A (000’s) % BBB
(000’s) % <BBB or Unrated (000’s)
% Total (000’s)
Total %
Asset Allocation Fund $3,329 30 $1,292 12 $3,166 29 $3,278 29 $- - $11,065 100 Dividend Fund 380 35 116 10 282 26 318 29 - - 1,096 100 T-Bill Fund 83 100 - - - - - - - - 83 100 Canadian-35 Index Fund 132 100 - - - - - - - - 132 100 Can-Am Fund 28,435 100 - - - - - - - - 28,435 100 Can-Asian Fund 15,288 100 - - - - - - - - 15,288 100 Can-Daq 100 Fund 10,633 100 - - - - - - - - 10,633 100 Can-Euro Fund 11,175 100 - - - - - - - - 11,175 100 Can-Global Bond Fund 1,393 100 - - - - - - - - 1,393 100 Can-Emerge Fund 23 100 - - - - - - - - 23 100 Equity Fund 42 100 - - - - - - - - 42 100 Mid-Term Bond Fund 1,939 18 3,607 34 5,181 48 - - - - 10,727 100
122
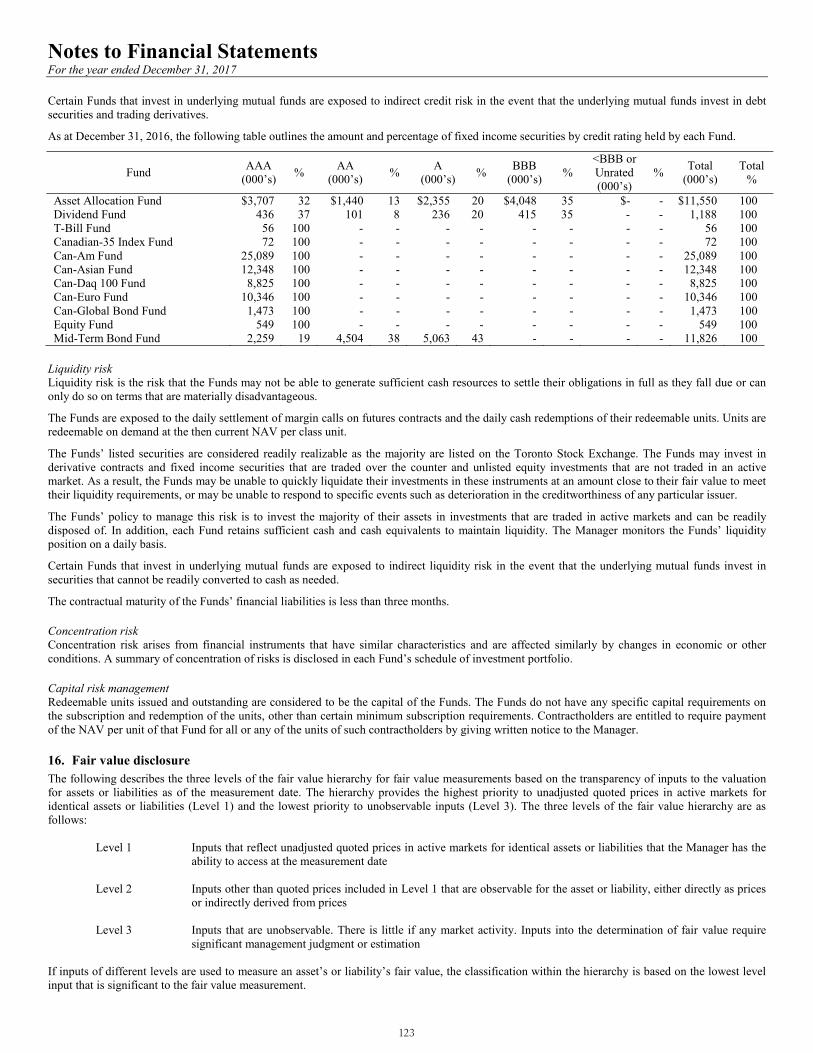
Notes to Financial Statements For the year ended December 31, 2017 Certain Funds that invest in underlying mutual funds are exposed to indirect credit risk in the event that the underlying mutual funds invest in debt securities and trading derivatives.
As at December 31, 2016, the following table outlines the amount and percentage of fixed income securities by credit rating held by each Fund.
Fund AAA (000’s) % AA
(000’s) % A (000’s) % BBB
(000’s) % <BBB or Unrated (000’s)
% Total (000’s)
Total %
Asset Allocation Fund $3,707 32 $1,440 13 $2,355 20 $4,048 35 $- - $11,550 100 Dividend Fund 436 37 101 8 236 20 415 35 - - 1,188 100 T-Bill Fund 56 100 - - - - - - - - 56 100 Canadian-35 Index Fund 72 100 - - - - - - - - 72 100 Can-Am Fund 25,089 100 - - - - - - - - 25,089 100 Can-Asian Fund 12,348 100 - - - - - - - - 12,348 100 Can-Daq 100 Fund 8,825 100 - - - - - - - - 8,825 100 Can-Euro Fund 10,346 100 - - - - - - - - 10,346 100 Can-Global Bond Fund 1,473 100 - - - - - - - - 1,473 100 Equity Fund 549 100 - - - - - - - - 549 100 Mid-Term Bond Fund 2,259 19 4,504 38 5,063 43 - - - - 11,826 100
Liquidity risk Liquidity risk is the risk that the Funds may not be able to generate sufficient cash resources to settle their obligations in full as they fall due or can only do so on terms that are materially disadvantageous.
The Funds are exposed to the daily settlement of margin calls on futures contracts and the daily cash redemptions of their redeemable units. Units are redeemable on demand at the then current NAV per class unit.
The Funds’ listed securities are considered readily realizable as the majority are listed on the Toronto Stock Exchange. The Funds may invest in derivative contracts and fixed income securities that are traded over the counter and unlisted equity investments that are not traded in an active market. As a result, the Funds may be unable to quickly liquidate their investments in these instruments at an amount close to their fair value to meet their liquidity requirements, or may be unable to respond to specific events such as deterioration in the creditworthiness of any particular issuer.
The Funds’ policy to manage this risk is to invest the majority of their assets in investments that are traded in active markets and can be readily disposed of. In addition, each Fund retains sufficient cash and cash equivalents to maintain liquidity. The Manager monitors the Funds’ liquidity position on a daily basis.
Certain Funds that invest in underlying mutual funds are exposed to indirect liquidity risk in the event that the underlying mutual funds invest in securities that cannot be readily converted to cash as needed.
The contractual maturity of the Funds’ financial liabilities is less than three months.
Concentration risk Concentration risk arises from financial instruments that have similar characteristics and are affected similarly by changes in economic or other conditions. A summary of concentration of risks is disclosed in each Fund’s schedule of investment portfolio.
Capital risk management Redeemable units issued and outstanding are considered to be the capital of the Funds. The Funds do not have any specific capital requirements on the subscription and redemption of the units, other than certain minimum subscription requirements. Contractholders are entitled to require payment of the NAV per unit of that Fund for all or any of the units of such contractholders by giving written notice to the Manager.
16. Fair value disclosure The following describes the three levels of the fair value hierarchy for fair value measurements based on the transparency of inputs to the valuation for assets or liabilities as of the measurement date. The hierarchy provides the highest priority to unadjusted quoted prices in active markets for identical assets or liabilities (Level 1) and the lowest priority to unobservable inputs (Level 3). The three levels of the fair value hierarchy are as follows:
Level 1 Inputs that reflect unadjusted quoted prices in active markets for identical assets or liabilities that the Manager has the ability to access at the measurement date
Level 2 Inputs other than quoted prices included in Level 1 that are observable for the asset or liability, either directly as prices
or indirectly derived from prices Level 3 Inputs that are unobservable. There is little if any market activity. Inputs into the determination of fair value require
significant management judgment or estimation If inputs of different levels are used to measure an asset’s or liability’s fair value, the classification within the hierarchy is based on the lowest level input that is significant to the fair value measurement.
123
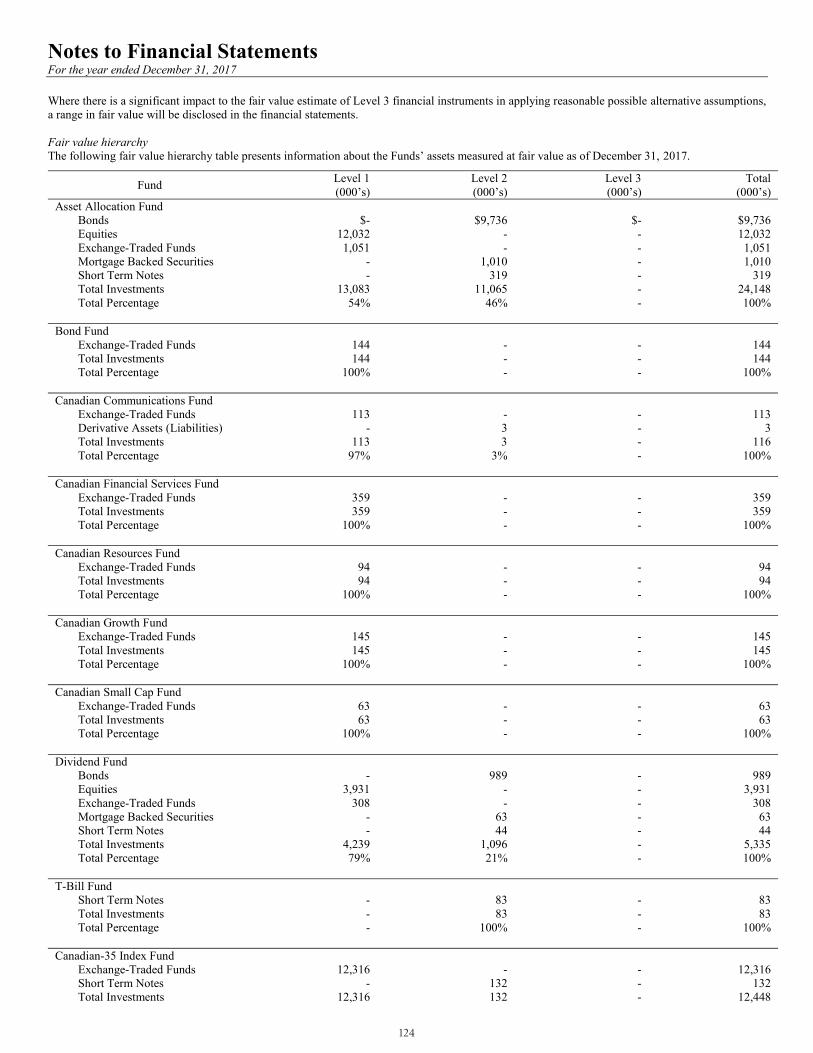
Notes to Financial Statements For the year ended December 31, 2017 Where there is a significant impact to the fair value estimate of Level 3 financial instruments in applying reasonable possible alternative assumptions, a range in fair value will be disclosed in the financial statements. Fair value hierarchy The following fair value hierarchy table presents information about the Funds’ assets measured at fair value as of December 31, 2017.
Fund Level 1 (000’s)
Level 2 (000’s)
Level 3 (000’s)
Total (000’s)
Asset Allocation Fund Bonds $- $9,736 $- $9,736 Equities 12,032 - - 12,032 Exchange-Traded Funds 1,051 - - 1,051 Mortgage Backed Securities - 1,010 - 1,010 Short Term Notes - 319 - 319 Total Investments 13,083 11,065 - 24,148 Total Percentage 54% 46% - 100%
Bond Fund Exchange-Traded Funds 144 - - 144 Total Investments 144 - - 144 Total Percentage 100% - - 100% Canadian Communications Fund Exchange-Traded Funds 113 - - 113 Derivative Assets (Liabilities) - 3 - 3 Total Investments 113 3 - 116 Total Percentage 97% 3% - 100% Canadian Financial Services Fund Exchange-Traded Funds 359 - - 359 Total Investments 359 - - 359 Total Percentage 100% - - 100% Canadian Resources Fund Exchange-Traded Funds 94 - - 94 Total Investments 94 - - 94 Total Percentage 100% - - 100% Canadian Growth Fund Exchange-Traded Funds 145 - - 145 Total Investments 145 - - 145 Total Percentage 100% - - 100% Canadian Small Cap Fund Exchange-Traded Funds 63 - - 63 Total Investments 63 - - 63 Total Percentage 100% - - 100% Dividend Fund Bonds - 989 - 989 Equities 3,931 - - 3,931 Exchange-Traded Funds 308 - - 308 Mortgage Backed Securities - 63 - 63 Short Term Notes - 44 - 44 Total Investments 4,239 1,096 - 5,335 Total Percentage 79% 21% - 100% T-Bill Fund Short Term Notes - 83 - 83 Total Investments - 83 - 83 Total Percentage - 100% - 100%
Canadian-35 Index Fund Exchange-Traded Funds 12,316 - - 12,316 Short Term Notes - 132 - 132 Total Investments 12,316 132 - 12,448
124
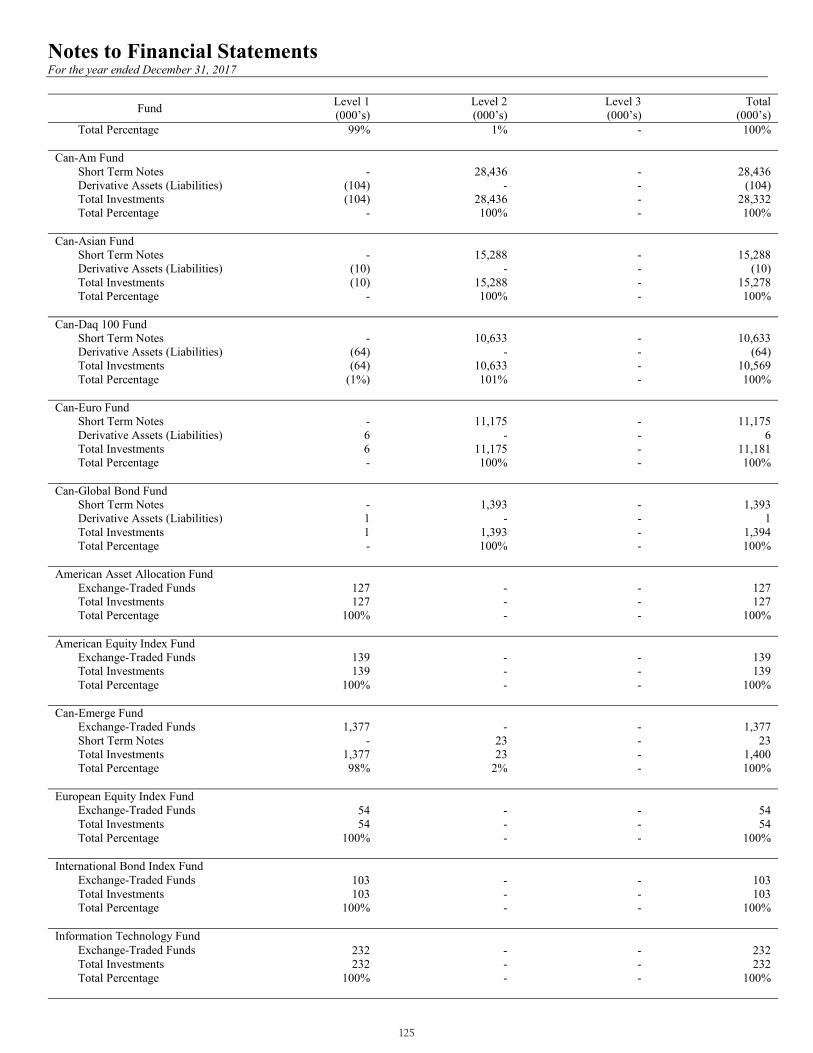
Notes to Financial Statements For the year ended December 31, 2017
Fund Level 1 (000’s)
Level 2 (000’s)
Level 3 (000’s)
Total (000’s)
Total Percentage 99% 1% - 100%
Can-Am Fund Short Term Notes - 28,436 - 28,436 Derivative Assets (Liabilities) (104) - - (104) Total Investments (104) 28,436 - 28,332
Total Percentage - 100% - 100%
Can-Asian Fund Short Term Notes - 15,288 - 15,288 Derivative Assets (Liabilities) (10) - - (10) Total Investments (10) 15,288 - 15,278 Total Percentage - 100% - 100% Can-Daq 100 Fund Short Term Notes - 10,633 - 10,633 Derivative Assets (Liabilities) (64) - - (64) Total Investments (64) 10,633 - 10,569
Total Percentage (1%) 101% - 100%
Can-Euro Fund Short Term Notes - 11,175 - 11,175 Derivative Assets (Liabilities) 6 - - 6 Total Investments 6 11,175 - 11,181 Total Percentage - 100% - 100%
Can-Global Bond Fund Short Term Notes - 1,393 - 1,393 Derivative Assets (Liabilities) 1 - - 1 Total Investments 1 1,393 - 1,394 Total Percentage - 100% - 100% American Asset Allocation Fund Exchange-Traded Funds 127 - - 127 Total Investments 127 - - 127 Total Percentage 100% - - 100%
American Equity Index Fund Exchange-Traded Funds 139 - - 139 Total Investments 139 - - 139 Total Percentage 100% - - 100%
Can-Emerge Fund Exchange-Traded Funds 1,377 - - 1,377 Short Term Notes - 23 - 23 Total Investments 1,377 23 - 1,400 Total Percentage 98% 2% - 100%
European Equity Index Fund Exchange-Traded Funds 54 - - 54 Total Investments 54 - - 54 Total Percentage 100% - - 100%
International Bond Index Fund Exchange-Traded Funds 103 - - 103 Total Investments 103 - - 103 Total Percentage 100% - - 100%
Information Technology Fund Exchange-Traded Funds 232 - - 232 Total Investments 232 - - 232 Total Percentage 100% - - 100%
125
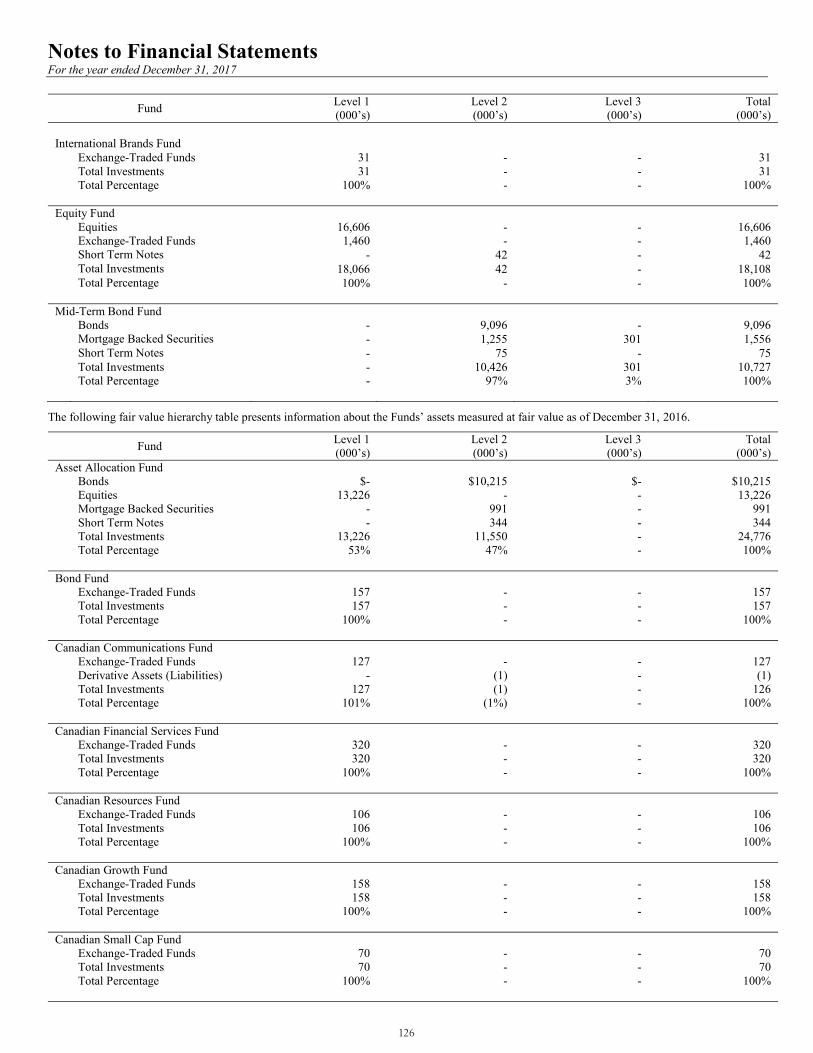
Notes to Financial Statements For the year ended December 31, 2017
Fund Level 1 (000’s)
Level 2 (000’s)
Level 3 (000’s)
Total (000’s)
International Brands Fund Exchange-Traded Funds 31 - - 31 Total Investments 31 - - 31 Total Percentage 100% - - 100%
Equity Fund Equities 16,606 - - 16,606 Exchange-Traded Funds 1,460 - - 1,460 Short Term Notes - 42 - 42 Total Investments 18,066 42 - 18,108
Total Percentage 100% - - 100%
Mid-Term Bond Fund Bonds - 9,096 - 9,096 Mortgage Backed Securities - 1,255 301 1,556 Short Term Notes - 75 - 75 Total Investments - 10,426 301 10,727 Total Percentage - 97% 3% 100%
The following fair value hierarchy table presents information about the Funds’ assets measured at fair value as of December 31, 2016.
Fund Level 1 (000’s)
Level 2 (000’s)
Level 3 (000’s)
Total (000’s)
Asset Allocation Fund Bonds $- $10,215 $- $10,215 Equities 13,226 - - 13,226 Mortgage Backed Securities - 991 - 991 Short Term Notes - 344 - 344 Total Investments 13,226 11,550 - 24,776 Total Percentage 53% 47% - 100%
Bond Fund Exchange-Traded Funds 157 - - 157 Total Investments 157 - - 157 Total Percentage 100% - - 100% Canadian Communications Fund Exchange-Traded Funds 127 - - 127 Derivative Assets (Liabilities) - (1) - (1) Total Investments 127 (1) - 126 Total Percentage 101% (1%) - 100% Canadian Financial Services Fund Exchange-Traded Funds 320 - - 320 Total Investments 320 - - 320 Total Percentage 100% - - 100% Canadian Resources Fund Exchange-Traded Funds 106 - - 106 Total Investments 106 - - 106 Total Percentage 100% - - 100% Canadian Growth Fund Exchange-Traded Funds 158 - - 158 Total Investments 158 - - 158 Total Percentage 100% - - 100% Canadian Small Cap Fund Exchange-Traded Funds 70 - - 70 Total Investments 70 - - 70 Total Percentage 100% - - 100%
126
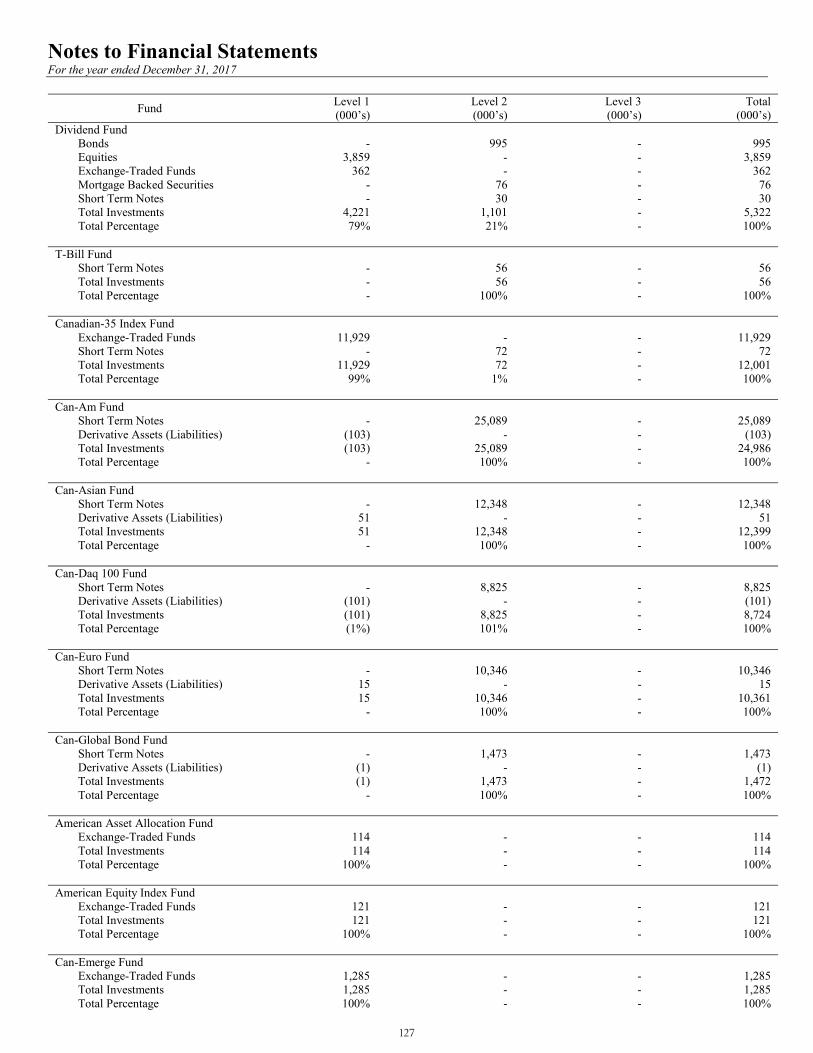
Notes to Financial Statements For the year ended December 31, 2017
Fund Level 1 (000’s)
Level 2 (000’s)
Level 3 (000’s)
Total (000’s)
Dividend Fund Bonds - 995 - 995 Equities 3,859 - - 3,859 Exchange-Traded Funds 362 - - 362 Mortgage Backed Securities - 76 - 76 Short Term Notes - 30 - 30 Total Investments 4,221 1,101 - 5,322 Total Percentage 79% 21% - 100% T-Bill Fund Short Term Notes - 56 - 56 Total Investments - 56 - 56 Total Percentage - 100% - 100%
Canadian-35 Index Fund Exchange-Traded Funds 11,929 - - 11,929 Short Term Notes - 72 - 72 Total Investments 11,929 72 - 12,001 Total Percentage 99% 1% - 100%
Can-Am Fund Short Term Notes - 25,089 - 25,089 Derivative Assets (Liabilities) (103) - - (103) Total Investments (103) 25,089 - 24,986
Total Percentage - 100% - 100%
Can-Asian Fund Short Term Notes - 12,348 - 12,348 Derivative Assets (Liabilities) 51 - - 51 Total Investments 51 12,348 - 12,399 Total Percentage - 100% - 100% Can-Daq 100 Fund Short Term Notes - 8,825 - 8,825 Derivative Assets (Liabilities) (101) - - (101) Total Investments (101) 8,825 - 8,724
Total Percentage (1%) 101% - 100%
Can-Euro Fund Short Term Notes - 10,346 - 10,346 Derivative Assets (Liabilities) 15 - - 15 Total Investments 15 10,346 - 10,361 Total Percentage - 100% - 100%
Can-Global Bond Fund Short Term Notes - 1,473 - 1,473 Derivative Assets (Liabilities) (1) - - (1) Total Investments (1) 1,473 - 1,472 Total Percentage - 100% - 100% American Asset Allocation Fund Exchange-Traded Funds 114 - - 114 Total Investments 114 - - 114 Total Percentage 100% - - 100%
American Equity Index Fund Exchange-Traded Funds 121 - - 121 Total Investments 121 - - 121 Total Percentage 100% - - 100%
Can-Emerge Fund Exchange-Traded Funds 1,285 - - 1,285 Total Investments 1,285 - - 1,285 Total Percentage 100% - - 100%
127
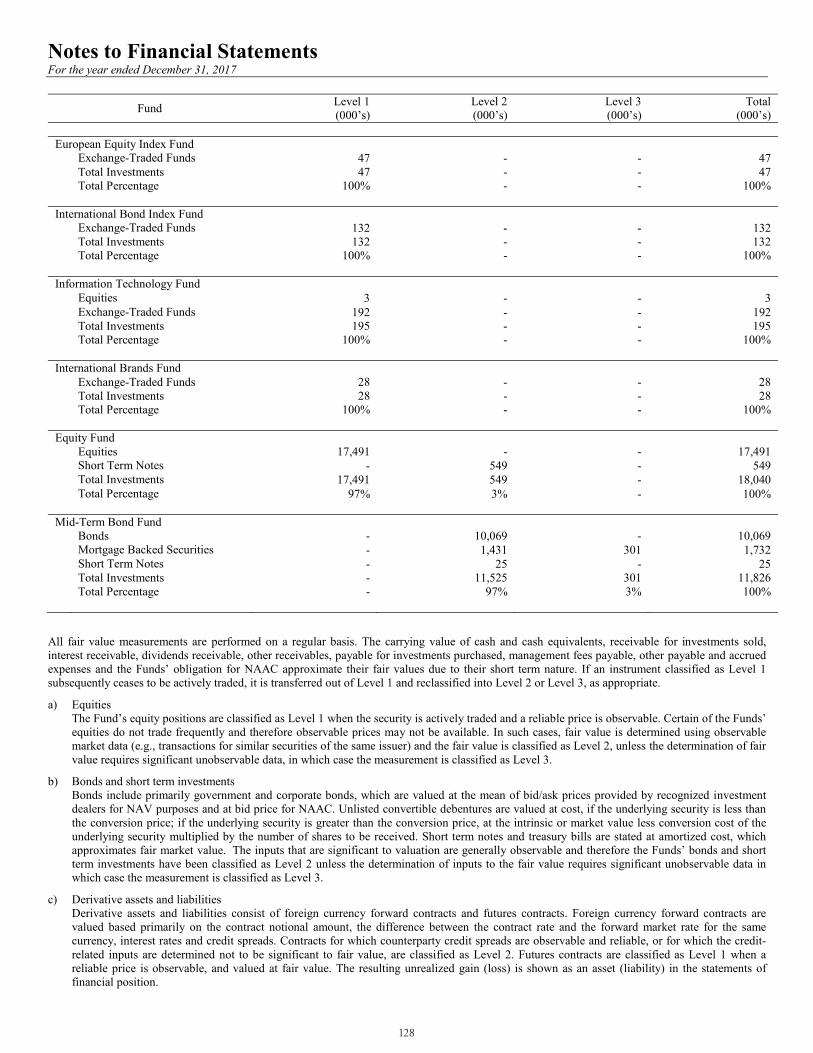
Notes to Financial Statements For the year ended December 31, 2017
Fund Level 1 (000’s)
Level 2 (000’s)
Level 3 (000’s)
Total (000’s)
European Equity Index Fund Exchange-Traded Funds 47 - - 47 Total Investments 47 - - 47 Total Percentage 100% - - 100%
International Bond Index Fund Exchange-Traded Funds 132 - - 132 Total Investments 132 - - 132 Total Percentage 100% - - 100%
Information Technology Fund Equities 3 - - 3 Exchange-Traded Funds 192 - - 192 Total Investments 195 - - 195 Total Percentage 100% - - 100%
International Brands Fund Exchange-Traded Funds 28 - - 28 Total Investments 28 - - 28 Total Percentage 100% - - 100%
Equity Fund Equities 17,491 - - 17,491 Short Term Notes - 549 - 549 Total Investments 17,491 549 - 18,040
Total Percentage 97% 3% - 100%
Mid-Term Bond Fund Bonds - 10,069 - 10,069 Mortgage Backed Securities - 1,431 301 1,732 Short Term Notes - 25 - 25 Total Investments - 11,525 301 11,826 Total Percentage - 97% 3% 100%
All fair value measurements are performed on a regular basis. The carrying value of cash and cash equivalents, receivable for investments sold, interest receivable, dividends receivable, other receivables, payable for investments purchased, management fees payable, other payable and accrued expenses and the Funds’ obligation for NAAC approximate their fair values due to their short term nature. If an instrument classified as Level 1 subsequently ceases to be actively traded, it is transferred out of Level 1 and reclassified into Level 2 or Level 3, as appropriate.
a) Equities The Fund’s equity positions are classified as Level 1 when the security is actively traded and a reliable price is observable. Certain of the Funds’ equities do not trade frequently and therefore observable prices may not be available. In such cases, fair value is determined using observable market data (e.g., transactions for similar securities of the same issuer) and the fair value is classified as Level 2, unless the determination of fair value requires significant unobservable data, in which case the measurement is classified as Level 3.
b) Bonds and short term investments Bonds include primarily government and corporate bonds, which are valued at the mean of bid/ask prices provided by recognized investment dealers for NAV purposes and at bid price for NAAC. Unlisted convertible debentures are valued at cost, if the underlying security is less than the conversion price; if the underlying security is greater than the conversion price, at the intrinsic or market value less conversion cost of the underlying security multiplied by the number of shares to be received. Short term notes and treasury bills are stated at amortized cost, which approximates fair market value. The inputs that are significant to valuation are generally observable and therefore the Funds’ bonds and short term investments have been classified as Level 2 unless the determination of inputs to the fair value requires significant unobservable data in which case the measurement is classified as Level 3.
c) Derivative assets and liabilities Derivative assets and liabilities consist of foreign currency forward contracts and futures contracts. Foreign currency forward contracts are valued based primarily on the contract notional amount, the difference between the contract rate and the forward market rate for the same currency, interest rates and credit spreads. Contracts for which counterparty credit spreads are observable and reliable, or for which the credit-related inputs are determined not to be significant to fair value, are classified as Level 2. Futures contracts are classified as Level 1 when a reliable price is observable, and valued at fair value. The resulting unrealized gain (loss) is shown as an asset (liability) in the statements of financial position.
128
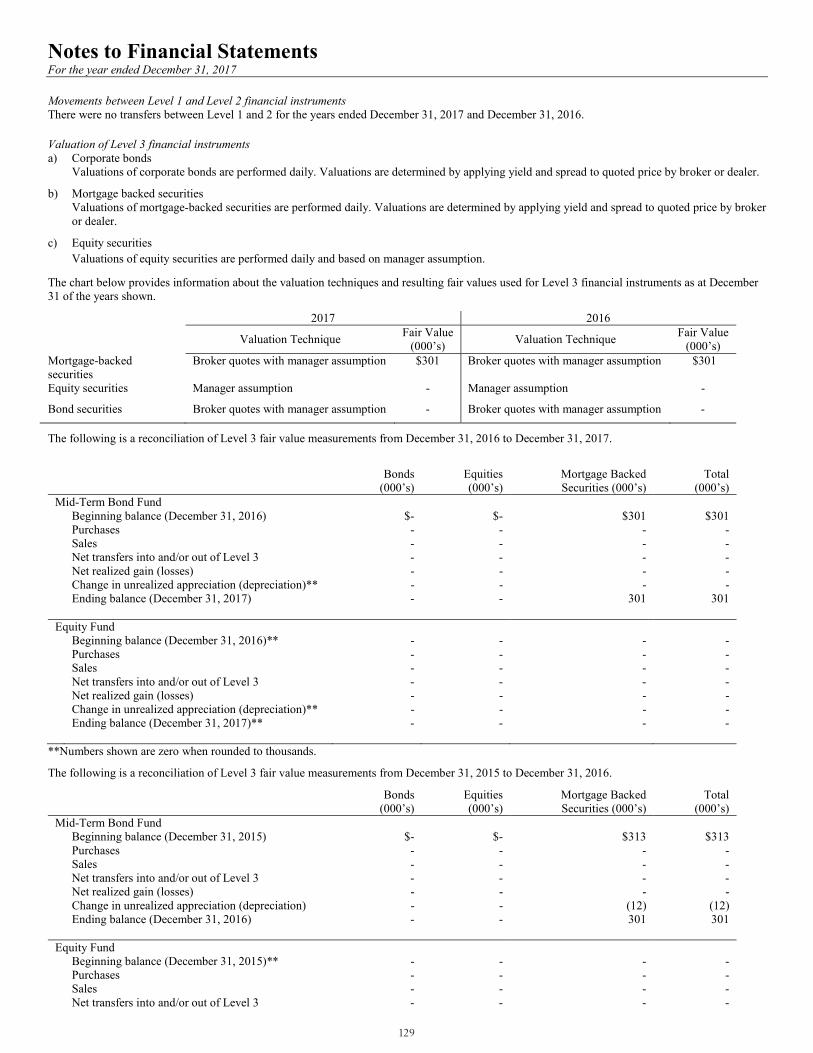
Notes to Financial Statements For the year ended December 31, 2017 Movements between Level 1 and Level 2 financial instruments There were no transfers between Level 1 and 2 for the years ended December 31, 2017 and December 31, 2016.
Valuation of Level 3 financial instruments a) Corporate bonds
Valuations of corporate bonds are performed daily. Valuations are determined by applying yield and spread to quoted price by broker or dealer.
b) Mortgage backed securities Valuations of mortgage-backed securities are performed daily. Valuations are determined by applying yield and spread to quoted price by broker or dealer.
c) Equity securities Valuations of equity securities are performed daily and based on manager assumption.
The chart below provides information about the valuation techniques and resulting fair values used for Level 3 financial instruments as at December 31 of the years shown.
2017 2016 Valuation Technique Fair Value
(000’s) Valuation Technique Fair Value (000’s)
Mortgage-backed securities
Broker quotes with manager assumption $301 Broker quotes with manager assumption $301
Equity securities Manager assumption - Manager assumption -
Bond securities Broker quotes with manager assumption - Broker quotes with manager assumption -
The following is a reconciliation of Level 3 fair value measurements from December 31, 2016 to December 31, 2017.
Bonds
(000’s) Equities (000’s)
Mortgage Backed Securities (000’s)
Total (000’s)
Mid-Term Bond Fund Beginning balance (December 31, 2016) $- $- $301 $301 Purchases - - - - Sales - - - - Net transfers into and/or out of Level 3 - - - - Net realized gain (losses) - - - - Change in unrealized appreciation (depreciation)** - - - - Ending balance (December 31, 2017) - - 301 301 Equity Fund Beginning balance (December 31, 2016)** - - - - Purchases - - - - Sales - - - - Net transfers into and/or out of Level 3 - - - - Net realized gain (losses) - - - - Change in unrealized appreciation (depreciation)** - - - - Ending balance (December 31, 2017)** - - - -
**Numbers shown are zero when rounded to thousands.
The following is a reconciliation of Level 3 fair value measurements from December 31, 2015 to December 31, 2016.
Bonds (000’s)
Equities (000’s)
Mortgage Backed Securities (000’s)
Total (000’s)
Mid-Term Bond Fund Beginning balance (December 31, 2015) $- $- $313 $313 Purchases - - - - Sales - - - - Net transfers into and/or out of Level 3 - - - - Net realized gain (losses) - - - - Change in unrealized appreciation (depreciation) - - (12) (12) Ending balance (December 31, 2016) - - 301 301 Equity Fund Beginning balance (December 31, 2015)** - - - - Purchases - - - - Sales - - - - Net transfers into and/or out of Level 3 - - - -
129
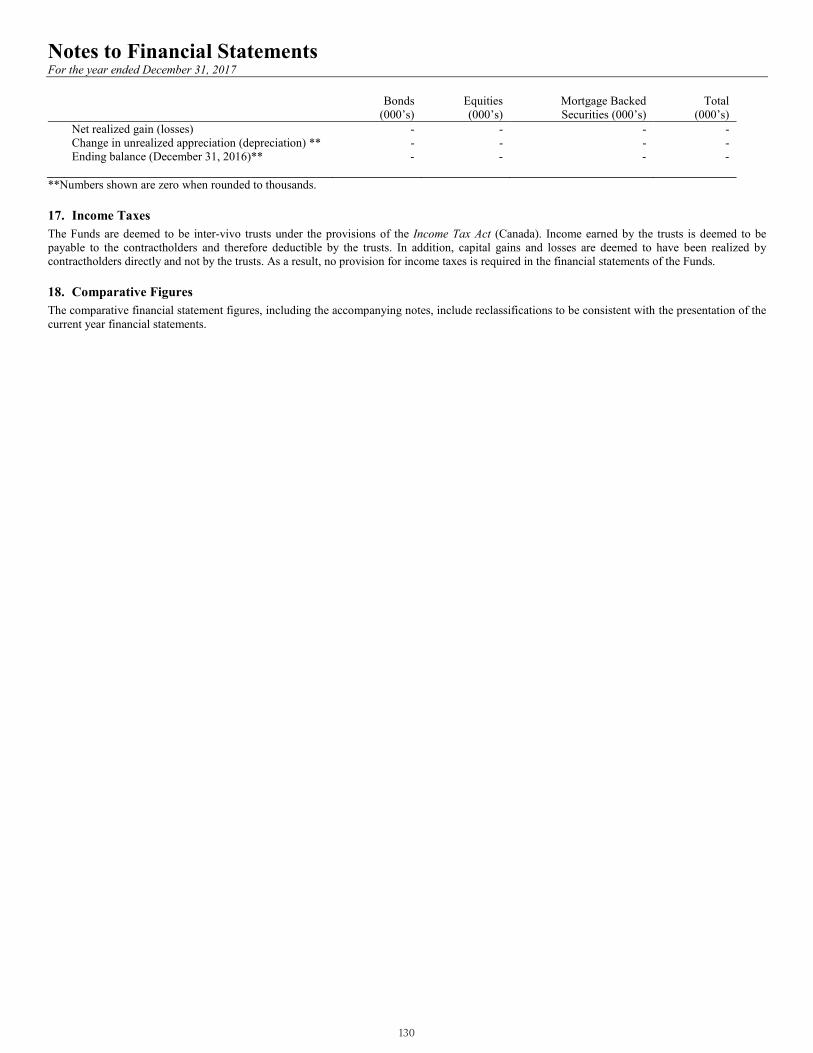
Notes to Financial Statements For the year ended December 31, 2017
Bonds (000’s)
Equities (000’s)
Mortgage Backed Securities (000’s)
Total (000’s)
Net realized gain (losses) - - - - Change in unrealized appreciation (depreciation) ** - - - - Ending balance (December 31, 2016)** - - - -
**Numbers shown are zero when rounded to thousands.
17. Income Taxes The Funds are deemed to be inter-vivo trusts under the provisions of the Income Tax Act (Canada). Income earned by the trusts is deemed to be payable to the contractholders and therefore deductible by the trusts. In addition, capital gains and losses are deemed to have been realized by contractholders directly and not by the trusts. As a result, no provision for income taxes is required in the financial statements of the Funds.
18. Comparative Figures The comparative financial statement figures, including the accompanying notes, include reclassifications to be consistent with the presentation of the current year financial statements.
130
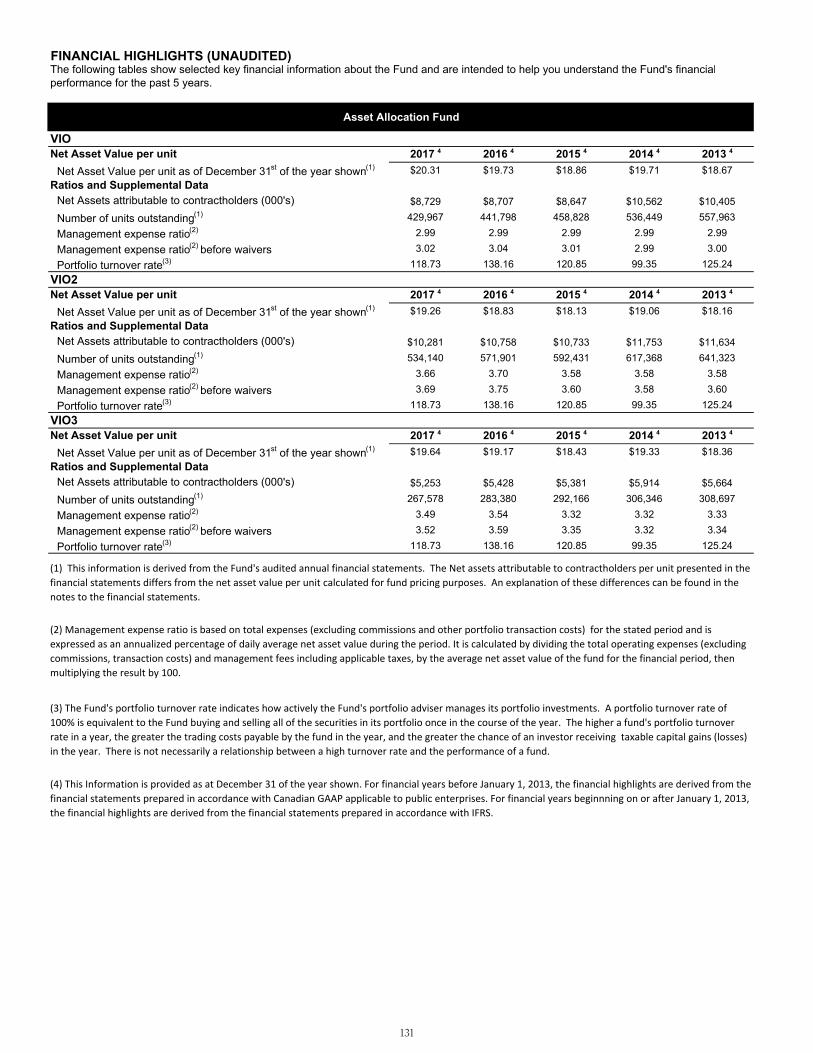
FINANCIAL HIGHLIGHTS (UNAUDITED)
VIONet Asset Value per unit 2017 4 2016 4 2015 4 2014 4 2013 4
Net Asset Value per unit as of December 31st of the year shown(1) $20.31 $19.73 $18.86 $19.71 $18.67 Ratios and Supplemental Data
Net Assets attributable to contractholders (000's) $8,729 $8,707 $8,647 $10,562 $10,405
Number of units outstanding(1) 429,967 441,798 458,828 536,449 557,963
Management expense ratio(2) 2.99 2.99 2.99 2.99 2.99
Management expense ratio(2) before waivers 3.02 3.04 3.01 2.99 3.00
Portfolio turnover rate(3) 118.73 138.16 120.85 99.35 125.24VIO2Net Asset Value per unit 2017 4 2016 4 2015 4 2014 4 2013 4
Net Asset Value per unit as of December 31st of the year shown(1) $19.26 $18.83 $18.13 $19.06 $18.16 Ratios and Supplemental Data
Net Assets attributable to contractholders (000's) $10,281 $10,758 $10,733 $11,753 $11,634
Number of units outstanding(1) 534,140 571,901 592,431 617,368 641,323
Management expense ratio(2) 3.66 3.70 3.58 3.58 3.58
Management expense ratio(2) before waivers 3.69 3.75 3.60 3.58 3.60
Portfolio turnover rate(3) 118.73 138.16 120.85 99.35 125.24VIO3Net Asset Value per unit 2017 4 2016 4 2015 4 2014 4 2013 4
Net Asset Value per unit as of December 31st of the year shown(1) $19.64 $19.17 $18.43 $19.33 $18.36 Ratios and Supplemental Data
Net Assets attributable to contractholders (000's) $5,253 $5,428 $5,381 $5,914 $5,664
Number of units outstanding(1) 267,578 283,380 292,166 306,346 308,697
Management expense ratio(2) 3.49 3.54 3.32 3.32 3.33
Management expense ratio(2) before waivers 3.52 3.59 3.35 3.32 3.34
Portfolio turnover rate(3) 118.73 138.16 120.85 99.35 125.24
(1) This information is derived from the Fund's audited annual financial statements. The Net assets attributable to contractholders per unit presented in the financial statements differs from the net asset value per unit calculated for fund pricing purposes. An explanation of these differences can be found in the notes to the financial statements.
(2) Management expense ratio is based on total expenses (excluding commissions and other portfolio transaction costs) for the stated period and is expressed as an annualized percentage of daily average net asset value during the period. It is calculated by dividing the total operating expenses (excluding commissions, transaction costs) and management fees including applicable taxes, by the average net asset value of the fund for the financial period, then multiplying the result by 100.
(3) The Fund's portfolio turnover rate indicates how actively the Fund's portfolio adviser manages its portfolio investments. A portfolio turnover rate of 100% is equivalent to the Fund buying and selling all of the securities in its portfolio once in the course of the year. The higher a fund's portfolio turnover rate in a year, the greater the trading costs payable by the fund in the year, and the greater the chance of an investor receiving taxable capital gains (losses) in the year. There is not necessarily a relationship between a high turnover rate and the performance of a fund.
(4) This Information is provided as at December 31 of the year shown. For financial years before January 1, 2013, the financial highlights are derived from the financial statements prepared in accordance with Canadian GAAP applicable to public enterprises. For financial years beginnning on or after January 1, 2013, the financial highlights are derived from the financial statements prepared in accordance with IFRS.
The following tables show selected key financial information about the Fund and are intended to help you understand the Fund's financialperformance for the past 5 years.
Asset Allocation Fund
131
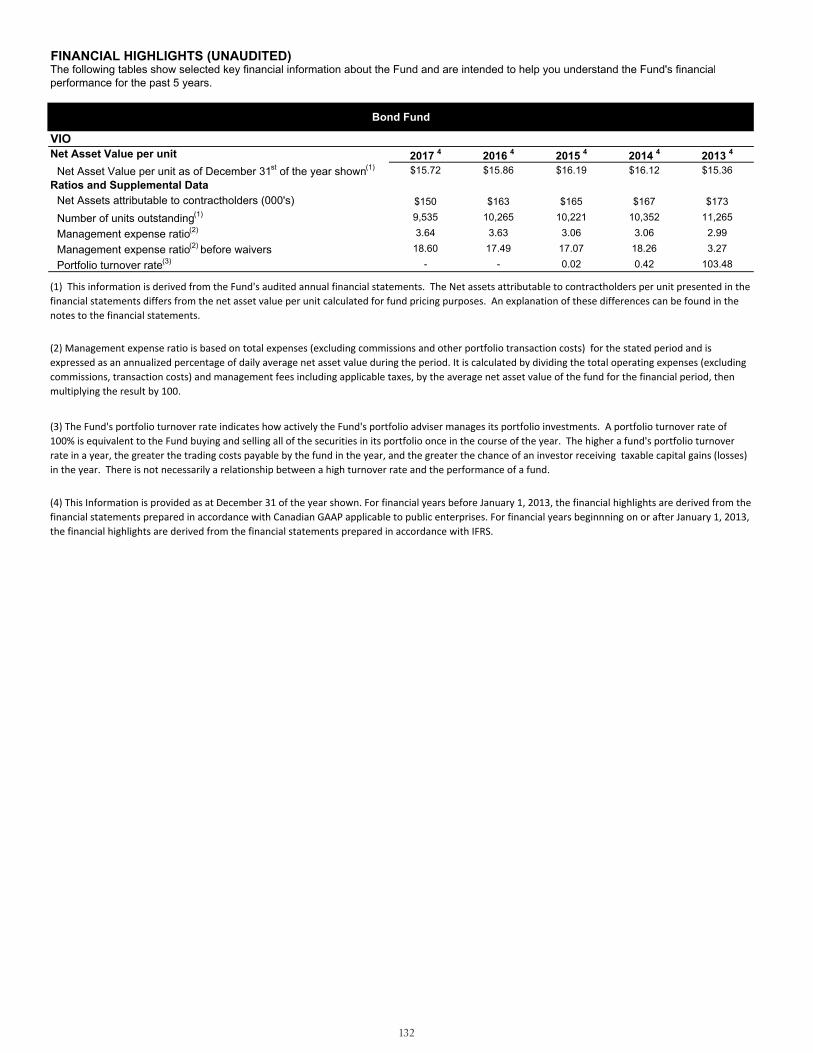
FINANCIAL HIGHLIGHTS (UNAUDITED)
VIONet Asset Value per unit 2017 4 2016 4 2015 4 2014 4 2013 4
Net Asset Value per unit as of December 31st of the year shown(1) $15.72 $15.86 $16.19 $16.12 $15.36 Ratios and Supplemental Data
Net Assets attributable to contractholders (000's) $150 $163 $165 $167 $173
Number of units outstanding(1) 9,535 10,265 10,221 10,352 11,265
Management expense ratio(2) 3.64 3.63 3.06 3.06 2.99
Management expense ratio(2) before waivers 18.60 17.49 17.07 18.26 3.27
Portfolio turnover rate(3) - - 0.02 0.42 103.48
The following tables show selected key financial information about the Fund and are intended to help you understand the Fund's financialperformance for the past 5 years.
(4) This Information is provided as at December 31 of the year shown. For financial years before January 1, 2013, the financial highlights are derived from the financial statements prepared in accordance with Canadian GAAP applicable to public enterprises. For financial years beginnning on or after January 1, 2013, the financial highlights are derived from the financial statements prepared in accordance with IFRS.
Bond Fund
(1) This information is derived from the Fund's audited annual financial statements. The Net assets attributable to contractholders per unit presented in the financial statements differs from the net asset value per unit calculated for fund pricing purposes. An explanation of these differences can be found in the notes to the financial statements.
(2) Management expense ratio is based on total expenses (excluding commissions and other portfolio transaction costs) for the stated period and is expressed as an annualized percentage of daily average net asset value during the period. It is calculated by dividing the total operating expenses (excluding commissions, transaction costs) and management fees including applicable taxes, by the average net asset value of the fund for the financial period, then multiplying the result by 100.
(3) The Fund's portfolio turnover rate indicates how actively the Fund's portfolio adviser manages its portfolio investments. A portfolio turnover rate of 100% is equivalent to the Fund buying and selling all of the securities in its portfolio once in the course of the year. The higher a fund's portfolio turnover rate in a year, the greater the trading costs payable by the fund in the year, and the greater the chance of an investor receiving taxable capital gains (losses) in the year. There is not necessarily a relationship between a high turnover rate and the performance of a fund.
132

FINANCIAL HIGHLIGHTS (UNAUDITED)
VIONet Asset Value per unit 2017 4 2016 4 2015 4 2014 4 2013 4
Net Asset Value per unit as of December 31st of the year shown(1) $11.88 $13.06 $11.32 $11.77 $11.93 Ratios and Supplemental Data
Net Assets attributable to contractholders (000's) $117 $128 $110 $114 $119
Number of units outstanding(1) 9,864 9,809 9,671 9,675 9,968
Management expense ratio(2) 4.01 4.03 3.45 3.46 3.42
Management expense ratio(2) before waivers 24.60 24.62 25.02 26.51 4.73
Portfolio turnover rate(3) 4.71 104.41 N/A N/A 126.55
The following tables show selected key financial information about the Fund and are intended to help you understand the Fund's financialperformance for the past 5 years.
(4) This Information is provided as at December 31 of the year shown. For financial years before January 1, 2013, the financial highlights are derived from the financial statements prepared in accordance with Canadian GAAP applicable to public enterprises. For financial years beginnning on or after January 1, 2013, the financial highlights are derived from the financial statements prepared in accordance with IFRS.
Canadian Communications Fund
(1) This information is derived from the Fund's audited annual financial statements. The Net assets attributable to contractholders per unit presented in the financial statements differs from the net asset value per unit calculated for fund pricing purposes. An explanation of these differences can be found in the notes to the financial statements.
(2) Management expense ratio is based on total expenses (excluding commissions and other portfolio transaction costs) for the stated period and is expressed as an annualized percentage of daily average net asset value during the period. It is calculated by dividing the total operating expenses (excluding commissions, transaction costs) and management fees including applicable taxes, by the average net asset value of the fund for the financial period, then multiplying the result by 100.
(3) The Fund's portfolio turnover rate indicates how actively the Fund's portfolio adviser manages its portfolio investments. A portfolio turnover rate of 100% is equivalent to the Fund buying and selling all of the securities in its portfolio once in the course of the year. The higher a fund's portfolio turnover rate in a year, the greater the trading costs payable by the fund in the year, and the greater the chance of an investor receiving taxable capital gains (losses) in the year. There is not necessarily a relationship between a high turnover rate and the performance of a fund.
133

FINANCIAL HIGHLIGHTS (UNAUDITED)
VIONet Asset Value per unit 2017 4 2016 4 2015 4 2014 4 2013 4
Net Asset Value per unit as of December 31st of the year shown(1) $29.22 $26.92 $22.64 $24.17 $22.28 Ratios and Supplemental Data
Net Assets attributable to contractholders (000's) $368 $321 $277 $318 $281
Number of units outstanding(1) 12,602 11,941 12,227 13,156 12,608
Management expense ratio(2) 4.05 4.04 3.47 3.48 3.47
Management expense ratio(2) before waivers 10.53 12.19 11.21 11.98 4.90
Portfolio turnover rate(3) 2.30 10.59 0.35 0.01 124.84
The following tables show selected key financial information about the Fund and are intended to help you understand the Fund's financialperformance for the past 5 years.
(4) This Information is provided as at December 31 of the year shown. For financial years before January 1, 2013, the financial highlights are derived from the financial statements prepared in accordance with Canadian GAAP applicable to public enterprises. For financial years beginnning on or after January 1, 2013, the financial highlights are derived from the financial statements prepared in accordance with IFRS.
Canadian Financial Services Fund
(1) This information is derived from the Fund's audited annual financial statements. The Net assets attributable to contractholders per unit presented in the financial statements differs from the net asset value per unit calculated for fund pricing purposes. An explanation of these differences can be found in the notes to the financial statements.
(2) Management expense ratio is based on total expenses (excluding commissions and other portfolio transaction costs) for the stated period and is expressed as an annualized percentage of daily average net asset value during the period. It is calculated by dividing the total operating expenses (excluding commissions, transaction costs) and management fees including applicable taxes, by the average net asset value of the fund for the financial period, then multiplying the result by 100.
(3) The Fund's portfolio turnover rate indicates how actively the Fund's portfolio adviser manages its portfolio investments. A portfolio turnover rate of 100% is equivalent to the Fund buying and selling all of the securities in its portfolio once in the course of the year. The higher a fund's portfolio turnover rate in a year, the greater the trading costs payable by the fund in the year, and the greater the chance of an investor receiving taxable capital gains (losses) in the year. There is not necessarily a relationship between a high turnover rate and the performance of a fund.
134

FINANCIAL HIGHLIGHTS (UNAUDITED)
VIONet Asset Value per unit 2017 4 2016 4 2015 4 2014 4 2013 4
Net Asset Value per unit as of December 31st of the year shown(1) $14.51 $15.71 $11.66 $15.46 $18.12 Ratios and Supplemental Data
Net Assets attributable to contractholders (000's) $96 $107 $84 $117 $140
Number of units outstanding(1) 6,640 6,842 7,225 7,591 7,741
Management expense ratio(2) 3.97 3.95 3.42 3.43 3.42
Management expense ratio(2) before waivers 28.22 27.52 25.98 20.98 5.79
Portfolio turnover rate(3) - - N/A N/A 154.81
The following tables show selected key financial information about the Fund and are intended to help you understand the Fund's financialperformance for the past 5 years.
(4) This Information is provided as at December 31 of the year shown. For financial years before January 1, 2013, the financial highlights are derived from the financial statements prepared in accordance with Canadian GAAP applicable to public enterprises. For financial years beginnning on or after January 1, 2013, the financial highlights are derived from the financial statements prepared in accordance with IFRS.
Canadian Resources Fund
(1) This information is derived from the Fund's audited annual financial statements. The Net assets attributable to contractholders per unit presented in the financial statements differs from the net asset value per unit calculated for fund pricing purposes. An explanation of these differences can be found in the notes to the financial statements.
(2) Management expense ratio is based on total expenses (excluding commissions and other portfolio transaction costs) for the stated period and is expressed as an annualized percentage of daily average net asset value during the period. It is calculated by dividing the total operating expenses (excluding commissions, transaction costs) and management fees including applicable taxes, by the average net asset value of the fund for the financial period, then multiplying the result by 100.
(3) The Fund's portfolio turnover rate indicates how actively the Fund's portfolio adviser manages its portfolio investments. A portfolio turnover rate of 100% is equivalent to the Fund buying and selling all of the securities in its portfolio once in the course of the year. The higher a fund's portfolio turnover rate in a year, the greater the trading costs payable by the fund in the year, and the greater the chance of an investor receiving taxable capital gains (losses) in the year. There is not necessarily a relationship between a high turnover rate and the performance of a fund.
135
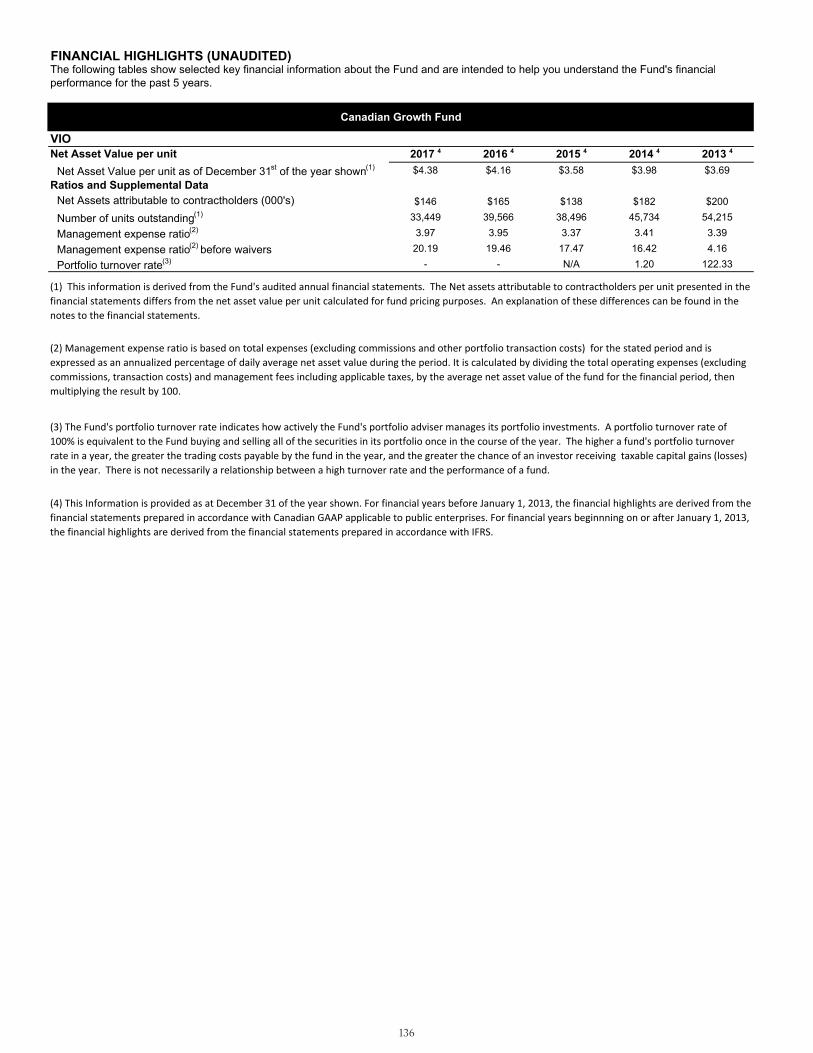
FINANCIAL HIGHLIGHTS (UNAUDITED)
VIONet Asset Value per unit 2017 4 2016 4 2015 4 2014 4 2013 4
Net Asset Value per unit as of December 31st of the year shown(1) $4.38 $4.16 $3.58 $3.98 $3.69 Ratios and Supplemental Data
Net Assets attributable to contractholders (000's) $146 $165 $138 $182 $200
Number of units outstanding(1) 33,449 39,566 38,496 45,734 54,215
Management expense ratio(2) 3.97 3.95 3.37 3.41 3.39
Management expense ratio(2) before waivers 20.19 19.46 17.47 16.42 4.16
Portfolio turnover rate(3) - - N/A 1.20 122.33
The following tables show selected key financial information about the Fund and are intended to help you understand the Fund's financialperformance for the past 5 years.
(3) The Fund's portfolio turnover rate indicates how actively the Fund's portfolio adviser manages its portfolio investments. A portfolio turnover rate of 100% is equivalent to the Fund buying and selling all of the securities in its portfolio once in the course of the year. The higher a fund's portfolio turnover rate in a year, the greater the trading costs payable by the fund in the year, and the greater the chance of an investor receiving taxable capital gains (losses) in the year. There is not necessarily a relationship between a high turnover rate and the performance of a fund.
(4) This Information is provided as at December 31 of the year shown. For financial years before January 1, 2013, the financial highlights are derived from the financial statements prepared in accordance with Canadian GAAP applicable to public enterprises. For financial years beginnning on or after January 1, 2013, the financial highlights are derived from the financial statements prepared in accordance with IFRS.
Canadian Growth Fund
(1) This information is derived from the Fund's audited annual financial statements. The Net assets attributable to contractholders per unit presented in the financial statements differs from the net asset value per unit calculated for fund pricing purposes. An explanation of these differences can be found in the notes to the financial statements.
(2) Management expense ratio is based on total expenses (excluding commissions and other portfolio transaction costs) for the stated period and is expressed as an annualized percentage of daily average net asset value during the period. It is calculated by dividing the total operating expenses (excluding commissions, transaction costs) and management fees including applicable taxes, by the average net asset value of the fund for the financial period, then multiplying the result by 100.
136

FINANCIAL HIGHLIGHTS (UNAUDITED)
VIONet Asset Value per unit 2017 4 2016 4 2015 4 2014 4 2013 4
Net Asset Value per unit as of December 31st of the year shown(1) $23.14 $23.32 $17.60 $20.64 $21.29 Ratios and Supplemental Data
Net Assets attributable to contractholders (000's) $65 $70 $54 $78 $67
Number of units outstanding(1) 2,826 3,029 3,062 3,776 3,144
Management expense ratio(2) 3.95 3.99 3.43 3.47 3.45
Management expense ratio(2) before waivers 39.89 41.17 41.06 37.01 4.42
Portfolio turnover rate(3) 7.00 N/A N/A N/A 195.75
The following tables show selected key financial information about the Fund and are intended to help you understand the Fund's financialperformance for the past 5 years.
(3) The Fund's portfolio turnover rate indicates how actively the Fund's portfolio adviser manages its portfolio investments. A portfolio turnover rate of 100% is equivalent to the Fund buying and selling all of the securities in its portfolio once in the course of the year. The higher a fund's portfolio turnover rate in a year, the greater the trading costs payable by the fund in the year, and the greater the chance of an investor receiving taxable capital gains (losses) in the year. There is not necessarily a relationship between a high turnover rate and the performance of a fund.
(4) This Information is provided as at December 31 of the year shown. For financial years before January 1, 2013, the financial highlights are derived from the financial statements prepared in accordance with Canadian GAAP applicable to public enterprises. For financial years beginnning on or after January 1, 2013, the financial highlights are derived from the financial statements prepared in accordance with IFRS.
Canadian Small Cap Fund
(1) This information is derived from the Fund's audited annual financial statements. The Net assets attributable to contractholders per unit presented in the financial statements differs from the net asset value per unit calculated for fund pricing purposes. An explanation of these differences can be found in the notes to the financial statements.
(2) Management expense ratio is based on total expenses (excluding commissions and other portfolio transaction costs) for the stated period and is expressed as an annualized percentage of daily average net asset value during the period. It is calculated by dividing the total operating expenses (excluding commissions, transaction costs) and management fees including applicable taxes, by the average net asset value of the fund for the financial period, then multiplying the result by 100.
137

FINANCIAL HIGHLIGHTS (UNAUDITED)
VIONet Asset Value per unit 2017 4 2016 4 2015 4 2014 4 2013 4
Net Asset Value per unit as of December 31st of the year shown(1) $19.34 $18.36 $16.99 $18.10 $17.29 Ratios and Supplemental Data
Net Assets attributable to contractholders (000's) $3,103 $3,085 $3,034 $3,516 $3,376
Number of units outstanding(1) 160,503 168,118 178,730 194,492 195,323
Management expense ratio(2) 3.74 3.74 3.33 3.35 3.35
Management expense ratio(2) before waivers 3.98 4.00 3.78 3.79 3.36
Portfolio turnover rate(3) 70.96 71.41 65.42 59.74 98.31VIO2Net Asset Value per unit 2017 4 2016 4 2015 4 2014 4 2013 4
Net Asset Value per unit as of December 31st of the year shown(1) $20.99 $19.68 $17.97 $18.98 $17.97 Ratios and Supplemental Data
Net Assets attributable to contractholders (000's) $869 $812 $774 $842 $945
Number of units outstanding(1) 41,420 41,275 43,117 44,418 52,632
Management expense ratio(2) 2.44 2.44 2.44 2.44 2.50
Management expense ratio(2) before waivers 2.68 2.71 2.89 2.87 2.51
Portfolio turnover rate(3) 70.96 71.41 65.42 59.74 98.31VIO3Net Asset Value per unit 2017 4 2016 4 2015 4 2014 4 2013 4
Net Asset Value per unit as of December 31st of the year shown(1) $18.70 $17.85 $16.60 $17.75 $17.01 Ratios and Supplemental Data
Net Assets attributable to contractholders (000's) $1,392 $1,440 $1,432 $1,558 $1,506
Number of units outstanding(1) 74,452 80,740 86,338 87,918 88,577
Management expense ratio(2) 4.25 4.24 3.68 3.68 3.69
Management expense ratio(2) before waivers 4.49 4.51 4.13 4.11 3.70
Portfolio turnover rate(3) 70.96 71.41 65.42 59.74 98.31
(1) This information is derived from the Fund's audited annual financial statements. The Net assets attributable to contractholders per unit presented in the financial statements differs from the net asset value per unit calculated for fund pricing purposes. An explanation of these differences can be found in the notes to the financial statements.
(2) Management expense ratio is based on total expenses (excluding commissions and other portfolio transaction costs) for the stated period and is expressed as an annualized percentage of daily average net asset value during the period. It is calculated by dividing the total operating expenses (excluding commissions, transaction costs) and management fees including applicable taxes, by the average net asset value of the fund for the financial period, then multiplying the result by 100.
(3) The Fund's portfolio turnover rate indicates how actively the Fund's portfolio adviser manages its portfolio investments. A portfolio turnover rate of 100% is equivalent to the Fund buying and selling all of the securities in its portfolio once in the course of the year. The higher a fund's portfolio turnover rate in a year, the greater the trading costs payable by the fund in the year, and the greater the chance of an investor receiving taxable capital gains (losses) in the year. There is not necessarily a relationship between a high turnover rate and the performance of a fund.
(4) This Information is provided as at December 31 of the year shown. For financial years before January 1, 2013, the financial highlights are derived from the financial statements prepared in accordance with Canadian GAAP applicable to public enterprises. For financial years beginnning on or after January 1, 2013, the financial highlights are derived from the financial statements prepared in accordance with IFRS.
The following tables show selected key financial information about the Fund and are intended to help you understand the Fund's financialperformance for the past 5 years.
Dividend Fund
138
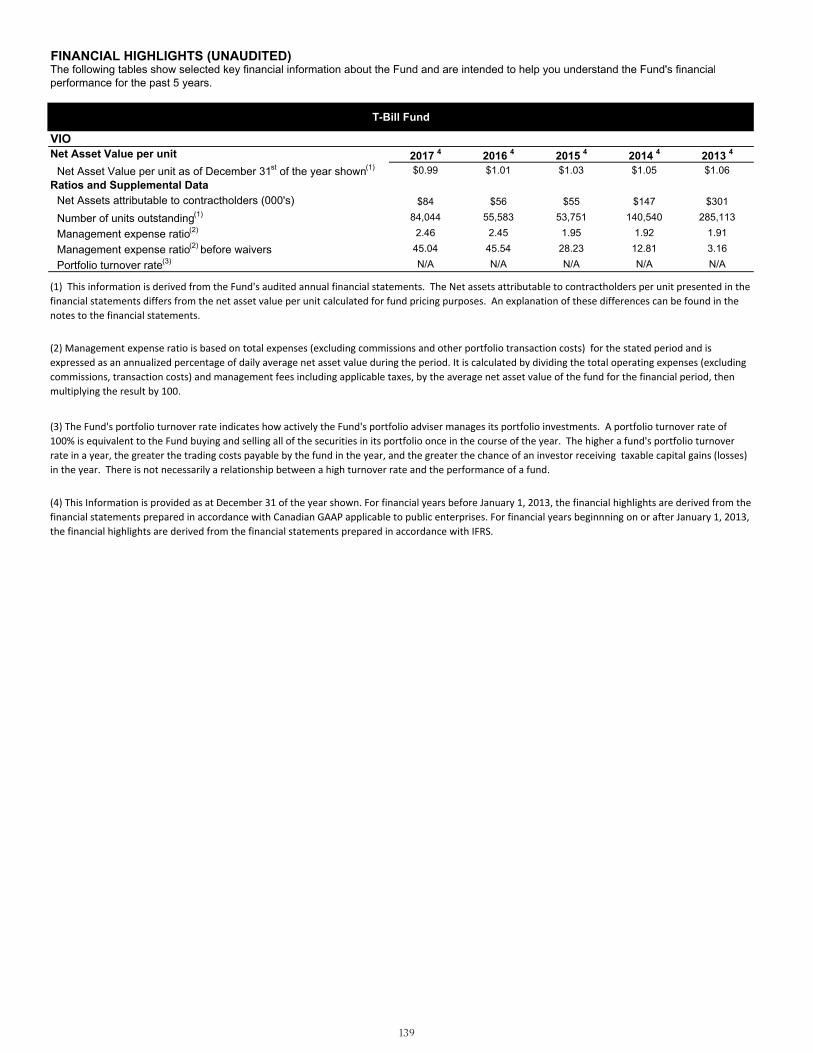
FINANCIAL HIGHLIGHTS (UNAUDITED)
VIONet Asset Value per unit 2017 4 2016 4 2015 4 2014 4 2013 4
Net Asset Value per unit as of December 31st of the year shown(1) $0.99 $1.01 $1.03 $1.05 $1.06 Ratios and Supplemental Data
Net Assets attributable to contractholders (000's) $84 $56 $55 $147 $301
Number of units outstanding(1) 84,044 55,583 53,751 140,540 285,113
Management expense ratio(2) 2.46 2.45 1.95 1.92 1.91
Management expense ratio(2) before waivers 45.04 45.54 28.23 12.81 3.16
Portfolio turnover rate(3) N/A N/A N/A N/A N/A
The following tables show selected key financial information about the Fund and are intended to help you understand the Fund's financialperformance for the past 5 years.
(4) This Information is provided as at December 31 of the year shown. For financial years before January 1, 2013, the financial highlights are derived from the financial statements prepared in accordance with Canadian GAAP applicable to public enterprises. For financial years beginnning on or after January 1, 2013, the financial highlights are derived from the financial statements prepared in accordance with IFRS.
T-Bill Fund
(1) This information is derived from the Fund's audited annual financial statements. The Net assets attributable to contractholders per unit presented in the financial statements differs from the net asset value per unit calculated for fund pricing purposes. An explanation of these differences can be found in the notes to the financial statements.
(2) Management expense ratio is based on total expenses (excluding commissions and other portfolio transaction costs) for the stated period and is expressed as an annualized percentage of daily average net asset value during the period. It is calculated by dividing the total operating expenses (excluding commissions, transaction costs) and management fees including applicable taxes, by the average net asset value of the fund for the financial period, then multiplying the result by 100.
(3) The Fund's portfolio turnover rate indicates how actively the Fund's portfolio adviser manages its portfolio investments. A portfolio turnover rate of 100% is equivalent to the Fund buying and selling all of the securities in its portfolio once in the course of the year. The higher a fund's portfolio turnover rate in a year, the greater the trading costs payable by the fund in the year, and the greater the chance of an investor receiving taxable capital gains (losses) in the year. There is not necessarily a relationship between a high turnover rate and the performance of a fund.
139

FINANCIAL HIGHLIGHTS (UNAUDITED)
VIONet Asset Value per unit 2017 4 2016 4 2015 4 2014 4 2013 4
Net Asset Value per unit as of December 31st of the year shown(1) $38.97 $36.67 $31.21 $34.79 $31.97 Ratios and Supplemental Data
Net Assets attributable to contractholders (000's) $3,733 $3,628 $3,148 $3,776 $3,691
Number of units outstanding(1) 95,824 98,937 100,882 108,531 115,561
Management expense ratio(2) 3.23 3.26 3.07 3.07 3.07
Management expense ratio(2) before waivers 3.28 3.33 3.19 3.18 3.08
Portfolio turnover rate(3) 1.82 1.94 N/A N/A N/AVIO2Net Asset Value per unit 2017 4 2016 4 2015 4 2014 4 2013 4
Net Asset Value per unit as of December 31st of the year shown(1) $37.10 $35.08 $30.00 $33.63 $31.08 Ratios and Supplemental Data
Net Assets attributable to contractholders (000's) $5,334 $5,142 $4,604 $5,296 $5,112
Number of units outstanding(1) 143,845 146,593 153,455 157,474 164,645
Management expense ratio(2) 3.72 3.74 3.62 3.62 3.62
Management expense ratio(2) before waivers 3.77 3.81 3.74 3.74 3.63
Portfolio turnover rate(3) 1.82 1.94 N/A N/A N/AVIO3Net Asset Value per unit 2017 4 2016 4 2015 4 2014 4 2013 4
Net Asset Value per unit as of December 31st of the year shown(1) $37.54 $35.56 $30.46 $34.05 $31.39 Ratios and Supplemental Data
Net Assets attributable to contractholders (000's) $1,327 $1,281 $1,119 $1,245 $1,223
Number of units outstanding(1) 35,372 36,035 36,744 36,572 39,008
Management expense ratio(2) 3.91 3.92 3.36 3.37 3.37
Management expense ratio(2) before waivers 3.95 3.99 3.48 3.48 3.38
Portfolio turnover rate(3) 1.82 1.94 N/A N/A N/AVIO4Net Asset Value per unit 2017 4 2016 4 2015 4 2014 4 2013 4
Net Asset Value per unit as of December 31st of the year shown(1) $40.83 $38.14 $32.22 $35.71 $32.63 Ratios and Supplemental Data
Net Assets attributable to contractholders (000's) $2,068 $1,940 $1,674 $1,947 $1,769
Number of units outstanding(1) 50,670 50,873 51,940 54,516 54,262
Management expense ratio(2) 2.50 2.50 2.49 2.49 2.49
Management expense ratio(2) before waivers 2.55 2.57 2.61 2.60 2.51
Portfolio turnover rate(3) 1.82 1.94 N/A N/A N/A
The following tables show selected key financial information about the Fund and are intended to help you understand the Fund's financialperformance for the past 5 years.
(4) This Information is provided as at December 31 of the year shown. For financial years before January 1, 2013, the financial highlights are derived from the financial statements prepared in accordance with Canadian GAAP applicable to public enterprises. For financial years beginnning on or after January 1, 2013, the financial highlights are derived from the financial statements prepared in accordance with IFRS.
(1) This information is derived from the Fund's audited annual financial statements. The Net assets attributable to contractholders per unit presented in the financial statements differs from the net asset value per unit calculated for fund pricing purposes. An explanation of these differences can be found in the notes to the financial statements.
(2) Management expense ratio is based on total expenses (excluding commissions and other portfolio transaction costs) for the stated period and is expressed as an annualized percentage of daily average net asset value during the period. It is calculated by dividing the total operating expenses (excluding commissions, transaction costs) and management fees including applicable taxes, by the average net asset value of the fund for the financial period, then multiplying the result by 100.
(3) The Fund's portfolio turnover rate indicates how actively the Fund's portfolio adviser manages its portfolio investments. A portfolio turnover rate of 100% is equivalent to the Fund buying and selling all of the securities in its portfolio once in the course of the year. The higher a fund's portfolio turnover rate in a year, the greater the trading costs payable by the fund in the year, and the greater the chance of an investor receiving taxable capital gains (losses) in the year. There is not necessarily a relationship between a high turnover rate and the performance of a fund.
Canadian-35 Index Fund
140
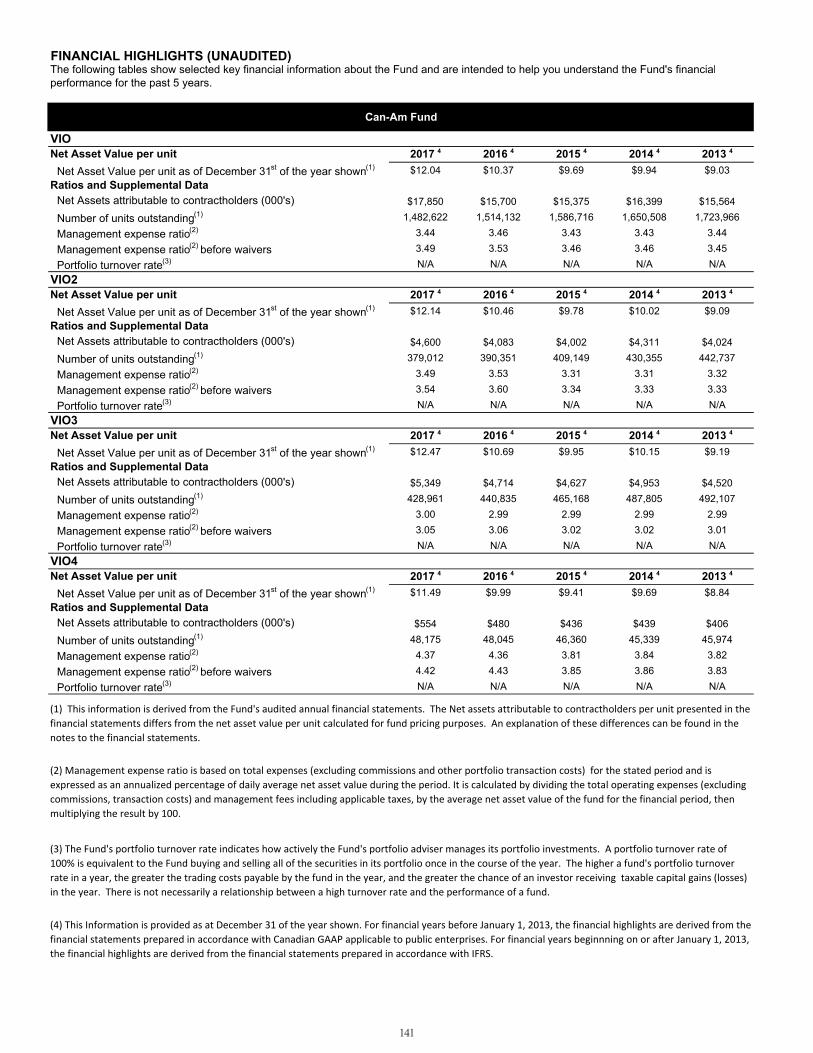
FINANCIAL HIGHLIGHTS (UNAUDITED)
VIONet Asset Value per unit 2017 4 2016 4 2015 4 2014 4 2013 4
Net Asset Value per unit as of December 31st of the year shown(1) $12.04 $10.37 $9.69 $9.94 $9.03 Ratios and Supplemental Data
Net Assets attributable to contractholders (000's) $17,850 $15,700 $15,375 $16,399 $15,564
Number of units outstanding(1) 1,482,622 1,514,132 1,586,716 1,650,508 1,723,966
Management expense ratio(2) 3.44 3.46 3.43 3.43 3.44
Management expense ratio(2) before waivers 3.49 3.53 3.46 3.46 3.45
Portfolio turnover rate(3) N/A N/A N/A N/A N/AVIO2Net Asset Value per unit 2017 4 2016 4 2015 4 2014 4 2013 4
Net Asset Value per unit as of December 31st of the year shown(1) $12.14 $10.46 $9.78 $10.02 $9.09 Ratios and Supplemental Data
Net Assets attributable to contractholders (000's) $4,600 $4,083 $4,002 $4,311 $4,024
Number of units outstanding(1) 379,012 390,351 409,149 430,355 442,737
Management expense ratio(2) 3.49 3.53 3.31 3.31 3.32
Management expense ratio(2) before waivers 3.54 3.60 3.34 3.33 3.33
Portfolio turnover rate(3) N/A N/A N/A N/A N/AVIO3Net Asset Value per unit 2017 4 2016 4 2015 4 2014 4 2013 4
Net Asset Value per unit as of December 31st of the year shown(1) $12.47 $10.69 $9.95 $10.15 $9.19 Ratios and Supplemental Data
Net Assets attributable to contractholders (000's) $5,349 $4,714 $4,627 $4,953 $4,520
Number of units outstanding(1) 428,961 440,835 465,168 487,805 492,107
Management expense ratio(2) 3.00 2.99 2.99 2.99 2.99
Management expense ratio(2) before waivers 3.05 3.06 3.02 3.02 3.01
Portfolio turnover rate(3) N/A N/A N/A N/A N/AVIO4Net Asset Value per unit 2017 4 2016 4 2015 4 2014 4 2013 4
Net Asset Value per unit as of December 31st of the year shown(1) $11.49 $9.99 $9.41 $9.69 $8.84 Ratios and Supplemental Data
Net Assets attributable to contractholders (000's) $554 $480 $436 $439 $406
Number of units outstanding(1) 48,175 48,045 46,360 45,339 45,974
Management expense ratio(2) 4.37 4.36 3.81 3.84 3.82
Management expense ratio(2) before waivers 4.42 4.43 3.85 3.86 3.83
Portfolio turnover rate(3) N/A N/A N/A N/A N/A
The following tables show selected key financial information about the Fund and are intended to help you understand the Fund's financialperformance for the past 5 years.
(4) This Information is provided as at December 31 of the year shown. For financial years before January 1, 2013, the financial highlights are derived from the financial statements prepared in accordance with Canadian GAAP applicable to public enterprises. For financial years beginnning on or after January 1, 2013, the financial highlights are derived from the financial statements prepared in accordance with IFRS.
(1) This information is derived from the Fund's audited annual financial statements. The Net assets attributable to contractholders per unit presented in the financial statements differs from the net asset value per unit calculated for fund pricing purposes. An explanation of these differences can be found in the notes to the financial statements.
(2) Management expense ratio is based on total expenses (excluding commissions and other portfolio transaction costs) for the stated period and is expressed as an annualized percentage of daily average net asset value during the period. It is calculated by dividing the total operating expenses (excluding commissions, transaction costs) and management fees including applicable taxes, by the average net asset value of the fund for the financial period, then multiplying the result by 100.
(3) The Fund's portfolio turnover rate indicates how actively the Fund's portfolio adviser manages its portfolio investments. A portfolio turnover rate of 100% is equivalent to the Fund buying and selling all of the securities in its portfolio once in the course of the year. The higher a fund's portfolio turnover rate in a year, the greater the trading costs payable by the fund in the year, and the greater the chance of an investor receiving taxable capital gains (losses) in the year. There is not necessarily a relationship between a high turnover rate and the performance of a fund.
Can-Am Fund
141
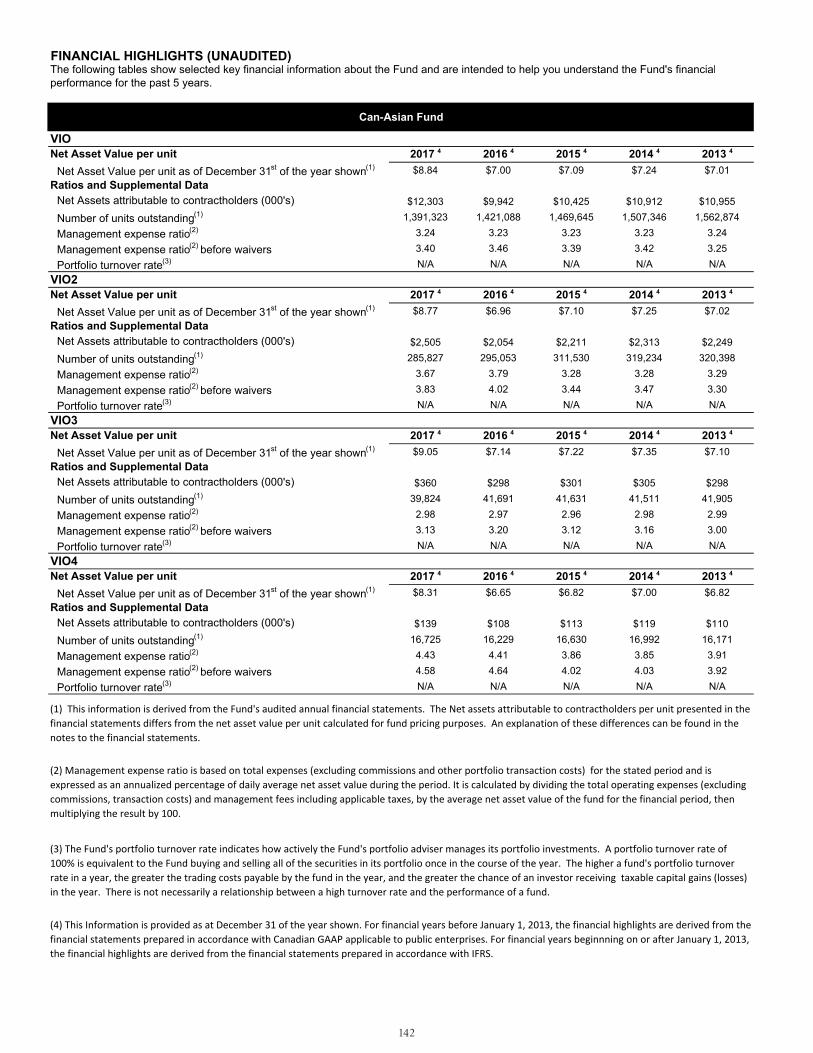
FINANCIAL HIGHLIGHTS (UNAUDITED)
VIONet Asset Value per unit 2017 4 2016 4 2015 4 2014 4 2013 4
Net Asset Value per unit as of December 31st of the year shown(1) $8.84 $7.00 $7.09 $7.24 $7.01 Ratios and Supplemental Data
Net Assets attributable to contractholders (000's) $12,303 $9,942 $10,425 $10,912 $10,955
Number of units outstanding(1) 1,391,323 1,421,088 1,469,645 1,507,346 1,562,874
Management expense ratio(2) 3.24 3.23 3.23 3.23 3.24
Management expense ratio(2) before waivers 3.40 3.46 3.39 3.42 3.25
Portfolio turnover rate(3) N/A N/A N/A N/A N/AVIO2Net Asset Value per unit 2017 4 2016 4 2015 4 2014 4 2013 4
Net Asset Value per unit as of December 31st of the year shown(1) $8.77 $6.96 $7.10 $7.25 $7.02 Ratios and Supplemental Data
Net Assets attributable to contractholders (000's) $2,505 $2,054 $2,211 $2,313 $2,249
Number of units outstanding(1) 285,827 295,053 311,530 319,234 320,398
Management expense ratio(2) 3.67 3.79 3.28 3.28 3.29
Management expense ratio(2) before waivers 3.83 4.02 3.44 3.47 3.30
Portfolio turnover rate(3) N/A N/A N/A N/A N/AVIO3Net Asset Value per unit 2017 4 2016 4 2015 4 2014 4 2013 4
Net Asset Value per unit as of December 31st of the year shown(1) $9.05 $7.14 $7.22 $7.35 $7.10 Ratios and Supplemental Data
Net Assets attributable to contractholders (000's) $360 $298 $301 $305 $298
Number of units outstanding(1) 39,824 41,691 41,631 41,511 41,905
Management expense ratio(2) 2.98 2.97 2.96 2.98 2.99
Management expense ratio(2) before waivers 3.13 3.20 3.12 3.16 3.00
Portfolio turnover rate(3) N/A N/A N/A N/A N/AVIO4Net Asset Value per unit 2017 4 2016 4 2015 4 2014 4 2013 4
Net Asset Value per unit as of December 31st of the year shown(1) $8.31 $6.65 $6.82 $7.00 $6.82 Ratios and Supplemental Data
Net Assets attributable to contractholders (000's) $139 $108 $113 $119 $110
Number of units outstanding(1) 16,725 16,229 16,630 16,992 16,171
Management expense ratio(2) 4.43 4.41 3.86 3.85 3.91
Management expense ratio(2) before waivers 4.58 4.64 4.02 4.03 3.92
Portfolio turnover rate(3) N/A N/A N/A N/A N/A
The following tables show selected key financial information about the Fund and are intended to help you understand the Fund's financialperformance for the past 5 years.
(4) This Information is provided as at December 31 of the year shown. For financial years before January 1, 2013, the financial highlights are derived from the financial statements prepared in accordance with Canadian GAAP applicable to public enterprises. For financial years beginnning on or after January 1, 2013, the financial highlights are derived from the financial statements prepared in accordance with IFRS.
(1) This information is derived from the Fund's audited annual financial statements. The Net assets attributable to contractholders per unit presented in the financial statements differs from the net asset value per unit calculated for fund pricing purposes. An explanation of these differences can be found in the notes to the financial statements.
(2) Management expense ratio is based on total expenses (excluding commissions and other portfolio transaction costs) for the stated period and is expressed as an annualized percentage of daily average net asset value during the period. It is calculated by dividing the total operating expenses (excluding commissions, transaction costs) and management fees including applicable taxes, by the average net asset value of the fund for the financial period, then multiplying the result by 100.
(3) The Fund's portfolio turnover rate indicates how actively the Fund's portfolio adviser manages its portfolio investments. A portfolio turnover rate of 100% is equivalent to the Fund buying and selling all of the securities in its portfolio once in the course of the year. The higher a fund's portfolio turnover rate in a year, the greater the trading costs payable by the fund in the year, and the greater the chance of an investor receiving taxable capital gains (losses) in the year. There is not necessarily a relationship between a high turnover rate and the performance of a fund.
Can-Asian Fund
142
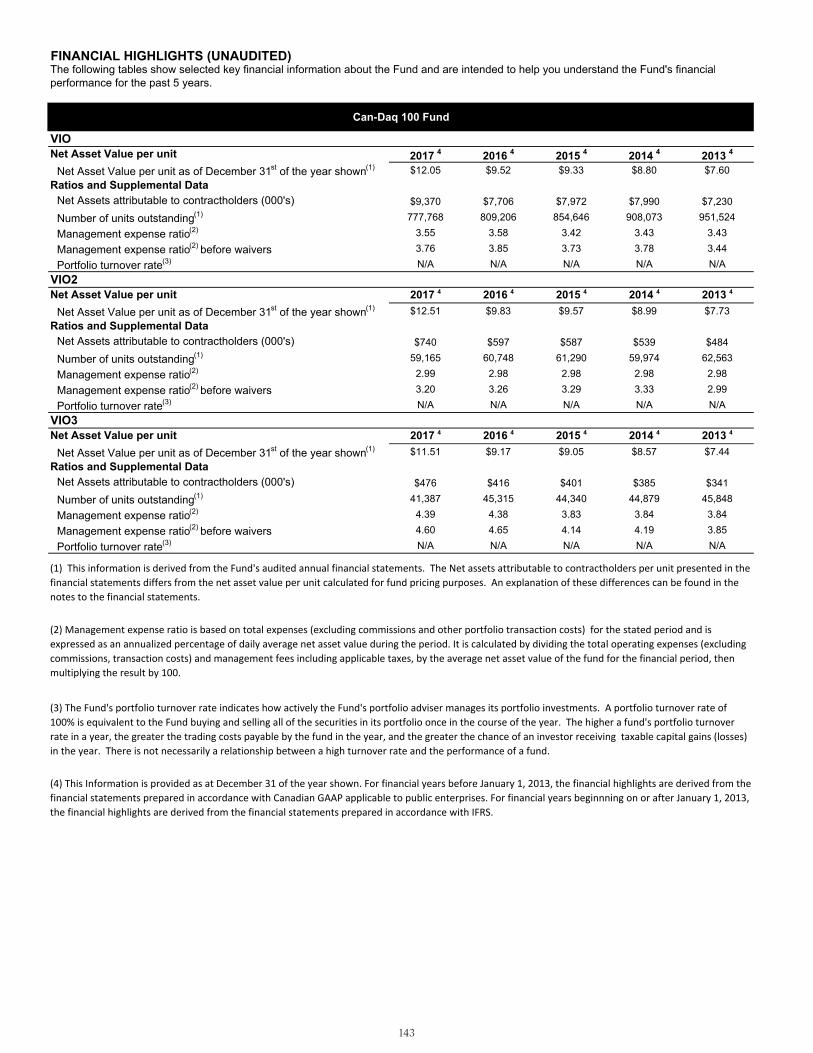
FINANCIAL HIGHLIGHTS (UNAUDITED)
VIONet Asset Value per unit 2017 4 2016 4 2015 4 2014 4 2013 4
Net Asset Value per unit as of December 31st of the year shown(1) $12.05 $9.52 $9.33 $8.80 $7.60 Ratios and Supplemental Data
Net Assets attributable to contractholders (000's) $9,370 $7,706 $7,972 $7,990 $7,230
Number of units outstanding(1) 777,768 809,206 854,646 908,073 951,524
Management expense ratio(2) 3.55 3.58 3.42 3.43 3.43
Management expense ratio(2) before waivers 3.76 3.85 3.73 3.78 3.44
Portfolio turnover rate(3) N/A N/A N/A N/A N/AVIO2Net Asset Value per unit 2017 4 2016 4 2015 4 2014 4 2013 4
Net Asset Value per unit as of December 31st of the year shown(1) $12.51 $9.83 $9.57 $8.99 $7.73 Ratios and Supplemental Data
Net Assets attributable to contractholders (000's) $740 $597 $587 $539 $484
Number of units outstanding(1) 59,165 60,748 61,290 59,974 62,563
Management expense ratio(2) 2.99 2.98 2.98 2.98 2.98
Management expense ratio(2) before waivers 3.20 3.26 3.29 3.33 2.99
Portfolio turnover rate(3) N/A N/A N/A N/A N/AVIO3Net Asset Value per unit 2017 4 2016 4 2015 4 2014 4 2013 4
Net Asset Value per unit as of December 31st of the year shown(1) $11.51 $9.17 $9.05 $8.57 $7.44 Ratios and Supplemental Data
Net Assets attributable to contractholders (000's) $476 $416 $401 $385 $341
Number of units outstanding(1) 41,387 45,315 44,340 44,879 45,848
Management expense ratio(2) 4.39 4.38 3.83 3.84 3.84
Management expense ratio(2) before waivers 4.60 4.65 4.14 4.19 3.85
Portfolio turnover rate(3) N/A N/A N/A N/A N/A
The following tables show selected key financial information about the Fund and are intended to help you understand the Fund's financialperformance for the past 5 years.
(2) Management expense ratio is based on total expenses (excluding commissions and other portfolio transaction costs) for the stated period and is expressed as an annualized percentage of daily average net asset value during the period. It is calculated by dividing the total operating expenses (excluding commissions, transaction costs) and management fees including applicable taxes, by the average net asset value of the fund for the financial period, then multiplying the result by 100.
(3) The Fund's portfolio turnover rate indicates how actively the Fund's portfolio adviser manages its portfolio investments. A portfolio turnover rate of 100% is equivalent to the Fund buying and selling all of the securities in its portfolio once in the course of the year. The higher a fund's portfolio turnover rate in a year, the greater the trading costs payable by the fund in the year, and the greater the chance of an investor receiving taxable capital gains (losses) in the year. There is not necessarily a relationship between a high turnover rate and the performance of a fund.
(4) This Information is provided as at December 31 of the year shown. For financial years before January 1, 2013, the financial highlights are derived from the financial statements prepared in accordance with Canadian GAAP applicable to public enterprises. For financial years beginnning on or after January 1, 2013, the financial highlights are derived from the financial statements prepared in accordance with IFRS.
Can-Daq 100 Fund
(1) This information is derived from the Fund's audited annual financial statements. The Net assets attributable to contractholders per unit presented in the financial statements differs from the net asset value per unit calculated for fund pricing purposes. An explanation of these differences can be found in the notes to the financial statements.
143

FINANCIAL HIGHLIGHTS (UNAUDITED)
VIONet Asset Value per unit 2017 4 2016 4 2015 4 2014 4 2013 4
Net Asset Value per unit as of December 31st of the year shown(1) $12.26 $11.03 $10.45 $10.37 $10.30 Ratios and Supplemental Data
Net Assets attributable to contractholders (000's) $6,279 $5,783 $5,698 $5,840 $5,914
Number of units outstanding(1) 512,121 524,351 545,516 563,039 574,311
Management expense ratio(2) 2.99 2.99 2.98 2.99 2.99
Management expense ratio(2) before waivers 3.20 3.26 3.27 3.29 3.00
Portfolio turnover rate(3) N/A N/A N/A N/A N/AVIO2Net Asset Value per unit 2017 4 2016 4 2015 4 2014 4 2013 4
Net Asset Value per unit as of December 31st of the year shown(1) $11.77 $10.66 $10.17 $10.15 $10.12 Ratios and Supplemental Data
Net Assets attributable to contractholders (000's) $4,686 $4,356 $4,309 $4,424 $4,552
Number of units outstanding(1) 398,227 408,566 423,550 435,940 449,871
Management expense ratio(2) 3.72 3.78 3.42 3.42 3.43
Management expense ratio(2) before waivers 3.93 4.05 3.71 3.72 3.44
Portfolio turnover rate(3) N/A N/A N/A N/A N/AVIO3Net Asset Value per unit 2017 4 2016 4 2015 4 2014 4 2013 4
Net Asset Value per unit as of December 31st of the year shown(1) $11.26 $10.28 $9.87 $9.88 $9.90 Ratios and Supplemental Data
Net Assets attributable to contractholders (000's) $233 $216 $203 $202 $211
Number of units outstanding(1) 20,696 21,031 20,603 20,420 21,310
Management expense ratio(2) 4.42 4.41 3.86 3.86 3.86
Management expense ratio(2) before waivers 4.63 4.68 4.14 4.16 3.87
Portfolio turnover rate(3) N/A N/A N/A N/A N/A
(1) This information is derived from the Fund's audited annual financial statements. The Net assets attributable to contractholders per unit presented in the financial statements differs from the net asset value per unit calculated for fund pricing purposes. An explanation of these differences can be found in the notes to the financial statements.
(2) Management expense ratio is based on total expenses (excluding commissions and other portfolio transaction costs) for the stated period and is expressed as an annualized percentage of daily average net asset value during the period. It is calculated by dividing the total operating expenses (excluding commissions, transaction costs) and management fees including applicable taxes, by the average net asset value of the fund for the financial period, then multiplying the result by 100.
(3) The Fund's portfolio turnover rate indicates how actively the Fund's portfolio adviser manages its portfolio investments. A portfolio turnover rate of 100% is equivalent to the Fund buying and selling all of the securities in its portfolio once in the course of the year. The higher a fund's portfolio turnover rate in a year, the greater the trading costs payable by the fund in the year, and the greater the chance of an investor receiving taxable capital gains (losses) in the year. There is not necessarily a relationship between a high turnover rate and the performance of a fund.
(4) This Information is provided as at December 31 of the year shown. For financial years before January 1, 2013, the financial highlights are derived from the financial statements prepared in accordance with Canadian GAAP applicable to public enterprises. For financial years beginnning on or after January 1, 2013, the financial highlights are derived from the financial statements prepared in accordance with IFRS.
The following tables show selected key financial information about the Fund and are intended to help you understand the Fund's financialperformance for the past 5 years.
Can-Euro Fund
144

FINANCIAL HIGHLIGHTS (UNAUDITED)
VIONet Asset Value per unit 2017 4 2016 4 2015 4 2014 4 2013 4
Net Asset Value per unit as of December 31st of the year shown(1) $15.63 $15.96 $16.30 $16.29 $15.11 Ratios and Supplemental Data
Net Assets attributable to contractholders (000's) $719 $799 $816 $1,156 $1,127
Number of units outstanding(1) 46,042 50,038 50,071 70,973 74,566
Management expense ratio(2) 4.02 4.01 3.47 3.45 3.47
Management expense ratio(2) before waivers 6.19 6.17 5.65 5.60 4.31
Portfolio turnover rate(3) N/A N/A N/A N/A N/AVIO2Net Asset Value per unit 2017 4 2016 4 2015 4 2014 4 2013 4
Net Asset Value per unit as of December 31st of the year shown(1) $15.86 $16.17 $16.48 $16.44 $15.23 Ratios and Supplemental Data
Net Assets attributable to contractholders (000's) $356 $361 $374 $423 $392
Number of units outstanding(1) 22,463 22,334 22,676 25,703 25,715
Management expense ratio(2) 3.83 3.82 3.29 3.29 3.28
Management expense ratio(2) before waivers 6.00 5.99 5.47 5.44 4.12
Portfolio turnover rate(3) N/A N/A N/A N/A N/AVIO3Net Asset Value per unit 2017 4 2016 4 2015 4 2014 4 2013 4
Net Asset Value per unit as of December 31st of the year shown(1) $16.40 $16.58 $16.75 $16.66 $15.39 Ratios and Supplemental Data
Net Assets attributable to contractholders (000's) $325 $317 $306 $289 $252
Number of units outstanding(1) 19,834 19,126 18,294 17,372 16,409
Management expense ratio(2) 2.99 2.98 2.99 3.00 3.00
Management expense ratio(2) before waivers 5.16 5.15 5.17 5.15 3.84
Portfolio turnover rate(3) N/A N/A N/A N/A N/A
The following tables show selected key financial information about the Fund and are intended to help you understand the Fund's financialperformance for the past 5 years.
(2) Management expense ratio is based on total expenses (excluding commissions and other portfolio transaction costs) for the stated period and is expressed as an annualized percentage of daily average net asset value during the period. It is calculated by dividing the total operating expenses (excluding commissions, transaction costs) and management fees including applicable taxes, by the average net asset value of the fund for the financial period, then multiplying the result by 100.
(3) The Fund's portfolio turnover rate indicates how actively the Fund's portfolio adviser manages its portfolio investments. A portfolio turnover rate of 100% is equivalent to the Fund buying and selling all of the securities in its portfolio once in the course of the year. The higher a fund's portfolio turnover rate in a year, the greater the trading costs payable by the fund in the year, and the greater the chance of an investor receiving taxable capital gains (losses) in the year. There is not necessarily a relationship between a high turnover rate and the performance of a fund.
(4) This Information is provided as at December 31 of the year shown. For financial years before January 1, 2013, the financial highlights are derived from the financial statements prepared in accordance with Canadian GAAP applicable to public enterprises. For financial years beginnning on or after January 1, 2013, the financial highlights are derived from the financial statements prepared in accordance with IFRS.
Can-Global Bond Fund
(1) This information is derived from the Fund's audited annual financial statements. The Net assets attributable to contractholders per unit presented in the financial statements differs from the net asset value per unit calculated for fund pricing purposes. An explanation of these differences can be found in the notes to the financial statements.
145
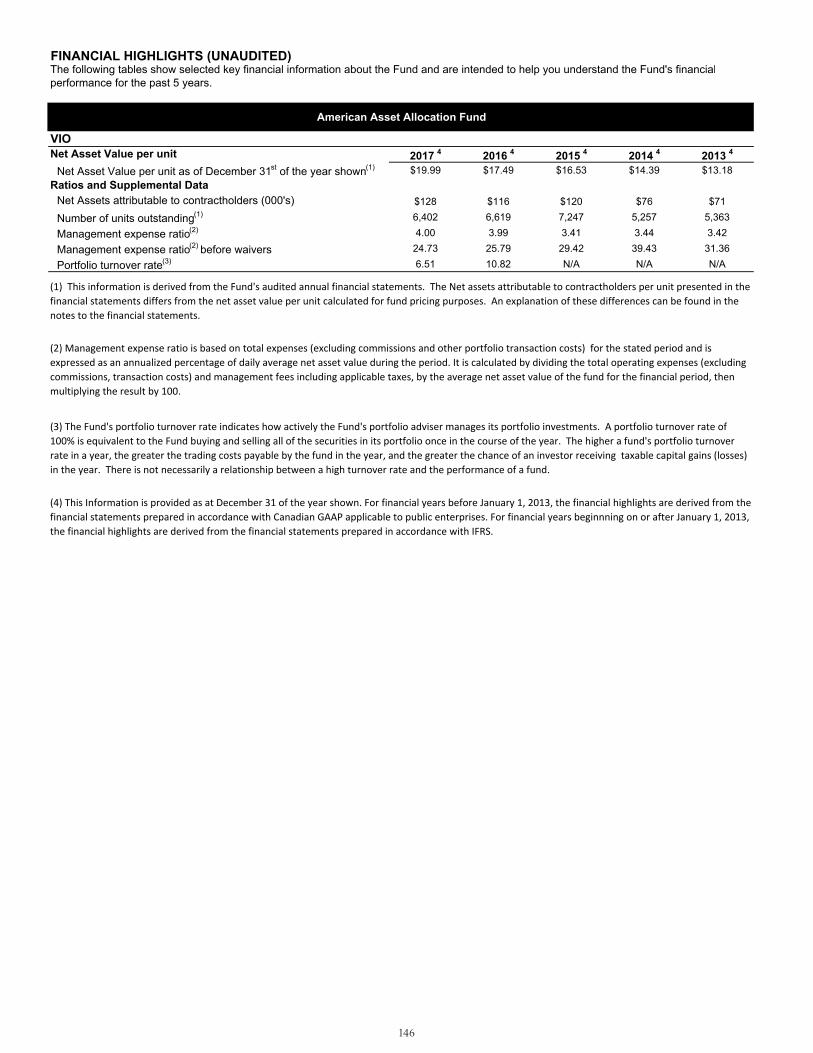
FINANCIAL HIGHLIGHTS (UNAUDITED)
VIONet Asset Value per unit 2017 4 2016 4 2015 4 2014 4 2013 4
Net Asset Value per unit as of December 31st of the year shown(1) $19.99 $17.49 $16.53 $14.39 $13.18 Ratios and Supplemental Data
Net Assets attributable to contractholders (000's) $128 $116 $120 $76 $71
Number of units outstanding(1) 6,402 6,619 7,247 5,257 5,363
Management expense ratio(2) 4.00 3.99 3.41 3.44 3.42
Management expense ratio(2) before waivers 24.73 25.79 29.42 39.43 31.36
Portfolio turnover rate(3) 6.51 10.82 N/A N/A N/A
The following tables show selected key financial information about the Fund and are intended to help you understand the Fund's financialperformance for the past 5 years.
(4) This Information is provided as at December 31 of the year shown. For financial years before January 1, 2013, the financial highlights are derived from the financial statements prepared in accordance with Canadian GAAP applicable to public enterprises. For financial years beginnning on or after January 1, 2013, the financial highlights are derived from the financial statements prepared in accordance with IFRS.
American Asset Allocation Fund
(1) This information is derived from the Fund's audited annual financial statements. The Net assets attributable to contractholders per unit presented in the financial statements differs from the net asset value per unit calculated for fund pricing purposes. An explanation of these differences can be found in the notes to the financial statements.
(2) Management expense ratio is based on total expenses (excluding commissions and other portfolio transaction costs) for the stated period and is expressed as an annualized percentage of daily average net asset value during the period. It is calculated by dividing the total operating expenses (excluding commissions, transaction costs) and management fees including applicable taxes, by the average net asset value of the fund for the financial period, then multiplying the result by 100.
(3) The Fund's portfolio turnover rate indicates how actively the Fund's portfolio adviser manages its portfolio investments. A portfolio turnover rate of 100% is equivalent to the Fund buying and selling all of the securities in its portfolio once in the course of the year. The higher a fund's portfolio turnover rate in a year, the greater the trading costs payable by the fund in the year, and the greater the chance of an investor receiving taxable capital gains (losses) in the year. There is not necessarily a relationship between a high turnover rate and the performance of a fund.
146
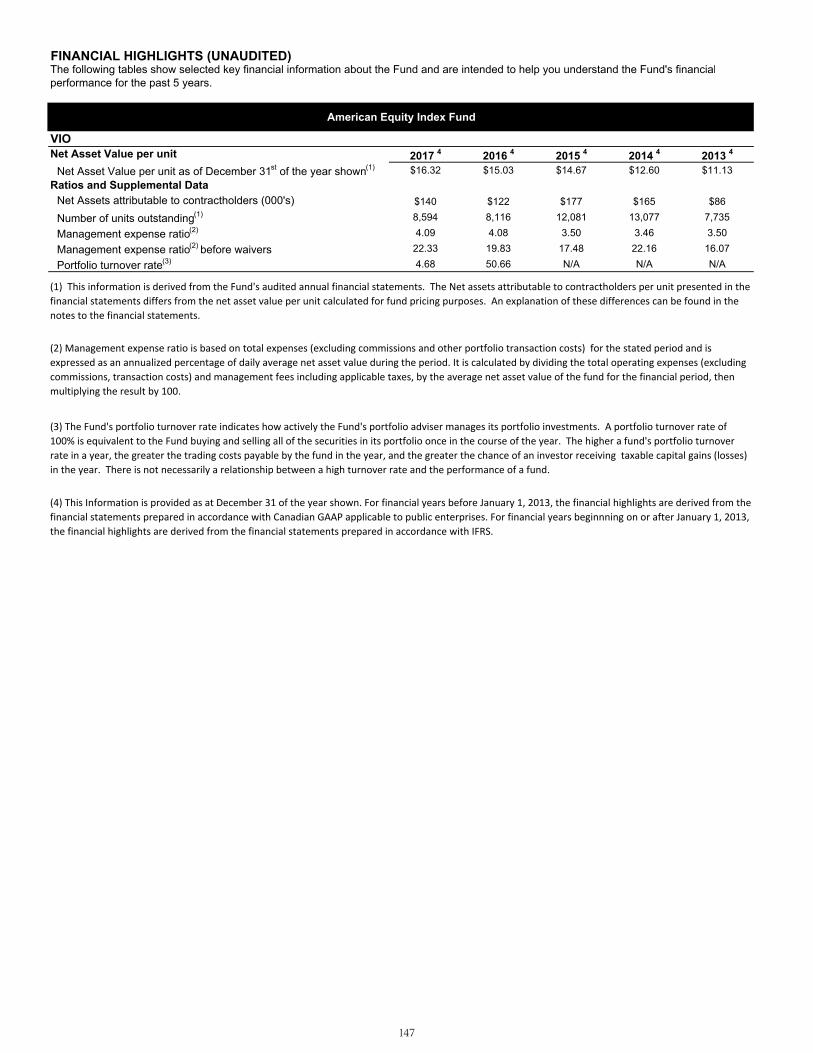
FINANCIAL HIGHLIGHTS (UNAUDITED)
VIONet Asset Value per unit 2017 4 2016 4 2015 4 2014 4 2013 4
Net Asset Value per unit as of December 31st of the year shown(1) $16.32 $15.03 $14.67 $12.60 $11.13 Ratios and Supplemental Data
Net Assets attributable to contractholders (000's) $140 $122 $177 $165 $86
Number of units outstanding(1) 8,594 8,116 12,081 13,077 7,735
Management expense ratio(2) 4.09 4.08 3.50 3.46 3.50
Management expense ratio(2) before waivers 22.33 19.83 17.48 22.16 16.07
Portfolio turnover rate(3) 4.68 50.66 N/A N/A N/A
The following tables show selected key financial information about the Fund and are intended to help you understand the Fund's financialperformance for the past 5 years.
(4) This Information is provided as at December 31 of the year shown. For financial years before January 1, 2013, the financial highlights are derived from the financial statements prepared in accordance with Canadian GAAP applicable to public enterprises. For financial years beginnning on or after January 1, 2013, the financial highlights are derived from the financial statements prepared in accordance with IFRS.
American Equity Index Fund
(1) This information is derived from the Fund's audited annual financial statements. The Net assets attributable to contractholders per unit presented in the financial statements differs from the net asset value per unit calculated for fund pricing purposes. An explanation of these differences can be found in the notes to the financial statements.
(2) Management expense ratio is based on total expenses (excluding commissions and other portfolio transaction costs) for the stated period and is expressed as an annualized percentage of daily average net asset value during the period. It is calculated by dividing the total operating expenses (excluding commissions, transaction costs) and management fees including applicable taxes, by the average net asset value of the fund for the financial period, then multiplying the result by 100.
(3) The Fund's portfolio turnover rate indicates how actively the Fund's portfolio adviser manages its portfolio investments. A portfolio turnover rate of 100% is equivalent to the Fund buying and selling all of the securities in its portfolio once in the course of the year. The higher a fund's portfolio turnover rate in a year, the greater the trading costs payable by the fund in the year, and the greater the chance of an investor receiving taxable capital gains (losses) in the year. There is not necessarily a relationship between a high turnover rate and the performance of a fund.
147
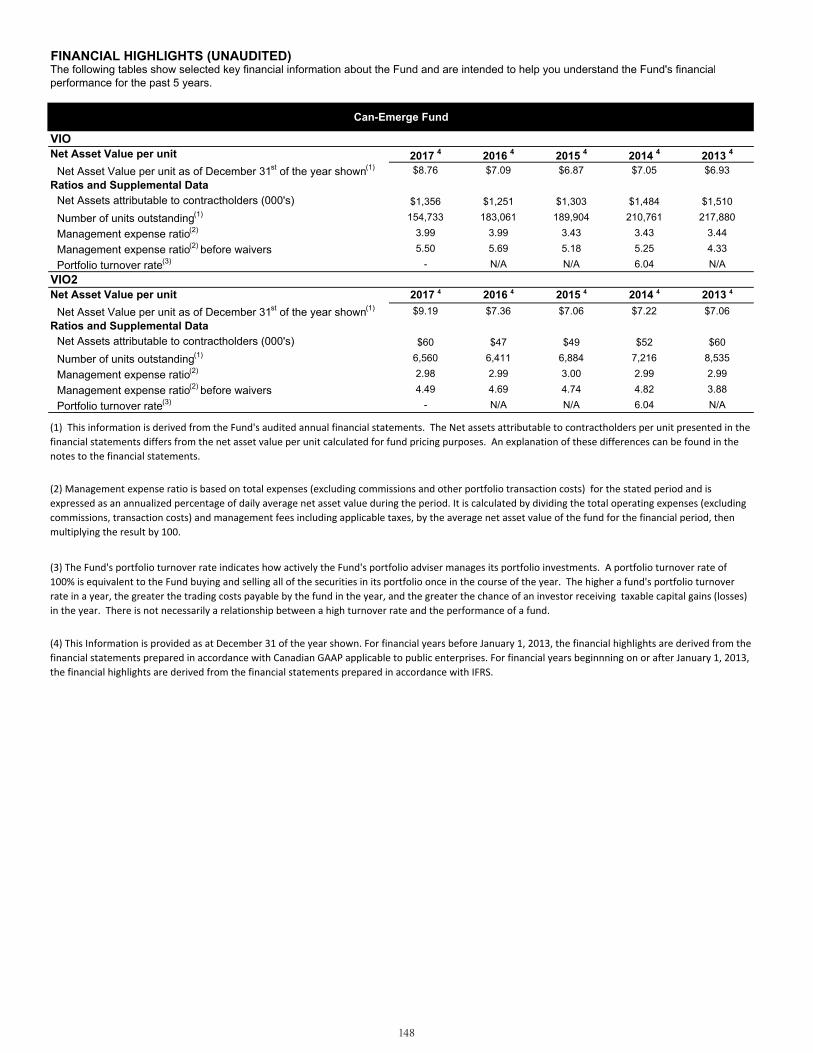
FINANCIAL HIGHLIGHTS (UNAUDITED)
VIONet Asset Value per unit 2017 4 2016 4 2015 4 2014 4 2013 4
Net Asset Value per unit as of December 31st of the year shown(1) $8.76 $7.09 $6.87 $7.05 $6.93 Ratios and Supplemental Data
Net Assets attributable to contractholders (000's) $1,356 $1,251 $1,303 $1,484 $1,510
Number of units outstanding(1) 154,733 183,061 189,904 210,761 217,880
Management expense ratio(2) 3.99 3.99 3.43 3.43 3.44
Management expense ratio(2) before waivers 5.50 5.69 5.18 5.25 4.33
Portfolio turnover rate(3) - N/A N/A 6.04 N/AVIO2Net Asset Value per unit 2017 4 2016 4 2015 4 2014 4 2013 4
Net Asset Value per unit as of December 31st of the year shown(1) $9.19 $7.36 $7.06 $7.22 $7.06 Ratios and Supplemental Data
Net Assets attributable to contractholders (000's) $60 $47 $49 $52 $60
Number of units outstanding(1) 6,560 6,411 6,884 7,216 8,535
Management expense ratio(2) 2.98 2.99 3.00 2.99 2.99
Management expense ratio(2) before waivers 4.49 4.69 4.74 4.82 3.88
Portfolio turnover rate(3) - N/A N/A 6.04 N/A
The following tables show selected key financial information about the Fund and are intended to help you understand the Fund's financialperformance for the past 5 years.
(3) The Fund's portfolio turnover rate indicates how actively the Fund's portfolio adviser manages its portfolio investments. A portfolio turnover rate of 100% is equivalent to the Fund buying and selling all of the securities in its portfolio once in the course of the year. The higher a fund's portfolio turnover rate in a year, the greater the trading costs payable by the fund in the year, and the greater the chance of an investor receiving taxable capital gains (losses) in the year. There is not necessarily a relationship between a high turnover rate and the performance of a fund.
(4) This Information is provided as at December 31 of the year shown. For financial years before January 1, 2013, the financial highlights are derived from the financial statements prepared in accordance with Canadian GAAP applicable to public enterprises. For financial years beginnning on or after January 1, 2013, the financial highlights are derived from the financial statements prepared in accordance with IFRS.
Can-Emerge Fund
(1) This information is derived from the Fund's audited annual financial statements. The Net assets attributable to contractholders per unit presented in the financial statements differs from the net asset value per unit calculated for fund pricing purposes. An explanation of these differences can be found in the notes to the financial statements.
(2) Management expense ratio is based on total expenses (excluding commissions and other portfolio transaction costs) for the stated period and is expressed as an annualized percentage of daily average net asset value during the period. It is calculated by dividing the total operating expenses (excluding commissions, transaction costs) and management fees including applicable taxes, by the average net asset value of the fund for the financial period, then multiplying the result by 100.
148

FINANCIAL HIGHLIGHTS (UNAUDITED)
VIONet Asset Value per unit 2017 4 2016 4 2015 4 2014 4 2013 4
Net Asset Value per unit as of December 31st of the year shown(1) $7.00 $6.20 $6.86 $6.19 $6.44 Ratios and Supplemental Data
Net Assets attributable to contractholders (000's) $56 $49 $52 $40 $41
Number of units outstanding(1) 8,035 7,863 7,639 6,496 6,439
Management expense ratio(2) 3.94 3.93 3.41 3.40 3.40
Management expense ratio(2) before waivers 47.98 54.24 50.89 64.66 32.68
Portfolio turnover rate(3) N/A 97.24 N/A N/A N/A
The following tables show selected key financial information about the Fund and are intended to help you understand the Fund's financialperformance for the past 5 years.
(4) This Information is provided as at December 31 of the year shown. For financial years before January 1, 2013, the financial highlights are derived from the financial statements prepared in accordance with Canadian GAAP applicable to public enterprises. For financial years beginnning on or after January 1, 2013, the financial highlights are derived from the financial statements prepared in accordance with IFRS.
European Equity Index Fund
(1) This information is derived from the Fund's audited annual financial statements. The Net assets attributable to contractholders per unit presented in the financial statements differs from the net asset value per unit calculated for fund pricing purposes. An explanation of these differences can be found in the notes to the financial statements.
(2) Management expense ratio is based on total expenses (excluding commissions and other portfolio transaction costs) for the stated period and is expressed as an annualized percentage of daily average net asset value during the period. It is calculated by dividing the total operating expenses (excluding commissions, transaction costs) and management fees including applicable taxes, by the average net asset value of the fund for the financial period, then multiplying the result by 100.
(3) The Fund's portfolio turnover rate indicates how actively the Fund's portfolio adviser manages its portfolio investments. A portfolio turnover rate of 100% is equivalent to the Fund buying and selling all of the securities in its portfolio once in the course of the year. The higher a fund's portfolio turnover rate in a year, the greater the trading costs payable by the fund in the year, and the greater the chance of an investor receiving taxable capital gains (losses) in the year. There is not necessarily a relationship between a high turnover rate and the performance of a fund.
149
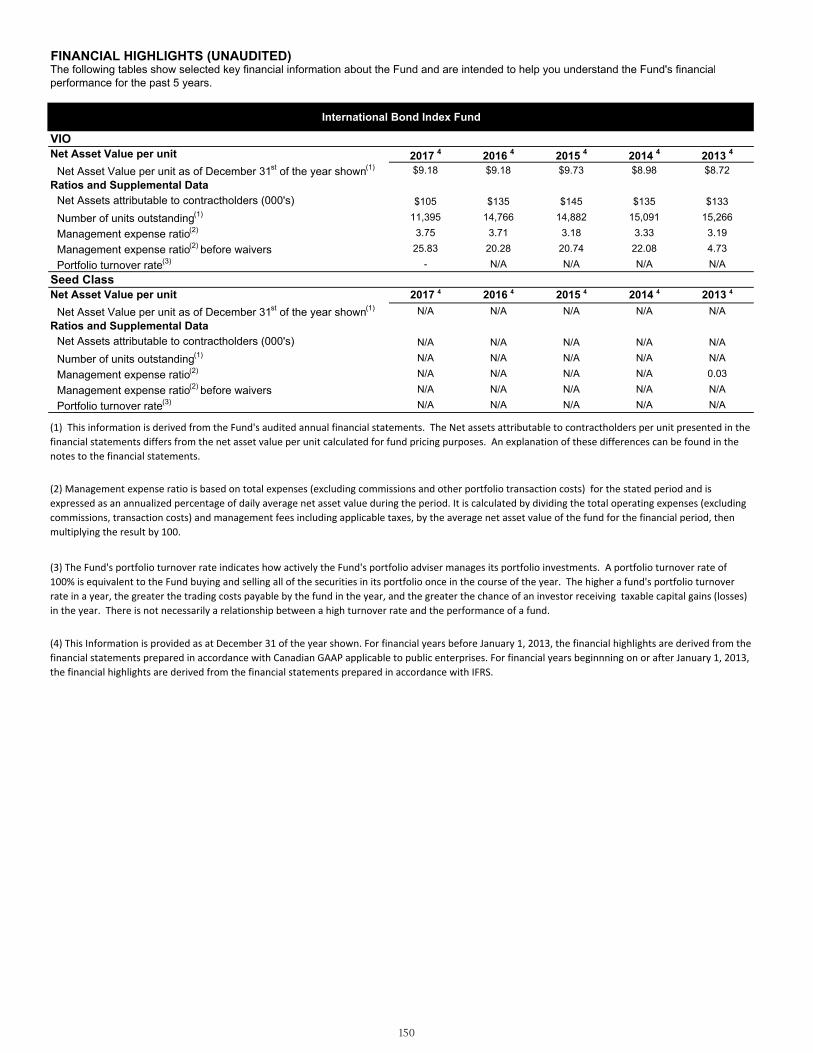
FINANCIAL HIGHLIGHTS (UNAUDITED)
VIONet Asset Value per unit 2017 4 2016 4 2015 4 2014 4 2013 4
Net Asset Value per unit as of December 31st of the year shown(1) $9.18 $9.18 $9.73 $8.98 $8.72 Ratios and Supplemental Data
Net Assets attributable to contractholders (000's) $105 $135 $145 $135 $133
Number of units outstanding(1) 11,395 14,766 14,882 15,091 15,266
Management expense ratio(2) 3.75 3.71 3.18 3.33 3.19
Management expense ratio(2) before waivers 25.83 20.28 20.74 22.08 4.73
Portfolio turnover rate(3) - N/A N/A N/A N/ASeed ClassNet Asset Value per unit 2017 4 2016 4 2015 4 2014 4 2013 4
Net Asset Value per unit as of December 31st of the year shown(1) N/A N/A N/A N/A N/ARatios and Supplemental Data
Net Assets attributable to contractholders (000's) N/A N/A N/A N/A N/A
Number of units outstanding(1) N/A N/A N/A N/A N/A
Management expense ratio(2) N/A N/A N/A N/A 0.03
Management expense ratio(2) before waivers N/A N/A N/A N/A N/A
Portfolio turnover rate(3) N/A N/A N/A N/A N/A
The following tables show selected key financial information about the Fund and are intended to help you understand the Fund's financialperformance for the past 5 years.
(3) The Fund's portfolio turnover rate indicates how actively the Fund's portfolio adviser manages its portfolio investments. A portfolio turnover rate of 100% is equivalent to the Fund buying and selling all of the securities in its portfolio once in the course of the year. The higher a fund's portfolio turnover rate in a year, the greater the trading costs payable by the fund in the year, and the greater the chance of an investor receiving taxable capital gains (losses) in the year. There is not necessarily a relationship between a high turnover rate and the performance of a fund.
(4) This Information is provided as at December 31 of the year shown. For financial years before January 1, 2013, the financial highlights are derived from the financial statements prepared in accordance with Canadian GAAP applicable to public enterprises. For financial years beginnning on or after January 1, 2013, the financial highlights are derived from the financial statements prepared in accordance with IFRS.
International Bond Index Fund
(1) This information is derived from the Fund's audited annual financial statements. The Net assets attributable to contractholders per unit presented in the financial statements differs from the net asset value per unit calculated for fund pricing purposes. An explanation of these differences can be found in the notes to the financial statements.
(2) Management expense ratio is based on total expenses (excluding commissions and other portfolio transaction costs) for the stated period and is expressed as an annualized percentage of daily average net asset value during the period. It is calculated by dividing the total operating expenses (excluding commissions, transaction costs) and management fees including applicable taxes, by the average net asset value of the fund for the financial period, then multiplying the result by 100.
150

FINANCIAL HIGHLIGHTS (UNAUDITED)
VIONet Asset Value per unit 2017 4 2016 4 2015 4 2014 4 2013 4
Net Asset Value per unit as of December 31st of the year shown(1) $7.24 $6.07 $5.64 $4.64 $3.78 Ratios and Supplemental Data
Net Assets attributable to contractholders (000's) $238 $201 $186 $159 $129
Number of units outstanding(1) 32,922 33,233 32,977 34,369 34,051
Management expense ratio(2) 4.36 4.35 3.78 3.75 3.78
Management expense ratio(2) before waivers 14.60 17.04 17.74 22.02 5.63
Portfolio turnover rate(3) - N/A N/A N/A 196.18
The following tables show selected key financial information about the Fund and are intended to help you understand the Fund's financialperformance for the past 5 years.
(4) This Information is provided as at December 31 of the year shown. For financial years before January 1, 2013, the financial highlights are derived from the financial statements prepared in accordance with Canadian GAAP applicable to public enterprises. For financial years beginnning on or after January 1, 2013, the financial highlights are derived from the financial statements prepared in accordance with IFRS.
Information Technology Fund
(1) This information is derived from the Fund's audited annual financial statements. The Net assets attributable to contractholders per unit presented in the financial statements differs from the net asset value per unit calculated for fund pricing purposes. An explanation of these differences can be found in the notes to the financial statements.
(2) Management expense ratio is based on total expenses (excluding commissions and other portfolio transaction costs) for the stated period and is expressed as an annualized percentage of daily average net asset value during the period. It is calculated by dividing the total operating expenses (excluding commissions, transaction costs) and management fees including applicable taxes, by the average net asset value of the fund for the financial period, then multiplying the result by 100.
(3) The Fund's portfolio turnover rate indicates how actively the Fund's portfolio adviser manages its portfolio investments. A portfolio turnover rate of 100% is equivalent to the Fund buying and selling all of the securities in its portfolio once in the course of the year. The higher a fund's portfolio turnover rate in a year, the greater the trading costs payable by the fund in the year, and the greater the chance of an investor receiving taxable capital gains (losses) in the year. There is not necessarily a relationship between a high turnover rate and the performance of a fund.
151

FINANCIAL HIGHLIGHTS (UNAUDITED)
VIONet Asset Value per unit 2017 4 2016 4 2015 4 2014 4 2013 4
Net Asset Value per unit as of December 31st of the year shown(1) $11.01 $10.15 $9.81 $8.49 $7.24 Ratios and Supplemental Data
Net Assets attributable to contractholders (000's) $31 $28 $24 $20 $17
Number of units outstanding(1) 2,830 2,808 2,447 2,402 2,357
Management expense ratio(2) 4.30 4.26 3.71 3.70 3.76
Management expense ratio(2) before waivers 84.97 100.11 110.24 144.96 33.61
Portfolio turnover rate(3) N/A 3.52 N/A N/A 168.57
The following tables show selected key financial information about the Fund and are intended to help you understand the Fund's financialperformance for the past 5 years.
(4) This Information is provided as at December 31 of the year shown. For financial years before January 1, 2013, the financial highlights are derived from the financial statements prepared in accordance with Canadian GAAP applicable to public enterprises. For financial years beginnning on or after January 1, 2013, the financial highlights are derived from the financial statements prepared in accordance with IFRS.
International Brands Fund
(1) This information is derived from the Fund's audited annual financial statements. The Net assets attributable to contractholders per unit presented in the financial statements differs from the net asset value per unit calculated for fund pricing purposes. An explanation of these differences can be found in the notes to the financial statements.
(2) Management expense ratio is based on total expenses (excluding commissions and other portfolio transaction costs) for the stated period and is expressed as an annualized percentage of daily average net asset value during the period. It is calculated by dividing the total operating expenses (excluding commissions, transaction costs) and management fees including applicable taxes, by the average net asset value of the fund for the financial period, then multiplying the result by 100.
(3) The Fund's portfolio turnover rate indicates how actively the Fund's portfolio adviser manages its portfolio investments. A portfolio turnover rate of 100% is equivalent to the Fund buying and selling all of the securities in its portfolio once in the course of the year. The higher a fund's portfolio turnover rate in a year, the greater the trading costs payable by the fund in the year, and the greater the chance of an investor receiving taxable capital gains (losses) in the year. There is not necessarily a relationship between a high turnover rate and the performance of a fund.
152

FINANCIAL HIGHLIGHTS (UNAUDITED)
Net Asset Value per unit 2017 4 2016 4 2015 4 2014 4 2013 4
Net Asset Value per unit as of December 31st of the year shown(1) $19.99 $19.09 $17.57 $19.11 $18.34 Ratios and Supplemental Data
Net Assets attributable to contractholders (000's) $15,846 $15,788 $15,278 $17,328 $17,378
Number of units outstanding(1) 792,926 827,396 870,083 907,451 948,207
Management expense ratio(2) 3.72 3.76 3.64 3.65 3.65
Management expense ratio(2) before waivers 3.79 3.86 3.71 3.69 3.66
Portfolio turnover rate(3) 74.64 146.77 143.19 93.62 139.32VIO2Net Asset Value per unit 2017 4 2016 4 2015 4 2014 4 2013 4
Net Asset Value per unit as of December 31st of the year shown(1) $21.15 $20.05 $18.31 $19.79 $18.87 Ratios and Supplemental Data
Net Assets attributable to contractholders (000's) $2,348 $2,277 $2,087 $2,444 $2,361
Number of units outstanding(1) 111,076 113,590 114,007 123,608 125,189
Management expense ratio(2) 3.00 2.99 2.99 2.99 2.99
Management expense ratio(2) before waivers 3.07 3.09 3.06 3.03 3.00
Portfolio turnover rate(3) 74.64 146.77 143.19 93.62 139.32
The following tables show selected key financial information about the Fund and are intended to help you understand the Fund's financialperformance for the past 5 years.
(4) This Information is provided as at December 31 of the year shown. For financial years before January 1, 2013, the financial highlights are derived from the financial statements prepared in accordance with Canadian GAAP applicable to public enterprises. For financial years beginnning on or after January 1, 2013, the financial highlights are derived from the financial statements prepared in accordance with IFRS.
Equity Fund
VIO
(1) This information is derived from the Fund's audited annual financial statements. The Net assets attributable to contractholders per unit presented in the financial statements differs from the net asset value per unit calculated for fund pricing purposes. An explanation of these differences can be found in the notes to the financial statements.
(2) Management expense ratio is based on total expenses (excluding commissions and other portfolio transaction costs) for the stated period and is expressed as an annualized percentage of daily average net asset value during the period. It is calculated by dividing the total operating expenses (excluding commissions, transaction costs) and management fees including applicable taxes, by the average net asset value of the fund for the financial period, then multiplying the result by 100.
(3) The Fund's portfolio turnover rate indicates how actively the Fund's portfolio adviser manages its portfolio investments. A portfolio turnover rate of 100% is equivalent to the Fund buying and selling all of the securities in its portfolio once in the course of the year. The higher a fund's portfolio turnover rate in a year, the greater the trading costs payable by the fund in the year, and the greater the chance of an investor receiving taxable capital gains (losses) in the year. There is not necessarily a relationship between a high turnover rate and the performance of a fund.
153

FINANCIAL HIGHLIGHTS (UNAUDITED)
Net Asset Value per unit 2017 4 2016 4 2015 4 2014 4 2013 4
Net Asset Value per unit as of December 31st of the year shown(1) $44.64 $44.73 $45.11 $44.86 $42.39 Ratios and Supplemental Data
Net Assets attributable to contractholders (000's) $5,818 $6,260 $6,562 $6,820 $6,773
Number of units outstanding(1) 130,484 140,128 145,693 152,383 160,051
Management expense ratio(2) 3.11 3.10 2.97 2.96 2.97
Management expense ratio(2) before waivers 3.18 3.18 3.08 3.07 2.98
Portfolio turnover rate(3) 144.99 104.36 67.1 100.08 137.36VIO2Net Asset Value per unit 2017 4 2016 4 2015 4 2014 4 2013 4
Net Asset Value per unit as of December 31st of the year shown(1) $42.40 $42.75 $43.38 $43.38 $41.22 Ratios and Supplemental Data
Net Assets attributable to contractholders (000's) $3,937 $4,323 $4,758 $5,021 $5,091
Number of units outstanding(1) 92,953 101,242 109,825 116,005 123,696
Management expense ratio(2) 3.74 3.71 3.51 3.52 3.52
Management expense ratio(2) before waivers 3.81 3.80 3.62 3.62 3.53
Portfolio turnover rate(3) 144.99 104.36 67.1 100.08 137.36VIO3Net Asset Value per unit 2017 4 2016 4 2015 4 2014 4 2013 4
Net Asset Value per unit as of December 31st of the year shown(1) $46.46 $46.27 $46.38 $45.90 $43.17 Ratios and Supplemental Data
Net Assets attributable to contractholders (000's) $1,038 $1,264 $1,294 $1,348 $1,391
Number of units outstanding(1) 22,362 27,348 27,939 29,442 32,263
Management expense ratio(2) 2.50 2.49 2.49 2.49 2.49
Management expense ratio(2) before waivers 2.57 2.58 2.60 2.59 2.51
Portfolio turnover rate(3) 144.99 104.36 67.1 100.08 137.36
The following tables show selected key financial information about the Fund and are intended to help you understand the Fund's financialperformance for the past 5 years.
(3) The Fund's portfolio turnover rate indicates how actively the Fund's portfolio adviser manages its portfolio investments. A portfolio turnover rate of 100% is equivalent to the Fund buying and selling all of the securities in its portfolio once in the course of the year. The higher a fund's portfolio turnover rate in a year, the greater the trading costs payable by the fund in the year, and the greater the chance of an investor receiving taxable capital gains (losses) in the year. There is not necessarily a relationship between a high turnover rate and the performance of a fund.
(4) This Information is provided as at December 31 of the year shown. For financial years before January 1, 2013, the financial highlights are derived from the financial statements prepared in accordance with Canadian GAAP applicable to public enterprises. For financial years beginnning on or after January 1, 2013, the financial highlights are derived from the financial statements prepared in accordance with IFRS.
Mid-Term Bond Fund
VIO
(1) This information is derived from the Fund's audited annual financial statements. The Net assets attributable to contractholders per unit presented in the financial statements differs from the net asset value per unit calculated for fund pricing purposes. An explanation of these differences can be found in the notes to the financial statements.
(2) Management expense ratio is based on total expenses (excluding commissions and other portfolio transaction costs) for the stated period and is expressed as an annualized percentage of daily average net asset value during the period. It is calculated by dividing the total operating expenses (excluding commissions, transaction costs) and management fees including applicable taxes, by the average net asset value of the fund for the financial period, then multiplying the result by 100.
154

DisclaimersSource: MSCI makes no express or implied warranties or representations and shall have no liability whatsoever with respect to any MSCI data contained herein. The MSCI data may not be further redistributed or used as a basis for other indexes or any securities or financial products. This report is not approved, endorsed, reviewed or produced by MSCI. None of the MSCI data is intended to constitute investment advice or a recommendation to make (or refrain from making) any kind of investment decision and may not be relied on as such.
The ivari’s product is not in any way sponsored, endorsed, sold or promoted by FTSE TMX Global Debt Capital Markets Inc. (together the “Licensor Parties”) and the Licensor Parties do not make any warranty or representation whatsoever, expressly or impliedly, either as to the results to be obtained from the use of the (“the Index*”) and/or the figure at which the said Index stands at any particular time on any particular day or otherwise. The Index is compiled and calculated by FTSE TMX Global Debt Capital Markets Inc. and all copyright in the Index values and constituent lists vests in FTSE TMX Global Debt Capital Markets Inc. None of the Licensor Parties shall be liable (whether in negligence or otherwise) to any person for any error in the Index and the Licensor Parties shall not be under any obligation to advise any person of any error therein.
“FTSE” is a trade mark of FTSE International Ltd and is used under licence.” “TMX” is a trade mark of TSX Inc. and is used under licence. *Index-FTSE TMX Canada Bond Universe Index
The Fund is not sponsored, endorsed, sold or promoted by NASDAQ, Inc. or its affiliates (NASDAQ, with its affiliates, are referred to as the “Corporations”). The Corporations have not passed on the legality or suitability of, or the accuracy or adequacy of descriptions and disclosures relating to, the Fund. The Corporations make no representation or warranty, express or implied to the unitholders of the Fund or any member of the public regarding the advisability of investing in securities generally or in the Fund particularly, or the ability of the NASDAQ-100 Index® to track general stock market performance. The Corporations’ only relationship to ivari (“Licensee”) is in the licensing of the Nasdaq® and NASDAQ-100 Index® marks, and certain trade names of the Corporations and the use of the NASDAQ-100 Index® which is determined, composed and calculated by NASDAQ without regard to ivari or the Fund. NASDAQ has no obligation to take the needs of ivari or the unitholders of the Fund into consideration in determining, composing or calculating the NASDAQ-100 Index®. The Corporations are not responsible for and have not participated in the determination of the timing of, prices at, or quantities of the Fund’s units to be issued or in the determination or calculation of the equation by which the Fund’s units are to be converted into cash. The Corporations have no liability in connection with the administration, marketing or offering of the Fund. THE CORPORATIONS DO NOT GUARANTEE THE ACCURACY AND/OR UNINTERRUPTED CALCULATION OF THE NASDAQ-100 INDEX® OR ANY DATA INCLUDED THEREIN. THE CORPORATIONS MAKE NO WARRANTY, EXPRESS OR IMPLIED, AS TO RESULTS TO BE OBTAINED BY ivari, UNITHOLDERS OF THE FUND, OR ANY OTHER PERSON OR ENTITY FROM THE USE OF THE NASDAQ-100 INDEX® OR ANY DATA INCLUDED THEREIN. THE CORPORATIONS MAKE NO EXPRESS OR IMPLIED WARRANTIES, AND EXPRESSLY DISCLAIM ALL WARRANTIES OF MERCHANTABILITY OR FITNESS FOR A PARTICULAR PURPOSE OR USE WITH RESPECT TO THE NASDAQ-100 INDEX® OR ANY DATA INCLUDED THEREIN. WITHOUT LIMITING ANY OF THE FOREGOING, IN NO EVENT SHALL THE CORPORATIONS HAVE ANY LIABILITY FOR ANY LOST PROFITS OR SPECIAL, INCIDENTAL, PUNITIVE, INDIRECT, OR CONSEQUENTIAL DAMAGES, EVEN IF NOTIFIED OF THE POSSIBILITY OF SUCH DAMAGES.
The “Index”** is a product of S&P Dow Jones Indices LLC (“SPDJI”) and TSX Inc., and has been licensed for use by ivari. Standard & Poor’s® and S&P® are registered trademarks of Standard & Poor’s Financial Services LLC (“S&P”). Dow Jones® is a registered trademark of Dow Jones Trademark Holdings LLC (“Dow Jones”). TSX® is a registered trademark of TSX Inc. The trademarks have been licensed to SPDJI and have been sublicensed for use for certain purposes by ivari. ivari’s Product(s) are not sponsored, endorsed, sold or promoted by SPDJI, S&P, Dow Jones, any of their respective affiliates (collectively, “S&P Dow Jones Indices”) or TSX Inc. or its affiliates (collectively, “TSX”). Neither S&P Dow Jones Indices nor TSX make any representation or warranty, express or implied, to the owners of the ivari’s Product(s) or any member of the public regarding the advisability of investing in securities generally or in ivari’s Product(s) particularly or the ability of the Index** to track general market performance. S&P Dow Jones Indices’ only relationship to ivari with respect to the Index** is the licensing of the Index and certain trademarks, service marks and/or trade names of S&P Dow Jones Indices and/or its licensors. The Index** is determined, composed and calculated by S&P Dow Jones Indices without regard to ivari or the ivari’s Product(s). S&P Dow Jones Indices and TSX have no obligation to take the needs of ivari or the owners of ivari’s Product(s) into consideration in determining, composing or calculating the Index**. Neither S&P Dow Jones Indices nor TSX are responsible for and have not participated in the determination of the prices, and amount of ivari’s Product(s) or the timing of the issuance or sale of ivari’s Product(s) or in the determination or calculation of the equation by which ivari’s Product(s) is to be converted into cash, surrendered or redeemed, as the case may be. S&P Dow Jones Indices and TSX have no obligation or liability in connection with the administration, marketing or trading of ivari’s Product(s). There is no assurance that investment products based on the Index** will accurately track index performance or provide positive investment returns. S&P Dow Jones Indices LLC and TSX are not investment advisors. Inclusion of a security within an index is not a recommendation by S&P Dow Jones Indices or TSX to buy, sell, or hold such security, nor is it considered to be investment advice. NEITHER S&P DOW JONES INDICES NOR TSX GUARANTEES THE ADEQUACY, ACCURACY, TIMELINESS AND/OR THE COMPLETENESS OF THE INDEX** OR ANY DATA RELATED THERETO OR ANY COMMUNICATION, INCLUDING BUT NOT LIMITED TO, ORAL OR WRITTEN COMMUNICATION (INCLUDING ELECTRONIC COMMUNICATIONS) WITH RESPECT THERETO. S&P DOW JONES INDICES AND TSX SHALL NOT BE SUBJECT TO ANY DAMAGES OR LIABILITY FOR ANY ERRORS, OMISSIONS, OR DELAYS THEREIN. S&P DOW JONES INDICES AND TSX MAKE NO EXPRESS OR IMPLIED WARRANTIES, AND EXPRESSLY DISCLAIM ALL WARRANTIES OF MERCHANTABILITY OR FITNESS FOR A PARTICULAR PURPOSE OR USE OR AS TO RESULTS TO BE OBTAINED BY ivari, OWNERS OF THE ivari’s PRODUCT(S), OR ANY OTHER PERSON OR ENTITY FROM THE USE OF THE INDEX** OR WITH RESPECT TO ANY DATA RELATED THERETO. WITHOUT LIMITING ANY OF THE FOREGOING, IN NO EVENT WHATSOEVER SHALL S&P DOW JONES INDICES OR TSX BE LIABLE FOR ANY INDIRECT, SPECIAL, INCIDENTAL, PUNITIVE, OR CONSEQUENTIAL DAMAGES INCLUDING BUT NOT LIMITED TO, LOSS OF PROFITS, TRADING LOSSES, LOST TIME OR GOODWILL, EVEN IF THEY HAVE BEEN ADVISED OF THE POSSIBLITY OF SUCH DAMAGES, WHETHER IN CONTRACT, TORT, STRICT LIABILITY, OR OTHERWISE. THERE ARE NO THIRD PARTY BENEFICIARIES OF ANY AGREEMENTS OR ARRANGEMENTS BETWEEN S&P DOW JONES INDICES AND ivari, OTHER THAN THE LICENSORS OF S&P DOW JONES INDICES.
**Index – S&P/TSX 60 Index , S&P/TSX Composite Index, S&P/TSX Capped Financials, S&P/TSX Capped Energy Index, S&P/TSX Capped Materials Index, S&P/TSX Small Cap Index.
Disclaimers (continued)
1. The Nikkei Stock Average (NSA) is a copyrighted material calculated in a methodology independently developed and created by The Licensor and The Licensor is the sole exclusive owner of the copyright and other intellectual property rights in the NSA itself and the methodology to calculate the NSA;
2. The intellectual property and any other rights in the marks to indicate Nikkei and the NSA shall be vested in Nikkei Inc.;
3. Nikkei Inc. does not sponsor, support, sell or market the Product. Nikkei Inc. has - besides granting the license to the Licensee to use certain trademarks and to use the NSA for the Product – no connection with the Product. The license agreement between Nikkei Inc. and the Licensee does not provide any rights to any third parties.
4. The Product is managed exclusively at the risk of the Licensee and Nikkei Inc. shall assume no obligation or responsibility for its management and transactions of the Product. Nikkei Inc. is not responsible for the accuracy and the calculation of the Product or the data contained therein.
5. Nikkei Inc. shall not have the obligation to continuously announce the NSA and shall not be liable for any error, delay, interruption, suspension or cessation of announcement thereof; and
6. Nikkei Inc. shall have the right to change the description of the stocks included in the NSA, the calculation methodology of the NSA or any other details of the NSA and shall have the right to suspend or cease the announcement of the NSA without owning any liability to the Licensor or any other third party.
The Hang Seng Index (the “Index”) is published and compiled by Hang Seng Indexes Company Limited pursuant to a licence from Hang Seng Data Services Limited. The mark and name Hang Seng Index are proprietary to Hang Seng Data Services Limited. Hang Seng Indexes Company Limited and Hang Seng Data Services Limited have agreed to the use of, and reference to, the Index by ivari in connection with Can-Asian Fund/Index Account (the “Product”), BUT NEITHER HANG SENG INDEXES COMPANY LIMITED NOR HANG SENG DATA SERVICES LIMITED WARRANTS OR REPRESENTS OR GUARANTEES TO ANY BROKER OR HOLDER OF THE PRODUCT OR ANY OTHER PERSON (i) THE ACCURACY OR COMPLETENESS OF THE INDEX AND ITS COMPUTATION OR ANY INFORMATION RELATED THERETO; OR (ii) THE FITNESS OR SUITABILITY FOR ANY PURPOSE OF THE INDEX OR ANY COMPONENT OR DATA COMPRISED IN IT; OR (iii) THE RESULTS WHICH MAY BE OBTAINED BY ANY PERSON FROM THE USE OF THE INDEX OR ANY COMPONENT OR DATA COMPRISED IN IT FOR ANY PURPOSE, AND NO WARRANTY OR REPRESENTATION OR GUARANTEE OF ANY KIND WHATSOEVER RELATING TO THE INDEX IS GIVEN OR MAY BE IMPLIED. The process and basis of computation and compilation of the Index and any of the related formula or formulae, constituent stocks and factors may at any time be changed or altered by Hang Seng Indexes Company Limited without notice. TO THE EXTENT PERMITTED BY APPLICABLE LAW, NO RESPONSIBILITY OR LIABILITY IS ACCEPTED BY HANG SENG INDEXES COMPANY LIMITED OR HANG SENG DATA SERVICES LIMITED (i) IN RESPECT OF THE USE OF AND/OR REFERENCE TO THE INDEX BY ivari IN CONNECTION WITH THE PRODUCT; OR (ii) FOR ANY INACCURACIES, OMISSIONS, MISTAKES OR ERRORS OF HANG SENG INDEXES COMPANY LIMITED IN THE COMPUTATION OF THE INDEX; OR (iii) FOR ANY INACCURACIES, OMISSIONS, MISTAKES, ERRORS OR INCOMPLETENESS OF ANY INFORMATION USED IN CONNECTION WITH THE COMPUTATION OF THE INDEX WHICH IS SUPPLIED BY ANY OTHER PERSON; OR (iv) FOR ANY ECONOMIC OR OTHER LOSS WHICH MAY BE DIRECTLY OR INDIRECTLY SUSTAINED BY ANY BROKER OR HOLDER OF THE PRODUCT OR ANY OTHER PERSON DEALING WITH THE PRODUCT AS A RESULT OF ANY OF THE AFORESAID, AND NO CLAIMS, ACTIONS OR LEGAL PROCEEDINGS MAY BE BROUGHT AGAINST HANG SENG INDEXES COMPANY LIMITED AND/OR HANG SENG DATA SERVICES LIMITED in connection with the Product in any manner whatsoever by any broker, holder or other person dealing with the Product. Any broker, holder or other person dealing with the Product does so therefore in full knowledge of this disclaimer and can place no reliance whatsoever on Hang Seng Indexes Company Limited and Hang Seng Data Services Limited. An investor, by purchasing the Product, will be regarded as having acknowledged, understood and accepted this disclaimer and will be bound by it; and the level of the Index at any time for the purposes of the Product will be the level as calculated by HSIL in its sole discretion. For the avoidance of doubt, this disclaimer does not create any contractual or quasi-contractual relationship between any broker, holder or other person and Hang Seng Indexes Company Limited and/or Hang Seng Data Services Limited and must not be construed to have created such relationship.
Any amount that is allocated to a segregated fund is invested at the risk of the contract holder(s) and may increase or decrease in value.TM ivari and the ivari logos are trademarks of ivari Holdings ULC. ivari is licensed to use such marks.
IP718 4/18
500-5000 Yonge StreetToronto, Ontario M2N 7J8ivari.ca
With a national network of thousands of independent advisors, ivari provides a full range of
insurance products designed to help Canadians make the right choice for their protection needs.
The people, products and service that make up ivari have stood the test of time and have been
around for over 80 years in the Canadian marketplace. Through our commitment to always being
approachable and transparent in everything we do, we are dedicated to starting a fresh, new
conversation about insurance. And we will stand by our word. Visit us at ivari.ca.