Embed Size (px)
Citation preview

Investment Management Positions: Pay Philosophy Discussion and Recommendations
February 2019
Agenda Item 8b | Attachment 1 | Page 1 of 22

Methodology Overview
Agenda Item 8b | Attachment 1 | Page 2 of 22

© 2019 Grant Thornton LLP | All rights reserved | U.S. member firm of Grant Thornton International Ltd
Methodology• GT provided compensation design recommendations for investment
positions based on outcomes from the December meeting
• Proposed compensation levels are intended to position CalPERS near the comparator Total Cash 50th percentile (approved philosophy):
• Option A has significantly higher salaries and lower annual incentives
• Option C has slightly higher salaries, annual incentives similar to current levels, and introduces a new long-term incentive
• Both options still represent discount from industry/market levels
3
Agenda Item 8b | Attachment 1 | Page 3 of 22

© 2019 Grant Thornton LLP | All rights reserved | U.S. member firm of Grant Thornton International Ltd
Methodology (continued)
4
Option Goal: establish compensation levels at the comparator total cash 50th percentile with incentives aligned with mission
A1 • Increase salary midpoints to market 90th percentile (or above, depending on position)• Decrease annual incentive ranges• No long-term incentives
C1 • Increase salary midpoints to market 50th to 75th percentile (depending on position)• Maintain or slightly increase annual incentive ranges (depending on position)• Introduce long-term incentives with values equal to annual incentive range targets
1 Source data for both options is from the comparator group compensation survey conducted by McLagan and presented to the Board in 2015; conservative adjustments to the data were made to more closely represent today’s market.
Agenda Item 8b | Attachment 1 | Page 4 of 22

© 2019 Grant Thornton LLP | All rights reserved | U.S. member firm of Grant Thornton International Ltd
Long Term Incentive –Design and High Level Overview• Option C introduces a long-term incentive ("LTI") as a part of total
compensation
• LTI levels, expressed as a percent of salary, are equal to annual incentive range targets and vary by position classification• E.g., 0–60% annual incentive range (40% target) would have an LTI of 40%
• Comparable annual and LTI opportunities provide an appropriate balance of incentivizing short-term performance, longer-term stewardship, and promote retention
5
Agenda Item 8b | Attachment 1 | Page 5 of 22

© 2019 Grant Thornton LLP | All rights reserved | U.S. member firm of Grant Thornton International Ltd
Long Term Incentive –Design and High Level Overview (continued)• GT recommends measuring absolute fund performance over a
multi-year (i.e. 3-5 years) period, with payouts occurring at the end of the performance period
• Note: relative fund performance is measured in the annual incentive plan
• If Option C is selected, GT and CalPERS will work to finalize implementation recommendations ahead of the next Committee meeting
6
Agenda Item 8b | Attachment 1 | Page 6 of 22

Recommended Compensation Levels and Ranges
Agenda Item 8b | Attachment 1 | Page 7 of 22

© 2019 Grant Thornton LLP | All rights reserved | U.S. member firm of Grant Thornton International Ltd
Associate Investment Manager
8
Market Total Cash Levels
CalPERS Today: 0-40% Incentive Range (27% Target)
Option A: 0-21% Incentive Range (14% Target)
Option C: 0-40% Incentive Range (27% Target), 27% LTI
$135$162
$204$256
$146$183
$36
$65
$29
$54
$39
$73$39
$49
Mkt P25,$199
Mkt P50,$243
Mkt P75,$287
$171
$227 $233
$309
$225
$305
$0
$50
$100
$150
$200
$250
$300
$350
Mid Base +Tgt Bonus
Max Base +Max Bonus
Mid Base +Tgt Bonus
Max Base +Max Bonus
Mid Base +Tgt Bonus + LTI
Max Base +Max Bonus + LTI
Com
pens
atio
n Am
ount
($00
0s)
Salary Bonus LTI
Agenda Item 8b | Attachment 1 | Page 8 of 22

© 2019 Grant Thornton LLP | All rights reserved | U.S. member firm of Grant Thornton International Ltd
Investment Manager
9
Market Total Cash Levels
$185 $229 $185 $229 $185 $229$317
$397
$244$305
$55$103
$74
$138$92
$172$95
$178
$98
$183$98
$122
Mkt P25,$340
Mkt P50,$426
Mkt P75,$545
$240
$333
$259
$367
$277
$401$412
$575
$439
$610
$0
$100
$200
$300
$400
$500
$600
$700
Mid Base +Tgt Bonus
Max Base +Max Bonus
Mid Base +Tgt Bonus
Max Base +Max Bonus
Mid Base +Tgt Bonus
Max Base +Max Bonus
Mid Base +Tgt Bonus
Max Base +Max Bonus
Mid Base +Tgt Bonus
Max Base +Max Bonus
Com
pens
atio
n Am
ount
($00
0s)
Salary Bonus LTI
CalPERS Range A:0-45% Incentive Range
(30% Target)
CalPERS Range B:0-60% Incentive Range
(40% Target)
CalPERS Range C:0-75% Incentive Range
(50% Target)
Option A: 0-45% Incentive Range
(30% Target)
Option C: 0-60% Incentive Range (40%
Target), 40% LTI
Agenda Item 8b | Attachment 1 | Page 9 of 22

© 2019 Grant Thornton LLP | All rights reserved | U.S. member firm of Grant Thornton International Ltd
Investment Director
10
Market Total Cash Levels
$248 $308 $248 $308
$495$619
$321$401
$99
$185
$124
$231
$149
$279
$161
$301$161
$201
Mkt P25,$508
Mkt P50,$639
Mkt P75,$874
$347
$493
$372
$539
$644
$898
$642
$903
$0
$100
$200
$300
$400
$500
$600
$700
$800
$900
$1,000
Mid Base +Tgt Bonus
Max Base +Max Bonus
Mid Base +Tgt Bonus
Max Base +Max Bonus
Mid Base +Tgt Bonus
Max Base +Max Bonus
Mid Base +Tgt Bonus
Max Base +Max Bonus
Com
pens
atio
n Am
ount
($00
0s)
Salary Bonus LTI
CalPERS Range A: 0-60% Incentive Range (40% Target)
CalPERS Range B: 0-75% Incentive Range (50% Target)
Option A: 0-45% Incentive Range (30% Target)
Option C: 0-75% Incentive Range (50% Target), 50% LTI
Agenda Item 8b | Attachment 1 | Page 10 of 22

© 2019 Grant Thornton LLP | All rights reserved | U.S. member firm of Grant Thornton International Ltd
Managing Investment Director
11
Market Total Cash Levels
$345 $428$701
$876
$412 $515
$173$321
$280
$525
$288
$541$288
$361
Mkt P25,$775
Mkt P50,$1,036
Mkt P75,$1,743
$518
$749$981
$1,401
$989
$1,416
$0
$200
$400
$600
$800
$1,000
$1,200
$1,400
$1,600
$1,800
Mid Base +Tgt Bonus
Max Base +Max Bonus
Mid Base +Tgt Bonus
Max Base +Max Bonus
Mid Base +Tgt Bonus + LTI
Max Base +Max Bonus + LTI
Com
pens
atio
n Am
ount
($00
0s)
Salary Bonus LTI
CalPERS Today: 0-75% Incentive Range (50% Target)
Option A: 0-60% Incentive Range (40% Target)
Option C: 0-105% Incentive Range (70% Target), 70% LTI
Agenda Item 8b | Attachment 1 | Page 11 of 22

© 2019 Grant Thornton LLP | All rights reserved | U.S. member firm of Grant Thornton International Ltd
Chief Operating Investment Officer
12
Market Total Cash Levels
CalPERS Today: 0-60% Incentive Range (40% Target)
Option A: 0-45% Incentive Range (30% Target)
Option C: 0-75% Incentive Range (50% Target), 50% LTI
$317$393
$497$621
$328$410
$127
$236$149
$279
$164
$308$164
$205
Mkt P25,$592
Mkt P50,$659
Mkt P75,$767
$443
$629 $646
$900
$656
$923
$0
$100
$200
$300
$400
$500
$600
$700
$800
$900
$1,000
Mid Base +Tgt Bonus
Max Base +Max Bonus
Mid Base +Tgt Bonus
Max Base +Max Bonus
Mid Base +Tgt Bonus + LTI
Max Base +Max Bonus + LTI
Com
pens
atio
n Am
ount
($00
0s)
Salary Bonus LTI
Agenda Item 8b | Attachment 1 | Page 12 of 22

Cost Comparisons
Agenda Item 8b | Attachment 1 | Page 13 of 22

© 2019 Grant Thornton LLP | All rights reserved | U.S. member firm of Grant Thornton International Ltd
Cost ComparisonsThe table below details estimated total compensation costs as a % of AUM (assuming an average salary at new range midpoint)
• Projected costs assume mid salary ranges and target annual incentives• Movement of CalPERS to the new salary range for either Option A or C will be
determined as a part of implementation
14
Option Salary Tgt Incentive LTI Total % of CalPERS AUM1
Current • $24.8M • $9.7M • n/a • $34.5M 0.010%A • $44.4M • $13.0M • n/a • $57.4M 0.016%C • $31.1M • $13.9M • $13.9M • $58.9M 0.017%1 Assumes CalPERS has $350B in Assets Under Management (“AUM”)
Agenda Item 8b | Attachment 1 | Page 14 of 22

Appendix
Agenda Item 8b | Attachment 1 | Page 15 of 22

© 2019 Grant Thornton LLP | All rights reserved | U.S. member firm of Grant Thornton International Ltd
Incentive Range Revisions• GT recommends a single annual incentive range for the Investment Manager and Investment
Director positions• A policy provision would allow caps to be set within the single range based on variables such
as role, function, and placement within the organization
16
Investment Manager current ranges:• 0% – 45% (30% target)• 0% – 60% (40% target)• 0% – 75% (50% target)
GT recommends:• Option A: 0% – 45% (30% target)• Option C: 0% – 60% (40% target)
Investment Director current ranges:• 0% – 60% (40% target)• 0% – 75% (50% target)
GT recommends:• Option A: 0% – 45% (30% target)• Option C: 0% – 75% (50% target)
Agenda Item 8b | Attachment 1 | Page 16 of 22

© 2019 Grant Thornton LLP | All rights reserved | U.S. member firm of Grant Thornton International Ltd
Associate Investment Manager: Recommended Base Salary and Incentive
17
Total Cash (+ LTI for Option C)Annual Incentive Mid Base + Max Base +
Base Salary Ranges (% of Salary) LTI Tgt Bonus vs. Max Bonus vs.Min/P25 Mid/P50 Max/P75 Target Max (% of Sal) Mkt P50 Mkt P75
Current CalPERS: $108,000 $135,000 $162,000 27% 40% - $171,450 $226,800Comparator Data: $126,000 $146,000 $169,000 - - - $243,000 $287,000
Option A Proposed Comp: $153,368 $204,490 $255,613 14% 21% - $233,119 $309,291Variance from Comparator: +22% +40% +51% - - - -4% +8%
Option C Proposed Comp: $109,500 $146,000 $182,500 27% 40% 27% $224,840 $304,775Variance from Comparator: -13% 0% +8% - - - -7% +6%
Agenda Item 8b | Attachment 1 | Page 17 of 22

© 2019 Grant Thornton LLP | All rights reserved | U.S. member firm of Grant Thornton International Ltd
Investment Manager: Recommended Base Salary and Incentive
18
Total Cash (+ LTI for Option C)Annual Incentive Mid Base + Max Base +
Base Salary Ranges (% of Salary) LTI Tgt Bonus vs. Max Bonus vs.Min/P25 Mid/P50 Max/P75 Target Max (% of Sal) Mkt P50 Mkt P75
Current CalPERS (Range A): $140,000 $184,660 $229,320 30% 45% - $240,058 $332,514Current CalPERS (Range B): $140,000 $184,660 $229,320 40% 60% - $258,524 $366,912Current CalPERS (Range C): $140,000 $184,660 $229,320 50% 75% - $276,990 $401,310
Comparator Data: $182,000 $212,000 $244,000 - - - $426,000 $545,000
Option A Proposed Comp: $237,900 $317,200 $396,500 30% 45% - $412,360 $574,925Variance from Comparator: +31% +50% +63% - - - -3% +5%
Option C Proposed Comp: $183,000 $244,000 $305,000 40% 60% 40% $439,200 $610,000Variance from Comparator: +1% +15% +25% - - - +3% +12%
Agenda Item 8b | Attachment 1 | Page 18 of 22

© 2019 Grant Thornton LLP | All rights reserved | U.S. member firm of Grant Thornton International Ltd
Investment Director:Recommended Base Salary and Incentive
19
Total Cash (+ LTI for Option C)Annual Incentive Mid Base + Max Base +
Base Salary Ranges (% of Salary) LTI Tgt Bonus vs. Max Bonus vs.Min/P25 Mid/P50 Max/P75 Target Max (% of Sal) Mkt P50 Mkt P75
Current CalPERS (Range A): $188,000 $247,972 $307,944 40% 60% - $347,161 $492,710Current CalPERS (Range B): $188,000 $247,972 $307,944 50% 75% - $371,958 $538,902
Comparator Data: $229,000 $260,000 $321,000 - - - $639,000 $874,000
Option A Proposed Comp: $371,542 $495,389 $619,237 30% 45% - $644,006 $897,893Variance from Comparator: +62% +91% +93% - - - +1% +3%
Option C Proposed Comp: $240,750 $321,000 $401,250 50% 75% 50% $642,000 $902,813Variance from Comparator: +5% +23% +25% - - - +0% +3%
Agenda Item 8b | Attachment 1 | Page 19 of 22

© 2019 Grant Thornton LLP | All rights reserved | U.S. member firm of Grant Thornton International Ltd
Managing Investment Director: Recommended Base Salary and Incentive
20
Total Cash (+ LTI for Option C)Annual Incentive Mid Base + Max Base +
Base Salary Ranges (% of Salary) LTI Tgt Bonus vs. Max Bonus vs.Min/P25 Mid/P50 Max/P75 Target Max (% of Sal) Mkt P50 Mkt P75
Current CalPERS: $262,000 $345,032 $428,064 50% 75% - $517,548 $749,112Comparator Data: $273,000 $315,000 $412,000 - - - $1,036,000 $1,743,000
Option A Proposed Comp: $525,398 $700,531 $875,663 40% 60% - $980,743 $1,401,062Variance from Comparator: +92% +122% +113% - - - -5% -20%
Option C Proposed Comp: $309,000 $412,000 $515,000 70% 105% 70% $988,800 $1,416,250Variance from Comparator: +13% +31% +25% - - - -5% -19%
Agenda Item 8b | Attachment 1 | Page 20 of 22
© 2019 Grant Thornton LLP | All rights reserved | U.S. member firm of Grant Thornton International Ltd
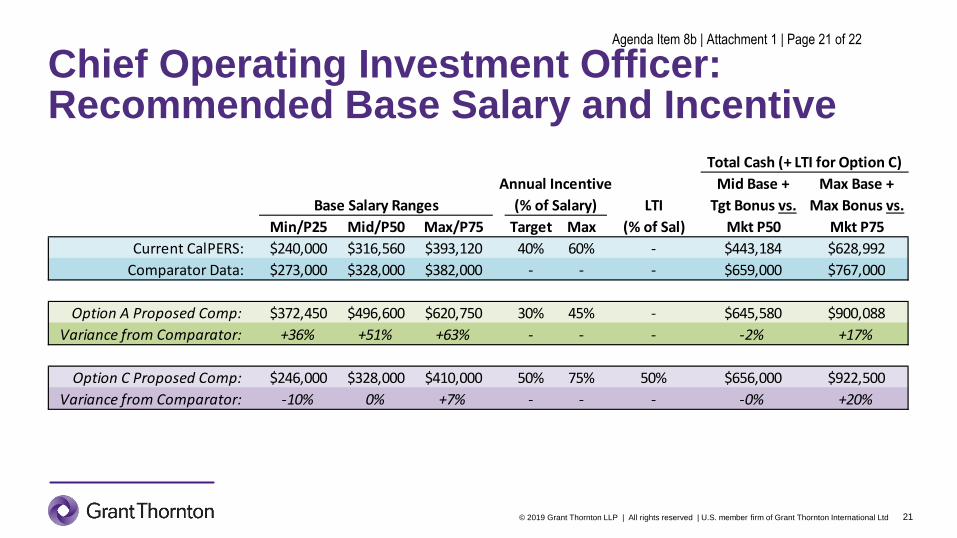
Chief Operating Investment Officer:Recommended Base Salary and Incentive
21
Total Cash (+ LTI for Option C)Annual Incentive Mid Base + Max Base +
Base Salary Ranges (% of Salary) LTI Tgt Bonus vs. Max Bonus vs.Min/P25 Mid/P50 Max/P75 Target Max (% of Sal) Mkt P50 Mkt P75
Current CalPERS: $240,000 $316,560 $393,120 40% 60% - $443,184 $628,992Comparator Data: $273,000 $328,000 $382,000 - - - $659,000 $767,000
Option A Proposed Comp: $372,450 $496,600 $620,750 30% 45% - $645,580 $900,088Variance from Comparator: +36% +51% +63% - - - -2% +17%
Option C Proposed Comp: $246,000 $328,000 $410,000 50% 75% 50% $656,000 $922,500Variance from Comparator: -10% 0% +7% - - - -0% +20%
Agenda Item 8b | Attachment 1 | Page 21 of 22

© 2019 Grant Thornton LLP | All rights reserved | U.S. member firm of Grant Thornton International Ltd 22
Agenda Item 8b | Attachment 1 | Page 22 of 22