Embed Size (px)
Citation preview

FOR INSTITUTIONAL USE ONLY |
Investment Levers in a Challenging WorldAugust 2016
0903c02a81210d7c
Rafael Silveira, Ph.D., Executive DirectorMulti-Asset Solutions212.648.2847, [email protected]
FOR INSTITUTIONAL USE ONLY | NOT FOR PUBLIC DISTRIBUTION
1 | FOR INSTITUTIONAL USE ONLY |
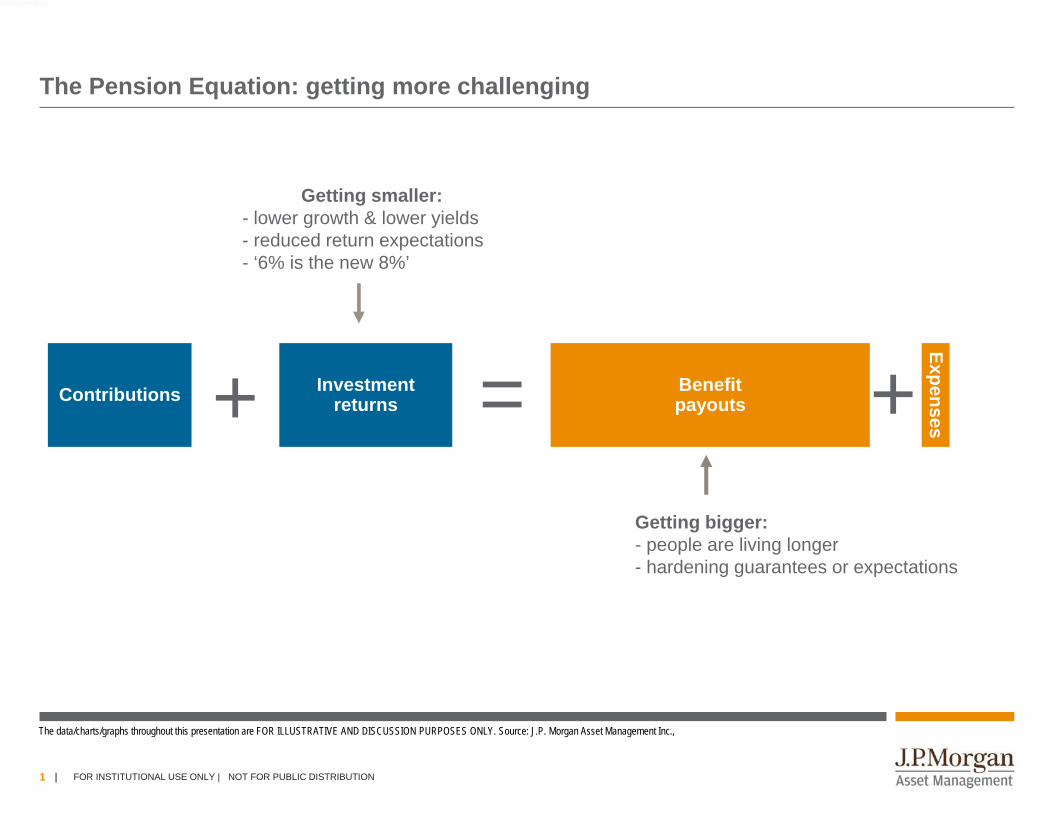
Getting smaller:- lower growth & lower yields- reduced return expectations- ‘6% is the new 8%’
The Pension Equation: getting more challenging
Getting bigger:- people are living longer- hardening guarantees or expectations
Contributions Investment returns
Benefit payouts
Expenses= ++
The data/charts/graphs throughout this presentation are FOR ILLUSTRATIVE AND DISCUSSION PURPOSES ONLY. Source: J.P. Morgan Asset Management Inc.,
4d03c02a80035a72
FOR INSTITUTIONAL USE ONLY | NOT FOR PUBLIC DISTRIBUTION
2 | FOR INSTITUTIONAL USE ONLY | NOT FOR PUBLIC DISTRIBUTION
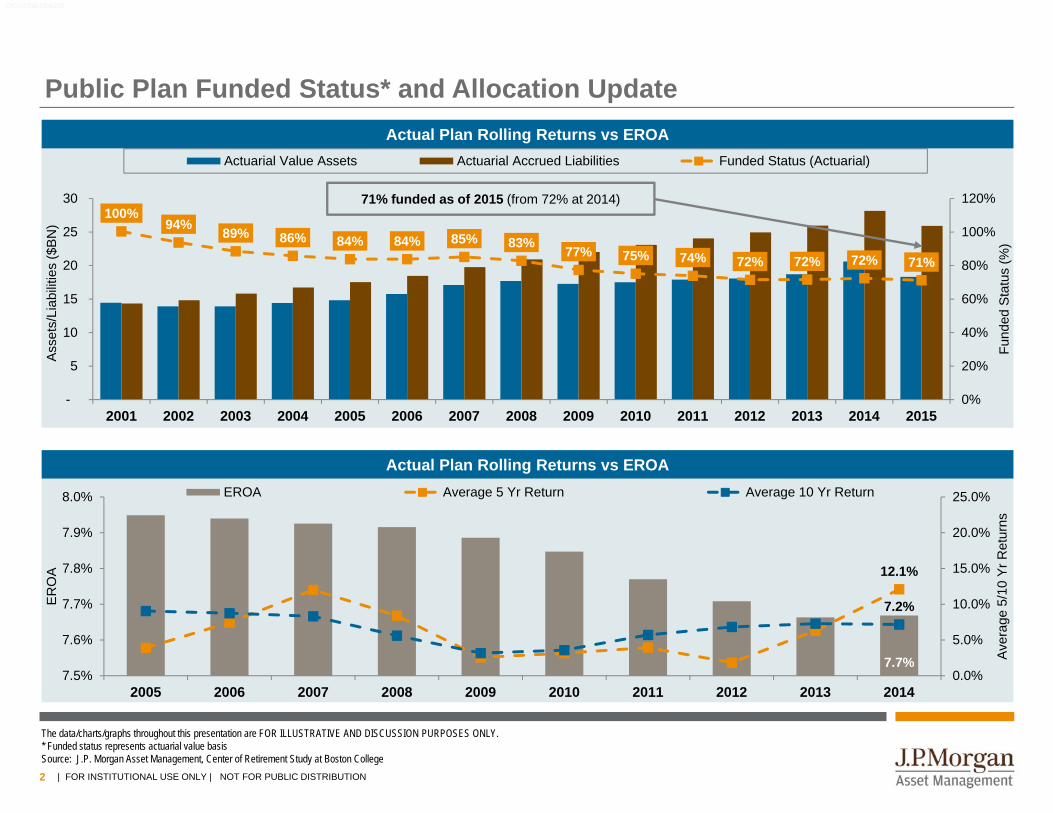
Public Plan Funded Status* and Allocation Update
The data/charts/graphs throughout this presentation are FOR ILLUSTRATIVE AND DISCUSSION PURPOSES ONLY.* Funded status represents actuarial value basisSource: J.P. Morgan Asset Management, Center of Retirement Study at Boston College
100%94% 89% 86% 84% 84% 85% 83% 77% 75% 74% 72% 72% 72% 71%
0%
20%
40%
60%
80%
100%
120%
-
5
10
15
20
25
30
2001 2002 2003 2004 2005 2006 2007 2008 2009 2010 2011 2012 2013 2014 2015
Fund
ed S
tatu
s (%
)
Ass
ets/
Liab
ilitie
s ($
BN
)
Actuarial Value Assets Actuarial Accrued Liabilities Funded Status (Actuarial)
71% funded as of 2015 (from 72% at 2014)
0903c02a815b62d3
Actual Plan Rolling Returns vs EROA
7.7%
12.1%
7.2%
0.0%
5.0%
10.0%
15.0%
20.0%
25.0%
7.5%
7.6%
7.7%
7.8%
7.9%
8.0%
2005 2006 2007 2008 2009 2010 2011 2012 2013 2014
Ave
rage
5/1
0 Y
rRet
urns
ER
OA
EROA Average 5 Yr Return Average 10 Yr Return
Actual Plan Rolling Returns vs EROA
FOR INSTITUTIONAL USE ONLY | NOT FOR PUBLIC DISTRIBUTION| FOR INSTITUTIONAL USE ONLY | NOT FOR PUBLIC DISTRIBUTION
3 | FOR INSTITUTIONAL USE ONLY |
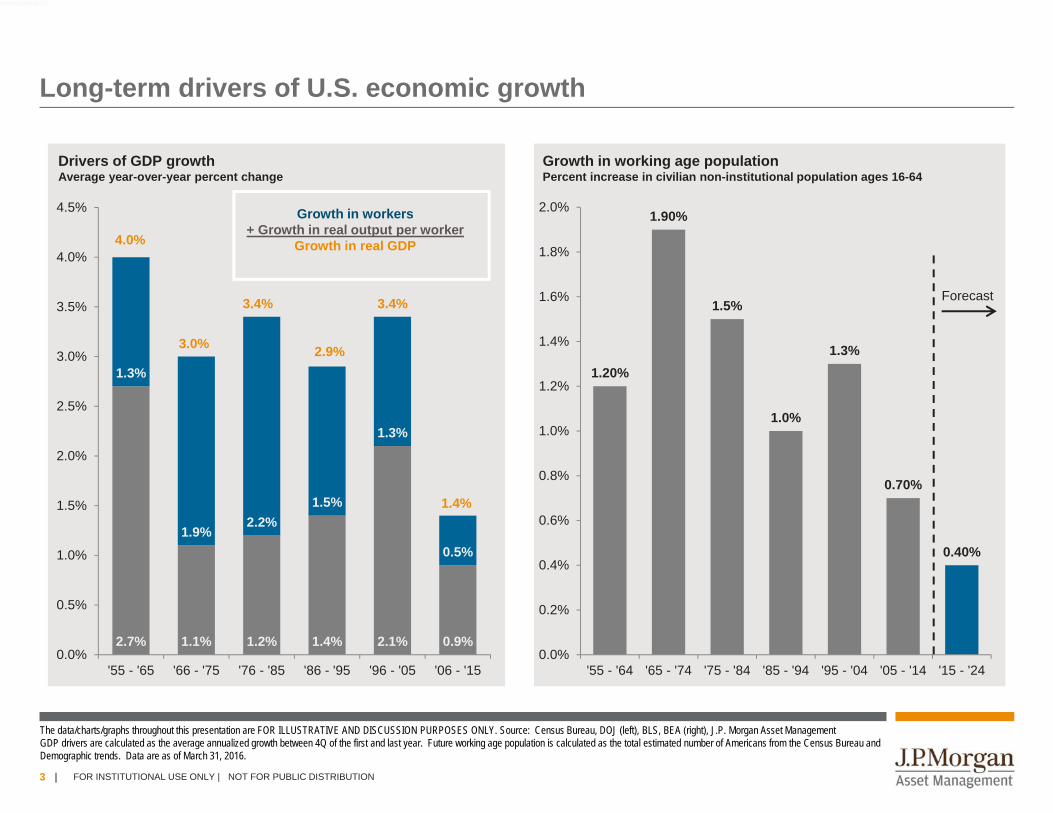
Long-term drivers of U.S. economic growth
The data/charts/graphs throughout this presentation are FOR ILLUSTRATIVE AND DISCUSSION PURPOSES ONLY. Source: Census Bureau, DOJ (left), BLS, BEA (right), J.P. Morgan Asset ManagementGDP drivers are calculated as the average annualized growth between 4Q of the first and last year. Future working age population is calculated as the total estimated number of Americans from the Census Bureau andDemographic trends. Data are as of March 31, 2016.
2.7% 1.1% 1.2% 1.4% 2.1% 0.9%
1.3%
1.9%2.2%
1.5%
1.3%
0.5%
0.0%
0.5%
1.0%
1.5%
2.0%
2.5%
3.0%
3.5%
4.0%
4.5%
'55 - '65 '66 - '75 '76 - '85 '86 - '95 '96 - '05 '06 - '15
2.9%
4.0%
3.0%
3.4% 3.4%
1.4%
Drivers of GDP growthAverage year-over-year percent change
Growth in workers+ Growth in real output per worker
Growth in real GDP
1.20%
1.90%
1.5%
1.0%
1.3%
0.70%
0.40%
0.0%
0.2%
0.4%
0.6%
0.8%
1.0%
1.2%
1.4%
1.6%
1.8%
2.0%
'55 - '64 '65 - '74 '75 - '84 '85 - '94 '95 - '04 '05 - '14 '15 - '24
Growth in working age populationPercent increase in civilian non-institutional population ages 16-64
Forecast
4d03c02a80035a72
FOR INSTITUTIONAL USE ONLY | NOT FOR PUBLIC DISTRIBUTION
4 | FOR INSTITUTIONAL USE ONLY | NOT FOR PUBLIC DISTRIBUTION
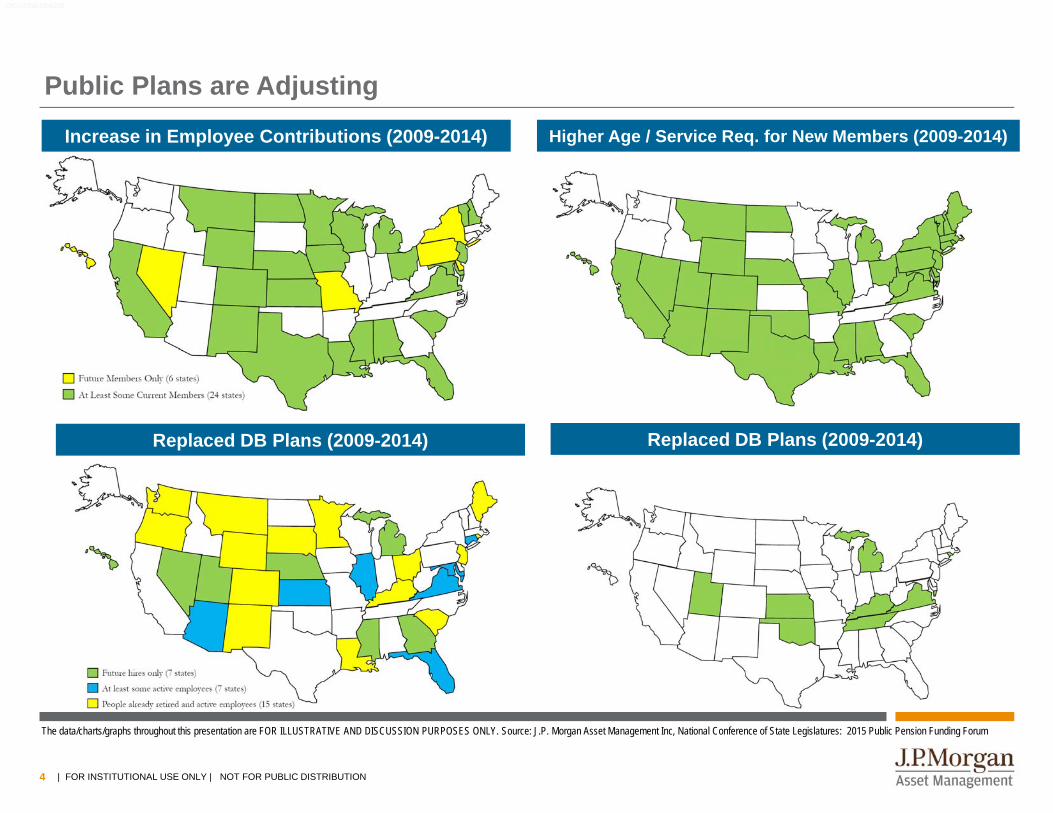
Public Plans are Adjusting
The data/charts/graphs throughout this presentation are FOR ILLUSTRATIVE AND DISCUSSION PURPOSES ONLY. Source: J.P. Morgan Asset Management Inc, National Conference of State Legislatures: 2015 Public Pension Funding Forum
0903c02a815b62d3
Increase in Employee Contributions (2009-2014) Higher Age / Service Req. for New Members (2009-2014)
Replaced DB Plans (2009-2014)Replaced DB Plans (2009-2014)
| FOR INSTITUTIONAL USE ONLY | NOT FOR PUBLIC DISTRIBUTION
5 | FOR INSTITUTIONAL USE ONLY | NOT FOR PUBLIC DISTRIBUTION
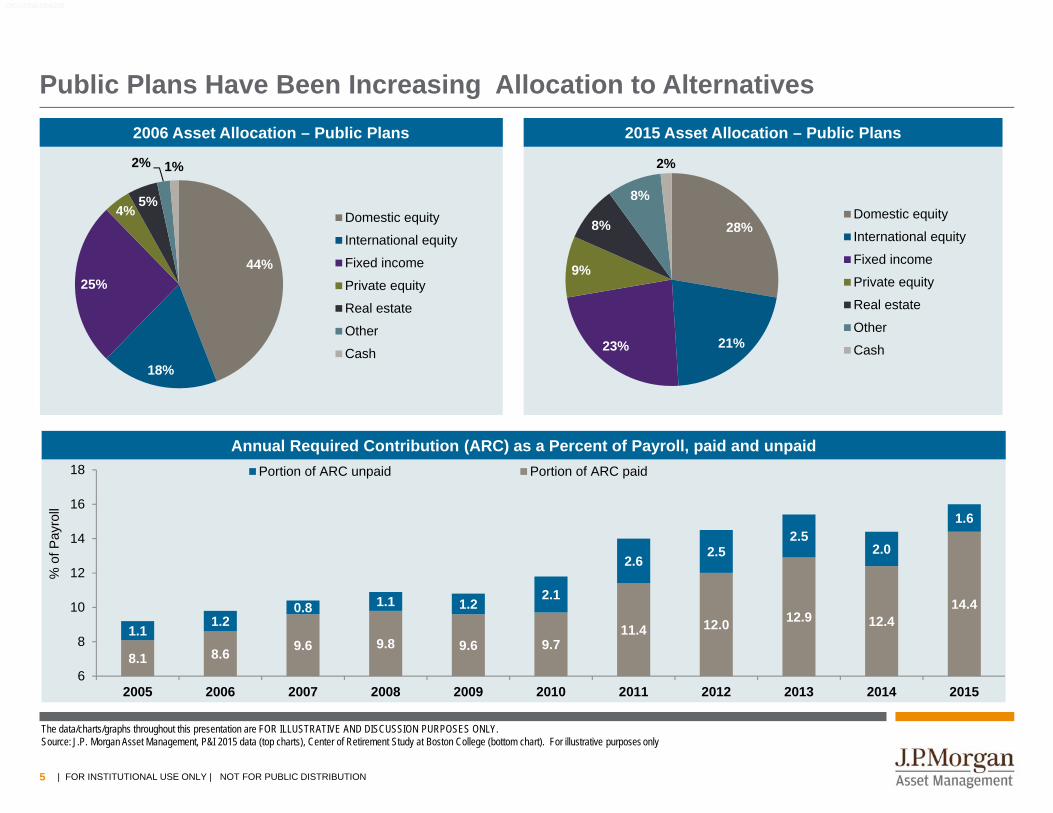
Public Plans Have Been Increasing Allocation to Alternatives
The data/charts/graphs throughout this presentation are FOR ILLUSTRATIVE AND DISCUSSION PURPOSES ONLY. Source: J.P. Morgan Asset Management, P&I 2015 data (top charts), Center of Retirement Study at Boston College (bottom chart). For illustrative purposes only
2006 Asset Allocation – Public Plans 2015 Asset Allocation – Public Plans
44%
18%
25%
4%5%
2% 1%
Domestic equity
International equity
Fixed income
Private equity
Real estate
Other
Cash
28%
21%23%
9%
8%
8%
2%
Domestic equity
International equity
Fixed income
Private equity
Real estate
Other
Cash
0903c02a815b62d3
Annual Required Contribution (ARC) as a Percent of Payroll, paid and unpaid
8.1 8.6 9.6 9.8 9.6 9.711.4 12.0 12.9 12.4
14.4
1.11.2
0.8 1.1 1.22.1
2.62.5
2.52.0
1.6
6
8
10
12
14
16
18
2005 2006 2007 2008 2009 2010 2011 2012 2013 2014 2015
% o
f Pay
roll
Portion of ARC unpaid Portion of ARC paid
| FOR INSTITUTIONAL USE ONLY | NOT FOR PUBLIC DISTRIBUTION
6 | FOR INSTITUTIONAL USE ONLY |
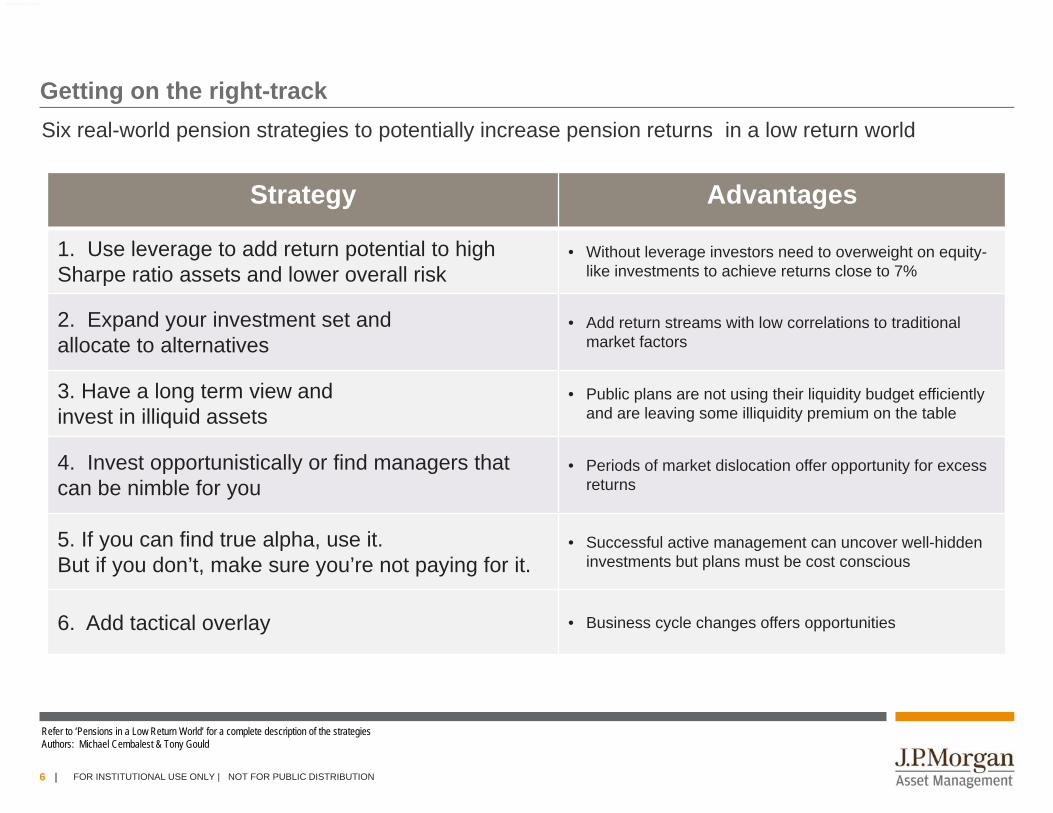
Getting on the right-track
Strategy Advantages
1. Use leverage to add return potential to high Sharpe ratio assets and lower overall risk
• Without leverage investors need to overweight on equity-like investments to achieve returns close to 7%
2. Expand your investment set andallocate to alternatives
• Add return streams with low correlations to traditional market factors
3. Have a long term view and invest in illiquid assets
• Public plans are not using their liquidity budget efficiently and are leaving some illiquidity premium on the table
4. Invest opportunistically or find managers that can be nimble for you
• Periods of market dislocation offer opportunity for excess returns
5. If you can find true alpha, use it. But if you don’t, make sure you’re not paying for it.
• Successful active management can uncover well-hidden investments but plans must be cost conscious
6. Add tactical overlay • Business cycle changes offers opportunities
Six real-world pension strategies to potentially increase pension returns in a low return world
Refer to ‘Pensions in a Low Return World’ for a complete description of the strategiesAuthors: Michael Cembalest & Tony Gould
FOR INSTITUTIONAL USE ONLY | NOT FOR PUBLIC DISTRIBUTION
0903c02a8161e090
7 | FOR INSTITUTIONAL USE ONLY |
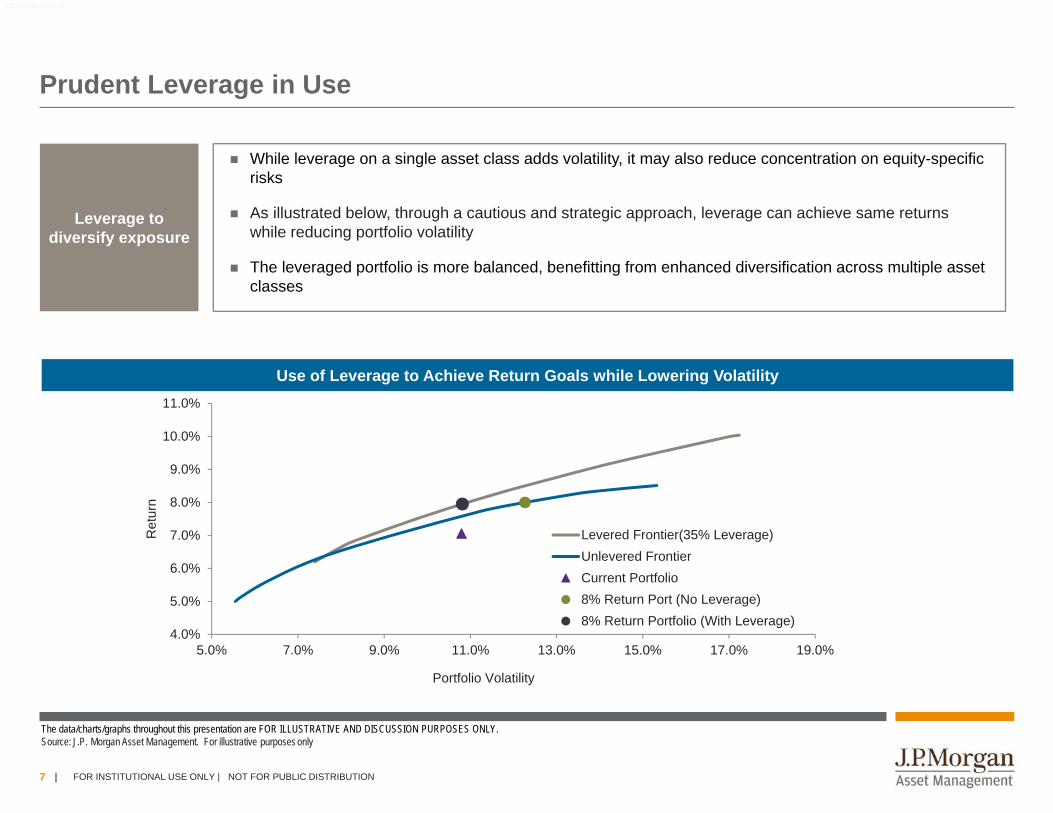
Prudent Leverage in Use
The data/charts/graphs throughout this presentation are FOR ILLUSTRATIVE AND DISCUSSION PURPOSES ONLY. Source: J.P. Morgan Asset Management. For illustrative purposes only
0903c02a815b62d3
Leverage to diversify exposure
While leverage on a single asset class adds volatility, it may also reduce concentration on equity-specific risks
As illustrated below, through a cautious and strategic approach, leverage can achieve same returns while reducing portfolio volatility
The leveraged portfolio is more balanced, benefitting from enhanced diversification across multiple asset classes
4.0%
5.0%
6.0%
7.0%
8.0%
9.0%
10.0%
11.0%
5.0% 7.0% 9.0% 11.0% 13.0% 15.0% 17.0% 19.0%
Ret
urn
Portfolio Volatility
Levered Frontier(35% Leverage)Unlevered FrontierCurrent Portfolio8% Return Port (No Leverage)8% Return Portfolio (With Leverage)
Use of Leverage to Achieve Return Goals while Lowering Volatility
FOR INSTITUTIONAL USE ONLY | NOT FOR PUBLIC DISTRIBUTION
8 | FOR INSTITUTIONAL USE ONLY |
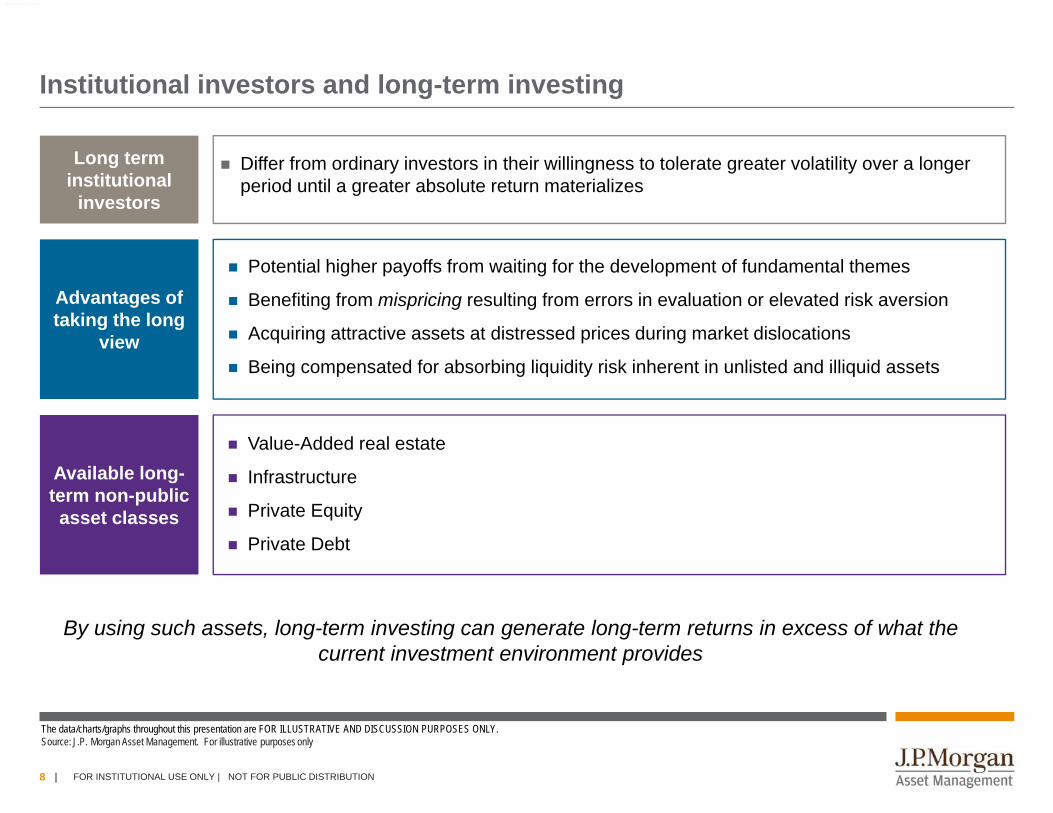
Institutional investors and long-term investing
Long term institutional
investors
Advantages of taking the long
view
Differ from ordinary investors in their willingness to tolerate greater volatility over a longer period until a greater absolute return materializes
Potential higher payoffs from waiting for the development of fundamental themes
Benefiting from mispricing resulting from errors in evaluation or elevated risk aversion
Acquiring attractive assets at distressed prices during market dislocations
Being compensated for absorbing liquidity risk inherent in unlisted and illiquid assets
Available long-term non-public asset classes
Value-Added real estate
Infrastructure
Private Equity
Private Debt
By using such assets, long-term investing can generate long-term returns in excess of what the current investment environment provides
FOR INSTITUTIONAL USE ONLY | NOT FOR PUBLIC DISTRIBUTION
The data/charts/graphs throughout this presentation are FOR ILLUSTRATIVE AND DISCUSSION PURPOSES ONLY. Source: J.P. Morgan Asset Management. For illustrative purposes only
0903c02a8161e090
9 | FOR INSTITUTIONAL USE ONLY |
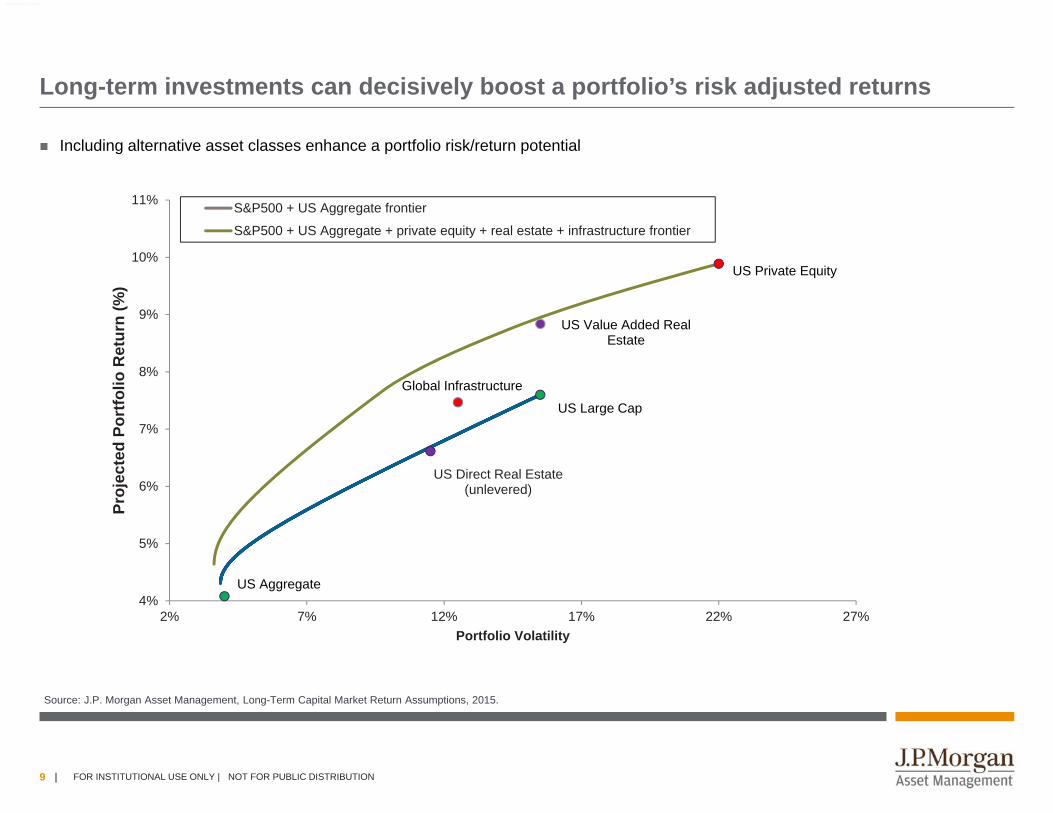
Long-term investments can decisively boost a portfolio’s risk adjusted returns
Including alternative asset classes enhance a portfolio risk/return potential
Source: J.P. Morgan Asset Management, Long-Term Capital Market Return Assumptions, 2015.
US Value Added Real Estate
US Large Cap
US Aggregate
US Direct Real Estate (unlevered)
US Private Equity
Global Infrastructure
4%
5%
6%
7%
8%
9%
10%
11%
2% 7% 12% 17% 22% 27%
Proj
ecte
d Po
rtfo
lio R
etur
n (%
)
Portfolio Volatility
S&P500 + US Aggregate frontier
S&P500 + US Aggregate + private equity + real estate + infrastructure frontier
FOR INSTITUTIONAL USE ONLY | NOT FOR PUBLIC DISTRIBUTION
0903c02a8161e090
10 | FOR INSTITUTIONAL USE ONLY |
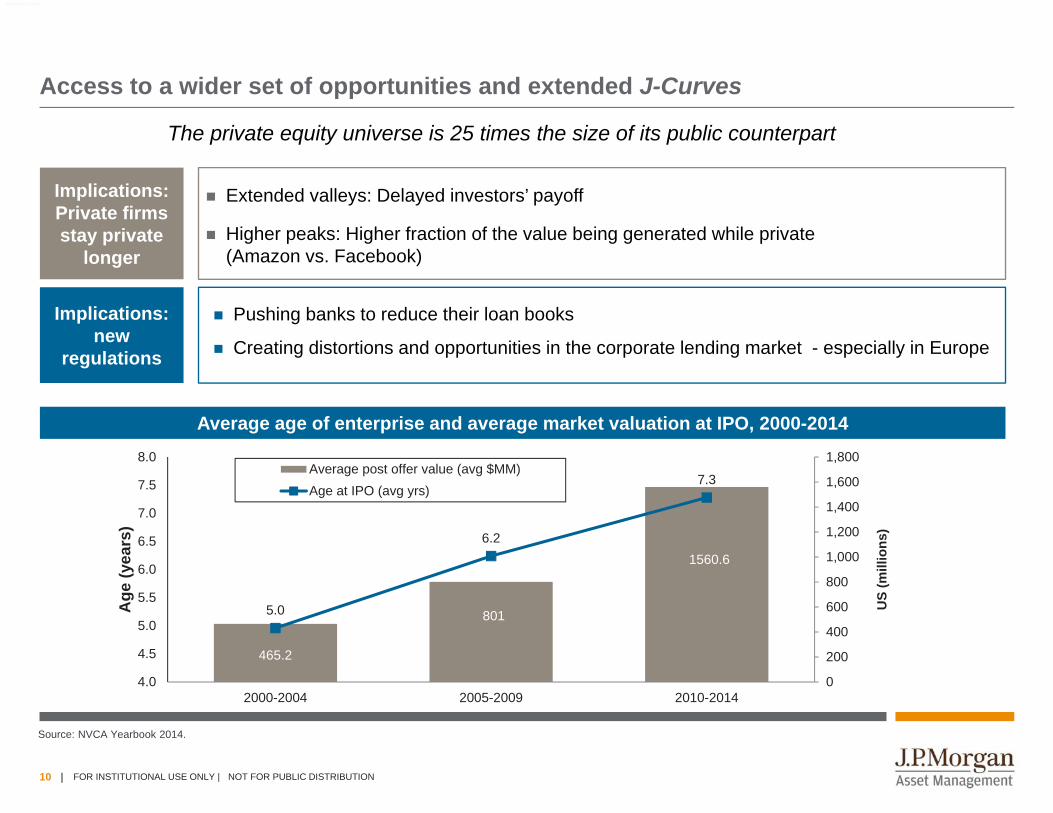
Access to a wider set of opportunities and extended J-Curves
Average age of enterprise and average market valuation at IPO, 2000-2014
Source: NVCA Yearbook 2014.
465.2
801
1560.6
5.0
6.2
7.3
0
200
400
600
800
1,000
1,200
1,400
1,600
1,800
4.0
4.5
5.0
5.5
6.0
6.5
7.0
7.5
8.0
2000-2004 2005-2009 2010-2014
US
(mill
ions
)
Age
(yea
rs)
Average post offer value (avg $MM)Age at IPO (avg yrs)
Implications: Private firms stay private
longer
Implications: new
regulations
Extended valleys: Delayed investors’ payoff
Higher peaks: Higher fraction of the value being generated while private (Amazon vs. Facebook)
Pushing banks to reduce their loan books
Creating distortions and opportunities in the corporate lending market - especially in Europe
The private equity universe is 25 times the size of its public counterpart
FOR INSTITUTIONAL USE ONLY | NOT FOR PUBLIC DISTRIBUTION
0903c02a8161e090
11 | FOR INSTITUTIONAL USE ONLY | NOT FOR PUBLIC DISTRIBUTION
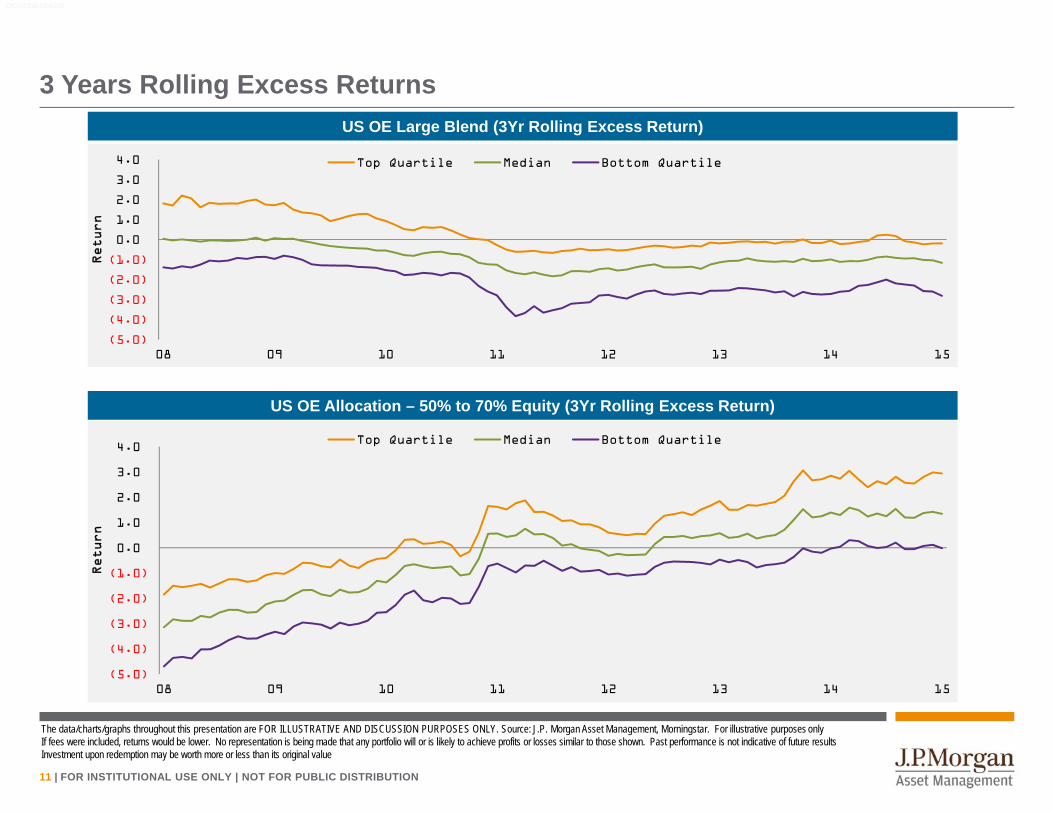
3 Years Rolling Excess Returns
The data/charts/graphs throughout this presentation are FOR ILLUSTRATIVE AND DISCUSSION PURPOSES ONLY. Source: J.P. Morgan Asset Management, Morningstar. For illustrative purposes onlyIf fees were included, returns would be lower. No representation is being made that any portfolio will or is likely to achieve profits or losses similar to those shown. Past performance is not indicative of future resultsInvestment upon redemption may be worth more or less than its original value
0903c02a815b62d3
US OE Large Blend (3Yr Rolling Excess Return)
(5.0)
(4.0)
(3.0)
(2.0)
(1.0)
0.0
1.0
2.0
3.0
4.0
08 09 10 11 12 13 14 15
Return
Top Quartile Median Bottom Quartile
(5.0)
(4.0)
(3.0)
(2.0)
(1.0)
0.0
1.0
2.0
3.0
4.0
08 09 10 11 12 13 14 15
Return
Top Quartile Median Bottom Quartile
US OE Allocation – 50% to 70% Equity (3Yr Rolling Excess Return)

12 | FOR INSTITUTIONAL USE ONLY |
Appendix Supplemental Information
0903c02a81210d7c
FOR INSTITUTIONAL USE ONLY | NOT FOR PUBLIC DISTRIBUTION
13 | FOR INSTITUTIONAL USE ONLY |
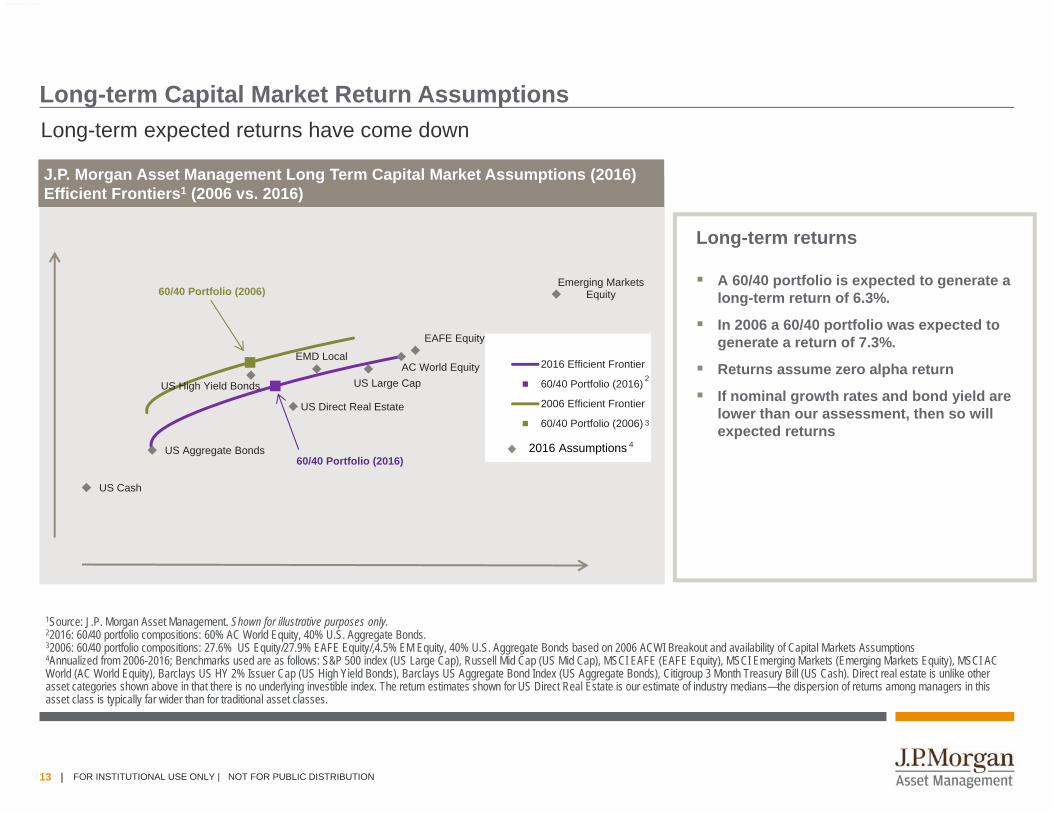
Long-term Capital Market Return Assumptions
1Source: J.P. Morgan Asset Management. Shown for illustrative purposes only.22016: 60/40 portfolio compositions: 60% AC World Equity, 40% U.S. Aggregate Bonds.32006: 60/40 portfolio compositions: 27.6% US Equity/27.9% EAFE Equity/,4.5% EM Equity, 40% U.S. Aggregate Bonds based on 2006 ACWI Breakout and availability of Capital Markets Assumptions4Annualized from 2006-2016; Benchmarks used are as follows: S&P 500 index (US Large Cap), Russell Mid Cap (US Mid Cap), MSCI EAFE (EAFE Equity), MSCI Emerging Markets (Emerging Markets Equity), MSCI AC World (AC World Equity), Barclays US HY 2% Issuer Cap (US High Yield Bonds), Barclays US Aggregate Bond Index (US Aggregate Bonds), Citigroup 3 Month Treasury Bill (US Cash). Direct real estate is unlike other asset categories shown above in that there is no underlying investible index. The return estimates shown for US Direct Real Estate is our estimate of industry medians—the dispersion of returns among managers in this asset class is typically far wider than for traditional asset classes.
J.P. Morgan Asset Management Long Term Capital Market Assumptions (2016) Efficient Frontiers1 (2006 vs. 2016)J.P. Morgan Asset Management Long Term Capital Market Assumptions (2016) Efficient Frontiers1 (2006 vs. 2016)
Long-term returns
A 60/40 portfolio is expected to generate a long-term return of 6.3%.
In 2006 a 60/40 portfolio was expected to generate a return of 7.3%.
Returns assume zero alpha return
If nominal growth rates and bond yield are lower than our assessment, then so will expected returns
US Aggregate Bonds
US Cash
US High Yield Bonds
US Direct Real Estate
EMD Local
EAFE Equity
AC World Equity
Emerging Markets Equity
60/40 Portfolio (2016)
US Large Cap
60/40 Portfolio (2006)
2016 Efficient Frontier
60/40 Portfolio (2016)
2006 Efficient Frontier
60/40 Portfolio (2006)
2016 Assumptions 4
3
2
Long-term expected returns have come down
FOR INSTITUTIONAL USE ONLY | NOT FOR PUBLIC DISTRIBUTION
0903c02a8161e090
14 | FOR INSTITUTIONAL USE ONLY |
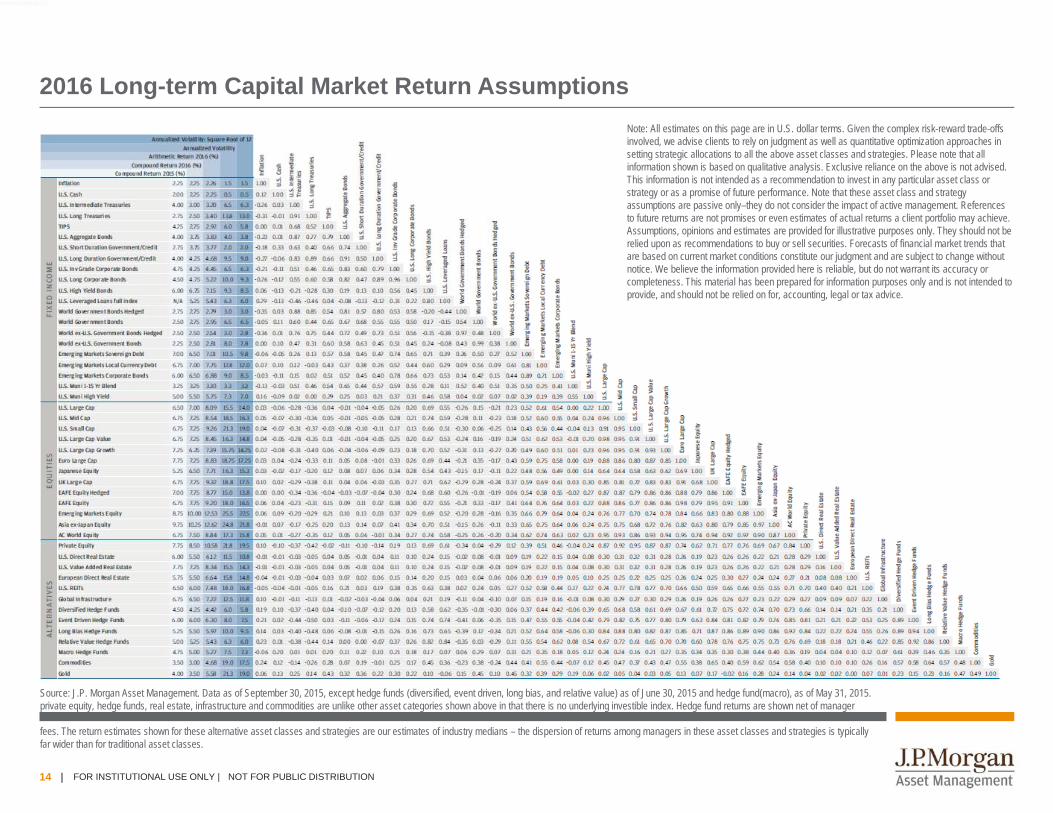
2016 Long-term Capital Market Return AssumptionsNote: All estimates on this page are in U.S. dollar terms. Given the complex risk-reward trade-offs involved, we advise clients to rely on judgment as well as quantitative optimization approaches in setting strategic allocations to all the above asset classes and strategies. Please note that all information shown is based on qualitative analysis. Exclusive reliance on the above is not advised. This information is not intended as a recommendation to invest in any particular asset class or strategy or as a promise of future performance. Note that these asset class and strategy assumptions are passive only–they do not consider the impact of active management. References to future returns are not promises or even estimates of actual returns a client portfolio may achieve. Assumptions, opinions and estimates are provided for illustrative purposes only. They should not be relied upon as recommendations to buy or sell securities. Forecasts of financial market trends that are based on current market conditions constitute our judgment and are subject to change without notice. We believe the information provided here is reliable, but do not warrant its accuracy or completeness. This material has been prepared for information purposes only and is not intended to provide, and should not be relied on for, accounting, legal or tax advice.
Source: J.P. Morgan Asset Management. Data as of September 30, 2015, except hedge funds (diversified, event driven, long bias, and relative value) as of June 30, 2015 and hedge fund(macro), as of May 31, 2015. private equity, hedge funds, real estate, infrastructure and commodities are unlike other asset categories shown above in that there is no underlying investible index. Hedge fund returns are shown net of manager
fees. The return estimates shown for these alternative asset classes and strategies are our estimates of industry medians – the dispersion of returns among managers in these asset classes and strategies is typically far wider than for traditional asset classes.
4d03c02a80035a72
FOR INSTITUTIONAL USE ONLY | NOT FOR PUBLIC DISTRIBUTION

15 | FOR INSTITUTIONAL USE ONLY |
71J.P. Morgan Asset Management - Risks and DisclosuresNOT FOR RETAIL DISTRIBUTION: This communication has been prepared exclusively for Institutional/Wholesale Investors as well as Professional Clients as defined by local laws and regulation.This is a promotional document and is intended to report solely on investment strategies and opportunities identified by J.P.Morgan Asset Management and as such the views contained herein are not to be taken as an advice or recommendation to buy or sell any investment or interest thereto. This document is confidential and intended only for the person or entity to which it has been provided. Reliance upon information in this material is at the sole discretion of the reader. The material was prepared without regard to specific objectives, financial situation or needs of any particular receiver. Any research in this document has been obtained and may have been acted upon by J.P. Morgan Asset Management for its own purpose. The results of such research are being made available as additional information and do not necessarily reflect the views of J.P.Morgan Asset Management.
Any forecasts, figures, opinions, statements of financial market trends or investment techniques and strategies expressed are those of JPMorgan Asset Management, unless otherwise stated, as of the date of issuance. They are considered to be reliable at the time of writing, but no warranty as to the accuracy, and reliability or completeness in respect of any error or omission is accepted. They may be subject to change without reference or notification to you.
Any investment decision should be based solely on the basis of any applicable local offering documents such as the Prospectus, annual report, semi-annual report, private placement or offering memorandum. For further information, any questions and for copies of the offering material you can contact your usual J.P. Morgan Asset Management representative. Both past performance and yield may not be a reliable guide to future performance. There is no guarantee that any forecast will come to past.
Any reproduction, retransmission, dissemination or other unauthorised use of this document or the information contained herein by any person or entity without the express prior written consent of J.P. Morgan Asset Management is strictly prohibited.
J.P.Morgan Asset Management and/or any of its affiliates and employees may hold positions or act as a market maker in the financial instruments of any issuer discussed herein or act as the underwriter, placement agent or lender to such issuer. The investments and strategies discussed herein may not be suitable for all investors and may not be authorized or its offering may be restricted in your jurisdiction, it is the responsibility of every reader to satisfy himself as to the full observance of the laws and regulations of the relevant jurisdictions. Prior to any application investors are advised to take all necessary legal, regulatory and tax advice on the consequences of an investment in the product(s).
4d03c02a80035a72
FOR INSTITUTIONAL USE ONLY | NOT FOR PUBLIC DISTRIBUTION

16 | FOR INSTITUTIONAL USE ONLY |
J.P. Morgan Asset Management - Risks and DisclosuresJPMAM Long Term Capital Market Assumptions: Given the complex risk-reward trade-offs involved, we advise clients to rely on judgment as well as quantitative optimization approaches in setting strategic allocations. Please note that all information shown is based on qualitative analysis. Exclusive reliance on the above is not advised. This information is not intended as a recommendation to invest in any particular asset class or strategy or as a promise of future performance. Note that these asset class and strategy assumptions are passive only–they do not consider the impact of active management. References to future returns are not promises or even estimates of actual returns a client portfolio may achieve. Assumptions, opinions and estimates are provided for illustrative purposes only. They should not be relied upon as recommendations to buy or sell securities. Forecasts of financial market trends that are based on current market conditions constitute our judgment and are subject to change without notice. We believe the information provided here is reliable, but do not warrant its accuracy or completeness. This material has been prepared for information purposes only and is not intended to provide, and should not be relied on for, accounting, legal or tax advice. The outputs of the assumptions are provided for illustration/discussion purposes only and are subject to significant limitations. “Expected” or “Alpha” return estimates are subject to uncertainty and error. For example changes in the historical data from which it is estimated will result in different implications for asset class returns. Expected returns for each asset class conditional on an economic scenario; actual returns in the event the scenario comes to pass could be higher or lower, as they have been in the past, so an investor should not expect to achieve returns similar to the outputs shown herein. References to future returns for either asset allocation strategies or asset classes are not promises of actual returns a client portfolio may achieve. Because of the inherent limitations of all models, potential investors should not rely exclusively on the model when making a decision. The model cannot account for the impact that economic, market, and other factors may have on the implementation and ongoing management of an actual investment portfolio. Unlike actual portfolio outcomes, the model outcomes do not reflect actual trading, liquidity constraints, fees, expenses, taxes and other factors that could impact the future returns. The model assumptions are passive only—they do not consider the impact of active management. A manager’s ability to achieve similar outcomes is subject to risk factors over which the manager may have no or limited control.
Securities products, if presented in the U.S., are offered by J.P. Morgan Institutional Investments, Inc., member FINRA/SIPC.
J.P. Morgan Asset Management is the brand for the asset management business of JPMorgan Chase & Co. and its affiliates worldwide. This communication is issued by the following entities: in the United Kingdom by JPMorgan Asset Management (UK) Limited, which is authorized and regulated by the Financial Conduct Authority(FCA); in other EU jurisdictions by JPMorgan Asset Management (Europe) S.à r.l.; in Switzerland by J.P. Morgan (Suisse) SA, which is regulated by the Swiss Financial Market Supervisory Authority FINMA; in Hong Kong by JF Asset Management Limited, or JPMorgan Funds (Asia) Limited, or JPMorgan Asset Management Real Assets (Asia) Limited; in Singapore by JPMorgan Asset Management (Singapore) Limited or JPMorgan Asset Management Real Assets (Singapore) Pte Ltd; Australia by JPMorgan Asset Management (Australia) Limited; in Taiwan by JPMorgan Asset Management (Taiwan) Limited; in Brazil by Banco J.P. Morgan S.A., which is regulated by The Brazilian Securities and Exchange Commission (CVM) and Brazilian Central Bank (Bacen); and in Canada by JPMorgan Asset Management (Canada) Inc., which is a registered Portfolio Manager and Exempt Market Dealer in all Canadian provinces and territories except the Yukon and is also registered as an Investment Fund Manager in British Columbia, Ontario, Quebec and Newfoundland and Labrador. This communication is issued in the United States by J.P. Morgan Investment Management Inc., which is regulated by the Securities and Exchange Commission.
Copyright 2016 JPMorgan Chase & Co. All rights reserved.
FOR INSTITUTIONAL USE ONLY | NOT FOR PUBLIC DISTRIBUTION
4d03c02a80035a72