Embed Size (px)
Citation preview
Investment-Led Growth in China: Global Spillovers
Ashvin Ahuja and Malhar Nabar
WP/12/267
© 2012 International Monetary Fund WP/12/267
IMF Working Paper
Asia and Pacific Department
Investment-Led Growth in China: Global Spillovers
Prepared by Ashvin Ahuja and Malhar Nabar1
Authorized for distribution by Steve Barnett
November 2012
Abstract
Over the past decade, China’s growth model has become more reliant on investment and its footprint in global imports has widened substantially. Several economies within China’s supply chain are increasingly exposed to its investment-led growth and face growing risks from a deceleration in investment in China. This note quantifies potential global spillovers from an investment slowdown in China. It finds that a one percentage point slowdown in investment in China is associated with a reduction of global growth of just under one-tenth of a percentage point. The impact is about five times larger than in 2002. Regional supply chain economies and commodity exporters with relatively less diversified economies are most vulnerable to an investment slowdown in China. The spillover effects also register strongly across a range of macroeconomic, trade, and financial variables among G20 trading partners.
JEL Classification Numbers: E22, F62, O57
Keywords: China, Investment, Spillovers
Authors’ E-Mail Addresses: [email protected], [email protected]
1 The authors thank Steve Barnett, Mitali Das, Il Houng Lee, Andre Meier, Alla Myrvoda, Papa N’Diaye, members of the IMF’s interdepartmental task force on spillovers, and seminar participants at the People’s Bank of China and National Development and Reform Commission, Beijing for their helpful comments.
This Working Paper should not be reported as representing the views of the IMF. The views expressed in this Working Paper are those of the author(s) and do not necessarily represent those of the IMF or IMF policy. Working Papers describe research in progress by the author(s) and are published to elicit comments and to further debate.
2
Contents Page
I. A Growth Model Increasingly Dependent on Investment ......................................................3 II. Assessing Exposures to Investment-Led Growth in China ...................................................4 III. Effects of An Investment Slowdown in China .....................................................................6 IV. Implications of a Hand-off to Consumption ........................................................................7 V. Effects of an Investment Slowdown on G20 Macro Indicators ............................................8 VI. Summary ............................................................................................................................12 References……………………………………………………………………………………12 Appendix A…………………………………………………………………………………..13 Appendix B……………………………………...…………………………………………...18
3
0
10
20
30
40
0
20
40
60
80 Electric Machinery, Electronics, Computers, Communication
Equipment: Universal, Special Purpose, Transport
Textiles
TertiarySecondary
FAI by Sector
(left axis) (right axis)
2004 2006 2008 2011 2004 2006 2008 2011
Share of Manufacturing FAIShare of Total FAI
Sources: CEIC; and IMF staff calculations.
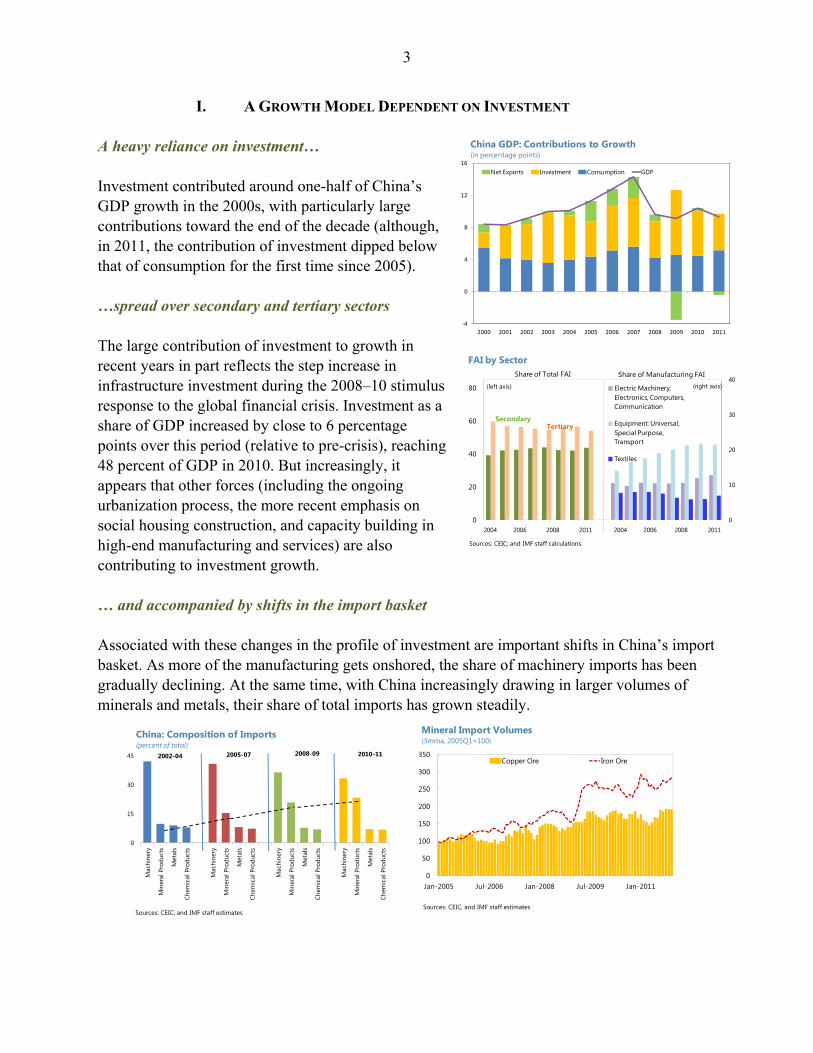
I. A GROWTH MODEL DEPENDENT ON INVESTMENT A heavy reliance on investment… Investment contributed around one-half of China’s GDP growth in the 2000s, with particularly large contributions toward the end of the decade (although, in 2011, the contribution of investment dipped below that of consumption for the first time since 2005). …spread over secondary and tertiary sectors The large contribution of investment to growth in recent years in part reflects the step increase in infrastructure investment during the 2008–10 stimulus response to the global financial crisis. Investment as a share of GDP increased by close to 6 percentage points over this period (relative to pre-crisis), reaching 48 percent of GDP in 2010. But increasingly, it appears that other forces (including the ongoing urbanization process, the more recent emphasis on social housing construction, and capacity building in high-end manufacturing and services) are also contributing to investment growth. … and accompanied by shifts in the import basket Associated with these changes in the profile of investment are important shifts in China’s import basket. As more of the manufacturing gets onshored, the share of machinery imports has been gradually declining. At the same time, with China increasingly drawing in larger volumes of minerals and metals, their share of total imports has grown steadily.
0
15
30
45
Mac
hine
ry
Min
eral
Pro
duct
s
Met
als
Chem
ical
Pro
duct
s
Mac
hine
ry
Min
eral
Pro
duct
s
Met
als
Chem
ical
Pro
duct
s
Mac
hine
ry
Min
eral
Pro
duct
s
Met
als
Chem
ical
Pro
duct
s
Mac
hine
ry
Min
eral
Pro
duct
s
Met
als
Chem
ical
Pro
duct
s
2002-04 2005-07 2008-09 2010-11
China: Composition of Imports(percent of total)
Sources: CEIC; and IMF staff estimates
0
50
100
150
200
250
300
350
Jan-2005 Jul-2006 Jan-2008 Jul-2009 Jan-2011
Copper Ore Iron Ore
Mineral Import Volumes(3mma, 2005Q1=100)
Sources: CEIC; and IMF staff estimates
‐4
0
4
8
12
16
2000 2001 2002 2003 2004 2005 2006 2007 2008 2009 2010 2011
Net Exports Investment Consumption GDP
China GDP: Contributions to Growth(in percentage points)
4
United States
GermanyJapan
Australia
South Africa
Brazil
Chile
Peru
Iran
Saudi Arabia
Taiwan Province of China
Korea
Malaysia
Philippines
Thailand
Zambia
Kazakhstan
0
5
10
15
20
0 1 2 3 4 5
Exports to China, 2001 and 2011(in percent of national GDP)
2001
2011
Exposure greaterin 2011 than in 2001
Sources: DOTS; and IMF staff estiamtes
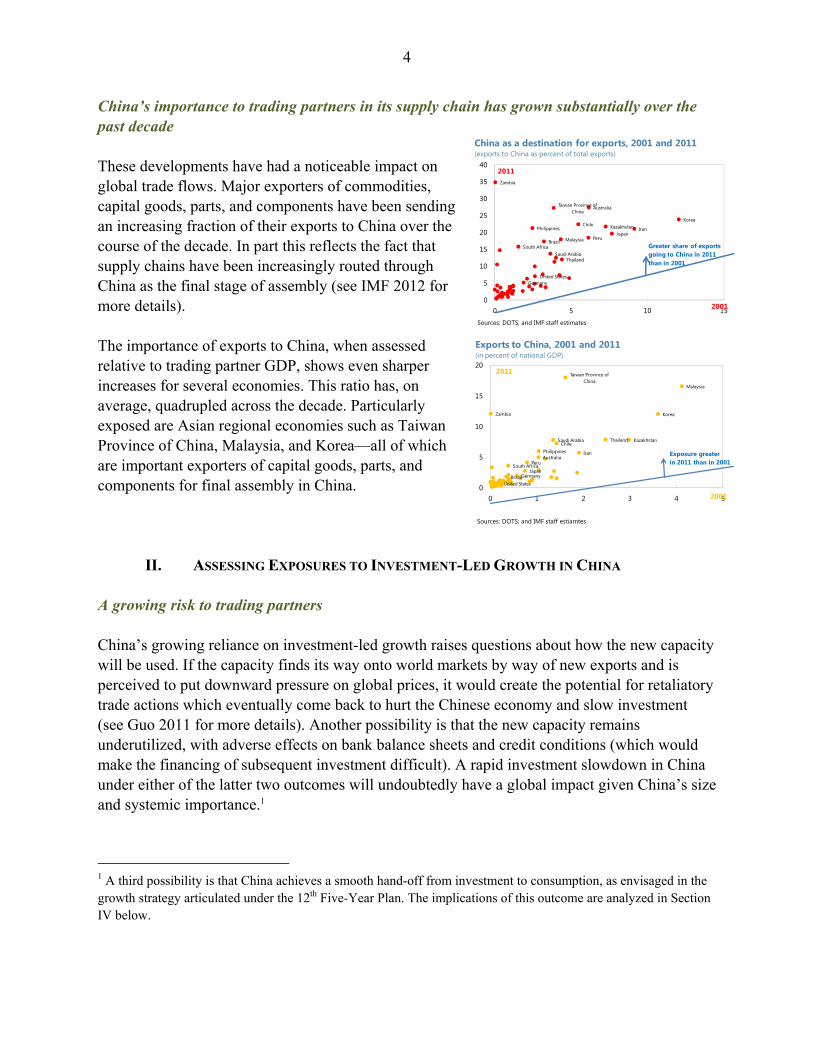
China’s importance to trading partners in its supply chain has grown substantially over the past decade These developments have had a noticeable impact on global trade flows. Major exporters of commodities, capital goods, parts, and components have been sending an increasing fraction of their exports to China over the course of the decade. In part this reflects the fact that supply chains have been increasingly routed through China as the final stage of assembly (see IMF 2012 for more details). The importance of exports to China, when assessed relative to trading partner GDP, shows even sharper increases for several economies. This ratio has, on average, quadrupled across the decade. Particularly exposed are Asian regional economies such as Taiwan Province of China, Malaysia, and Korea—all of which are important exporters of capital goods, parts, and components for final assembly in China.
II. ASSESSING EXPOSURES TO INVESTMENT-LED GROWTH IN CHINA A growing risk to trading partners China’s growing reliance on investment-led growth raises questions about how the new capacity will be used. If the capacity finds its way onto world markets by way of new exports and is perceived to put downward pressure on global prices, it would create the potential for retaliatory trade actions which eventually come back to hurt the Chinese economy and slow investment (see Guo 2011 for more details). Another possibility is that the new capacity remains underutilized, with adverse effects on bank balance sheets and credit conditions (which would make the financing of subsequent investment difficult). A rapid investment slowdown in China under either of the latter two outcomes will undoubtedly have a global impact given China’s size and systemic importance.1
1 A third possibility is that China achieves a smooth hand-off from investment to consumption, as envisaged in the growth strategy articulated under the 12th Five-Year Plan. The implications of this outcome are analyzed in Section IV below.
United StatesGermany
Japan
Australia
South AfricaBrazil
Chile
Peru
Iran
Saudi Arabia
Taiwan Province of China
Korea
Malaysia
Philippines
Thailand
Zambia
Kazakhstan
0
5
10
15
20
25
30
35
40
0 5 10 15
China as a destination for exports, 2001 and 2011(exports to China as percent of total exports)
2011
2001
Greater share of exportsgoing to China in 2011 than in 2001
Sources: DOTS; and IMF staff estimates
5
Quantifying spillovers
To get a sense of the potential magnitudes, the spillover from China on trading partner j is measured as
China spillover , exCHN , China Fixed Investment growth
where
exCHNExports to China
GDP
and China Fixed Investment growth is measured as the annual percent change of real gross fixed capital formation from the national accounts. This spillover measure varies across countries in a given year based on their export exposure to China and also varies over time based on fluctuations in China’s fixed investment growth. By construction, it only measures the influence of Chinese activity on other economies through the direct trade channel. Indirect trade exposures through vertically-integrated intermediate economies are not captured. Another concern with this measure is that it does not reflect financial exposures, which would also have a bearing on growth in trading partners. However, with the comprehensive system of capital controls in place and the dominance of domestic sources of financing, the financial spillover channel is likely to be limited. Estimating the impact of spillovers The effect of the spillover from China on trading partner growth is estimated using a broad sample of 64 economies exposed to China through the export channel described above. The sample covers the period of China’s membership in the WTO (2002–11) and includes the full set of OECD economies, emerging markets classified under the MSCI index, and key commodity producers. The main specification is
,
, , ,
, ,
The main coefficient of interest in this regression is β , which captures the effect of spillovers from China’s investment activity on growth in trading partner j. Additional controls include partner country lagged growth, the annual percent change in terms of trade ( , ), and macro volatility ( , ; measured as the standard deviation of GDP growth calculated over moving five-year windows).
6
-1
-0.8
-0.6
-0.4
-0.2
0
Germany Japan Philippines Thailand Korea Malaysia Taiwan Province of
China
China Investment Slowdown (1 percentage point) Impact on Trading Partner Growth (in percentage points)
Source: IMF staff estiamtes
Differentiating between manufacturing and nontradables fixed investment The regression is also estimated using different measures of fixed investment growth in China: overall, manufacturing, and nontradables.2 Manufacturing and nontradables fixed investment are calculated by applying shares from fixed asset investment data (available only from 2003 onward) to the national accounts series on real gross fixed capital formation. This breakdown allows for a comparison of likely effects from a slowdown in investment concentrated in manufacturing versus a deceleration concentrated in nontradables.
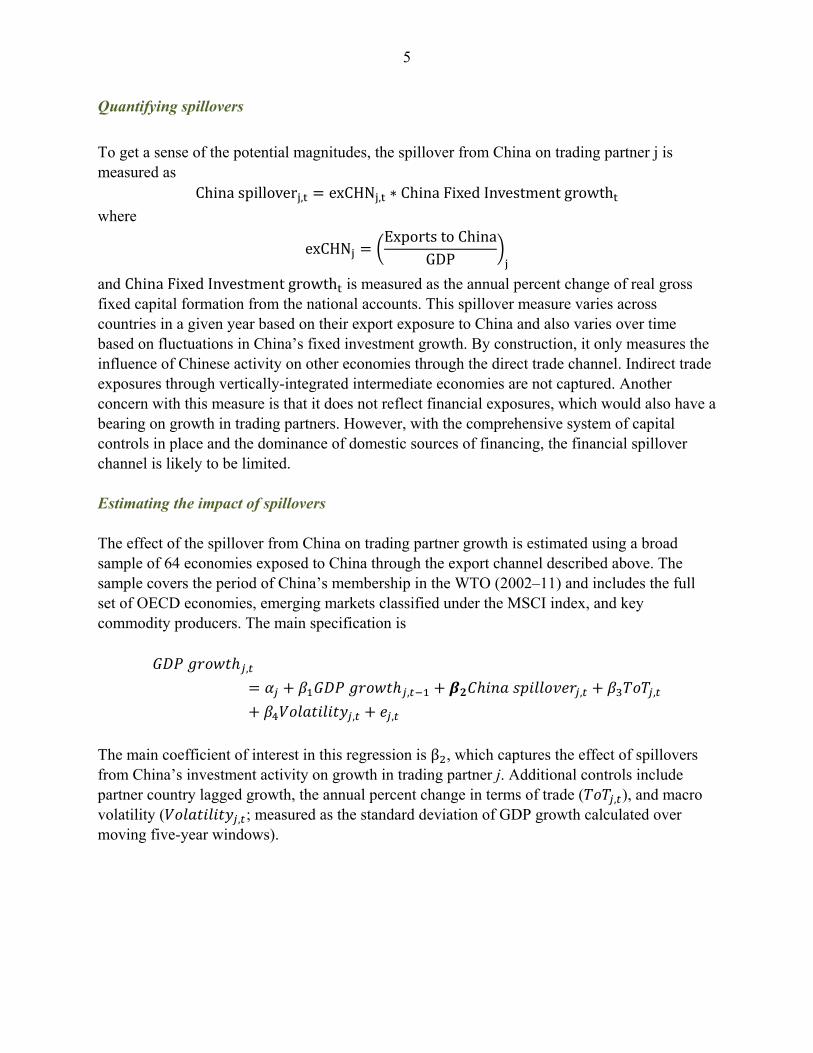
III. EFFECTS OF AN INVESTMENT SLOWDOWN IN CHINA Regional supply chain economies are highly vulnerable … The impact of China’s investment-led growth on trading partners has grown over time as China’s growth model tilts more toward investment and its global footprint of imports widens (Appendix A, Tables 1–4). Aggregating across all 64 economies (weighted by their PPP shares), the impact on global growth of a one percentage point slowdown in investment in China is just under one-tenth of a percentage point. The impact is about five times larger than in 2002 (estimated to be 0.02 percentage points). The most heavily exposed economies are those that lie within the Asian regional supply chain such as Taiwan Province of China, Korea, and Malaysia. The results from Table 4 (estimated based on the sample years covering the global financial crisis and the stimulus response in China) suggest that if investment growth declines by 1 percentage point in China, GDP growth in Taiwan Province of China for example falls by slightly over nine-tenths of a percentage point. Among the advanced economy exporters of capital goods, Japan suffers a decline of just over one-tenth of a percentage point in response while growth in Germany declines by a slightly smaller amount. As are commodity exporters with relatively less diversified economies Among commodity exporters, the impact of a slowdown in investment growth in China is likely to be largest on
2 The nontradables sector is defined to include utilities, construction, transport and storage, IT, wholesale and retail trade, catering, banking and insurance, real estate, leasing and commercial services, education, health care, sport and entertainment, and public administration.
-0.4
-0.3
-0.2
-0.1
0
Brazil Indonesia Australia Iran Kazakhstan Saudi Arabia
Zambia Chile
China Investment Slowdown (1 ppt point) Impact on Commodity Exporters (in percentage points)
Source: IMF staff estimates
7
-0.8
-0.6
-0.4
-0.2
0
Germany Japan Philippines Thailand Korea Malaysia Taiwan Province of China
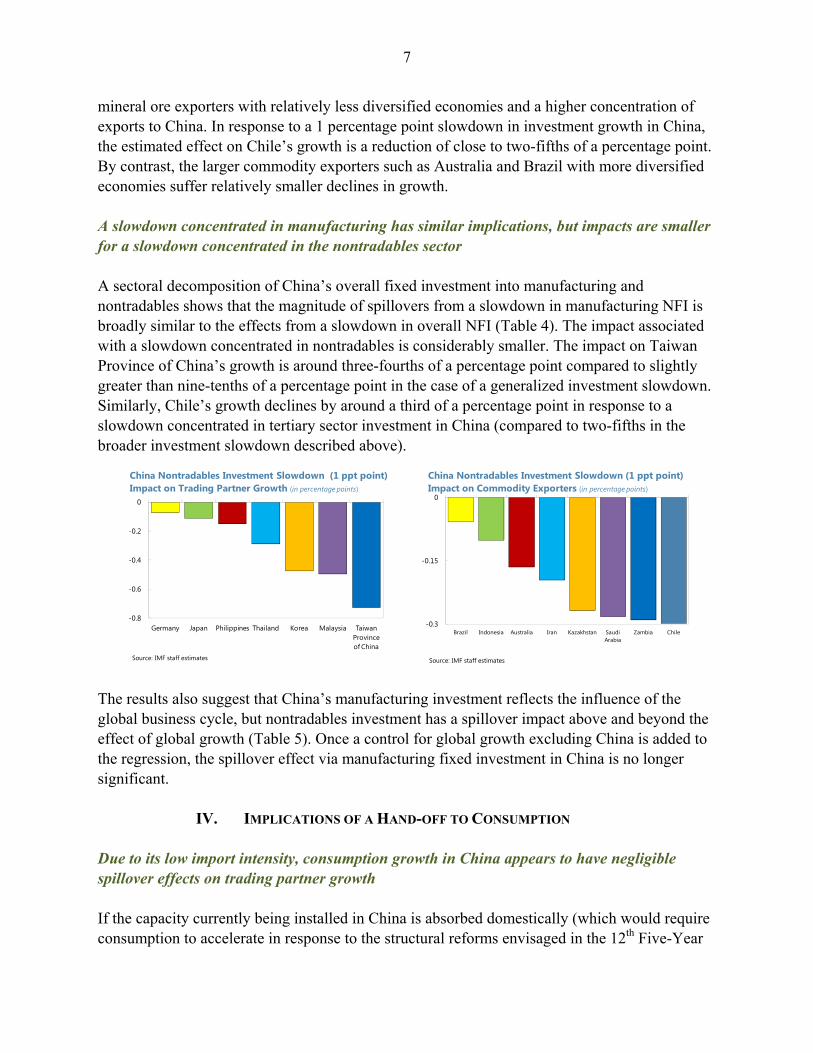
China Nontradables Investment Slowdown (1 ppt point)Impact on Trading Partner Growth (in percentage points)
Source: IMF staff estimates
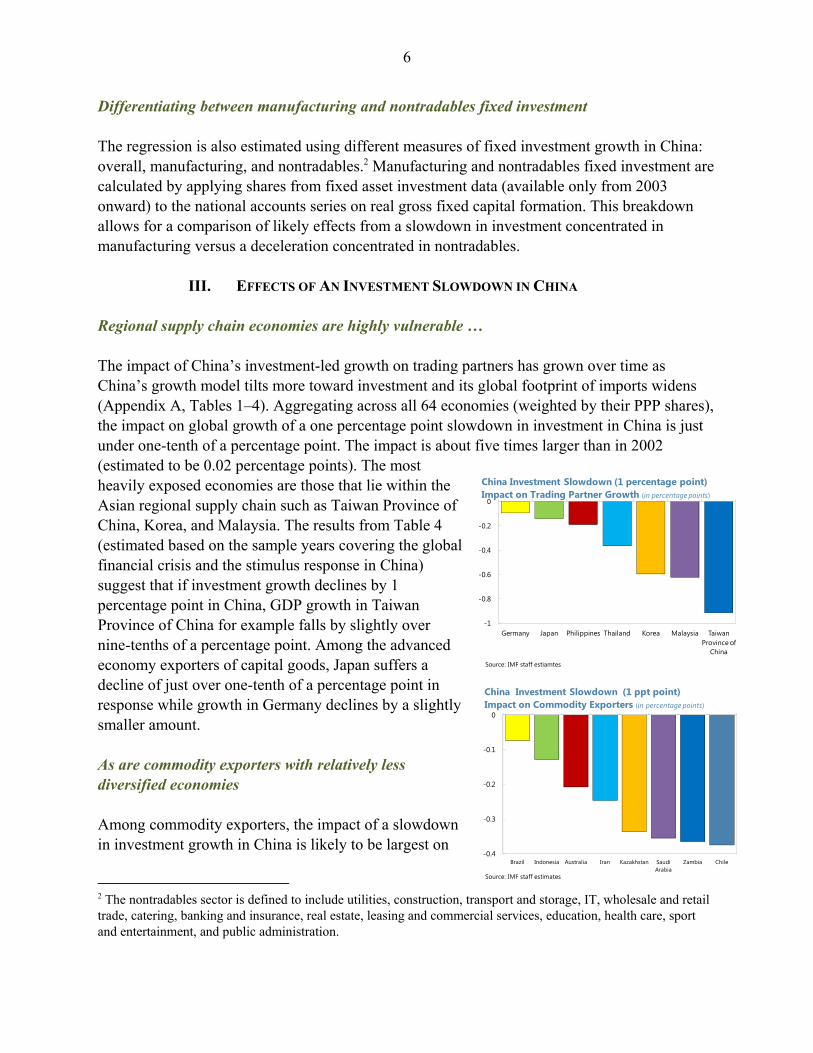
mineral ore exporters with relatively less diversified economies and a higher concentration of exports to China. In response to a 1 percentage point slowdown in investment growth in China, the estimated effect on Chile’s growth is a reduction of close to two-fifths of a percentage point. By contrast, the larger commodity exporters such as Australia and Brazil with more diversified economies suffer relatively smaller declines in growth. A slowdown concentrated in manufacturing has similar implications, but impacts are smaller for a slowdown concentrated in the nontradables sector A sectoral decomposition of China’s overall fixed investment into manufacturing and nontradables shows that the magnitude of spillovers from a slowdown in manufacturing NFI is broadly similar to the effects from a slowdown in overall NFI (Table 4). The impact associated with a slowdown concentrated in nontradables is considerably smaller. The impact on Taiwan Province of China’s growth is around three-fourths of a percentage point compared to slightly greater than nine-tenths of a percentage point in the case of a generalized investment slowdown. Similarly, Chile’s growth declines by around a third of a percentage point in response to a slowdown concentrated in tertiary sector investment in China (compared to two-fifths in the broader investment slowdown described above).
The results also suggest that China’s manufacturing investment reflects the influence of the global business cycle, but nontradables investment has a spillover impact above and beyond the effect of global growth (Table 5). Once a control for global growth excluding China is added to the regression, the spillover effect via manufacturing fixed investment in China is no longer significant.
IV. IMPLICATIONS OF A HAND-OFF TO CONSUMPTION Due to its low import intensity, consumption growth in China appears to have negligible spillover effects on trading partner growth If the capacity currently being installed in China is absorbed domestically (which would require consumption to accelerate in response to the structural reforms envisaged in the 12th Five-Year
-0.3
-0.15
0
Brazil Indonesia Australia Iran Kazakhstan Saudi Arabia
Zambia Chile
China Nontradables Investment Slowdown (1 ppt point)Impact on Commodity Exporters (in percentage points)
Source: IMF staff estimates
8
Plan), a smooth hand-off from investment to consumption-led growth can be achieved. China’s growth would moderate into the medium term, but would still remain above 8 percent as outlined in the rebalancing scenario in the Staff Report for the 2011 Article IV Consultation with China. The benefits of such an outcome for consumer goods exporters are, however, likely to be small. China’s share in global consumer goods imports has increased at a slower pace than its share in global consumption over the past fifteen years. It currently plays a small role as an importer of consumer goods, accounting for only 2 percent of global consumer goods imports (see IMF 2012 for more details). The panel regression approach using the broad sample of 64 economies confirms that this is the case. The low import intensity of consumption in China suggests that the direct spillover effect from consumption growth on trading partner growth is negligible. A similar exercise to the one outlined above, but which instead quantifies potential spillovers from consumption growth in China, shows that the effects on trading partner growth are insignificant (Appendix A, Table 6).
V. EFFECTS OF AN INVESTMENT SLOWDOWN ON G20 MACRO INDICATORS A complementary approach uses Factor Augmented VARs to assess spillover effects on key macroeconomic, trade, and financial variables A complementary approach presented below uses a factor-augmented VAR (FAVAR) to gauge the domestic and global spillovers of a slowdown in China’s FAI investment. The FAVAR framework is extended into a two-region model that allows China to interact with the other G20 economies. The analysis captures the feedback from China to the rest of the world, and vice versa, over time. It also captures the spillover effect among the rest of the G20 economies from a specific event originated in China. The fact that market participants monitor hundreds of economic variables in their decision-making process provides motivation for conditioning the analysis of their decisions on a rich information set. The FAVAR framework extracts information from the rich data set to gauge the impact of particular forces that may not be directly observable. These “forces” are treated as latent common components, which are interrelated, and their impacts on economic variables are traced through impulse response functions. By accounting for unobserved variables, there is a better chance that findings based on spurious association can be avoided. More detailed description of the model and estimation strategy can be found in the appendix of the Background Paper IV.B “The Spillover Effects of a Downturn in China’s Real Estate Sector.” Briefly, the model is a stable FAVAR in growth (except for balances and interest rates) with five common factors for each region (China and the rest of the G20 economies) and China’s fixed asset investment (FAI). The model uses one lag. The Cholesky factor from the residual covariance matrix is used to orthogonalize the impulses, which imposes an ordering of
9
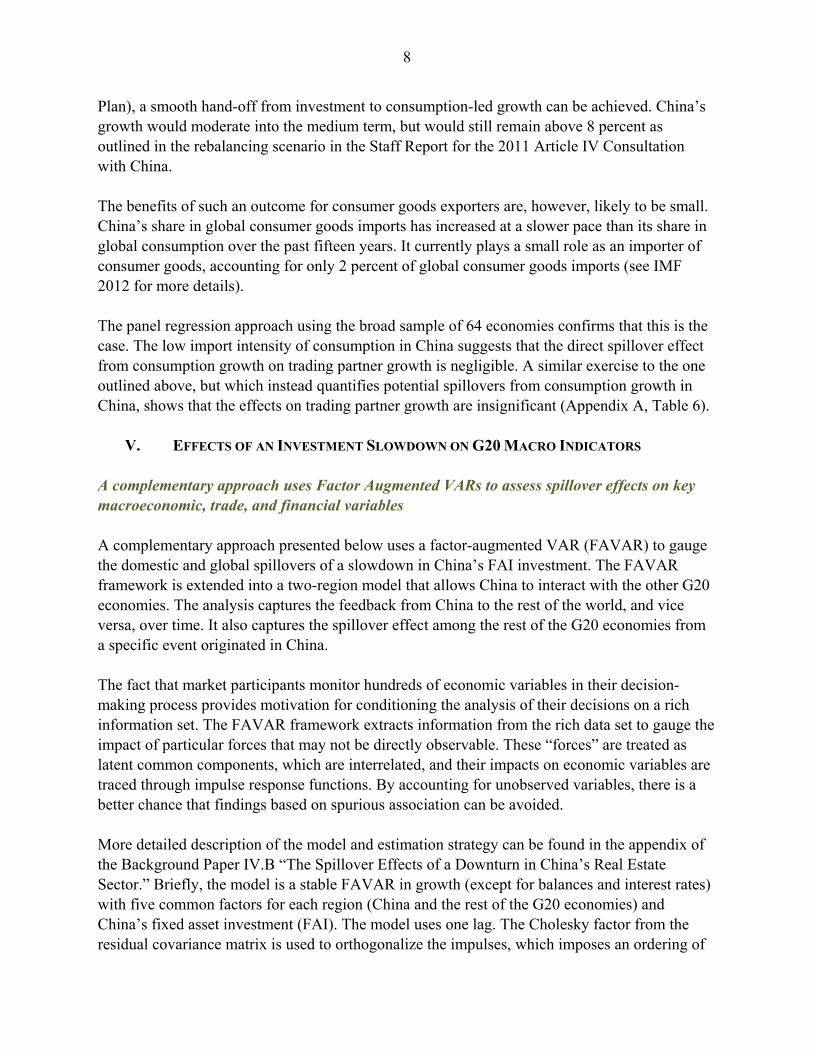
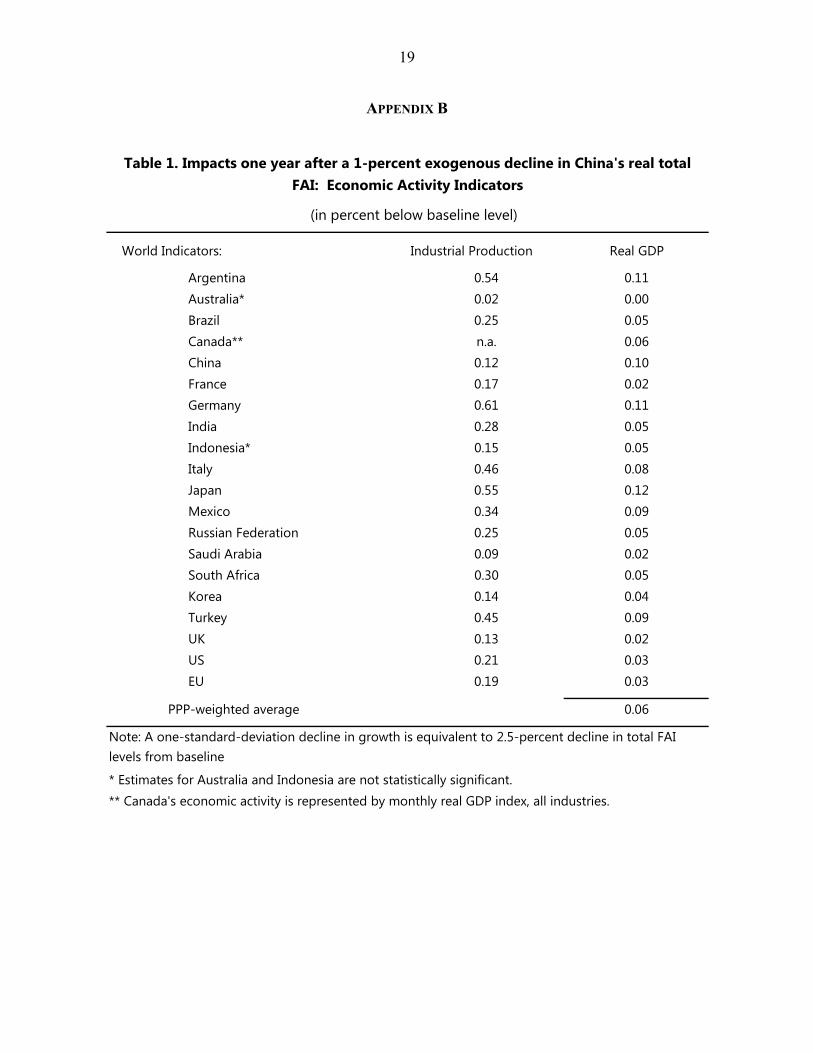
the variables in the VAR and treats investment as exogenous in the period of shock. The results are robust to reordering within factor groups. The data set is a balanced panel of 390 monthly time series from the G20 stretching from 2000M1 to 2011M9, with 68 China-specific variables and 322 from the rest of the G20. The sample contains at least one full cycle of investment in China. It starts from the period right before China’s entry into the WTO and covers the time when it became increasingly integrated with the world economy. Since the model is in growth, the experiment assumes an exogenous, temporary, one-standard-deviation growth shock to China’s FAI. The shock dampens within 3 quarters and dissipates fully after around 40 months. Specifically, this is a one-time 15-percentage-point (seasonally adjusted, annualized) drop in FAI growth that reverts to trend growth largely within 7-8 months.3 While this is a temporary, negative growth shock, the decline in FAI level is permanent. The shock is approximately equivalent to a 2½ percent drop from baseline in real FAI level 12 months after. The analysis does not assume policy response beyond that which was already in the sample. Twenty-four-month-peak impacts are reported with standard error bands in the charts below. Impacts on levels 12 months after the shock, in percent below baseline, are also derived and reported for comparison in Appendix B, Tables 1–2. Global spillovers from a temporary shock to China’s FAI growth last for approximately 5-8 quarters A temporary shock to China’s FAI growth would reverberate around the world, with the spillover impacts on G20 economies dissipating after approximately 5–8 quarters. In this exercise, the approximate impact on GDP growth would vary with the size of industrial production-to-GDP ratio in each economy.4 The implied peak impact on PPP-weighted G20 GDP growth is -0.2 percentage point, which translates to around 0.1 percent below baseline at 12 months after the shock originated in China (see Appendix B, Table 1). Overall, capital goods manufacturers (such as Germany and Japan) 3 One standard deviation shock is equivalent to 1.2 percentage points in month-over-month, seasonally adjusted, growth rates. 4 Industrial production is defined differently from country to country. The OECD definition includes production in mining, manufacturing, and public utilities (electricity, gas, and water), but excludes construction.
-5
-3
-1
1A
ustr
alia
Braz
il
Cana
da*
Ger
man
y
Indi
a
Indo
nesi
a
Japa
n
Kore
a UK
US
EU
SignificantNot significant
Peak Impact on Industrial Production (In percentage points, saar; 1 s.d. shock)
*Canada's economic activity is represented by monthly real GDP index, all industries.
-0.8
-0.6
-0.4
-0.2
0
0.2
0.4
Aus
tral
ia
Braz
il
Cana
da
Ger
man
y
Indi
a
Indo
nesi
a
Japa
n
Kore
a
UK US
EU
SignificantNot significant
Peak Impact on Real GDP(In percentage points, saar; 1 s.d. shock)
10
-16
-12
-8
-4
0
Aus
tral
ia
Braz
il
Cana
da
Ger
man
y
Indi
a
Japa
n
Kore
a UK
US EU
SignificantNot significant
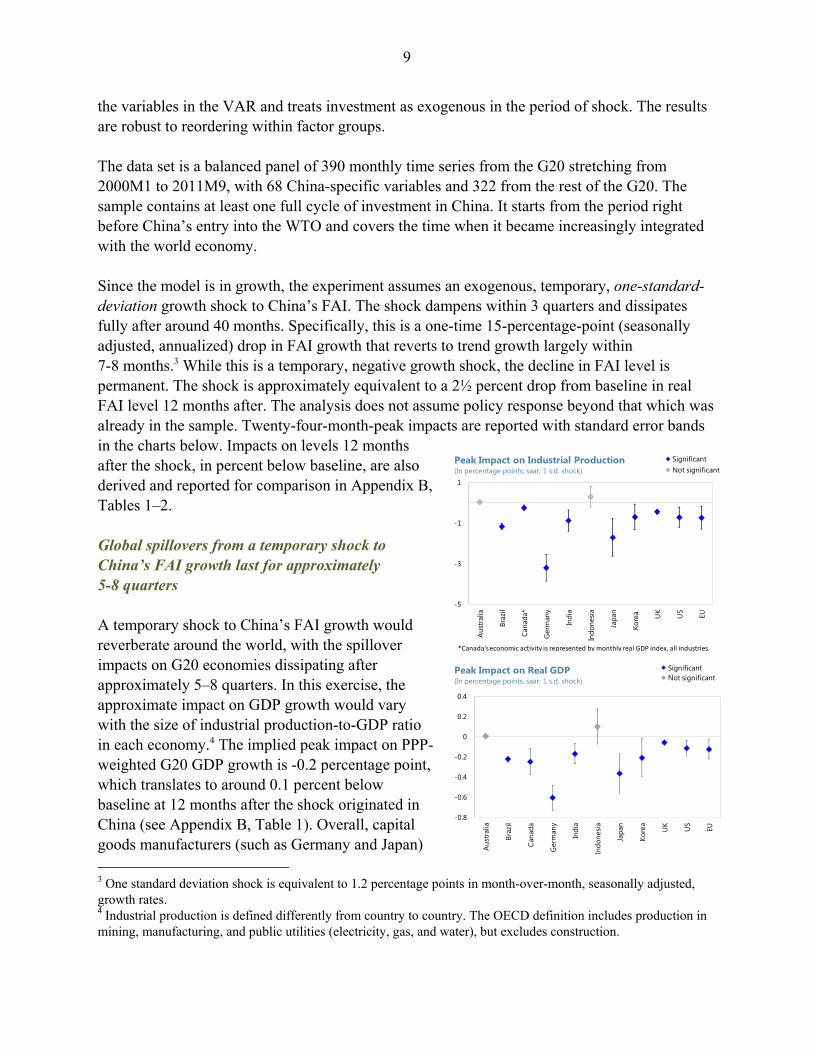
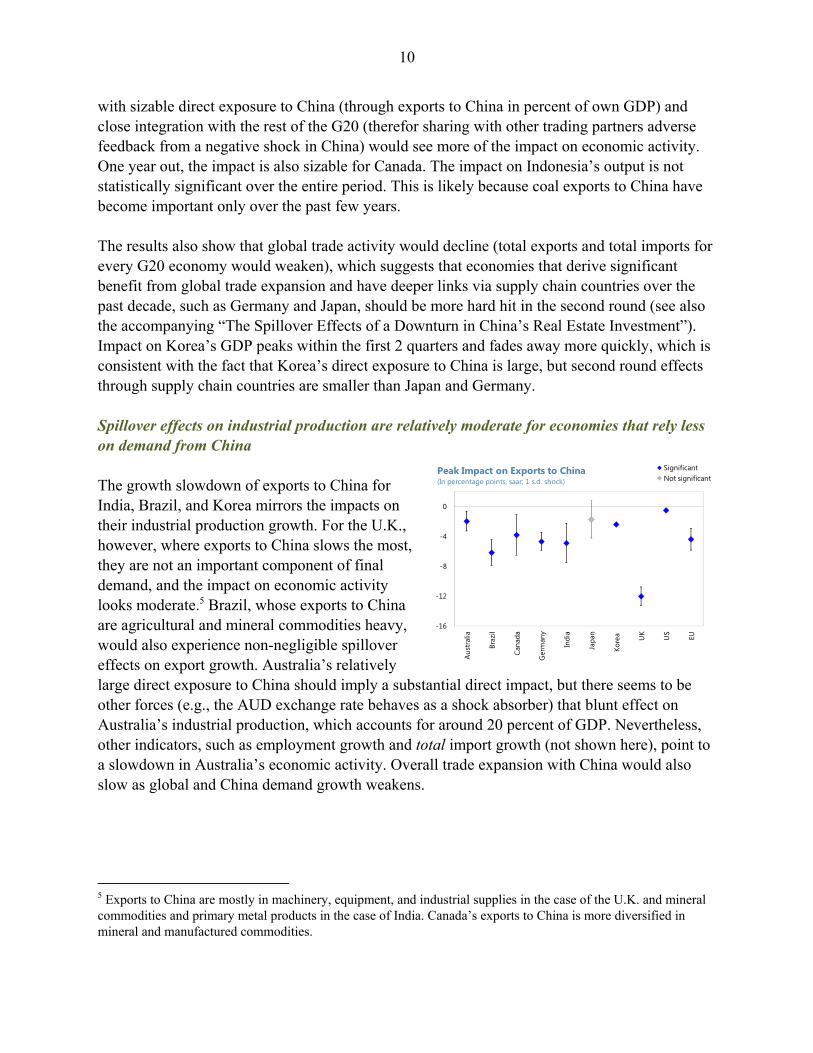
Peak Impact on Exports to China(In percentage points, saar; 1 s.d. shock)
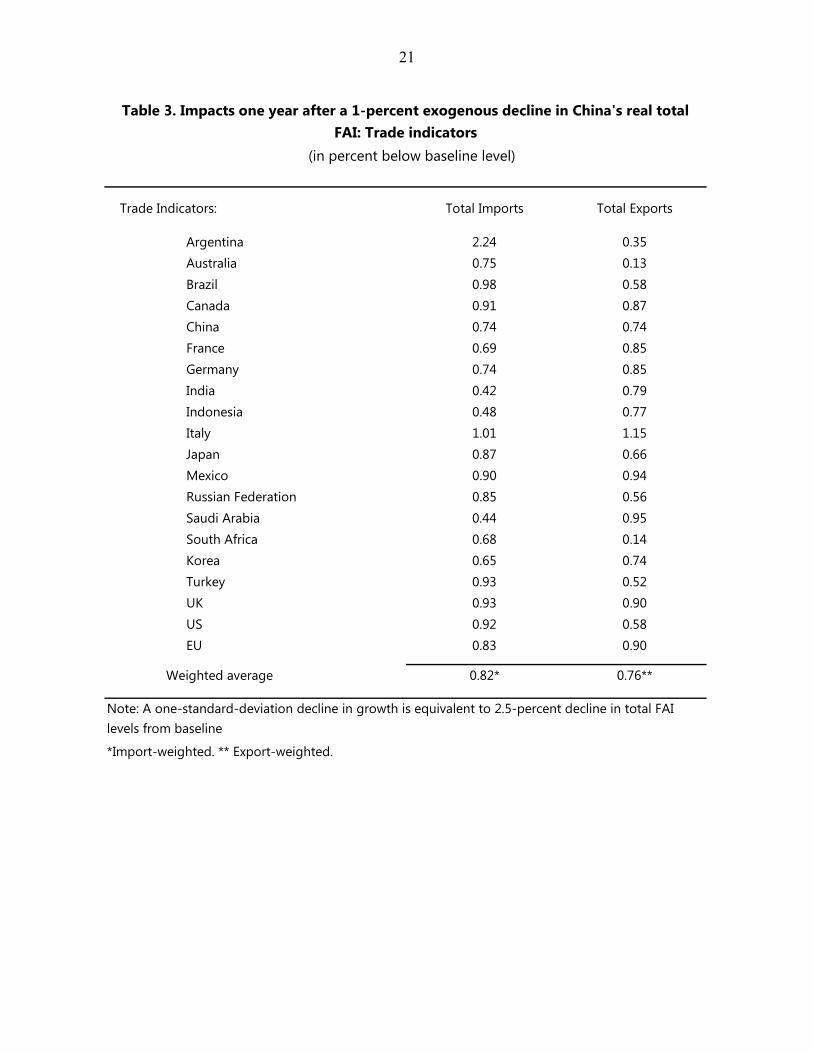
with sizable direct exposure to China (through exports to China in percent of own GDP) and close integration with the rest of the G20 (therefor sharing with other trading partners adverse feedback from a negative shock in China) would see more of the impact on economic activity. One year out, the impact is also sizable for Canada. The impact on Indonesia’s output is not statistically significant over the entire period. This is likely because coal exports to China have become important only over the past few years. The results also show that global trade activity would decline (total exports and total imports for every G20 economy would weaken), which suggests that economies that derive significant benefit from global trade expansion and have deeper links via supply chain countries over the past decade, such as Germany and Japan, should be more hard hit in the second round (see also the accompanying “The Spillover Effects of a Downturn in China’s Real Estate Investment”). Impact on Korea’s GDP peaks within the first 2 quarters and fades away more quickly, which is consistent with the fact that Korea’s direct exposure to China is large, but second round effects through supply chain countries are smaller than Japan and Germany. Spillover effects on industrial production are relatively moderate for economies that rely less on demand from China The growth slowdown of exports to China for India, Brazil, and Korea mirrors the impacts on their industrial production growth. For the U.K., however, where exports to China slows the most, they are not an important component of final demand, and the impact on economic activity looks moderate.5 Brazil, whose exports to China are agricultural and mineral commodities heavy, would also experience non-negligible spillover effects on export growth. Australia’s relatively large direct exposure to China should imply a substantial direct impact, but there seems to be other forces (e.g., the AUD exchange rate behaves as a shock absorber) that blunt effect on Australia’s industrial production, which accounts for around 20 percent of GDP. Nevertheless, other indicators, such as employment growth and total import growth (not shown here), point to a slowdown in Australia’s economic activity. Overall trade expansion with China would also slow as global and China demand growth weakens.
5 Exports to China are mostly in machinery, equipment, and industrial supplies in the case of the U.K. and mineral commodities and primary metal products in the case of India. Canada’s exports to China is more diversified in mineral and manufactured commodities.
11
-0.9
-0.7
-0.5
-0.3
-0.1
0.1
Aus
tral
ia
Cana
da
Ger
nam
y
Indi
a
Italy
Japa
n
Kore
a
UK
US
EU
Significant
Not significant
Peak Impact on Sovereign Bond Spreads: 10Y-2Y(In percent; 12-month cumulative; 1 s.d. shock)
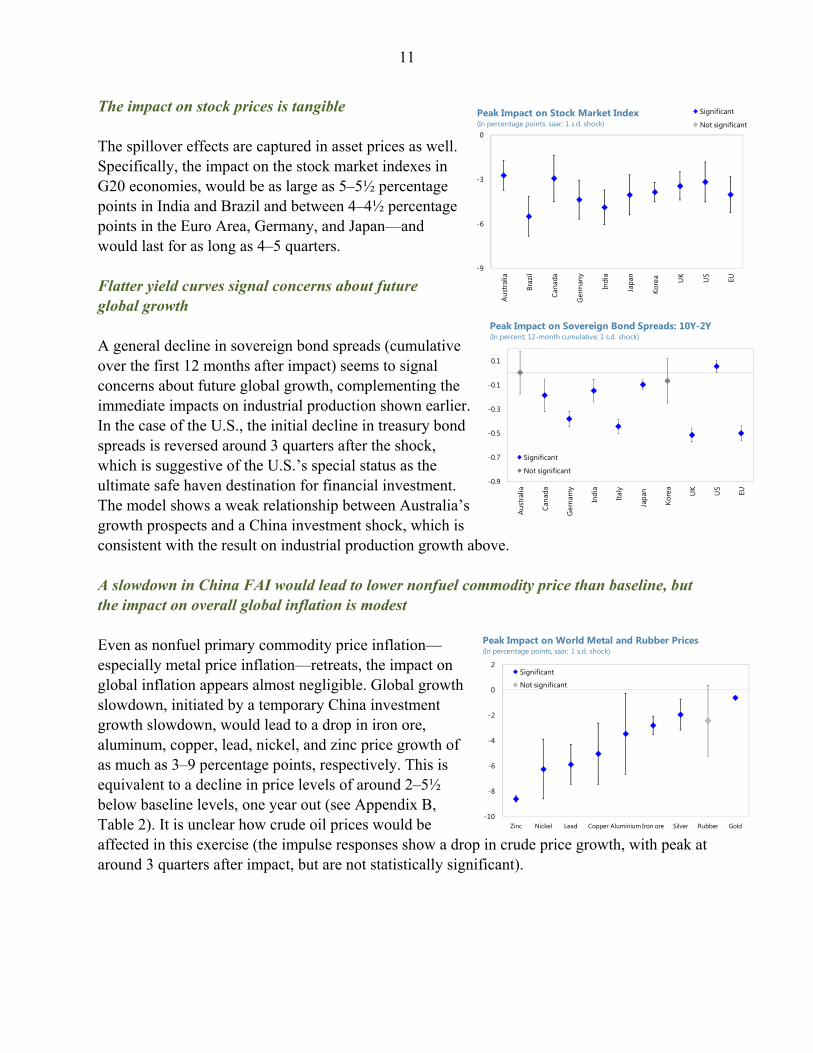
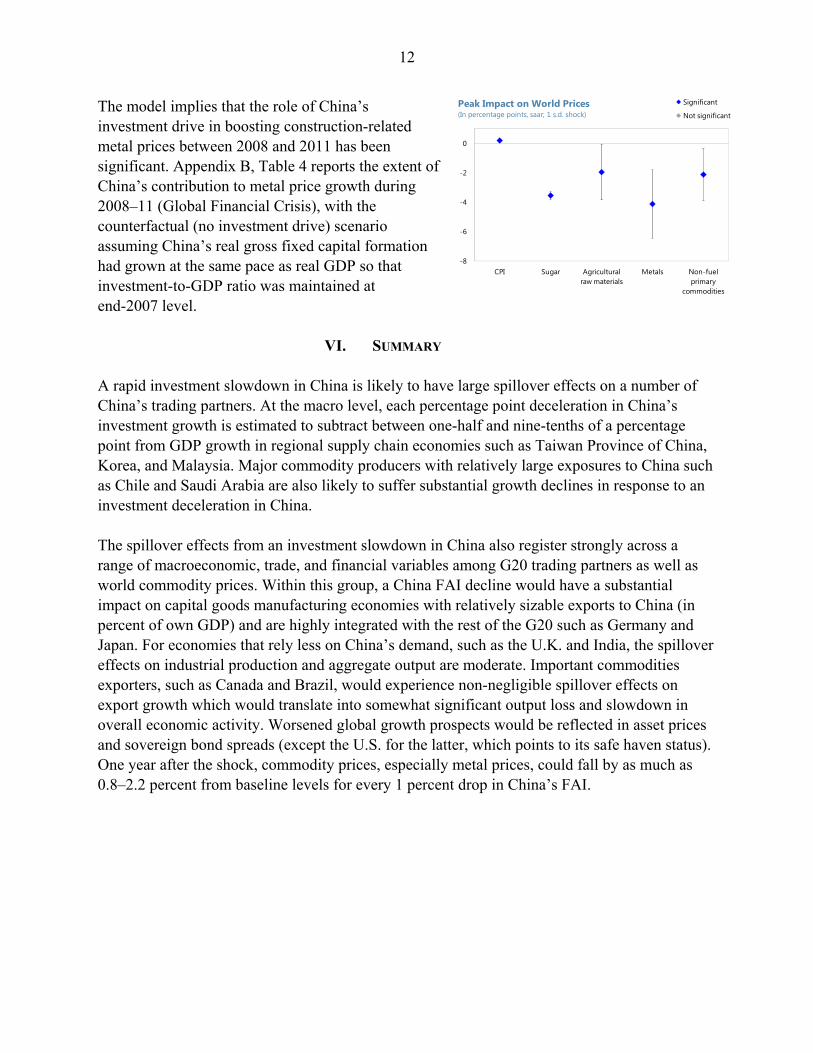
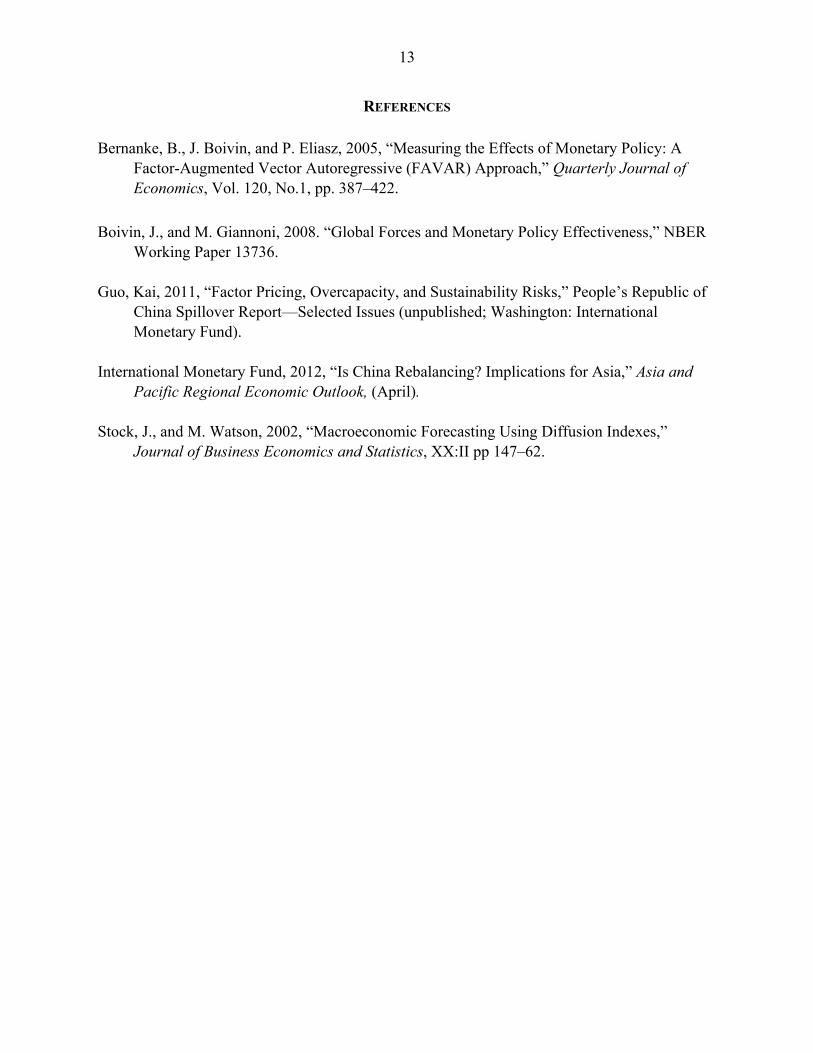
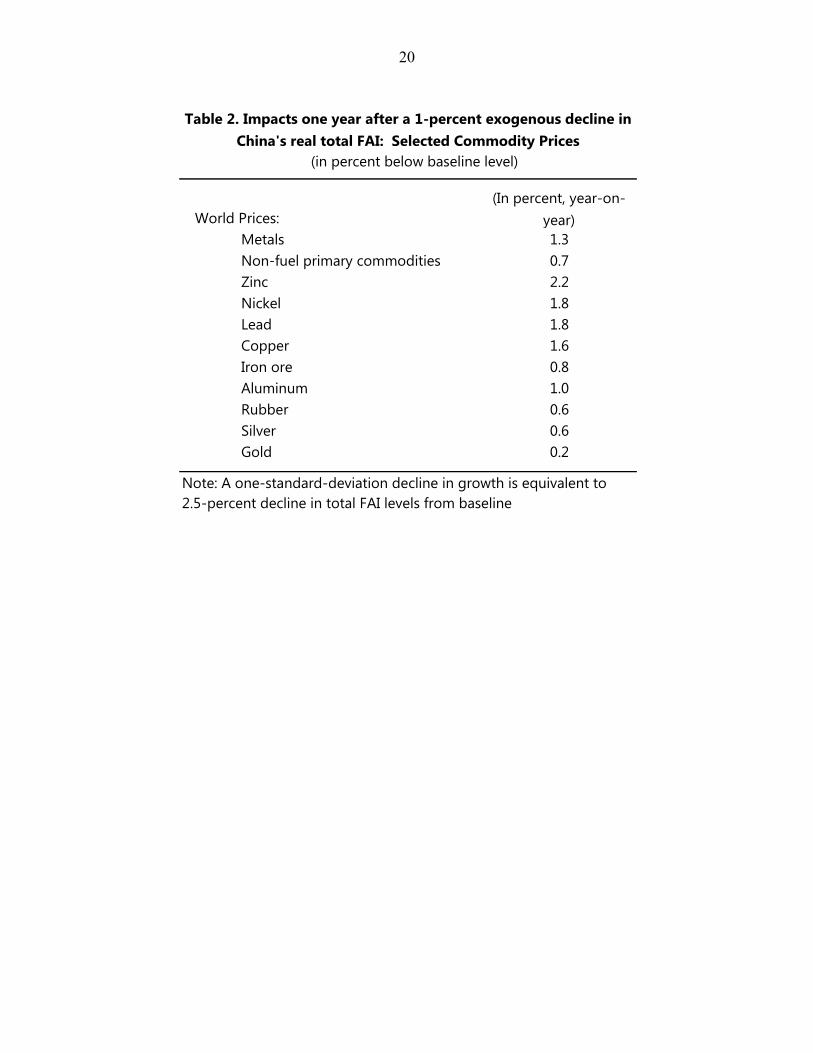
The impact on stock prices is tangible The spillover effects are captured in asset prices as well. Specifically, the impact on the stock market indexes in G20 economies, would be as large as 5–5½ percentage points in India and Brazil and between 4–4½ percentage points in the Euro Area, Germany, and Japan—and would last for as long as 4–5 quarters. Flatter yield curves signal concerns about future global growth A general decline in sovereign bond spreads (cumulative over the first 12 months after impact) seems to signal concerns about future global growth, complementing the immediate impacts on industrial production shown earlier. In the case of the U.S., the initial decline in treasury bond spreads is reversed around 3 quarters after the shock, which is suggestive of the U.S.’s special status as the ultimate safe haven destination for financial investment. The model shows a weak relationship between Australia’s growth prospects and a China investment shock, which is consistent with the result on industrial production growth above. A slowdown in China FAI would lead to lower nonfuel commodity price than baseline, but the impact on overall global inflation is modest Even as nonfuel primary commodity price inflation—especially metal price inflation—retreats, the impact on global inflation appears almost negligible. Global growth slowdown, initiated by a temporary China investment growth slowdown, would lead to a drop in iron ore, aluminum, copper, lead, nickel, and zinc price growth of as much as 3–9 percentage points, respectively. This is equivalent to a decline in price levels of around 2–5½ below baseline levels, one year out (see Appendix B, Table 2). It is unclear how crude oil prices would be affected in this exercise (the impulse responses show a drop in crude price growth, with peak at around 3 quarters after impact, but are not statistically significant).
-9
-6
-3
0
Aus
tral
ia
Braz
il
Cana
da
Ger
man
y
Indi
a
Japa
n
Kore
a UK
US EU
Significant
Not significantPeak Impact on Stock Market Index(In percentage points, saar; 1 s.d. shock)
-10
-8
-6
-4
-2
0
2
Zinc Nickel Lead Copper Aluminium Iron ore Silver Rubber Gold
Significant
Not significant
Peak Impact on World Metal and Rubber Prices(In percentage points, saar; 1 s.d. shock)
12
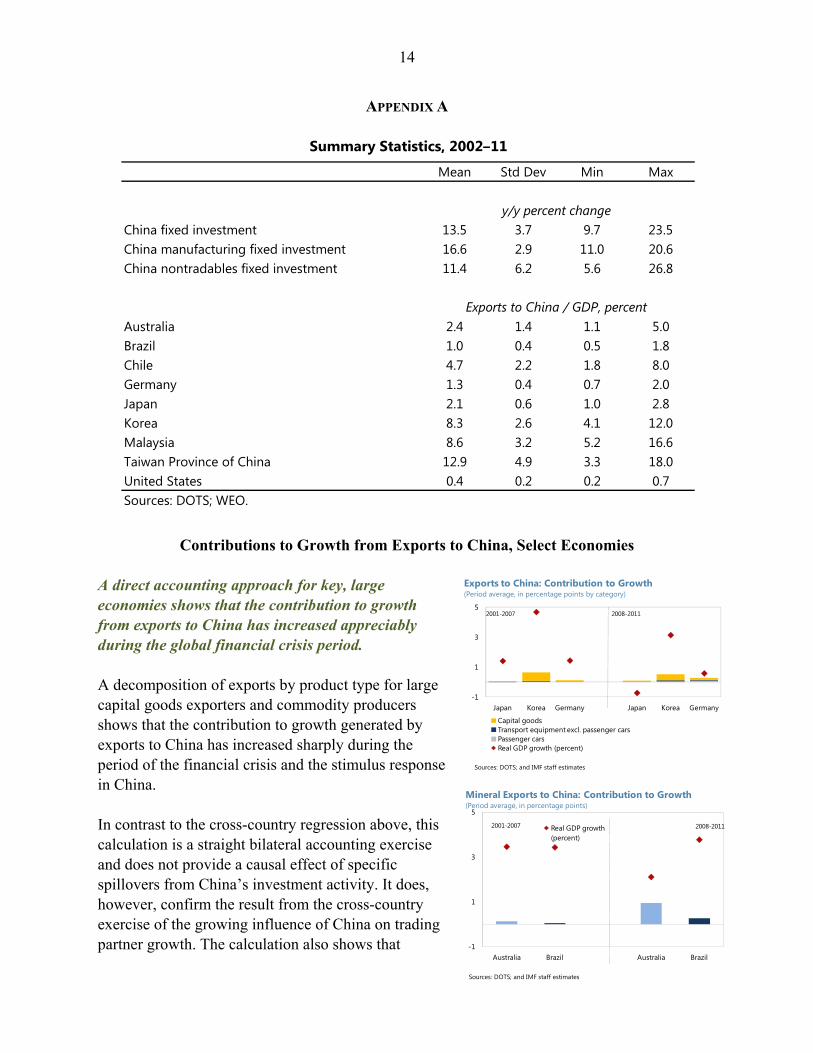
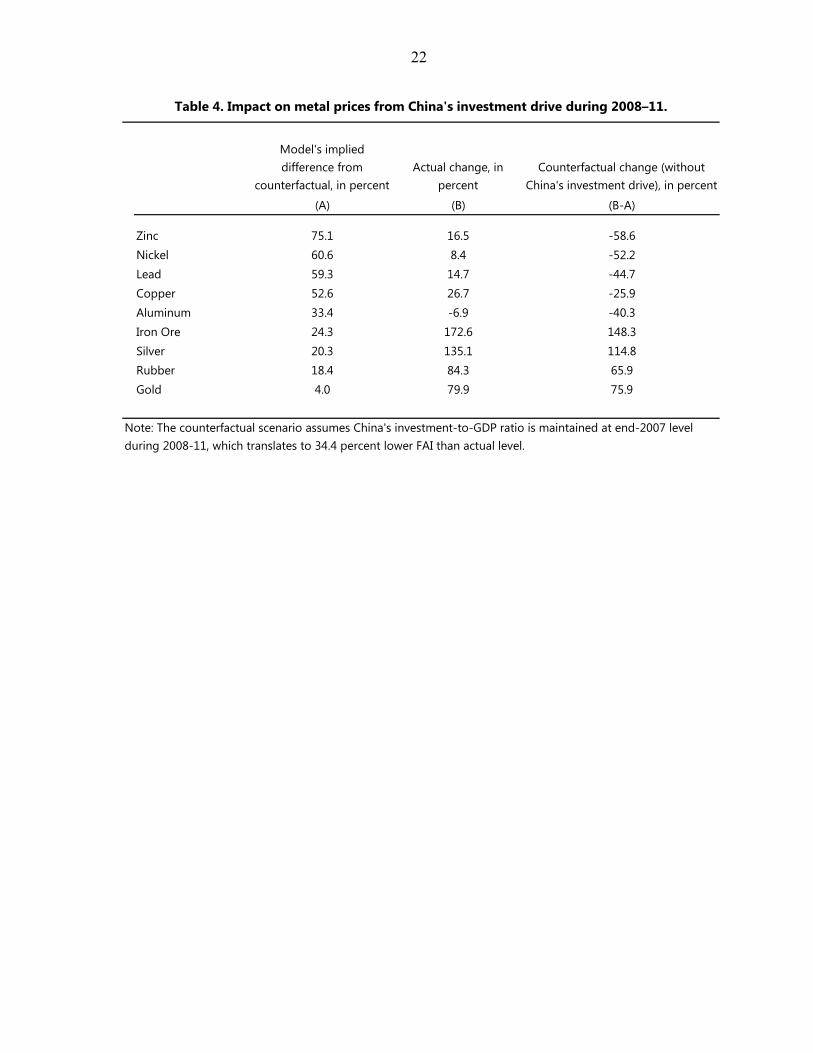
The model implies that the role of China’s investment drive in boosting construction-related metal prices between 2008 and 2011 has been significant. Appendix B, Table 4 reports the extent of China’s contribution to metal price growth during 2008–11 (Global Financial Crisis), with the counterfactual (no investment drive) scenario assuming China’s real gross fixed capital formation had grown at the same pace as real GDP so that investment-to-GDP ratio was maintained at end-2007 level.
VI. SUMMARY A rapid investment slowdown in China is likely to have large spillover effects on a number of China’s trading partners. At the macro level, each percentage point deceleration in China’s investment growth is estimated to subtract between one-half and nine-tenths of a percentage point from GDP growth in regional supply chain economies such as Taiwan Province of China, Korea, and Malaysia. Major commodity producers with relatively large exposures to China such as Chile and Saudi Arabia are also likely to suffer substantial growth declines in response to an investment deceleration in China. The spillover effects from an investment slowdown in China also register strongly across a range of macroeconomic, trade, and financial variables among G20 trading partners as well as world commodity prices. Within this group, a China FAI decline would have a substantial impact on capital goods manufacturing economies with relatively sizable exports to China (in percent of own GDP) and are highly integrated with the rest of the G20 such as Germany and Japan. For economies that rely less on China’s demand, such as the U.K. and India, the spillover effects on industrial production and aggregate output are moderate. Important commodities exporters, such as Canada and Brazil, would experience non-negligible spillover effects on export growth which would translate into somewhat significant output loss and slowdown in overall economic activity. Worsened global growth prospects would be reflected in asset prices and sovereign bond spreads (except the U.S. for the latter, which points to its safe haven status). One year after the shock, commodity prices, especially metal prices, could fall by as much as 0.8–2.2 percent from baseline levels for every 1 percent drop in China’s FAI.
-8
-6
-4
-2
0
CPI Sugar Agricultural raw materials
Metals Non-fuel primary
commodities
Significant
Not significantPeak Impact on World Prices(In percentage points, saar; 1 s.d. shock)
13
REFERENCES
Bernanke, B., J. Boivin, and P. Eliasz, 2005, “Measuring the Effects of Monetary Policy: A Factor-Augmented Vector Autoregressive (FAVAR) Approach,” Quarterly Journal of Economics, Vol. 120, No.1, pp. 387–422.
Boivin, J., and M. Giannoni, 2008. “Global Forces and Monetary Policy Effectiveness,” NBER
Working Paper 13736. Guo, Kai, 2011, “Factor Pricing, Overcapacity, and Sustainability Risks,” People’s Republic of
China Spillover Report—Selected Issues (unpublished; Washington: International Monetary Fund).
International Monetary Fund, 2012, “Is China Rebalancing? Implications for Asia,” Asia and
Pacific Regional Economic Outlook, (April). Stock, J., and M. Watson, 2002, “Macroeconomic Forecasting Using Diffusion Indexes,”
Journal of Business Economics and Statistics, XX:II pp 147–62.
14
-1
1
3
5
Australia Brazil Australia Brazil
Real GDP growth (percent)
Mineral Exports to China: Contribution to Growth (Period average, in percentage points)
2001-2007 2008-2011
Sources: DOTS; and IMF staff estimates
APPENDIX A
Contributions to Growth from Exports to China, Select Economies A direct accounting approach for key, large economies shows that the contribution to growth from exports to China has increased appreciably during the global financial crisis period. A decomposition of exports by product type for large capital goods exporters and commodity producers shows that the contribution to growth generated by exports to China has increased sharply during the period of the financial crisis and the stimulus response in China. In contrast to the cross-country regression above, this calculation is a straight bilateral accounting exercise and does not provide a causal effect of specific spillovers from China’s investment activity. It does, however, confirm the result from the cross-country exercise of the growing influence of China on trading partner growth. The calculation also shows that
Mean Std Dev Min Max
China fixed investment 13.5 3.7 9.7 23.5China manufacturing fixed investment 16.6 2.9 11.0 20.6China nontradables fixed investment 11.4 6.2 5.6 26.8
Australia 2.4 1.4 1.1 5.0Brazil 1.0 0.4 0.5 1.8Chile 4.7 2.2 1.8 8.0Germany 1.3 0.4 0.7 2.0Japan 2.1 0.6 1.0 2.8Korea 8.3 2.6 4.1 12.0Malaysia 8.6 3.2 5.2 16.6Taiwan Province of China 12.9 4.9 3.3 18.0United States 0.4 0.2 0.2 0.7Sources: DOTS; WEO.
y/y percent change
Exports to China / GDP, percent
Summary Statistics, 2002–11
-1
1
3
5
Japan Korea Germany Japan Korea Germany
Capital goodsTransport equipment excl. passenger carsPassenger carsReal GDP growth (percent)
Exports to China: Contribution to Growth (Period average, in percentage points by category)
2001-2007 2008-2011
Sources: DOTS; and IMF staff estimates
15
despite accounts of the rise of luxury goods exports (such as high-end passenger cars) to China from Japan and Germany, the fraction of growth they account for in these source economies is still relatively small. Finally, with regard to large commodity exporters, the contribution to growth from mineral exports to China has more than doubled during the 2008-11 period compared to 2001–07. In Australia’s case, they accounted for just below one-half of growth in the later interval. With regard to Brazil, the accounting exercise confirms that the economy appears well diversified and exports to China account for a relatively small fraction of overall growth even during the period of infrastructure expansion in China.
Regression Results
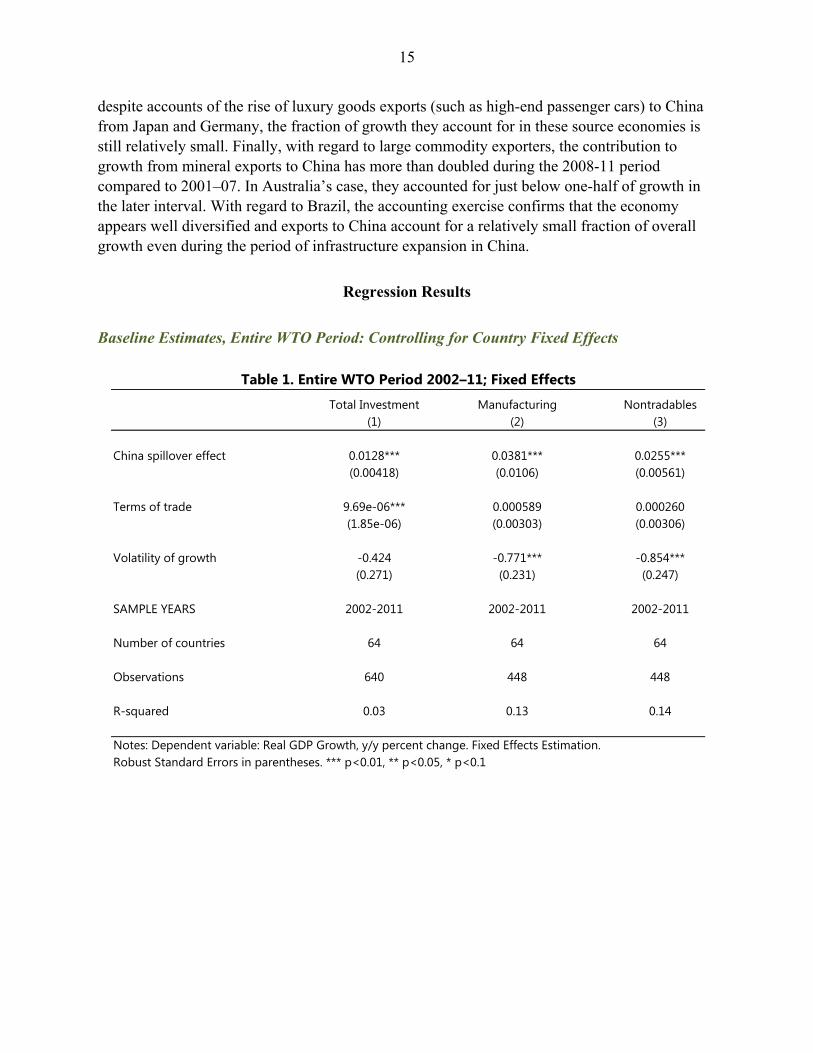
Baseline Estimates, Entire WTO Period: Controlling for Country Fixed Effects
Total Investment Manufacturing Nontradables(1) (2) (3)
China spillover effect 0.0128*** 0.0381*** 0.0255***(0.00418) (0.0106) (0.00561)
Terms of trade 9.69e-06*** 0.000589 0.000260(1.85e-06) (0.00303) (0.00306)
Volatility of growth -0.424 -0.771*** -0.854***(0.271) (0.231) (0.247)
SAMPLE YEARS 2002-2011 2002-2011 2002-2011
Number of countries 64 64 64
Observations 640 448 448
R-squared 0.03 0.13 0.14
Notes: Dependent variable: Real GDP Growth, y/y percent change. Fixed Effects Estimation. Robust Standard Errors in parentheses. *** p<0.01, ** p<0.05, * p<0.1
Table 1. Entire WTO Period 2002–11; Fixed Effects
16
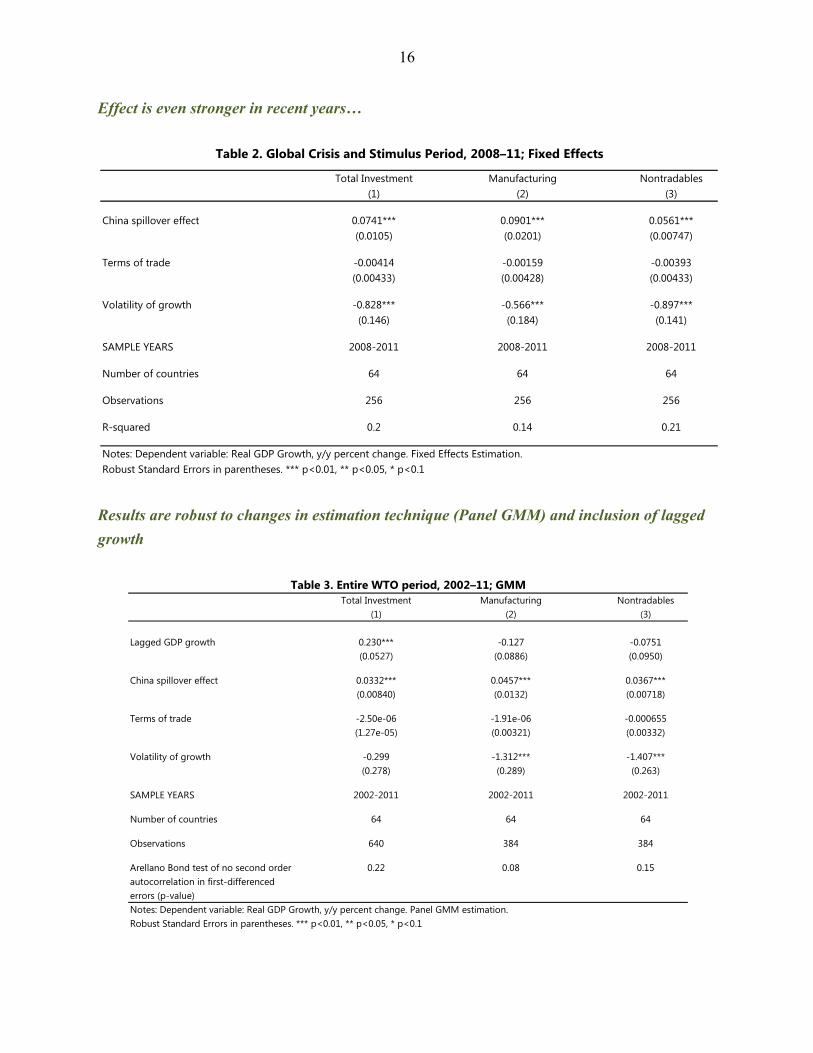
Effect is even stronger in recent years…
Results are robust to changes in estimation technique (Panel GMM) and inclusion of lagged
growth
Total Investment Manufacturing Nontradables(1) (2) (3)
China spillover effect 0.0741*** 0.0901*** 0.0561***(0.0105) (0.0201) (0.00747)
Terms of trade -0.00414 -0.00159 -0.00393(0.00433) (0.00428) (0.00433)
Volatility of growth -0.828*** -0.566*** -0.897***(0.146) (0.184) (0.141)
SAMPLE YEARS 2008-2011 2008-2011 2008-2011
Number of countries 64 64 64
Observations 256 256 256
R-squared 0.2 0.14 0.21
Notes: Dependent variable: Real GDP Growth, y/y percent change. Fixed Effects Estimation. Robust Standard Errors in parentheses. *** p<0.01, ** p<0.05, * p<0.1
Table 2. Global Crisis and Stimulus Period, 2008–11; Fixed Effects
Total Investment Manufacturing Nontradables(1) (2) (3)
Lagged GDP growth 0.230*** -0.127 -0.0751(0.0527) (0.0886) (0.0950)
China spillover effect 0.0332*** 0.0457*** 0.0367***(0.00840) (0.0132) (0.00718)
Terms of trade -2.50e-06 -1.91e-06 -0.000655(1.27e-05) (0.00321) (0.00332)
Volatility of growth -0.299 -1.312*** -1.407***(0.278) (0.289) (0.263)
SAMPLE YEARS 2002-2011 2002-2011 2002-2011
Number of countries 64 64 64
Observations 640 384 384
Arellano Bond test of no second order 0.22 0.08 0.15autocorrelation in first-differencederrors (p-value)Notes: Dependent variable: Real GDP Growth, y/y percent change. Panel GMM estimation. Robust Standard Errors in parentheses. *** p<0.01, ** p<0.05, * p<0.1
Table 3. Entire WTO period, 2002–11; GMM
17
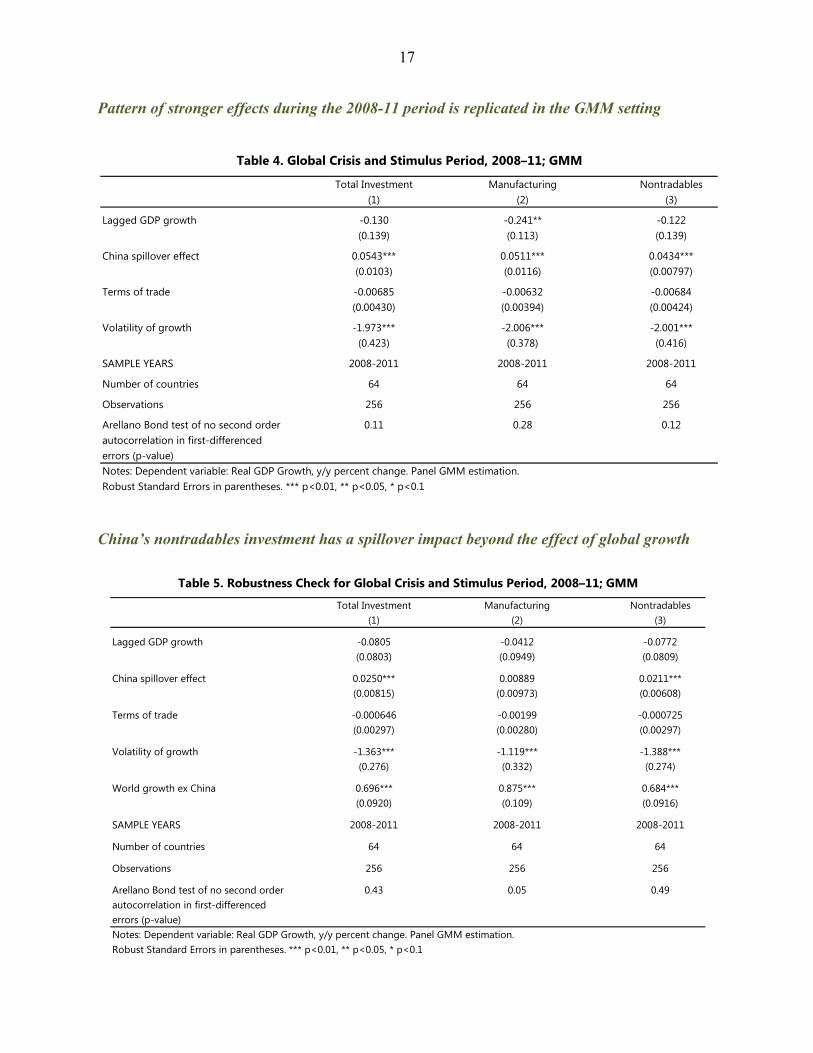
Pattern of stronger effects during the 2008-11 period is replicated in the GMM setting
China’s nontradables investment has a spillover impact beyond the effect of global growth
Total Investment Manufacturing Nontradables(1) (2) (3)
Lagged GDP growth -0.130 -0.241** -0.122(0.139) (0.113) (0.139)
China spillover effect 0.0543*** 0.0511*** 0.0434***(0.0103) (0.0116) (0.00797)
Terms of trade -0.00685 -0.00632 -0.00684(0.00430) (0.00394) (0.00424)
Volatility of growth -1.973*** -2.006*** -2.001***(0.423) (0.378) (0.416)
SAMPLE YEARS 2008-2011 2008-2011 2008-2011
Number of countries 64 64 64
Observations 256 256 256
Arellano Bond test of no second order 0.11 0.28 0.12autocorrelation in first-differencederrors (p-value)Notes: Dependent variable: Real GDP Growth, y/y percent change. Panel GMM estimation. Robust Standard Errors in parentheses. *** p<0.01, ** p<0.05, * p<0.1
Table 4. Global Crisis and Stimulus Period, 2008–11; GMM
Total Investment Manufacturing Nontradables(1) (2) (3)
Lagged GDP growth -0.0805 -0.0412 -0.0772(0.0803) (0.0949) (0.0809)
China spillover effect 0.0250*** 0.00889 0.0211***(0.00815) (0.00973) (0.00608)
Terms of trade -0.000646 -0.00199 -0.000725(0.00297) (0.00280) (0.00297)
Volatility of growth -1.363*** -1.119*** -1.388***(0.276) (0.332) (0.274)
World growth ex China 0.696*** 0.875*** 0.684***(0.0920) (0.109) (0.0916)
SAMPLE YEARS 2008-2011 2008-2011 2008-2011
Number of countries 64 64 64
Observations 256 256 256
Arellano Bond test of no second order 0.43 0.05 0.49autocorrelation in first-differencederrors (p-value)Notes: Dependent variable: Real GDP Growth, y/y percent change. Panel GMM estimation. Robust Standard Errors in parentheses. *** p<0.01, ** p<0.05, * p<0.1
Table 5. Robustness Check for Global Crisis and Stimulus Period, 2008–11; GMM
18
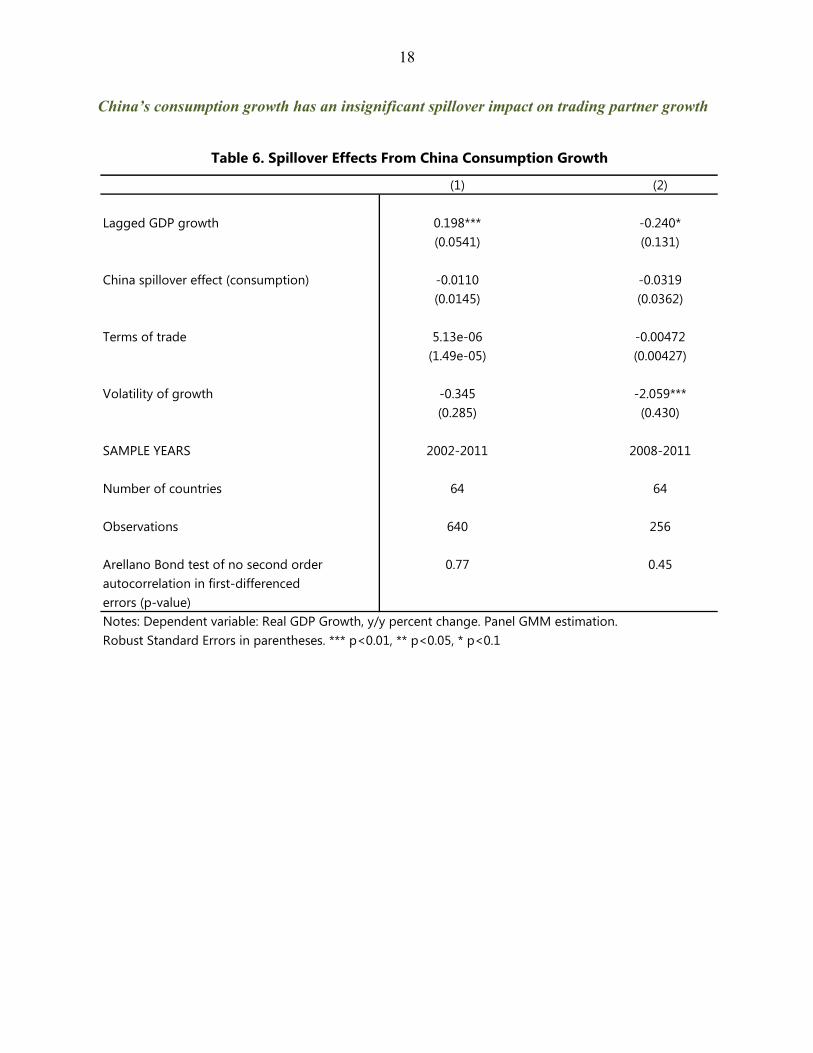
China’s consumption growth has an insignificant spillover impact on trading partner growth
(1) (2)
Lagged GDP growth 0.198*** -0.240*(0.0541) (0.131)
China spillover effect (consumption) -0.0110 -0.0319(0.0145) (0.0362)
Terms of trade 5.13e-06 -0.00472(1.49e-05) (0.00427)
Volatility of growth -0.345 -2.059***(0.285) (0.430)
SAMPLE YEARS 2002-2011 2008-2011
Number of countries 64 64
Observations 640 256
Arellano Bond test of no second order 0.77 0.45autocorrelation in first-differencederrors (p-value)
Robust Standard Errors in parentheses. *** p<0.01, ** p<0.05, * p<0.1
Table 6. Spillover Effects From China Consumption Growth
Notes: Dependent variable: Real GDP Growth, y/y percent change. Panel GMM estimation.
19
APPENDIX B
World Indicators: Industrial Production Real GDP
Argentina 0.54 0.11Australia* 0.02 0.00Brazil 0.25 0.05Canada** n.a. 0.06China 0.12 0.10France 0.17 0.02Germany 0.61 0.11India 0.28 0.05Indonesia* 0.15 0.05Italy 0.46 0.08Japan 0.55 0.12Mexico 0.34 0.09Russian Federation 0.25 0.05Saudi Arabia 0.09 0.02South Africa 0.30 0.05Korea 0.14 0.04Turkey 0.45 0.09UK 0.13 0.02US 0.21 0.03EU 0.19 0.03
PPP-weighted average 0.06
* Estimates for Australia and Indonesia are not statistically significant.** Canada's economic activity is represented by monthly real GDP index, all industries.
Table 1. Impacts one year after a 1-percent exogenous decline in China's real total FAI: Economic Activity Indicators
(in percent below baseline level)
Note: A one-standard-deviation decline in growth is equivalent to 2.5-percent decline in total FAI levels from baseline
20
World Prices:(In percent, year-on-
year)Metals 1.3Non-fuel primary commodities 0.7Zinc 2.2Nickel 1.8Lead 1.8Copper 1.6Iron ore 0.8Aluminum 1.0Rubber 0.6Silver 0.6Gold 0.2
2.5-percent decline in total FAI levels from baselineNote: A one-standard-deviation decline in growth is equivalent to
Table 2. Impacts one year after a 1-percent exogenous decline in China's real total FAI: Selected Commodity Prices
(in percent below baseline level)
21
Trade Indicators: Total Imports Total Exports
Argentina 2.24 0.35Australia 0.75 0.13Brazil 0.98 0.58Canada 0.91 0.87China 0.74 0.74France 0.69 0.85Germany 0.74 0.85India 0.42 0.79Indonesia 0.48 0.77Italy 1.01 1.15Japan 0.87 0.66Mexico 0.90 0.94Russian Federation 0.85 0.56Saudi Arabia 0.44 0.95South Africa 0.68 0.14Korea 0.65 0.74Turkey 0.93 0.52UK 0.93 0.90US 0.92 0.58EU 0.83 0.90
Weighted average 0.82* 0.76**
*Import-weighted. ** Export-weighted.
Note: A one-standard-deviation decline in growth is equivalent to 2.5-percent decline in total FAI levels from baseline
Table 3. Impacts one year after a 1-percent exogenous decline in China's real total FAI: Trade indicators
(in percent below baseline level)
22
Model's implied difference from
counterfactual, in percentActual change, in
percentCounterfactual change (without
China's investment drive), in percent
(A) (B) (B-A)
Zinc 75.1 16.5 -58.6Nickel 60.6 8.4 -52.2Lead 59.3 14.7 -44.7Copper 52.6 26.7 -25.9Aluminum 33.4 -6.9 -40.3Iron Ore 24.3 172.6 148.3Silver 20.3 135.1 114.8Rubber 18.4 84.3 65.9Gold 4.0 79.9 75.9
Table 4. Impact on metal prices from China's investment drive during 2008–11.
Note: The counterfactual scenario assumes China's investment-to-GDP ratio is maintained at end-2007 level during 2008-11, which translates to 34.4 percent lower FAI than actual level.