Embed Size (px)
Citation preview

Zuari Industries Ltd ACMIIL 1
C O M P A N Y R E P O R TAn ISO 9001:2008 Certified Company
INVESTMENT INTERRMEDIATES LTD.
1
We initiate coverage on Zuari Industries Ltd (ZIL) with “ACCUMULATE” recommendation and target price of ` 683, based on 5x FY13E EPS of ` 136.5. In FY10, ZIL had revenue of 69% and 26% respectively from manufacturing and trading of fertilizers. Similarly, Urea, DAP and other complex fertilizers contributed ~18%, ~23% and ~26% respectively. In trading business, ZIL mainly trades into MOP and DAP, which contributed 92% of the trading revenue in FY10. ZIL has diversified into several other segments like cement, seeds, financial services and furniture. We expect ZIL’s manufacturing revenue to grow at a CAGR of 9% during FY10-FY13E on back of capacity addition for complex fertilizers.
Investment rationale
● Capacity addition for complex fertilizers: ZIL plans to increase the complex fertilizer capacity by 0.3 million tonnes per annum, which is expected to commence production in Q1FY13. The additional capacity would increase production from 0.7 million in FY10 tonnes to 0.9 million tonnes in FY13E. Due to the debottlenecking activity, manufacturing volumes are expected to be firm during FY11E and FY12E.
● Urea feedstock conversion: ZIL is in the process of converting feedstock from naphtha to natural gas. ZIL has already signed a gas supply agreement with GAIL and expects to obtain gas from January 2013. The capex for the same is expected to be ~` 650 million. The feedstock changeover will lead to improvement in margin, working capital requirement and increase in the production of urea.
● Benefit from the government policies: ZIL is likely to benefit from NBS Policy introduced in April 2010. After NBS policy, the stand alone revenue for ZIL has increased by 48% YOY to ` 45,806 million in 9MFY11. In the same period, EBITDA and PAT increased by 15% and 7% respectively to ̀ 2,455 million and ̀ 1,457 million. In addition to this, ZIL is also increasing complex fertilizers capacity by 0.3 million by FY13E, which will help ZIL to improve margin and volumes.
● Advantage of Paradeep Phosphates: Zuari Maroc Phosphate Ltd (50:50 joint venture between ZIL and Maroc Phosphate of Moroco) has 80.45% stake in Paradeep Phosphate Ltd (PPL). PPL produces ~1.2 million tonnes of DAP and other complex fertilizers annually. PPL has a strong presence in the complex fertilizers industry with market share of ~13%. PPL meets ~50% of the phosphatic acid requirement internally and imports the balance. Also, the margins for PPL are higher compared to ZIL.
Valuation
ZIL’s revenue is expected to grow at CAGR of 15%, from ` 61,684 million in FY10 to ` 94,981 million in FY13E. EBITDA is expected to grow at a CAGR of 18% during FY10-FY13E on account of improvement in margin for complex fertilizers. The NBS policy on complex and pottasic fertilizers had a positive impact on the sector, as seen in the ZIL result for 9MFY11. We expect, EPS to grow at CAGR of 17% during FY10-FY13E from ̀ 86.1 to ̀ 136.5. At CMP of ̀ 650, stock is trading at 5.6x and 4.8x of FY12E and FY13E, EPS of ` 115.9 and ` 136.5 respectively. We initiate coverage on ZIL with an “ACCUMULATE” recommendation and a target price of ` 683, assigning PE multiple of 5x to FY13E EPS of ` 136.5.
Zuari Industries Ltd
AnalystDeepak [email protected]: (022) 2858 3411
07 April, 2011
A C C U M U L A T E
Key Data (`)
CMP 650
Target Price 683
Key Data
Bloomberg Code ZUAR IN
Reuters Code ZURI.BO
BSE Code 500780
NSE Code ZUARIAGRO
Face Value (`) 10
Market Cap. (` mn) 19,137
52 Week High (`) 895
52 Week Low (`) 557
Avg. Daily Volume (6m) 38,286
Beta (Sensex) 0.71
Shareholding Pattern (%) Dec - 2010
Promoters 34.4
Financial Institutions/Banks 8.3
Foreign Institutional Investors 0.2
Bodies Corporate 21.1
Individuals 9.1
Others 26.9
Total 100.0
(` mn) FY11E FY12E FY13E
Revenues 74,332 87,887 94,981
EBIDTA 5683 6773 7,471
EBIDTA Margin (%) 7.65 7.71 7.87%
PAT 2851 3411 4,020
PAT Margin (%) 4.06 4.10 4.45%
EPS (`) 96.8 115.9 136.5
Zuari Industries Ltd ACMIIL 2
C O M P A N Y R E P O R TAn ISO 9001:2008 Certified Company
INVESTMENT INTERRMEDIATES LTD.
1
Company background
Zuari Agro Chemicals Ltd. was incorporated in 1967 for manufacturing urea and it was promoted by K K Birla Group and US Steel Corporation. In 1998, Zuari Agro was renamed as Zuari Industries Ltd (ZIL). The company has four manufacturing plants in Goa for producing urea, DAP and other complex fertilizers. ZIL also trades in agricultural inputs such as seeds, specialty fertilizers and pesticides. ZIL has diversified into several other segments like cement, seeds, financial services and furniture. ZIL has marketing offices in the states of Goa, Maharashtra, Karnataka, Andhra Pradesh and Tamil Nadu. The company has over 2,000 dealers and 5,000 sub dealers that market its various brands of fertilizers and other agri inputs.
Manufacturing Plant
Product Plant Location Activity
Ammonia Goa The ammonia plant is based on ICI steam reforming process, where
naphtha is used as feedstock. The ammonia plant has an installed capacity
of 700 metric tonnes per day.
Urea Goa The urea plant utilizes a Mitsui Toatsu total recycle- C process having
capacity of 1,210 metric tonnes per day.
NPK A Goa NPK A plant manufactures complex fertilizers such as 28:28:0, 19:19:19,
18:46:0 and 14:35:14. It has installed capacity of 1,100 metric tonnes
per day.
NPK B Goa The plant manufactures DAP having installed capacity of 1,100 metric
tonnes per day.
Source: ACMIIL Research, Company
Business overview
Over the last five years ZIL derived on an average, 51%, 16% and 34% of the consolidated revenues from manufacturing activity, trading goods and its subsidiaries respectively. The consolidated revenue for ZIL has grown at CAGR of 15% to ` 61,684 million during FY06-FY10. However, the trading revenue has grown at a CAGR of 54% compared to CAGR of 9% for manufacturing goods in the same period.
On consolidated basis, urea, DAP and other complex fertilizers contributed ~18%, ~23% and ~26% respectively, during FY10. In trading business, ZIL mainly trades into MOP (Muriate of potash) and DAP, which contributes 92% of the trading revenue in FY10.
Consolidated revenue contribution (%)
Manufacturing Trading Subsidiaries & JVs
0%
10%
20%
30%
40%
50%
60%
70%
80%
90%
100%
FY06 FY07 FY08 FY09 FY10
53% 56% 57%42% 44%
8%10% 9%
26% 26%
39% 34% 34% 32% 31%
Source: Company, ACMIIL Research

Zuari Industries Ltd ACMIIL 3
C O M P A N Y R E P O R TAn ISO 9001:2008 Certified Company
INVESTMENT INTERRMEDIATES LTD.
1
Manufacturing
ZIL manufactures urea, pesticides, DAP and other complex fertilizers. In the manufacturing segment, urea contributed on an average 39% of the total manufacturing revenue during FY06-FY10, while complex fertilizers contributed 58% and pesticides contributed 3%.
Trading business
ZIL’s trading revenue has grown at a CAGR of 54% to ` 15,906 million during the last five years (FY06-FY10). DAP (Di-ammonia phosphate) and MOP (Muriate of potash) contributed 92% of the trading revenue in FY10. The rest was contributed by SSP (single super phosphate), SOP (sulphate of potash), pesticides, seeds, bio-phosphate and urea. Trading business is low margin business, where ZIL has an average operating margin of ~3% in past five years (FY06-FY10). ZIL markets its products under ‘Jai Kisaan’ brand in the states of Goa, Maharashtra, Karnataka, Andhra Pradesh, Kerala and some parts of Tamil Nadu. ZIL has a network of 2,100 dealers and 5,000 sub dealers, who markets its products.
Consolidated Revenue Break-up - FY10
UreaComplex
Trading-MOP
Others - Manufacturing
DAPTrading -DAP
Trading-Others
Others
18%
23% 26%
8%
16%2%2%5%
Source: Company, ACMIIL Research
Revenue breakup (%)
FY06 FY07 FY08 FY09 FY100%
10%
20%
30%
40%
50%
60%
70%
80%
90%
100%
OthersNPKDAPUrea
Source: Company, ACMIIL Research

Zuari Industries Ltd ACMIIL 4
C O M P A N Y R E P O R TAn ISO 9001:2008 Certified Company
INVESTMENT INTERRMEDIATES LTD.
1
Subsidiaries and JVsZIL has diversified into other business areas like cement, furniture, seeds, real estate, finance and infrastructure, through subsidiaries and joint ventures. ZIL derives on an average one third (34% in during FY06-FY10) of the consolidated revenue from other business areas (areas other than manufacturing and trading business of ZIL). The major contribution is from joint venture company i.e. Zuari Maroc Phosphate (Paradeep Phosphate), with 26% of consolidated revenue and 84% of total revenue from subsidiary and joint ventures.
Subsidiaries Revenue FY10
(` mn)
PAT FY10
(` mn)
(%) Holding Country
Zuari Seeds Ltd 305.9 2.5 100% India
Zuari Infrastructure & Developers Ltd 0 (0.0) 100% India
Indian Furniture Products Ltd 935.3 20.6 100% India
Simon India Ltd 2,661.9 298.0 100% India
Zuari Developers Ltd 0 (2.5) 100% India
Zuari Investment Ltd 105.4 22.2 83% India
Gulbarga Cements Ltd 0 (0.5) 100% India
Globex Ltd (UAE) 0 (0.1) 100% UAE
Zuari Fertilizers & Chemicals Ltd 0 (0.1) 100% India
Joint Ventures Revenue PBT (%) Holding Country
Zuari Maroc Phosphate Ltd 15,805.5 808.3 50% India
Zuari Indian Oil Tanking Ltd 77.0 29.8 50% India
Zuari Roten Speciality Fertilizer Ltd 110.2 5.4 50% India
Source: ACMIIL Research, company
Investment in subsidiaries companies
ZIL, as on March 2010, had invested ` 2,925 million into various businesses. ZIL invested into unrelated businesses like furniture, infrastructure, real estate, financial services and cement, which comprised of 32% (` 950 million) of the total investment and it invested 68% (` 1,975 million) into related businesses like seeds and fertilizers. Amongst the unrelated businesses, Zuari Investment, Indian Furniture Products and Simon India are profitable and they contribute ~0.2%, ~1.5% and ~4.3% respectively, to the total consolidated revenue in FY10.
Source: Company, ACMIIL Research
Trading revenue
-
4,000
8,000
12,000
16,000
20,000
24,000
28,000
0%
5%
10%
15%
20%
25%
30%
FY06 FY07 FY08 FY09 FY10
Trading revenue ( mn)` as % of consolidated revenue
31%
62%
6% 1%
DAP MOP Pesticides Others
Revenue break up in FY 10

Zuari Industries Ltd ACMIIL 5
C O M P A N Y R E P O R TAn ISO 9001:2008 Certified Company
INVESTMENT INTERRMEDIATES LTD.
1
Investment in subsidiaries as on March 2010
Name Company *Investment cost
as on FY10 (` mn)
% of total
investment
Zuari Maroc Phosphate Joint venture 1,798 61%
Zuari Investment Ltd Subsidiary 400 14%
Indian Furniture Products Subsidiary 230 8%
Zuari Seeds Subsidiary 142 5%
Zuari Indian Oil Tanking Joint venture 100 3%
Zuari Developers Subsidiary 83 3%
Gulbarga Cement Subsidiary 60 2%
Style Spa Furniture Associates 40 1%
Simon India Subsidiary 35 1%
Zuari Roten Speciality Fertilizer Joint venture 35 1%
Globex Subsidiary 1 0.05%
Zuari Infrastructure & Developers Subsidiary 1 0.02%
Zuari Fertilizers & Chemicals Subsidiary 1 0.02%
2,925
Source: ACMIIL Research, *According to ZIL’s standalone investment
Zuari Seeds Ltd – Zuari Seeds Ltd is engaged in production and marketing of hybrid seeds. The company has revenue of ` 306 million (contributing ~0.5% to the consolidated revenue in FY10) with PAT of ` 2.5 million as of FY10. The company exports its products to Bangladesh and other neighboring countries.
Zuari Infrastructure & Developers Ltd – Zuari Infrastructure and Developers Ltd is a 100% subsidiary of ZIL. The company was set up to develop SEZ for IT and ITES. The company is looking to enter into real estate and other related services.
Indian Furniture Products Ltd. – Indian Furniture Products Ltd is a 100% subsidiary of ZIL and is into manufacturing and sales of ready-to-assemble furniture (RTA). The company’s plant is located in Kakalur, near Chennai in Tamil Nadu. The factory has a floor area of 225,000 sq.ft and it has the capacity to produce 200,000 units of furniture annually. The company has revenue of ` 935 million (contributing ~1.5% to the consolidated revenue in FY10) with PAT of ` 21 million as of FY10.
Simon India Ltd – SIL is a 100% subsidiary of ZIL, which is engaged in engineering procurement and construction (EPC) activities. SIL was incorporated as a JV between Simon Carves, UK and ZIL. In 2003, it became a 100% subsidiary of ZIL. SIL had revenue of ̀ 2,662 million (contributing ~4% to the consolidated revenue in FY10) and PAT of ` 298 million in FY10. SIL has an order book of ` 1908.6 million and is currently executing several projects in India and overseas. The major projects under execution are,
● Ammonia abatement & Flare system project for SABIC in Saudi Arabia.
● Gypsum storage and handling project for Paradeep Phosphates Limited, Orissa.
● Dewatering project for Hindustan Zinc at Bhilwara.

Zuari Industries Ltd ACMIIL 6
C O M P A N Y R E P O R TAn ISO 9001:2008 Certified Company
INVESTMENT INTERRMEDIATES LTD.
1
Zuari Developers Ltd – ZDL is a 100% subsidiary of ZIL, which is engaged in the business of real estate. ZDL is in the process of developing 73 acres of land in Hulikeri, Mandya District, Karnataka for ZIL’s Zuari Garden City Project.
Zuari Investment Ltd- Zuari Investment Ltd is a 83.33% subsidiary of ZIL. Zuari Investment is a member of NSE and BSE for equity and F&O. Besides being a depository participant for both NSDL and CDSL, it is also empanelled with AMFI for the distribution of mutual funds. Zuari Investment is also a member of Over-The-Counter Exchange of India (OTCEI) and a category-II, registered and share transfer agent. It has 17 branches all over India and four wholly owned subsidiaries:
● Zuari Insurance Brokers Ltd. - It is an IRDA licensed direct broker for life and non-life segment.
● Zuari Commodity Trading Ltd. – It is a member of NCDEX and MCX.
● Zuari Financial Services Ltd. – It has submitted requisite papers for NBFC to RBI.
● Zuari Holding Ltd. – It was incorporated in Sept 2009 for making strategic investments.
With four subsidiaries, Zuari Investment is a one-stop shop for stock broking, depositary services, investment advisory, insurance broking and commodity broking. In FY10, Zuari Investment had total income of ̀ 106 million and PAT of ̀ 22 million. Gulbarga Cements Ltd – GCL was acquired by ZIL in 2008 and became a 100% subsidiary of the company. GCL owns limestone-mining lease of 989.89 hectares at Ferozabad in Gulbarga district of Karnataka. GCL has received clearance from the Ministry of Environment & Forests for setting up a cement plant (3.23 million tonnes annually) and a coal based power plant (50MW) in Gulbarga, Karnataka. The company is in the process of acquiring land for cement plant and various other approvals. Globex Ltd – GL is a 100% offshore subsidiary of ZIL. GL was set up to carry out general trading in fertilizers, commodities and investment in properties development. Zuari Fertilizers & Chemicals Ltd – ZFCL is a 100% subsidiary of ZIL which manufactures organic and inorganic fertilizers, particularly for farmers of Karnataka and Maharashtra. ZFCL has got an approval for setting up a 1.2 million tonnes urea manufacturing plant in the Belgaum district of Karnataka. ZFCL is in the process of taking various approvals from the state and central government.
Simon India – Revenue and PAT
PAT ( mn)`Revenue ( mn)`
-
500
1,000
1,500
2,000
2,500
3,000
(50)
-
50
100
150
200
250
300
350
FY06 FY07 FY08 FY09 FY10
Source: CMIE, company, ACMIIL Research
Zuari Industries Ltd ACMIIL 7
C O M P A N Y R E P O R TAn ISO 9001:2008 Certified Company
INVESTMENT INTERRMEDIATES LTD.
1
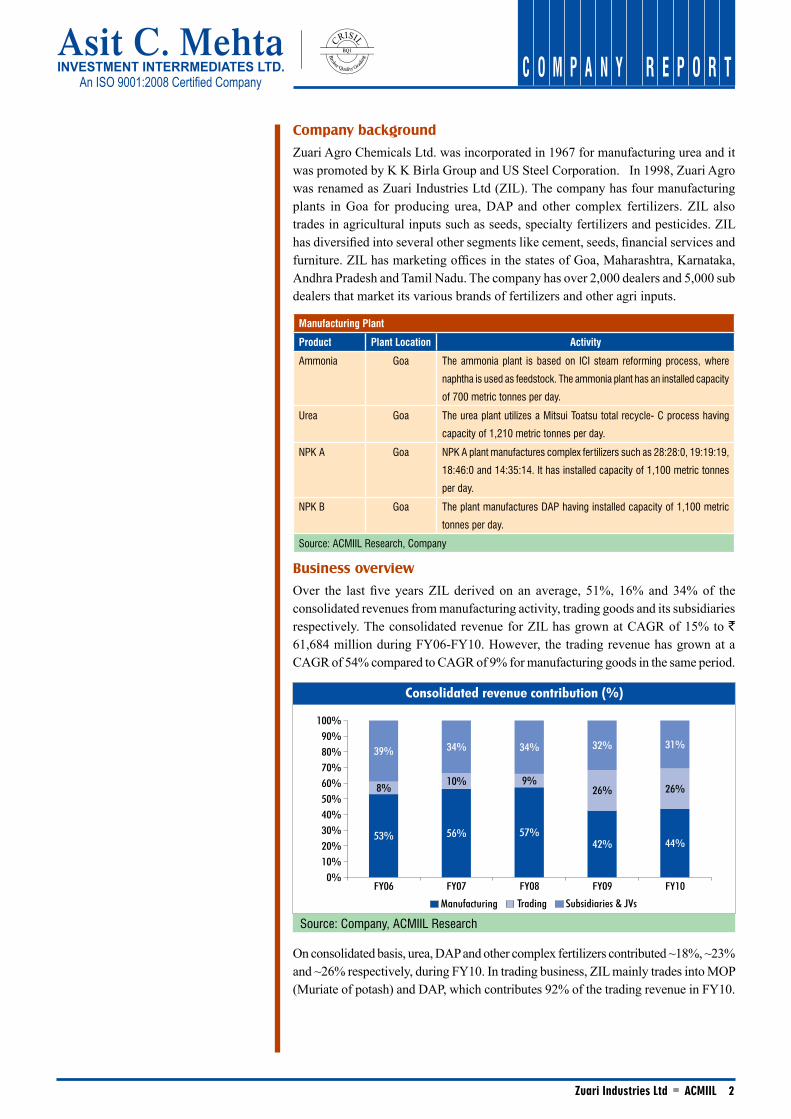
Joint VenturesZuari Maroc Phosphate Ltd – ZMPL is 50:50 joint venture between ZIL and Maroc Phosphore S.A, Morocco. ZMPL was set up to acquire majority stake in Paradeep Phosphates Ltd (PPL) under the scheme of disinvestment in 2002. PPL has manufacturing capacity of 0.72 million tonnes per annum in Orissa. In FY10, ZMPL had revenue of ̀ 15,805 million and PBT of ̀ 808 million (ZIL’s share). PPL produces DAP and other complex fertilizers along with sulphuric acid and phosphoric acid, which are important raw materials used in manufacturing phosphatic fertilizers. Zuari Indian Oil Tanking Ltd – ZIOTL is 50:50 joint venture between ZIL and Indian Oiltanking Ltd (joint venture between Indian Oil and Oiltanking GMbH, Germany). ZIOTL has terminalling facility for petroleum products like naphtha, motor spirit, high-speed diesel and kerosene. The terminal is located in Goa, linked with a 14km long pipeline at Mormugao Port. ZIOL provides terminalling services for naphtha to HPCL, BPCL, ZIL and other oil companies. Zuari Roten Speciality Fertilizer Ltd – ZRSFL is a 50:50 joint venture between ZIL and Rotem Amfert Negev Ltd, Israel. The company was incorporated in 2007 to produce water-soluble fertilizers (WSF) in India through the marketing and dealer network of ZIL. ZRSFL has a plant at Baramati, Maharashtra with the capacity to produce 24,000MT of WSF annually. ZRSFL will initially produce 19:19:19 grade of WSF. With respect to related business areas, we expect the benefit of these businesses to be realized after FY13E. With respect to the unrelated business areas, we believe that these were not established with a longer-term objective, which is reflected in their poor performance over the years. We expect that at the right opportunity, the company may exit out of these businesses.Following are ongoing investment in the unrelated businesses,
● Zuari Developers, is currently in the process of developing 73 acres of land at Hulkeri, Srirongapatnam Taluka, Mandya district, Karnataka for the Zuari Garden City Project.
● Similarly, in the cement business, Gulbarga Cement has its own limestone-mining lease of 989.89 hectares at Ferozabad in Gulbarga district of Karnataka. The company has received clearance from the Ministry of Environment and Forests for setting up a plant of 3.23 million tonnes per annum and a coal based power plant of 50MW. The expected capex for the same is ~` 12 billion. The company is in the process of acquiring land for setting up cement plants and various other approvals. We believe investment in the cement business is likely to get delayed, due to weaker demand scenario and as opportunity in the fertilizers business is higher after formulation of NBS (Nutrient Based Subsidy) policy.
Other unrelated businesses, their performances and outlook, ● Zuari Oil Tanking - The joint venture company’s revenue has grown at CAGR
of 2% only during FY06-FY10. ● Zuari Infrastructure Development – The Company which was incorporated with
an objective to set up and develop SEZ for IT and ITES, is still at a planning stage. ● Globex - An offshore subsidiary, Globex was established with view to carry
out trading in fertilizers and investment in property. The subsidiary is still at a planning stage.
● Indian Furniture Products - A 100% subsidiary company, whose revenue has grown at a CAGR of only 7% during FY06-FY10 to ` 993 million and started making profit in past three years i.e, PAT of ` 21 in FY10.
● Zuari Investment - An 83.33% subsidiary of ZIL, Zuari Investment is into the financial services business with revenue of ̀ 106 million and PAT of ̀ 22 million in FY10. We believe Zuari Investment is established for all the financial needs of Zuari Group itself.
Zuari Industries Ltd ACMIIL 8
C O M P A N Y R E P O R TAn ISO 9001:2008 Certified Company
INVESTMENT INTERRMEDIATES LTD.
1
Investment Rationale
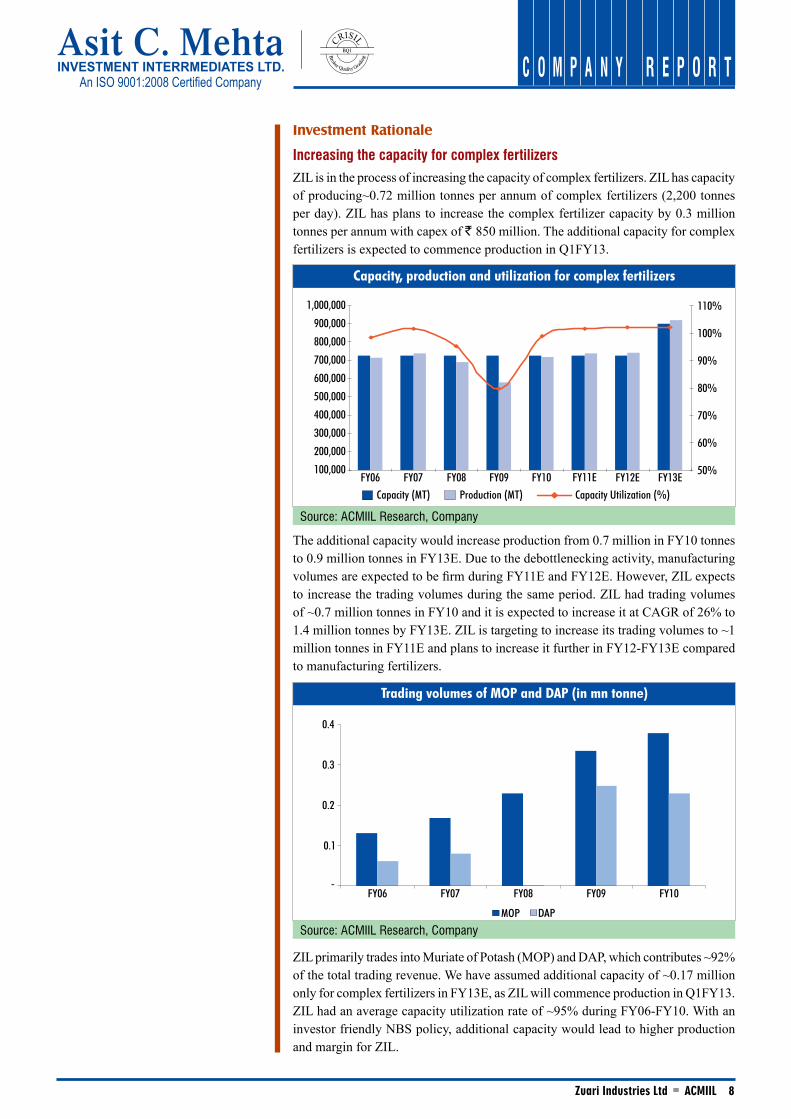
Increasing the capacity for complex fertilizers ZIL is in the process of increasing the capacity of complex fertilizers. ZIL has capacity of producing~0.72 million tonnes per annum of complex fertilizers (2,200 tonnes per day). ZIL has plans to increase the complex fertilizer capacity by 0.3 million tonnes per annum with capex of ` 850 million. The additional capacity for complex fertilizers is expected to commence production in Q1FY13.
The additional capacity would increase production from 0.7 million in FY10 tonnes to 0.9 million tonnes in FY13E. Due to the debottlenecking activity, manufacturing volumes are expected to be firm during FY11E and FY12E. However, ZIL expects to increase the trading volumes during the same period. ZIL had trading volumes of ~0.7 million tonnes in FY10 and it is expected to increase it at CAGR of 26% to 1.4 million tonnes by FY13E. ZIL is targeting to increase its trading volumes to ~1 million tonnes in FY11E and plans to increase it further in FY12-FY13E compared to manufacturing fertilizers.
ZIL primarily trades into Muriate of Potash (MOP) and DAP, which contributes ~92% of the total trading revenue. We have assumed additional capacity of ~0.17 million only for complex fertilizers in FY13E, as ZIL will commence production in Q1FY13. ZIL had an average capacity utilization rate of ~95% during FY06-FY10. With an investor friendly NBS policy, additional capacity would lead to higher production and margin for ZIL.
Capacity, production and utilization for complex fertilizers
100,000
200,000
300,000
400,000
500,000
600,000
700,000
800,000
900,000
1,000,000
50%
60%
70%
80%
90%
100%
110%
FY06 FY07 FY08 FY09 FY10 FY11E FY12E FY13E
Capacity Utilization (%)Capacity (MT) Production (MT)
Source: ACMIIL Research, Company
Trading volumes of MOP and DAP (in mn tonne)
MOP DAP
FY06 FY07 FY08 FY09 FY10-
0.1
0.2
0.3
0.4
Source: ACMIIL Research, Company

Zuari Industries Ltd ACMIIL 9
C O M P A N Y R E P O R TAn ISO 9001:2008 Certified Company
INVESTMENT INTERRMEDIATES LTD.
1
Urea feedstock conversionZIL is in the process of converting feedstock from current naphtha to natural gas. As per Ministry of Petroleum, gas produced from the KG basin will be available to South India from 2012. GAIL will be laying the Dabhol-Bangalore pipeline with connectivity to Goa, through which ZIL will be able to source the gas. ZIL has already signed a gas supply agreement with GAIL in November 2009 and expects to obtain gas at the plant from January 2013. ZIL has already commenced hardware work for the feedstock conversion from naphtha to gas and expects to complete it by March 2011. The capex for the same is expected to be ~` 650 million. The feedstock changeover will lead to improvement in margin, working capital requirement and increase in the production of urea. This conversion in turn will lead to,
● Margin improvement - Cost of producing one tonne of urea using naphtha is ~` 22,000-24,000/tonne, whereas using natural gas, the cost is ~` 10,500-12,000/tonne. This conversion will help improve margins in ZIL after FY13E.
● Increase in the production of urea (additional 50,000 tonnes per annum from current production of ~400,000 per annum) from the existing plant as current production is restricted by government because usage of naphtha as raw material. (Pre-1992 naphtha based urea plant are not allowed capacity utilization more than 100% - as mentioned in Third Stage Policy effective from October 2006 - till date )
● Urea producers are paid subsidy on the basis of their cost of production and thus a higher production cost (with use of naphtha) means higher subsidy payout for the government. The usage of gas for producing urea will lead to lower subsidy receivable from the government, which will improve the working capital cycle for ZIL.
In addition to urea feedstock conversion, ZIL is planning to set up a Greenfield gas based urea plant in Belgaum district of Karnataka with a capacity of 1.2 million tonnes under Zuari Fertilizers & Chemicals Ltd (a 100% subsidiary). These plans stem from the favorable urea policy of GOI. ZFCL has got Karnataka High Level Clearance Committee’s approval for the plant and it is in the process of getting various other approvals from the government. The management is expecting to acquire land and commence execution after the new urea policy announcement. The estimated capex for the plant is ` 45 billion. However, as this additional urea plant is still in the planning stage, we have not factored the same into our estimates.
ZIL had ~0.4 million tonnes of urea production capacity (1210 tonnes per day) in FY10. ZIL has an average capacity utilization of ~99%. We expect urea sales to grow at a CAGR of 1% during FY10-FY13E. Feedstock conversion would benefit ZIL with improved margins after FY13E.
Capacity, production and utilization for urea
Capacity Utilization (%)Production (tonnes)Capacity (tonnes)
350,000
360,000
370,000
380,000
390,000
400,000
410,000
420,000
90%
92%
94%
96%
98%
100%
102%
104%
106%
108%
FY06 FY07 FY08 FY09 FY10 FY11E FY12E FY13E
Source: ACMIIL Research, Company

Zuari Industries Ltd ACMIIL 10
C O M P A N Y R E P O R TAn ISO 9001:2008 Certified Company
INVESTMENT INTERRMEDIATES LTD.
1
Benefit from the government policies
ZIL is likely to be a beneficiary of government policies on urea as well as for complex fertilizers. Government introduced the NBS (Nutrient Based Subsidy) policy on April 2010, which is likely to benefit complex fertilizers players like ZIL. On a stand-alone basis, ZIL derived 35% of its revenue from manufactured complex fertilizers and 34% from traded complex fertilizers in FY10. On a consolidated basis, manufactured complex fertilizers and traded fertilizers respectively contributed to 49% and 26% of net revenue in FY10. After implementation of NBS policy, the stand alone revenue for ZIL has increased by 48% YOY to ̀ 45,806 million in 9MFY11. In the same period, EBITDA and PAT increased by 15% and 7% respectively to ` 2,455 million and ` 1,457 million. In addition to this, ZIL is also increasing complex fertilizers capacity by 0.3 million by FY13E, which will help ZIL to improve margin and volumes.
Similarly, government is likely to consider urea under NBS policy as announced in the Budget 2011. ZIL derives ~18% of its consolidated revenue from urea. The inclusion of urea under NBS policy would be beneficial for urea players. However, we believe that since urea is a heavily consumed fertilizer in India, the inclusion of urea under NBS policy may lead to increase in its prices. The GOI has to consider the interest of both farmers as well as manufacturers while announcing the urea policy. The earlier urea policy (expired on March 2010) was not producer friendly, as capacity expansion by the players were not taken into account. The capex for setting up 1.2 million tonnes Greenfield urea plant is ~` 4.5 billion with time period of ~35-40 months.
Advantage of Paradeep Phosphates
Zuari Maroc Phosphates Ltd (ZMPL) is a 50:50 joint venture company, established as a special purpose vehicle for acquiring of Paradeep Phosphate Ltd (PPL). Currently, ZMPL holds 80.45% stake in PPL while the government owns the balance. PPL has revenue of ` 31,511 million including subsidy for FY10. PPL was incorporated in 1981 as a joint venture of GOI and The Republic of Nauru and it became a PSU in 1993. In 2002, the company made huge losses, which led the GOI to divest in it. The management of the company is presently with the Zuari Group and the OCP (Office Chrifien Des Phosphates) Group of Morocco.
PPL produces ~1.2 million tonnes of DAP and other complex fertilizers annually. The plant is located in the port town of Paradeep in the district of Jagatsinghpur in Orissa and has capacity to produce 0.72 million tonnes of DAP per annum. The plant also produces intermediary products like phosphoric acid (installed capacity of 0.225 million tonnes) and sulphuric acid (installed capacity of 0.66 million tonnes), which are important raw materials for producing phosphatic fertilizers. PPL meets ~50%
Revenue contribution
% Contribution to ZILRevenue ( mn)`
0%
5%
10%
15%
20%
25%
30%
35%
-
5,000
10,000
15,000
20,000
25,000
30,000
FY06 FY07 FY08 FY09 FY10 FY11E FY12E FY13E
Source: ACMIIL Research, Company, Revenue is ZIL’s % stake (50%)

Zuari Industries Ltd ACMIIL 11
C O M P A N Y R E P O R TAn ISO 9001:2008 Certified Company
INVESTMENT INTERRMEDIATES LTD.
1
of the phosphatic acid requirement internally and imports the balance from countries like Morocco, Tunisia and Indonesia etc. The margins for PPL (average EBITDA margin of 8% during FY06-FY10) are higher compared to ZIL (average EBITDA margin of 5% during FY06-FY10). PPL has a strong presence in the complex fertilizers industry with market share of ~13%. PPL’s products are distributed over 16 states in India and it has selling arrangements made through its sister concerns i.e. ZIL and Chambal Fertilizers. PPL markets its products under ‘Navratna’ brand. We expect revenue and PAT to grow at CAGR of 9% and 10% during FY10-FY13E. DAP (~62%) and other complex fertilizers (~31%) contributed on an average ~93% of total revenue for PPL in FY10.
PPL is planning a capex of ̀ 5 billion over three years for capacity addition of complex fertilizers, a new sulphuric acid plant and a new captive power plant. However, as all of these are at a planning stage, we have not factored it into our valuation.
Strong balance sheetZIL has a strong cash balance on its balance sheet. As of March 2010, ZIL has cash balance of ` 2,498 million (` 85/share) and liquid investment of ` 722 million (` 25/share). Additionally, ZIL has major investments in Chambal Fertilizers (13.5%), Texmaco (3%) and Nagarjuna Fertilizers (1%) as on March 2010 with total cost of ` 913 million. The market value of these three investments workout be at ` 4,848 million (` 165/share).
Major Investment by ZIL
Investment Stake in
Company
Nos of
Shares (mn)
Cost (` mn) Cost/share
(`)
CMP (`) Market Value
(` mn)
Chambal Fertilizers 13.5% 56 713 13 82 4,580
Texmaco 3.2% 4 56 14 34 138
Nagarjuna Fertilizers 1% 4 143 33 30 129
913 4,848
Source: ACMIIL Research, company
According to the management, Zuari Maroc Phosphate (joint venture), Texmaco and Chambal Fertilizers are the major investments made by ZIL. These are core investments and are strategic in nature.
Revenue breakup
Ammonia DAP MOP NPK Scrap
0%
10%
20%
30%
40%
50%
60%
70%
80%
90%
100%
FY06 FY07 FY08 FY09 FY10P FY11E FY12E FY13E
Source: ACMIIL Research, Company, *consolidated revenue

Zuari Industries Ltd ACMIIL 12
C O M P A N Y R E P O R TAn ISO 9001:2008 Certified Company
INVESTMENT INTERRMEDIATES LTD.
1
Outlook for fertilizers
The demand/supply expectation for important fertilizers, urea and DAP.DomesticHistorically, the nutrient consumption was higher towards nitrogen (N) due to its availability, lower farm gate price and higher self-sufficiency of urea. However, over the years we have seen movement towards balance nutrient. The nutrient consumption ratio improved from 5.3:2.2:1 in 2005-06.to 4.6:2:1 in 2008-09. The nutrient consumption ratio is expected to decline to 5.2:2.2:1.0 in 2010-11P and in time reach to 4.3:2.2:1.4 in 2013-14P.
Like nutrient consumption, product consumption is also concentrated on urea, which is moving towards balanced usage of complex/potassic fertilizers. Urea’s share in total consumption declined in 2008-09 to 52.9% from 56.5% in 2007-08. Whereas, consumption of DAP increased to 18% from 16% in the same period. The consumption of urea is expected to increase to 30.8 million tonnes (50.4% share) in 2013-14P. DAP and other complex fertilizers are expected to grow to 11.9 million tonnes and 9.7 million tonnes respectively, during 2013-14P. UreaDue to lack of clarity from the government’s urea policy, urea capacity has always failed to match demand. The demand for urea increased to 27 million tonnes in 2008-09 from 22 million in 2005-06, whereas capacity has increased from 19.7 million tonnes to 20.3 million tonnes in the same period. Therefore, part of the urea demand was imported.
Fertilizer product consumption composition (million tonnes)
OthersOther ComplexDAPUrea
2005-06
2006-07
2007-08
2008-09E
2009-10P
2010-11P
2011-12P
2012-13P
2013-14P0%
20%
40%
60%
80%
100%
22 24 26 27 26 28 29 30 31
7 7 8 9 9 10 10 11 12
7 7 7 7 7 7 9 9 10
6 6 6 7 7 7 8 9 9
Source: FAI, Crisil
Outlook on urea demand-supply (million tonnes)
ImportsProductionConsumptionCapacity
2005-06
2006-07
2007-08
2008-09E
2009-10P
2010-11P
2011-12P
2012-13P
2013-14P0
5
10
15
20
25
30
35
2.14.7 6.9
5.7 4.5 5.8 6.2 6.3 6.6
Source: FAI, Crisil

Zuari Industries Ltd ACMIIL 13
C O M P A N Y R E P O R TAn ISO 9001:2008 Certified Company
INVESTMENT INTERRMEDIATES LTD.
1
The demand for urea is likely to recover from 2010-11E due to higher usage (as DAP is costlier then urea). Urea consumption is expected to grow CAGR of 3% during 2009E-2014P to 31 million tonnes from 27 million tonnes. Import is expected to grow at CAGR of 3% during the same period. DAPIn 2008-09, domestic DAP production declined as international price of DAP declined without a corresponding fall in raw material price of rock phosphate and phosphoric acid. Therefore, there was an increase in consumption of imports. India is largest importer of DAP in the world. Assuming normal rainfall, DAP consumption is expected to increase CAGR of 5% during 2008-09E to 2013-14P. The increase in the consumption is likely to be sustained by imports, which is expected to grow to 8 million tonnes during 2013-14P. DAP and the other complex fertilizers can be manufactured in same unit. Therefore, players are likely to produce other complex fertilizers to meet the supply.Price movement of fertilizers and raw materials
Source: Bloomberg, ACMIIL research, Urea - ICIS Pricing Urea Granular Bulk US Gulf FOB Spot Price, DAP - ICIS Pricing Phosphate DAP Bulk US Gulf FoB Spot Price
DAP ($/tonne)
0
200
400
600
800
1000
1200
1400
Jan-
00
Jan-
01
Jan-
02
Jan-
03
Jan-
04
Jan-
05
Jan-
06
Jan-
07
Jan-
08
Jan-
09
Jan-
10
Jan-
11
Urea ($/tonne)
0
100
200
300
400
500
600
700
800
900
Jan-
00
Jan-
01
Jan-
02
Jan-
03
Jan-
04
Jan-
05
Jan-
06
Jan-
07
Jan-
08
Jan-
09
Jan-
10
Jan-
11
Source: Bloomberg, ACMIIL research, Phosphoric acid - ICIS Pricing Phosphoric Acid P205 Fertilizer Grade India Cost & Freight Cash Price, Sulphur - ICIS Pricing Sulphur India Cost & Freight Price
Phosphoric acid ($/tonne)
Apr-
06
Oct
-06
Apr-
07
Oct
-07
Apr-
08
Oct
-08
Apr-
09
Oct
-09
Apr-
10
Oct
-10
-
500
1,000
1,500
2,000
2,500
Sulphur ($/tonne)
0
100
200
300
400
500
600
700
800
900
Jan-
00
Jan-
01
Jan-
02
Jan-
03
Jan-
04
Jan-
05
Jan-
06
Jan-
07
Jan-
08
Jan-
09
Jan-
10
Jan-
11

Zuari Industries Ltd ACMIIL 14
C O M P A N Y R E P O R TAn ISO 9001:2008 Certified Company
INVESTMENT INTERRMEDIATES LTD.
1
Expectations from policy changeDuring the past fifteen years, nitrogenous fertilizers contributed two third of the total nutrients consumption in India, a country where urea is a dominant nutrient. Urea accounts for more than 60% of total fertilizer subsidy over the past ten years. The consumption pattern in India suggests higher consumption of urea compared to complex fertilizers as it is cheaper and its impact is immediately visible. The pricing policy for urea (NPS-III) was applicable till Mar 2010 and government is in the process of formulating a new policy. Over the years, the government had not increased the farm gate price of urea, as it was largely consumed by Indian farmers, resulting in a huge amount of subsidy burden for the government. Additionally, higher feedstock prices, railway freight, electricity charges and international prices of feedstock further increased the subsidy burden.ExpectationThe aim of the government is to ensure availability of food at an affordable price. Therefore, the fertilizer sector is highly regulated. Over the past ten years, there was no significant increase in the farm gate price of urea and the difference between cost of production and farm gate price was paid as indirect subsidy to the farmers (e.g. Cost of producing one tonne of urea using natural gas is ~` 10,500-12,000/tonne, compared to farm gate price of ` 5,130/tonne). We expect government to bring in an investor friendly policy for urea, so as to reduce the subsidy burden. Government has already introduced NBS policy for complex fertilizers. Looking at the past history, the government cannot totally de-regulate urea, as it is largely consumed by farmers and it is a politically sensitive subject. The government is expected to de-control urea in a phased manner or bring it under the NBS, similar to the complex fertilizers.ImpactWe expect that total de-control of urea will increase the competition. Currently, there is limited competition in the urea sector, as it is driven by the government policies. The fertilizer sector is highly capital intensive. The average cost of setting up a Greenfield urea project is ~` 33,000/tonne based on natural gas. The average construction period for the same is close to 35-40 months. Also, feedstock requirement, technology use, adequate monsoons etc are important factors determining the profitability for urea players. All these factors lead to low margin, low investment by the urea players and higher subsidy burden for the government. In the de-control scenario, the government has to keep in mind the natural gas requirement from the urea players. Some of the players are still running plants based on naphtha due to inadequate pipeline facility for the natural gas, resulting in lower profitability and higher subsidy for government.
Source: Bloomberg, ACMIIL research, Ammonia - ICIS Pricing Ammonia US Gulf Cost & Freight Price
Naphtha ($/tonne)
Jan-
00
Jan-
01
Jan-
02
Jan-
03
Jan-
04
Jan-
05
Jan-
06
Jan-
07
Jan-
08
Jan-
09
Jan-
10
Jan-
11
-
200
400
600
800
1,000
1,200
1,400
Ammonia ($/tonne)
0
200
400
600
800
1000
1200
Jan-
04
Jan-
05
Jan-
06
Jan-
07
Jan-
08
Jan-
09
Jan-
10
Jan-
11

Zuari Industries Ltd ACMIIL 15
C O M P A N Y R E P O R TAn ISO 9001:2008 Certified Company
INVESTMENT INTERRMEDIATES LTD.
1
We expect that de-control of urea will be done in a phased manner and ZIL will benefit as urea contributes ~18% to its FY10 consolidated revenue. The players like Chambal Fertilizers, Nagarjuna Fertilizers and GNFC are likely to benefit most from the urea de-control as they contributed 52%, 35% and 11% respectively to the revenue in FY10.
SWOT
Strengths
● Diversified business areas
Opportunities
● Capacity expansion for urea and complex fertilizers
Weakness
● High dependence on imports for raw material
● Investments in unrelated business.
Threats
● Highly regulated industry
● In a highly politically sensitive space
Concerns
● Zuari is exposed to various types of risk in the fertilizer business. This includes raw material price movement (like high crude oil prices), change in the pricing policy and poor monsoons, which can weaken the demand.
● ZIL is in the process of changing its feedstock from naphtha to natural gas. Any delay in the process or supply of gas can put pressure on the profitability of the company.
● Zuari has invested into various unrelated businesses, which does not have any synergies with the company.
Peer Group
A urea producer’s performance depends on capacity additions, utilization, operational efficiency, capital structure and working capital management. As it is a highly regulated sector, competition between urea players is limited. However, in complex fertilizers, the producers compete on the basis of raw material sourcing, plant location and operational efficiency. Most of the complex fertilizer players focus on one or few grades with a large market share.
The fertilizer sector is highly regulated by the government, so growth in earnings is limited. Therefore, most of the players have diversified business areas.
Company Diversified business area
GSFC Chemicals
Tata Chemicals Soda ash, Cement
Nagarjuna Fertilizers Oil exploration, Power
Chambal Fertilizers Shipping, Textiles
Deepak Fertilizers Realty, Chemicals
Zuari Industries Financial services, Cement, Furniture, Realty
Source: ACMIIL Research

Zuari Industries Ltd ACMIIL 16
C O M P A N Y R E P O R TAn ISO 9001:2008 Certified Company
INVESTMENT INTERRMEDIATES LTD.
1
Peer group
FY11E FY12E FY13E D/E P/B ROE ROCE Market
Cap
TTM Fertilizers revenue
contribution
Company PE (x) (x) (x) (%) (%) (` mn) Revenue
(` mn)
EBITDA
Margin (%)
PAT Margin
(%)
(%)
Chambal Fertilizers 10.0 9.3 9.1 1.9 1.8 14.4 5.6 30,068 45,854 18% 7% 54%
*Coromandel International 12.8 10.5 9.3 1.3 4.1 32.7 19.1 79,590 77,627 15% 9% 100%
Deepak Fertilizers 7.6 6.3 5.4 0.8 1.3 15.4 9.3 12,520 14,602 25% 12% 33%
GNFC** 7.9 4.9 Na 0.3 0.7 24.1 21.4 14,368 25,102 12% 4% 61%
GSFC^ 4.3 3.6 Na 0.3 1.3 14.8 11.6 27,439 44,151 23% 13% 71%
Nagarjuna Fertilizers** 7.1 5.8 Na 3.3 1.1 4.1 2.1 11,668 28,259 16% 4% 100%
RCF 20.8 19.2 19.3 0.7 2.2 19.2 19.3 43,693 52,883 8% 4% 74%
*Tata Chemicals 11.3 9.7 8.3 1.1 1.7 17.5 8.4 83,203 61,950 16% 7% 44%
Zuari Industries^ 6.7 5.6 4.8 1.2 1.3 18.7 13.7 19,137 58,323 7% 4% 95%
Average 9.8 8.3 9.3 1.2 1.7 17.9 12.3 15% 7% 70%
Source: ACMIIL Research, Bloomberg, CMIE, *consolidated result, ^ACMIIL Estimates, ^TTM numbers are standalone. **Standalone annual numbers.
Financial Performance
During FY06-FY10, revenue for ZIL grew at a CAGR of 15%. ZIL’s revenue is expected to grow at a CAGR of 15% from ` 61,684 million to ` 94,981 million during FY10-FY13E. The growth is expected on account of higher trading volumes. The trading volumes for urea and complex fertilizer is expected to grow ~2x to ~1.4 million tonnes during FY10-FY13E.
Consolidated revenue and growth
YOY Change (%)Revenue ( mn)`FY08 FY09 FY10 FY11E FY12E FY13E
-
10,000
20,000
30,000
40,000
50,000
60,000
70,000
80,000
90,000
100,000
-40%
-20%
0%
20%
40%
60%
80%
100%
120%
140%
Source: ACMIIL Research
EBITDA and PAT margin
1.0%
3.0%
5.0%
7.0%
9.0%
11.0%
FY08 FY09 FY10 FY11E FY12E FY13E
EBITDA Margin PAT Margin
Source: ACMIIL Research

Zuari Industries Ltd ACMIIL 17
C O M P A N Y R E P O R TAn ISO 9001:2008 Certified Company
INVESTMENT INTERRMEDIATES LTD.
1
During the past five years (FY06-FY10), ZIL has an average EBITDA margin of ~7% and PAT margin of ~4.5%. The EBITDA is expected to grow at CAGR of 17% during FY10-FY13E on account of NBS policy. Similarly, PAT is expected to grow at a CAGR of 17% to ` 4,020 million in FY13E.
ZIL’s earning is dependent on the monsoon and availability of raw material (phosphoric acid for DAP and other complex fertilizers). We expect the normal monsoon and stable crude oil price to ZIL earning stable. Both ROE and ROCE is expected to improve during FY11-FY13E.
Valuation
ZIL’s revenue is expected to grow at CAGR of 15%, from ` 61,684 million in FY10 to ` 94,981 million in FY13E. EBITDA is expected to grow at a CAGR of 18% during FY10-FY13E on account of improvement in margin for complex fertilizers. The NBS policy on complex and pottasic fertilizers had a positive impact on the sector, as seen in the ZIL result for 9MFY11. We expect, EPS to grow at CAGR of 17% during FY10-FY13E from ` 86.1 to ` 136.5. At CMP of ` 650, stock is trading at 5.6x and 4.8x of FY12E and FY13E, EPS of ` 115.9 and ` 136.5 respectively. We initiate coverage on ZIL with an “ACCUMULATE” recommendation and a target price of ` 683, assigning PE multiple of 5x to FY13E EPS of ` 136.5.
ROE and ROCE (%)
0%
5%
10%
15%
20%
25%
30%
FY08 FY09 FY10 FY11E FY12E FY13E
ROE ROCE
Source: ACMIIL Research
PE Chart
Price 10 P/E 8 P/E 6 P/E 4 P/E 2 P/E
Apr-0
7
Jul-0
7
Oct-0
7
Jan-
08
Apr-0
8
Jul-0
8
Oct-0
8
Jan-
09
Apr-0
9
Jul-0
9
Oct-0
9
Jan-
10
Apr-1
0
Jul-1
0
Oct-1
0
Jan-
11-
200
400
600
800
1,000
1,200
Source: ACMIIL Research

Zuari Industries Ltd ACMIIL 18
C O M P A N Y R E P O R TAn ISO 9001:2008 Certified Company
INVESTMENT INTERRMEDIATES LTD.
1
Consolidated Financials
Particulars (` MN)
FY 2008 FY 2009 FY 2010 FY 2011E FY 2012E FY 2013E
Net Sales 39,686 88,988 61,684 74,332 87,887 94,981
Total Expenditure 36,511 86,455 59,039 70,135 82,705 89,145
Operating Profit 3,174 2,533 2,645 4,196 5,182 5,837
Other Income 907 3,354 1,936 1,487 1,591 1,634
EBITDA 4,082 5,887 4,581 5,683 6,773 7,471
Depreciation 399 385 404 454 492 557
EBIT 3,682 5,501 4,177 5,229 6,280 6,914
Interest 2,077 915 565 756 760 775
PBT 1,606 4,587 3,612 4,473 5,520 6,139
Taxes 441 1,058 931 1,452 1,917 1,916
PAT before minority interest 1,164 3,528 2,681 3,021 3,603 4,223
Share in associates -23 15 7 0 0 0
(-) Minority Interest 0 520 152 170 192 203
PAT after minority interest 1,141 3,024 2,536 2,851 3,411 4,020
Growth (%)
Net sales 124% -31% 21% 18% 8%
PAT 203% -24% 13% 19% 17%
Operating Margin 8.00% 2.85% 4.29% 5.65% 5.90% 6.15%
EBITDA Margin 10.28% 6.62% 7.43% 7.65% 7.71% 7.87%
PAT Margin 2.93% 3.97% 4.35% 4.06% 4.10% 4.45%
Source: ACMIIL Research
Balance sheet (` MN)
FY 2008 FY 2009 FY 2010 FY 2011E FY 2012E FY 2013E
Sources of Funds
Share capital 294 294 294 294 294 294
Reserve & Surplus 8,002 10,921 13,302 15,996 19,251 23,114
Shareholders Funds 8,297 11,216 13,596 16,291 19,545 23,409
Total Loans 11,475 9,890 16,890 16,290 14,290 11,790
Deferred Tax Liabilities 1,413 212 (135) (135) (135) (135)
Minority Interest - 665 744 915 1,107 1,309
Total 21,184 21,982 31,096 33,360 34,807 36,374
Application of Funds
Goodwill 1,886 1,930 1,963 1,963 1,963 1,963
Gross Block 8,272 8,497 8,877 9,377 10,077 11,077
(-) Accumulated Depreciation 4,904 5,283 5,634 6,088 6,580 7,137
Net Block 3,368 3,214 3,243 3,289 3,497 3,940
Capital WIP 58 288 531 731 931 931
Investments 4,262 9,344 8,651 8,651 8,651 8,651
Net Current Assets 11,611 7,206 16,708 18,726 19,766 20,889
Total 21,184 21,982 31,096 33,360 34,807 36,374
Source: ACMIIL Research

Zuari Industries Ltd ACMIIL 19
C O M P A N Y R E P O R TAn ISO 9001:2008 Certified Company
INVESTMENT INTERRMEDIATES LTD.
1
Cash flow (` MN)
FY 2008 FY 2009 FY 2010 FY 2011E FY 2012E FY 2013E
Net Profit before tax 1,606 4,587 3,612 4,473 5,520 6,139
Add
Depreciation 399 385 404 454 492 557
Interest charges 2,077 1,004 565 756 760 775
Profit before working capital changes 3,484 4,876 3,425 5,683 6,773 7,471
Change in Working Capital -689 5,542 -11,000 -116 -2,435 293
Cash flow after working capital 2,796 10,417 -7,575 5,567 4,338 7,763
(-) Direct Tax -173 -1,238 -946 -1,452 -1,917 -1,916
Net cash flow from operating activities 2,623 9,180 -8,521 4,115 2,421 5,847
Net cash flow from Investing activities 1,293 -7,907 4,542 -700 -900 -1,000
Net cash from Financing Activities -2,940 -2,943 5,669 -1,513 -2,916 -3,431
Net increase /(decrease) in cash 975 -1,670 1,691 1,902 -1,395 1,415
Op. balance of cash 1,128 2,104 434 2,498 4,400 3,005
Cl. balance of cash 2,104 434 2,498 4,400 3,005 4,420
Source: ACMIIL Research
Ratios
Profitability Ratio FY 2008 FY 2009 FY 2010 FY 2011E FY 2012E FY 2013E
EBITDA Margin 10.3% 6.6% 7.4% 7.6% 7.7% 7.9%
PAT Margin 2.9% 4.0% 4.3% 4.1% 4.1% 4.4%
RONW 13.8% 27.0% 18.7% 17.5% 17.5% 17.2%
ROCE 18.6% 26.1% 13.7% 16.1% 18.6% 19.6%
Per Share Ratios
EPS 38.8 102.7 86.1 96.8 115.9 136.5
CEPS 52.3 115.8 99.9 112.2 132.6 155.4
BV per share 281.8 381.0 461.8 553.3 663.9 795.1
Valuation Ratios
P/E (x) 6.7 5.6 4.8
P/CEPS (x) 5.8 4.9 4.2
P/BV (x) 1.2 1.0 0.8
EV/EBIDTA 5.5 4.5 3.5
Capital Structure Ratios
Debt/Equity 1.4 0.9 1.2 1.0 0.7 0.5
Current Ratio 2.2 1.2 2.4 2.2 2.2 2.1
Turnover Ratios
Inventory turnover 7.2 9.9 9.4 9.2 9.7 10.0
Debtors turnover ratio 5.0 5.8 6.0 6.2 6.1 6.1
Creditors turnover ratio 4.1 2.7 5.3 4.8 5.2 5.0
Fixed asset turnover 11.8 27.7 19.0 22.6 25.1 24.1
Source: ACMIIL Research

Zuari Industries Ltd ACMIIL 20
C O M P A N Y R E P O R TAn ISO 9001:2008 Certified Company
INVESTMENT INTERRMEDIATES LTD.
1
Disclaimer:
This report is based on information that we consider reliable, but we do not represent that it is accurate or complete and it should not be relied upon such. ACMIIL or
any of its affiliates or employees shall not be in any way responsible for any loss or damage that may arise to any person from any inadvertent error in the information
contained in the report. ACMIIL and/or Promoters of ACMIIL and/or the relatives of promoters and/or employees of ACMIIL may have interest/position, financial or
otherwise in the securities mentioned in this report. To enhance transparency we have incorporated a Disclosure of Interest Statement in this document. This should
however not be treated as endorsement of the views expressed in the report
Disclosure of Interest Zuari Industries Ltd
1. Analyst ownership of the stock NO
2. Broking Relationship with the company covered NO
3. Investment Banking relationship with the company covered NO
4. Discretionary Portfolio Management Services NO
This document has been prepared by the Research Desk of Asit C Mehta Investment Interrmediates Ltd. and is meant for use of the recipient only and is not for
circulation. This document is not to be reported or copied or made available to others. It should not be considered as an offer to sell or a solicitation to buy any security.
The information contained herein is from sources believed reliable. We do not represent that it is accurate or complete and it should not be relied upon as such. We
may from time to time have positions in and buy and sell securities referred to herein.
SEBI Regn No: BSE INB 010607233 (Cash); INF 010607233 (F&O), NSE INB 230607239 (Cash); INF 230607239 (F&O)
Notes:
Institutional Sales:
Ravindra Nath, Tel: +91 22 2858 3400
Kirti Bagri, Tel: +91 22 2858 3731
K.Subramanyam, Tel: +91 22 2858 3739
Email: [email protected]
Institutional Dealing:
Email: [email protected]