Embed Size (px)
Citation preview
FOR INSTITUTIONAL/WHOLESALE OR PROFESSIONAL CLIENT USE ONLY | NOT FOR RETAIL DISTRIBUTION
The road not takenPitfalls and opportunities in infrastructure investing
INVESTMENTINSIGHTS

MICHAEL CEMBALEST
Chairman of Market and Investment Strategy J.P. Morgan Asset Management
Michael Cembalest is Chairman of Market and Investment Strategy for J.P. Morgan Asset
Management, a global leader in investment management and private banking, with $1.6 trillion
of client assets under management worldwide (as of December 31, 2013). He is responsible for
leading the strategic market and investment insights across the firm’s Institutional, Funds and
Private Banking businesses.
Mr. Cembalest is also a member of the J.P. Morgan Asset Management Investment Committee
and a member of the Investment Committee for the J.P. Morgan Retirement Plan for the firm’s
more than 250,000 employees.
Mr. Cembalest was most recently Chief Investment Officer for the firm’s Global Private Bank, a
role he held for eight years. He was previously head of a fixed income division of Investment
Management, with responsibility for high grade, high yield, emerging markets and municipal bonds.
Before joining Asset Management, Mr. Cembalest served as head strategist for Emerging
Markets Fixed Income at J.P. Morgan Securities. Mr. Cembalest joined J.P. Morgan in 1987 as a
member of the firm’s Corporate Finance division.
Mr. Cembalest earned an M.A. from the Columbia School of International and Public Affairs in
1986 and a B.A. from Tufts University in 1984.

F O R E W O R D
O u r I n v e s t m e n t I n s i g h t s s e r i e s f o c u s e s on the building
blocks of managing money. Some of our reports deal with the way we construct
portfolios, while others address opportunities we see in the various countries
and markets that we invest in. From time to time, we also look at the asset
management industry and the value it can provide for institutional investors.
In this paper, we focus on the next phase in the maturation of infrastructure investing. The need for private capital to finance essential investments in transportation, energy, telecommunications and services is critical. Institutional investors find infrastructure’s stable long-term yields, diversification and inflation protection benefits attractive, but want to avoid the pitfalls encountered in its initial phase. We review the missteps of past infrastructure projects and show how they can be used to inform a set of guiding principles we view as essential to successfully navigating the road ahead.
We hope that the research and insights presented here will help you to anticipate and realize the investment opportunities available in the next phase of infrastructure investing.

ABOUT
J.P. MORGAN GLOBAL INSTITUTIONAL
ASSET MANAGEMENT
J.P. Morgan Global Institutional Asset Management is a global leader in investment
management, dedicated to creating a strategic advantage for institutions by connecting clients
with J.P. Morgan professionals. With roughly 800 investors on the ground in more than 30
countries, the firm seeks to deliver first-class investment results to some of the world’s most
sophisticated organizations, including corporate pension plans, endowments, foundations,
insurance companies, sovereign wealth funds and government-affiliated institutions.
J.P. Morgan Global Institutional is distinguished by its capital markets knowledge, global
investment expertise and the long-term, proactive partnerships it establishes with clients.
Our innovative strategies span equity, fixed income, real estate, private equity, hedge funds,
infrastructure and asset allocation. J.P. Morgan Global Institutional is part of J.P. Morgan Asset
Management, which has assets under supervision of $2.3 trillion and assets under management
of $1.6 trillion (as of December 31, 2013).

1Executive summary
5Infrastructure pitfalls, past and present
14 Designing an infrastructure investment strategy for the long run—guiding principles
16Opportunities: Principles in practice
20Appendices
I: Infrastructure performance from Preqin
II: Infrastructure performance from the Center for Private Equity Research
III: Natural gas peaker plants and the dispatch curve
IV: The problem with accreting swaps applied to infrastructure projects
24Sources
T A B L E O F C O N T E N T S

E X E C U T I V E S U M M A R Y

J.P. MORGAN ASSET MANAGEMENT 1
The road not taken: Pitfalls and opportunities in infrastructure investingInfrastructure grabs a lot of headlines. In preparation for this year’s G20 meetings, participants cited a 2013 report from McKinsey1 that referred to $57 trillion of infrastructure invest-ment needed globally by 2030. Given the state of sovereign finances, public entities face challenges financing this on their own. Funding mechanisms such as gas tax revenues help, but are typically insufficient. As a result, governments have increased their reliance on private investment to build infrastructure assets.
The asset class has a lot to offer institutional investors.2 We review returns on infrastructure investing in Appendices I and II; both show attractive returns, particularly for the best-perform-ing projects and managers. However, the return dispersion among projects and managers is extremely wide (according to one analysis, wider than on venture capital and private equity).
Infrastructure is still a relatively recent addition to institutional portfolios. Current allocations among U.S. pension funds, for example, are roughly 1%–2% but expected to grow to 5% or more in the coming years (see sidebar on page 4). In our view, attractive core and core-plus infrastructure investment oppor-tunities are available to institutional investors interested in
1 Infrastructure Productivity: How to Save $1 Trillion a Year (McKinsey Global Institute, January 2013).
2 Institutional investors can access infrastructure through separately managed accounts and through listed funds. There are 30 to 40 listed vehicles globally, a number that has been roughly constant since 2007 (see 2014 Preqin Global Infrastructure Report [Prequin, January 2014]).
their potential for long-term stable cash flows, diversification and inflation protection. However, as the historical dispersion of returns among projects and managers suggests, investment selection must be based on more than just the societal need for a given project and a government willing to sponsor its partial or complete privatization. While there’s a clear link among infrastructure investing, rising GDP and employment growth, what matters to investors are adequate protections and sufficient returns on capital.
What’s the best approach? Infrastructure investing requires an acute understanding of the political process, the business cycle, natural resource risks and very localized competitive dynamics. In this paper, we review some of the recent pitfalls that infrastructure investors have faced and how these experi-ences can be used to develop guiding principles that work over the long run to help ensure that institutional investors’ objectives are met. We apply these principles to selected infrastructure sectors to illustrate the role they play in evalu-ating potential investment opportunities. This approach may end up deviating from many commonly used strategies. As such, it is often the road not taken, but we believe it is the right one.

2 THE ROAD NOT TAKEN: PITFALLS AND OPPORTUNITIES IN INFRASTRUCTURE INVESTING
E X E C U T I V E S U M M A R Y
Designing an infrastructure investment strategy for the long run—guiding principlesOur broad review of pitfalls experienced in infrastructure proj-ects over the past decade (detailed on pages 5–13) informs our list of investment principles for institutions seeking core/core-plus infrastructure exposure (see pages 14–15). To summarize, we believe investors should assess the extent to which the funds that they invest in adhere to the following principles:
• Generally confine investment to established assets supplying essential services, with clear visibility around user demand.
• Avoid excessive leverage and financial engineering.
• Investments in markets, regulatory environments and jurisdictions without track records of private investment need to be priced correctly to account for the additional risk.
• Fund managers should concentrate on areas where they bring a deep knowledge of industry dynamics as well as the region’s political, economic and competitive complexities.
• Establish control positions to ensure that the fund manager’s intended strategy for the asset is implemented.
• Negotiate agreements that foster a sharing of investment risks among stakeholders and ensure adequate compen-sation for bearing those risks.
• Provide diversified opportunities across region, vintage year and infrastructure type while being cautious of investments in market sectors where current popularity can lead to overpricing of infrastructure assets.
Opportunities: Principles in practiceTo illustrate the approach, we review these basic principles and a few select observations on potential opportunities (discussed at greater length on pages 16–19):
Transportation projects have often suffered from rose-colored estimates of traffic volumes, reliance on the completion of subsequent development initiatives or the use of excessive leverage. There may, however, be select opportunities in new projects and in the unwinding of prior ones that are now dis-tressed. To take advantage of these opportunities while addressing some of the pitfalls of the past, our teams are working on a new approach, which seeks to foster greater alignment of interests and a sharing of risks among operators, investors and state and local governments.
We see substantial capital needs in the North American power sector and the broader energy value chain as the shale gas story continues to evolve. Evaluation of investment opportuni-ties in midstream pipelines (to deliver natural gas from explo-ration and production [E&P] sites to regional distributors) requires a thorough understanding of end-user demand for natural gas. Negotiating long-term contracts that entail a return on invested capital can help to mitigate some of the risks involved with varying decline rates and production costs.
We expect to see continued robust shale gas production, which is likely to sustain the cost advantage of natural gas, support demand growth and offer opportunities in natural gas transmission assets (for delivery of natural gas from treatment plants to homes and businesses). Rising asset valuations, however, offer a cautious note. As a result, our understanding of competitive and relative cost dynamics suggests that investment in existing local distribution company platforms may be the preferred investment option.

J.P. MORGAN ASSET MANAGEMENT 3
E X E C U T I V E S U M M A R Y
The need for private capitalInfrastructure investing, relative to other real asset categories, such as real estate, is clearly still maturing and has its own set of challenges, given its ties to the public sector. However, the public need for private capital has never been greater (Exhibits 1 and 2), and the public sector will need to find ways of compensating private investors. With the right approach, institutional investors can potentially benefit from investments with long-term, stable cash flows that are tied to economic growth, increasing energy demand and continued increases in urbanization.
The world needs a lot more infrastructure spending...EXHIBIT 1: ACTUAL VS. REQUIRED INFRASTRUCTURE SPENDING
Source: McKinsey; data as of January 2013.
0
10
20
30
40
50
60
Actual infrastructure spending1996–2013
Required infrastructure spending2013–2030
USD
trill
ions
...but the public sector may have trouble financing it on its ownEXHIBIT 2: OECD GOVT. NET DEBT, % OF GDP, INCL. STATE AND LOCAL
Source: OECD; data as of year-end 2013.
10
20
30
40
Perc
ent 50
60
70
80
1969 1973 1977 1981 1985 1989 1993 1997 2001 2005 2009 2013

4 THE ROAD NOT TAKEN: PITFALLS AND OPPORTUNITIES IN INFRASTRUCTURE INVESTING
E X E C U T I V E S U M M A R Y
A QUICK SNAPSHOT OF INFRASTRUCTURE INVESTING
INFRASTRUCTURE IS A CATCHALL TERM THAT REFERS TO A WIDE VARIETY OF FIXED ASSETS USED IN TRANSPORTATION, ENERGY, TELECOMMUNICATIONS AND SERVICES
Many institutions are interested in infrastructure due to its diversification benefits, potential for inflation protection and sta-ble long-term yields. Project revenues are derived from a variety of tolling arrangements, regulated utility models and long-term contracts for power plants. Despite these benefits, the transition to a world of greater private ownership has been a gradual one.
To date, Europe has taken the lead, with countries like the UK and Portugal financing 20%–30% of infrastructure through public-private partnerships (PPPs). In the U.S., this approach has been less widely used, in part due to the heavy historical reliance on the municipal bond market to finance infrastructure (in which case taxpayers retain the risks and rewards of ownership); PPPs in the U.S. have been growing but from low levels.* From 2010 to 2013, private infrastructure funds around the world invested $30 billion–$40 billion of equity per year, with aggregate deal values of $200 billion to $300 billion. They have recovered since the recession but are not markedly above pre-recession levels. Current pension fund infrastructure allocations are 1%–2%, with around two-thirds of plans below their long-term targets. Preqin surveys indicate that many of the underweight pension plans intend to increase allocations. In addition, Bain & Co. believes that while the majority of institutional investors allocate less than 5% to infrastructure today, they will allocate 5% or more in the coming years.
INFRASTRUCTURE OVERVIEW
Source: J.P. Morgan.
Sector SubsectorsRegulated assets Water and wastewater, electricity transmis-
sion, natural gas and power distributionTransportation Toll roads, airports, seaports, rail, parking
Power generation Conventional (coal, natural gas), renewable
Midstream Pipelines, storage, gathering/processing
Communications Cell towers, cable networks, satellite systems
Social infrastructure Hospitals, schools, courts/prisons
ESTIMATED AGGREGATE VALUE OF INFRASTRUCTURE DEALS COMPLETED GLOBALLY BY PRIVATE FUNDS
Source: Preqin Infrastructure Group; data as of year-end 2013.
0
50
100
150
200
250
300
2007 2008 2009 2010 2011 2012 2013
USD
billi
ons
BREAKDOWN OF INFRASTRUCTURE DEALS BY REGION
Source: Preqin Infrastructure Group; data as of year-end 2013.
Perc
ent
0
10
20
30
40
50
60
70
80
90
100
2008 2009 2010 2011 2012 2013
Other
Lat Am
Australasia
Asia
N. America
Europe
* Public-Private Partnerships to Revamp U.S. Infrastructure (The Hamilton Project, February 2011).
J.P. MORGAN ASSET MANAGEMENT 5
Infrastructure pitfalls, past and presentOwning fixed assets with a regulated rate of return set by local and federal governments seems like a straightforward exercise in capital deployment, and it is tempting to compare it to investments in office buildings, retail malls, warehouses and hotels. However, unlike real estate assets, which exist mostly in the domain of the private sector, there is often substantial public sector involvement in the permitting, rate setting, ownership and oversight of infrastructure assets. That’s what makes them different and why an investment approach cannot simply be based on concepts like cap rates, usage volumes and occupancy levels.
Sometimes investment strategies are best defined by the para-meters of what not to do and what to avoid. With that in mind, we review some challenges that prior infrastructure projects faced.3 After doing so, we lay out some of our guiding principles regarding institutional investment in infrastructure assets.
Pitfall #1: Rose-colored transportation forecasts and the unknown price of convenience
Pitfall #2: Project success too dependent on subsequent development initiatives
Pitfall #3: Price swings, supply shocks, contract terms and regulatory issues affecting energy
Pitfall #4: Too much financial engineering and/or leverage
Pitfall #5: Overly optimistic renewable energy projections (using wind as an example)
3 Please see Sources (pages 24–25) for references related to the projects discussed in this section.
One thing to keep in mind as you read through these case studies is that they are a mix of cash flow-based investments related to existing assets and “greenfield” development projects whose ultimate demand patterns were unknown at purchase. They are also a mix of projects with stable cash flows and more-volatile ones, with the latter related to merchant energy and greenfield transportation. These kinds of projects are often referred to as “core” assets but sometimes turn out to be “non-core” due to mispriced risk, poorly understood market demand and excessive leverage. Institutions seeking core infrastructure exposure need to ensure that the funds they invest in are confined to established assets supplying essential services, with clear visibility around user demand and appropriate leverage. These core assets typically exhibit low usage volatility, economic insensitivity and inflation-protection characteristics.

6 THE ROAD NOT TAKEN: PITFALLS AND OPPORTUNITIES IN INFRASTRUCTURE INVESTING
Exhibit 4 looks at revenues for U.S. toll roads, also as a percentage of the original forecast; the results are just as grim. This is not unique to the U.S.: A 2010 study of 14 Australian toll roads found that traffic volumes in the first year of operation averaged only 55% of the forecast level.4
On the following page, we look briefly at three toll road projects, and at what went wrong.
4 David Hensher (University of Sydney) and Zheng Li (University of Sydney). Toll Roads in Australia: An Overview of Characteristics and Accuracy of Demand Forecasts (NCHRP Synthesis Report, 2010).
I N F R A S T R U C T U R E P I T F A L L S , P A S T A N D P R E S E N T
Pitfall #1: Rose-colored transportation forecasts and the unknown price of convenienceToll road economics are often based on the notion that drivers will pay for convenience: a toll in exchange for a faster route and less gas usage. In a world full of data (credit card and mortgage prepayments and defaults, customer buying prefer-ences, insurance policy mortality), you might think this is easy to calibrate. Unfortunately, it hasn’t been. Exhibit 3 shows the distribution of actual traffic volumes across different coun-tries, measured as a percentage of the original traffic forecast. Even in countries with prior toll road experiences, the average is well below 100%.
A measure of rose-colored infrastructure investingEXHIBIT 3: ACTUAL TRAFFIC VOLUMES AS A % OF INITIAL FORECAST
Source: Robert Bain, Error and Optimism Bias in Toll Road Traffic Forecasts (University of Leeds, 2009).
0.0 0.2 0.4 0.6 0.8 1.0 1.2 1.4 1.6
Perc
ent
81%58%
Actual/forecast tra�c
Countries withprior toll roads
Countries withoutprior toll roads
Performance of U.S. toll roads opened in 1986-2004EXHIBIT 4: ACTUAL REVENUE AS A PERCENTAGE OF PROJECTED RESULTS FROM OPERATIONS
Source: National Cooperative Highway Research Program (NCHRP); data as of 2006.
Note: In each of the five years, each dot represents a different project.
0
20
40
60
80
Perc
ent 100
120
140
160
Year 1 Year 2 Year 3 Year 4 Year 5
ESTIMATING THE VALUE OF TIME (VoT)Macro-level models of toll road demand are popular because of their low cost and easy implementation. They typically estimate the number of vehicle trips based on economic activity, land use patterns and demographics, and then map each trip to a mode of transportation and route. However, such models are primarily designed to forecast traffic volumes on a regional level rather than for specific roads and have poorly judged the price points at which drivers have been willing to pay more to save time/fuel. Micro-level models have gained traction in the academic community and in practice; time will tell if they are able to improve traffic forecasting accuracy. These micro-level
models attempt to better capture the value of time (VoT), which is the value drivers assign to their travel time. Macro-level models segment the population by income and assign each bracket a VoT. In contrast, micro-level models argue that VoT varies within income brackets and even on an intrapersonal level, depending on the purpose of the trip and time of day. The central principle: Travel demand is derived from activity demand (e.g., why you are going from place A to place B). Using this framework, forecasters conduct household-level analysis (mail-in surveys, studies of GPS/smartphone activity) and create population-wide distributions to estimate overall toll road demand.

J.P. MORGAN ASSET MANAGEMENT 7
I N F R A S T R U C T U R E P I T F A L L S , P A S T A N D P R E S E N T
SH-130 Highway, Austin, TexasIn 2007, a 50-year concession was signed by investors to design, build, finance and operate a 41-mile section of the SH-130 bypass around Austin. It was built in response to increasing truck traffic entering Texas from Mexico as well as congestion on alternate routes; the project was noted for having some of the highest speed limits in the country at 80–85 mph. However, traffic volumes have fallen short: The road is often not the fastest route, it runs through undeveloped areas, and motorists reportedly find the tolls excessive ($8 for cars and $29 for commercial trucks) compared with free 65-mph alternatives. In October 2013, Moody’s downgraded the project’s debt to Caa3 due to “substantially weaker than forecasted traffic and revenue performance” and “a slow-growth profile rather than a steep ramp-up as would have been expected.” The Wall Street Journal reported that the project’s owners have hired restructuring lawyers.
Summary: Poor underwriting of driver cost/time/ speed preferences.
M6 Toll, Birmingham, UKThe M6 Toll is Britain’s first tolled highway, completed in 2003. A greenfield project with a 50-year concession, the tollway was designed to alleviate congestion on the busiest section of the free-to-use M6 motorway around Birmingham—and link London more easily to northern industrial centers and Scotland (Exhibit 5). While the original forecast for the M6 Toll called for 72,000 vehicles per day, traffic volumes peaked at only 55,000 vehicles per day in 2006 and have at times fallen as low as 25,000 (35% of the initial forecast). The reason: Many drivers are opting to use the free M6 motorway, which is operating at 2x capacity. This has resulted in suggestions that the toll road should be nationalized and the toll revoked to alleviate conges-tion on the free M6 motorway. The toll road’s finances are struggling: Its debt to cash-flow multiple of 26x compares with 3x to 7x for global toll road portfolios. In November 2013, the
owners sought to restructure with creditors. Note: The debt multiple includes the impact of an accreting interest rate swap, which is now out of the money and effectively adds debt to the project (see Appendix IV for more details).
Summary: Misjudgment of driver preferences for speed and convenience.
Cross City Tunnel, Sydney, AustraliaThe Cross City Tunnel opened in 2006 and averaged 30,000 vehicles per day in 2007, a third of the 89,000 projected when the deal was financed. Forecasts were based on overly optimistic assumptions about traffic growth and drivers’ attitudes toward toll roads. The original forecasts appear to have disregarded the project’s engineers, who capped the tunnel’s maximum traffic capacity at 50,000 to 70,000. Despite this apparently finite cap, the project’s consultants projected 100,000 vehicles per day for 2016 and 200,000 for 2034. Why were they wrong? Consultants apparently mis-judged the number of feeder routes into the tunnel. The project defaulted within 16 months of opening and defaulted again in 2013.
Summary: Consultants should never override engineers.
EXHIBIT 5: M6 TOLL, BIRMINGHAM, UK
Source: J.P. Morgan. For illustrative purposes only.
to Edinburgh
M5
M42
to LondonBirmingham
M6 Toll
M6 Toll
M6free motorway
M6 free motorway

8 THE ROAD NOT TAKEN: PITFALLS AND OPPORTUNITIES IN INFRASTRUCTURE INVESTING
Pitfall #2: Project success too dependent on subsequent development projectsSometimes infrastructure projects rely on the completion of other, related public or private sector assets. If they are not completed on time, the value of the infrastructure project is at risk.
Northwest Parkway, Denver, ColoradoIn 2007, local authorities signed a $603 million, 99-year con-cession agreement to operate the nine-mile piece of highway (Exhibit 6). Part of the $603 million package: $40 million paid by investors if the remaining part of the beltway was completed and a further $60 million if it was completed by 2020.
The deal’s price represented one of the largest multiples of revenues ever paid for a U.S. toll road (90x 2006 revenues), reflecting the confidence the buyers had in the eventual com-pletion of the beltway (red dotted line) and increased traffic on the Northwest Parkway. Despite political assurances that the beltway would be completed by 2020, recent city council reports reveal that it is behind schedule and running into financing and design obstacles; its eventual completion is in doubt. Current traffic levels on the Northwest Parkway are only 17% of capacity.
Summary: Discount politicians’ assurances regarding things they cannot control.
South Bay Expressway, San Diego, CaliforniaThe project: a 10-mile express toll road in Southern California, designed to facilitate travel between San Diego and the Mexican border (Exhibit 7). Built as part of a public-private partnership, the expressway took 13 months longer than anticipated and was completed in 2007. Projected 2009 traffic
volumes of 60,000 vehicles per day were not met; actual volumes have ranged from 23,000 to 29,000. The project’s primary failures appear to be overly optimistic projections regarding suburban development outside San Diego and an underestimation of competition from free-to-use roads that connect to major Mexican traffic arteries. An additional head-ache: a $40 million litigation with contractors as a result of construction delay disputes. Citing lower than expected traffic and toll revenue, the expressway filed for Chapter 11 bank-ruptcy protection and was eventually purchased at a price representing a haircut of approximately 30% for the lenders and a complete write-down of equity.
Summary: There’s a big difference between building infrastructure linking established commercial and residential areas and infrastructure reliant on subsequent development on either end.
EXHIBIT 7: SOUTH BAY EXPRESSWAY, SAN DIEGO, CALIFORNIA
Source: J.P. Morgan. For illustrative purposes only.
805
5
5
8
75
San Diego
Pacific OceanMEXICO
CALIFORNIA
South Bay Expressway
905
94
125
54
EXHIBIT 6: NORTHWEST PARKWAY, DENVER, COLORADO
Source: J.P. Morgan. For illustrative purposes only.
Denver International
Airport
E-470 tollway
Free-to-use road
Northwest Parkway
Unbuilt beltwayportion
70 70
70
225
25
25
76
76 270
E470
E470
36
6
I N F R A S T R U C T U R E P I T F A L L S , P A S T A N D P R E S E N T

J.P. MORGAN ASSET MANAGEMENT 9
Pitfall #3: Price swings, supply shocks, contract terms and regulatory issues affecting energyEnergy investing offers perhaps the most attractive returns in the infrastructure universe, but it is accompanied by the most complicated set of regulatory, technology, business cycle and production risks. The supply shocks resulting from the shale revolution will reverberate for decades and are changing the landscape for energy investments. The examples below deal with coal and natural gas plants used for both baseload and peaking power; we review the unique risks and opportunities of owning natural gas peaker plants in Appendix III.
Longview coal power plant, West VirginiaLongview came online in 2011 as one of the last coal plants built and financed by private investors. The plant sits on a rich coal mine, an advantage that lowers both fuel and operating
costs. When the project was planned in 2006, coal was much cheaper per British thermal unit (Btu) than natural gas (see Exhibits 8 and 9 and box below). This was before the shale revolution; the U.S. planned on importing natural gas from Qatar and Russia at the time. Given this backdrop and the per-ceived strong competitive position of coal, the project’s owners only secured a five-year contract for 50% of the plant’s capacity. Then came the shale revolution at Barnett, Marcellus and Haynesville, which led to the 2009–2011 price collapse in natu-ral gas relative to coal. Add in some plant-specific construction problems at Longview, and the result was that natural gas became a preferred alternative for local utilities. Longview filed for Chapter 11 bankruptcy in August 2013 after not being able to re-contract the plant.
Summary: Energy supply shocks like the shale gas revolution reduced the long-standing margin of safety for coal plant owners across the industry.
PRICES PER BTU UNDERSTATE THE COST ADVANTAGE OF USING NATURAL GAS (VS. COAL) TO GENERATE ELECTRICITYIn other words, don’t confuse the price of the fuel’s heat content with the economics of converting it into electricity. Just because coal and natural gas prices may be equal on a Btu basis, it doesn’t mean that the economics of generating coal-fired electricity are the same as generating electricity from natural gas, particularly when newer gas plants are involved. Coal plants (and older natural gas plants) have slower ramp-up rates and other operating drawbacks that translate into lower electricity production efficiency rates. When such plants burn coal in large boilers to generate steam for steam turbogenerators, their efficiency rates are 35% (for older plants) to 41% (for the newest plants). However, combined cycle natural gas plants burn natural gas in gas turbines and then use waste gas to power steam turbogenerators. Their combined efficiency rates are 60% (1.5x better). As a result, the EIA cites a 1.5x ratio of natural gas to coal prices as the rate at which the economics of electricity generation are similar.
USD/
MM
Btu
0
3
6
9
12
15
2002 2004 2006 2008 2010 2012 2014
Natural gas
Coal
Ope
ratio
n be
gins
Bank
rupt
cy fi
led
Plan
ning
The consequences of the shale revolution: the collapse in the price of natural gas relative to coalEXHIBIT 8: U.S. NATURAL GAS AND COAL PRICES
Source: Bloomberg; data as of February 2014.
Ratio
1x
2x
3x
4x
5x
As per the EIA, below this line natural gas is more cost-e�cient than coal
Ope
ratio
n be
gins
Bank
rupt
cy fi
led
Plan
ning
2002 2004 2006 2008 2010 2012 20140x
6x
EXHIBIT 9: NATURAL GAS/COAL PRICE RATIO*
Source: Bloomberg, Energy Information Administration (EIA); data as of February 2014.
*Both natural gas and coal prices are expressed as USD per million Btu.
I N F R A S T R U C T U R E P I T F A L L S , P A S T A N D P R E S E N T

10 THE ROAD NOT TAKEN: PITFALLS AND OPPORTUNITIES IN INFRASTRUCTURE INVESTING
Panda Energy, TexasIn 2010, a private company secured financing to construct three natural gas-fired combined cycle power plants at a projected cost of approximately $1,000 per kilowatt (kW), for completion in 2014. These costs appear notably higher than what the company could have paid for existing capacity (Exhibit 10). It could be the case that the company was forecasting higher electricity prices in Texas based on growing demand and a declining reserve margin in the Electric Reliability Council of Texas (ERCOT), as well as the closure and retirement of coal plants. Another possibility is that the company believed that ERCOT would shift from “production pricing” (plants only get paid for actual energy produced) to “capacity pricing” (plant owners also get paid for their capacity to produce, which covers their fixed costs; ERCOT is the only regional power system in the U.S. without capacity pricing). In regions subject to capacity pricing, power generators are reimbursed for construction costs when building new plants but not for premiums paid for existing ones. As a result, if ERCOT became a capacity market, plant construction costs could have been more easily reim-bursed than acquisition costs of new plants. However, ERCOT has not abandoned its production pricing approach,5 and the company will have to compete in merchant power markets with a very high cost base. In September 2012, S&P expressed concerns about the project’s high future cash flow volatility in the absence of stabilizing power purchase agreements or capacity market payments.
Summary: It’s risky to assume that Texas will become like the rest of the U.S.; establish convincing evidence of future regulatory shifts.
5 The likelihood of a switch to capacity pricing in Texas may have gone down, given statements from ERCOT indicating that it sees the Texas power grid as having a comfortable margin of supply for the next few years (i.e., no need to reserve capacity).
Source: UBS, SEC filings, FactSet, Bloomberg, Sparkspread; data as of August 2013.
New builds can be much more expensive than buying existing capacityEXHIBIT 10: SELECT COMBINED CYCLE NATURAL GAS PLANT TRANSACTIONS IN TEXAS, 2010–2013
Date announced
Name of asset(s)
Capacity (megawatts)
Deal size (USD
millions)USD/
kW2010 Panda Energy plant
construction 1,800 1,800 1,000
4/16/2010 Colorado Bend Energy Center, Quail Run
1,124 365 325
10/26/2010 Oyster Creek Unit VIII 430 100 233
10/27/2010 Freestone Energy Center
257 215 836
12/30/2010 Quail Run 573 185 323
1/13/2011 Guadalupe 1,142 351 307
5/12/2011 Wolf Hollow 720 305 424
6/24/2011 Odessa-Ector 1,135 335 295
3/14/2012 Rio Nogales 800 480 600
8/4/2012 Bosque 800 432 540
4/2/2013 Gregory Power 411 244 565
I N F R A S T R U C T U R E P I T F A L L S , P A S T A N D P R E S E N T

J.P. MORGAN ASSET MANAGEMENT 11
U.S. portfolio of gas and coal power plants, with hydroelectric plants mixed inOne large natural gas plant in this regional portfolio was located in New Hampshire, a region where capacity payments only extend for one year. As a result, it can be difficult to obtain financing, given lender concerns around sufficient utilization of the asset. The buyers decided to improve the cash flow sta-bility of the plant by entering into a complex agreement in which they received a fixed payment stream and paid out a volatile one that was based on both electricity prices (their revenues) and natural gas prices (their input costs). If the pay-ments made by the plant owners are similar to their net cash flows from operations, they have effectively converted their business from a volatile one to a more stable one that banks would finance.
This makes sense except for one flaw: The natural gas price that was incorporated into this swap arrangement was different from the natural gas price the plant actually paid in its normal operations. The latter was based on prices in New England for gas the plant actually purchased, while the former was linked to prices for gas in the Mid-Atlantic region. At the time this swap arrangement was designed, the two prices had been moving in tandem. Unfortunately, three years into the transaction, regional natural gas prices diverged sharply, a by-product of different regional supply constraints and the proximity to Marcellus and other shale deposits. Higher natural gas prices caused a decline in the company’s cash flow from operations that was not offset by lower swap payments to its counterparty because the reference gas price did not rise nearly as much, as shown in Exhibit 11. The portfolio suffered losses when the buyers unwound the swap at the end of 2013.
Summary: Power plant valuations can be heavily impacted by poorly structured hedges subject to basis risk across regions.
Southwest Natural Gas Generation, Western U.S. In April 2008, investors acquired a portfolio of natural gas power plants. The region where the plants are located (Western U.S.) operates on a long-term bilateral contract basis in which power plants with such contracts receive both fixed payments on their capacity and the right to sell their megawatt hours (MWh) of electricity to the grid at the prevailing spot price. As a result, non-contract holders are subordinated in the queue when selling MWh. The buyers’ average portfolio contract life was 6.8 years, around three-quarters of which expired in 2012–2013. The owners anticipated stable electricity demand from surrounding areas and environmental pressure leading to accelerated coal plant retirements, both of which would presumably result in their contracts being extended. Coal plants went offline as expected, but electricity demand fell sharply due to the recession and remained weak (Exhibit 12). When the bilateral contracts expired, they were not renewed, and the owners suffered on two fronts: Their capacity payments ended, and existing contract holders supplied all the electricity needed by local utilities. Following contract expiration, some plants operated on a merchant basis before being re-contracted, while others remained uncontracted. As a result, the owners only received minimal dividends and had to contribute additional equity.
Summary: Given business cycle risks, diversification of contract lengths in regions subject to bilateral contracts and queuing is critical.
0
5
10
15
20
25
30
35
2009 2010 2011 2012 2013 2014
USD/
MM
Btu
New England nat gas (actual gas purchase price)
Mid-Atlantic nat gas(reference gas price)
Swap
agr
eem
ent e
nter
ed
Swap
unw
ound
Regional differences in natural gas prices can create substantial basis risk for hedgersEXHIBIT 11: REGIONAL DIFFERENCES IN NATURAL GAS PRICES
Source: Bloomberg; data as of February 2014.
6,100
6,500
6,900
7,300
7,700
8,100
2004 2006 2008 2010 2012 2014
Meg
awat
ts
Port
folio
acqu
isiti
on
Colorado Public Service forecast
Bulk
of
cont
ract
sex
piry
The risk of contract maturity concentrationEXHIBIT 12: COLORADO ELECTRICITY PRODUCTION: ACTUAL VS. PROJECTED MEGAWATTS
Source: Public Service Company of Colorado; data as of year-end 2012.
I N F R A S T R U C T U R E P I T F A L L S , P A S T A N D P R E S E N T

12 THE ROAD NOT TAKEN: PITFALLS AND OPPORTUNITIES IN INFRASTRUCTURE INVESTING
Pitfall #4: Too much financial engineering and/or leverageIn this section, we review projects whose revenues and operating cash flows were within the realm of initial expectations but whose financing structures caused serious problems.
Indiana Toll RoadA 75-year concession was given to the Indiana Toll Road Concession Company in 2006. The financing package con-tained a nine-year, interest-only bullet loan hedged with a 20-year accreting interest rate swap whose rates were preset at 3% to 11.3% by 2023. As with most accreting swaps, the owners expected to refinance it before its coupons rose to high levels. While revenue and operating cash flow improved substantially from 2006 to 2011 (Exhibit 13) and traffic patterns were stable, total project debt nearly doubled, from $3.4 billion at acquisition to $6.0 billion in 2011, a consequence of declin-ing interest rates creating mark-to-market losses on the swap (see Exhibit 14 and Appendix IV). This prevented an early refi-nancing from happening, and increased the project’s debt load and effective interest cost. While debt to cash flow multiples remained stable, they were elevated at 40x cash flow. The project’s owners in all likelihood expected to see significant declines in debt multiples over time as the project’s revenues grew (debt to cash flow would have been 20x in 2012 if not for the swap—still high, but more manageable).
Summary: Financial engineers can create more problems than civil engineers.
Diversified global marine and rail terminal operating company Sometimes infrastructure managers purchase interests in operating companies and do not just confine portfolios to indi-vidual projects. In one instance, a manager acquired a 49% stake in a diversified company that owns 210 terminal facilities and rail operations around the world (Exhibit 15). The price was 20x cash flow (on the high side for a minority stake), and debt was 13x cash flow. The price reflected the presumed ben-efits of global revenue diversification. From 2006 to 2012, there was a 7% annual decline in revenue—weak but not always catastrophic. In this case, the financing required increased coupons if debt to cash flow multiples rose, which resulted in higher costs just when the project could not afford them. Under new owners, the deal was refinanced more con-servatively: shorter-term debt, less leverage and more equity.
Summary: Geographic diversification is great, but globalization has increased the correlation of country growth patterns; if highly leveraging global infrastructure portfolios, do so with caution.
72
74
76
78
80
82
60
80
100
120
140
160
180
200
2007 2008 2009 2010 2011 2012
Total revenues Ebitda Ebitda margin
USD
mill
ions
Ebitd
a m
argi
n (%
)
Revenues and gross margins have grown as expectedEXHIBIT 13: INDIANA TOLL ROAD ANNUAL REVENUE
Source: Statewide Mobility Partners, Macquarie; data as of year-end 2012.
30x
40x
50x
60x
0
1
2
3
4
5
6
7
2006 2007 2008 2009 2010 2011
Long-term debt Swap liability Debt multiple
USD
bill
ions
Debt
to c
ash
flow
mul
tiple
The negative impact from an accreting swapEXHIBIT 14: INDIANA TOLL ROAD ANNUAL DEBT METRICS
Source: Statewide Mobility Partners; data as of year-end 2011.
EXHIBIT 15: COMPARISON OF FINANCING APPROACHES
Source: J.P. Morgan.
2007 2014
Loan to value 65%–75% 55%–60%
Equity 25%–35% 40%–45%Cost of financing L + 130 bps & step-up
based on Ebitda multipleL + 220–250 bps
Debt coverage ratio minimum before default
1.0x–1.1x 1.4x
I N F R A S T R U C T U R E P I T F A L L S , P A S T A N D P R E S E N T

J.P. MORGAN ASSET MANAGEMENT 13
Pitfall #5: Overly optimistic renewable energy projections (using wind as an example)Wind farm economics are affected by government subsidies, state requirements for renewable energy production, raw materials pricing (e.g., rare-earth metals such as neodymium, used for high-performance magnets), technological improve-ments vs. operational degradation, ongoing operating and maintenance expenses, involuntary curtailment6 and the variability of the wind itself. It can be (and is) done profitably, but there are risks involved.
Exhibit 16 shows projected and actual capacity factors (actual generation as a percentage of potential nameplate capacity) at two locations, in Ohio and New York. This is by no means a representative sample, and these are far from optimal wind locations. However, they indicate how wind variability7 and technological issues can result in less electricity than consultants originally laid out to investors and utilities.
6 Curtailment: when wind farm electricity is available but not drawn upon due to grid congestion or instability, or the need to maintain minimum operating levels on thermal generators or hydroelectric facilities.
7 The power of wind is a function of wind velocity cubed; as a result, a 10% reduction in wind speed results in a roughly 30% reduction in wind electricity generation. A recent study cited in Der Spiegel notes 2.5% annualized returns on 1,150 wind farm investments in German closed-end funds, a function of less wind speed than projections, higher than expected O&M expenses, and fees.
On wind variability, Exhibit 17 shows the distribution of wind capacity factors from a U.S. Department of Energy (DoE) study based on vintage year.8 Operating and maintenance (O&M) costs can vary as well; according to the DoE, annual project O&Ms vary from $5 to $20 per MWh.
To be clear, wind has plenty of positive momentum; it repre-sented 40% of all U.S. capacity additions in 2012. GE reportedly has new turbine technology that can deliver capacity factors as high as 50%, and more-recent projects are already delivering capacity factors of 40%–50% in areas with Class 5–7 wind speeds. The same is true for Danish offshore wind farms, many of which post capacity factors in the mid-40s. Part of the improvement is related to increases in rotor diameters and tower heights, designed to improve productivity. Even without subsidies, some wind projects generate electricity at levelized costs that are now competitive with combined cycle natural gas plants. Nevertheless, one should not assume that the results generated by a nationwide portfolio of 446 wind farms will be consistently realized on much smaller subsets. As shown, there can be a very broad range of outcomes.
8 While rotor diameters and tower heights are increasing, the DoE notes that many newer wind farms are built in less optimal wind locations, offsetting part of the technological productivity improvement.
Instances of overly optimistic wind projectionsEXHIBIT 16: PROJECTED VS. ACTUAL WIND CAPACITY FACTORS— ACTUAL GENERATION AS A % OF POTENTIAL
Source: EIA, American Municipal Power, New York State Energy Research and Development Authority (NYSERDA); data as of year-end 2013.
22
26
30
Perc
ent
34
38
Projected 2013 2012 Projected ActualBlue Creek Wind—Ohio New York Wind—Class 3–4
34.7
29.8
26.7
31
2927
25
Individual wind project performance can differ substantially from industry averagesEXHIBIT 17: WIND CAPACITY FACTORS BY YEAR OF INSTALLATION
Source: Lawrence Berkeley National Laboratory, U.S. Department of Energy; data as of August 2013.
0
10
20
30
40
50
60
98–99
23776
00–01
241,514
02–03
361,908
04–05
273,417
06
201,640
07
344,931
08
768,513
09
959,561
10
484,731
11
635,854
Power generation-weighted average Individual projects
Actu
al g
ener
atio
nas
a %
of p
oten
tial
Vintage:
# projects:Megawatts:
I N F R A S T R U C T U R E P I T F A L L S , P A S T A N D P R E S E N T

14 THE ROAD NOT TAKEN: PITFALLS AND OPPORTUNITIES IN INFRASTRUCTURE INVESTING
Designing an infrastructure investment strategy for the long run—guiding principlesThe observed pitfalls highlight the ways in which infrastructure is different from other fixed assets, such as real estate. The operational and governance risks are more complex and need intense focus both during the planning stages and throughout an asset’s life. The inherently political nature of infrastructure
provides an additional layer of complexity across geographies and sectors that needs to be managed and priced in from a risk perspective. With the recent pitfalls in mind, we believe the following basic principles emerge as being best suited for infrastructure investing over the long run.
“The missteps of past infrastructure projects can be used to inform
a set of guiding principles we view as essential to successfully
navigating the road ahead.”

J.P. MORGAN ASSET MANAGEMENT 15
D E S I G N I N G A N I N F R A S T R U C T U R E I N V E S T M E N T S T R A T E G Y F O R T H E L O N G R U N — G U I D I N G P R I N C I P L E S
G U I D I N G P R I N C I P L E S F O R I N F R A S T R U C T U R E I N V E S T I N G
1. Control positions, acquired either through majority equity percentages or through governance rights, help ensure that the investor’s strategy for the asset is implemented and prevent it from being “hijacked” in favor of other constituencies.
2. Assets that fall outside the range of “core” and “core-plus” introduce development and operational risks that have to be actively managed and priced correctly. Core/core-plus generally refers to existing assets with stable income streams that can be used as a platform for growth and new construction. Pure greenfield project risks are often underpriced due to both construction risk and the lack of visibility on eventual usage and demand. Some of these greenfield project risks can be mitigated through partnerships with public entities that allow private investors to earn a predetermined rate of return on invested capital that is backed by a revenue stream not tied to the usage of the new asset (i.e., a sales tax).
3. Assets that rely excessively on back-ended appreciation in exchange for lower yields are typically mispriced and require overly optimistic localized growth forecasts to make sense.
4. Markets, regulatory environments and jurisdictions without proven track records showing how they implement reform, resolve disputes, handle pressure from citizens and legislators, and treat investors require adequate additional compensation.
5. Leverage and financial engineering (e.g., accreting interest rate swaps) should be kept in check.
6. Renewable energy projects often benefit from production tax credits, feed-in tariffs and minimum renewable standards set at the state level. These policies are inherently variable and create risks around resale value for existing projects. However, such projects can be attractive if they have long-term contractual agreements with utilities.
7. Diversify by region, vintage year and infrastructure type, particularly when there are regions or sectors that are generating too much investor interest. Europe is currently generating a lot of interest from investors. Global institu-tional investors have made funds of $1 trillion available for investment in European infrastructure over the next 10 years, typically focusing on Northern Europe as a preferred destination, given its more stable operating, economic and legislative environment. However, the lack of available assets has driven prices higher and caused some investors to look at Southern and Eastern Europe instead. Examples of aggressive investing in Northern Europe over the last year include the following:
• A regional airport was priced as a trophy asset despite being highly dependent on a single, low-cost carrier, and having airline and merchandising revenue that is subject to regulatory caps.
• Sale of a regional Scandinavian electricity distribution network was priced at over 16x cash flow, well above the typical 8–10x multiples in the sector. Portfolio managers owning shares in the selling company noted a deal price that was 10%–15% higher than they expected.

16 THE ROAD NOT TAKEN: PITFALLS AND OPPORTUNITIES IN INFRASTRUCTURE INVESTING
As a result, caution is warranted on transportation invest-ments, given the pitfalls and value destruction observed in this sector (and in toll road and port acquisitions in particular) from the 2005–2008 vintage. However, there may be select opportunities in some new projects and in the unwinding of distressed assets as owners face refinancing deadlines and/or decide to exit projects. The best (and virtually only) example so far in the U.S. is the South Bay expressway. In 2011, after a competitive bidding process, the expressway was acquired out of bankruptcy for $345 million. The concession was originally awarded to private investors for $635 million.10
To respond to these broader challenges, our teams are work-ing on a new solution that pools institutional capital and accel-erates the delivery of multiple transportation projects under a 20- to 30-year partnership framework. The approach seeks to create greater alignment of interests among the various stake-holders, so that they share risks instead of transferring them.
10 David Tanner. “New agency slashes toll rates on South Bay Expressway,” Land Line Magazine. (July 5, 2012).
To provide a sense of how this strategy works in practice, we review below some thoughts on four of the major infrastruc-ture sectors and how the basic principles we’ve identified apply to them.
TransportationThe U.S. public sector, both federal and municipal, faces numerous transportation financing challenges. Public demand for improved transportation options, weak job and economic growth, the specter of construction cost inflation, the decline of insured municipal financing and a dearth of federal funds all contribute to a growing need for innovative financing solu-tions. However, we view the U.S. privatization model as flawed and inefficient, as evidenced by its mixed track record. The asymmetric risk profile of a typical PPP project provides core returns but is accompanied by significant downside risk and requires return-sharing above certain thresholds.9 This dynamic creates some tensions among construction firms seeking short-term profits, infrastructure investors bearing the risks of up-front forecasts, project users and taxpayers.
9 One alternative now gaining traction in the U.S. is the idea, mostly for new greenfield projects, of having bidders selected based on how cheaply they can deliver, operate and maintain the asset, with their bids being based upon fixed payments for the life of the concession. The owners are paid based on construction milestones and facility performance standards, and do not have volume/usage exposure to the asset, which remains with the municipality. These transactions are referred to as “availability payments.”
Opportunities: Principles in practice

J.P. MORGAN ASSET MANAGEMENT 17
O P P O R T U N I T I E S : P R I N C I P L E S I N P R A C T I C E
Power generationIn the U.S., a volatile regulatory/policy environment creates both challenges and opportunities. Deep industry expertise and knowledge of local regulatory developments are critical in order to navigate the regional power markets in the U.S. In particular, as coal plant retirements accelerate in the coming years due to the competitiveness of natural gas-fired plants and environmental regulations, an understanding of self-build alternatives for utilities can drive investment opportunities. As a quick review, an electric utility shutting down a coal plant generally has three options: Buy a natural gas plant or alterna-tive resource to replace it; build a new plant; or contract with a third party to purchase power directly. Utilities often opt to build or buy a plant rather than contracting for power, in order to boost their rate base the most. However, regulatory commis-sions and public advocacy groups may intervene to secure the cheapest alternative for ratepayers. When infrastructure inves-tors cultivate relationships with all these constituents, they are in a better position to participate in the most economic solu-tion and earn an attractive return on capital.
An example: In August 2010, PSCo (Colorado’s largest electric utility) submitted a plan to the state regulator to replace retir-ing coal plants with new natural gas plants that it would build. During negotiations with the state regulator and public advo-cacy groups, Southwest Gen, an electricity generation company, argued that contracting for power from a third party with existing natural gas plants would be cheaper and save con-sumers money. As a result, the utility’s original plan was modi-fied and Southwest Gen signed a 10-year contract for one of its facilities. Infrastructure investors can benefit in this case when they have ownership stakes in electricity generation companies that intervene in the process.
As for renewable energy, solar generation can be an attractive investment under a very specific set of circumstances: a high minimum state/federal requirement for renewable energy; higher solar capacity factors; declining technology costs (either for photovoltaic or thermal) and improved productivity; and the availability of tax credits for projects built before 2016. More broadly, renewable energy policies across many countries remain in flux. Recent grid reliability issues and price increases in Germany cast doubt on a continuation of current subsidies for wind power. In fact, to help offset rapidly rising residential electricity prices in Germany and manage genera-tion resource availability, 10 new coal plants are scheduled to start producing electricity in the next two years.11 As explained earlier, pricing regimes must offer investors in renewable energy sufficient protection against intermittency risks, chang-ing government policy and underestimation of O&M expenses. On a global basis, around 30% of all deals in the infrastructure industry since 2008 have been related to renewable energy (the largest slice); our preferences are likely to concentrate on other sectors of the pie (Exhibit 18).
11 McCown, Brigham. “Germany’s energy goes kaput, threatening economic stability,” Forbes. (December 30, 2013).
Renewable energy29%
Utilities14%
Telecoms3%
Other3%
Energy15%
Social(Hospitals, schools, prisons)18%
Transportation18%
Recent infrastructure investment trendsEXHIBIT 18: BREAKDOWN OF INFRASTRUCTURE DEALS BY INDUSTRY, 2008–2013
Source: Preqin Infrastructure Group; data as of year-end 2013.

18 THE ROAD NOT TAKEN: PITFALLS AND OPPORTUNITIES IN INFRASTRUCTURE INVESTING
O P P O R T U N I T I E S : P R I N C I P L E S I N P R A C T I C E
Regulated gas sector (delivery of natural gas from treatment plants to homes and businesses)In the U.S., we see a sustained cost advantage in using natural gas vs. propane or fuel oil in regions where the differential in pricing has exceeded 20%–30%. We expect continued robust shale gas production to keep this price differential high, with positive longer-term impacts on natural gas demand. As a result, we see potential value in natural gas transmission assets. However, caution is warranted due to rising valuations observed in some transactions, some of which have been 1.6 to 1.8x the project’s rate base (the value upon which owners are given a return on capital). As a result, reinvestment and capital expenditure into an existing local distribution company platform can often generate the highest expected returns, given the ability to build assets at 1.0x their effective rate base.
Midstream pipelines (delivery of natural gas from E&P sites to regional distributors)We see substantial capital needs in the North American power sector and the broader energy value chain as the shale gas story continues to evolve. As an example of how capital-intensive the shale oil and gas E&P process has become, consider this: The 4,000 wells brought online in 2012 in the U.S. outpaced the total number of wells (conventional and
unconventional) brought online in the same year in the rest of the world, excluding Canada.
An investment in this sector requires a thorough under-standing of demand from end users in order to analyze the impact on supply-side infrastructure development and operation. Long-term contracts that entail a return on invested capital provide certainty of demand and are aligned with our long-term investment horizons. We generally avoid volumetric contracts, because individual wells can exhibit volatile production characteristics.
The comments above relate to current opportunities for infrastructure investors. It is also interesting to consider the ways in which natural gas may change the infrastructure investment landscape in the years ahead. To do so, consider its four main demand drivers in the context of the overall picture of energy sources and uses (Exhibit 19):
Power generation
As shown in the diagram, the single largest use for natural gas is electricity generation. Since 1990, coal’s share of electric power has declined from 53% to 41%, while natural gas has risen from 11% to 24%. We believe this process will continue, even with capital investment in coal plants reducing nitrogen oxide and sulfur dioxide emissions by 90% since 1990.
0
10
20
30
40
50
60
70
80
90
100
Source Sector (use)
Perc
enta
ge o
f tot
al
Renewables (9%)
Coal (18%)
Petroleum(36%)
Natural gas(28%)
Electric power(40%)
Residential & commercial(10%)
Industrial(22%)
Transportation(28%)
Nuclear (9%)
Breakdown by source/use (%)
1009
52 13<1
891
28 343
36
5
23
72
1
26
43
93
21
1241
24
1
117
4339
8
<175
16
Sources and uses of primary energyEXHIBIT 19: PRIMARY U.S. ENERGY CONSUMPTION BY SOURCE AND SECTOR
Source: EIA; data as of year-end 2012. Some breakdowns by source/use may not sum to 100% due to rounding.

J.P. MORGAN ASSET MANAGEMENT 19
O P P O R T U N I T I E S : P R I N C I P L E S I N P R A C T I C E
Industrial processes
Industrial users represent the second-largest users of natural gas. On a national level, there’s still a roughly even mix of natural gas and petroleum use. In our annual energy note last year, we reviewed how marginal costs for oil are rising, a function of decline rates on existing fields and more-complex locations required to bring new supplies online (Nigeria deepwater, Canada heavy oil and some U.S. shale). As a result, we expect more fuel switching in favor of natural gas vs. petroleum products such as propane (Exhibit 20).12
Residential and commercial users
In this category, natural gas has won the battle, representing 75% of total sources. There may be some additional transi-tions away from petroleum, but only on the margin.
12 According to the EIA, propane represents 38% of industrial petroleum consumption; other petroleum products account for less than 6% each, which is why we compare propane to natural gas in the chart above.
Transportation
This is where the future may become more interesting for natural gas. It currently represents a small portion of transportation energy sources, but this could change with increased use of natural gas vehicles. The National Academy of Sciences loves the idea: “With further expected improve-ments in vehicle technology and fuel efficiency, natural gas powered vehicles will provide superior benefits in terms of criteria pollutant reductions compared to nearly all other types of vehicles, even electric and plug-in hybrid electric vehicles.”13 The U.S. is behind other countries, with only about 110,000 out of 15 million natural gas vehicles (NGVs) globally, ranking 39th in per capita use. For passenger cars driven 10,000 miles per year, the payback periods can be very long (10+ years). However, for garbage trucks, transit buses, school buses, taxis and other high-use, centrally fueled vehicles, NGVs can make more sense. According to a 2011 analysis from the National Renewable Energy Laboratory, including all costs and credits, garbage truck and transit breakeven payback times were 2.5–3.5 years. Since the report was published, the cost of diesel has gone up and the cost of natural gas has declined, reducing payback breakevens further. One sign of rising expectations: Navigant Research projects 35 million NGVs around the world by 2020 vs. today’s 15 million.14
13 Hidden Costs of Energy: Unpriced Consequences of Energy Production and Use (National Academies Press, 2010).
14 Josie Garthwaite, “For natural gas-fueled cars, long road looms ahead,” National Geographic (September 4, 2013).
Ratio
0.0x
0.2x
0.4x
0.6x
0.8x
1.0x
1.2x
2002 2004 2006 2008 2010 2012 2014
Natural gas increasingly attractive to industrial usersEXHIBIT 20: NATURAL GAS/PROPANE PRICE RATIO*
Source: Bloomberg, EIA; data as of February 2014.
*Both natural gas and propane prices are expressed as USD per million Btu.

20 THE ROAD NOT TAKEN: PITFALLS AND OPPORTUNITIES IN INFRASTRUCTURE INVESTING
Appendix I: Infrastructure performance from PreqinPreqin is an alternative investment data management and consulting firm with performance histories covering private equity, venture capital, real estate and hedge funds. Infra-structure investment by institutional investors is a more recent phenomenon. As a result, the Preqin performance history for infrastructure is not as deep as for other categories. The firm’s infrastructure performance database covers 140 closed-end funds, most of which were launched after 2004. For comparison purposes, Preqin private equity and hedge fund performance databases incorporate 6,700 and 14,700 funds, respectively. In other words, we would interpret the Preqin infrastructure data more cautiously, given its more concentrated and recent nature.
Exhibits A1.1 and A1.2 show median, top quartile and bottom quartile internal rates of return (IRRs) and net multiples from Preqin data. The lower net multiples for more-recent years may reflect the marks on unrealized transactions that will change as the funds mature. More-recent vintages also still have substantial amounts of uncalled and uninvested capital. However, as with private equity and venture capital, there were transactions in 2006 and 2007 that entailed high prices paid, so some of this recent underperformance may be permanent. The charts demonstrate substantial performance dispersion among top, median and bottom quartile funds.
Preqin also tracks the return expectations of infrastructure managers whose funds closed from 2010 to 2013 (Exhibit A1.3). While infrastructure investing is generally thought of as being heavily cash-flow-based with stable returns, this distri-bution shows a very wide range of perceived risks taken across the industry.
A P P E N D I C E S
0
40
Net
IRR
sinc
e in
cept
ion
(%)
Vintage year
5
10
15
20
25
30
35
1992–99 2000–05 2006 2007 2008 2009 2010
Top quartile IRR boundaryMedian net IRRBottom quartile IRR boundary
EXHIBIT A1.1: NET IRRS FOR UNLISTED INFRASTRUCTURE FUNDS BY VINTAGE YEAR
Source: Preqin Infrastructure Group; data as of year-end 2013.
Net
mul
tiple
sin
ce in
cept
ion
Top quartile net multiple boundaryMedian net multiple Bottom quartile net multiple boundary
0.8x
0.9x
1.0x
1.1x
1.2x
1.3x
1.4x
1.5x
1.6x
1.7x
2006 2007 2008 2009 2010 2011Vintage year
EXHIBIT A1.2: NET MULTIPLES ON INVESTMENT FOR UNLISTED INFRASTRUCTURE FUNDS BY VINTAGE YEAR
Source: Preqin Infrastructure Group; data as of year-end 2013.
Perc
ent o
f fun
ds
0
5
10
15
20
10% or less 10.1–12% 12.1–14% 14.1–16% Target net IRR
16.1–18% 18.1–20% Over 20%
EXHIBIT A1.3: DISTRIBUTION OF UNLISTED INFRASTRUCTURE FUNDS CLOSED 2010–2013, BY TARGET NET IRR
Source: Preqin Infrastructure Online; data as of year-end 2013.

J.P. MORGAN ASSET MANAGEMENT 21
A P P E N D I C E S
Appendix II: Infrastructure performance from the Center for Private Equity ResearchA study from the Center for Private Equity Research (CEPRES) covers 360 investments made from 1971–2009. The study, domi-nated by U.S. and European telecom privatizations in the late 1990s, cites investment returns that significantly exceeded those on venture capital and private equity in similar vintage years. However, dispersion across infrastructure investments was extremely high, much higher than for private equity and even higher than for venture capital. In other words, there were a lot of high-performing assets and some that performed very poorly. Note that the telecom privatization process of the past may not bear any resemblance to privatizations of the future.
DetailsProfessors at Technische Universität in Munich, Germany, ana-lyzed returns and risks on specific private equity infrastructure transactions (not funds). CEPRES collects monthly cash flows from individual private equity deals as reported by managers. The authors categorized a transaction as “infrastructure” if it was in transport, energy, telecom or natural resources, or if it was initiated by a self-designated infrastructure fund. The data sample consisted of 363 infrastructure deals between 1971 and 2009, centered in 1999, with 75% of all deals between 1994 and 2002 (Exhibit A2.1).
The majority of the study’s infrastructure deals were related to telecommunication investments (59%); the remainder were in natural resources and energy (25%), transportation (13%) and alternative energy (3%). Geographically, Europe represented 43%, North America 43%, Asia 8% and the rest of the world 6%.
EXHIBIT A2.1: DISTRIBUTION OF INFRASTRUCTURE DEALS BY YEAR (1971–2007)
Source: Bitsch, Buchner and Kaserer, Risk, Return and Cash Flow Characteristics of Infrastructure Fund Investments (EIB Papers, 2010).
Perc
enta
ge o
f dea
ls
0
2
4
6
8
10
12
14
1971 1974 1977 1980 1983 1986 1989 1992 1995 1998 2001 2004 2007
Source: Florian Bitsch, Axel Buchner and Christoph Kaserer, Risk, Return and Cash Flow Characteristics of Infrastructure Fund Investments (EIB Papers, 2010).
EXHIBIT A2.2: COMPARISON OF PRIVATE INVESTMENT PERFORMANCE (1971–2007)
Infrastructure Non-infrastructureGreenfield
infrastructure Venture capitalBrownfield
infrastructureLate-stage
private equity
IRR (%)Average 67 20 46 6 91 40Median 19 6 5 -22 36 25Standard deviation 300 197 306 221 292 155
MULTIPLE (X)Average 2.7 2.5 2.2 2.1 3.3 2.9Median 1.7 1.1 1.2 0.4 2.5 2.0
Key findings (Exhibit A2.2):
• On both an IRR and a multiple on invested capital (MOI) basis, median returns for infrastructure (19%, 1.69x) were higher than for non-infrastructure (6%, 1.13x). The median infrastructure MOI was significantly lower than the mean (2.69x), indicating a very large dispersion with a few outlying positive returns.
• The authors compared early-stage, greenfield infrastructure investing with venture capital, and brownfield (established) deals with later-stage private equity. Both infrastructure categories outperformed their respective counterparts.
• The authors found that private equity investing in infrastructure had significantly less risk of complete loss of capital compared with non-infrastructure investing (5.26% of brownfield infrastructure deals ended up being complete write-offs vs. 9% for late-stage private equity).
• The authors found that median infrastructure investments in Europe outperformed those in other regions. According to the authors, higher returns in Europe may have reflected governments not maximizing sales price as a universal goal, and the ability of private sector owners to make substantial reductions in operational inefficiencies.
22 THE ROAD NOT TAKEN: PITFALLS AND OPPORTUNITIES IN INFRASTRUCTURE INVESTING
A P P E N D I C E S
0
10
20
30
40
50
60
70
80
90
100
Jan-11 Jul-11 Jan-12 Jul-12 Jan-13 Jul-13
Perc
ent
Nat gas“peakers”
Coal
Hydro
Nat gas CC
Geothermal
Wind
Nuclear
Demand seasonality by energy sourceEXHIBIT A3.1: MONTHLY CAPACITY FACTORS
Source: EIA; data as of November 2013.
0
50
100
150
200
250
300
0 20 40 60 80 100 120
Vari
able
ope
ratin
g co
st ($
/MW
h)
Capacity available to meet electricity demand (GW)
Nat gaspeakersRenewables
Nuclear
HydroCoal
Nat gascombinedcycle
Nat gassinglecycle
PetroleumEarl
y-m
orni
ngde
man
d
Peak
dem
and
Peakers called into service only when demand is at its highestEXHIBIT A3.2: HYPOTHETICAL DISPATCH CURVE FOR THE U.S.
Source: EIA. J.P. Morgan; data as of February 2014.
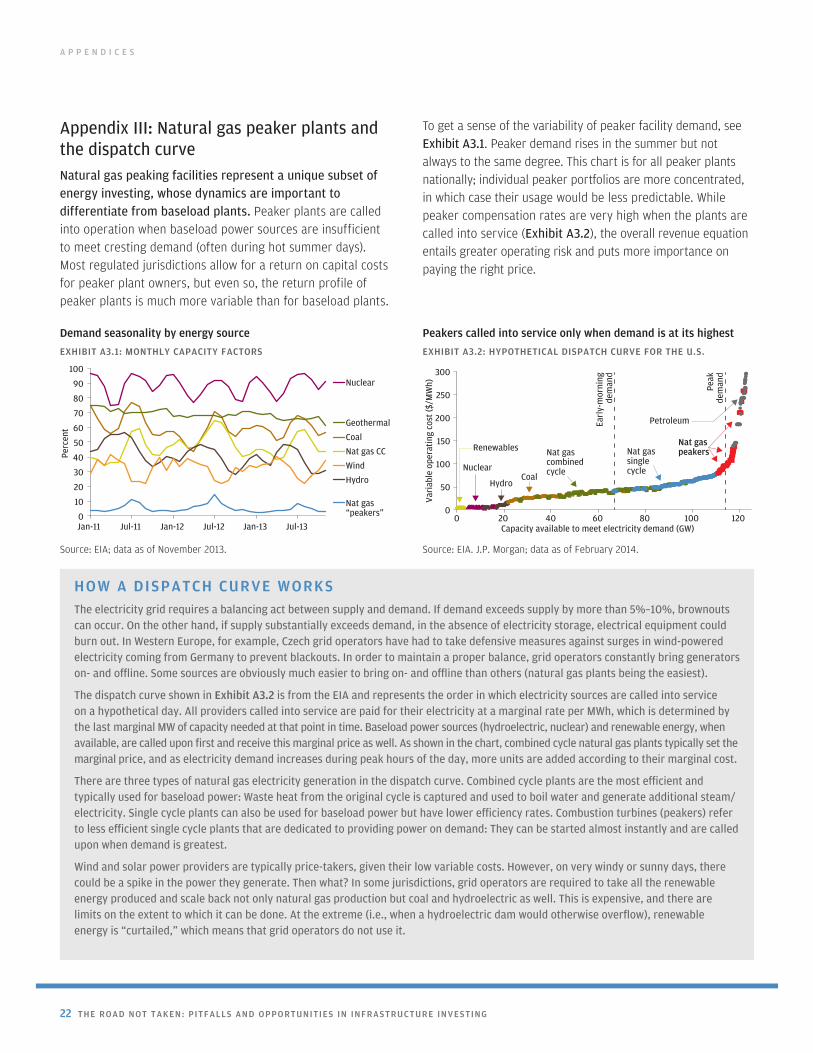
HOW A DISPATCH CURVE WORKSThe electricity grid requires a balancing act between supply and demand. If demand exceeds supply by more than 5%–10%, brownouts can occur. On the other hand, if supply substantially exceeds demand, in the absence of electricity storage, electrical equipment could burn out. In Western Europe, for example, Czech grid operators have had to take defensive measures against surges in wind-powered electricity coming from Germany to prevent blackouts. In order to maintain a proper balance, grid operators constantly bring generators on- and offline. Some sources are obviously much easier to bring on- and offline than others (natural gas plants being the easiest).
The dispatch curve shown in Exhibit A3.2 is from the EIA and represents the order in which electricity sources are called into service on a hypothetical day. All providers called into service are paid for their electricity at a marginal rate per MWh, which is determined by the last marginal MW of capacity needed at that point in time. Baseload power sources (hydroelectric, nuclear) and renewable energy, when available, are called upon first and receive this marginal price as well. As shown in the chart, combined cycle natural gas plants typically set the marginal price, and as electricity demand increases during peak hours of the day, more units are added according to their marginal cost.
There are three types of natural gas electricity generation in the dispatch curve. Combined cycle plants are the most efficient and typically used for baseload power: Waste heat from the original cycle is captured and used to boil water and generate additional steam/electricity. Single cycle plants can also be used for baseload power but have lower efficiency rates. Combustion turbines (peakers) refer to less efficient single cycle plants that are dedicated to providing power on demand: They can be started almost instantly and are called upon when demand is greatest.
Wind and solar power providers are typically price-takers, given their low variable costs. However, on very windy or sunny days, there could be a spike in the power they generate. Then what? In some jurisdictions, grid operators are required to take all the renewable energy produced and scale back not only natural gas production but coal and hydroelectric as well. This is expensive, and there are limits on the extent to which it can be done. At the extreme (i.e., when a hydroelectric dam would otherwise overflow), renewable energy is “curtailed,” which means that grid operators do not use it.
Appendix III: Natural gas peaker plants and the dispatch curveNatural gas peaking facilities represent a unique subset of energy investing, whose dynamics are important to differentiate from baseload plants. Peaker plants are called into operation when baseload power sources are insufficient to meet cresting demand (often during hot summer days). Most regulated jurisdictions allow for a return on capital costs for peaker plant owners, but even so, the return profile of peaker plants is much more variable than for baseload plants.
To get a sense of the variability of peaker facility demand, see Exhibit A3.1. Peaker demand rises in the summer but not always to the same degree. This chart is for all peaker plants nationally; individual peaker portfolios are more concentrated, in which case their usage would be less predictable. While peaker compensation rates are very high when the plants are called into service (Exhibit A3.2), the overall revenue equation entails greater operating risk and puts more importance on paying the right price.

J.P. MORGAN ASSET MANAGEMENT 23
A P P E N D I C E S
Appendix IV: The problem with accreting swaps applied to infrastructure projectsMany infrastructure projects are financed with bank loans, whose interest payments are almost always floating rate (a function of how banks finance themselves with short-term deposits and interbank loans). Because infrastructure project revenues (particularly for toll roads) are more bond-like in nature, project owners sometimes elect to swap floating rate loan exposure for fixed rate. Why an “accreting” swap? A tradi-tional swap has a single fixed rate, while an accreting swap starts out with a low rate and rises over time to compensate. This presumably suits projects whose cash flows are expected to rise over time.
The problem: A fixed rate loan is not the same as a floating rate loan combined with an interest rate swap. Consider the following stylized example. The project owners take out a
nine-year floating rate loan and overlay a 20-year accreting swap (the swap term is longer than the loan, with the goal of making refinancing by year nine easier). Now let’s assume that interest rates fall. It looks like a lost opportunity for the proj-ect’s owners, as they could have benefited from a lower cost of debt. But it’s worse than that, because the mark-to-market loss on the interest rate swap adds to the project’s total debt and jeopardizes its ability to refinance, even when there’s no change in the project’s cash flow.
This scenario is shown as 1 in Exhibit A4.1. The table computes changes in an owner’s net equity position based on interest rate shifts and cash flow changes vs. original under-writing. There are even cases where the project’s cash flow rises vs. original expectations, but the swap mark-to-market loss more than offsets its impact 2 . Of course, the worst case outcome is when the project’s cash flow underperforms expectations and interest rates fall 3 .
Model simulation: Infrastructure project financed by a nine-year bank loan plus 20-year accreting swapEXHIBIT A4.1: TIME-WEIGHTED NPV GAIN/(LOSS) ON USD2 BILLION INVESTMENT BASED ON CHANGING INTEREST RATES AND CASH FLOW GROWTH
Annual cash flow growth vs. original underwriting
Changes in long-term interest rate swap curve
-2.5% -2.0% -1.5% -1.0% -0.5% — 0.5% 1.0% 1.5% 2.0% 2.5%-5.0% (2,685) (2,521) (2,357) (2,193) (2,029) (1,865) (1,700) (1,536) (1,372) (1,208) (1,044)-4.0% (2,352) (2,188) (2,024) (1,859) (1,695) (1,531) (1,367) (1,203) (1,039) (875) (711)-3.0% (2,000) (1,836) (1,671) (1,507) (1,343) (1,179) (1,015) (851) (687) (523) (358)-2.0% (1,628) (1,464) (1,300) (1,135) (971) (807) (643) (479) (315) (151) 13 -1.0% (1,235) (1,071) (907) (743) (579) (415) (250) (86) 78 242 406
— (821) (657) (493) (328) (164) (0) 164 328 492 656 820 1.0% (384) (220) (55) 109 273 437 601 765 929 1,093 1,258 2.0% 77 241 405 570 734 898 1,062 1,226 1,390 1,554 1,718 3.0% 563 727 891 1,055 1,219 1,384 1,548 1,712 1,876 2,040 2,204 4.0% 1,075 1,239 1,403 1,567 1,731 1,895 2,060 2,224 2,388 2,552 2,716 5.0% 1,614 1,778 1,942 2,106 2,270 2,435 2,599 2,763 2,927 3,091 3,255
3
12
Source: J.P. Morgan. Stylized example. For illustrative purposes only. See text for definition of highlighted scenarios.
ASSUMPTIONS FOR MODEL SIMULATION
Deal size: 10,000 Leverage: 80%Debt: 8,000 Equity: 2,000 Purchase multiple of free cash flow: 20Required internal rate of return: 12%Implied annual cash flow growth: 4.09%Bank loan credit spread: 1%, 9-year term, refinancing
and project valuation in Year 8
YEAR 1 2 3 4 5 6 7 8 9 10Swap coupon (%) 3.13 3.13 3.13 3.13 3.40 3.65 3.65 4.15 4.15 4.90
YEAR 11 12 13 14 15 16 17 18 19 20Swap coupon (%) 5.95 6.15 6.65 7.35 7.83 9.38 9.54 11.29 11.29 11.29

24 THE ROAD NOT TAKEN: PITFALLS AND OPPORTUNITIES IN INFRASTRUCTURE INVESTING
“$1B power plant approved in W. Va.,” AFX News. (June 27, 2006).
2014 Preqin Global Infrastructure Report, (Preqin, January 2014).
Annual Energy Review 2011, (U.S. Energy Information Administration, September 2012).
Bain, Robert. Error and optimism bias in toll road traffic forecasts,
(University of Leeds, 2009).
Ben-Akiva, Moshe and John Bowman. Activity based travel demand
model systems, (Massachusetts Institute of Technology [MIT], 1996).
Berke, Jon and Seth Brumby, Eugene Gilligan. “Indiana Toll Road paves the way for restructuring with advisors,” Financial Times. (November 7, 2012).
Bitsch, Florian and Axel Buchner, Christoph Kaserer. Risk, Return
and Cash Flow Characteristics of Infrastructure Fund Investments,
(EIB Papers, 2010).
City Council’s 2013 Priorities Update, (City and County of Broomfield, Colorado, January 24, 2014).
Declaration of Anthony G. Evans, Chief Financial Officer of Southbay
Expressway, L.P., in Support of the Debtors’ Chapter 11 Petitions
and First Day Motions, (United States Bankruptcy Court, Southern District of California, March 22, 2010).
Dunning, Michael. “Toll road bankruptcies: why there are many lessons, but few straightforward solutions,” InfraNews. (April 29, 2013).
Estimating toll road demand and revenue, (Transportation Research Board, 2006).
Evans, Rohanda and Jason McNichol. S.S.A. Marine, (University of California, February 2006).
Fitzgerald, Patrick and Emily Glazer. “Longview Power, coal supplier file for bankruptcy,” Wall Street Journal. (August 30, 2013).
“Fund sells stake in port operator,” Reuters. (January 7, 2014).
Fuquay, Jim. “Overhaul of Texas electricity market put off by new
S O U R C E S
forecast on power demand,” Star–Telegram. (March 2014).
Garthwaite, Josie. “For natural gas-fueled cars, long road looms ahead,” National Geographic. (September 4, 2013).
Global infrastructure investment to reach four trillion dollars by
2017, (Bain & Company, February 2014).
Grad, Paul and Peter Kenyone. “Australia suffers toll concession failures,” TunnelTalk. (July 16, 2013).
Hensher, David (University of Sydney) and Zheng Li (University of Sydney). Toll Roads in Australia: An Overview of Characteristics and
Accuracy of Demand Forecasts, (National Cooperative Highway Research Program (NCHRP) Synthesis Report, 2010).
Hidden Costs of Energy: Unpriced Consequences of Energy
Production and Use, (National Academies Press, 2010).
Hogan, Steve. Introduction of a Private Concessionaire on the
Northwest Parkway—Colorado, (Northwest Parkway PHA, December 4, 2007).
Infrastructure in 2012: Spotlight on Leadership, (Ernst & Young and Urban Land Institute, 2012).
Infrastructure Productivity: How to Save $1 Trillion a Year, (McKinsey Global Institute, January 2013).
Johnson, Kirk. “No Closure for Denver’s Beltway Loop,” New York
Times. (January 2012).
Koppel, Nathan and Emily Glazer “Fast Texas toll road struggles to pick up drivers,” Wall Street Journal. (January 2, 2014).
Lane, Thomas. “M6 Toll debt at 26x EBITDA, MQA reports,” InfraNews. (September 2, 2013).
Latsch, Gunther. “Weak returns cripple German renewables,” Der Spiegel. (January 30, 2014).
Macquarie Atlas Roads—Analyst Pack 2012, (Macquarie, 2012).
Macquarie Atlas Roads—Management Information Report, (Maquarie, June 30, 2013).

J.P. MORGAN ASSET MANAGEMENT 25
S O U R C E S
McCown, Brigham. “Germany’s energy goes kaput, threatening economic stability,” Forbes. (December 30, 2013).
Miecamp, Julie. “Macquarie’s M6 Toll Road seeks court backing for loan extension,” (Bloomberg, November 26, 2013).
Moody’s Downgrades SH 130 Concession Company, (Moody’s Investor Services, October 2013).
Natural Gas Vehicles, Fueling Infrastructure, and Economics,
(National Renewable Energy Laboratory, March 2011).
Painvin, Nicolas and Dan Robertson, Toll Road Networks Peers’
Positioning, (Fitch Ratings, June 2013).
“Panda closes $420m private equity fund raising,” SparkSpread. (November 16, 2011).
Pension Funds Investment in Infrastructure: A Survey,
(OECD—Project on Strategic Transport Infrastructure to 2030, September 2011).
“PPL in power purchase contract with Longview Power,” Reuters. (January 24, 2007).
Project Profile Carrix Inc., (InsideView, January 2014).
Project Profile SH 130, (Federal Highway Administration, February 2014).
Public-Private Partnerships to Revamp U.S. Infrastructure,
(The Hamilton Project, February 2011).
Quinn, Megan. “Northwest Parkway scales back what it pays to Broomfield PD,” Broomfield Enterprise. (July 10, 2013).
Rosendahl, Jussi. “Fortum to sell Finnish power distribution grid for $3.5 billion,” Reuters. (December 12, 2013).
“S&P rates Panda Sherman Power Debt prelim B+,” Reuters.
(September 12, 2012).
Samuel, Peter. “At Year 1 TX 130 / 5&6 has very little traffic,” TOLLROADSnews. (October 23, 2013).
Samuel, Peter. “Northwest Parkway in Colorado concessioned to Brisa for $603m,” TOLLROADSnews. (August 30, 2007).
Samuel, Peter. “South Bay Expressway company files for bankruptcy in San Diego,” TOLLROADSnews. (March 24, 2010).
Samuel, Peter. “Sydney Cross City Tunnel bankrupt—receivers take over,” TOLLROADSnews. (January 2, 2007).
Statewide Mobility Partners LLC and Subsidiary, Consolidated
Financial Statements, (2006–2011).
Tanner, David. “New agency slashes toll rates on South Bay Expressway,” Land Line Magazine. (July 5, 2012).
“Transurban buys doubly broke Sydney Cross-City Tunnel,” TOLLROADSnews. (November 12, 2013).

26 THE ROAD NOT TAKEN: PITFALLS AND OPPORTUNITIES IN INFRASTRUCTURE INVESTING

NOT FOR RETAIL DISTRIBUTION: This communication has been prepared exclusively for Institutional/Wholesale Investors as well as Professional Clients as defined by local laws and regulation.
This document is intended to report solely on investment strategies and opportunities identified by J.P. Morgan Asset Management. Additional information is avail-able upon request. Information herein is believed to be reliable but J.P. Morgan Asset Management does not warrant its completeness or accuracy. Opinions and estimates constitute our judgment and are subject to change without notice. It is not intended and should not to be taken as an offer or solicitation to buy or sell any security or interest to anyone in any jurisdiction or to acquire any security or interest. Furthermore, nothing in this document constitutes or should be taken as an advice or recommendation to buy or sell any investment and the material should not be relied upon as containing sufficient information to support an investment decision. Any investment decision should be based solely upon the information contained in the product’s offering materials. J.P. Morgan Asset Management and/or its affiliates and employees may hold a position or act as market maker in the financial instruments of any issuer discussed herein or act as underwriter, placement agent, advisor or lender to such issuer. The investments and strategies discussed herein may not be suitable for all investors; if you have any doubts you should con-sult your J.P. Morgan Asset Management Client Adviser, Broker or Portfolio Manager. You should consult your tax or legal adviser about the issues discussed herein. The investments discussed may fluctuate in price or value. Investors may get back less than they invested. Changes in rates of exchange may have an adverse effect on the value, price or income of investments. Any forecasts, figures, opinions, views and investment techniques, unless otherwise stated, are those of the investment manager/adviser at the time of this document. They are considered to be accurate at the time of writing, but no warranty of accuracy is given and no liability in respect of any error or omission is accepted. They may be subject to change.
Real estate and infrastructure investing may be subject to a higher degree of market risk because of concentration in a specific industry, sector or geographical sector. Real estate and infrastructure investing may be subject to risks including, but not limited to, declines in the value of real estate, risks related to general and economic conditions, changes in the value of the underlying property owned by the trust and defaults by borrower.
Investments in alternative investments, such as those described herein, may not be suitable for certain investors and should not constitute a complete investment programme. Any investments should only be made by those who fully understand and are willing to accept and assume the risks involved with alternative invest-ments. Alternative investments often engage in leverage and other investment practices that can be extremely speculative and involve a high degree of risk. Such practices may increase the volatility of performance and the risk of investment loss, including the loss of the entire amount that is invested. Moreover, there can be no assurance that the investment strategy of the product will be achieved.
The statements herein containing words such as “may,” “will,” “should,” “expect,” “anticipate,” “estimate,” “intend,” “continue” or “believe” or the negatives thereof or other variations thereon or comparable terminology are forward-looking statements and not historical facts. For example, the Portfolio Target Return noted herein is a forward-looking statement. Due to various risks, uncertainties and assumptions, including, without limitation, those set forth herein and in the Memo-randum, actual events or results or the actual performance of the Fund may differ materially from those reflected in or contemplated by such forward-looking statements. Among the factors that could cause actual results to differ materially are: the general economic climate, inflationary trends, competition and the supply of, and demand for, property investments in the target markets, interest rate levels, the availability of financing, potential environmental liability and other risks associated with the ownership, development and acquisition of real assets, changes in the legal or regulatory environment, and greater than anticipated construction or management costs.
In Hong Kong, this material is distributed by JPMorgan Chase Bank, N.A. (JPMCB) Hong Kong branch except to recipients having an account at JPMCB Singapore branch and where this material relates to a Collective Investment Scheme in which case it is distributed by J.P. Morgan Securities (Asia Pacific) Limited (JPMSAPL). Both JPMCB Hong Kong branch and JPMSAPL are regulated by the Hong Kong Monetary Authority. In Singapore, this material is distributed by JPMCB Singapore branch except to recipients having an account at JPMCB Singapore branch and where this material relates to a Collective Investment Scheme (other than private funds such as a private equity and hedge funds) in which case it is distributed by J.P. Morgan (S.E.A.) Limited (JPMSEAL). Both JPMCB Singapore branch and JPMSEAL are regulated by the Monetary Authority of Singapore.
With respect to countries in Latin America, the distribution of this material may be restricted in certain jurisdictions. Receipt of this material does not constitute an offer or solicitation to any person in any jurisdiction in which such offer or solicitation is not authorized or to any person to whom it would be unlawful to make such offer or solicitation. To the extent this content makes reference to a fund, the Fund may not be publicly offered in any Latin American country, without previous registration of such fund’s securities in compliance with the laws of the corresponding jurisdiction.
Potential investors should consult their own advisors regarding tax treatment by the jurisdiction applicable to them. Shareholders should rely only upon advice received from their own tax advisors based upon their own individual circumstances and the laws applicable to them.
J.P. Morgan Asset Management is the brand for the asset management business of JPMorgan Chase & Co. and its affiliates worldwide. This communication is issued by the following entities: in the United Kingdom by JPMorgan Asset Management (UK) Limited, which is regulated by the Financial Conduct Authority; in other EU jurisdictions by JPMorgan Asset Management (Europe) S.à r.l.; in Switzerland by J.P. Morgan (Suisse) SA, which is regulated by the Swiss Financial Market Supervisory Authority FINMA; in Hong Kong by JF Asset Management Limited, or JPMorgan Funds (Asia) Limited, or JPMorgan Asset Management Real Assets (Asia) Limited, all of which are regulated by the Securities and Futures Commission; in India by JPMorgan Asset Management India Private Limited which is regulated by the Securities & Exchange Board of India; in Singapore by JPMorgan Asset Management (Singapore) Limited, or JPMorgan Asset Management Real Assets (Singapore) Pte Ltd, all of which are regulated by the Monetary Authority of Singapore; in Japan by JPMorgan Securities Japan Limited, which is regulated by the Financial Services Agency; in Australia by JPMorgan Asset Management (Australia) Limited, which is regulated by the Australian Securities and Investments Commission; in Brazil by Banco J.P. Morgan S.A., which is regulated by The Brazilian Securities and Exchange Commission (CVM) and Brazilian Central Bank (Bacen); and in Canada by JPMorgan Asset Management (Canada) Inc., which is a registered Portfolio Manager and Exempt Market Dealer in all Canadian provinces and territories except the Yukon and is also registered as an Investment Fund Manager in British Columbia, Ontario, Quebec and Newfoundland and Labrador. This communication is issued in the United States by J.P. Morgan Investment Management Inc., which is regulated by the Securities and Exchange Commission. Accordingly this document should not be circulated or presented to persons other than to professional, institutional or wholesale investors as defined in the relevant local regulations.
If you no longer wish to receive these communications please contact your J.P. Morgan representative.
Past performance is not a guarantee of future results.
© 2014 JPMorgan Chase & Co. All rights reserved.
FOR INSTITUTIONAL/WHOLESALE OR PROFESSIONAL CLIENT USE ONLY—NOT FOR RETAIL DISTRIBUTION

FOR INSTITUTIONAL/WHOLESALE OR PROFESSIONAL CLIENT USE ONLY | NOT FOR RETAIL DISTRIBUTION
© JPMorgan Chase & Co., March 2014
J . P. M O R G A N A S S E T M A N A G E M E N T
270 Park Avenue I New York, NY 10017
WP_ROAD NOT TAKEN