Embed Size (px)
Citation preview

Investment, infrastructure and competition in European telecom: blue sky thinking
Telecommunications and Media Forum Brussels, Belgium
March 19. 2013
Dr. Raúl L. Katz (*) Adjunct Professor, Division of Finance and Economics Director of Business Strategy Research Columbia Institute of Tele-information

2
The purpose of this presentation is to identify new ideas that could contribute to building the future of European telecommunications
● How can the investment framework established yesterday take the technological developments, consumer preferences and business models of tomorrow into account?
● What kind of changes to the investment framework are necessary to ensure deployment of high-speed and ultrafast networks in Europe?
● What more is needed?

The targets defined by the Digital Agenda and the National Plans
3
Country 25-30 Mbps 100 Mbps Year Austria 100% 2020 Czech Republic 30% 2015 Denmark 100% 2020 Estonia 100% 2015 Finland 100% 2015 France 100% 2025 Germany 75% 2020 Spain 98% 2020 Sweden 90% 2020 United Kingdom 90% 2015
NATIONAL BROADBAND PLANS
• Bring broadband to all Europeans by 2013 • Access to all Europeans to 30 Mbps or above by 2020 • 50 % or more European households with connections above 100 Mbps

The current situation shows, so far, weak FTTH and LTE sectors, and increasing attractiveness in cable DOCSIS 3.0
● Coverage (2012): 11.5% ● As of end of 2012, the EU 27
countries exhibit 6.2 million FTTH/B subscribers and 28.9 million homes passed (only Sweden and France with aproximately 1 million FTTH/B subscribers) – France, Spain, Portugal:
36% growth rate – Scandinavia, Netherlands:
28% growth rate – Rest of EU27: 7%
● Average take up rate among EU 27 is 21.5% (Scandinavia >30%)
● Average FTTH/B coverage among EU27 is 14%
4
FTTH/B ● 52% European premises
passed by cable delivering between 10 Mbps and more than 100 Mbps
● 7.5 million DOCSIS 3.0 subscribers
● 69% of European internet-capable cable networks have been upgraded to DOCSIS 3.0, but not all end users have CPE
● Countries with high cable coverage include Netherlands (95%), Portugal, Belgium, the UK
DOCSIS 3.0 ● LTE accounts for less than
1% of total mobile connections in Europe
● The lack of spectrum in the 800 MHz band is hampering network coverage expansion as existing spectrum bands used for LTE services (mainly in 2600 MHz bands) do not allow operators to efficiently deploy the technology outside of the main urban areas
● It is estimated that just under 20% of total mobile connections in the EU27 region will have migrated to LTE by 2017
LTE

Blue Sky Reality Check I
● ACHIEVEMENT OF TARGETS WILL RESULT FROM A COMBINATION OF TECHNOLOGY STRATEGIES – In countries with cable footprint, DOCSIS 3.0 is the best option for delivering
100 Mbps – Most member states can reach 50% coverage of 100 Mbps with the support of
copper through vectoring and pair bonding (including phantom mode) – LTE through 800 MHz can deliver 30 Mbps in rural areas
● A SUBSTANTIAL RISK RESIDES ON LIMITED UPTAKE WHICH PLACES THE CENTER OF PUBLIC INTERVENTION ON THE DEMAND SIDE – Low value proposition of NGN – Low ICT literacy – Affordability
5

Blue-Sky Reality Check II
● SEVERAL COMMON MISTAKES MADE BY PUBLIC PARTIES IN THE PROCESS OF DEPLOYING NGA – Since projects are treated as an infrastructure subsidy by central government,
little attention is paid to the robustness of the business plan – Competitive retaliation sometimes erode the viability of original business plan – Over-optimism in assessment of customer acquisition – Lack of initial commitment of project sponsor
● REGULATORY INTERVENTION COULD INCREASE RISK OF ACHIEVING NGA TARGETS – Asymmetric regulation of telco incumbent raises the ROIC hurdle rate – Sub-loop unbundling and premature disconnect of copper networks will impair
vectoring technology – Limited spectrum availability to deliver LTE in 800 MHz
6

Two blue (ish) sky ideas that consider the regulatory variable
● Unless we alliviate regulatory pressure, investment (especially to unserved areas) will not materialize
● Unless we reduce tax burden on equipment purchasing, broadband deployment will be limited (a lesson from the US)
7

Pro-competition policies in industries with high economies of scale, while helping address market failures, can affect the rythm of innovation and investment
ASYMMETRIC REGULATION AND PRO-COMPETITIVE POLICIES
INN
OVA
TIO
N A
ND
INVE
STM
ENN
T
Limited incentives of investment
- +
-
+ Correction of market failures
REGULATION VERSUS INNOVATION AND INVESTMENT
8

To test this hypothesis, we built a model to explain the rate of adoption of non-voice mobile services
9
• In competitive markets, consolidation increases incentives for innovation • High levels of competition promote a greater focus on operating
efficiencies and cost reduction • Lower levels of competition reduce the risk of innovation initiatives
• Additionally, certain sector and non-sector specific policies and regulations affect incentives to innovate • Policies oriented toward reducing customer switching costs (e.g.,
number portability) stimulate innovation to preserve loyalty and reduce churn
• A regulator not being sufficiently independent will reduce the incentive to innovate because a successful differentiation strategy could lead to asymmetric pressures
• Sector restrictions to FDI could result in limited willingness to innovate • These policy variables notwithstanding, companies will invest in markets
with a higher demand profile

A model was specified to test the impact of industry concentration and other variables on non-voice mobile service revenues
10
TICyPRODUCT_ingles_i_xii_001_228.indb 216 2/5/11 11:12:16
IDMC: indicator of regulatory independence in a given country MNP: dummy variable indicating the existence of mobile number portability NMPY: years since mobile number portability has been enacted OWNCAP: indicator of foreign ownership restrictions in wireless service provider GDP: GDP per capita (measured in US$ PPP) EF: index of economic freedom URBAN: urbanization index POP: percentage population between 15 and 64 years of age

Model confirms some of the hypotheses
11
• Market concentration is directly linked to innovation: consolidation provides operators with a higher certainty of potential returns on investments in wireless data development
• Mobile number portability and years of policy since enactment are directly linked to innovation
• Portability does not necessarily lead to churn, but the threat of churn provides an incentive for operators to innovate to build loyalty
• Regulatory independence and innovation are not significantly linked In the mobile industry: the degree of regulatory independence is not an important variable in explaining new product development
• Market potential is a critical variable driving innovation: all socio-demographic variables are directly and significantly linked to innovation

Two blue (ish) sky ideas that consider the regulatory variable
● Unless we alliviate regulatory pressure, investment (especially to unserved areas) will not materialize
● Unless we reduce tax burden on equipment purchasing, broadband deployment will be limited (a lesson from the US)
12

Telecommunications and cable TV equipment investment in 2010 in the United States reached $42.1 billion (or $137.12 per capita)
EVOLUTION OF TELECOM AND CABLE TV INVESTMENT PER CAPITA IN THE UNITED STATES (2006-10)
YEAR 2006 2007 2008 2009 2010 Total
Mean Total Investment $ 141.98 $ 136.12 $ 126.01 $ 116.02 $ 137.12 $ 131.45
Mean Taxable Investment $ 93.71 $ 89.84 $ 83.17 $ 76.57 $ 90.50 $ 86.76
Std. Dev. $ 46.15 $ 38.76 $ 38.94 $ 43.01 $ 60.58 $ 46.23
Minimum State $ 17.03 $ 38.60 $ 29.49 $ 28.39 $ 35.84 $ 17.03
Maximum State $ 243.57 $ 192.56 $ 214.68 $ 229.50 $ 447.44 $ 447.44
• Approximately 66% of all investment ($27.80 billion or $90.50 per capita) is on equipment subject to sales taxes
• Variance of investment across states is fairly wide and increasing over time • While market potential and competitive pressure drive investment intensity, sales taxes also
play a role
13

Of the total investment, $1.394 billion was paid in sales taxes (on average 4.02% for telcos and 4.45% for cable)
EVOLUTION OF SALES TAX ON INVESTMENT IN THE UNITED STATES (2006-10)
Year 2006 2007 2008 2009 2010 Mean 3.88% 3.94% 3.96% 4.12% 4.02% Max. 9.25% 9.25% 9.25% 9.25% 9.25% Standard deviation 3.50% 3.55% 3.58% 3.60% 3.67% States without taxes 20 20 20 19 20
WIRELESS/WIRELINE
Year 2006 2007 2008 2009 2010 Mean 4.14% 4.20% 4.23% 4.42% 4.45% Max. 9.25% 9.25% 9.25% 9.25% 9.25% Standard deviation 3.55% 3.58% 3.60% 3.62% 3.65% States without taxes 20 20 20 19 19
CABLE TV
• The five year average sales tax rate is fairly stable over time, although it exhibits an increasing divergence across states
• Taxation on telecommunications equipment purchasing is not homogeneous across the country since twenty states and the District of Columbia do not apply sales taxes to telecommunications equipment, while nineteen do not tax cable TV equipment
14

The study tested two hypotheses and simulated a policy outcome
H1: Lower sales taxes on initial equipment
purchasing have a positive impact on telecom
investment
H2: Higher telecom investment increases
its economic contribution
Policy Simulation: What is the economic impact of lowering taxes that affect
telecom investment?
Sales taxes on initial network
equipment purchases
Increase in network
deployment costs
Reduction in broadband penetration
Negative impact on economic
growth
15

A decrease of 1 percentage point in the tax rate would increase investment in cable TV by $0.31 per capita and $0.85 in telecom
16

This effect can be also verified by examining actual investment behavior in specific states
0.00
20.00
40.00
60.00
80.00
100.00
120.00
140.00
160.00
0.00%
1.00%
2.00%
3.00%
4.00%
5.00%
6.00%
7.00%
2006 2007 2008 2009 2010
Sales Tax Rate for Wireless & Wireline Investment Per Capita Wireless & Wireline
N. Dakota eliminated
sales tax on network
equipment purchases in
2009
Telecom investment decreased 33% from $115.37 to $77.44 per
capita 0.00
20.00
40.00
60.00
80.00
100.00
120.00
5.60%
5.80%
6.00%
6.20%
6.40%
6.60%
6.80%
7.00%
7.20%
7.40%
2006 2007 2008 2009 2010
Sales Tax Rate for Wireless & Wireline Investment Per Capita Wireless & Wireline
S. Carolina increased the sales tax rate from 6.25% in
2006 to 7.25% in 2007
Telecom investment increased three-fold
from $48 to $148.30 per
capita
NORTH DAKOTA: SALES TAX RATE AND TELECOM INVESTMENT (2006-10)
SOUTH CAROLINA: SALES TAX RATE AND TELECOM INVESTMENT (2006-10)
17

We found that a reduction in sales taxes has a positive impact on telecommunications capital investment
H1: An elimination of the sales tax in the states that
still tax equipment purchasing would generate $1.4B-$1.7B in additional
investment
H2: Higher telecom investment increases
its economic contribution
Policy Simulation: What is the economic impact of lowering taxes that affect
telecom investment?
Reduce sales taxes on ini/al
network equipment purchases
Reduc/on in network
deployment costs
Reduc/on in broadband penetra/on
Nega/ve impact on economic
growth
H2: $1.4B in additional investment would generate $7.2B in additional output and 53,000 jobs (baseline
estimate)
18

Three blue sky ideas that leave out the regulatory variable
● Unless we change some of the basic assumptions, the FTTH business case is unprofitable
● Unless we modify some financing models, NGN in low density areas will not materialize
● Unless we increase the NGN value proposition, consumer uptake will remain at sub-optimal levels
19

20
We constructed an investment model that captures all commercial and financial variables of a FTTH business plan
RETAIL ARPU
WHOLESALE ARPU
RETAIL WHOLESALE MIX
CPE COSTS
CONSTRUCTION COSTS
MARKET SHARE WHOLESALE ACCESS LINKS
DEPLOYMENT PLANS
HOMES PASSED
EQUIPMENT COSTS
RETAIL REVENUES
WHOLESALE REVENUES
OPERATING EXPENSES
AMORTIZATION AND TAXES
EBITDA
EBIT
FREE CASH FLOWS
BROADBAND MARKET

21
Investment model assumptions
TYPES ITEM ASSUMPTION RATIONALE
EQUIPMENT COSTS ● FTTB-G-PON: 289.5 €
● FTTH-G-PON: 393.4 €
● Sanford Bernstein estimates 950 € for home connected, split as 650 € for home passed and 300 € incremental for connected
● Verizon mentions that at 5 million homes passed, homes passed are 382 € and 213 € incremental for connected
CONSTRUCTION COSTS (OSP and CO labor)
● 29.5 €
CPE COSTS (ONT, OLT and equipment)
● 320 €
RETAIL ARPU (average over five years)
● € 63 ● Starting point is the ARPU of a digital household (around 62 Euros)
● Assumed to increase by adding other value-added services aimed at capturing a portion of the consumer surplus (raising to 73 Euros)
● Prices would start diminishing at 2% per annum CUSTOMER CHURN ● 1.4%/Month ● Consistent with international triple play experience (e.g.
Cox)
WHOLESALE ARPU ● 28 € ● Driven by approximately 40% wholesale/retail ratio
WHOLESALE/RETAIL MIX
● 89% to 85 % ● Assumes that 90% of fiber is deployed in areas of competition, triggering ULL provisioning
CA
PITA
L R
EVEN
UES

22
Investment model assumptions (cont.)
ITEM ASSUMPTION RATIONALE
OPEX ● 54 Euros/line/month ● Operating expenses comprise four categories: customer acquisition costs, provisioning costs (installation and activation of service), maintenance and customer assistance costs, and general costs
● These costs are known to be lower than those of the legacy network (approximately 70%) reaching 54 Euros/ line/month
WACC ● 8.26 ● Driven by Beta=1.36 (averaging internet and data transport firms)
g ● 2% ● Average of analysts assessment for Iliad and CSFB for Fastweb

23
Our base case estimates costs and revenues for a moderate deployment plan
HOMES PASSED 5,600,000
HOMES CONNECTED 1,400,000 (25%)
CAPITAL INVESTMENT € 1,300,000,000

24
The model output (in million €) for our base case indicates a positive NPV, although most of it resides in its terminal value
Year 1 Year 2 Year 3 Year 4 Year 5
REVENUES 115 335 563 799 1,022
OPEX 31.4 56.9 84.4 113.6 131.4
EBITDA 83.7 277.9 478.4 685.8 879.4
EBIT 55.1 214.5 374.2 582.5 776.9
FCF (170.6) (83.3) 17.24 208.7 349.6
NET PRESENT VALUE (W/O terminal value) € 105 MM
NET PRESENT VALUE (W/terminal value) € 3,373 MM

25
As expected, the investment model is highly sensitive to the percentage of homes passed that are connected
HOMES CONNECTED/HOMES PASSED
(average over five years)
NET PRESENT VALUE (W/O terminal value)
NET PRESENT VALUE (W/terminal value)
10 % €(207) MM € 597 MM
15 % €(103) MM € 1,522 MM
20 % € 1 MM € 2,448 MM
25 % € 105 MM € 3,373 MM
30 % € 209 MM € 4,298 MM
35 % € 313 MM € 5,223 MM
40 % € 417 MM € 6,148 MM
45 % € 521 MM € 7,072 MM
50 % € 625 MM € 7,996 MM
BASE CASE

26
Similarly, the business case is very sensitive to retail ARPU (revenues to be generated by household)
Pricing scenarios RETAIL ARPU (average over five years)
NET PRESENT VALUE (W/O terminal value)
NET PRESENT VALUE (W/terminal value)
Broadband prices fall at ~8% p.a.
€ 47.1 € (166) MM € 1,696 MM
Copper broadband drops 8.6% and fiber 6%
€ 48.8 € (141) MM € 1,851 MM
Broadband prices decline uniformly 6%
p.a.
€ 51.5 € (99) MM € 2,109 MM
Fiber prices align with copper
€ 54.0 € (83) MM € 2,212 MM
Baseline case (price tiering)
€ 63.0 € 105 MM € 3,373 MM BASE CASE

27
When the investment model is stress-tested, it exhibits a high potential to yield negative NPVs
HOMES CONNECTED/HOMES PASSED
25 % 20% 15%
PRICES Price tiering Fiber aligned with copper and decline 4.8%
Fiber aligned with copper and decline 6.0%
CAPEX DEPLOYMENT COSTS As forecast >10% >20%
NET PRESENT VALUE (W/O terminal value) € 105 MM (237) MM (374) MM
NET PRESENT VALUE (W/terminal value) € 3,373 MM 1,202 MM 237 MM
BASE CASE
28
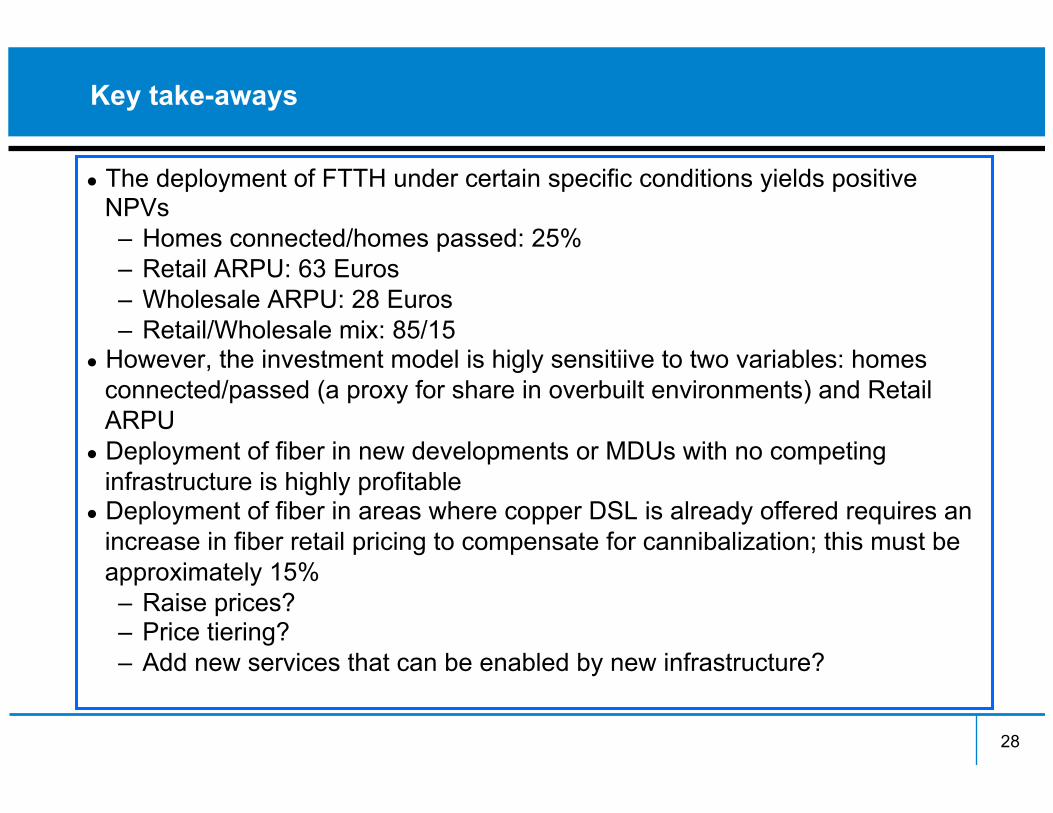
Key take-aways
● The deployment of FTTH under certain specific conditions yields positive NPVs – Homes connected/homes passed: 25% – Retail ARPU: 63 Euros – Wholesale ARPU: 28 Euros – Retail/Wholesale mix: 85/15
● However, the investment model is higly sensitiive to two variables: homes connected/passed (a proxy for share in overbuilt environments) and Retail ARPU
● Deployment of fiber in new developments or MDUs with no competing infrastructure is highly profitable
● Deployment of fiber in areas where copper DSL is already offered requires an increase in fiber retail pricing to compensate for cannibalization; this must be approximately 15% – Raise prices? – Price tiering? – Add new services that can be enabled by new infrastructure?

Three blue sky ideas that leave out of the regulatory variable
● Unless we change some of the basic assumptions, the FTTH business case is unprofitable
● Unless we modify some financing models, NGN in low density areas will not materialize
● Unless we increase the NGN value proposition, consumer uptake will remain at sub-optimal levels
29

Variables Explaining NGA Project Success or Failure
Project Success Project Failure • Demand aggregation across neighboring
areas in order to achieve critical mass • Limited support obtained to negotiate
financial terms with lender syndicate • Sharing of deployment costs by competitors
or value-chain players • Since project was treated as an infrastructure
subsidy by central government, little attention was paid to the robustness of the business plan
• Focused FTTH deployment on the part of the incumbent
• Competitive retaliation eroded the viability of original business plan
• Financing of FTTH from capex • Over-optimism in assessment of customer acquisition
• Careful development of business plan (demand assessment, technology decisions, commercial strategy, capital plan, etc.)
• Competitive retaliation of the incumbent could raise the issue that indiscriminate public intervention could pre-empt market forces
• Open access business model utilized to rapidly gain critical mass of demand
• Lack of initial commitment of project sponsor
• Due diligence of credit facility conducted by an outside party on behalf of lenders
30

Framework for assessing NGN business models
Project Context Investment Model Financing Model
1. Compe))ve environment (exis)ng players offering
broadband access) 2. Compe))ve subs)tutes
(VDSL, Docsis 3.0) 3. Industry structure (number
of players, exis)ng service-‐based players)
4. Project sponsor (incumbent, municipality, alterna)ve service provider, etc.)
1. Average revenue per user
2. Wholesale access rates 3. Wholesale/retail mix 4. Deployment costs 5. Subscribers/homes
passed
1. Sources of funds (equity, public funds, debt)
2. Financial investors (ins)tu)onal, banks,
venture capitalists, angel investors, governments)
3. Lending terms (limited or non recourse, rate and
tenor, seniority, collateral, covenants)
Three drivers of NGN project success
31
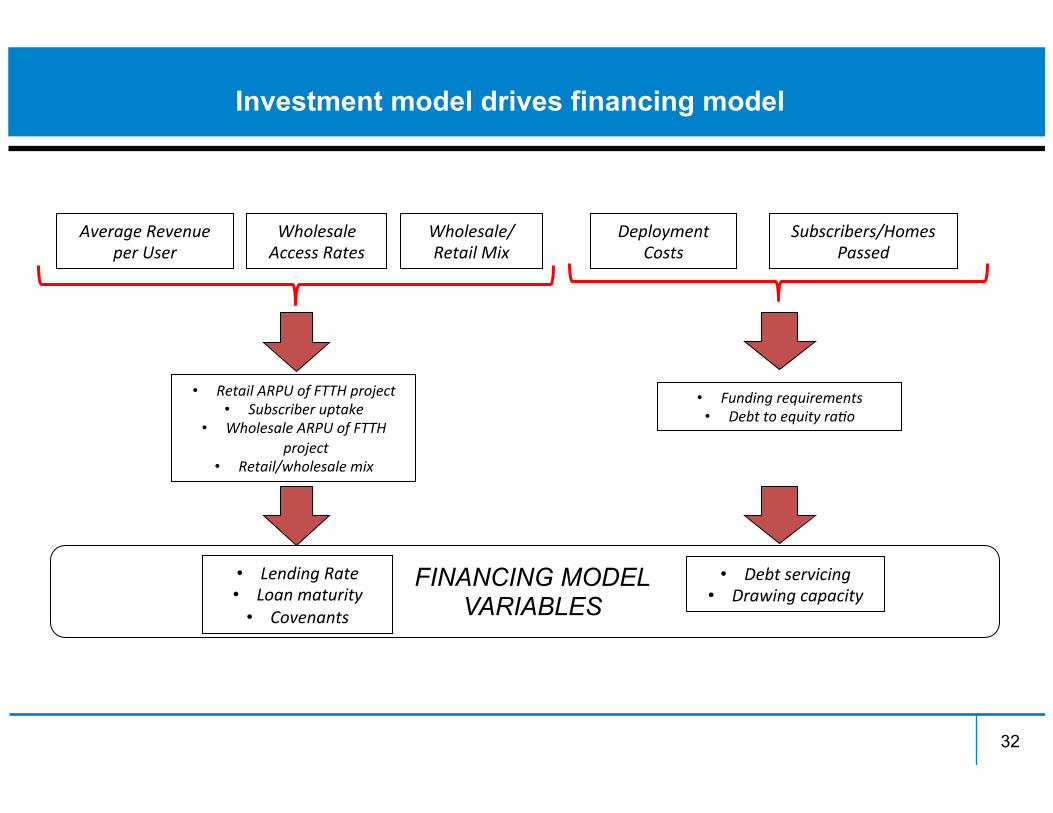
Investment model drives financing model
Average Revenue per User
Deployment Costs
Wholesale Access Rates
Wholesale/Retail Mix
Subscribers/Homes Passed
• Retail ARPU of FTTH project • Subscriber uptake
• Wholesale ARPU of FTTH project
• Retail/wholesale mix
• Lending Rate • Loan maturity
• Covenants
• Funding requirements • Debt to equity ra)o
• Debt servicing • Drawing capacity
FINANCING MODEL VARIABLES
32
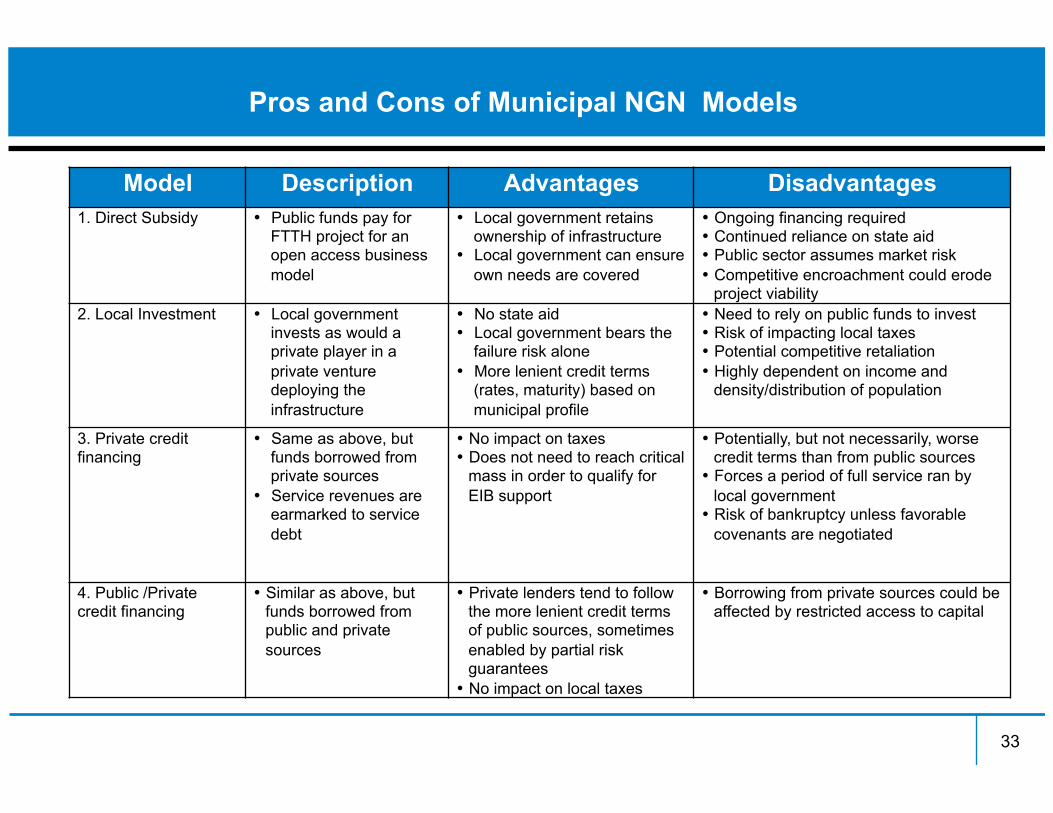
Pros and Cons of Municipal NGN Models
Model Description Advantages Disadvantages 1. Direct Subsidy • Public funds pay for
FTTH project for an open access business model
• Local government retains ownership of infrastructure
• Local government can ensure own needs are covered
• Ongoing financing required • Continued reliance on state aid • Public sector assumes market risk • Competitive encroachment could erode
project viability 2. Local Investment • Local government
invests as would a private player in a private venture deploying the infrastructure
• No state aid • Local government bears the
failure risk alone • More lenient credit terms
(rates, maturity) based on municipal profile
• Need to rely on public funds to invest • Risk of impacting local taxes • Potential competitive retaliation • Highly dependent on income and
density/distribution of population
3. Private credit financing
• Same as above, but funds borrowed from private sources
• Service revenues are earmarked to service debt
• No impact on taxes • Does not need to reach critical
mass in order to qualify for EIB support
• Potentially, but not necessarily, worse credit terms than from public sources
• Forces a period of full service ran by local government
• Risk of bankruptcy unless favorable covenants are negotiated
4. Public /Private credit financing
• Similar as above, but funds borrowed from public and private sources
• Private lenders tend to follow the more lenient credit terms of public sources, sometimes enabled by partial risk guarantees
• No impact on local taxes
• Borrowing from private sources could be affected by restricted access to capital
33
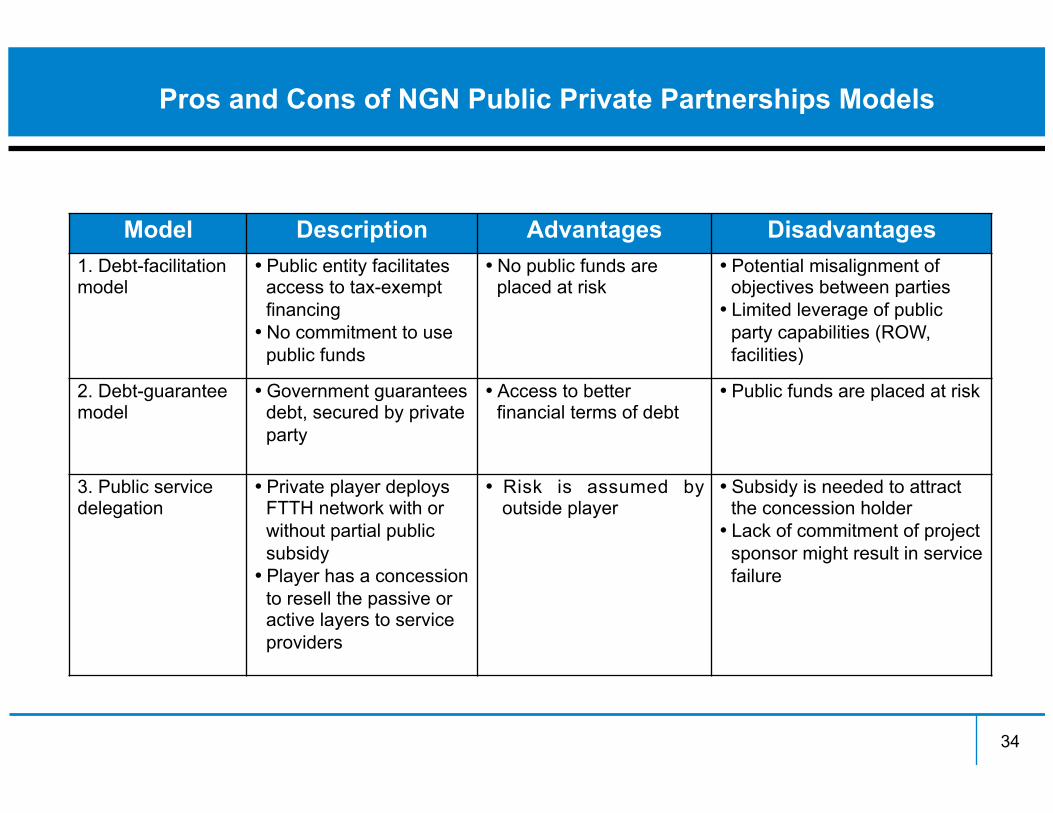
Pros and Cons of NGN Public Private Partnerships Models
Model Description Advantages Disadvantages 1. Debt-facilitation model
• Public entity facilitates access to tax-exempt financing
• No commitment to use public funds
• No public funds are placed at risk
• Potential misalignment of objectives between parties
• Limited leverage of public party capabilities (ROW, facilities)
2. Debt-guarantee model
• Government guarantees debt, secured by private party
• Access to better financial terms of debt
• Public funds are placed at risk
3. Public service delegation
• Private player deploys FTTH network with or without partial public subsidy
• Player has a concession to resell the passive or active layers to service providers
• Risk is assumed by outside player
• Subsidy is needed to attract the concession holder
• Lack of commitment of project sponsor might result in service failure
34

NGN Financing Models have to be selected carefully
Geographic Mix Urban Sub-urban Rural
Financing Strategies
Municipal/Regional
• Municipality as an investor
• Public/private credit financing
Public Private Partnerships
• Public service delegation
Operator-funded • Incumbent funded • Joint venture • Multi-fibre
• Cost sharing model
Operator-funded and public policy
stimuli
• Public funding program
35

Consider Pooled Financing Approaches for small NGN Projects
• Pooled facility to finance multiple small projects, with several lenders taking their pro rata exposure to each of the projects
• Target size of each facility: US$ 20 million, sufficient to handle 5-6 small NGN projects
• Projects would be majority-owned by public sector sponsors, although the private sector could have an ownership stake
• Facility will have the support from a public lender, which would provide credit enhancements, such as loan guarantees equal to 50% of the total amount
• The pooled facility will be ring fenced • Projects could apply, through the pooled facility, to receive output-based
aid from public funds • Each project will be structured using a project finance approach • Project sponsors will develop the NGN projects with technical and
operational assistance provided by government entities
36
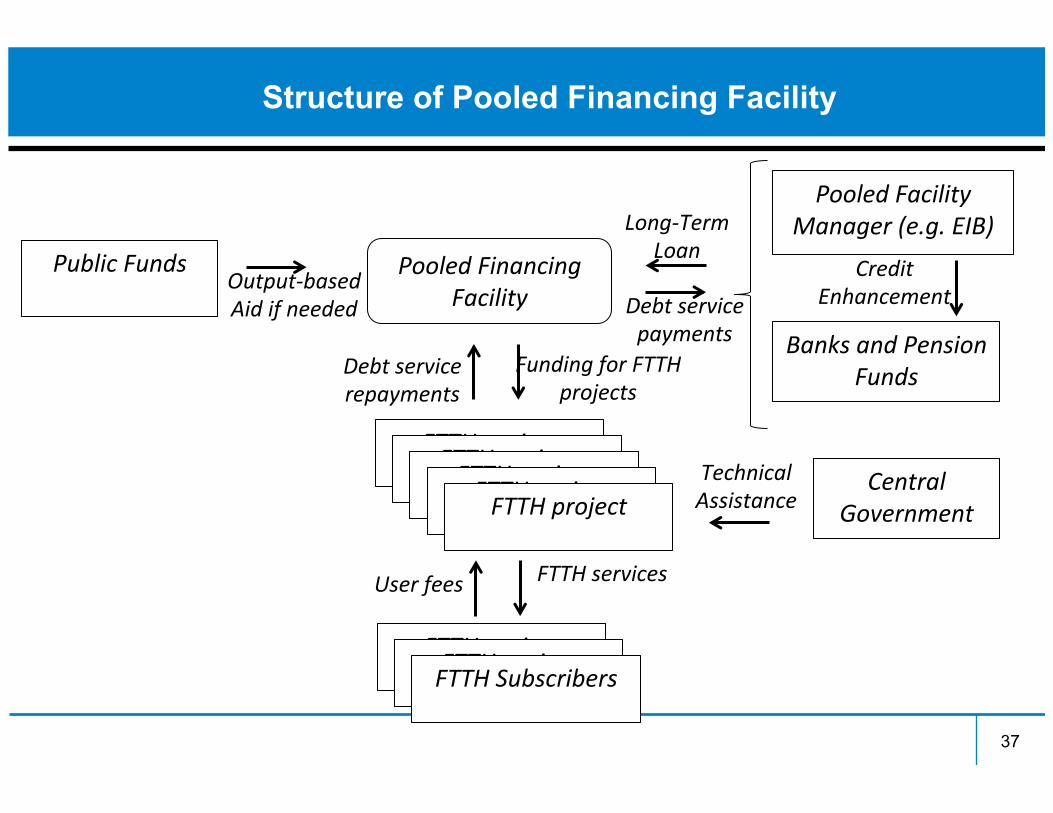
Structure of Pooled Financing Facility
Pooled Financing Facility
FTTH project FTTH project FTTH project FTTH project FTTH project
FTTH project FTTH project FTTH Subscribers
Funding for FTTH projects
Debt service repayments
FTTH services User fees
Pooled Facility Manager (e.g. EIB)
Banks and Pension Funds
Credit Enhancement
Long-‐Term Loan
Debt service payments
Public Funds Output-‐based Aid if needed
Central Government
Technical Assistance
37

Three blue sky ideas that leave out of the regulatory variable
● Unless we change some of the basic assumptions, the FTTH business case is unprofitable
● Unless we modify some financing models, NGN in low density areas will not materialize
● Unless we increase the NGN value proposition, consumer uptake will remain at sub-optimal levels
38
39
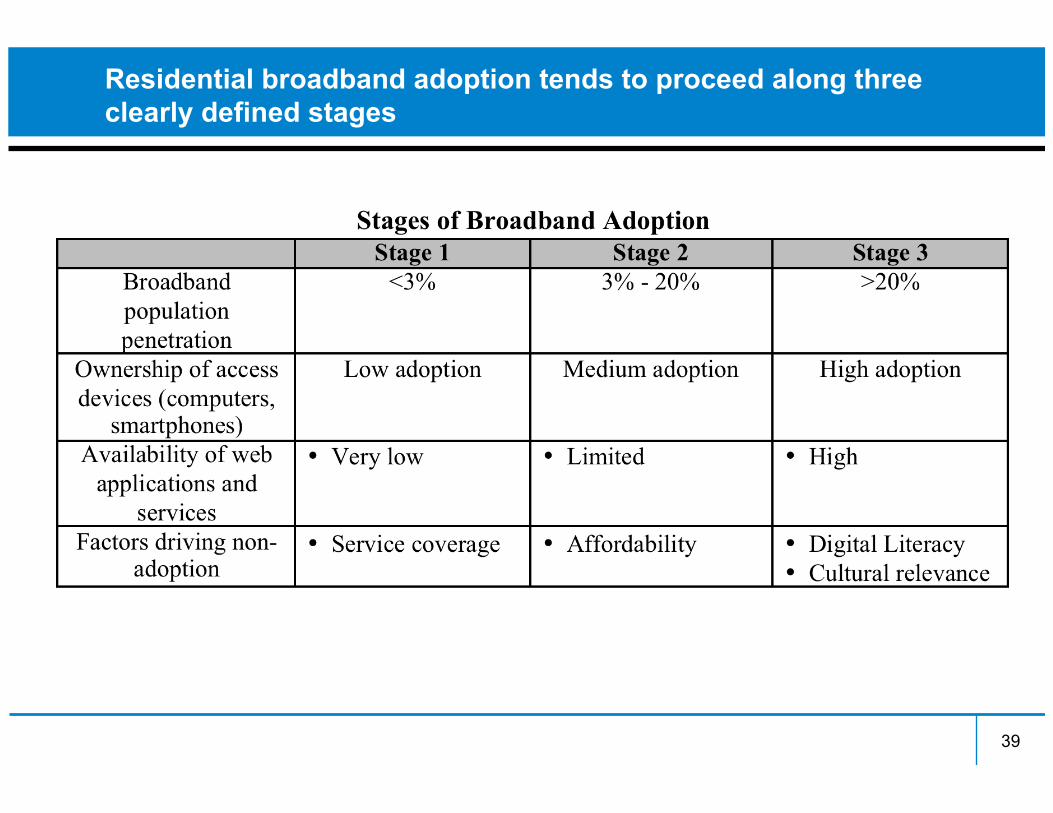
Residential broadband adoption tends to proceed along three clearly defined stages

The broadband demand gap is in general the result of three obstacles
40
Income
Education
Age
Ethnic
Limited Affordability
Limited digital Literacy
Lack of relevance
STRUCTURAL FACTORS ADOPTION OBSTACLES

Addressing the affordability barrier of NGN requires putting in place three types of initiatives
41
Income
Education
Age
Ethnic
Limited Affordability
Limited Digital Literacy
Lack of Relevance
STRUCTURAL FACTORS ADOPTION OBSTACLES
• Reduce broadband service pricing
• Reduce pricing of access devices
• Reduce taxation on broadband and service
AFFORDABILITY INITIATIVES

Broadband elasticities, identified at lower service levels, should exist within NGA as well
42
CORRELATION BETWEEN FIXED BROADBAND PRICE ELASTICITY AND SERVICE PENETRATION
Source: Estimates by the author based on research literature
CAP Handset Air cards / Dongles
500 MB -.320
1 GB -.305 -.633 2 GB -.245 -.667
5 GB -.673
MOBILE BROADBAND: PRICE ELASTICITY
COEFFICIENTS FOR DIFFERENT PRICE PLANS

Returning to taxation, an inverse relationship exists between end user taxes and adoption of wireless broadband services
43
TAXATION VERSUS ADOPTION OF DATA SERVICES
Sources: Katz et al. (2008); Wireless Intelligence
Ecuador
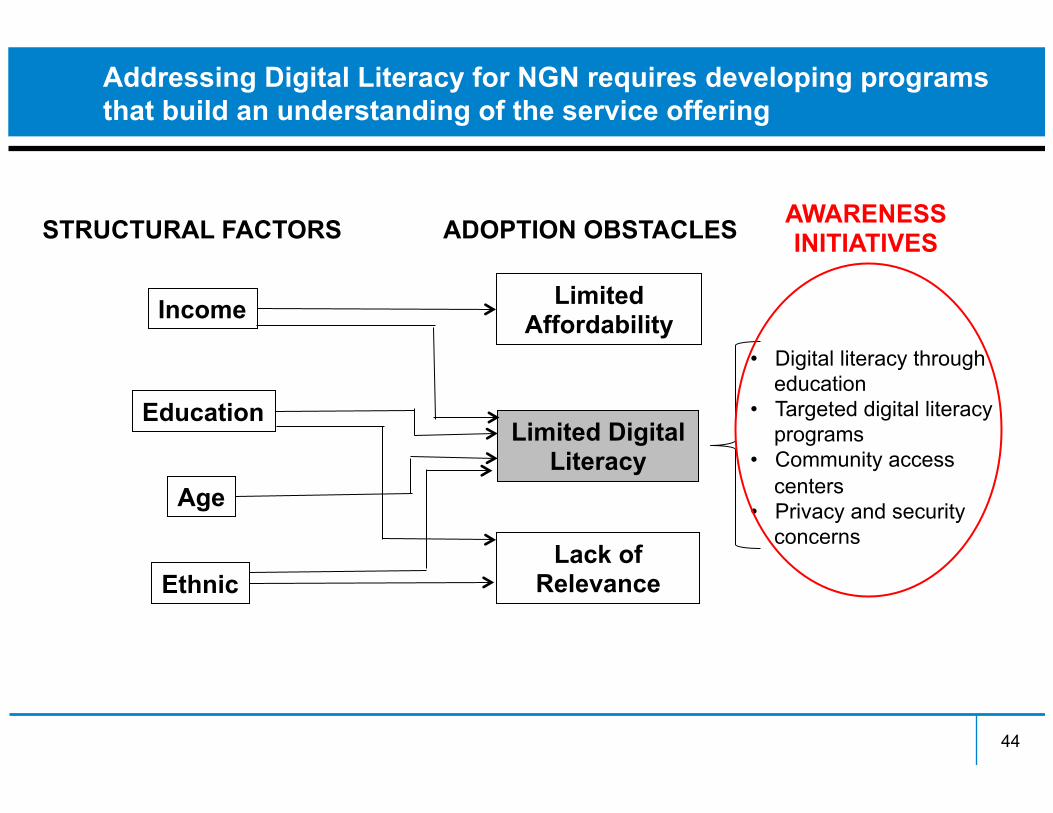
Addressing Digital Literacy for NGN requires developing programs that build an understanding of the service offering
44
Income
Education
Age
Ethnic
Limited Affordability
Limited Digital Literacy
Lack of Relevance
STRUCTURAL FACTORS ADOPTION OBSTACLES
• Digital literacy through education
• Targeted digital literacy programs
• Community access centers
• Privacy and security concerns
AWARENESS INITIATIVES

Beyond pricing, NGN demand stimulation centers on enhancing its value proposition around applications
Income
Education
Age
Ethnic
Limited Affordability
Limited Digital Literacy
Lack of Relevance
STRUCTURAL FACTORS ADOPTION OBSTACLES
• Introduce applications with high network effects
• Launch services with high social and welfare impact
• Deliver locally-relevant applications and content
RELEVANCE INITIATIVES

To sum up, it is useful to look within and beyond regulation to increase the likelihood of achieving the DE tragets
46
● Unless we alliviate regulatory pressure, investment (especially to unserved areas) will not materialize
● Unless we reduce tax burden on equipment purchasing, broadband deployment will be limited (a lesson from the US)
● Unless we change some of the basic assumptions, the FTTH business case is unprofitable
● Unless we modify some financing models, NGN in low density areas will not materialize
● Unless we increase the NGN value proposition, consumer uptake will remain at sub-optimal levels

47