Embed Size (px)
Citation preview
Investment in Mining
Keith LockwoodTIPS Annual Forum
14 June 2016
THE GLOBAL CONTEXT
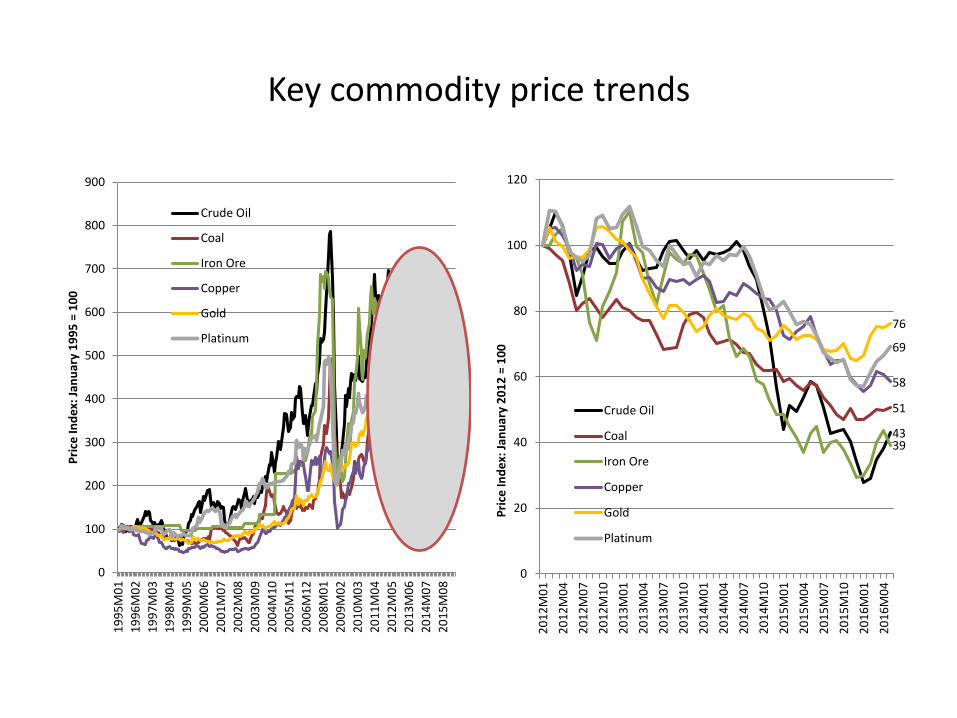
Key commodity price trends
0
100
200
300
400
500
600
700
800
900
19
95
M0
1
19
96
M0
2
19
97
M0
3
19
98
M0
4
19
99
M0
5
20
00
M0
6
20
01
M0
7
20
02
M0
8
20
03
M0
9
20
04
M1
0
20
05
M1
1
20
06
M1
2
20
08
M0
1
20
09
M0
2
20
10
M0
3
20
11
M0
4
20
12
M0
5
20
13
M0
6
20
14
M0
7
20
15
M0
8
Pri
ce In
de
x: J
anu
ary
19
95
= 1
00
Crude Oil
Coal
Iron Ore
Copper
Gold
Platinum
43
51
39
58
76
69
0
20
40
60
80
100
120
20
12
M0
1
20
12
M0
4
20
12
M0
7
20
12
M1
0
20
13
M0
1
20
13
M0
4
20
13
M0
7
20
13
M1
0
20
14
M0
1
20
14
M0
4
20
14
M0
7
20
14
M1
0
20
15
M0
1
20
15
M0
4
20
15
M0
7
20
15
M1
0
20
16
M0
1
20
16
M0
4
Pri
ce In
de
x: J
anu
ary
20
12
= 1
00
Crude Oil
Coal
Iron Ore
Copper
Gold
Platinum
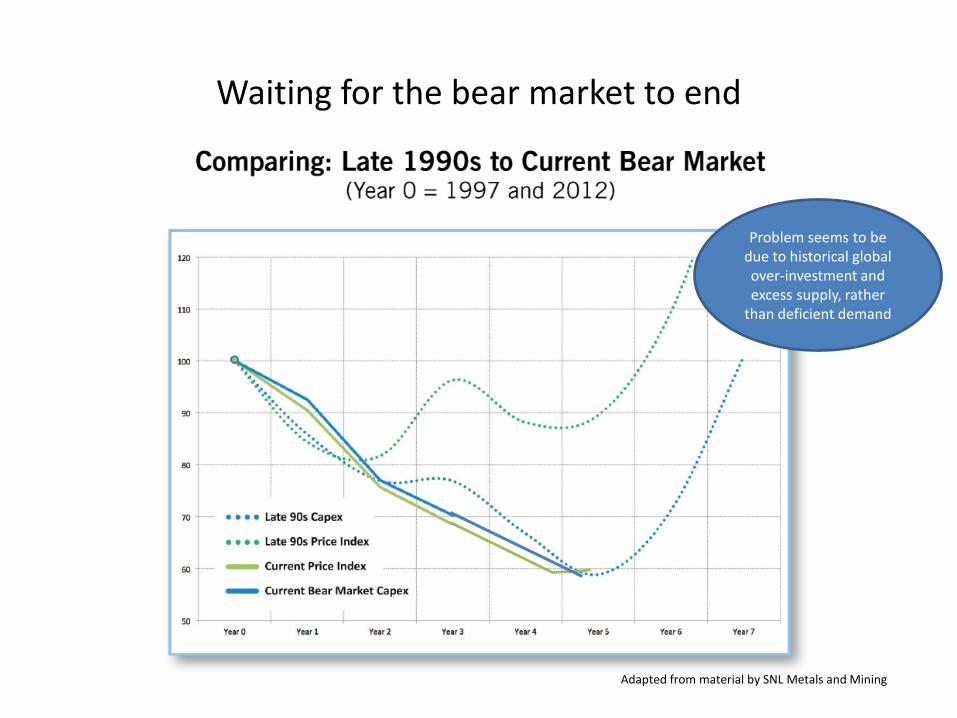
Waiting for the bear market to end
Adapted from material by SNL Metals and Mining
Problem seems to be due to historical global over-investment and excess supply, rather
than deficient demand
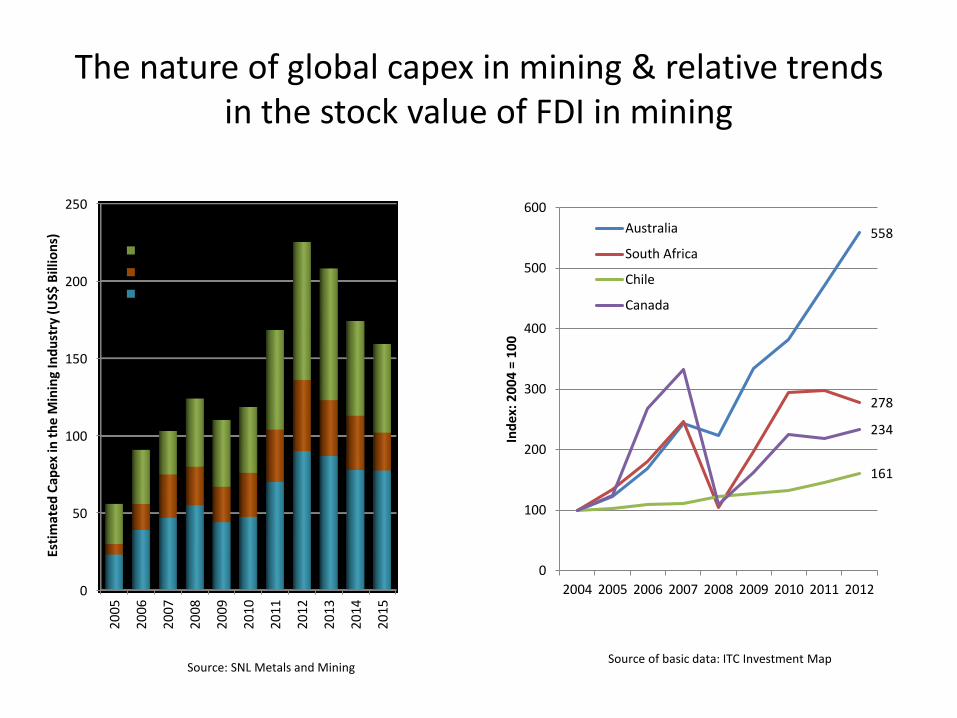
The nature of global capex in mining & relative trends in the stock value of FDI in mining
558
278
161
234
0
100
200
300
400
500
600
2004 2005 2006 2007 2008 2009 2010 2011 2012
Ind
ex: 2
00
4 =
10
0
Australia
South Africa
Chile
Canada
Source of basic data: ITC Investment Map
0
50
100
150
200
250
200
5
200
6
200
7
200
8
200
9
201
0
201
1
201
2
201
3
201
4
201
5
Esti
mat
ed C
ape
x in
th
e M
inin
g In
du
stry
(U
S$ B
illio
ns)
Greenfield
Brownfield
Sustaining Capex
Source: SNL Metals and Mining
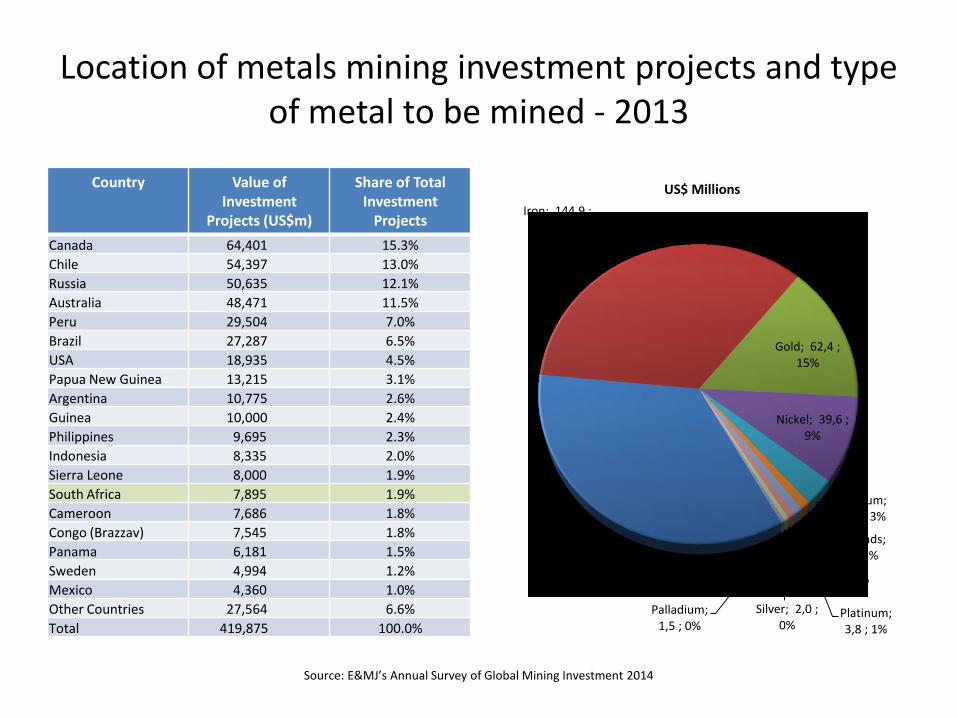
Location of metals mining investment projects and type of metal to be mined - 2013
Copper; 146,3 ; 35%
Iron; 144,9 ; 35%
Gold; 62,4 ; 15%
Nickel; 39,6 ; 9%
Uranium; 12,6 ; 3%
Diamonds; 4,0 ; 1%
Platinum; 3,8 ; 1%
Zinc; 2,8 ; 1%
Silver; 2,0 ; 0%
Palladium; 1,5 ; 0%
US$ MillionsCountry Value of Investment
Projects (US$m)
Share of Total Investment
Projects
Canada 64,401 15.3%
Chile 54,397 13.0%
Russia 50,635 12.1%
Australia 48,471 11.5%
Peru 29,504 7.0%
Brazil 27,287 6.5%
USA 18,935 4.5%
Papua New Guinea 13,215 3.1%
Argentina 10,775 2.6%
Guinea 10,000 2.4%
Philippines 9,695 2.3%
Indonesia 8,335 2.0%
Sierra Leone 8,000 1.9%
South Africa 7,895 1.9%
Cameroon 7,686 1.8%
Congo (Brazzav) 7,545 1.8%
Panama 6,181 1.5%
Sweden 4,994 1.2%
Mexico 4,360 1.0%
Other Countries 27,564 6.6%
Total 419,875 100.0%
Source: E&MJ’s Annual Survey of Global Mining Investment 2014
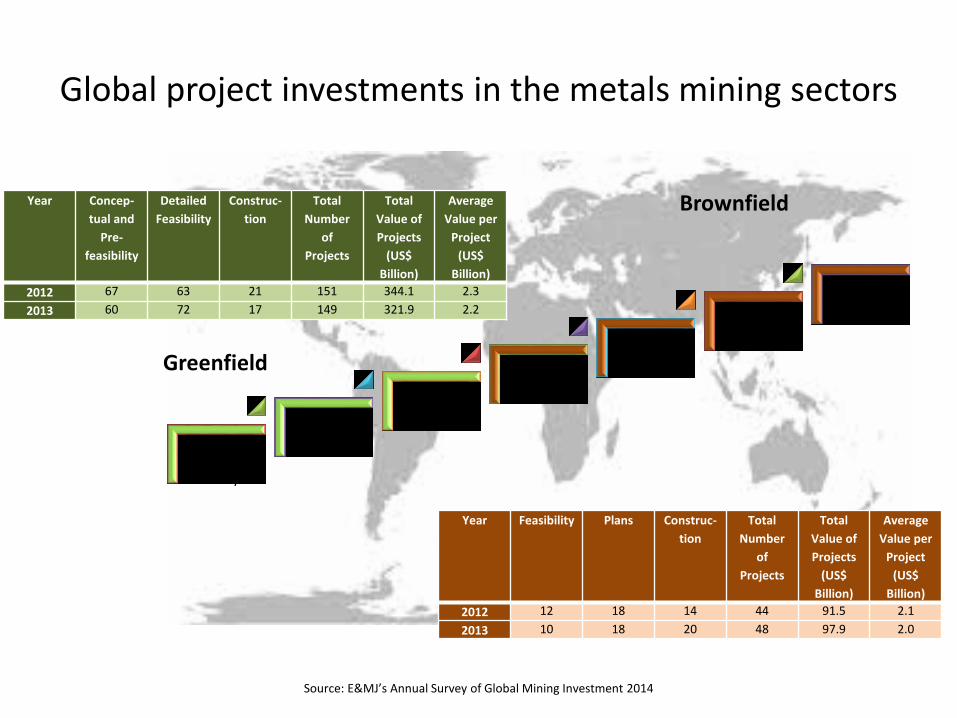
Global project investments in the metals mining sectors
Conceptual & Pre-feasibility
Feasibility
Construction
Operating -Feasibility
Operating –Plans
Operating –Construction
Other Brownfields
Source: E&MJ’s Annual Survey of Global Mining Investment 2014
Year Concep-
tual and
Pre-
feasibility
Detailed
Feasibility
Construc-
tion
Total
Number
of
Projects
Total
Value of
Projects
(US$
Billion)
Average
Value per
Project
(US$
Billion)
2012 67 63 21 151 344.1 2.3
2013 60 72 17 149 321.9 2.2
Year Feasibility Plans Construc-
tion
Total
Number
of
Projects
Total
Value of
Projects
(US$
Billion)
Average
Value per
Project
(US$
Billion)
2012 12 18 14 44 91.5 2.1
2013 10 18 20 48 97.9 2.0
Greenfield
Brownfield
INVESTMENT IN SOUTH AFRICANMINING
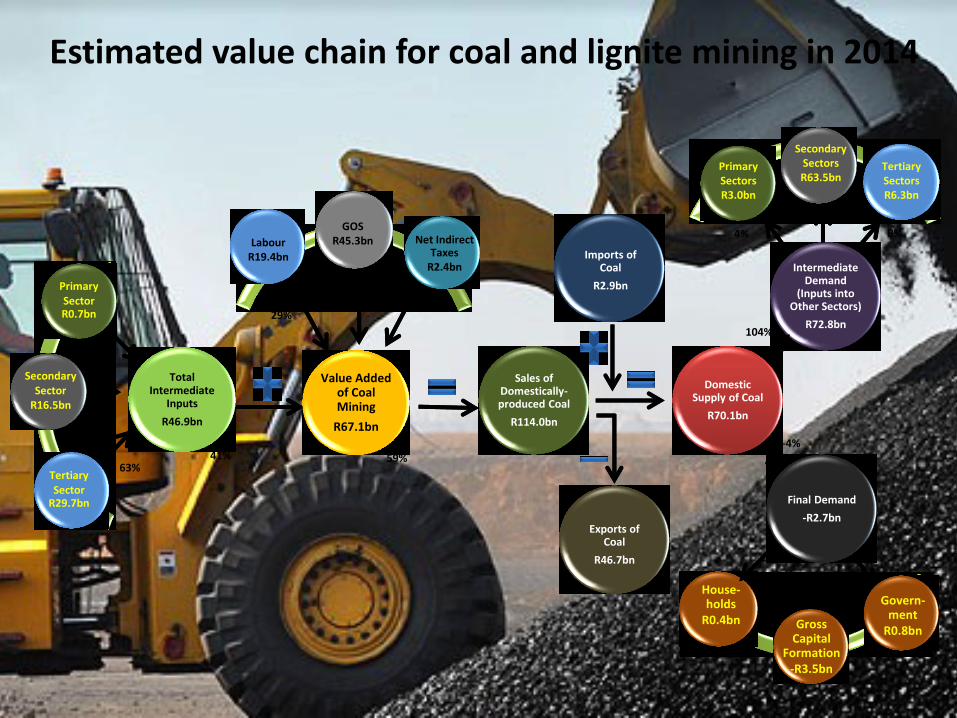
Total Intermediate
Inputs
R46.9bn
Primary Sector R0.7bn
Secondary Sector
R16.5bn
Tertiary Sector
R29.7bn
Value Added of Coal Mining
R67.1bn
LabourR19.4bn
GOSR45.3bn Net Indirect
TaxesR2.4bn
Sales of Domestically-produced Coal
R114.0bn
Exports of Coal
R46.7bn
Imports of Coal
R2.9bn
Domestic Supply of Coal
R70.1bn
Final Demand
-R2.7bn
Intermediate Demand
(Inputs into Other Sectors)
R72.8bn
Primary SectorsR3.0bn
Secondary SectorsR63.5bn
Tertiary SectorsR6.3bn
Gross Capital
Formation-R3.5bn
63%
35%
2%
29%
67%
4%
41% 59%
House-holds
R0.4bn
104%
-4%
9%
87%
4%
Govern-ment
R0.8bn
Estimated value chain for coal and lignite mining in 2014
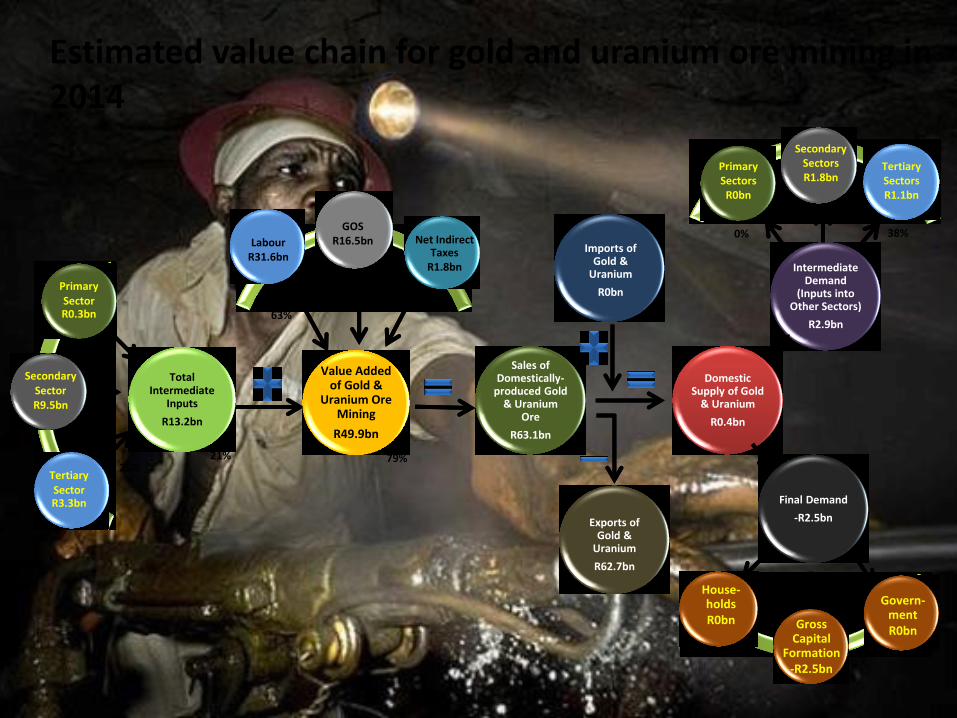
Total Intermediate
Inputs
R13.2bn
Primary Sector R0.3bn
Secondary Sector R9.5bn
Tertiary Sector R3.3bn
Value Added of Gold &
Uranium Ore Mining
R49.9bn
LabourR31.6bn
GOSR16.5bn Net Indirect
TaxesR1.8bn
Sales of Domestically-
produced Gold & Uranium
Ore
R63.1bn
Exports of Gold &
Uranium
R62.7bn
Imports of Gold &
Uranium
R0bn
Domestic Supply of Gold
& Uranium
R0.4bn
Final Demand
-R2.5bn
Intermediate Demand
(Inputs into Other Sectors)
R2.9bn
Primary SectorsR0bn
Secondary SectorsR1.8bn
Tertiary SectorsR1.1bn
Gross Capital
Formation-R2.5bn
25%
72%
3%
63%
33%
4%
21% 79%
House-holdsR0bn
38%
62%
0%
Govern-mentR0bn
Estimated value chain for gold and uranium ore mining in 2014
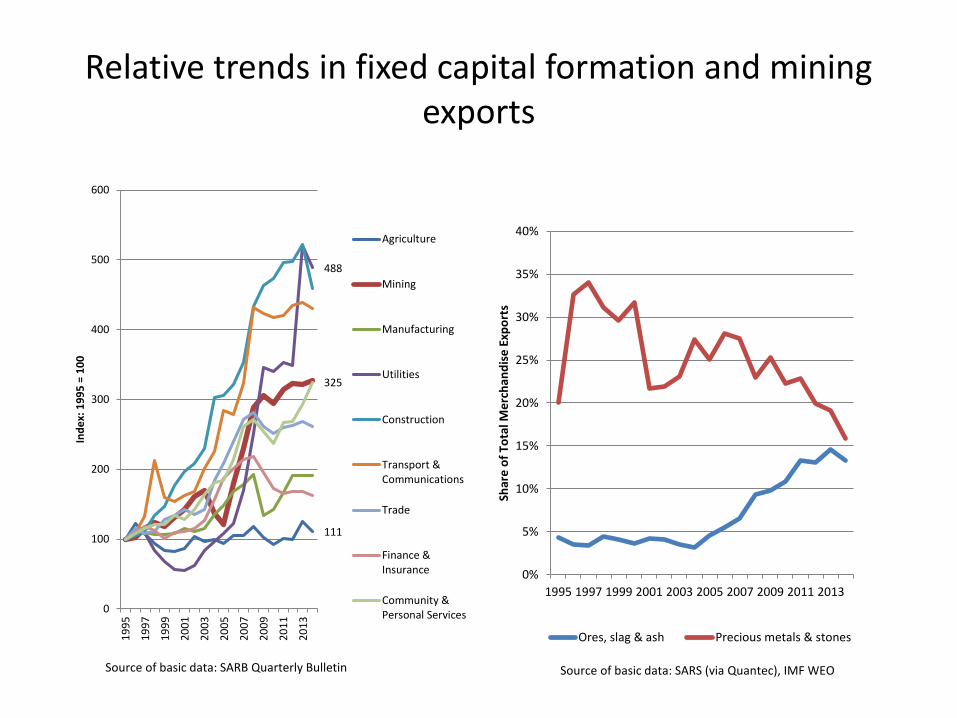
Relative trends in fixed capital formation and mining exports
0%
5%
10%
15%
20%
25%
30%
35%
40%
1995 1997 1999 2001 2003 2005 2007 2009 2011 2013
Shar
e o
f To
tal M
erc
han
dis
e E
xpo
rts
Ores, slag & ash Precious metals & stones
111
488
325
0
100
200
300
400
500
600
19
95
19
97
19
99
20
01
20
03
20
05
20
07
20
09
20
11
20
13
Ind
ex:
19
95
= 1
00
Agriculture
Mining
Manufacturing
Utilities
Construction
Transport &Communications
Trade
Finance &Insurance
Community &Personal Services
Source of basic data: SARB Quarterly Bulletin Source of basic data: SARS (via Quantec), IMF WEO
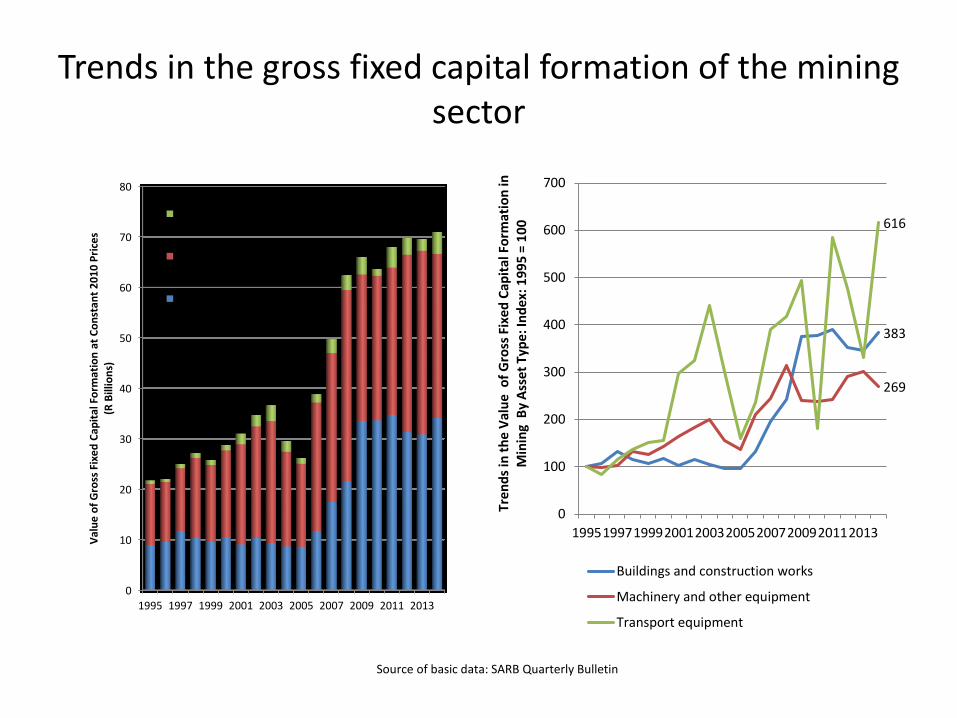
Trends in the gross fixed capital formation of the mining sector
0
10
20
30
40
50
60
70
80
1995 1997 1999 2001 2003 2005 2007 2009 2011 2013
Val
ue
of
Gro
ss F
ixe
d C
apit
al F
orm
atio
n a
t C
on
stan
t 2
01
0 P
rice
s (R
Bill
ion
s)
Transport equipment
Machinery and otherequipment
Buildings and constructionworks
383
269
616
0
100
200
300
400
500
600
700
1995199719992001200320052007200920112013
Tren
ds
in t
he
Val
ue
of
Gro
ss F
ixed
Cap
ital
Fo
rmat
ion
in
Min
ing
By
Ass
et
Typ
e: I
nd
ex:
19
95
= 1
00
Buildings and construction works
Machinery and other equipment
Transport equipment
Source of basic data: SARB Quarterly Bulletin
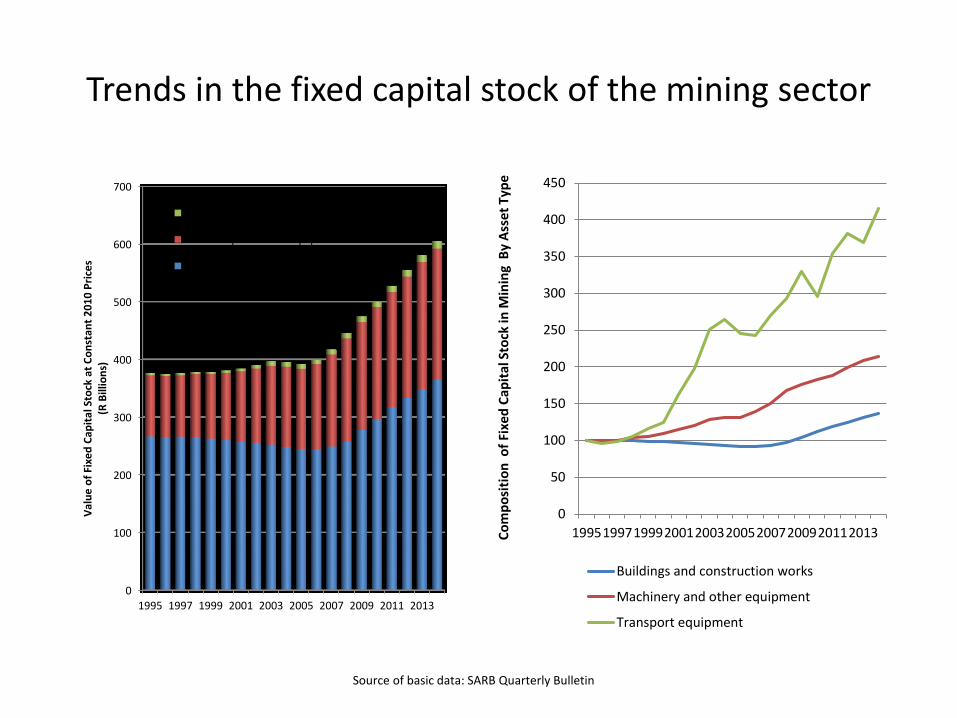
Trends in the fixed capital stock of the mining sector
0
100
200
300
400
500
600
700
1995 1997 1999 2001 2003 2005 2007 2009 2011 2013
Val
ue
of
Fixe
d C
apit
al S
tock
at
Co
nst
ant
20
10
Pri
ces
(R B
illio
ns)
Transport equipment
Machinery and other equipment
Buildings and construction works
0
50
100
150
200
250
300
350
400
450
1995199719992001200320052007200920112013Co
mp
osi
tio
n o
f Fi
xed
Cap
ital
Sto
ck in
Min
ing
By
Ass
et
Typ
e
Buildings and construction works
Machinery and other equipment
Transport equipment
Source of basic data: SARB Quarterly Bulletin
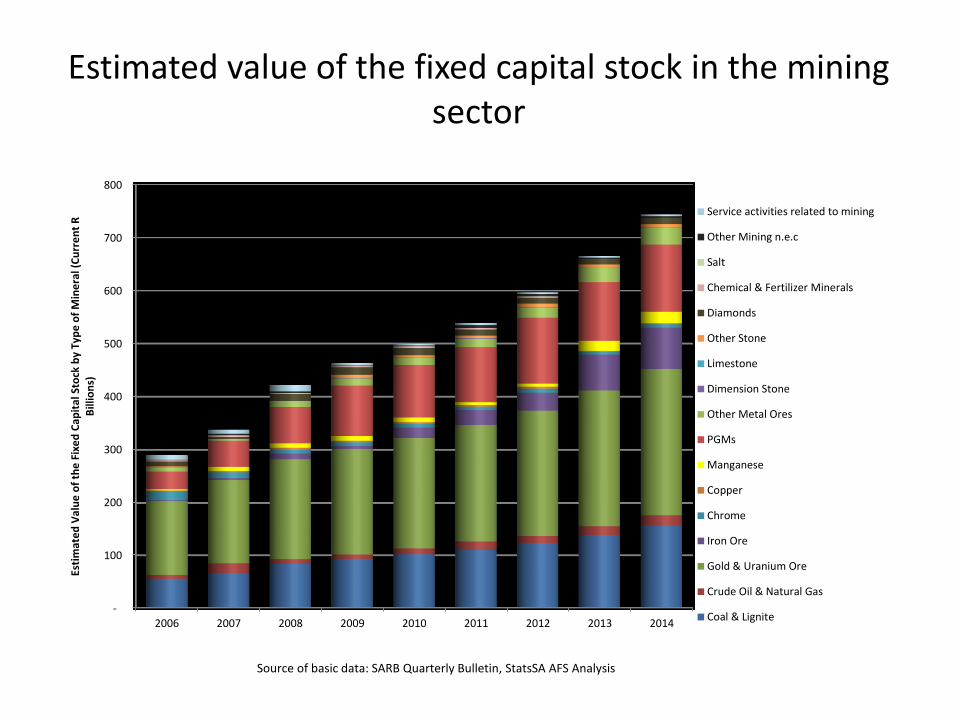
Estimated value of the fixed capital stock in the mining sector
-
100
200
300
400
500
600
700
800
2006 2007 2008 2009 2010 2011 2012 2013 2014
Esti
mat
ed
Val
ue
of
the
Fix
ed
Cap
ital
Sto
ck b
y Ty
pe
of
Min
era
l (C
urr
en
t R
B
illio
ns)
Service activities related to mining
Other Mining n.e.c
Salt
Chemical & Fertilizer Minerals
Diamonds
Other Stone
Limestone
Dimension Stone
Other Metal Ores
PGMs
Manganese
Copper
Chrome
Iron Ore
Gold & Uranium Ore
Crude Oil & Natural Gas
Coal & Lignite
Source of basic data: SARB Quarterly Bulletin, StatsSA AFS Analysis
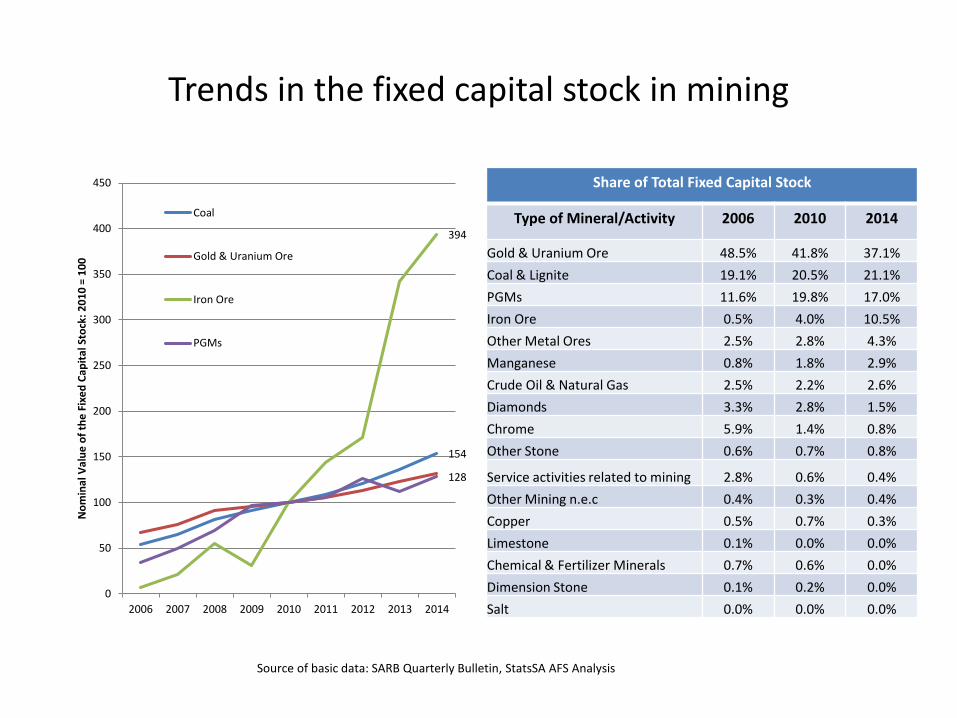
Trends in the fixed capital stock in mining
154
394
128
0
50
100
150
200
250
300
350
400
450
2006 2007 2008 2009 2010 2011 2012 2013 2014
No
min
al V
alu
e o
f th
e F
ixe
d C
apit
al S
tock
: 2
01
0 =
10
0
Coal
Gold & Uranium Ore
Iron Ore
PGMs
Share of Total Fixed Capital Stock
Type of Mineral/Activity 2006 2010 2014
Gold & Uranium Ore 48.5% 41.8% 37.1%
Coal & Lignite 19.1% 20.5% 21.1%
PGMs 11.6% 19.8% 17.0%
Iron Ore 0.5% 4.0% 10.5%
Other Metal Ores 2.5% 2.8% 4.3%
Manganese 0.8% 1.8% 2.9%
Crude Oil & Natural Gas 2.5% 2.2% 2.6%
Diamonds 3.3% 2.8% 1.5%
Chrome 5.9% 1.4% 0.8%
Other Stone 0.6% 0.7% 0.8%
Service activities related to mining 2.8% 0.6% 0.4%
Other Mining n.e.c 0.4% 0.3% 0.4%
Copper 0.5% 0.7% 0.3%
Limestone 0.1% 0.0% 0.0%
Chemical & Fertilizer Minerals 0.7% 0.6% 0.0%
Dimension Stone 0.1% 0.2% 0.0%
Salt 0.0% 0.0% 0.0%
Source of basic data: SARB Quarterly Bulletin, StatsSA AFS Analysis
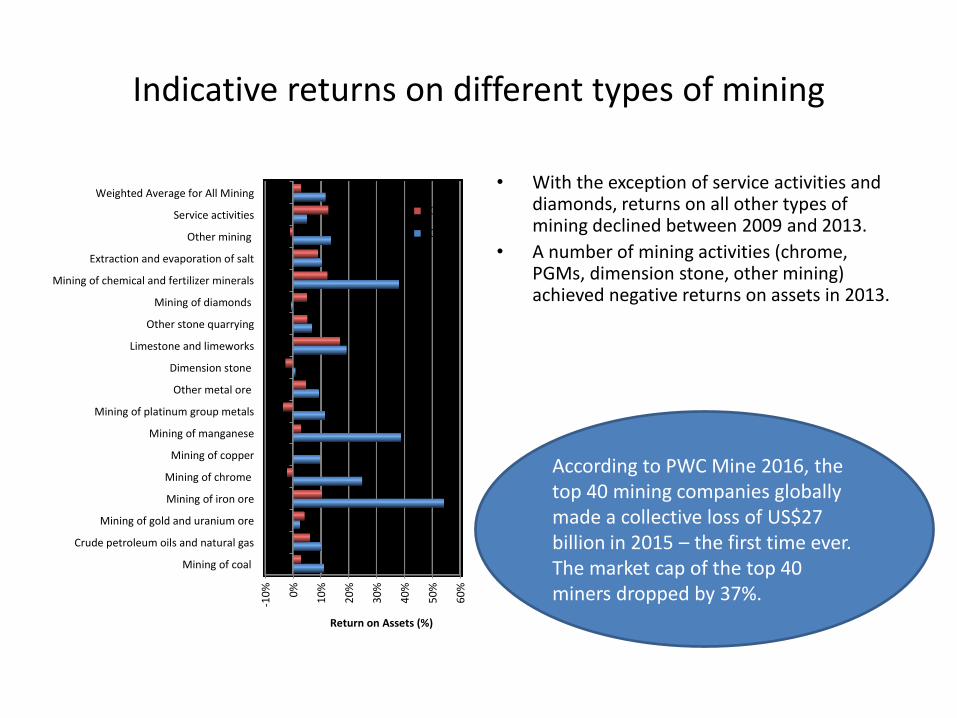
Indicative returns on different types of mining
-10
%
0%
10
%
20
%
30
%
40
%
50
%
60
%
Mining of coal
Crude petroleum oils and natural gas
Mining of gold and uranium ore
Mining of iron ore
Mining of chrome
Mining of copper
Mining of manganese
Mining of platinum group metals
Other metal ore
Dimension stone
Limestone and limeworks
Other stone quarrying
Mining of diamonds
Mining of chemical and fertilizer minerals
Extraction and evaporation of salt
Other mining
Service activities
Weighted Average for All Mining
Return on Assets (%)
2013
2009
• With the exception of service activities and diamonds, returns on all other types of mining declined between 2009 and 2013.
• A number of mining activities (chrome, PGMs, dimension stone, other mining) achieved negative returns on assets in 2013.
According to PWC Mine 2016, the top 40 mining companies globally made a collective loss of US$27 billion in 2015 – the first time ever.The market cap of the top 40 miners dropped by 37%.
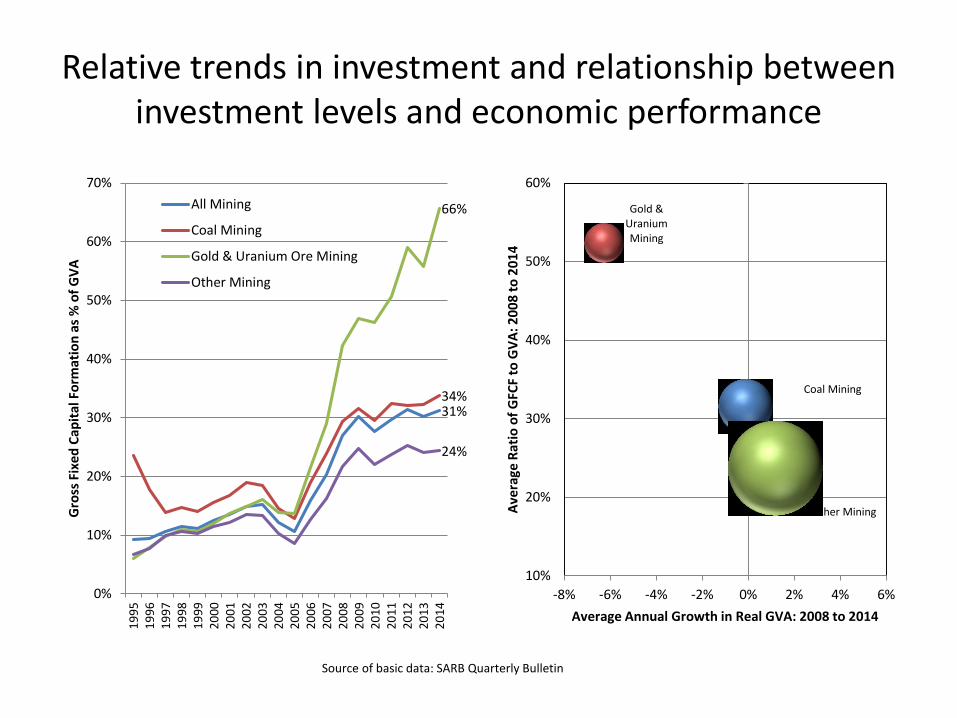
Relative trends in investment and relationship between investment levels and economic performance
31%34%
66%
24%
0%
10%
20%
30%
40%
50%
60%
70%
19
95
19
96
19
97
19
98
19
99
20
00
20
01
20
02
20
03
20
04
20
05
20
06
20
07
20
08
20
09
20
10
20
11
20
12
20
13
20
14
Gro
ss F
ixed
Cap
ital
Fo
rmat
ion
as
% o
f G
VA
All Mining
Coal Mining
Gold & Uranium Ore Mining
Other Mining
Other Mining
Coal Mining
Gold & Uranium Mining
10%
20%
30%
40%
50%
60%
-8% -6% -4% -2% 0% 2% 4% 6%
Ave
rage
Rat
io o
f G
FCF
to G
VA
: 20
08
to
20
14
Average Annual Growth in Real GVA: 2008 to 2014
Source of basic data: SARB Quarterly Bulletin
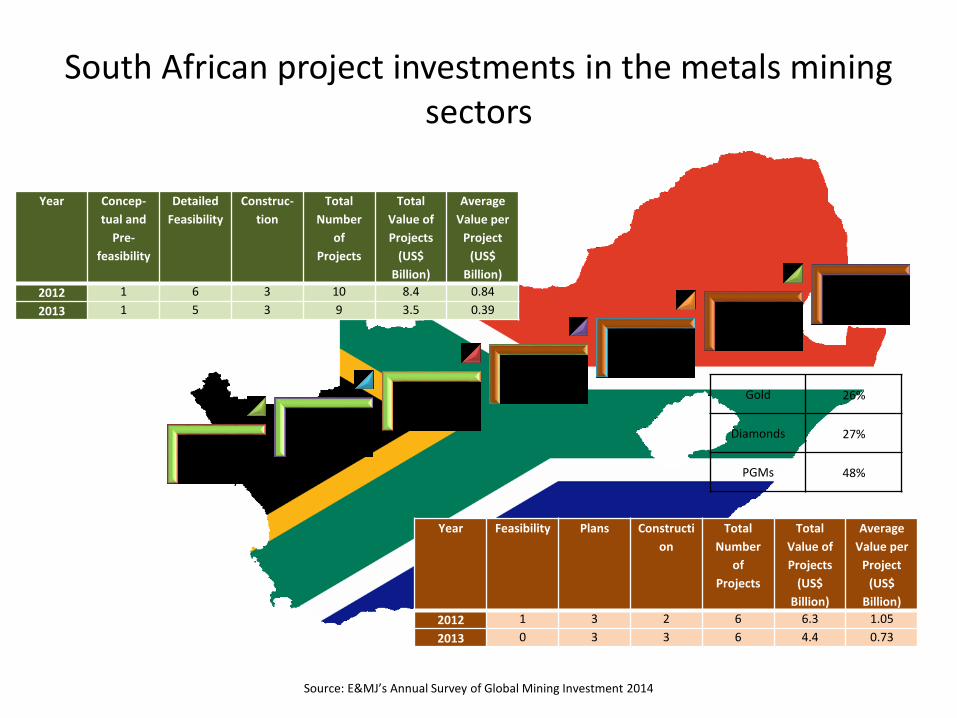
South African project investments in the metals mining sectors
Conceptual & Pre-feasibility
Feasibility
Construction
Operating -Feasibility
Operating –Plans
Operating –Construction
Other Brownfields
Source: E&MJ’s Annual Survey of Global Mining Investment 2014
Gold 26%
Diamonds 27%
PGMs 48%
Year Concep-
tual and
Pre-
feasibility
Detailed
Feasibility
Construc-
tion
Total
Number
of
Projects
Total
Value of
Projects
(US$
Billion)
Average
Value per
Project
(US$
Billion)
2012 1 6 3 10 8.4 0.84
2013 1 5 3 9 3.5 0.39
Year Feasibility Plans Constructi
on
Total
Number
of
Projects
Total
Value of
Projects
(US$
Billion)
Average
Value per
Project
(US$
Billion)
2012 1 3 2 6 6.3 1.05
2013 0 3 3 6 4.4 0.73
LOOKING FOR REASONS FOR SOUTH AFRICA’S DETERIORATING INVESTMENT PERFORMANCE
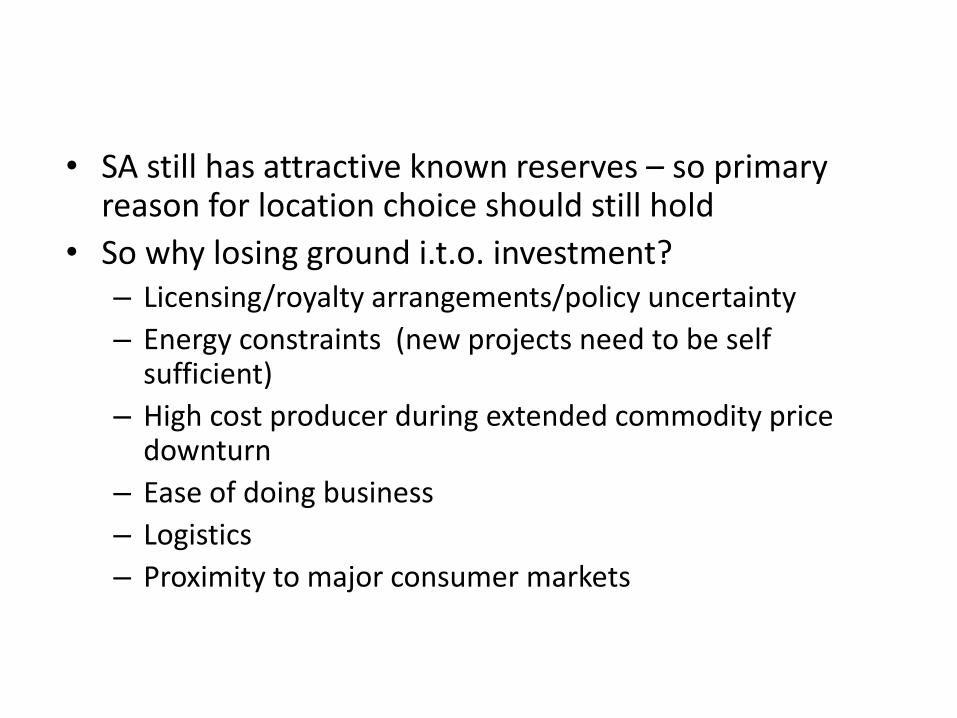
• SA still has attractive known reserves – so primary reason for location choice should still hold
• So why losing ground i.t.o. investment?– Licensing/royalty arrangements/policy uncertainty
– Energy constraints (new projects need to be self sufficient)
– High cost producer during extended commodity price downturn
– Ease of doing business
– Logistics
– Proximity to major consumer markets
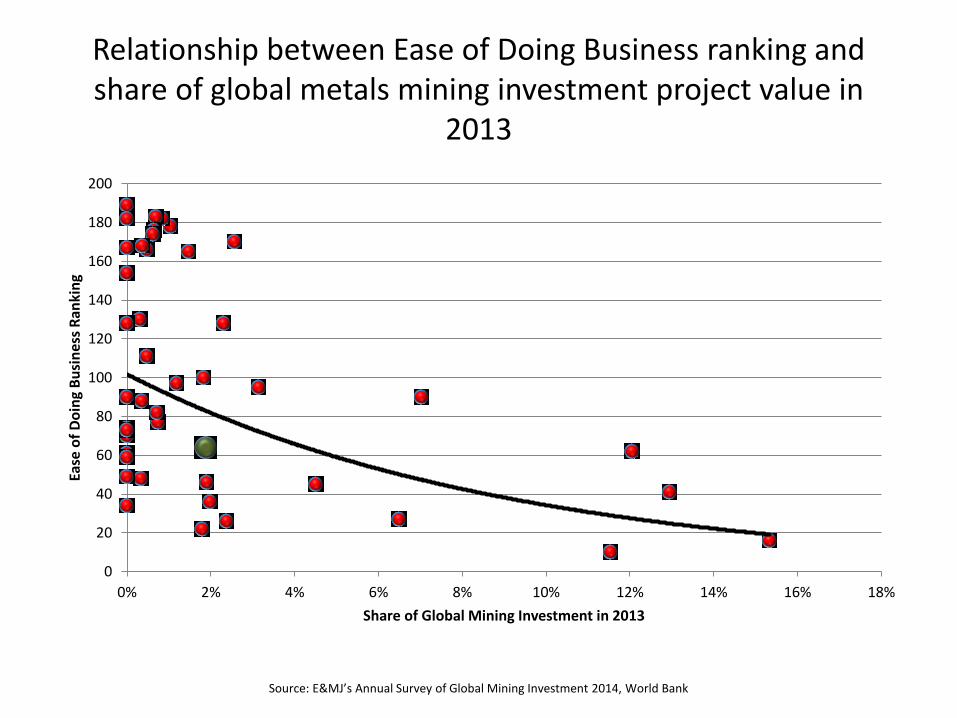
Relationship between Ease of Doing Business ranking and share of global metals mining investment project value in
2013
0
20
40
60
80
100
120
140
160
180
200
0% 2% 4% 6% 8% 10% 12% 14% 16% 18%
Ease
of
Do
ing
Bu
sin
ess
Ran
kin
g
Share of Global Mining Investment in 2013
Source: E&MJ’s Annual Survey of Global Mining Investment 2014, World Bank
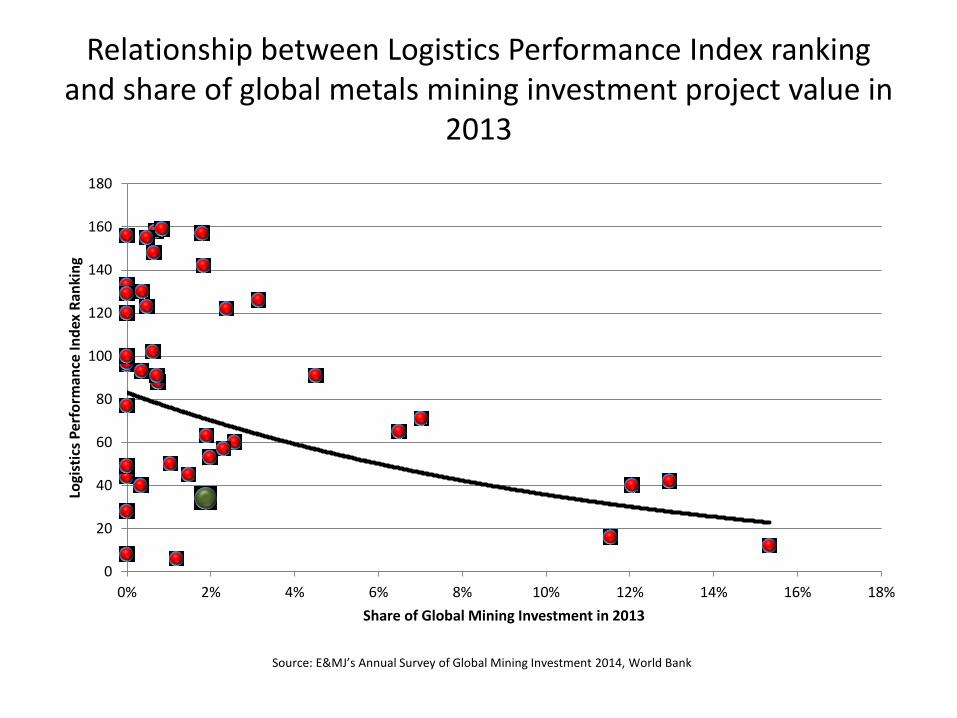
Relationship between Logistics Performance Index ranking and share of global metals mining investment project value in
2013
0
20
40
60
80
100
120
140
160
180
0% 2% 4% 6% 8% 10% 12% 14% 16% 18%
Logi
stic
s P
erfo
rman
ce In
dex
Ran
kin
g
Share of Global Mining Investment in 2013
Source: E&MJ’s Annual Survey of Global Mining Investment 2014, World Bank
Conclusion
• The nascent uptick in some commodity prices seems unlikely to gain significant momentum over the medium term: the bear market seems likely to remain intact.
• A sustainable price turnaround will depend largely on supply cuts rather than a dramatic recovery in demand
• A significant recovery in global mining investment therefore still seems some years off. The nature of investment will continue to shift to sustaining investment, rather than new mines.
• Even within the context of a gloomy global environment, South Africa’s mining sector has underperformed.
• While proximity to major markets is a factor, the main reasons for the underperformance appear to have been largely self-inflicted (policy uncertainty, electricity constraints, fractious labour relations).
• Given depressed output levels, investment has been high (in some cases unsustainably so), but there is still little indication that the nature of investment is consistent with a radically changed, mechanised mining sector.