Embed Size (px)
Citation preview
0
Olam International Limited
Investment in Greenfield Urea Manufacturing Facility in Gabon
15th November 2010 | Singapore
1
This presentation may contain statements regarding the businessof Olam International Limited and its subsidiaries (‘Group’) thatare of a forward looking nature and are therefore based onmanagement’s assumptions about future developments.
Such forward looking statements are intended to be identified bywords such as ‘believe’, ‘estimate’, ‘intend’, ‘may’, ‘will’, ‘expect’,and ‘project’ and similar expressions as they relate to the Group.Forward-looking statements involve certain risks anduncertainties because they relate to future events. Actual resultsmay vary materially from those targeted, expected or projecteddue to several factors.
Potential risks and uncertainties includes such factors as generaleconomic conditions, foreign exchange fluctuations, interest ratechanges, commodity price fluctuations and regulatorydevelopments. The reader and/or listener is cautioned to notunduly rely on these forward-looking statements. We do notundertake any duty to publish any update or revision of anyforward looking statements.
Cautionary note on forward-looking statements
2
In 2009, fertilizer manufacturing and distributionidentified as a growth opportunity
Goal
sStr
ateg
ic t
hru
sts
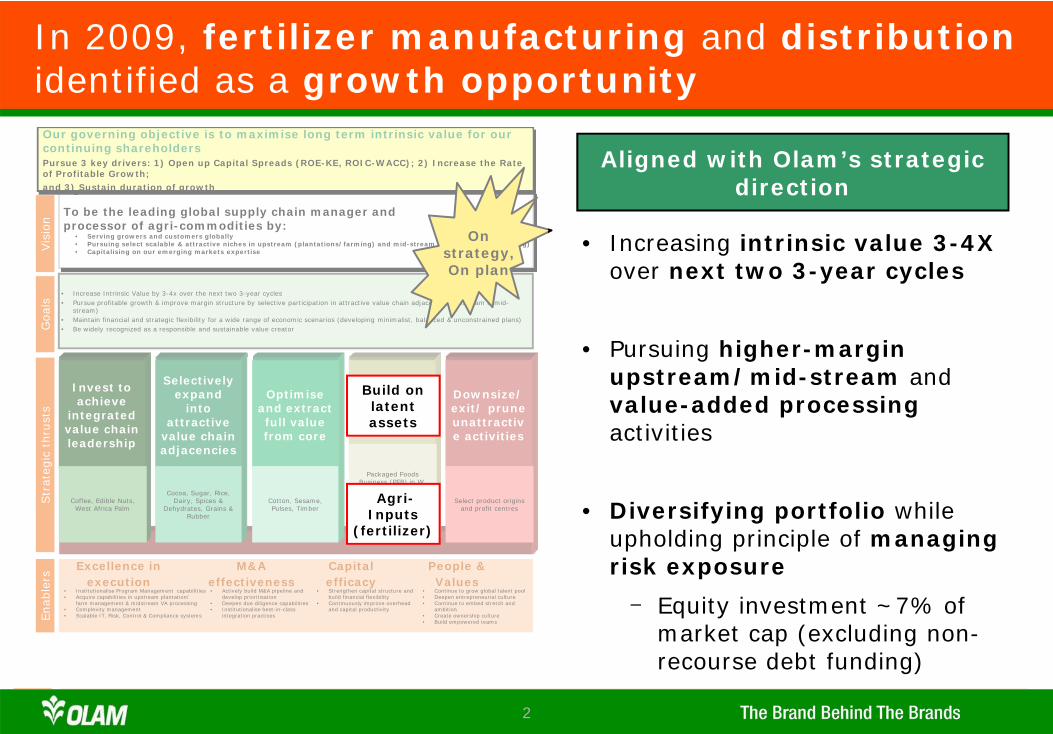
• Increase Intrinsic Value by 3-4x over the next two 3-year cycles• Pursue profitable growth & improve margin structure by selective participation in attractive value chain adjacencies (upstream & mid-stream)• Maintain financial and strategic flexibility for a wide range of economic scenarios (developing minimalist, balanced & unconstrained plans)• Be widely recognized as a responsible and sustainable value creator
Enab
lers
Excellence in execution Capital efficacyM&A effectiveness People & Values• Institutionalise Program Management
capabilities• Acquire capabilities in upstream plantation/
farm management & midstream VA processing• Complexity management• Scalable IT, Risk, Control & Compliance systems
• Continue to grow global talent pool• Deepen entrepreneurial culture• Continue to embed stretch and
ambition• Create ownership culture• Build empowered teams
• Actively build M&A pipeline and develop prioritisation
• Deepen due diligence capabilities• Institutionalise best-in-class
integration practices
• Strengthen capital structure and build financial flexibility
• Continuously improve overhead and capital productivity
Downsize/exit/ prune
unattractive activities
Build onlatent assets
Optimise and extract
full valuefrom core
Invest to achieve
integrated value chain
leadership
Selectively expand into
attractive value chain
adjacencies
To be the leading global supply chain manager and processor of agri-commodities by:• Serving growers and customers globally • Pursuing select scalable & attractive niches in upstream (plantations/farming) and mid-stream (value added processing)• Capitalising on our emerging markets expertiseV
isio
n
Our governing objective is to maximise long term intrinsic value for our continuing shareholdersPursue 3 key drivers: 1) Open up Capital Spreads (ROE-KE, ROIC-WACC); 2) Increase the Rate of Profitable Growth; and 3) Sustain duration of growth
Cocoa, Sugar, Rice, Dairy, Spices &
Dehydrates, Grains & Rubber
Cotton, Sesame, Pulses, Timber
Select product origins and profit centres
Packaged Foods Business (PFB) in W. Africa,
Commodity Financial Services (CFS), Agri-
Inputs (fertiliser)
Coffee, Edible Nuts, West Africa Palm
On strategy, On plan
Build on latent assets
Agri-Inputs(fertilizer)
Goal
sStr
ateg
ic t
hru
sts
• Increase Intrinsic Value by 3-4x over the next two 3-year cycles• Pursue profitable growth & improve margin structure by selective participation in attractive value chain adjacencies (upstream & mid-
stream)• Maintain financial and strategic flexibility for a wide range of economic scenarios (developing minimalist, balanced & unconstrained plans)• Be widely recognized as a responsible and sustainable value creator
Enab
lers
Excellence in execution
Capital efficacy
M&A effectiveness
People & Values
• Institutionalise Program Management capabilities• Acquire capabilities in upstream plantation/
farm management & midstream VA processing• Complexity management• Scalable IT, Risk, Control & Compliance systems
• Continue to grow global talent pool• Deepen entrepreneurial culture• Continue to embed stretch and
ambition• Create ownership culture• Build empowered teams
• Actively build M&A pipeline and develop prioritisation
• Deepen due diligence capabilities• Institutionalise best-in-class
integration practices
• Strengthen capital structure and build financial flexibility
• Continuously improve overhead and capital productivity
Downsize/exit/ prune unattractive activities
Build onlatent assets
Optimise and extractfull valuefrom core
Invest to achieve
integrated value chain leadership
Selectively expand
into attractive
value chain adjacencies
To be the leading global supply chain manager and processor of agri-commodities by:
• Serving growers and customers globally • Pursuing select scalable & attractive niches in upstream (plantations/farming) and mid-stream (value added processing)• Capitalising on our emerging markets expertiseV
isio
n
Our governing objective is to maximise long term intrinsic value for our continuing shareholdersPursue 3 key drivers: 1) Open up Capital Spreads (ROE-KE, ROIC-WACC); 2) Increase the Rate of Profitable Growth; and 3) Sustain duration of growth
Cocoa, Sugar, Rice, Dairy, Spices &
Dehydrates, Grains & Rubber
Cotton, Sesame, Pulses, Timber
Select product origins and profit centres
On strategy, On plan
Packaged Foods Business (PFB) in W. Africa, Commodity Financial Services (CFS), Agri-Inputs
(fertiliser)
Coffee, Edible Nuts, West Africa Palm
Build on latent assets
Agri-Inputs
(fertilizer)
• Increasing intrinsic value 3-4Xover next two 3-year cycles
• Pursuing higher-marginupstream/mid-stream and value-added processingactivities
• Diversifying portfolio while upholding principle of managing risk exposure
- Equity investment ~7% of market cap (excluding non-recourse debt funding)
Aligned with Olam’s strategic direction
3
Investment Summary
Overview
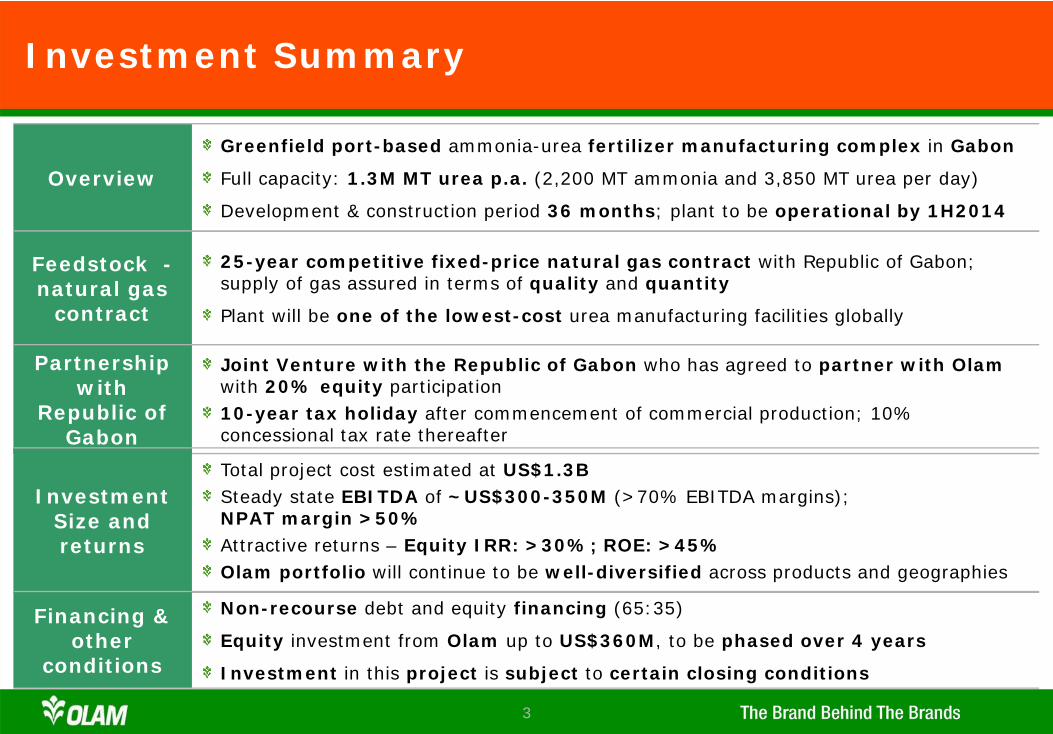
Greenfield port-based ammonia-urea fertilizer manufacturing complex in Gabon
Full capacity: 1.3M MT urea p.a. (2,200 MT ammonia and 3,850 MT urea per day)
Development & construction period 36 months; plant to be operational by 1H2014
Feedstock -natural gas
contract
25-year competitive fixed-price natural gas contract with Republic of Gabon; supply of gas assured in terms of quality and quantity
Plant will be one of the lowest-cost urea manufacturing facilities globally
Partnership with
Republic of Gabon
Joint Venture with the Republic of Gabon who has agreed to partner with Olam with 20% equity participation10-year tax holiday after commencement of commercial production; 10% concessional tax rate thereafter
Investment Size and returns
Total project cost estimated at US$1.3BSteady state EBITDA of ~US$300-350M (>70% EBITDA margins);NPAT margin >50%Attractive returns – Equity IRR: >30%; ROE: >45%Olam portfolio will continue to be well-diversified across products and geographies
Financing & other
conditions
Non-recourse debt and equity financing (65:35)
Equity investment from Olam up to US$360M, to be phased over 4 years
Investment in this project is subject to certain closing conditions
4
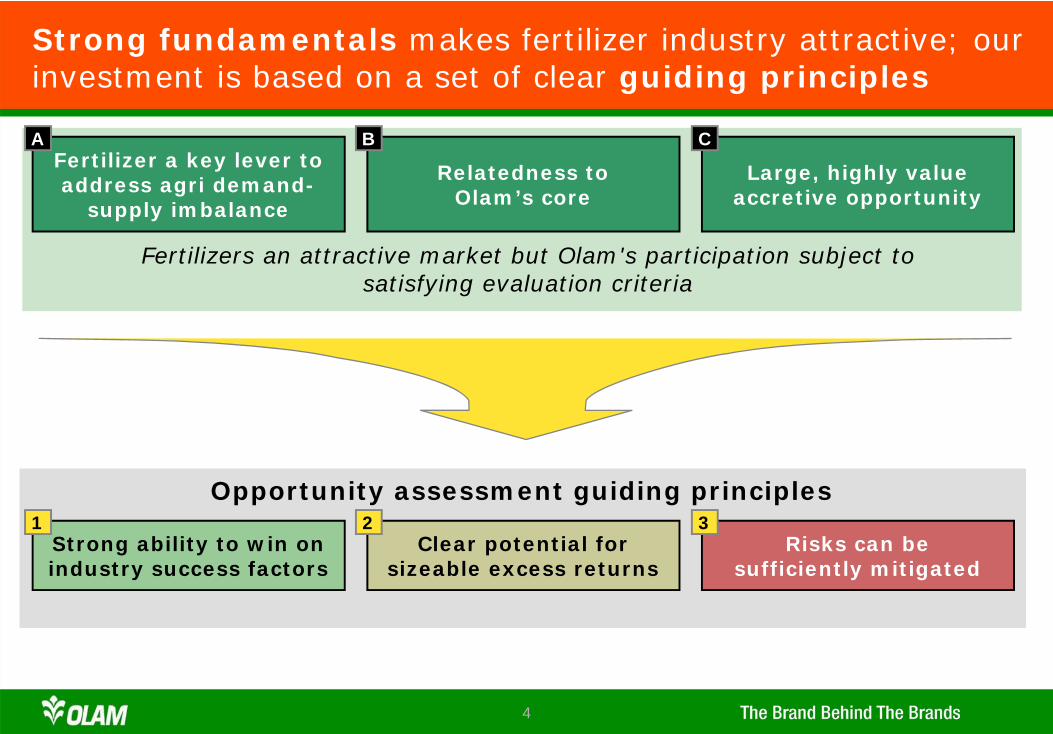
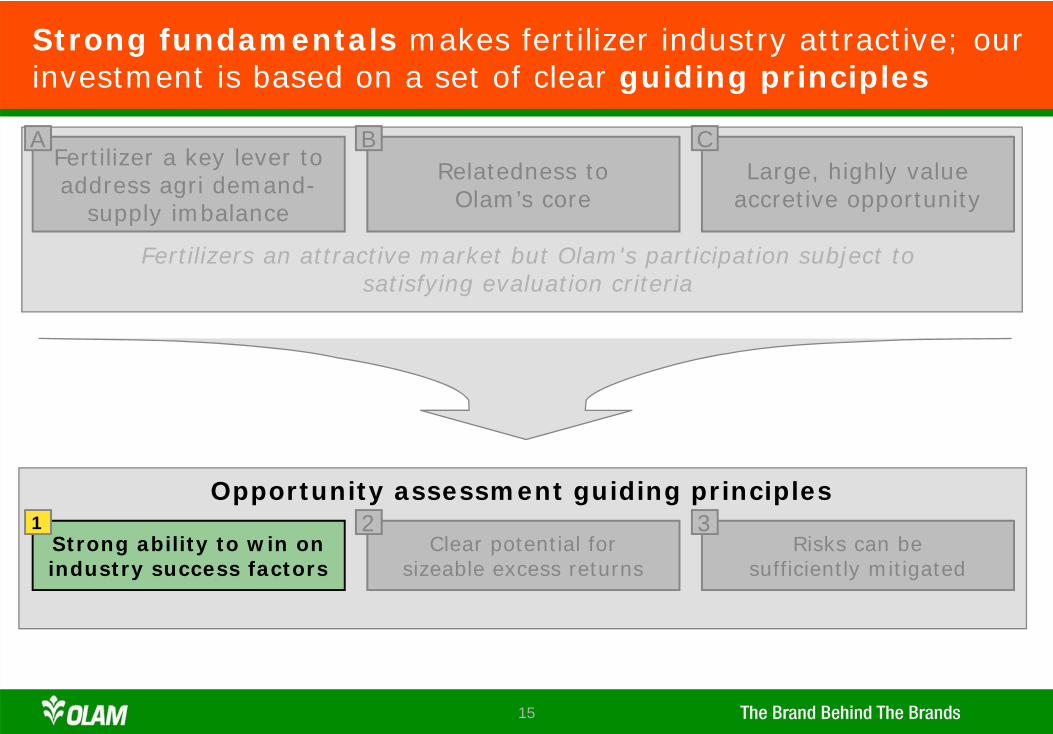
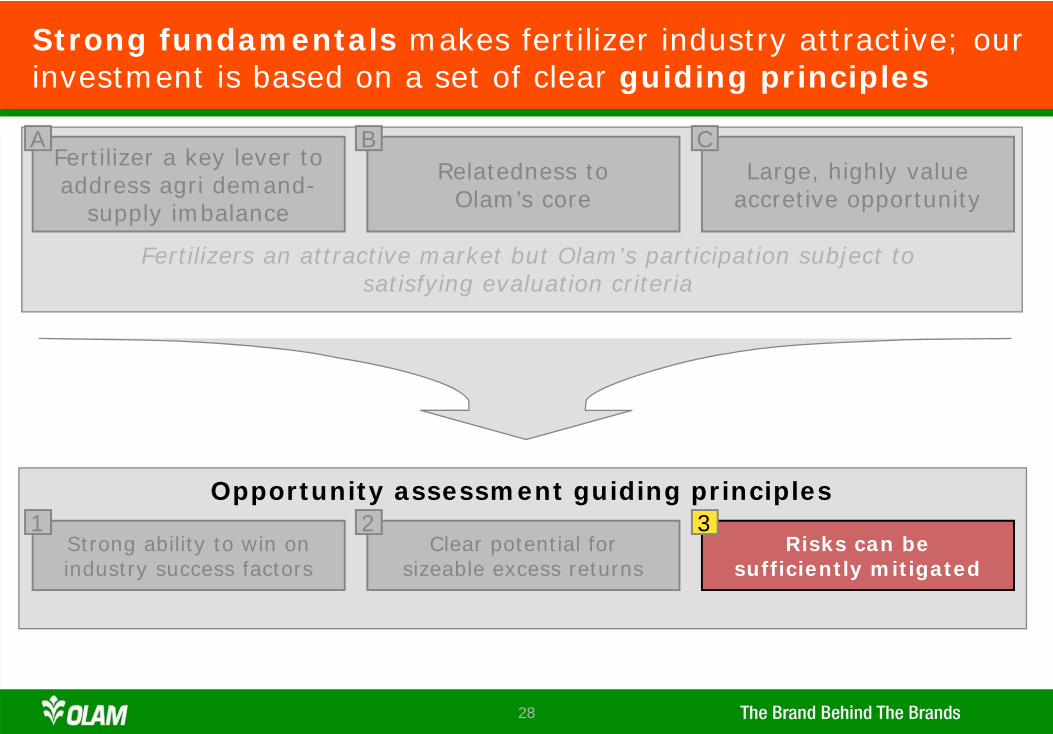
Strong fundamentals makes fertilizer industry attractive; our investment is based on a set of clear guiding principles
Strong ability to win on industry success factors
Clear potential forsizeable excess returns
Risks can be sufficiently mitigated
Opportunity assessment guiding principles
Relatedness to Olam’s core
Fertilizer a key lever to address agri demand-
supply imbalance
Large, highly value accretive opportunity
Fertilizers an attractive market but Olam's participation subject to satisfying evaluation criteria
A B C
1 2 3
5
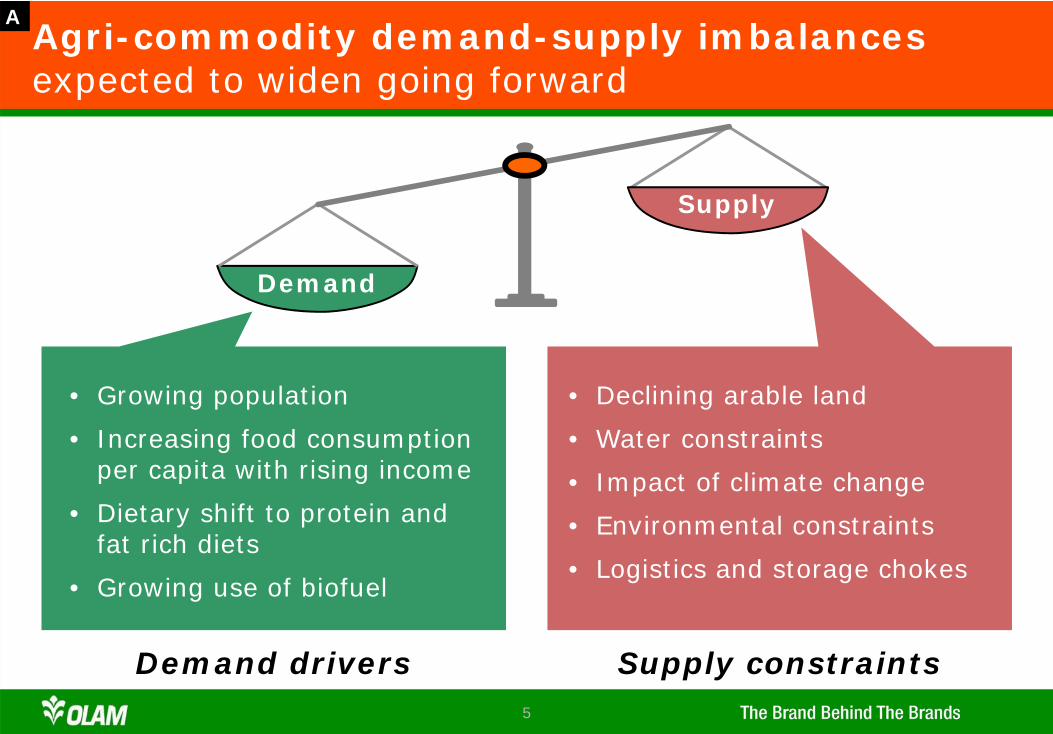
Agri-commodity demand-supply imbalancesexpected to widen going forward
A
Supply
Demand
• Growing population
• Increasing food consumption per capita with rising income
• Dietary shift to protein and fat rich diets
• Growing use of biofuel
• Declining arable land
• Water constraints
• Impact of climate change
• Environmental constraints
• Logistics and storage chokes
Demand drivers Supply constraints
6
-50
0
50
100
150%
-7
196 104 73
74
-23
44 34 30
-1
150
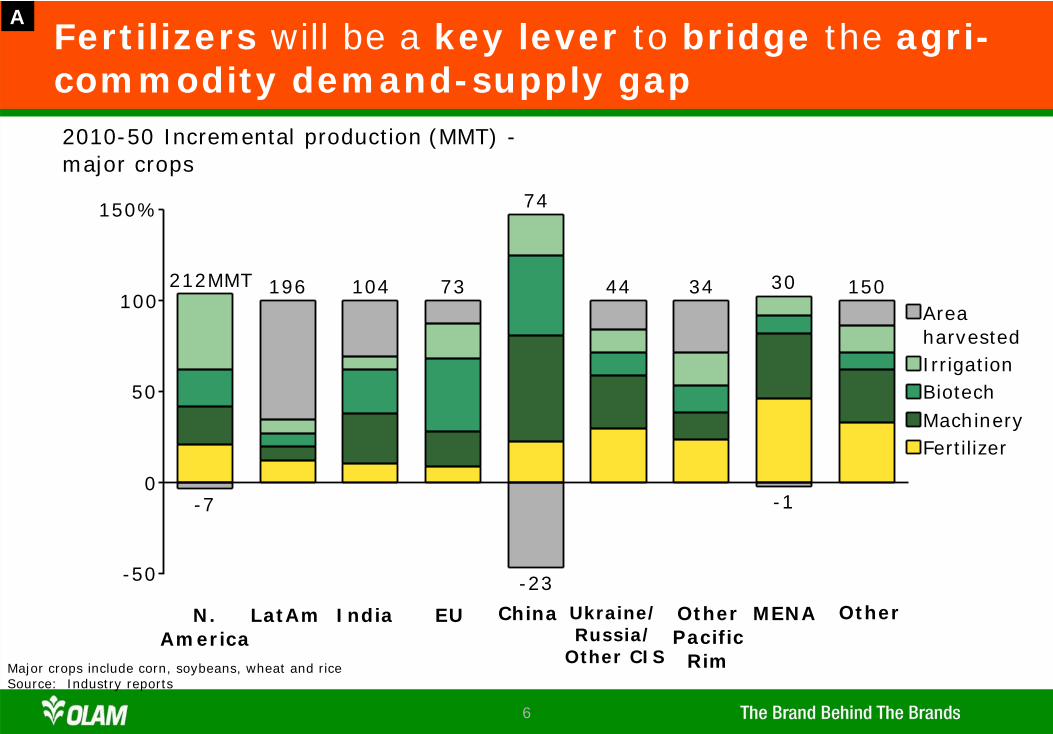
2010-50 Incremental production (MMT) -major crops
N.America
212MMT
LatAm India EU China Ukraine/Russia/
Other CIS
OtherPacific
Rim
MENA Other
FertilizerMachineryBiotechIrrigation
Areaharvested
Fertilizers will be a key lever to bridge the agri-commodity demand-supply gap
Major crops include corn, soybeans, wheat and riceSource: Industry reports
A
7
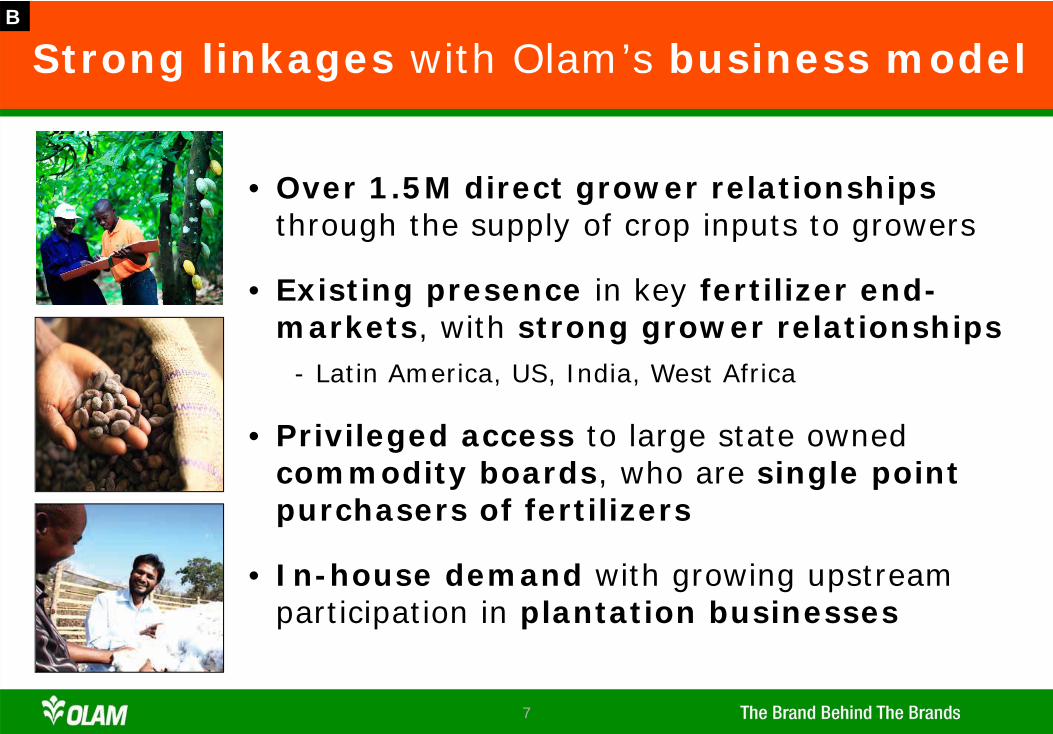
Strong linkages with Olam’s business model
• Over 1.5M direct grower relationships through the supply of crop inputs to growers
• Existing presence in key fertilizer end-markets, with strong grower relationships
- Latin America, US, India, West Africa
• Privileged access to large state owned commodity boards, who are single point purchasers of fertilizers
• In-house demand with growing upstream participation in plantation businesses
B
8
Large and highly value accretive opportunity
• Access to low cost feedstock in Gabon results in one of the lowest cost of production for urea globally and offers a high margin of safety
• Large absolute size of prize - potential to addUS$300-350M EBITDA (>70% margin) in steady-state; NPAT margin >50%
• Extremely attractive returns – Equity IRR >30%; ROE > 45%
C
9
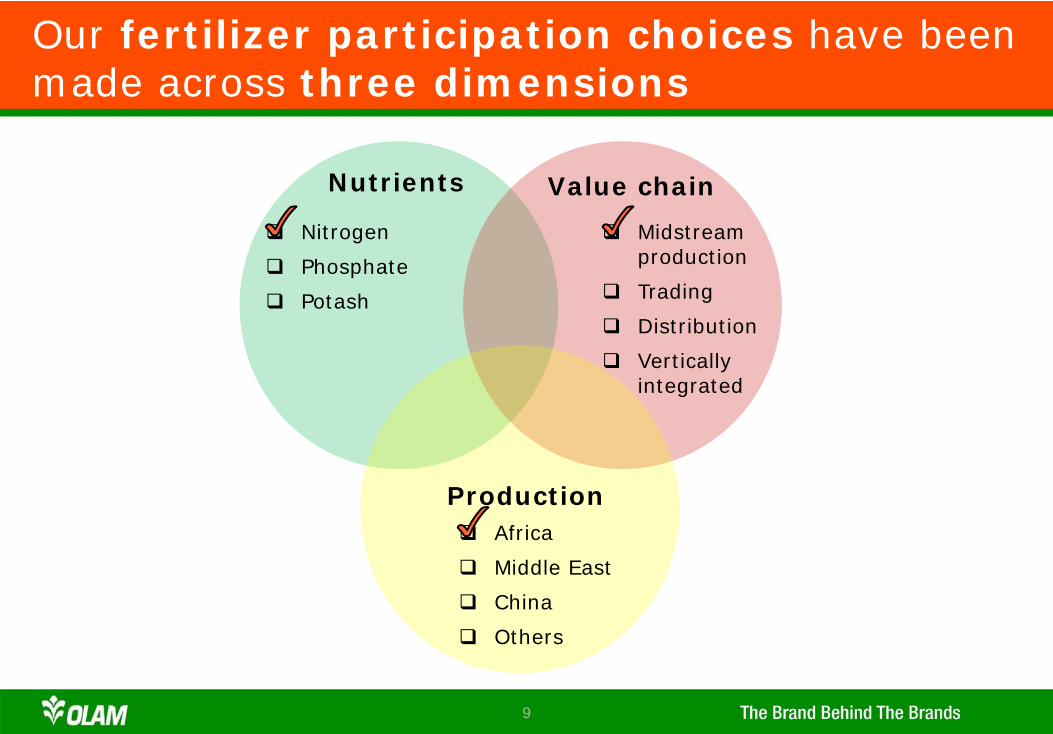
Our fertilizer participation choices have been made across three dimensions
Nutrients Value chain
Production
Midstream production
Trading
Distribution
Vertically integrated
Nitrogen
Phosphate
Potash
Africa
Middle East
China
Others
10
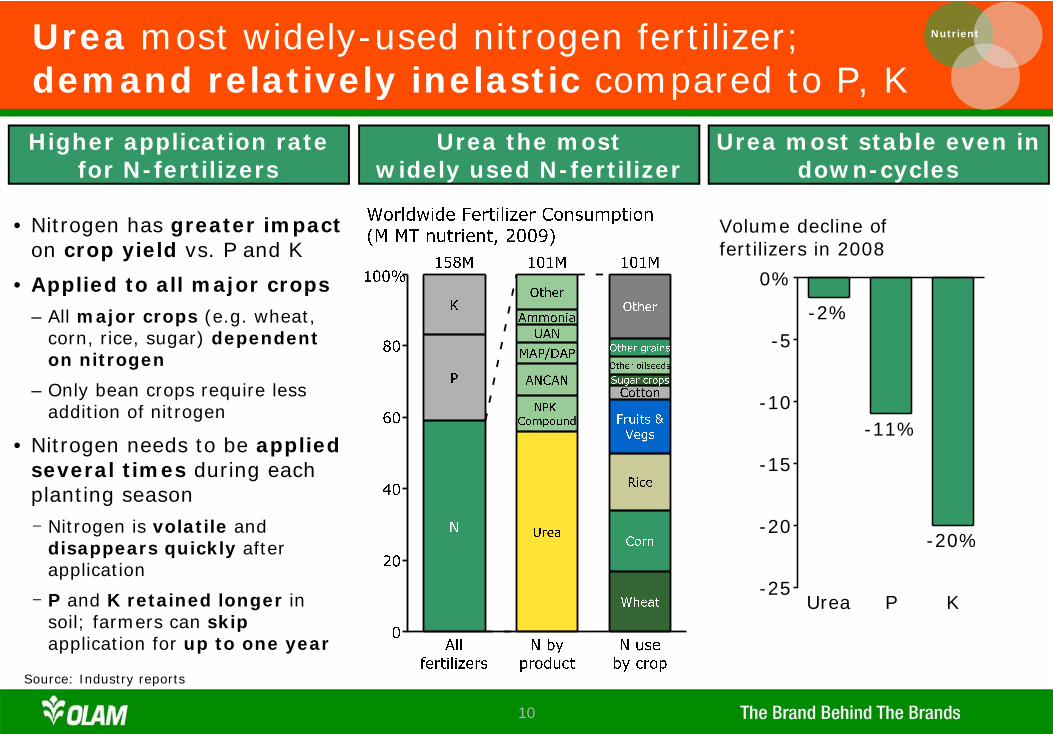
Urea most widely-used nitrogen fertilizer; demand relatively inelastic compared to P, K
Source: Industry reports
Nutrient
Urea most stable even in down-cycles
-25
-20
-15
-10
-5
0%
Urea
-2%
P
-11%
K
-20%
Volume decline offertilizers in 2008
Urea the most widely used N-fertilizer
• Nitrogen has greater impact on crop yield vs. P and K
• Applied to all major crops– All major crops (e.g. wheat,
corn, rice, sugar) dependent on nitrogen
– Only bean crops require less addition of nitrogen
• Nitrogen needs to be applied several times during each planting season- Nitrogen is volatile and
disappears quickly after application
- P and K retained longer in soil; farmers can skip application for up to one year
Higher application rate for N-fertilizers
11
0
25
50
75
100
125
0
25
50
75
100
125
2009
82
2010E
87
2011E
92
2012E
97
2013E
99
2014E
101
2015E
103
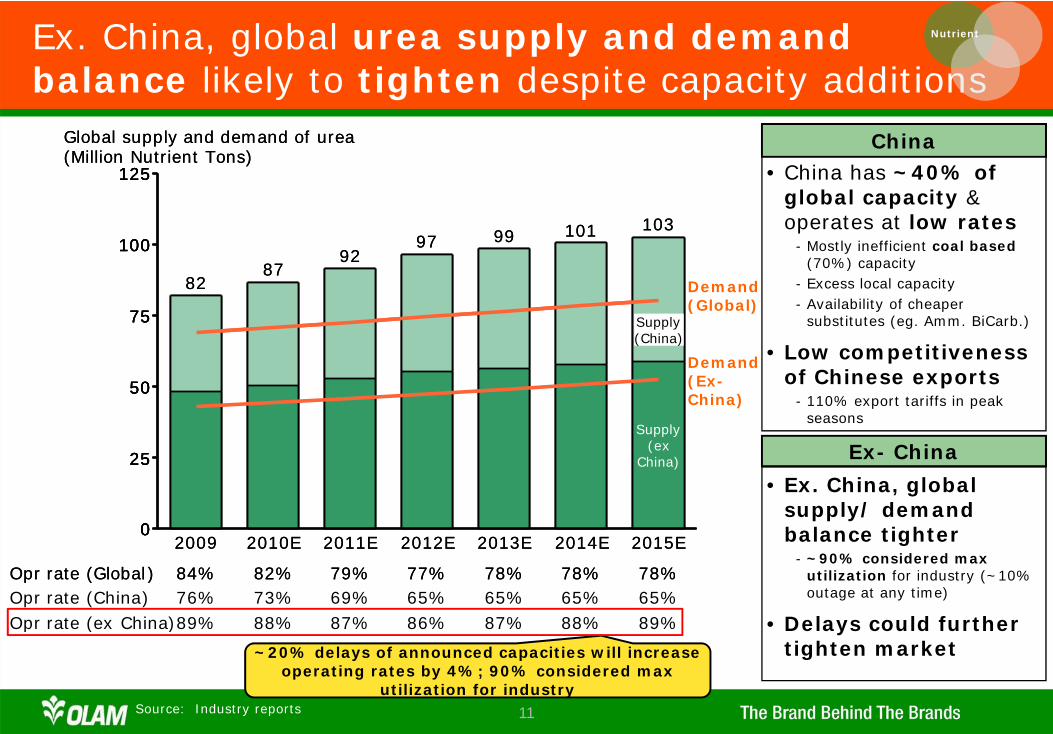
Global supply and demand of urea(Million Nutrient Tons)
Globalsupply
84% 82% 79% 77% 78% 78% 78%Opr rate (Global)
0
25
50
75
100
125
0
25
50
75
100
125
2009
82
2010E
87
2011E
92
2012E
97
2013E
99
2014E
101
2015E
Supply(ex
China)
103
Global supply and demand of urea(Million Nutrient Tons)
Supply(China)
84% 82% 79% 77% 78% 78% 78%Opr rate (Global)76% 73% 69% 65% 65% 65% 65%Opr rate (China)89% 88% 87% 86% 87% 88% 89%Opr rate (ex China)
Ex. China, global urea supply and demand balance likely to tighten despite capacity additions
Source: Industry reports
Nutrient
Demand (Global)
Demand (Ex-China)
~20% delays of announced capacities will increase operating rates by 4%; 90% considered max
utilization for industry
• China has ~40% of global capacity & operates at low rates
- Mostly inefficient coal based(70%) capacity
- Excess local capacity- Availability of cheaper
substitutes (eg. Amm. BiCarb.)
• Low competitiveness of Chinese exports
- 110% export tariffs in peak seasons
China
• Ex. China, global supply/ demand balance tighter
- ~90% considered max utilization for industry (~10% outage at any time)
• Delays could further tighten market
Ex- China
12
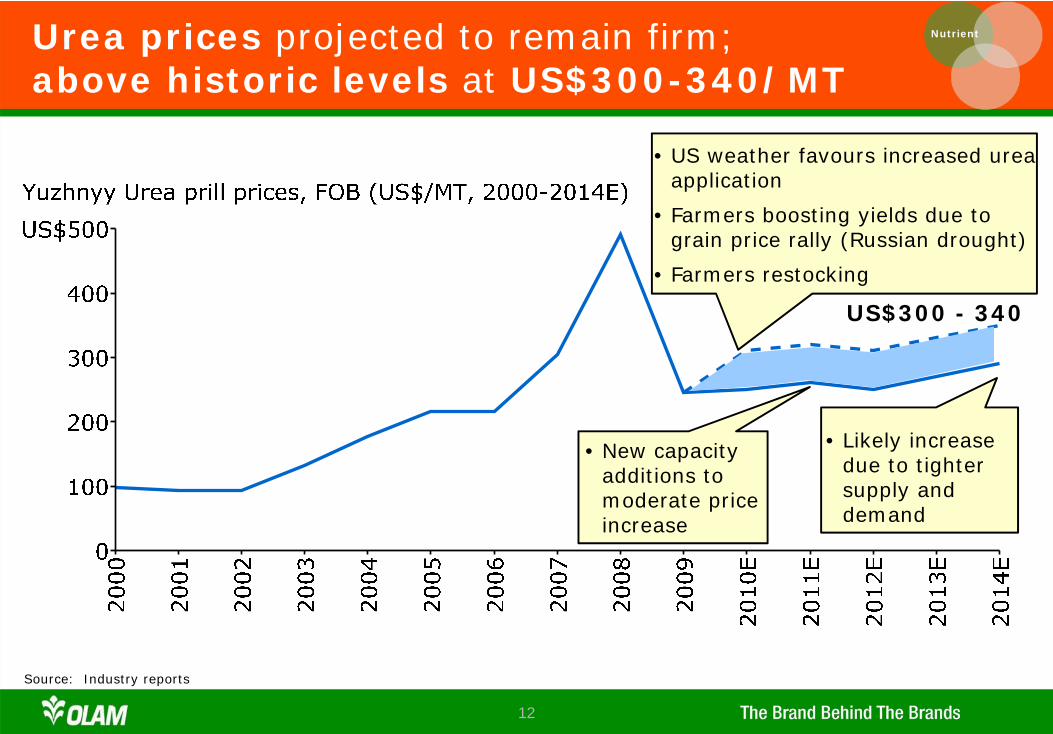
Urea prices projected to remain firm;above historic levels at US$300-340/MT
Source: Industry reports
• US weather favours increased urea application
• Farmers boosting yields due to grain price rally (Russian drought)
• Farmers restocking
• Likely increase due to tighter supply and demand
US$300 - 340
• New capacity additions to moderate price increase
Nutrient
13
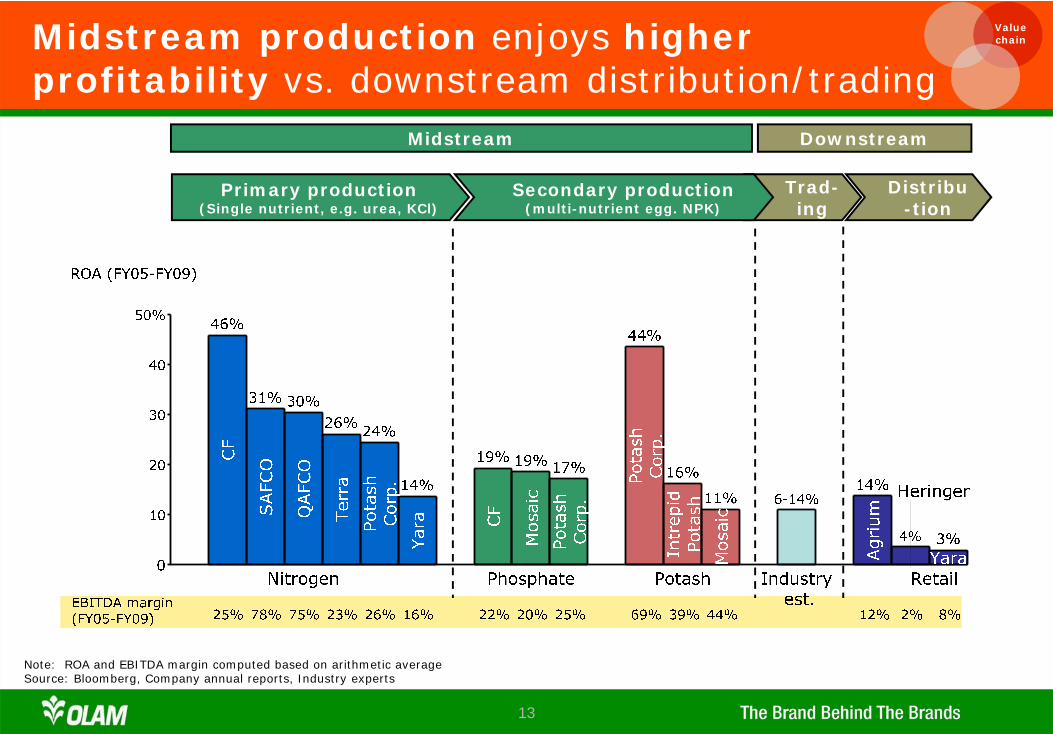
Midstream production enjoys higher profitability vs. downstream distribution/trading
Note: ROA and EBITDA margin computed based on arithmetic averageSource: Bloomberg, Company annual reports, Industry experts
Primary production(Single nutrient, e.g. urea, KCl)
Trad-ing
Secondary production (multi-nutrient egg. NPK)
Distribu-tion
Midstream Downstream
Value chain
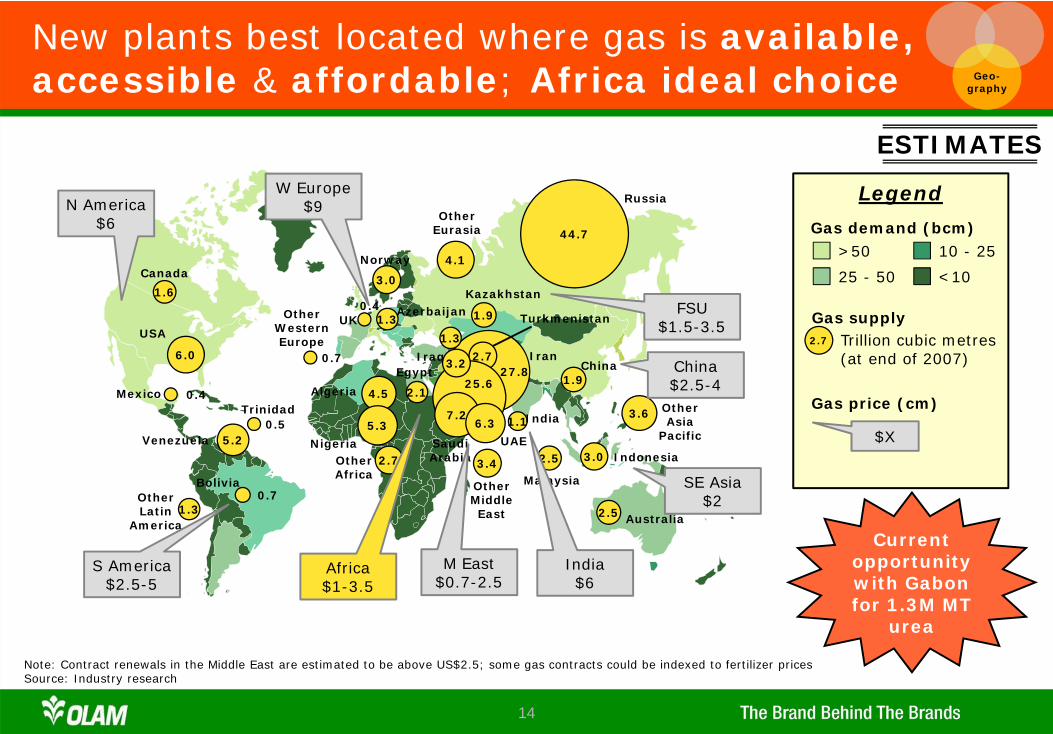
14
New plants best located where gas is available, accessible & affordable; Africa ideal choice
Other Asia
Pacific
Australia
UAE
Iran
Indonesia
1.1
3.0
3.6
2.5
Turkmenistan
Malaysia
India
China
5.2
27.82.7
2.5
1.9Algeria
NigeriaOther Africa
Other Middle East
Saudi Arabia
Egypt
Other Eurasia
Russia
44.7
Norway
Kazakhstan
Iraq
AzerbaijanUK
Canada
USA
Mexico
Venezuela
Trinidad
Other Western Europe
BoliviaOther Latin
America
1.6
6.0
0.4
0.5
0.71.3
0.7
0.41.3
3.0
4.1
1.9
1.3
2.14.5
5.3
25.6
3.2
7.26.3
3.42.7
FSU$1.5-3.5
China$2.5-4
SE Asia$2
India$6
Africa$1-3.5
S America$2.5-5
N America$6
W Europe$9
M East$0.7-2.5
Geo-graphy
>50
25 - 50
10 - 25
<10
Gas demand (bcm)
Trillion cubic metres (at end of 2007)
2.7
Gas supply
Gas price (cm)
$X
Legend
Note: Contract renewals in the Middle East are estimated to be above US$2.5; some gas contracts could be indexed to fertilizer pricesSource: Industry research
Current opportunity with Gabon for 1.3M MT
urea
ESTIMATES
15
Strong fundamentals makes fertilizer industry attractive; our investment is based on a set of clear guiding principles
Strong ability to win on industry success factors
Clear potential forsizeable excess returns
Risks can besufficiently mitigated
Opportunity assessment guiding principles
Relatedness to Olam’s core
Fertilizer a key lever to address agri demand-
supply imbalance
Large, highly value accretive opportunity
Fertilizers an attractive market but Olam's participation subject to satisfying evaluation criteria
A B C
1 2 3
16
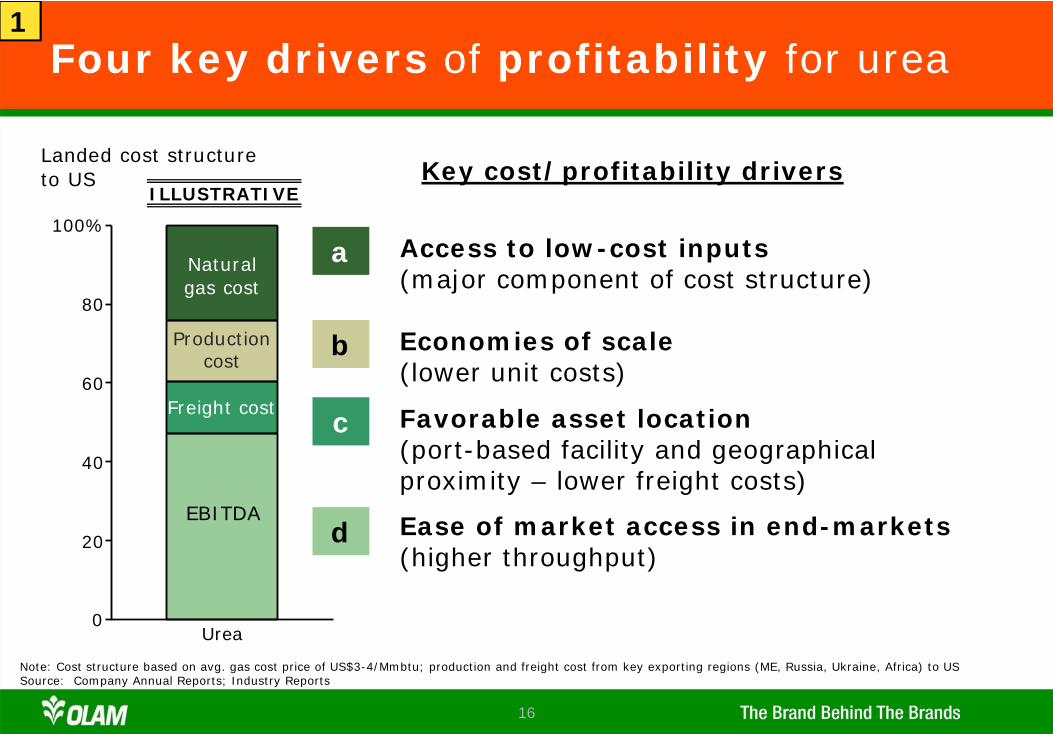
Four key drivers of profitability for urea
• Access to low-cost inputs(major component of cost structure)
0
20
40
60
80
100%
Urea
Freight cost
Landed cost structureto US
EBITDA
Naturalgas cost
Productioncost
a
• Favorable asset location (port-based facility and geographical proximity – lower freight costs)
• Ease of market access in end-markets (higher throughput)
c
d
Key cost/profitability drivers
Note: Cost structure based on avg. gas cost price of US$3-4/Mmbtu; production and freight cost from key exporting regions (ME, Russia, Ukraine, Africa) to USSource: Company Annual Reports; Industry Reports
• Economies of scale (lower unit costs)
b
ILLUSTRATIVE
11
17
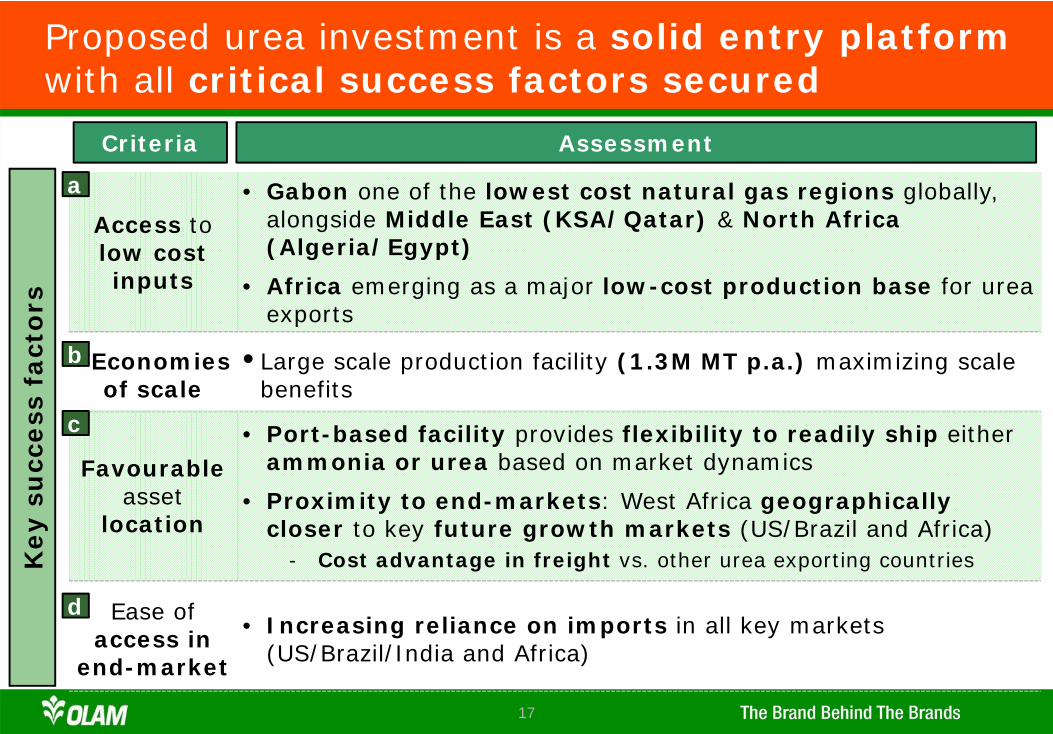
Proposed urea investment is a solid entry platform with all critical success factors secured
Key s
ucc
ess
fact
ors
Access tolow cost inputs
• Gabon one of the lowest cost natural gas regions globally, alongside Middle East (KSA/Qatar) & North Africa (Algeria/Egypt)
• Africa emerging as a major low-cost production base for urea exports
Criteria Assessment
Economies of scale
• Large scale production facility (1.3M MT p.a.) maximizing scale benefits
Favourableasset
location
• Port-based facility provides flexibility to readily ship eitherammonia or urea based on market dynamics
• Proximity to end-markets: West Africa geographically closer to key future growth markets (US/Brazil and Africa)
- Cost advantage in freight vs. other urea exporting countries
Ease of access in
end-market
• Increasing reliance on imports in all key markets (US/Brazil/India and Africa)
a
b
c
d
18
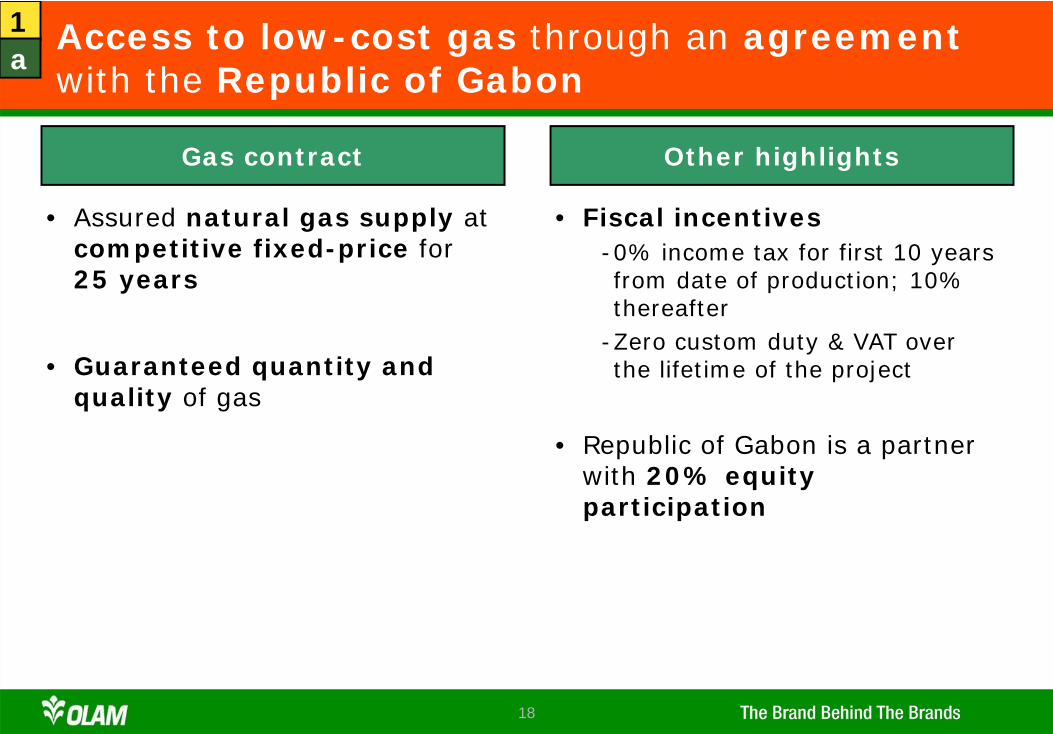
Access to low-cost gas through an agreementwith the Republic of Gabon
• Assured natural gas supply at competitive fixed-price for 25 years
• Guaranteed quantity and quality of gas
• Fiscal incentives-0% income tax for first 10 years from date of production; 10% thereafter
-Zero custom duty & VAT over the lifetime of the project
• Republic of Gabon is a partner with 20% equity participation
Gas contract Other highlights
1a
19
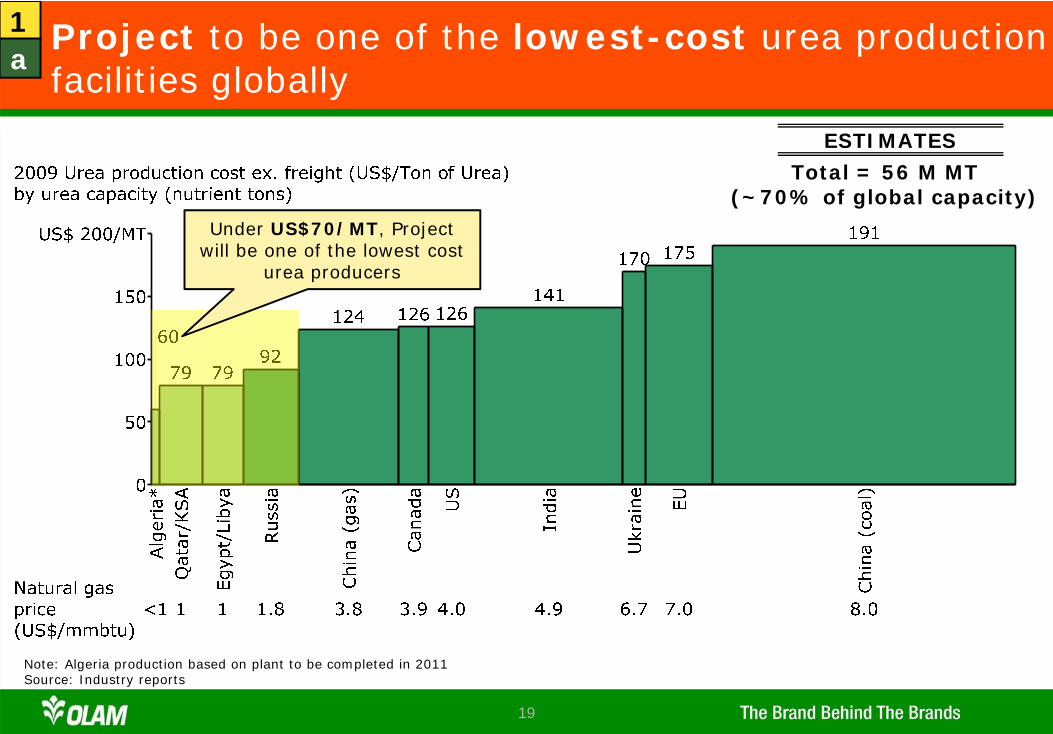
Note: Algeria production based on plant to be completed in 2011 Source: Industry reports
Project to be one of the lowest-cost urea production facilities globally
ESTIMATES
Total = 56 M MT(~70% of global capacity)
Under US$70/MT, Project will be one of the lowest cost
urea producers
1a
20
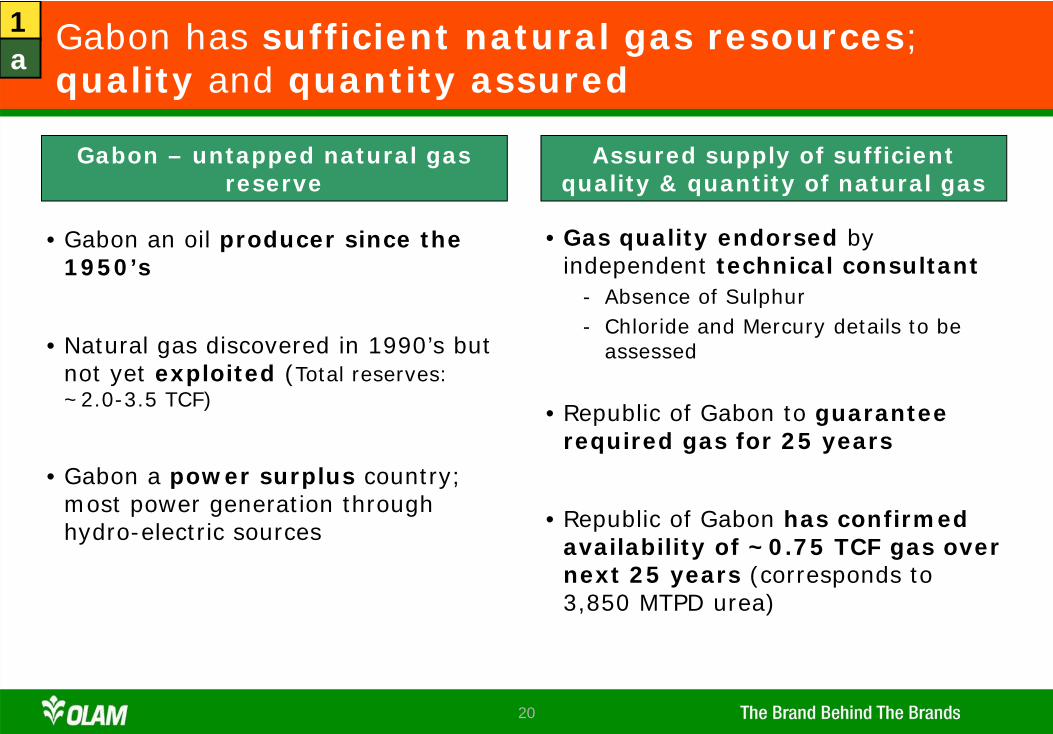
Gabon has sufficient natural gas resources; quality and quantity assured
• Gabon an oil producer since the 1950’s
• Natural gas discovered in 1990’s but not yet exploited (Total reserves: ~2.0-3.5 TCF)
• Gabon a power surplus country; most power generation through hydro-electric sources
• Republic of Gabon to guarantee required gas for 25 years
• Republic of Gabon has confirmed availability of ~0.75 TCF gas over next 25 years (corresponds to 3,850 MTPD urea)
• Gas quality endorsed by independent technical consultant
- Absence of Sulphur- Chloride and Mercury details to be
assessed
Assured supply of sufficient quality & quantity of natural gas
1a
Gabon – untapped natural gas reserve
21
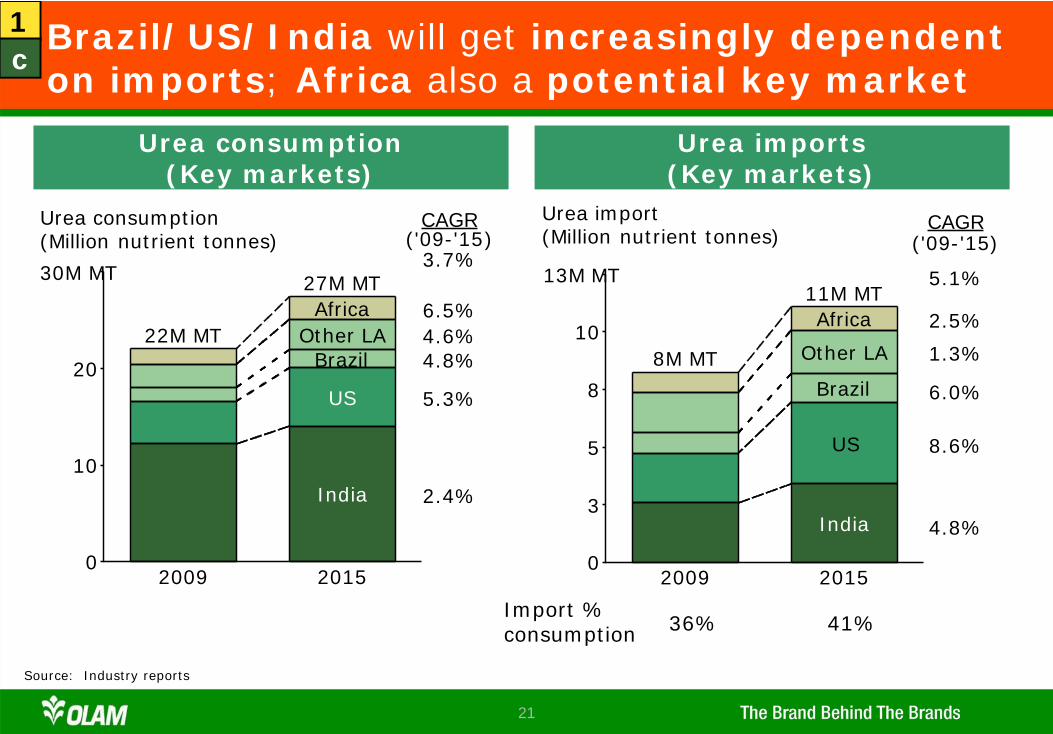
Brazil/US/India will get increasingly dependent on imports; Africa also a potential key market
0
10
20
2009
22M MT
2015
AfricaOther LA
Brazil
US
India
27M MT
Urea consumption(Million nutrient tonnes)
30M MT
2.4%
5.3%
4.8%4.6%6.5%
('09-'15)3.7%
CAGR
Source: Industry reports
Urea consumption(Key markets)
Urea imports(Key markets)
0
3
5
8
10
Urea import(Million nutrient tonnes)
2009
8M MT
2015
India
Brazil
Africa
Other LA
11M MT13M MT
US
4.8%
8.6%
6.0%
1.3%
2.5%
('09-'15)
5.1%
CAGR
36% 41%Import % consumption
1c
22
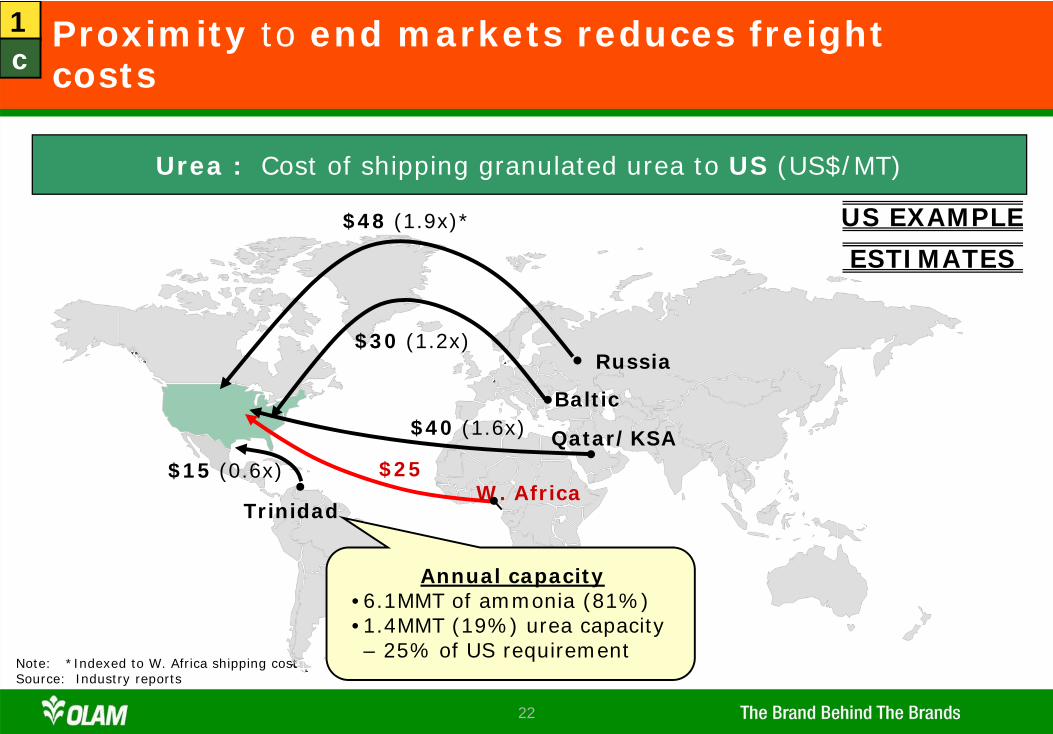
Proximity to end markets reduces freightcosts
Note: *Indexed to W. Africa shipping costSource: Industry reports
Urea : Cost of shipping granulated urea to US (US$/MT)
Qatar/KSA
Russia
Baltic
$48 (1.9x)*
$30 (1.2x)
$40 (1.6x)
$25W. Africa
Trinidad
$15 (0.6x)
US EXAMPLE
Annual capacity•6.1MMT of ammonia (81%)•1.4MMT (19%) urea capacity – 25% of US requirement
ESTIMATES
1c
23
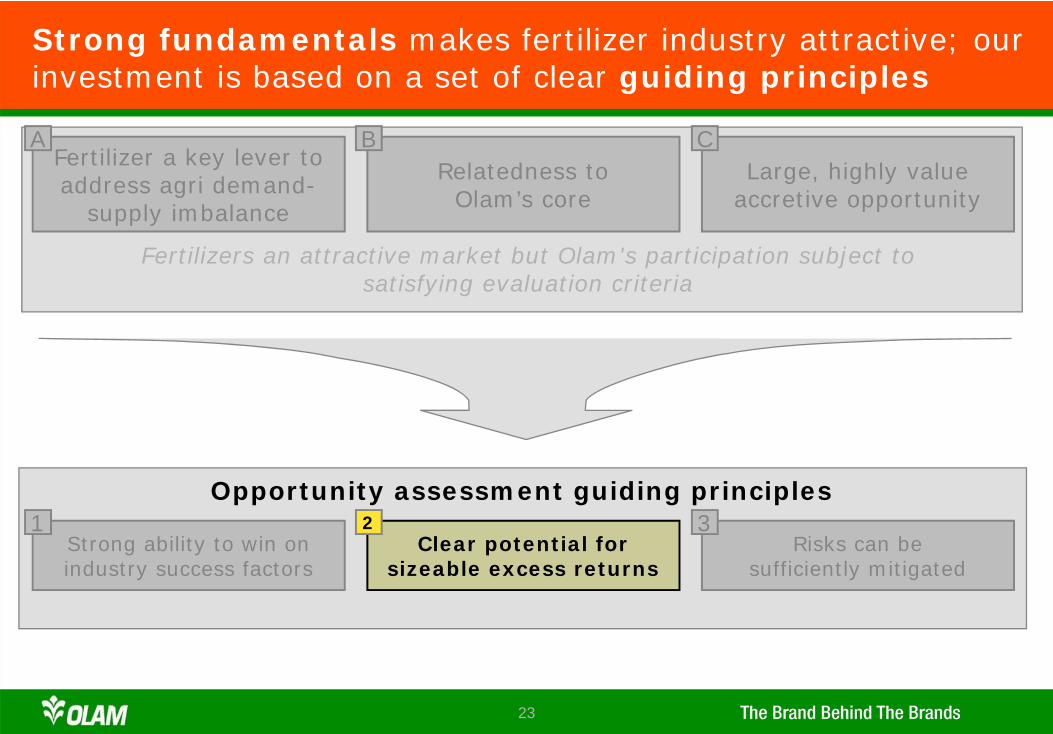
Strong fundamentals makes fertilizer industry attractive; our investment is based on a set of clear guiding principles
Strong ability to win on industry success factors
Clear potential forsizeable excess returns
Risks can besufficiently mitigated
Opportunity assessment guiding principles
Relatedness to Olam’s core
Fertilizer a key lever to address agri demand-
supply imbalance
Large, highly value accretive opportunity
Fertilizers an attractive market but Olam's participation subject to satisfying evaluation criteria
A B C
1 2 3
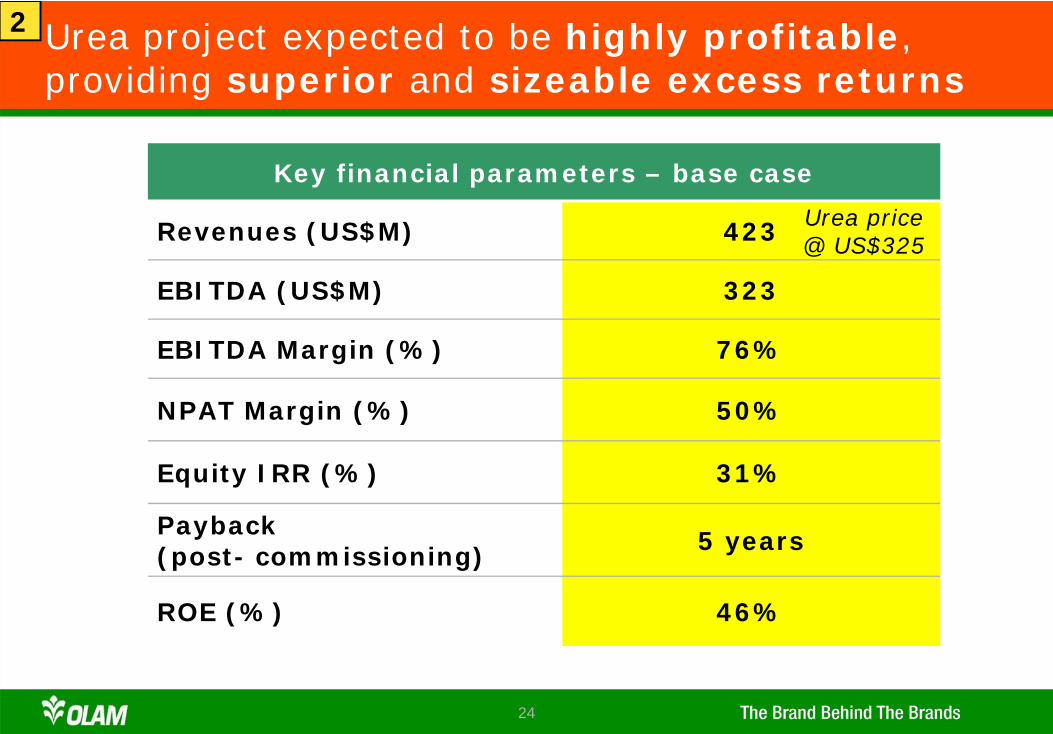
24
Key financial parameters – base case
Revenues (US$M) 423
EBITDA (US$M) 323
EBITDA Margin (%) 76%
NPAT Margin (%) 50%
Equity IRR (%) 31%
Payback (post- commissioning) 5 years
ROE (%) 46%
Urea price @ US$325
Urea project expected to be highly profitable, providing superior and sizeable excess returns
2
25
0
20
40
60
80
100%
2007
99%
2009
74%
6%
20%
2010Actual
60%
19%
6%
15%
2015EPrevious
40%
15%
10%
35%
1%
0
20
40
60
80
100%
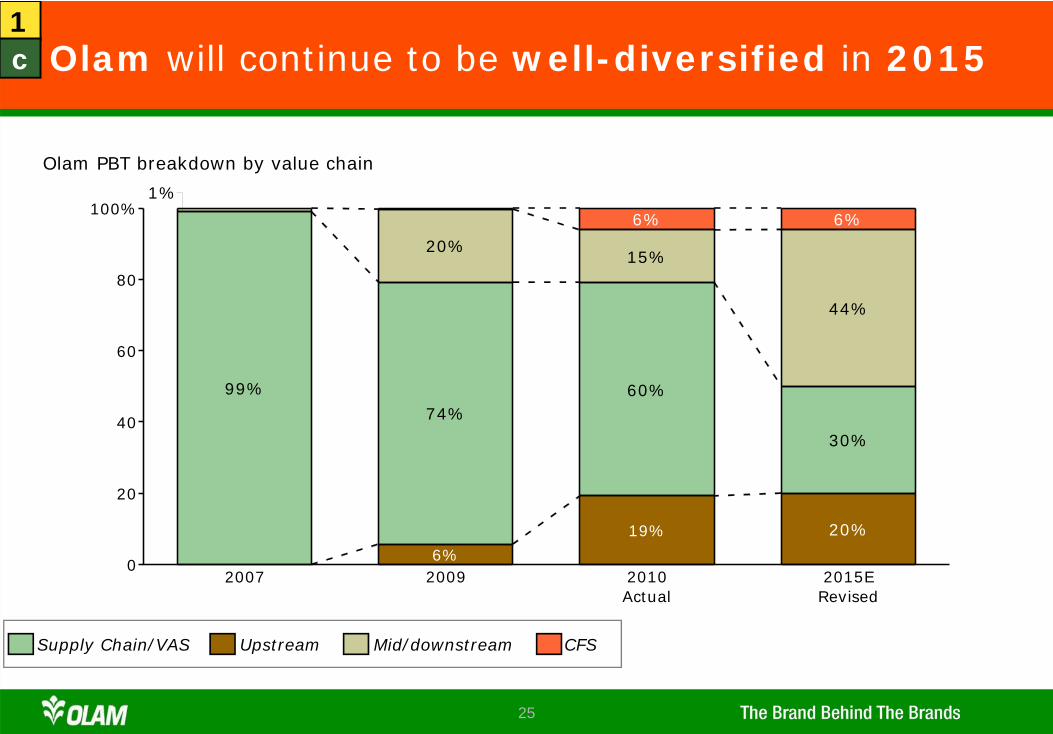
2007
99%
2009
74%
6%
20%
2010Actual
60%
19%
6%
15%
2015ERevised
30%
20%
6%
44%
1%
Olam will continue to be well-diversified in 2015
Supply Chain/VAS Upstream Mid/downstream CFS
Olam PBT breakdown by value chain
1c
26
0
20
40
60
80
100%
2015
RoW
Gabon(15-20%)
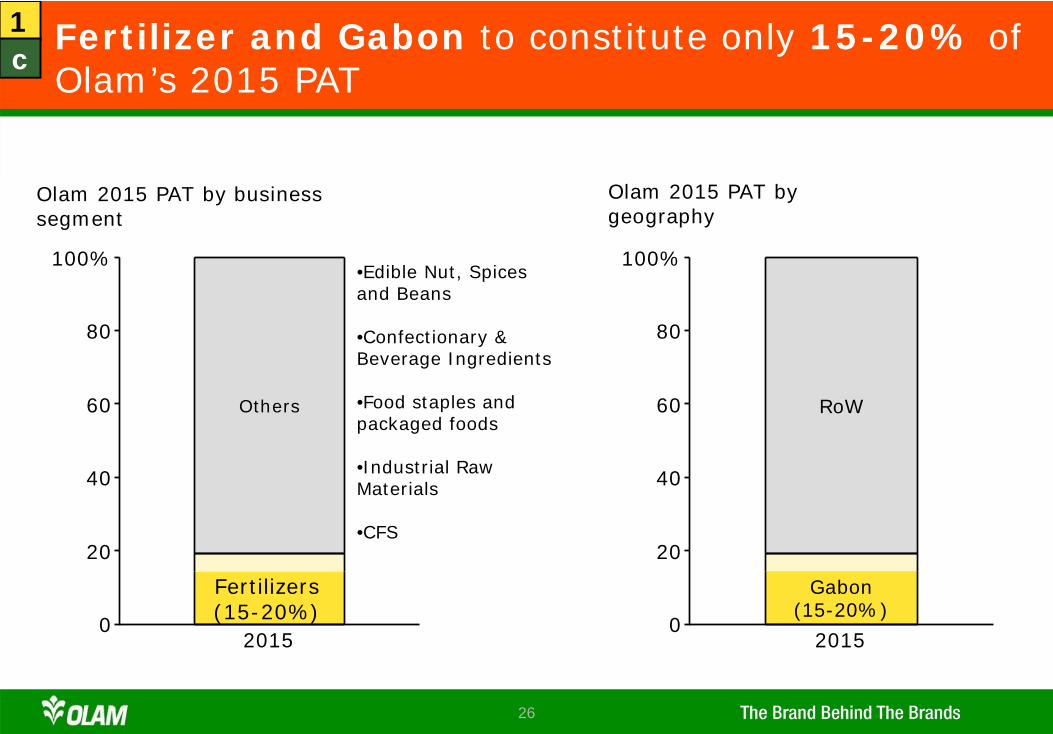
Olam 2015 PAT bygeography
0
20
40
60
80
100%
2015
Others
Olam 2015 PAT by businesssegment
Fertilizers(15-20%)
•Edible Nut, Spices and Beans
•Confectionary & Beverage Ingredients
•Food staples and packaged foods
•Industrial Raw Materials
•CFS
Fertilizer and Gabon to constitute only 15-20% of Olam’s 2015 PAT
1c
27
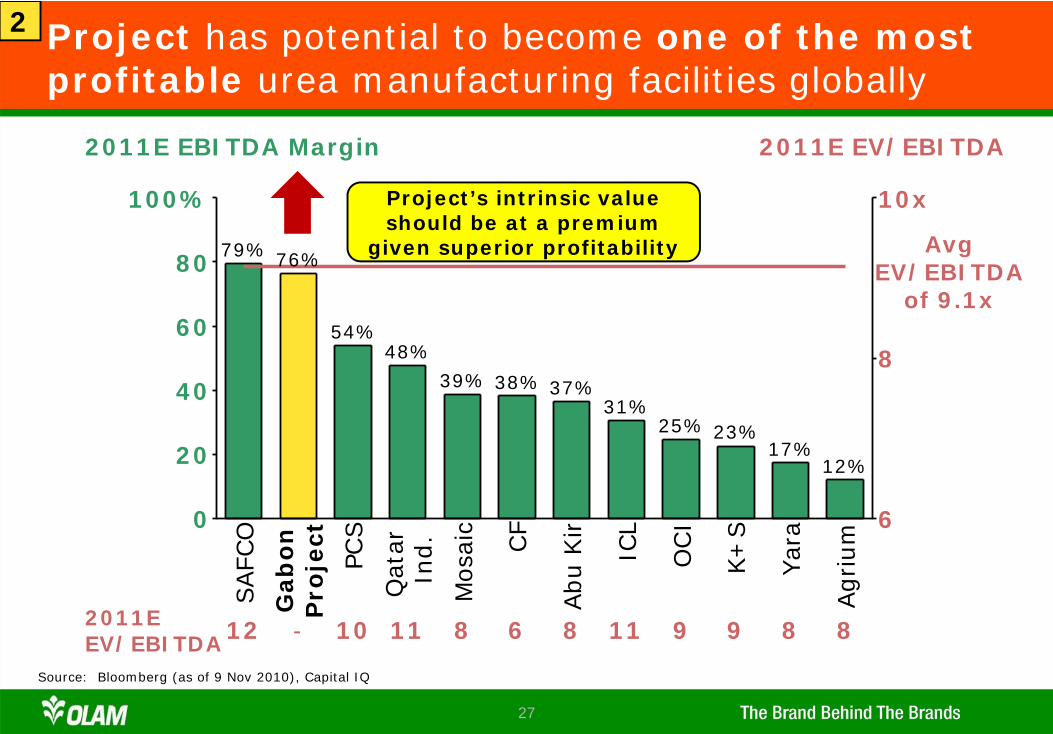
Project has potential to become one of the most profitable urea manufacturing facilities globally
0
20
40
60
80
100%
6
8
10x
SAFC
O79%
Gab
on
Pro
ject
76%
PCS
54%
Qat
arIn
d.
48%
Mos
aic
39%
CF
38%
Abu
Kir
37%
ICL
31%
OC
I
25%
K+
S
23%
Yar
a
17%
Agrium
12%
12 9 8 8- 10 11 8 6 8 11 92011EEV/EBITDA
2011E EBITDA Margin 2011E EV/EBITDA
Avg EV/EBITDA
of 9.1x
Project’s intrinsic value should be at a premium
given superior profitability
Source: Bloomberg (as of 9 Nov 2010), Capital IQ
2
28
Strong fundamentals makes fertilizer industry attractive; our investment is based on a set of clear guiding principles
Strong ability to win on industry success factors
Clear potential forsizeable excess returns
Risks can besufficiently mitigated
Opportunity assessment guiding principles
Relatedness to Olam’s core
Fertilizer a key lever to address agri demand-
supply imbalance
Large, highly value accretive opportunity
Fertilizers an attractive market but Olam's participation subject to satisfying evaluation criteria
A B C
1 2 3
29
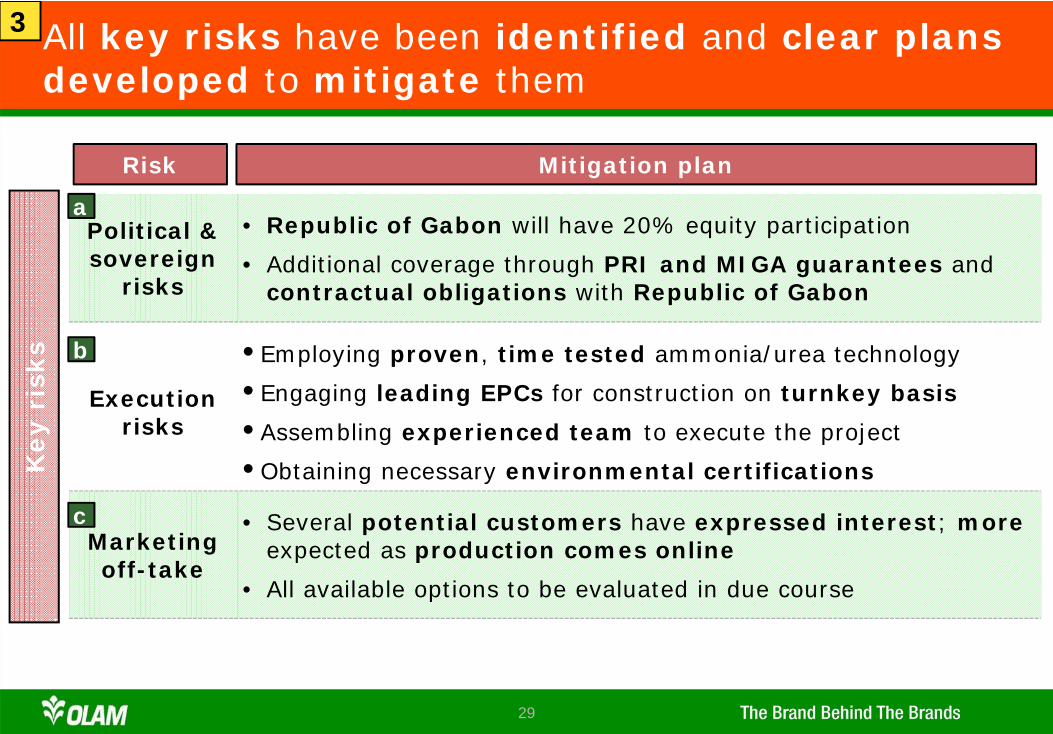
All key risks have been identified and clear plans developed to mitigate them
Key r
isks
Political & sovereign
risks
• Republic of Gabon will have 20% equity participation
• Additional coverage through PRI and MIGA guarantees and contractual obligations with Republic of Gabon
Risk Mitigation plan
Execution risks
• Employing proven, time tested ammonia/urea technology
• Engaging leading EPCs for construction on turnkey basis
• Assembling experienced team to execute the project
• Obtaining necessary environmental certifications
Marketing off-take
• Several potential customers have expressed interest; moreexpected as production comes online
• All available options to be evaluated in due course
a
b
c
3
30
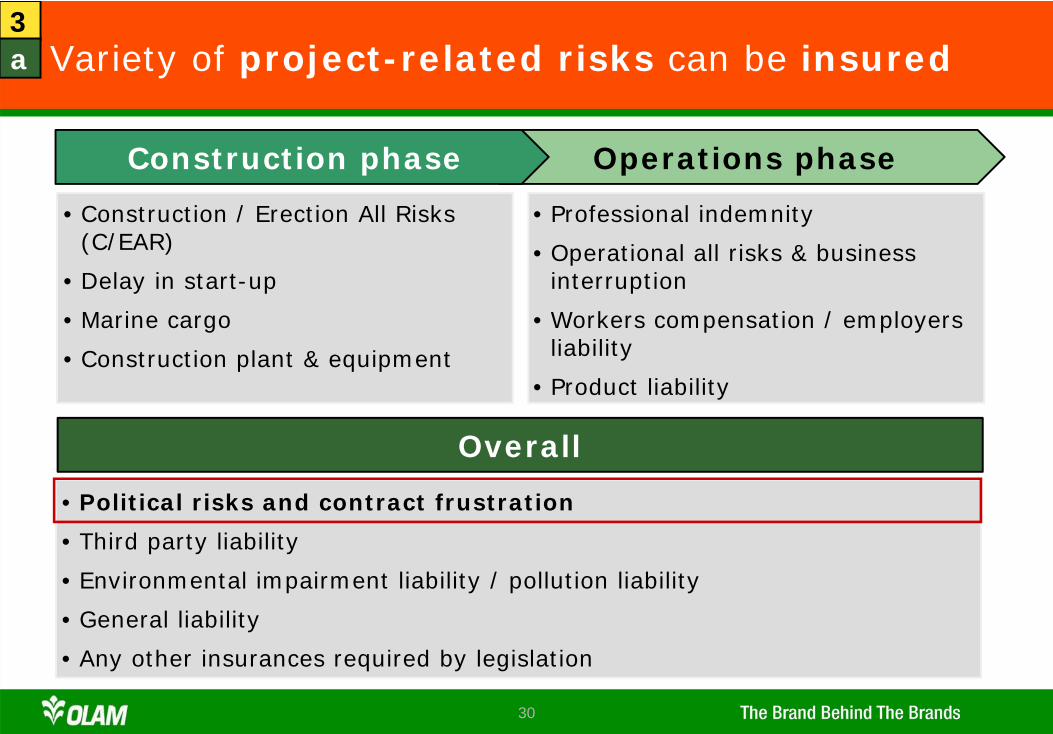
Variety of project-related risks can be insured
Operations phaseConstruction phase
Overall
• Construction / Erection All Risks (C/EAR)
• Delay in start-up
• Marine cargo
• Construction plant & equipment
• Professional indemnity
• Operational all risks & business interruption
• Workers compensation / employers liability
• Product liability
• Political risks and contract frustration
• Third party liability
• Environmental impairment liability / pollution liability
• General liability
• Any other insurances required by legislation
3a
31
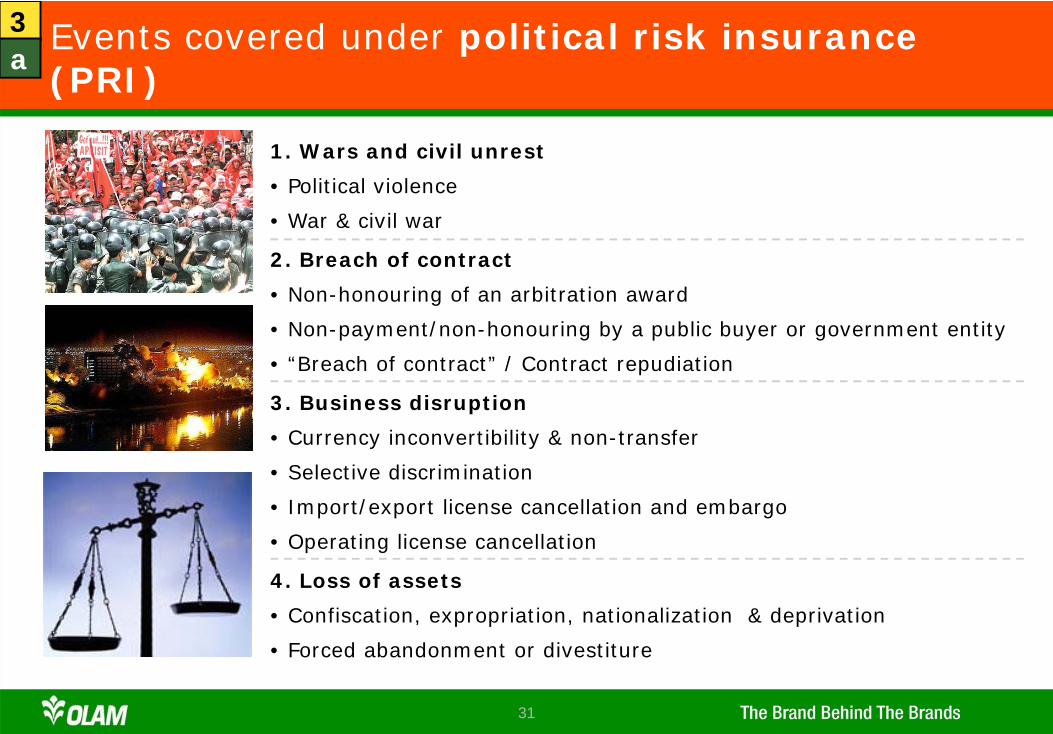
Events covered under political risk insurance (PRI)
1. Wars and civil unrest
• Political violence
• War & civil war
2. Breach of contract
• Non-honouring of an arbitration award
• Non-payment/non-honouring by a public buyer or government entity
• “Breach of contract” / Contract repudiation
3. Business disruption
• Currency inconvertibility & non-transfer
• Selective discrimination
• Import/export license cancellation and embargo
• Operating license cancellation
4. Loss of assets
• Confiscation, expropriation, nationalization & deprivation
• Forced abandonment or divestiture
3a
32
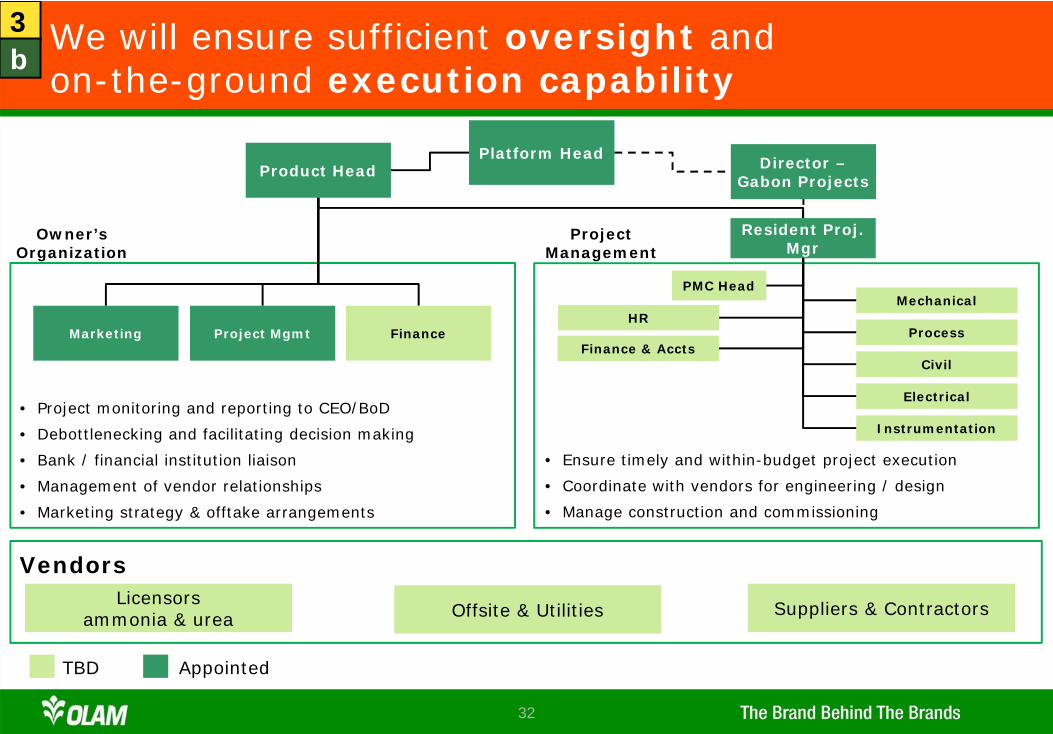
We will ensure sufficient oversight and on-the-ground execution capability
Offsite & UtilitiesLicensors
ammonia & urea Suppliers & Contractors
TBD Appointed
Platform Head
• Project monitoring and reporting to CEO/BoD
• Debottlenecking and facilitating decision making
• Bank / financial institution liaison
• Management of vendor relationships
• Marketing strategy & offtake arrangements
Vendors
Owner’s Organization
Director –Gabon Projects
Resident Proj. Mgr
HR
Finance & Accts
PMC Head
Process
Civil
Mechanical
Electrical
Instrumentation
• Ensure timely and within-budget project execution
• Coordinate with vendors for engineering / design
• Manage construction and commissioning
Marketing Project Mgmt Finance
Product Head
Project Management
3b
33
Senior personnel from fertilizer industry on board with >100 years combined experience
• Highly qualified personnel; prior leadership roles with leading fertilizer companies
• >100 years combined cross-functional experience in design, technology, EPC, project management, strategic planning, marketing, plant operations and maintenance
• Significant experience in developing and operating multiple large scale urea and ammonia plantsacross Middle East, Asia and Africa
3b
34
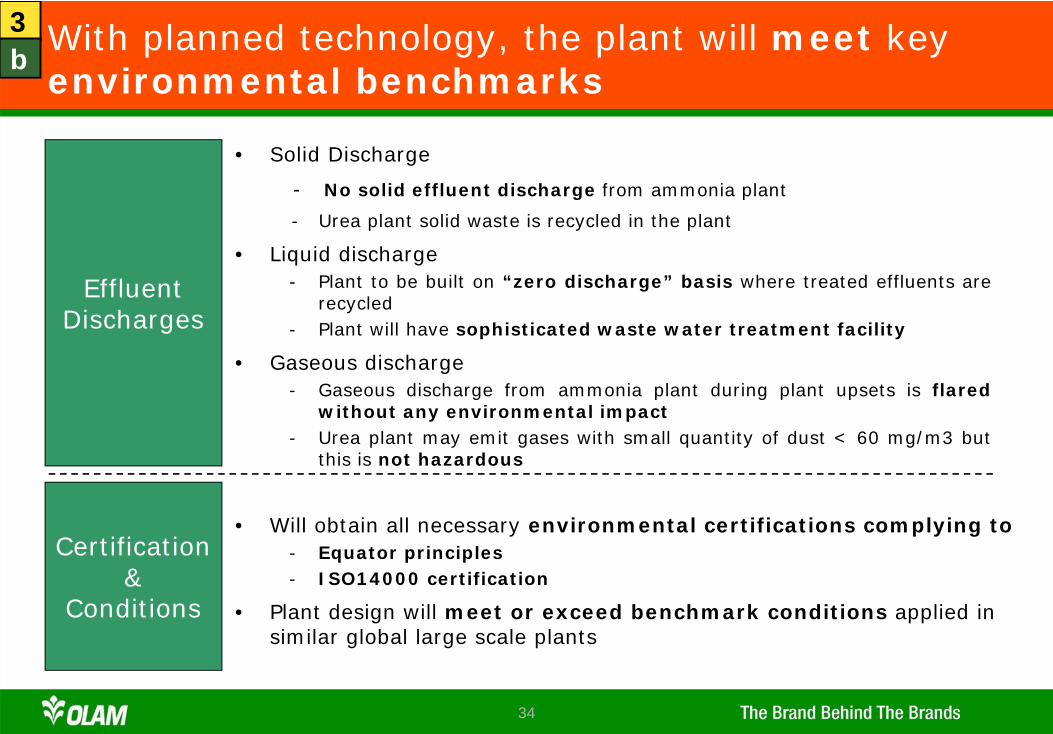
With planned technology, the plant will meet key environmental benchmarks
• Solid Discharge
- No solid effluent discharge from ammonia plant
- Urea plant solid waste is recycled in the plant
• Liquid discharge- Plant to be built on “zero discharge” basis where treated effluents are
recycled- Plant will have sophisticated waste water treatment facility
• Gaseous discharge- Gaseous discharge from ammonia plant during plant upsets is flared
without any environmental impact- Urea plant may emit gases with small quantity of dust < 60 mg/m3 but
this is not hazardous
EffluentDischarges
Certification &
Conditions
• Will obtain all necessary environmental certifications complying to- Equator principles- ISO14000 certification
• Plant design will meet or exceed benchmark conditions applied in similar global large scale plants
3b
35
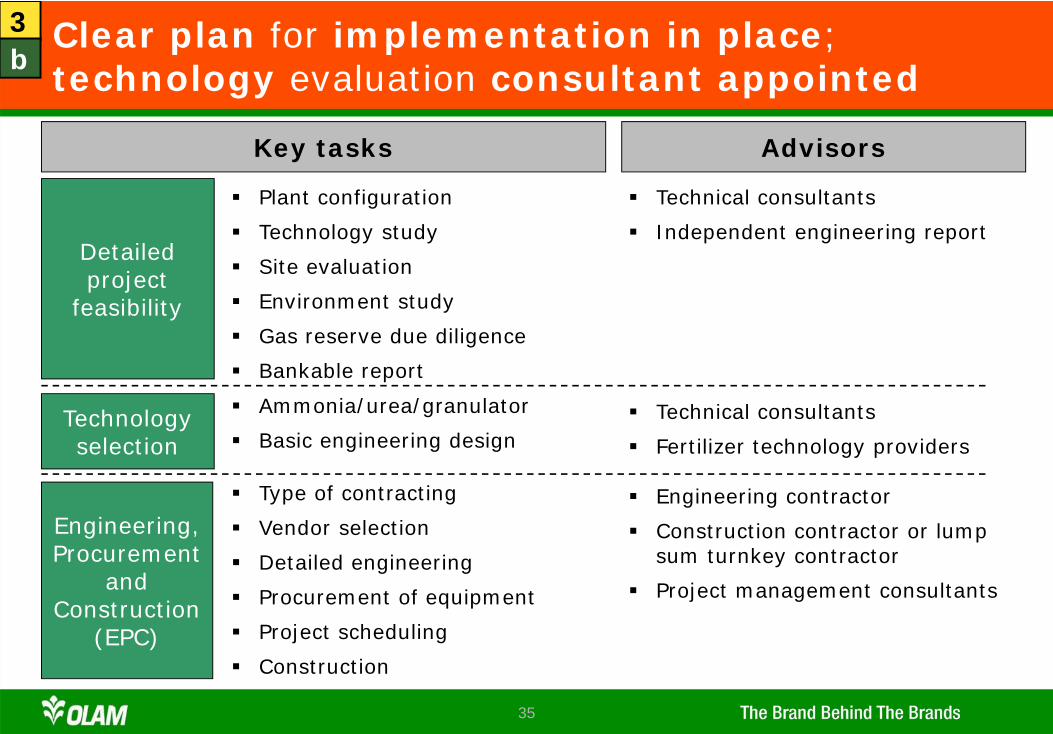
Clear plan for implementation in place; technology evaluation consultant appointed
Technology selection
Detailed project
feasibility
Plant configuration
Technology study
Site evaluation
Environment study
Gas reserve due diligence
Bankable report
Engineering, Procurement
and Construction
(EPC)
Ammonia/urea/granulator
Basic engineering design
Type of contracting
Vendor selection
Detailed engineering
Procurement of equipment
Project scheduling
Construction
Key tasks Advisors
Technical consultants
Independent engineering report
Technical consultants
Fertilizer technology providers
Engineering contractor
Construction contractor or lump sum turnkey contractor
Project management consultants
3b
36
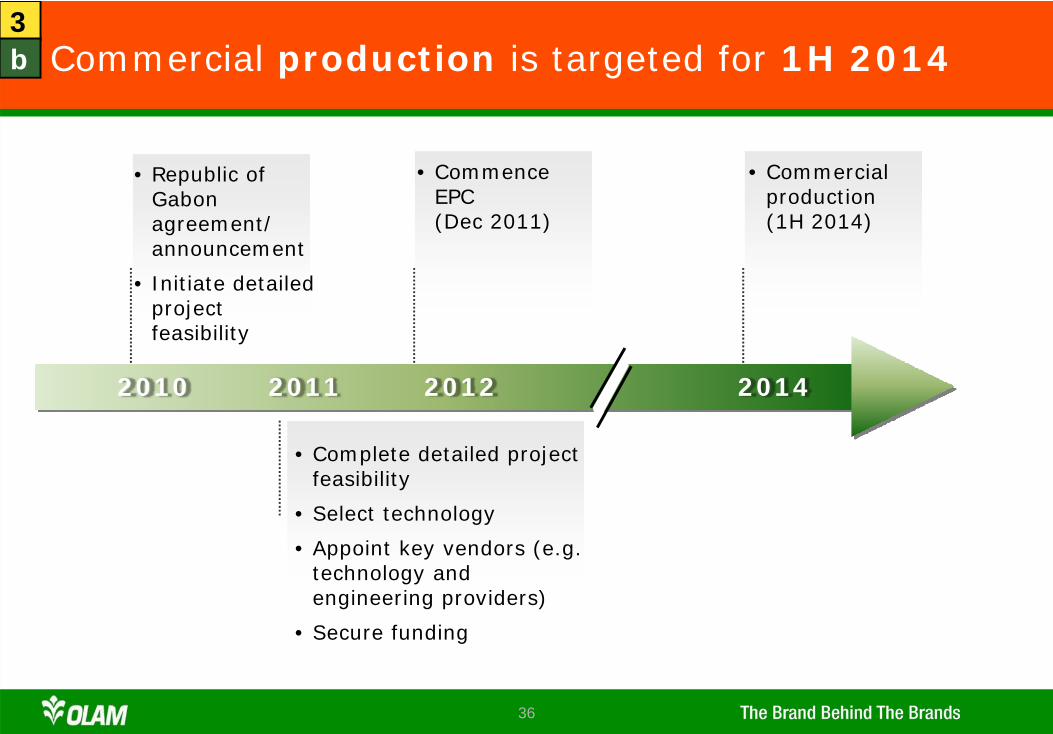
Commercial production is targeted for 1H 2014
2010 2011 2012 2014
• Commercial production (1H 2014)
• Commence EPC(Dec 2011)
• Republic of Gabon agreement/announcement
• Initiate detailed project feasibility
• Complete detailed project feasibility
• Select technology
• Appoint key vendors (e.g. technology and engineering providers)
• Secure funding
3b
37
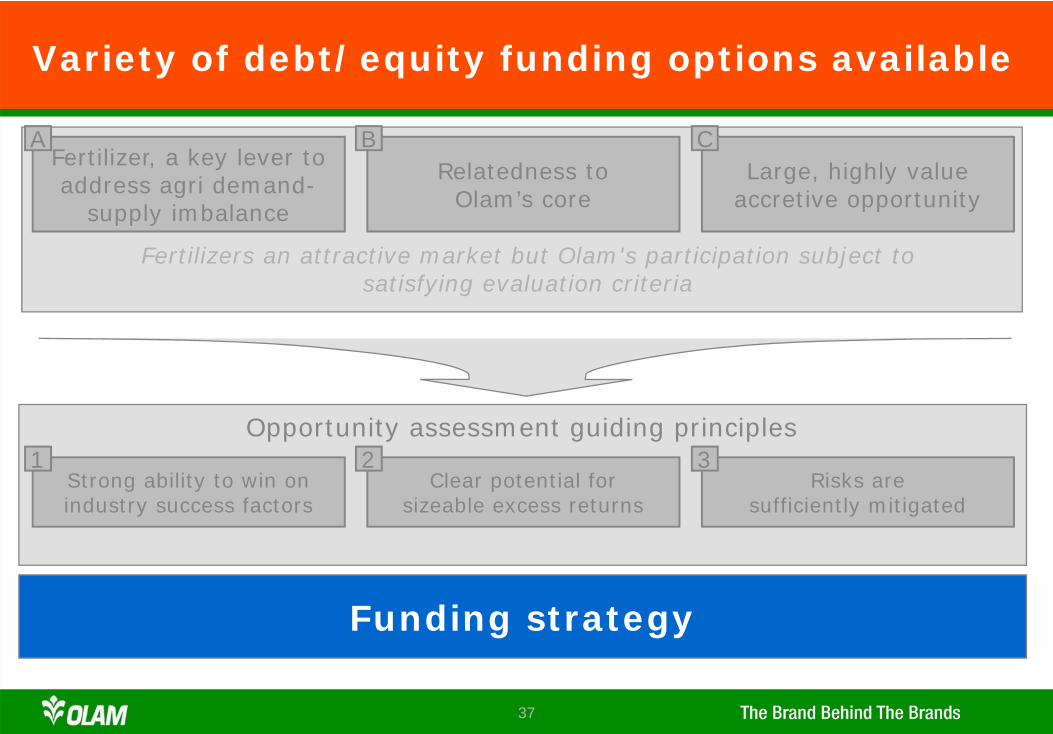
Variety of debt/equity funding options available
Strong ability to win on industry success factors
Clear potential forsizeable excess returns
Risks aresufficiently mitigated
Opportunity assessment guiding principles
Relatedness to Olam’s core
Fertilizer, a key lever to address agri demand-
supply imbalance
Large, highly value accretive opportunity
Fertilizers an attractive market but Olam's participation subject to satisfying evaluation criteria
A B C
1 2 3
Funding strategy
38
We intend to appoint the following financial advisors
39
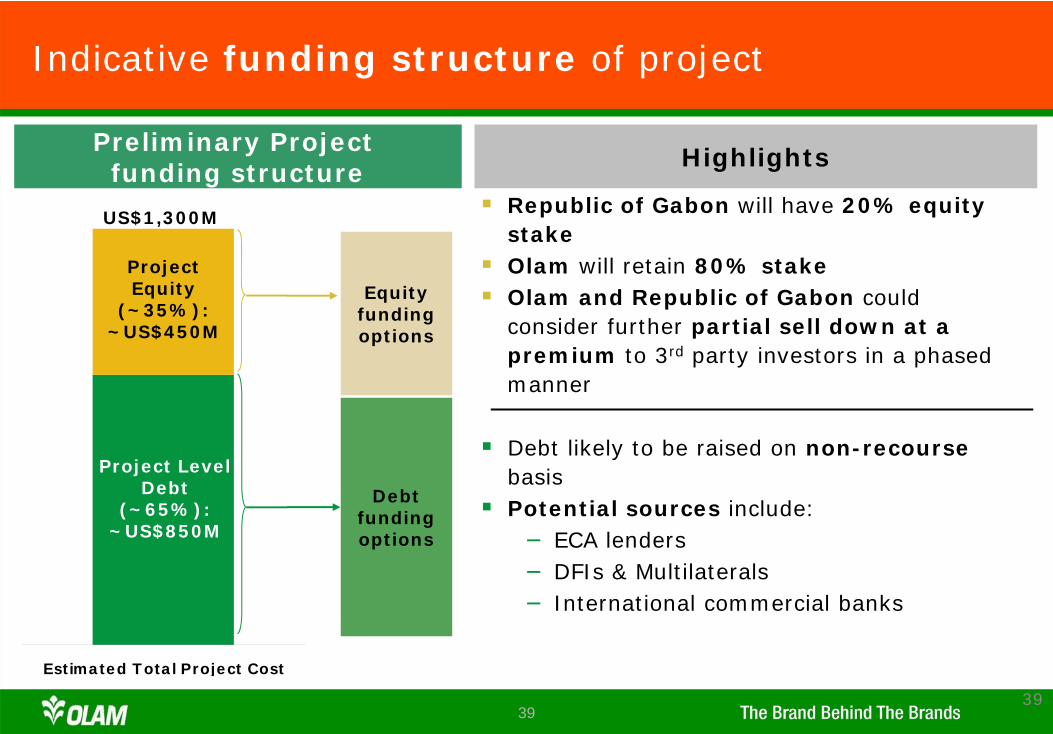
Indicative funding structure of project
39
Estimated Total Project Cost
Preliminary Project funding structure
Project Equity
(~35%): ~US$450M
Project Level Debt
(~65%): ~US$850M
Equity funding options
Highlights
Republic of Gabon will have 20% equity stake Olam will retain 80% stakeOlam and Republic of Gabon could consider further partial sell down at a premium to 3rd party investors in a phased manner
Debt likely to be raised on non-recourse basisPotential sources include:– ECA lenders– DFIs & Multilaterals– International commercial banks
Debt funding options
US$1,300M
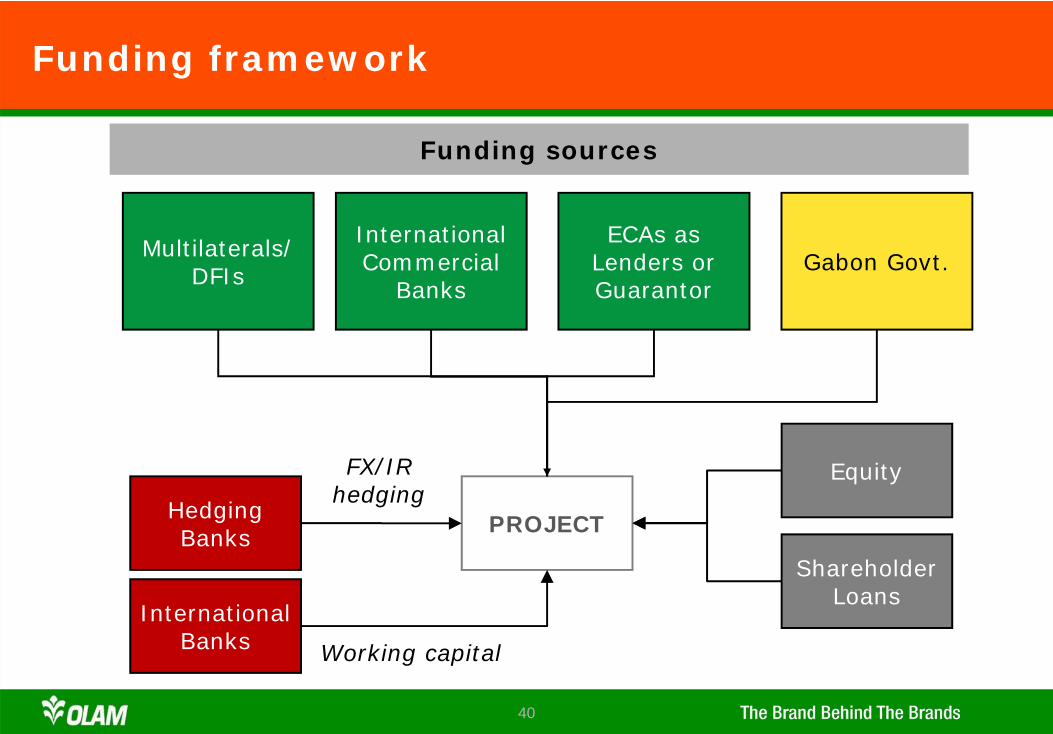
40
Funding framework
Multilaterals/ DFIs
International Commercial
BanksGabon Govt.
ECAs as Lenders or Guarantor
PROJECT
Equity
Shareholder Loans
Hedging Banks
InternationalBanks
Funding sources
Working capital
FX/IR hedging
41
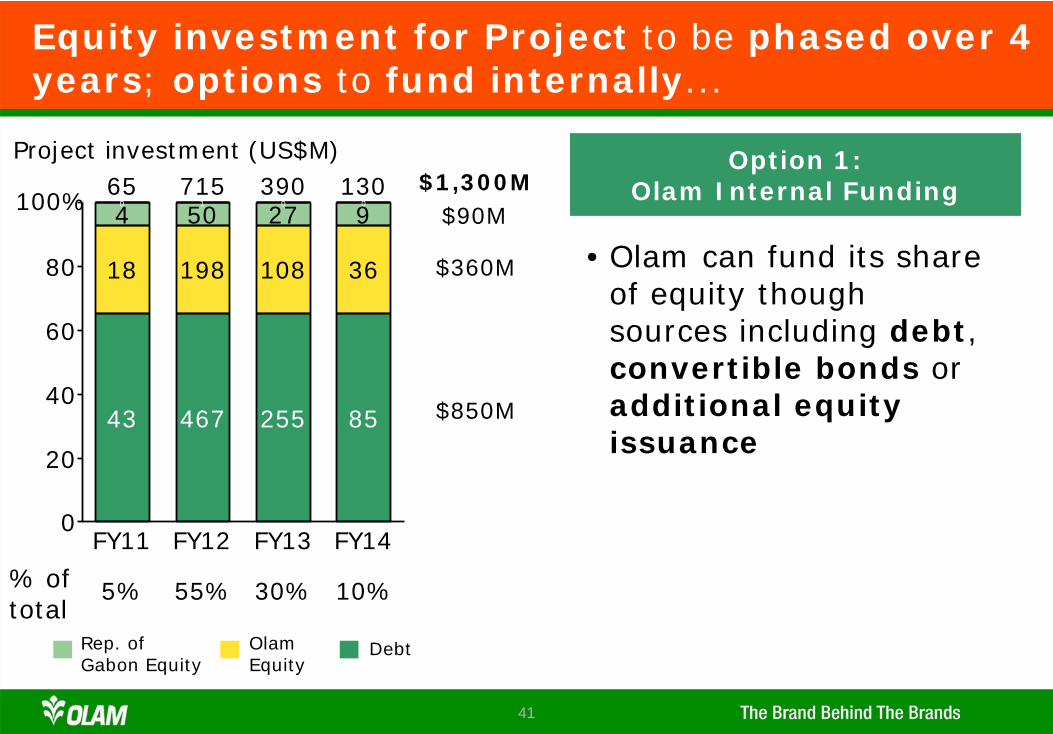
Equity investment for Project to be phased over 4 years; options to fund internally...
Option 1: Olam Internal Funding
Rep. of Gabon Equity
OlamEquity
Debt
• Olam can fund its share of equity though sources including debt, convertible bonds or additional equity issuance
$1,300M
$850M
$360M
$90M
0
20
40
60
80
Project investment (US$M)
FY11
0
4
18
43
65
FY12
1
50
198
467
715
FY13
0
27
108
255
390
FY14
0
9
36
85
130100%
5% 55% 30% 10%% of total
42
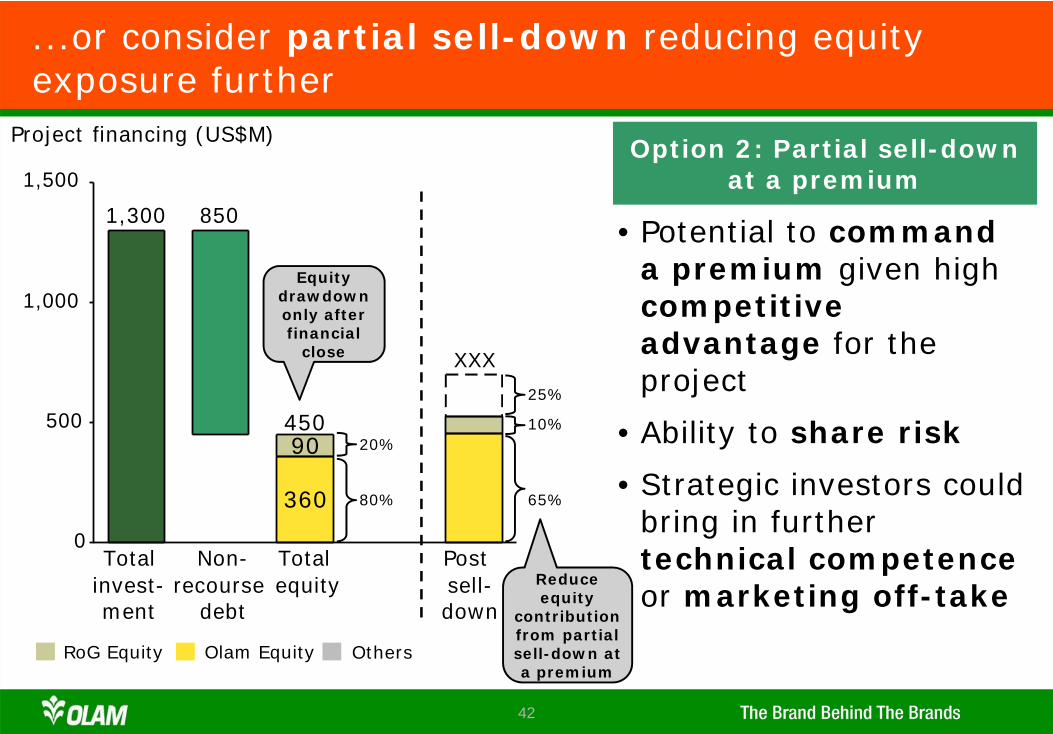
1,300
XXX
Project financing (US$M)
0
500
1,000
1,500
Totalinvest-ment
Non-recourse
debt
850
Totalequity
450
Postsell-down
...or consider partial sell-down reducing equity exposure further
Option 2: Partial sell-down at a premium
• Potential to command a premium given high competitive advantage for the project
• Ability to share risk
• Strategic investors could bring in further technical competence or marketing off-take
Equity drawdown only after financial
close
RoG Equity Olam Equity Others
360
90
Reduce equity
contribution from partial sell-down at a premium
80%
20%
65%
10%
25%
43
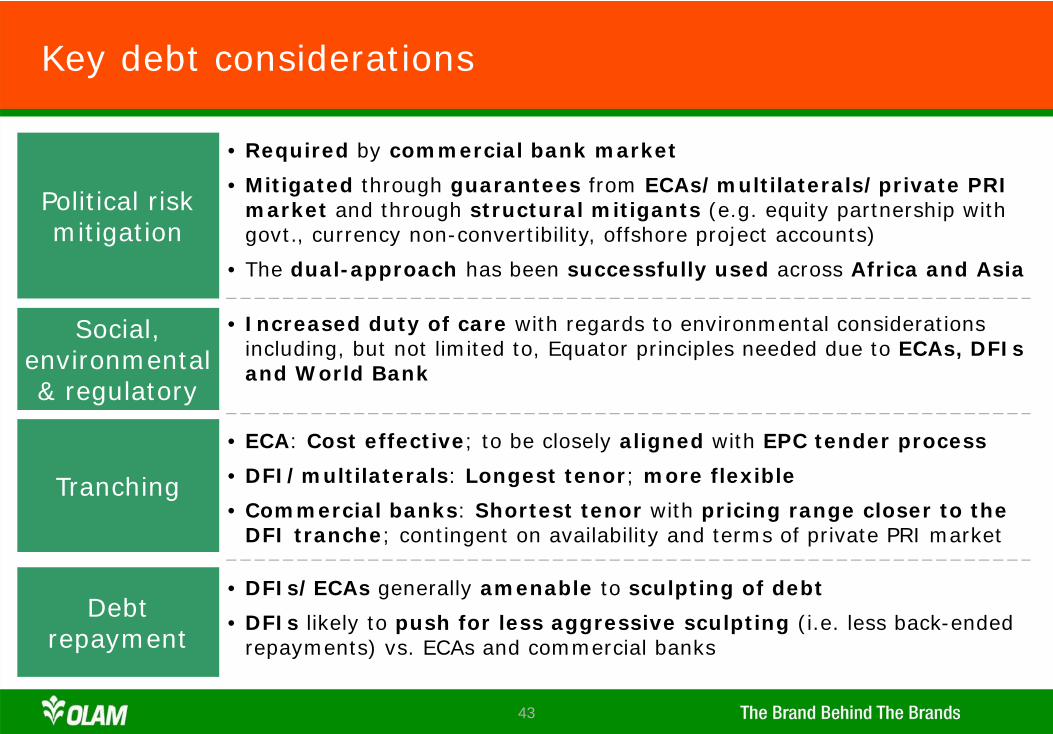
Key debt considerations
Political risk mitigation
Social, environmental & regulatory
Tranching
Debt repayment
• Required by commercial bank market
• Mitigated through guarantees from ECAs/multilaterals/private PRI market and through structural mitigants (e.g. equity partnership with govt., currency non-convertibility, offshore project accounts)
• The dual-approach has been successfully used across Africa and Asia
• Increased duty of care with regards to environmental considerations including, but not limited to, Equator principles needed due to ECAs, DFIs and World Bank
• ECA: Cost effective; to be closely aligned with EPC tender process
• DFI/multilaterals: Longest tenor; more flexible
• Commercial banks: Shortest tenor with pricing range closer to the DFI tranche; contingent on availability and terms of private PRI market
• DFIs/ECAs generally amenable to sculpting of debt
• DFIs likely to push for less aggressive sculpting (i.e. less back-ended repayments) vs. ECAs and commercial banks
44
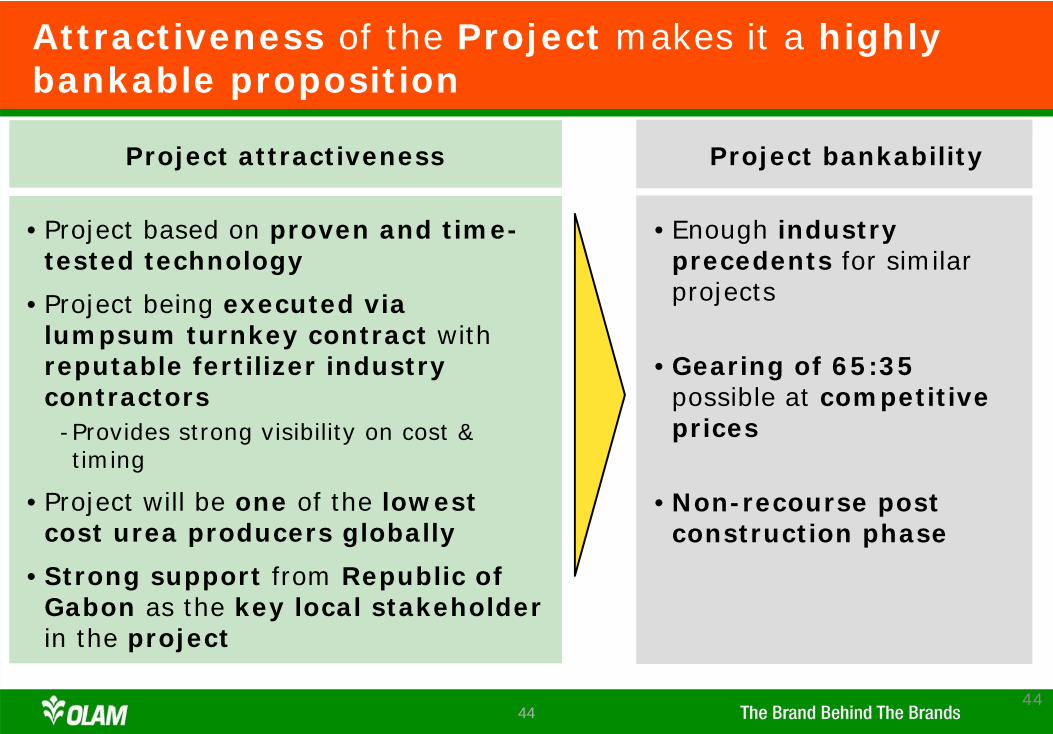
Attractiveness of the Project makes it a highly bankable proposition
44
•Enough industry precedents for similar projects
•Gearing of 65:35 possible at competitive prices
•Non-recourse post construction phase
•Project based on proven and time-tested technology
•Project being executed via lumpsum turnkey contract with reputable fertilizer industry contractors-Provides strong visibility on cost & timing
•Project will be one of the lowest cost urea producers globally
•Strong support from Republic of Gabon as the key local stakeholderin the project
Project attractiveness Project bankability
45
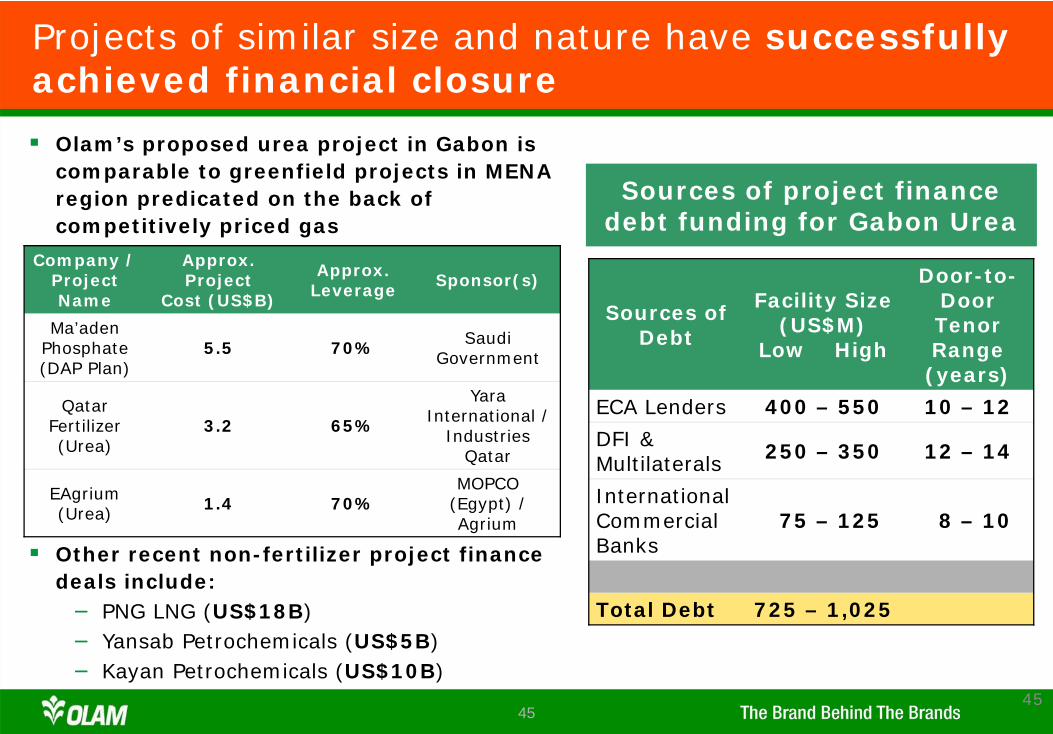
Projects of similar size and nature have successfully achieved financial closure
45
Sources of Debt
Facility Size (US$M)
Low High
Door-to-DoorTenor Range (years)
ECA Lenders 400 – 550 10 – 12
DFI & Multilaterals 250 – 350 12 – 14
International Commercial Banks
75 – 125 8 – 10
Total Debt 725 – 1,025
Sources of project finance debt funding for Gabon Urea
Olam’s proposed urea project in Gabon is comparable to greenfield projects in MENA region predicated on the back of competitively priced gas
Other recent non-fertilizer project finance deals include:– PNG LNG (US$18B)– Yansab Petrochemicals (US$5B)– Kayan Petrochemicals (US$10B)
Company / Project Name
Approx. Project
Cost (US$B)
Approx. Leverage Sponsor(s)
Ma’aden Phosphate (DAP Plan)
5.5 70% Saudi Government
Qatar Fertilizer (Urea)
3.2 65%
Yara International /
Industries Qatar
EAgrium (Urea) 1.4 70%
MOPCO (Egypt) / Agrium
46
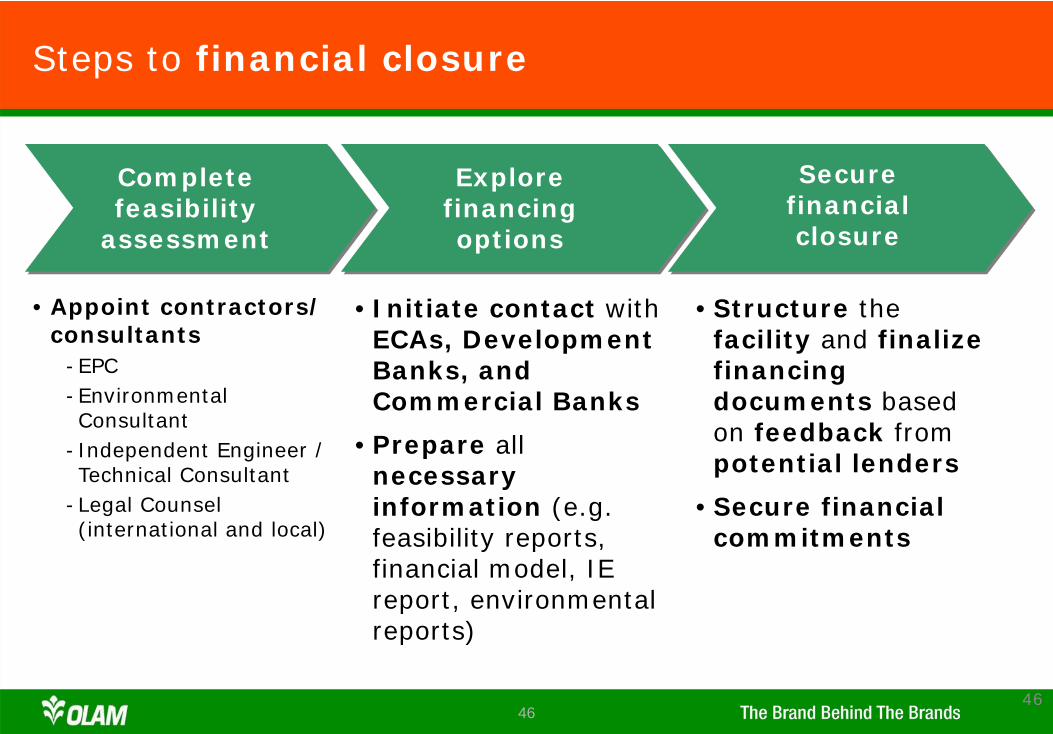
Steps to financial closure
46
Completefeasibility
assessment
Explore financing options
Secure financial closure
• Appoint contractors/ consultants
-EPC-Environmental Consultant
-Independent Engineer / Technical Consultant
-Legal Counsel (international and local)
•Initiate contact with ECAs, Development Banks, and Commercial Banks
•Prepare all necessary information (e.g. feasibility reports, financial model, IE report, environmental reports)
•Structure the facility and finalize financing documents based on feedback from potential lenders
•Secure financial commitments
47
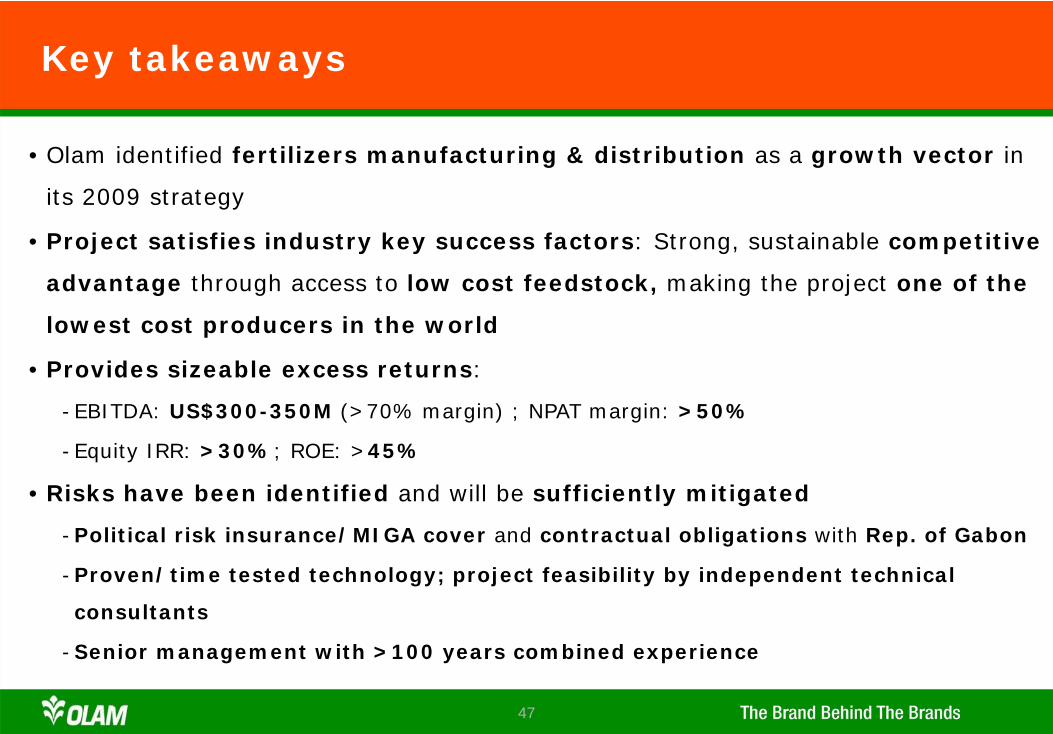
Key takeaways
• Olam identified fertilizers manufacturing & distribution as a growth vector in
its 2009 strategy
• Project satisfies industry key success factors: Strong, sustainable competitive
advantage through access to low cost feedstock, making the project one of the
lowest cost producers in the world
• Provides sizeable excess returns:
-EBITDA: US$300-350M (>70% margin) ; NPAT margin: >50%
-Equity IRR: >30%; ROE: >45%
• Risks have been identified and will be sufficiently mitigated
-Political risk insurance/MIGA cover and contractual obligations with Rep. of Gabon
-Proven/time tested technology; project feasibility by independent technical
consultants
-Senior management with >100 years combined experience
48
Thank you