Embed Size (px)
Citation preview
Investment horizonsDo managers do what they say?

About MercerMercer is a leading global provider of consulting, outsourcing and investment services. Mercer works with clients to solve their most complex benefit and human capital issues, designing and helping manage health, retirement and other benefits. It is a leader in benefits outsourcing. Mercer’s investment services include investment consulting and multi-manager investment management. Mercer’s 18,000 employees are based in more than 40 countries. The company is a wholly owned subsidiary of Marsh & McLennan Companies, Inc., which lists its stock (ticker symbol: MMC) on the New York, Chicago, and London stock exchanges. For more information, visit www.mercer.com.
About The IRRC InstituteThe IRRC Institute is a not-for-profit organization headquartered in New York, NY, whose mission is to provide thought leadership at the intersection of corporate responsibility and the informational needs of investors. More information is available at www.irrcinstitute.org.
1
Executive summary . . . . . . . . . . . . . . . . . . . . . . . . . . . . . . . . . . . . . . . . . . . . . . . . . . . . . . . . . . . . . . . . . . . . . . . . . . . . . . . 2
Introduction . . . . . . . . . . . . . . . . . . . . . . . . . . . . . . . . . . . . . . . . . . . . . . . . . . . . . . . . . . . . . . . . . . . . . . . . . . . . . . . . . . . . . . 4
Methodology . . . . . . . . . . . . . . . . . . . . . . . . . . . . . . . . . . . . . . . . . . . . . . . . . . . . . . . . . . . . . . . . . . . . . . . . . . . . . . . . . . . . . 4
Quantitative analysis . . . . . . . . . . . . . . . . . . . . . . . . . . . . . . . . . . . . . . . . . . . . . . . . . . . . . . . . . . . . . . . . . . . . . . . . . . . . . . 4
Qualitative analysis . . . . . . . . . . . . . . . . . . . . . . . . . . . . . . . . . . . . . . . . . . . . . . . . . . . . . . . . . . . . . . . . . . . . . . . . . . . . . . . . 5
Findings: Quantitative analysis . . . . . . . . . . . . . . . . . . . . . . . . . . . . . . . . . . . . . . . . . . . . . . . . . . . . . . . . . . . . . . . . . . . 7
Overall findings . . . . . . . . . . . . . . . . . . . . . . . . . . . . . . . . . . . . . . . . . . . . . . . . . . . . . . . . . . . . . . . . . . . . . . . . . . . . . . . . . . . 7
Disaggregated analysis – a focus on managers who exceeded their turnover expectations . . . . . . . . . . . . . . . 7
Findings: Case study analysis . . . . . . . . . . . . . . . . . . . . . . . . . . . . . . . . . . . . . . . . . . . . . . . . . . . . . . . . . . . . . . . . . . . . 12
Causes of short-termism. . . . . . . . . . . . . . . . . . . . . . . . . . . . . . . . . . . . . . . . . . . . . . . . . . . . . . . . . . . . . . . . . . . . . . . . . . . 14
Consequences of short-termism. . . . . . . . . . . . . . . . . . . . . . . . . . . . . . . . . . . . . . . . . . . . . . . . . . . . . . . . . . . . . . . . . . . . 15
Mechanisms to extend the investment horizon. . . . . . . . . . . . . . . . . . . . . . . . . . . . . . . . . . . . . . . . . . . . . . . . . . . . . . 16
Conclusion . . . . . . . . . . . . . . . . . . . . . . . . . . . . . . . . . . . . . . . . . . . . . . . . . . . . . . . . . . . . . . . . . . . . . . . . . . . . . . . . . . . . . . . 18
Appendix A: Statistical analysis . . . . . . . . . . . . . . . . . . . . . . . . . . . . . . . . . . . . . . . . . . . . . . . . . . . . . . . . . . . . . . . . . . 19
Appendix B: Case study findings . . . . . . . . . . . . . . . . . . . . . . . . . . . . . . . . . . . . . . . . . . . . . . . . . . . . . . . . . . . . . . . . . 23
Appendix C: References. . . . . . . . . . . . . . . . . . . . . . . . . . . . . . . . . . . . . . . . . . . . . . . . . . . . . . . . . . . . . . . . . . . . . . . . . . 35
Contents
2
This report examines the investment horizon of active long-only equity managers across different geographies and styles between June 2006 and June 2009.1 The overall aim of the research was not to prove that long-horizon investing is “good” and that short-horizon investing is “bad” (or visa versa), as we recognize that there is a valid role and function for all types of horizons and approaches to investment.2 Rather, the aim was to examine the extent to which there is a mismatch between the time horizon over which investors think and say they invest and how they actually invest. In this process, we examine how much short-termism exists3 and how that varies by region and by style.
The extent to which investment horizons deviate from their “intended” turnover range is of particular interest since it suggests that the way the strategies are being managed deviate from how they are being marketed to clients, at least with respect to the investment horizon. When portfolio turnover rates exceed their expected range by a notable margin, this could be a possible indicator of deeper problems with the invest-ment process that investors would be wise to consider in the selection and evaluation of managers.
As well as examining the prevalence of short-termism among long-only equity fund managers, the report explores the causes, consequences and possible solu-tions from the fund managers’ perspective. Do fund managers operate with a long or short investment horizon? To what extent do they think short-termism presents them with new opportunities, or conversely, makes their job harder/more challenging? Do they think short-term investment horizons have wider, negative consequences for the way companies behave and the market functions? If so, what are the possible remedies from their perspective?
To examine these questions, we used two approaches for the data analysis; namely, quantitative analysis of portfolio turnover of over 900 strategies to calculate
intended and realized average holding periods of man-agers across different regions and styles, as well as qualitative analysis via case studies on eight active equity fund managers.
The key findings of the quantitative analysis at the aggregate level were that:
■ Nearly two-thirds of strategies have turnover higher than expected, with some strategies recording more than 150% – 200% higher turnover than anticipated. Of the 822 strategies for which we had both expected and actual turnover data, we found that 540 of them (or 65%) exceeded their expected turnover over the sample period. Of these products, the turnover was, on average, 26% higher than antici-pated. In some cases when managers exceeded their expected turnover level, the difference was very large, which could be of concern for insti-tutional investors due not only to the impact on transaction costs, but also to the risk that the strategy is not being managed in line with its stated investment approach
■ Within the entire sample of 991 strategies, the average annual turnover is 72%, with around 20% of strategies falling into the ≥100% turnover end of the spectrum. Our analysis therefore suggests that short-termism exists and represents a material “tail risk” of investment strategies
■ We found that value4 managers have a lower annual turnover figure than the other style types. We also found that large cap strategies have a lower turnover rate than small cap strategies, and that socially responsible investing (SRI) strategies have a lower turnover than non-SRI strategies
■ Across the regions, of the managers that exceeded their stated turnover, we found that UK, Canadian and Australian equity strategies have the lowest average turnover value, while European (including UK), international and US strategies have the highest average turnover levels respectively
Executive summary
1 The study focuses purely on long-only equity strategies and excludes hedge fund and other long/short strategies.
2 For example, there is an argument that short-horizon investors can help to improve the efficiency of the market, both from an arbitrage perspective and also in terms of market liquidity (and its impact on bid/offer spreads). Examples of short-horizon investors might include day traders, investment banks, hedge funds and other investors that focus their alpha generation process on exploiting short-term arbitrage opportunities. The potential problems start when long-only, long-horizon investors view themselves as long-horizon investors, but actually behave as short-horizon investors; their clients are likely unaware that this is how their money is being invested. Also, long-horizon investors playing the short-term game may be at a disadvantage from a time, information, resource and expertise perspective compared to the expert short-horizon investors.
3 For the purpose of this study, in absolute terms short-termism is defined as an average holding period of 12 months or less (equivalent to 100% p.a. or higher turnover). In relative terms, it can also be measured as a higher actual level of turnover than expected levels, as self-reported/used in promotional material.
4 Value managers typically buy equities with low price/earnings, price/sales, price/book ratios, based on the belief that the stocks are undervalued.

3
■ Over time, we observed that turnover rates have been increasing for Europe ex UK and international strategies, with the turning point appearing to be around Q1 2008 (associated with the credit crisis, as discussed further below).
The key insights from our follow-up case study analysis from the fund managers’ perspective were that:
■ On the causes of short-termism, the key themes that emerged from our discussions included: volatile markets and changing macroeconomic conditions; the emergence of short-term traders, such as hedge funds; mixed signals from clients; short-term incentive systems; and behavioral biases, such as herding and recency bias5
■ Interestingly, fund managers recognize the potential negative consequences of short-termism, even while claiming it is unavoidable. The key themes (from the fund managers’ perspective) were: short-termism is part of how the market functions; it places short-term pressure on companies; it increases market volatility; it potentially demonstrates a lack of discipline in fund managers’ investment processes; and it potentially creates a misalignment of interests between fund managers and their clients
■ On the mechanisms to extend the investment horizon (to minimize the risk of significant and sustained overshoot in turnover versus expectations) our discussions with the managers identified the following themes6: regulatory measures such as transaction taxes or restrictions on hedge fund activities; longevity of client relationships; a deeper client understanding and awareness of the investment horizon and the possibility of short-term deviations in performance; and an incentive system and corporate culture within the fund management organizations themselves that encourages long-term thinking
While it is clear that there is a role for all types of investment strategies to exist – short- and long-horizon – it also appears to be true that many long-only equity strategies are exceeding their expected turnover rate and in some cases, by a considerable margin. No doubt this was exacerbated by the credit crisis and related market volatility during the time period of our analysis. However, on this point, there is a valid question to be asked about cause and effect; more specifically, behavioral finance evidence suggests that investor psychology and speculative investment activity contribute to higher asset price volatility, creating a vicious cycle of asset price volatility and short-term horizons.7
The resolution of the cause and effect of market volatility and higher turnover is beyond the scope of this study. We acknowledge that the time period selected for this study is one of extraordinarily high volatility. This provided an interesting backdrop for the comparative analysis and case study discussions. Rather than determine a definitive cause of short-termism, our analysis measures the degree to which long-only strategies tend to exceed their expected turnover and discusses possible explanations and solutions with a select group of managers.
5 Recency bias is the finding by psychologists that individuals place more weight on recent events and this distorts their decision making and behavior. From an investment perspective, this is often associated with investors switching in/out of investment products based on recent performance.
6 The causes, consequences and mechanisms to extend the investment horizon are all as told by the fund managers themselves and do not necessarily represent the views of Mercer or the IRRC.
7 For example, Shiller, in his book entitled Market Volatility (1992), challenges the standard efficient-markets model for explaining asset prices by emphasizing the significant role that popular opinion or psychology can play in driving price volatility. His theory challenges conventional thinking about the determinants of asset values and builds a link between investor behavior, speculative markets, boom/bust cycles, market volatility and the consequential impact on macroeconomic activity.
4
There is ample academic literature on the prevalence of short-termism in the financial markets and corporate sector, but the debate continues as to the net results for end investors and how they might best respond. While higher portfolio turnover will inevitably result in higher transaction costs, many active managers claim they can utilize short-horizon investing as a means to generate alpha. One way for institutional investors to tackle this challenge is to explicitly con-sider the level of portfolio turnover when evaluating fund managers, both for new and existing mandates. In this way, the question becomes not whether short- or long-horizon investing is good or bad, but whether active equity managers are behaving according to their claims when it comes to portfolio turnover.
Against that backdrop, this study examines the extent to which equity managers behave according to their stated approach when it comes to the investment horizon. Quantitative and qualitative data was used to analyze stated expected turnover vs. actual turn-over among long-only investment strategies across different geographic regions and styles. Following the quantitative data analysis, case studies were carried out with eight different active equity fund managers to consider how they view portfolio turnover in terms of their own incentives, market efficiency and relationships with clients. In addition, the report identifies areas for future study that may be of interest to investors, regulators and other stakeholders.
The outline of this report is as follows:
■ Section 3 presents the methodology
■ Section 4 presents the quantitative analysis with a particular focus on managers whose turnover exceeded their expected turnover level
■ Section 5 presents the highlights of eight case studies on the causes, consequences and possible solutions to short-termism
■ Section 6 concludes and the appendices present the complete data analysis, case study findings and relevant references that we consulted
Two approaches were used for data analysis; namely, quantitative analysis of portfolio holdings to calculate average holding periods of managers across different regions and styles, as well as qualitative analysis through interviews with active equity fund managers.
Quantitative analysisFor the purpose of this study, short-termism is defined as an average holding period of 12 months or less (equivalent to 100% p.a. or higher turnover).
The data used to calculate the investment horizon of equity managers, and thereby examine the prevalence of short-termism, was Mercer’s proprietary database of investment managers, the Global Investment Manager Database (GIMDTM). This database is a web-based Oracle application that is accessible to over 900 Mercer colleagues worldwide. GIMD provides a central repository for manager information, firm-wide demographic details, investment product details, performance, and Mercer research such as our meeting notes, news items and manager ratings. The products listed in this database are primarily invested in by institutional investors as they are the primary user of GIMD, although some of the products in GIMD are also marketed to retail investors (particularly products that appear in a defined contribution product suite that may also be investable for individual investors).
Our analysis compared the actual portfolio turnover data of investment managers to their expected portfolio turnover. The actual annual turnover was calculated, based on representative holding information that managers enter into GIMD, as the change in weights of the portfolio adjusted for market move-ments in the stocks, as follows:
The turnover number is the (one-sided) change in holdings between periods. The constituents of the portfolio as of quarter end t-1 are run forward to the end of month t using the returns for that month. These are then compared with the holdings at quarter end t, and the differences between the holdings are calculated. The absolute values of these differences are then added and divided by two. This is equiv-alent to the notional buys (or sells) required to rebalance the t-1 portfolio to that of time t, undertaken at time t.
The data required to calculate the actual turnover was compiled and aggregated for all managers where portfolio holdings data was available for a minimum of three years.
Introduction Methodology
5
The expected annual turnover is provided directly to GIMD by the fund managers themselves. The language of the request defines it as:
The lesser of purchases and sales divided by the average market value, excluding cash rollovers.
In contrast to actual annual turnover, which, as noted, was calculated for the purposes of this study, the expected turnover is provided in GIMD by the fund managers and updated by them.
There are over 3,600 active managers in GIMD that manage over 19,000 different investment strategies across all asset classes. Of these, 991 strategies had a history of equity fund manager portfolio holdings sufficient to conduct this analysis. A summary of the sample statistics used for this analysis is provided in the table below.
This study did not independently verify the portfolio holdings data in GIMD, as provided by the fund managers. However, we undertook a degree of “data cleaning” where errors in data inputting appeared to be obvious (such as large spikes in turnover by quarter or missing observations over time).
Quantitative data analysis: Sample statistics
Period June 2006 – June 2009
Frequency Quarterly data
Products by region Australia, Canada, Europe excluding UK, Europe including UK, Eurozone, International, UK and US*
Styles US small/large cap, neutral/value/growth/ varies, SRI and non-SRI*
* The regions and styles were included as far as our database allowed. The regions for which we did not have sufficient data to perform the calculations include Japan, emerging markets, Asia and New Zealand. Data defined by market cap was only available for the US products.
Qualitative analysisIn addition to the quantitative analysis, the qualitative component of the research was designed to delve deeper into understanding the drivers of holding periods, the factors that have an impact on investor behavior and the extent to which short-termism is perceived to be a problem (or not) by active managers. In particular, the aim of the case studies was to examine:
A. Causes of short-termism from the fund managers’ perspective
B. The implications of short-term investment horizons for fund managers themselves and across the wider market
C. Possible solutions or remedies to short-termism (as told from the fund managers’ perspective)
With that aim in mind, we invited 12 fund managers to participate in a semi-structured interview with Mercer. We selected the managers with a view to having a reasonable representation across regions and investment styles in order to make the results more suited to general conclusions. Eight managers agreed to participate in the interviews, the profiles of which are summarized in the table below.
Qualitative data analysis: Sample statistics
Number of case studies 8
Regional breakdown:
Europe including UK 1
International 2
United States 5
Style breakdown:
Neutral 1
Value 3
Growth 2
Varies 2
Non-SRI 6
SRI 2
Small cap 2
Mid cap 1
Large cap 5

6
We invited the interviewees to participate in the case studies on an anonymous basis in order to encourage a free flow of dialogue and a more open discussion, without the fear of commercial sensitivities inhibiting the conversation. The interviews were held via a tele-conference and lasted an average of one hour. The interviews were recorded for transcription, the high-lights of which are presented in Section 5 of this report.
The senior/lead portfolio manager participated in each interview; this was an important element for having a fruitful discussion that delved into investment horizons as told from the portfolio managers’ perspective. We wanted to avoid marketing speak and have a conversation with the investment decision maker directly. Often the lead portfolio manager was accompanied by some of his/her colleagues who also contributed to the discussion.
The interviews were semi-structured with a list of some possible discussion topics sent ahead of the meeting to allow some preparation time for the managers. The interviews did not go through each question rigidly, as the flow of the discussion led their direction. The issues/questions that were used as the guide for the interviews are provided below.
Portfolio turnover:
■ Do you monitor portfolio turnover? If yes, how, how often, and why do you believe it is important?
■ Do you have a target or desired turnover goal/range? If so, what is it?
■ Has your turnover been higher or lower than expected over the last three years, and by how much?
■ What are the main factors that might cause you to deviate significantly from your desired turnover goal/range?
Client interest in portfolio turnover:
■ Do your clients ask you to report portfolio turnover? If yes, how often and in what format is this provided?
■ Are you ever questioned about portfolio turnover in your regular review meetings with clients?
■ How important do you think turnover is from your clients’ perspective?
Incentive systems:
■ Are you paid a performance-based fee from your investor base? If yes, over what time period is this evaluated?
■ Within your organization, what are the primary determinants of your bonus payment?
■ What is the timeframe upon which the bonus payment is evaluated?
Time horizons:
■ What would you say is the average holding period with the entire equities market?
■ Do you think that the average market holding period affects how corporations create long-term value?
■ In your opinion, what would need to change for the market to adopt a longer-term horizon when making investment decisions? This can either be changes at the market-wide (industry) level, changes within your specific organization or changes in the relationship you have directly with your clients.
7
The average holding period of over 900 institutional actively managed equity portfolios was calculated from the period June 2006 to June 2009 across all major regions and styles for which we had available data, including value, growth, small, large cap and socially responsible investment (SRI) strategies.8 The primary aim of the data analysis was to:
■ Gain a baseline for turnover, against which deviations by style and region could be analyzed
■ Analyze the difference between fund managers’ expected turnover versus actual turnover of investment products
■ Analyze how actual turnover versus turnover expectations varies by region and investment style
Overall findingsAppendix A provides the charts and tables presenting the full results and data analysis. In summary, for all the investment products included in our analysis, we found that:
■ The average annual turnover of the sample (991 strategies) is 72%
■ Using the definition of 100% or greater annual turn-over as symptomatic of short-termism, we found that 193 of the 991 strategies fell into that category, meaning that around 20% of strategies turn over their portfolio completely every year
■ Analysis of actual annual turnover versus expected annual turnover revealed that of those that reported both their expected and actual turnover level (822 strategies), 540 (or 65%) recorded higher actual turnover than their expected level
■ We also examined the profile of managers based on the size of the fund in terms of assets under management and found that there was a high concentration of funds in the smaller end of the AUM spectrum. The average AUM of the entire sample (991 strategies) was US$2.3 billion; within that sample, around 75% of the managers that exceeded their expected turnover had AUM between US$500 million – US$2.5 billion
By region and by style, we found the following:
■ Strategies that represent equity mandates in International, European and US products recorded a shorter time horizon than the products managing equities across other regions
■ US small cap products are on average shorter-term (88% average annual turnover) than US large cap products (69%)
■ Growth products are on average shorter-term (77% average annual turnover) than value products (60%)
■ Non-SRI products are on average shorter-term (72% average annual turnover) than SRI products (55%)
Key conclusions:
■ Based on the sample of institutional products included in this analysis, short-termism exists and represents a material “tail risk” of investment products, but is not the average
■ There is significant variability in the range of turn-over over time and between product styles
■ When managers do exceed their expected turnover, the difference can be significant, which could be of concern for institutional investors due to the possible impact on performance and the risk that the manager is not behaving according to his/her stated investment approach
■ In light of the above, the investment horizon presents an additional and, perhaps, as yet largely unmeasured risk for institutional investors in the selection and review of active managers
Disaggregated analysis – a focus on managers who exceeded their turnover expectationsBuilding on these findings at the total sample level, we delved deeper to analyze which investment products exceeded their expected annual turnover over a three-year period.9 This was of particular interest since some strategies will naturally have a higher turnover rate as part of their alpha generation process
Findings: Quantitative analysis
8 The portfolios are mostly structured as separate or segregated accounts, managed for institutional investors. In some cases, the manager markets the portfolios as both separate accounts and mutual funds/retail accounts.
9 No minimum threshold was placed on the calculation of differences over the three-year average period, hence the deviations are unconstrained. The distribution of the differences in turnover shows that 64% of strategies exceeded turnover by 25% or less; 22% exceeded turnover by between 25 – 50%; 9% exceeded turnover by between 50 – 75%; and 5% exceeded by greater than 75%.
8
and have already made that explicit in the way they describe their strategy. By looking at actual turnover versus expected turnover, we were better able to identify the strategies that strayed from their stated investment approach in terms of expected turnover. As mentioned above, this could be a cause for concern for institutional investors due to not only a possible impact on trading costs and higher market timing risks, but also as a possible warning sign that the manager has deviated from his/her stated approach in regard to investment horizon.
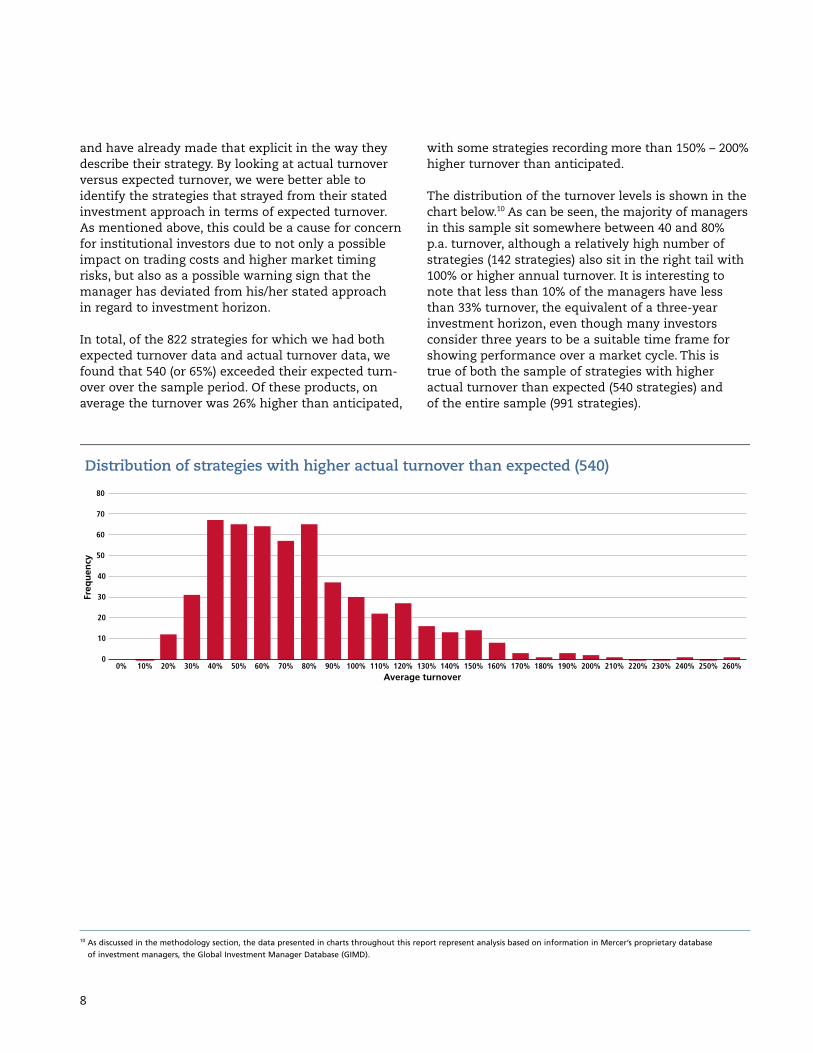
In total, of the 822 strategies for which we had both expected turnover data and actual turnover data, we found that 540 (or 65%) exceeded their expected turn-over over the sample period. Of these products, on average the turnover was 26% higher than anticipated,
with some strategies recording more than 150% – 200% higher turnover than anticipated.
The distribution of the turnover levels is shown in the chart below.10 As can be seen, the majority of managers in this sample sit somewhere between 40 and 80% p.a. turnover, although a relatively high number of strategies (142 strategies) also sit in the right tail with 100% or higher annual turnover. It is interesting to note that less than 10% of the managers have less than 33% turnover, the equivalent of a three-year investment horizon, even though many investors consider three years to be a suitable time frame for showing performance over a market cycle. This is true of both the sample of strategies with higher actual turnover than expected (540 strategies) and of the entire sample (991 strategies).
10 As discussed in the methodology section, the data presented in charts throughout this report represent analysis based on information in Mercer’s proprietary database of investment managers, the Global Investment Manager Database (GIMD).
10
20
0
30
40
50
60
70
80
Distribution of strategies with higher actual turnover than expected (540)
Average turnover
Freq
uenc
y
0% 10% 20% 30% 40% 50% 60% 70% 80% 90% 100% 110% 120% 130% 140% 150% 160% 170% 180% 190% 200% 210% 220% 230% 240% 250% 260%
9
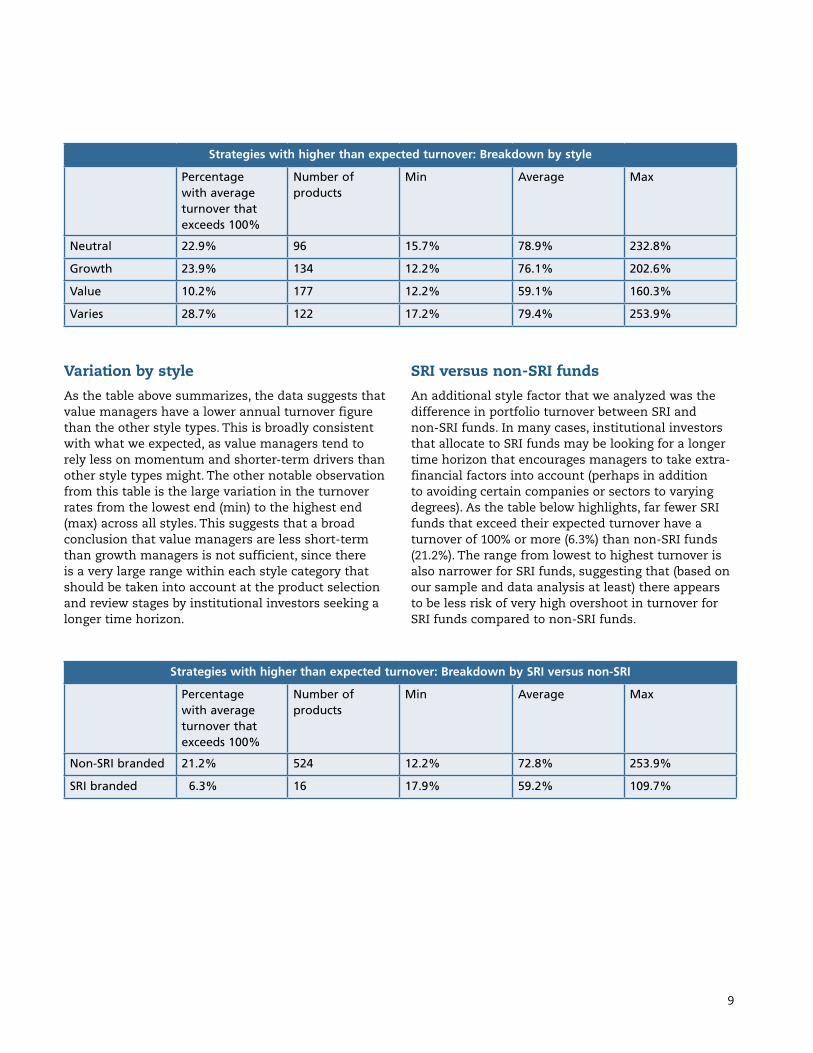
Variation by styleAs the table above summarizes, the data suggests that value managers have a lower annual turnover figure than the other style types. This is broadly consistent with what we expected, as value managers tend to rely less on momentum and shorter-term drivers than other style types might. The other notable observation from this table is the large variation in the turnover rates from the lowest end (min) to the highest end (max) across all styles. This suggests that a broad conclusion that value managers are less short-term than growth managers is not sufficient, since there is a very large range within each style category that should be taken into account at the product selection and review stages by institutional investors seeking a longer time horizon.
SRI versus non-SRI fundsAn additional style factor that we analyzed was the difference in portfolio turnover between SRI and non-SRI funds. In many cases, institutional investors that allocate to SRI funds may be looking for a longer time horizon that encourages managers to take extra-financial factors into account (perhaps in addition to avoiding certain companies or sectors to varying degrees). As the table below highlights, far fewer SRI funds that exceed their expected turnover have a turnover of 100% or more (6.3%) than non-SRI funds (21.2%). The range from lowest to highest turnover is also narrower for SRI funds, suggesting that (based on our sample and data analysis at least) there appears to be less risk of very high overshoot in turnover for SRI funds compared to non-SRI funds.
Strategies with higher than expected turnover: Breakdown by style
Percentage with average turnover that exceeds 100%
Number of products
Min Average Max
Neutral 22.9% 96 15.7% 78.9% 232.8%
Growth 23.9% 134 12.2% 76.1% 202.6%
Value 10.2% 177 12.2% 59.1% 160.3%
Varies 28.7% 122 17.2% 79.4% 253.9%
Strategies with higher than expected turnover: Breakdown by SRI versus non-SRI
Percentage with average turnover that exceeds 100%
Number of products
Min Average Max
Non-SRI branded 21.2% 524 12.2% 72.8% 253.9%
SRI branded 6.3% 16 17.9% 59.2% 109.7%
10
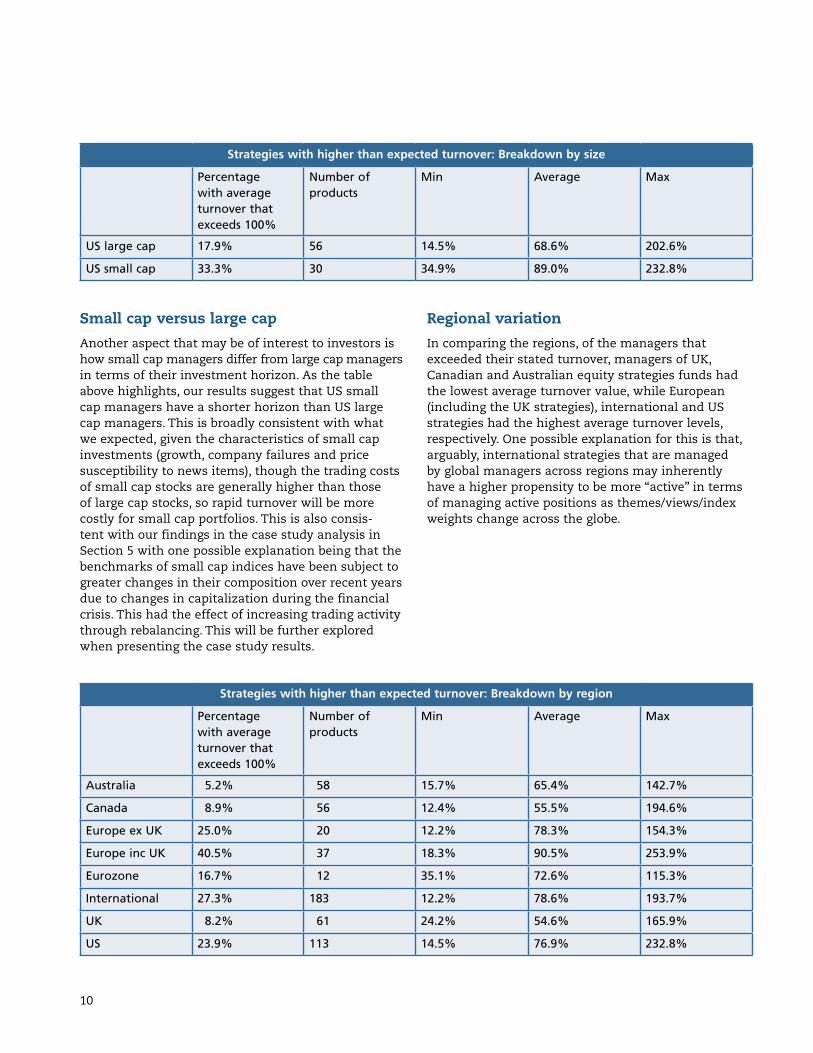
Small cap versus large capAnother aspect that may be of interest to investors is how small cap managers differ from large cap managers in terms of their investment horizon. As the table above highlights, our results suggest that US small cap managers have a shorter horizon than US large cap managers. This is broadly consistent with what we expected, given the characteristics of small cap investments (growth, company failures and price susceptibility to news items), though the trading costs of small cap stocks are generally higher than those of large cap stocks, so rapid turnover will be more costly for small cap portfolios. This is also consis-tent with our findings in the case study analysis in Section 5 with one possible explanation being that the benchmarks of small cap indices have been subject to greater changes in their composition over recent years due to changes in capitalization during the financial crisis. This had the effect of increasing trading activity through rebalancing. This will be further explored when presenting the case study results.
Regional variationIn comparing the regions, of the managers that exceeded their stated turnover, managers of UK, Canadian and Australian equity strategies funds had the lowest average turnover value, while European (including the UK strategies), international and US strategies had the highest average turnover levels, respectively. One possible explanation for this is that, arguably, international strategies that are managed by global managers across regions may inherently have a higher propensity to be more “active” in terms of managing active positions as themes/views/index weights change across the globe.
Strategies with higher than expected turnover: Breakdown by size
Percentage with average turnover that exceeds 100%
Number of products
Min Average Max
US large cap 17.9% 56 14.5% 68.6% 202.6%
US small cap 33.3% 30 34.9% 89.0% 232.8%
Strategies with higher than expected turnover: Breakdown by region
Percentage with average turnover that exceeds 100%
Number of products
Min Average Max
Australia 5.2% 58 15.7% 65.4% 142.7%
Canada 8.9% 56 12.4% 55.5% 194.6%
Europe ex UK 25.0% 20 12.2% 78.3% 154.3%
Europe inc UK 40.5% 37 18.3% 90.5% 253.9%
Eurozone 16.7% 12 35.1% 72.6% 115.3%
International 27.3% 183 12.2% 78.6% 193.7%
UK 8.2% 61 24.2% 54.6% 165.9%
US 23.9% 113 14.5% 76.9% 232.8%
11
In past studies of short-termism, the perception is that it is a global phenomenon and not one particu-lar to a certain region. The table above suggests that the variation in the turnover levels across regions is not insignificant and by no means uniform. We made some effort to examine the domicile of managers versus the region of the strategy that they manage, with a view to considering whether there is a cultural/local convention influence over investment horizons at play. Unfortunately our data on managers’ domicile was not insightful as a cultural/local convention proxy due to the dominant use of tax havens as domicile.
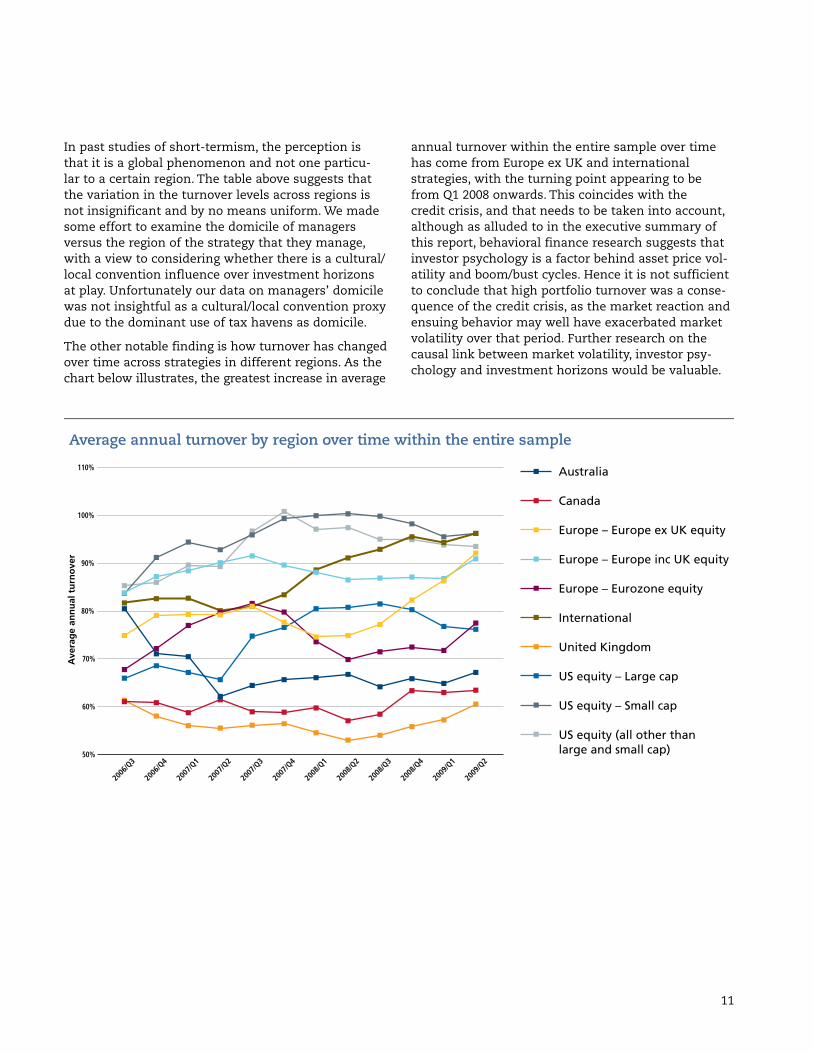
The other notable finding is how turnover has changed over time across strategies in different regions. As the chart below illustrates, the greatest increase in average
annual turnover within the entire sample over time has come from Europe ex UK and international strategies, with the turning point appearing to be from Q1 2008 onwards. This coincides with the credit crisis, and that needs to be taken into account, although as alluded to in the executive summary of this report, behavioral finance research suggests that investor psychology is a factor behind asset price vol-atility and boom/bust cycles. Hence it is not sufficient to conclude that high portfolio turnover was a conse-quence of the credit crisis, as the market reaction and ensuing behavior may well have exacerbated market volatility over that period. Further research on the causal link between market volatility, investor psy-chology and investment horizons would be valuable.
50%
60%
70%
80%
90%
100%
110%
Average annual turnover by region over time within the entire sample
Ave
rage
ann
ual t
urno
ver
2006
/Q3
2006
/Q4
2007
/Q1
2007
/Q2
2007
/Q3
2007
/Q4
2008
/Q1
2008
/Q2
2008
/Q3
2008
/Q4
2009
/Q1
2009
/Q2
Australia
Canada
Europe – Europe ex UK equity
Europe – Europe inc UK equity
Europe – Eurozone equity
International
United Kingdom
US equity – Large cap
US equity – Small cap
US equity (all other than large and small cap)
12
The aim of the case studies was to delve deeper into understanding the drivers of portfolio turnover, the factors that have an impact on investor behavior and the extent to which short-termism is perceived to be a problem (or not) by active managers. In particular, the case studies examined the following:
A. Causes of short-termism from the fund managers’ perspective
B. The implications of short-term investment horizons for fund managers themselves and across the wider market
C. Possible solutions or remedies to short-termism (as told from the fund managers’ perspective)
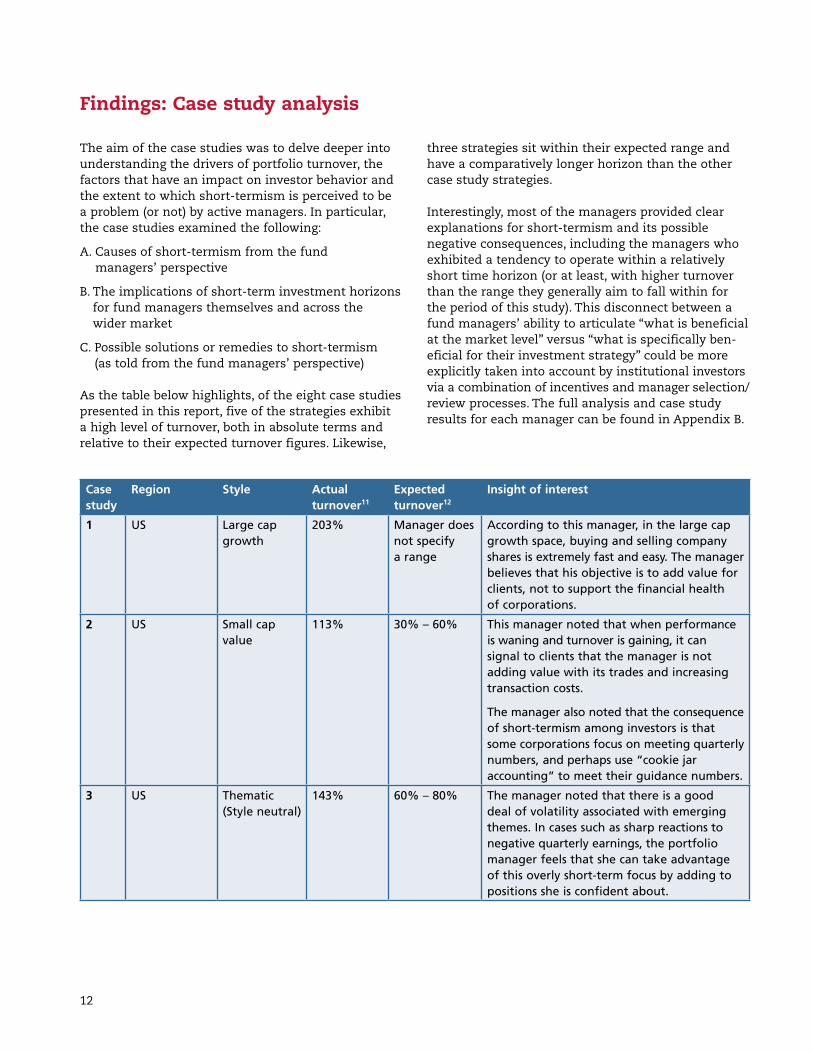
As the table below highlights, of the eight case studies presented in this report, five of the strategies exhibit a high level of turnover, both in absolute terms and relative to their expected turnover figures. Likewise,
three strategies sit within their expected range and have a comparatively longer horizon than the other case study strategies.
Interestingly, most of the managers provided clear explanations for short-termism and its possible negative consequences, including the managers who exhibited a tendency to operate within a relatively short time horizon (or at least, with higher turnover than the range they generally aim to fall within for the period of this study). This disconnect between a fund managers’ ability to articulate “what is beneficial at the market level” versus “what is specifically ben-eficial for their investment strategy” could be more explicitly taken into account by institutional investors via a combination of incentives and manager selection /review processes. The full analysis and case study results for each manager can be found in Appendix B.
Findings: Case study analysis
Case study
Region Style Actual turnover11
Expected turnover 12
Insight of interest
1 US Large cap growth
203% Manager does not specify a range
According to this manager, in the large cap growth space, buying and selling company shares is extremely fast and easy. The manager believes that his objective is to add value for clients, not to support the financial health of corporations.
2 US Small cap value
113% 30% – 60% This manager noted that when performance is waning and turnover is gaining, it can signal to clients that the manager is not adding value with its trades and increasing transaction costs.
The manager also noted that the consequence of short-termism among investors is that some corporations focus on meeting quarterly numbers, and perhaps use “cookie jar accounting” to meet their guidance numbers.
3 US Thematic (Style neutral)
143% 60% – 80% The manager noted that there is a good deal of volatility associated with emerging themes. In cases such as sharp reactions to negative quarterly earnings, the portfolio manager feels that she can take advantage of this overly short-term focus by adding to positions she is confident about.
13
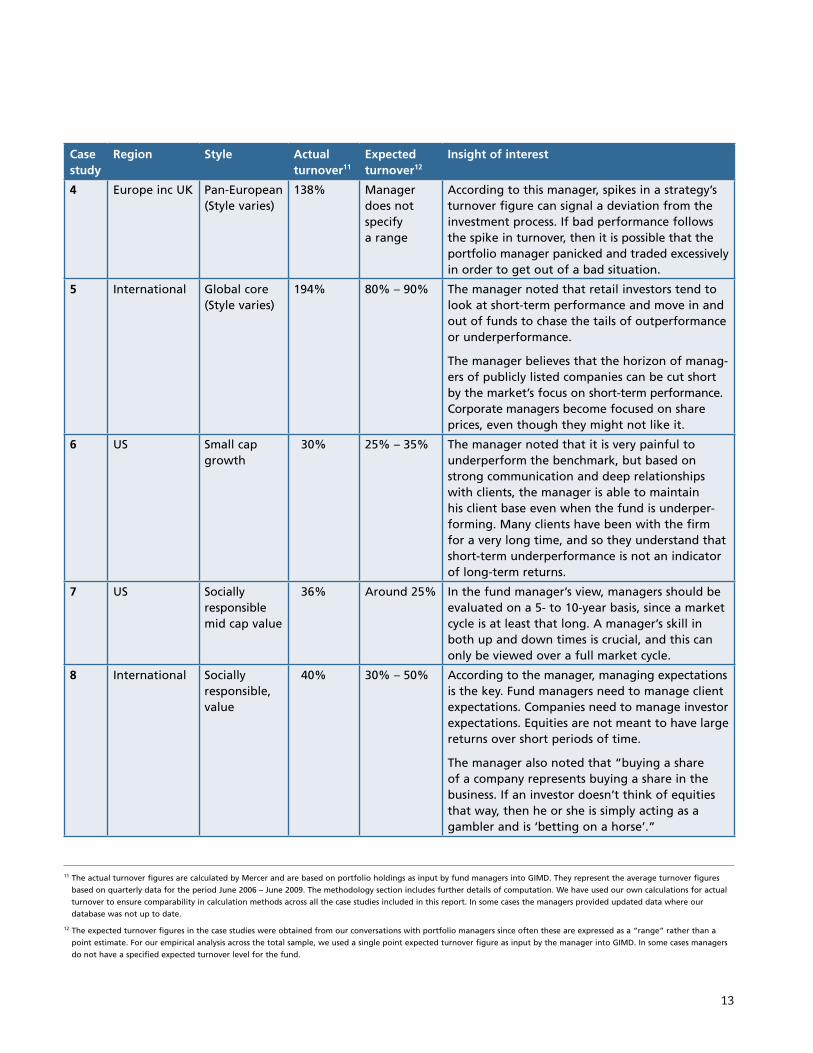
Case study
Region Style Actual turnover11
Expected turnover 12
Insight of interest
4 Europe inc UK Pan-European (Style varies)
138% Manager does not specify a range
According to this manager, spikes in a strategy’s turnover figure can signal a deviation from the investment process. If bad performance follows the spike in turnover, then it is possible that the portfolio manager panicked and traded excessively in order to get out of a bad situation.
5 International Global core(Style varies)
194% 80% – 90% The manager noted that retail investors tend to look at short-term performance and move in and out of funds to chase the tails of outperformance or underperformance.
The manager believes that the horizon of manag-ers of publicly listed companies can be cut short by the market’s focus on short-term performance. Corporate managers become focused on share prices, even though they might not like it.
6 US Small cap growth
30% 25% – 35% The manager noted that it is very painful to underperform the benchmark, but based on strong communication and deep relationships with clients, the manager is able to maintain his client base even when the fund is under per-forming. Many clients have been with the firm for a very long time, and so they understand that short-term underperformance is not an indicator of long-term returns.
7 US Socially responsible mid cap value
36% Around 25% In the fund manager’s view, managers should be evaluated on a 5- to 10-year basis, since a market cycle is at least that long. A manager’s skill in both up and down times is crucial, and this can only be viewed over a full market cycle.
8 International Socially responsible, value
40% 30% – 50% According to the manager, managing expectations is the key. Fund managers need to manage client expectations. Companies need to manage investor expectations. Equities are not meant to have large returns over short periods of time.
The manager also noted that “buying a share of a company represents buying a share in the business. If an investor doesn’t think of equities that way, then he or she is simply acting as a gambler and is ‘betting on a horse’.”
11 The actual turnover figures are calculated by Mercer and are based on portfolio holdings as input by fund managers into GIMD. They represent the average turnover figures based on quarterly data for the period June 2006 – June 2009. The methodology section includes further details of computation. We have used our own calculations for actual turnover to ensure comparability in calculation methods across all the case studies included in this report. In some cases the managers provided updated data where our database was not up to date.
12 The expected turnover figures in the case studies were obtained from our conversations with portfolio managers since often these are expressed as a “range” rather than a point estimate. For our empirical analysis across the total sample, we used a single point expected turnover figure as input by the manager into GIMD. In some cases managers do not have a specified expected turnover level for the fund.
14
There are important insights to glean from the case studies from the perspective of both the relatively long-horizon investors (case studies 6, 7 and 8) and the shorter-horizon investors (case studies 1 – 5 inclusive). This section summarizes the themes as they emerged in terms of:
■ The causes of short-termism
■ The consequences of short-termism
■ Mechanisms to extend investment horizons
For detailed profiles of the case studies, please see Appendix B. All of the findings below on the causes, consequences and possible solutions to short-termism are based on our discussions with the fund managers and do not necessarily represent the views of Mercer or the IRRC Institute.
Causes of short-termismThere has been extensive research on the causes of short-termism elsewhere, and it is not the purpose of this report to present a literature review. Nevertheless, a list of some of the relevant papers on this topic is presented in Appendix C. With this research in mind, we found a number of recurring themes emerge during our discussions with fund managers on the multiple drivers of short-termism, including:
■ Volatile markets and changing macroeconomic conditions – Almost all the managers cited the abnormal conditions in the financial markets over the past 18 months as a contributor to higher port-folio turnover. Some felt that the volatility produced new opportunities for them to exploit, while others were forced to close positions and cut their losses. Changes in benchmark weights were a contributing factor over this period (this was apparently especially pronounced in small cap stocks).
– It is interesting to note that in our overall sample data, spikes in turnover were not uncommon before the credit crisis.
■ The emergence of short-term traders – Hedge funds were cited by a few of the fund manag-ers as contributing to the shorter horizon of the market more widely. For example, one interviewee argued that “Flash traders or hedge funds with programmed algorithms contribute a great deal of turnover to the aggregate market turnover. … Investors who are not process-driven are more prone to be caught up in the herd mentality.”
■ Mixed signals from clients – Most of the fund managers felt that there is a relatively low level of interest from clients in portfolio turnover and that end investors often send conflicting messages about their expectations in regard to the investment hori-zon. This reportedly placed doubts over the strength of their conviction regarding the investment horizon against other priorities (such as performance relative to an index or benchmark over shorter time periods). As one manager stated: “Pension trustees can seem concerned about the long-term performance of their funds in one room and then seem overly concerned about the short-term performance in the next office over.”
– In addition to this, there was some mention of relatively short review periods of mandates, with three years cited as exacerbating short-term thinking as it increases the perceived risk of losing the mandate for underperformance over a period that ideally would encompass a full economic cycle.
■ Short-term incentive systems – On a related note to the signal from clients, some of the interviewees believe that the incentive systems are often devised to pay fund managers to be aggressive over shorter time periods. This was considered to be especially pronounced for mutual funds, where managers are often incentivized against quarterly performance versus a market benchmark or quartile rankings.
– On the question of performance fees and possible fee claw-back for periods of underperformance, almost all managers had little experience with performance-based fee arrangements, and there appeared to be little rush to move in this direction. Indeed, one manager noted that his team needed to be sure they could cover their fixed costs with a flat fee first, before embarking on performance-related payment structures.
– Another theme that emerged was the apparent lack of structure and experience in establishing performance fee agreements that can reportedly be time-consuming and complex to implement due to a lack of industry standards (and hence usually avoided by clients, although managers are willing to implement performance-based fees if they are asked).
15
■ Behavioral biases – Many of the interviewees cited “herding” or “panic” as reasons why turnover might increase at certain points in time. Some believe that momentum-based strategies are more at risk of falling prey to such biases. The risk of “recency bias” also emerged as a possible driver of the short-term cycle, whereby end investors allocate funds to strategies that have performed well recently and shift out of underperforming funds (with the obvi-ous risk that the performance trends reverse). The perceived risk of being fired from clients in such situations was said to be higher where relationships are not particularly deep or well-established over a full economic cycle.
Consequences of short-termismOn the “so what” question in regard to short-termism, the following themes emerged from our discussions with the managers:
■ It’s part of how the market functions – At least one fund manager (case study 1) felt that it was “not [his/her] job to support the financial health of corporations” and hence the market’s overall short-term focus was of little consequence for him/her. Another felt that there are different types of investment strategies, some are short-term, medium or long-term in nature (case study 4). It is not a question of “good or bad” in this manager’s opinion but rather realizing that these differences exist, noting that “long-termism is not capitalism.”
■ Places short-term pressure on companies – When the discussion turned from the implications for them as fund managers to the wider market impacts, almost all the managers observed that short-termism can encourage short-term thinking among corporations, which can distract corporate directors from their strategy and potentially undermine long-term shareholder value.
– A few of the managers believe that this can be a distinguishing factor in appraising companies for possible investment, where they will avoid investing in those companies that are more beholden to the demands of short-term investors. This could be a line of enquiry to pursue in fur-ther research – namely, to what extent (and how) do investors assess what companies are more prone to succumb to the short-term demands of investors?
■ Increases market volatility – Almost all managers thought that short-termism could increase market volatility which, in turn, could increase transaction costs. However, somewhat surprisingly, only one manager (case study 8) saw this from the end investors’ perspective and pointed out that higher turnover and transaction costs winds up “costing clients money” in terms of net returns. The conver-sations with the other managers focused largely on the implications of higher volatility for them in managing their strategy, which was, in general, thought to produce more opportunities for them to exploit. As such, even the long-horizon investors (case studies 6, 7 and 8) did not think that short-term investing had a detrimental impact on their ability to generate alpha (at least in gross terms, which is the way the managers view it). Managers’ view on this issue may be tied with their ability and confidence in generating enough alpha to justify their transaction costs and higher fees to clients. Otherwise there is a true disconnect between portfolio manager’s objectives and those of the end client.
■ Potentially demonstrates a lack of discipline in process – Two of the managers with a longer horizon (case studies 7 and 8) believed that higher than expected portfolio turnover could reflect a lack of discipline in the investment process and, as such, be symptomatic of a potential problem with the process itself.
■ Creates a misalignment of interests – Another manager (case study 3) suggested that a short-term investment focus can open up a divide and potential conflict of interest between achieving the short-term goals of fund managers and the long-term objectives of institutional investors. Interestingly, based on our calculations, this manager has a relatively high turnover level of 143% p.a. that is markedly above their targeted range of 60 to 80% p.a. Explaining the disconnect between understanding wider market impacts and behaving another way is a challenging dichotomy and a possible subject for further research.
16
Mechanisms to extend the investment horizon
As the preceding discussion highlighted, while not all the interviewees felt that extending the horizon was something that was in their best interest or even necessary, at a minimum the analysis suggests that there is a real risk that portfolio managers are straying from their investment process in regard to their investment horizon, and this requires further exami-nation. Furthermore, those end investors that actively seek to encourage longer-term thinking and investment horizons would find these results a concern and may be interested in exploring possible solutions. Some fruitful discussions took place with the case study portfolio managers around the conditions in which longer-term thinking might predominate, including:
■ Regulatory measures – A range of ideas were raised by the managers about what regulatory measures might be considered to promote longer investment horizons. Note that the managers were not prompted by us to consider regulation, we asked a broad question about “what changes might promote longer-term horizons” and some of them raised regulation. Perhaps because some believe that “long-termism is not capitalism,” they feel that regulatory oversight is necessary to extend the market’s focus further into the future. One of the ideas that came forward was to restrict hedge fund activities in some way to limit the volume of trading (Note: The managers interviewed were long-only equity managers and not hedge fund managers; it is not clear whether hedge funds actually have a shorter realized time horizon than traditional long-only managers). A few managers also mentioned introducing a transaction tax to raise trading costs; while others mentioned using another form of taxation to create a disincentive to trade (such as changing capital gains tax rules).13
– On the subject of regulation, none of the managers raised “soft” or voluntary regulatory measures as possible levers for change (or indeed collaborative measures among fund managers and end investors themselves).
■ Longevity of client relationships – Another theme that emerged (particularly from case 6, where turn-over stayed within its expected range despite the recent market volatility) was the belief that longevity of client relationships encourages managers to stay true to their process (including investment horizons). The manager noted that because his team had been around for a long time (inception 1985) and had client relationships that span a full economic cycle, they felt less at risk and under pressure that the bulk of their clients would drop them for short-term market underperformance (and take on the risk that a few of them might). On a related point, some of the managers felt that if they had longer mandates with clients that stretched beyond three years, then it would help to alleviate short-term pressure.14
■ Client understanding – On a related point, another theme that emerged across almost all the managers (even those whose turnover exceeded its expected range by a considerable amount) was the importance of being clear about the investment horizon and how that fits into the process from the outset, to minimize the risk of misgivings and being fired in the future for short-term underperformance. One manager in particular who appeared to stay within his expected turnover range over volatile periods (case 7) noted that in all pitches with clients his team emphasized that the portfolio would look very different from the benchmark and, in doing so, they hoped to attract like-minded end investors that are also focused on the long term.
13 As with all the case study evidence included in this report, these views represent those of the interviewees and not necessarily of Mercer or the IRRC.
14 The subject of investment mandates that encourage longer-term thinking has been pursued by the Marathon Club in its study entitled Guidance Note for Long-Term Investing (http://www.marathonclub.co.uk/Docs/MarathonClubFINALDOC.pdf).

17
■ Incentives/corporate culture – To varying degrees, fund managers’ annual bonuses are linked to performance versus a benchmark or manager rankings table in any given year (with some attempting to measure and weigh this over a three-year period). Most managers felt that the manager ranking/league tables in particular created a short-term mindset and hence would not be a feature for long-horizon mandates. Of the three strategies that demonstrated more capability for staying close to their expected turnover range, we found varying approaches toward incentivizing their portfolio managers:
– Case 6 pays its employees on the basis of AUM for each strategy rather than relative performance. Retention and client satisfaction are therefore key. While this is no doubt linked to performance, the manager believes this subtle shift in focus changes the mindset of his portfolio managers in a way that encourages them to stay true to their investment process (including on the investment horizon)
– Case 7 allocates bonuses to its fund managers based on the firm’s quarterly profits, and these are paid quarterly. Interestingly, benchmarks and peer group rankings are also part of the evaluation process for research teams. There is also a lon-gevity aspect where the longer staff members have been with the firm, the higher their bonus allocation will be. The firm believes that by not focusing too much on individual’s personal track record, it encourages longer-term thinking despite the focus on quarterly results.
– Case 8 distributes bonus pools based on team performance relative to the peer group over the past 12 months. It also includes metrics to measure the quality of notes taken during company visits and contribution to team meetings. There appeared to be a strong sense of corporate culture and alignment with the firm’s process and less focus on individual performance.
18
Overall, our results demonstrate that there is a strong tendency for active (long-only) equity fund managers to have higher portfolio turnover rates than they claim. This produces some challenges for institutional investors, as higher than expected turnover could bring adverse consequences, the most obvious being higher trading costs. It could also be symptomatic of a deeper issue brewing in the investment process itself. In addition, there are wider impacts of short-horizon investing for the way the capital market functions, which have adverse consequences for institutional investors in terms of risk, such as higher market volatility and a potential misalignment of interests between agents (when long-horizon fund managers behave as short-term investors) and principals (when institutional investors seek long-horizon investments, but their managers have higher turnover than they claim).
The case study findings regarding possible ways to lengthen the investment horizon are broadly consistent with the findings of previous studies on this subject. Perhaps the added value of this work is the wider perspective it brings, as we found that the combined role of incentives/corporate culture, fostering client understanding, longevity of client relationships and perhaps regulatory measures all play a role in extending investment horizons. In particular, there is no silver bullet in the form of incentives, as we found that practices vary quite a lot, even within a relatively small sample of managers who managed to keep their horizon true to their process in volatile market conditions.
Throughout this report we have identified a few areas for additional research, one of these being the claim by some investors that some companies are more prone to succumb to short-term demands from investors than others, and that this becomes part of the appraisal of companies (where investors seek out companies that are more resistant to short-term demands). How do they do this? Is this pervasive? What are the features of more “resilient” companies in terms of short-term demands? The second potential area for further enquiry could be the potential
misalignment of interests between fund managers and end investors in their products in terms of investment horizons. We found a disconnect between fund managers’ understanding of the wider negative impacts of short-termism for end investors (such as higher trading costs, deviation from investment process and higher market volatility/risk, as detailed in this report based on our discussions with managers) and their perception of what this means for them as active fund managers (where generally it is a welcome development that they believe presents them with the opportunity to demonstrate their expertise and skill to produce alpha, at least in gross terms). Finally, another area of interest for further research is the causal link between market volatility and investment horizons; in other words, does market volatility encourage higher turnover, or does higher turnover lead to increased market volatility?
To sum up, while it is clear that there is a role for all types of investment strategies to exist – short- and long-horizon – it also appears to be true that many strategies (indeed some 65%, based on our sample) are exceeding their expected turnover rate and in some cases, by a considerable margin. No doubt this was exacerbated by the credit crisis, but the case studies showed that some managers that greatly exceed expected turnover do not see this as an issue to be explained or addressed. Others offered a range of drivers and potential solutions, such as regulating hedge funds and developing longer-term relationships with clients. To the extent that exceeding turnover expectations is a risk to end investors, the case studies suggest that the ability to help extend time horizons lies at many points on the investor supply chain (investment managers, end investors, regulators and intermediaries). At a minimum, this report suggests that to be on top of the potential risks from investing in actively managed long-only equity funds for both new and existing mandates, institutional investors would be wise to explicitly consider the investment horizon as an additional barometer of style and process, and, where relevant, investigate the reasons why a strategy has strayed from its stated horizon.
Conclusion
19
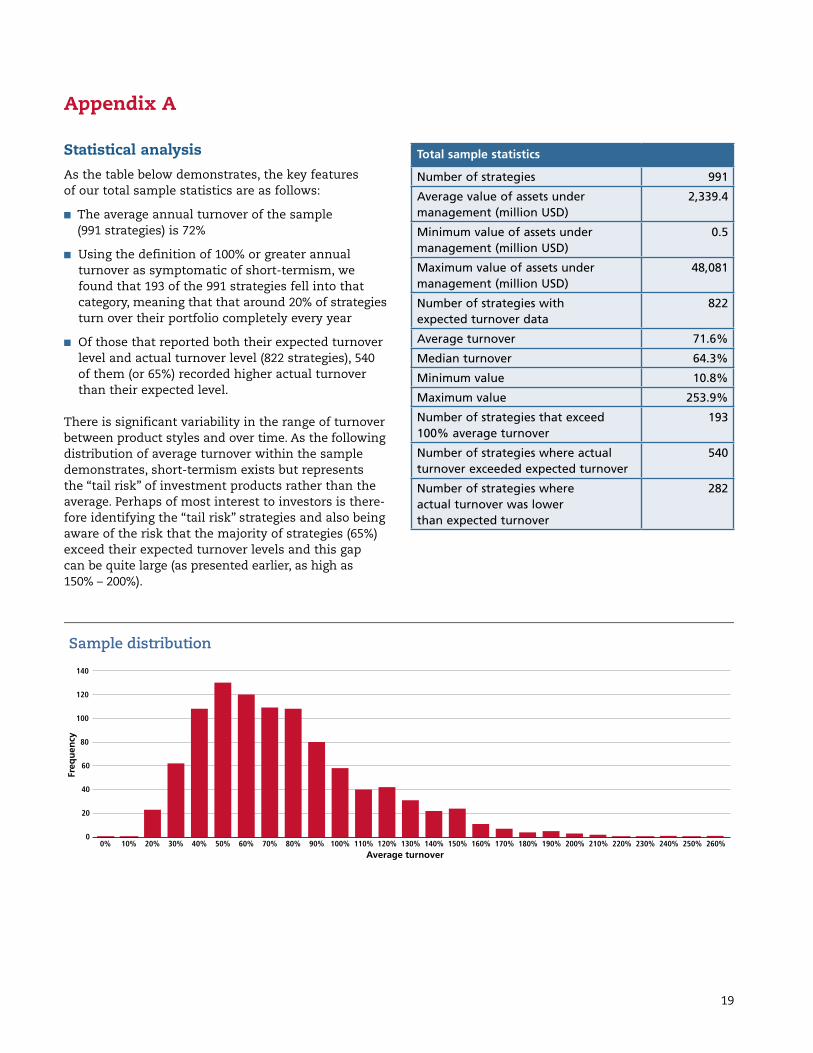
Statistical analysisAs the table below demonstrates, the key features of our total sample statistics are as follows:
■ The average annual turnover of the sample (991 strategies) is 72%
■ Using the definition of 100% or greater annual turnover as symptomatic of short-termism, we found that 193 of the 991 strategies fell into that category, meaning that that around 20% of strategies turn over their portfolio completely every year
■ Of those that reported both their expected turnover level and actual turnover level (822 strategies), 540 of them (or 65%) recorded higher actual turnover than their expected level.
There is significant variability in the range of turnover between product styles and over time. As the following distribution of average turnover within the sample demonstrates, short-termism exists but represents the “tail risk” of investment products rather than the average. Perhaps of most interest to investors is there-fore identifying the “tail risk” strategies and also being aware of the risk that the majority of strategies (65%) exceed their expected turnover levels and this gap can be quite large (as presented earlier, as high as 150% – 200%).
Total sample statistics
Number of strategies 991
Average value of assets under management (million USD)
2,339.4
Minimum value of assets under management (million USD)
0.5
Maximum value of assets under management (million USD)
48,081
Number of strategies with expected turnover data
822
Average turnover 71.6%
Median turnover 64.3%
Minimum value 10.8%
Maximum value 253.9%
Number of strategies that exceed 100% average turnover
193
Number of strategies where actual turnover exceeded expected turnover
540
Number of strategies where actual turnover was lower than expected turnover
282
Appendix A
20
40
60
80
100
120
140
Sample distribution
Average turnover
Freq
uenc
y
0% 10% 20% 30% 40% 50% 60% 70% 80% 90% 100% 110% 120% 130% 140% 150% 160% 170% 180% 190% 200% 210% 220% 230% 240% 250% 260%0
20
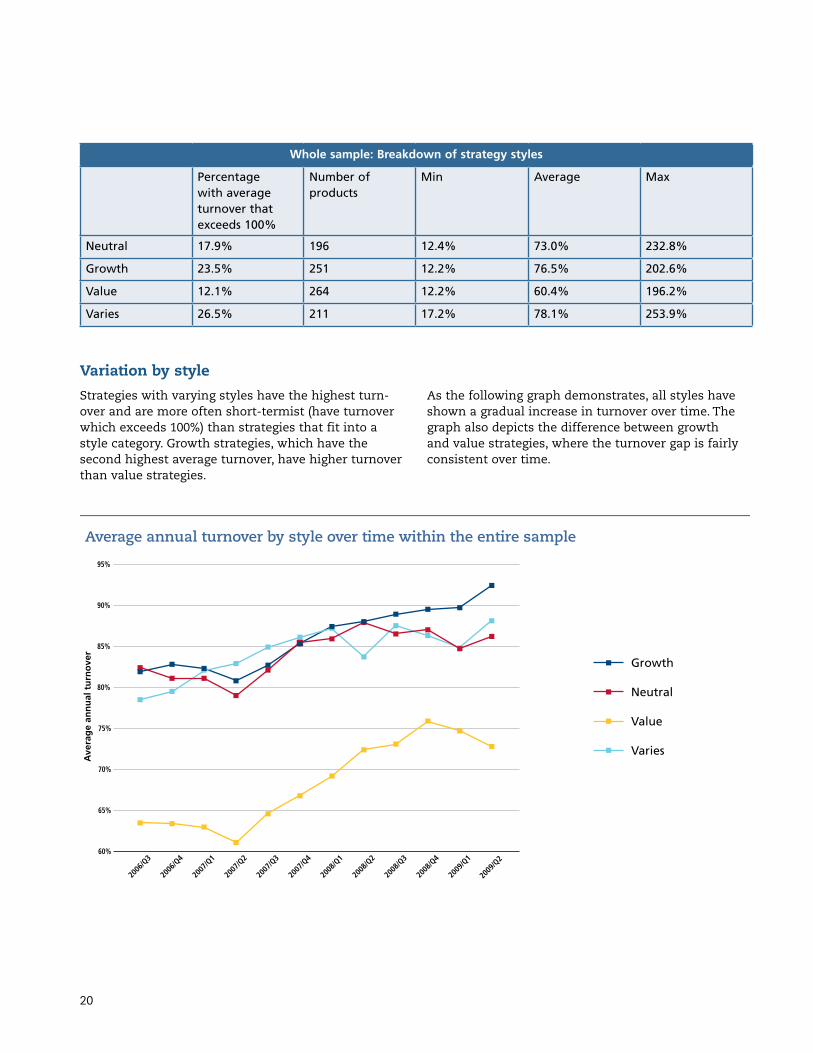
Variation by styleStrategies with varying styles have the highest turn-over and are more often short-termist (have turnover which exceeds 100%) than strategies that fit into a style category. Growth strategies, which have the second highest average turnover, have higher turnover than value strategies.
As the following graph demonstrates, all styles have shown a gradual increase in turnover over time. The graph also depicts the difference between growth and value strategies, where the turnover gap is fairly consistent over time.
Whole sample: Breakdown of strategy styles
Percentage with average turnover that exceeds 100%
Number of products
Min Average Max
Neutral 17.9% 196 12.4% 73.0% 232.8%
Growth 23.5% 251 12.2% 76.5% 202.6%
Value 12.1% 264 12.2% 60.4% 196.2%
Varies 26.5% 211 17.2% 78.1% 253.9%
60%
70%
65%
75%
80%
85%
90%
95%
Average annual turnover by style over time within the entire sample
Ave
rage
ann
ual t
urno
ver
2006
/Q3
2006
/Q4
2007
/Q1
2007
/Q2
2007
/Q3
2007
/Q4
2008
/Q1
2008
/Q2
2008
/Q3
2008
/Q4
2009
/Q1
2009
/Q2
Growth
Neutral
Value
Varies
21
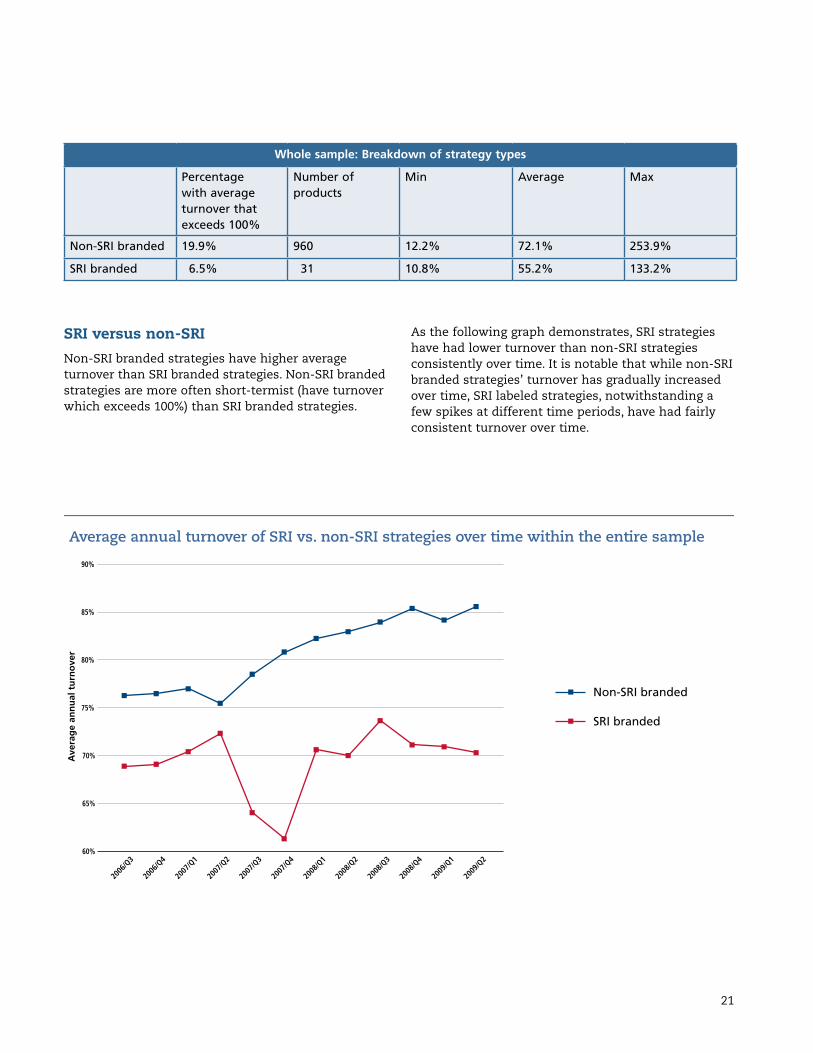
SRI versus non-SRINon-SRI branded strategies have higher average turnover than SRI branded strategies. Non-SRI branded strategies are more often short-termist (have turnover which exceeds 100%) than SRI branded strategies.
As the following graph demonstrates, SRI strategies have had lower turnover than non-SRI strategies consistently over time. It is notable that while non-SRI branded strategies’ turnover has gradually increased over time, SRI labeled strategies, notwithstanding a few spikes at different time periods, have had fairly consistent turnover over time.
Whole sample: Breakdown of strategy types
Percentage with average turnover that exceeds 100%
Number of products
Min Average Max
Non-SRI branded 19.9% 960 12.2% 72.1% 253.9%
SRI branded 6.5% 31 10.8% 55.2% 133.2%
60%
65%
70%
75%
80%
85%
90%
Average annual turnover of SRI vs. non-SRI strategies over time within the entire sample
Ave
rage
ann
ual t
urno
ver
2006
/Q3
2006
/Q4
2007
/Q1
2007
/Q2
2007
/Q3
2007
/Q4
2008
/Q1
2008
/Q2
2008
/Q3
2008
/Q4
2009
/Q1
2009
/Q2
Non-SRI branded
SRI branded
22
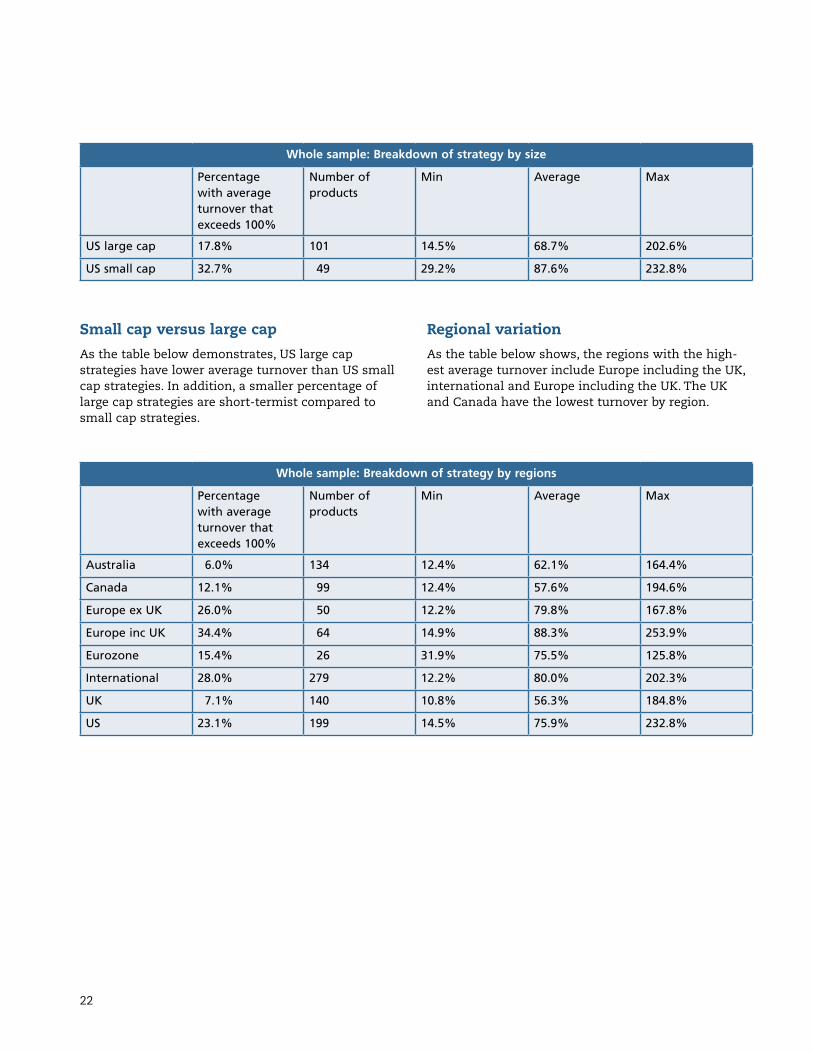
Small cap versus large capAs the table below demonstrates, US large cap strategies have lower average turnover than US small cap strategies. In addition, a smaller percentage of large cap strategies are short-termist compared to small cap strategies.
Regional variationAs the table below shows, the regions with the high-est average turnover include Europe including the UK, international and Europe including the UK. The UK and Canada have the lowest turnover by region.
Whole sample: Breakdown of strategy by regions
Percentage with average turnover that exceeds 100%
Number of products
Min Average Max
Australia 6.0% 134 12.4% 62.1% 164.4%
Canada 12.1% 99 12.4% 57.6% 194.6%
Europe ex UK 26.0% 50 12.2% 79.8% 167.8%
Europe inc UK 34.4% 64 14.9% 88.3% 253.9%
Eurozone 15.4% 26 31.9% 75.5% 125.8%
International 28.0% 279 12.2% 80.0% 202.3%
UK 7.1% 140 10.8% 56.3% 184.8%
US 23.1% 199 14.5% 75.9% 232.8%
Whole sample: Breakdown of strategy by size
Percentage with average turnover that exceeds 100%
Number of products
Min Average Max
US large cap 17.8% 101 14.5% 68.7% 202.6%
US small cap 32.7% 49 29.2% 87.6% 232.8%
23
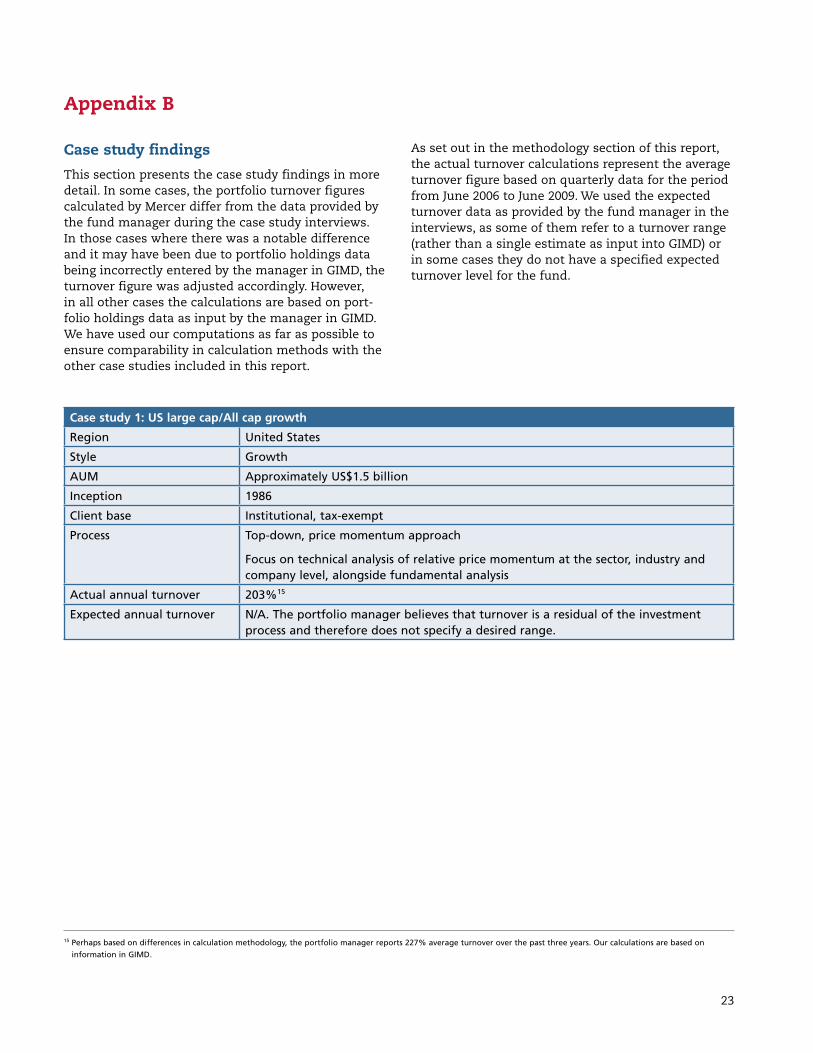
Case study findingsThis section presents the case study findings in more detail. In some cases, the portfolio turnover figures calculated by Mercer differ from the data provided by the fund manager during the case study interviews. In those cases where there was a notable difference and it may have been due to portfolio holdings data being incorrectly entered by the manager in GIMD, the turnover figure was adjusted accordingly. However, in all other cases the calculations are based on port-folio holdings data as input by the manager in GIMD. We have used our computations as far as possible to ensure comparability in calculation methods with the other case studies included in this report.
As set out in the methodology section of this report, the actual turnover calculations represent the average turnover figure based on quarterly data for the period from June 2006 to June 2009. We used the expected turnover data as provided by the fund manager in the interviews, as some of them refer to a turnover range (rather than a single estimate as input into GIMD) or in some cases they do not have a specified expected turnover level for the fund.
Appendix B
15 Perhaps based on differences in calculation methodology, the portfolio manager reports 227% average turnover over the past three years. Our calculations are based on information in GIMD.
Case study 1: US large cap/All cap growth
Region United States
Style Growth
AUM Approximately US$1.5 billion
Inception 1986
Client base Institutional, tax-exempt
Process Top-down, price momentum approach
Focus on technical analysis of relative price momentum at the sector, industry and company level, alongside fundamental analysis
Actual annual turnover 203%15
Expected annual turnover N/A. The portfolio manager believes that turnover is a residual of the investment process and therefore does not specify a desired range.
24
Portfolio turnover:Because this strategy is momentum-based, high turn-over is to be expected. The portfolio manager seeks to identify trends and move into and out of them as price movements dictate.
Although the manager does not specify a desired turnover range, the fund’s three-year average turn-over is higher than its five-year average turnover of 198%. This is because the investment process is geared toward identifying market leaders, and because global macro conditions have caused sharp changes in market leadership in the recent past. When macro conditions began to change drastically in July 2008, this manager sold holdings in order to be more defensively positioned. When those conditions reversed in March 2009, the manager again began repositioning the portfolio. This drastic repositioning is not characteristic of the investment strategy during more stable periods of macro conditions.
Client interest in portfolio turnover: This manager monitors turnover on a monthly basis and reports to clients quarterly. The turnover figures are part of the package of information clients receive about operations and performance. Because this is a momentum-based strategy, the manager doesn’t expect that clients that are adverse to turnover would be invested in this strategy. Instead, the manager believes the real concern for clients is the net perfor-mance, since trading costs are reflected in that figure. If the team has done an effective job of communicat-ing the investment process, then clients should under-stand that turnover is a residual of the investment process associated with this strategy.
Incentive systems:Clients pay either a flat fee, based on AUM, or a performance-based fee. Performance-based fee clients look back on a three-year rolling basis and compare performance relative to a specified benchmark with a fulcrum midpoint. A larger portion of clients pay on a flat-fee basis than based on performance.
Employees are paid a base salary, an annual performance- based bonus and an annual subjective bonus. The performance-based bonus is based on being in the top quartile of the like peer group for one year (trailing). The subjective bonus is the product of the entire annualized track record of the portfolio manager (some of the managers have been with the firm since its inception – their full track record
is considered) and the manager’s contribution to the broader portfolio management team. The subjective bonus makes up a larger portion of the overall bonus than the performance-based portion. The manager felt that big short-term performance-based bonuses attract employees who aren’t necessarily dedicated to the long-term interests of the firm.
Additional views from the portfolio manager: Do you think that the average market holding period affects how corporations create long-term value?
According to this manager, in the large cap growth space, buying and selling company shares is extremely fast and easy. Based on this reality, the manager believes that a manager’s objective is to add value for his clients, not to support the financial health of corporations.
In the large cap space, a manager’s actions do not have an impact on the stock price. For this reason, turnover itself does not impact a company’s cost of capital. The stock is always owned by someone. A company doesn’t necessarily suffer when a stock changes hands, because turnover occurs both when stock prices are rising and falling. Value investors sell when they hit their valuation targets, for example, and then momentum investors buy these shares in order to buy into a trend.
In company meetings, do you focus more on short-term issues, particularly the next quarter, than longer-term issues?
According to this manager, the team’s investment process leads it to look specifically for companies that will be able to sustain their leadership position relative to the peer group - they are trend followers. For other investors who are interested in valuation and look for companies that are on the verge of change, the approach to speaking with management may be different.
What would need to change for the market to become more long-term-oriented?
For the market to change and become more “long-term,” short-term/long-term capital gains structure would have to change or transaction costs would need to go up. “Flash traders” or hedge funds with programmed algorisms contribute a great deal of turnover to the aggregate market turnover. Investors who are not process driven are more prone to be caught up in the herd mentality.
25
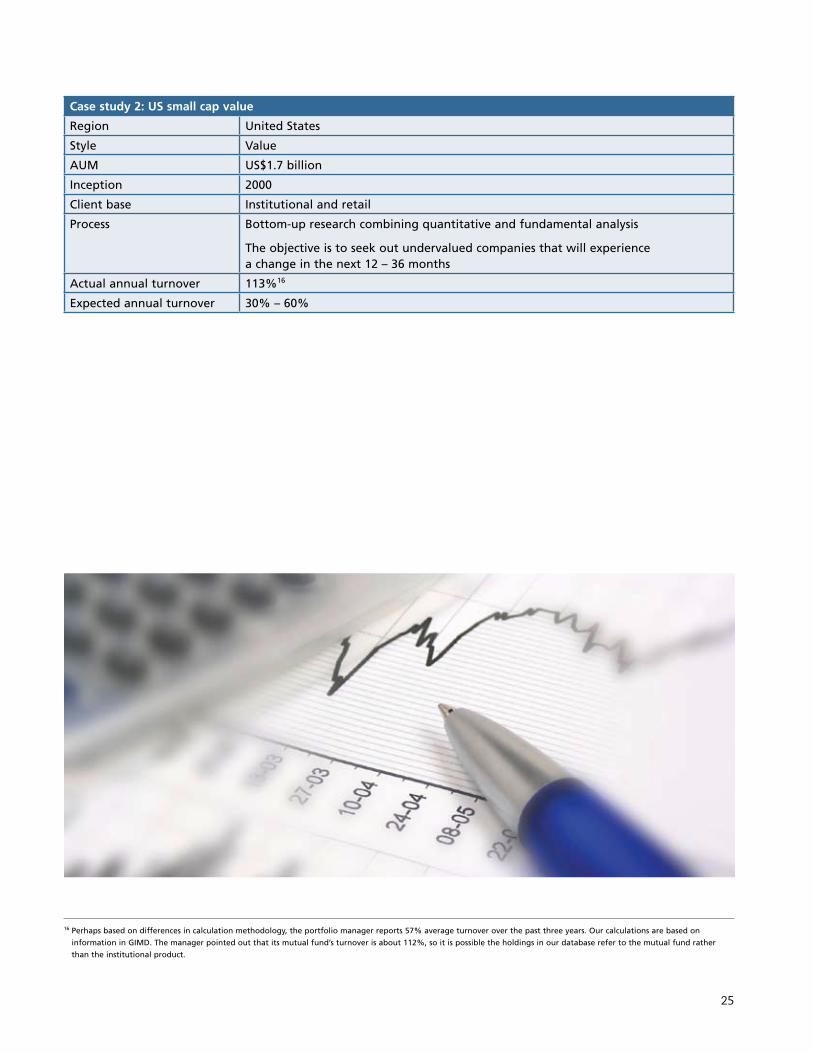
Case study 2: US small cap value
Region United States
Style Value
AUM US$1.7 billion
Inception 2000
Client base Institutional and retail
Process Bottom-up research combining quantitative and fundamental analysis
The objective is to seek out undervalued companies that will experience a change in the next 12 – 36 months
Actual annual turnover 113%16
Expected annual turnover 30% – 60%
16 Perhaps based on differences in calculation methodology, the portfolio manager reports 57% average turnover over the past three years. Our calculations are based on information in GIMD. The manager pointed out that its mutual fund’s turnover is about 112%, so it is possible the holdings in our database refer to the mutual fund rather than the institutional product.
26
Portfolio turnover:Turnover has been higher in the past 12 months than usual, which is a byproduct of market volatility. When there are dislocations from underlying fundamental value, the portfolio manager adds or trims names in the portfolio, under the assumption that the long-term thesis is still intact but the name has become over- or under-valued in the short-term. In the past 12 months, the manager has seen valuation targets that he thought would play out over a 24-month period play out over only three or four months.
According to this manager, turnover in the small cap space has generally been higher due to changing composition of small cap indices. In the style indices, for example, turnover has been about 30%, even with changes Russell has initiated to reduce turnover in benchmarks. In the last two years, the upper end of market caps in the Russell indices has dropped quite a bit. In order to stay in line with the benchmark, the manager has had to readjust the portfolio in response.
The manager feels that managing turnover, and thereby transaction costs, is important, especially for small cap investors. Transaction costs have come down in the past decade, but “slippage” has increased. Therefore, investors are able to transact a small number of shares at a price close to what they enter into the market, with more people following along or copying those trades, which tends to increase transaction costs. The manager believes that if turnover is over 100%, the strategy could be sacrificing as much as 5% in performance in terms of slippage in a year.
Client interest in turnover:Clients are interested in turnover because it demon-strates how closely the manager is sticking to its stated process. The manager makes an effort to explain to clients why turnover is higher than expected when this divergence occurs. Tax-sensitive clients seem to be more interested in turnover than other clients.
When performance is waning and turnover is gaining, it can signal to clients that the manager is not adding value with its trades and increasing transaction costs.
Incentive systems:The firm has a merit-based bonus system. It tracks analysts in their recommendations, but does not quantify the outcomes of recommendations. This is because it doesn’t want to encourage risk-averse behavior. Therefore, the merit-based bonus is based mostly on qualitative observations. Bonuses are calculated based on the calendar year.
Clients are reportedly mostly flat-fee-based. Performance-based fees are rare. Clients don’t often bring up these agreements, but such an agreement would be attractive to this manager.
Additional views from the portfolio manager: It seems to the portfolio manager that there is a lot more trading in and out of positions in the market now than there used to be. The manager cited a Bank of America/Merrill Lynch Small Cap Monthly Chart Book from October 2009 as showing that the last 6 – 12 months has had more volatile days in the Russell 2000 than it ever has had historically. The manager has also seen five consecutive quarters of negative attribu-tion associated with relative price strength. This shows that the market has been rotating significantly.
Perhaps hedge funds have contributed to the market moving toward a short-term horizon in this manner. The portfolio manager ultimately believes that the short-term focus makes the market less efficient over a three-year horizon and longer, and therefore creates opportunities for his team to outperform in the long run.
Do you think the average market holding period affects how corporations create long-term value?
According to the manager, some corporations have reacted negatively to the market’s short-term focus. For example, in the small cap space, a number of corporations have refused to give quarterly guidance. In contrast, some corporations that are reliant on short-term order flow, such as semiconductor corporations, refuse to give annual guidance and only give quarterly guidance, since they cannot see more than 90 days out. The manager went on to say that some corporations certainly focus on meet-ing quarterly numbers, and perhaps use “cookie jar accounting” to meet their guidance numbers.
What would need to change for the market to become more long-term-oriented?
Increasing transaction costs would certainly eat into profits from short-term trades and dissuade this kind of behavior.
The portfolio manager believes that a lower-volatility market will allow investors to take a longer-term view and, as a result, corporations will be able to take a longer-term focus.
27
Portfolio turnover:According to this manager, there is a good deal of volatility associated with emerging themes, since they tend to represent growth. In cases such as sharp reactions to negative quarterly earnings, the portfolio manager feels that her team can take advantage of this overly short-term focus by adding to positions they are confident about. In the reverse case, when they believe that the market is bringing a theme to its conclusion too soon, they will trim the portfolio’s position. This has occurred often in the recent past, explaining why turnover exceeded the desired range.
The strategy is not momentum-driven and the team’s level of conviction in its holdings is very high. When companies release news, the manager believes that it is very easy for team members to put the new information in context. For these reasons, the manager feels that they can withstand short-term drops in prices when fundamentals remain unchanged. In other cases, momentum investors drive prices of stocks up even after company fundamentals have started to deteriorate. At this point, the manager feels at risk of “jumping off too soon.” In this case, the quantitative research team helps the manager time the exit carefully in order to take advantage of the momentum-based price movement.
Overall, the manager believes that volatility in the market gives her tactical opportunities, which she uses to her advantage.
Client interest in turnover:The manager reports turnover to clients quarterly. The manager does not believe that clients place a priority on obtaining turnover data.
Incentive systems:Employee bonuses are not based on a one-year performance average at the strategy level but are largely driven by firm-wide performance over the year, which they believe encourages a collaborative culture of sharing information between teams.
The manager feels it is very important to educate clients about the investment process and to manage expec-tations for short-term performance in bear markets. Therefore, the team constantly tries to focus client attention on the five-year outperformance record.
Additional views from the portfolio manager: Do you think the average market holding period affects how corporations create long-term value?
In a typical market day, within an orderly market, there is a buyer for every seller. To this end, turnover washes out. In a disorderly market, driven by panic, high turnover can have a negative impact on corporations’ shareholder value.
Case study 3: US thematic equity
Region United States
Style Neutral
AUM Approximately US$4.5 billion
Inception 1981
Client base Institutional
Process Top-down and bottom-up research, with a focus on sector and industry-group trends
The portfolio consists of stocks from five to eight sector or industry-group themes, which tend to play out over 3 to 5 years, or in some cases longer
Actual annual turnover 143%17
Expected annual turnover 60% – 80%
17 Perhaps based on differences in calculation methodology, the portfolio manager reports 99.6% average turnover over the past three years. Our calculations are based on information in GIMD.
28
Portfolio turnover:The team calculates turnover monthly and publishes data quarterly. The team does not manage turnover, however, and it doesn’t have a target range. It feels that the turnover figure is determined by how often the team is generating new ideas or how rapidly the market is moving. For the latter reason, turnover has been particularly high in the past year or so.
According to the manager, spikes in a strategy’s turn-over figure can signal a deviation from the investment process. If bad performance follows the spike in turn-over, then it is possible that the portfolio manager panicked and traded excessively in order to get out of a bad situation. Essentially, the turnover figure reflects how many decisions are being made. If the turnover figure is high and performance is poor, the portfolio manager has made several poor decisions that are just then coming to light.
Client interest in turnover:The manager believes that clients and consultants are interested in turnover for two reasons. First, as mentioned above, high turnover and bad performance can be a powerful indicator of internal problems. The turnover number is an indicator of process – it lets investors know the team is doing what it set out to do, or following its stated process. Rigor of investment process is important for clients – it makes them feel comfortable that good performance is repeatable.
Incentive systems:The team is rewarded with equity in company stock, which the manager believes brings employees together and encourages a collegiate approach. The team is also awarded bonuses based on their strategy’s perfor-mance in the past 12 months. Additionally, employees are encouraged to grow the business via a revenue-sharing agreement; each strategy team gets a share of the revenue they bring in.
The firm is currently considering basing the perfor-mance-based bonus on a longer-term track record.
The discussion is centered on better aligning portfolio managers with client interests. According to the manager, clients usually look at the three-year performance number in addition to the one-year number, and so it makes sense to reward portfolio managers for outperformance over that time horizon.
The manager noted that clients’ pay performance-based fees as well as flat fees. For the company, it is important to make sure that fixed costs are completely covered by base fees. Therefore, the firm doesn’t actively push performance-based fees to clients; instead it waits for clients to show interest. The firm is quite happy to take on these agreements; however, it just has to be careful about how much of its revenue comes from these agreements. According to the manager, Scandinavians seem to be particularly interested in performance-based fees.
Additional views from the portfolio manager: The portfolio manager observed that pension trustees can seem concerned about the long-term performance of their funds in one room and then seem overly concerned about the short-term performance in the next office over.
Do you think the average market holding period affects how corporations create long-term value?The manager explained that recently, as fear gripped the markets, a massive destocking occurred. In this case, the corporate sector did in fact react to the financial markets. However, in a more normal market environment, the portfolio manager believes that corporate management attempts to manage to its best ability and then educate investors and encourage additional investment.
What would need to change for the market to become more long-term-oriented?“Long-termism is not capitalism.” Some investors are focused on the long term, some investors are interested in the short term, and others fall anywhere in between. That aspect of the market will never change.
Case study 4: Pan-European equity
Region Europe including the United Kingdom
Style Varies
AUM Seed capital of €1 million, based on a similar strategy with €300 million
Inception 2003
Client base Institutional
Process Identifies change as the central dynamic behind stock price movement
Combination of top-down and bottom-up research, which focuses on four factors: quality, value, growth and change
Actual annual turnover 138%18
Expected annual turnover N/A. The portfolio manager believes that turnover is a residual of the investment process.
29
Portfolio turnover:The portfolio manager tends to optimize the portfolio every two weeks and at each point targets a certain amount of turnover. The manager tries to keep turnover at 80% per year, but he will adjust his target upward, based on the available opportunities for alpha. If turn-over gets in excess of 100%, the manager will try to cut back. The current period has been characterized by market dislocation and macroeconomic changes, so changes in sector allocation, for example, have contributed to higher turnover than usual.
The firm releases quarterly reports on trading costs and turnover.
Client interest in turnover:According to this manager, an investor cannot have a 10-year investment horizon and have the strategy fail for three years because the client will fire him. On the other hand, a client will not fire a manager over six months of bad turnover.
Incentive systems:The firm has clients with performance-based fees on the retail side, but not on the institutional side. The performance-based fees are rather new.
The portfolio manager bonus system is focused on the portfolio manager’s rolling three-year Lipper quartile ranking. The three-year focus is hard and fast. Short-term or longer-term performance is not considered. Analysts are shared among all the fund managers, and they have a different set of metrics. The portfolio manager is solely responsible and accountable for a portfolio’s performance.
Additional views from the portfolio manager: According to the manager, hedge funds, combined with declining transaction costs, have caused market-wide turnover to increase over time. Institutional investors tend to look at process and longer-term performance. Retail investors tend to look at short-term performance and move in and out of funds at the tails of outperformance or underperformance.
Do you think the average market holding period affects how corporations create long-term value? The manager noted that in general, the horizon of managers of publicly listed companies can be cut short by the market’s focus on short-term performance. Company managers are focused on share prices, even though they might not like it.
What would need to change for the market to become more long-term-oriented?The manager believes that longer lockups on client assets, more focus on tax-adjusted performance, increased transaction costs or the shrinking of the hedge fund market via tightening regulation are all options for lengthening the market’s time horizon.
The manager also noted that to really determine how a process works, clients need to examine performance over at least a full business cycle – 10 years may be a good goal for long-term investing.
Case study 5: Global core equity
Region International
Style Varies
AUM US$2.4 billion
Inception 1994
Client base Institutional and retail
Process Bottom-up research, combination of quantitative and fundamental analysis
Actual annual turnover 194%18
Expected annual turnover 80% – 90%
18 Perhaps based on differences in calculation methodology, the portfolio manager reports 90% average turnover over the past three years. Our calculations are based on information in GIMD.
30
Case study 6: US small cap growth
Region United States
Style Growth
AUM US$2.2 billion
Inception 1985
Client base Institutional and endowment
Process Emphasis on fundamental, bottom-up research and valuation in order to find companies poised for growth at reasonable prices
Stated objective is investing for the long-term, target 3- to 4-year horizon
Actual annual turnover 30%
Expected annual turnover 25% – 35%
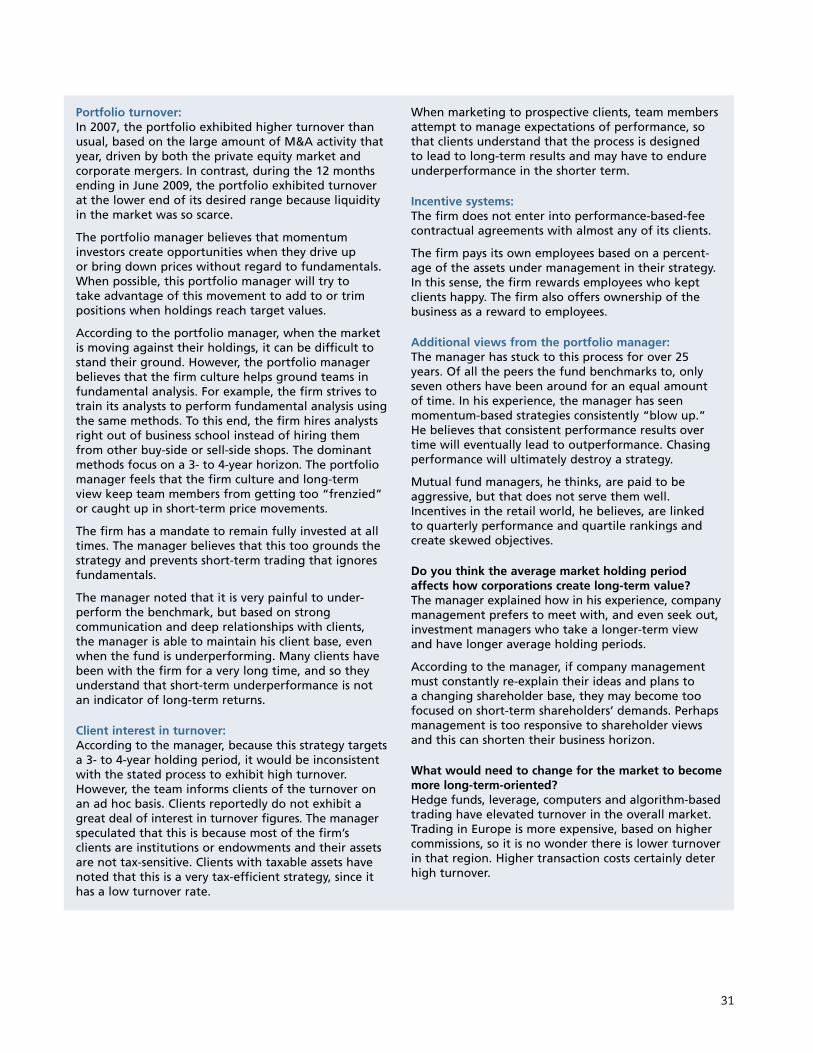
31
Portfolio turnover:In 2007, the portfolio exhibited higher turnover than usual, based on the large amount of M&A activity that year, driven by both the private equity market and corporate mergers. In contrast, during the 12 months ending in June 2009, the portfolio exhibited turnover at the lower end of its desired range because liquidity in the market was so scarce.
The portfolio manager believes that momentum investors create opportunities when they drive up or bring down prices without regard to fundamentals. When possible, this portfolio manager will try to take advantage of this movement to add to or trim positions when holdings reach target values.
According to the portfolio manager, when the market is moving against their holdings, it can be difficult to stand their ground. However, the portfolio manager believes that the firm culture helps ground teams in fundamental analysis. For example, the firm strives to train its analysts to perform fundamental analysis using the same methods. To this end, the firm hires analysts right out of business school instead of hiring them from other buy-side or sell-side shops. The dominant methods focus on a 3- to 4-year horizon. The portfolio manager feels that the firm culture and long-term view keep team members from getting too “frenzied” or caught up in short-term price movements.
The firm has a mandate to remain fully invested at all times. The manager believes that this too grounds the strategy and prevents short-term trading that ignores fundamentals.
The manager noted that it is very painful to under-perform the benchmark, but based on strong communication and deep relationships with clients, the manager is able to maintain his client base, even when the fund is underperforming. Many clients have been with the firm for a very long time, and so they understand that short-term underperformance is not an indicator of long-term returns.
Client interest in turnover:According to the manager, because this strategy targets a 3- to 4-year holding period, it would be inconsistent with the stated process to exhibit high turnover. However, the team informs clients of the turnover on an ad hoc basis. Clients reportedly do not exhibit a great deal of interest in turnover figures. The manager speculated that this is because most of the firm’s clients are institutions or endowments and their assets are not tax-sensitive. Clients with taxable assets have noted that this is a very tax-efficient strategy, since it has a low turnover rate.
When marketing to prospective clients, team members attempt to manage expectations of performance, so that clients understand that the process is designed to lead to long-term results and may have to endure underperformance in the shorter term.
Incentive systems:The firm does not enter into performance-based-fee contractual agreements with almost any of its clients.
The firm pays its own employees based on a percent-age of the assets under management in their strategy. In this sense, the firm rewards employees who kept clients happy. The firm also offers ownership of the business as a reward to employees.
Additional views from the portfolio manager: The manager has stuck to this process for over 25 years. Of all the peers the fund benchmarks to, only seven others have been around for an equal amount of time. In his experience, the manager has seen momentum-based strategies consistently “blow up.” He believes that consistent performance results over time will eventually lead to outperformance. Chasing performance will ultimately destroy a strategy.
Mutual fund managers, he thinks, are paid to be aggressive, but that does not serve them well. Incentives in the retail world, he believes, are linked to quarterly performance and quartile rankings and create skewed objectives.
Do you think the average market holding period affects how corporations create long-term value? The manager explained how in his experience, company management prefers to meet with, and even seek out, investment managers who take a longer-term view and have longer average holding periods.
According to the manager, if company management must constantly re-explain their ideas and plans to a changing shareholder base, they may become too focused on short-term shareholders’ demands. Perhaps management is too responsive to shareholder views and this can shorten their business horizon.
What would need to change for the market to become more long-term-oriented?Hedge funds, leverage, computers and algorithm-based trading have elevated turnover in the overall market. Trading in Europe is more expensive, based on higher commissions, so it is no wonder there is lower turnover in that region. Higher transaction costs certainly deter high turnover.
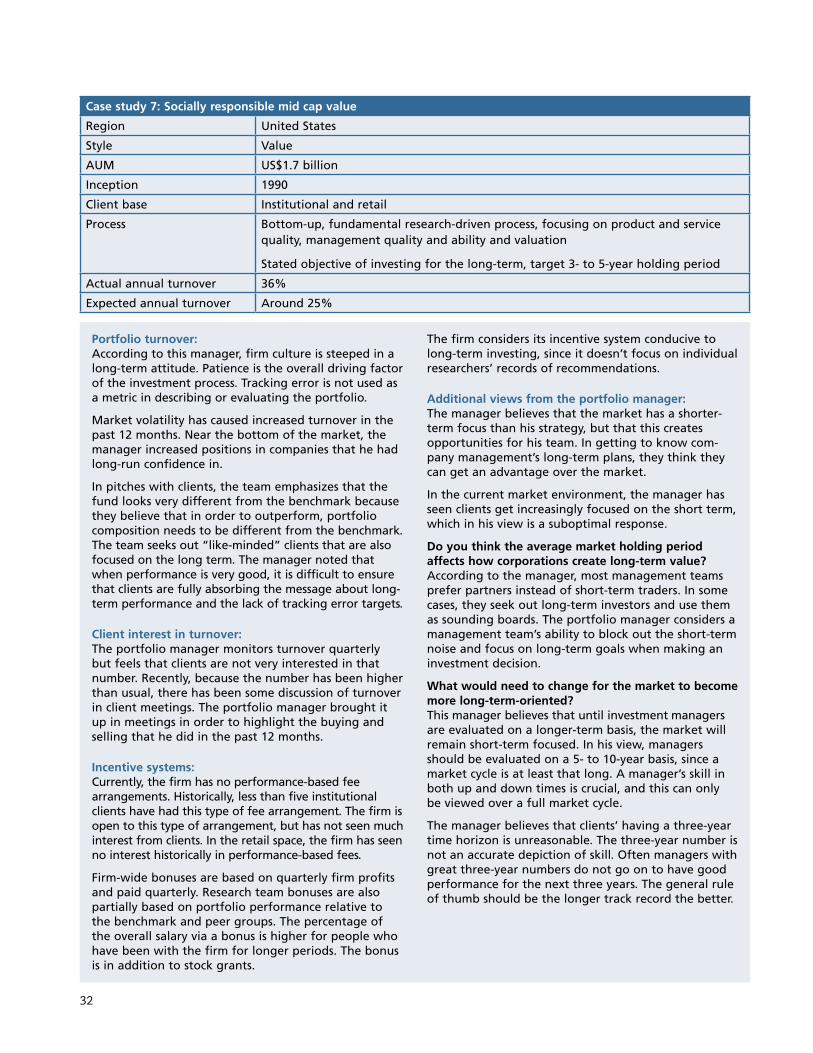
32
Portfolio turnover: According to this manager, firm culture is steeped in a long-term attitude. Patience is the overall driving factor of the investment process. Tracking error is not used as a metric in describing or evaluating the portfolio.
Market volatility has caused increased turnover in the past 12 months. Near the bottom of the market, the manager increased positions in companies that he had long-run confidence in.
In pitches with clients, the team emphasizes that the fund looks very different from the benchmark because they believe that in order to outperform, portfolio composition needs to be different from the benchmark. The team seeks out “like-minded” clients that are also focused on the long term. The manager noted that when performance is very good, it is difficult to ensure that clients are fully absorbing the message about long-term performance and the lack of tracking error targets.
Client interest in turnover:The portfolio manager monitors turnover quarterly but feels that clients are not very interested in that number. Recently, because the number has been higher than usual, there has been some discussion of turnover in client meetings. The portfolio manager brought it up in meetings in order to highlight the buying and selling that he did in the past 12 months.
Incentive systems:Currently, the firm has no performance-based fee arrange ments. Historically, less than five institutional clients have had this type of fee arrangement. The firm is open to this type of arrangement, but has not seen much interest from clients. In the retail space, the firm has seen no interest historically in performance-based fees.
Firm-wide bonuses are based on quarterly firm profits and paid quarterly. Research team bonuses are also partially based on portfolio performance relative to the benchmark and peer groups. The percentage of the overall salary via a bonus is higher for people who have been with the firm for longer periods. The bonus is in addition to stock grants.
The firm considers its incentive system conducive to long-term investing, since it doesn’t focus on individual researchers’ records of recommendations.
Additional views from the portfolio manager: The manager believes that the market has a shorter-term focus than his strategy, but that this creates opportunities for his team. In getting to know com-pany management’s long-term plans, they think they can get an advantage over the market.
In the current market environment, the manager has seen clients get increasingly focused on the short term, which in his view is a suboptimal response.
Do you think the average market holding period affects how corporations create long-term value? According to the manager, most management teams prefer partners instead of short-term traders. In some cases, they seek out long-term investors and use them as sounding boards. The portfolio manager considers a management team’s ability to block out the short-term noise and focus on long-term goals when making an investment decision.
What would need to change for the market to become more long-term-oriented?This manager believes that until investment managers are evaluated on a longer-term basis, the market will remain short-term focused. In his view, managers should be evaluated on a 5- to 10-year basis, since a market cycle is at least that long. A manager’s skill in both up and down times is crucial, and this can only be viewed over a full market cycle.
The manager believes that clients’ having a three-year time horizon is unreasonable. The three-year number is not an accurate depiction of skill. Often managers with great three-year numbers do not go on to have good performance for the next three years. The general rule of thumb should be the longer track record the better.
Case study 7: Socially responsible mid cap value
Region United States
Style Value
AUM US$1.7 billion
Inception 1990
Client base Institutional and retail
Process Bottom-up, fundamental research-driven process, focusing on product and service quality, management quality and ability and valuation
Stated objective of investing for the long-term, target 3- to 5-year holding period
Actual annual turnover 36%
Expected annual turnover Around 25%

33
Case study 8: EAFE plus socially responsible equity
Region International
Style Value
AUM US$1 billion
Inception 1996
Client base Institutional
Process Bottom-up research, top-down factors acting as secondary consideration in portfolio construction
Diversification, rather than formal controls guide geographical and sector weights
Utilizes same process as unconstrained portfolios
Stated objective is investing for the long term
Actual annual turnover 40%
Expected annual turnover 30% – 50%
34
Portfolio turnover: According to the portfolio manager and for the firm overall, turnover ties in closely with the stated invest-ment process, which is based on fundamentals and focuses on a long-term horizon. Monitoring turnover in this sense means monitoring the discipline with which the team is applying its process. In the past twelve months or so, turnover has been higher than usual because of an above average amount of attrac-tive investment opportunities; these have occurred as a result of falling market prices. Another factor that causes turnover to stray out of the desired range is M&A activity. There was a jump in M&A activity 2 – 3 years ago. Also, as companies change and develop over time, they may become eligible investments from the Socially Responsible Investment perspective. The manager noted that this would only apply to about one or two names a year.
Client interest in turnover:The portfolio manager believes that clients are inter-ested in portfolio turnover, insofar as it reflects the investment process and acts as a check on trading costs. The manager stressed that every time the fund management team trades, it costs their clients money.
Managing expectations about short-term performance:In prospect pitches and client meetings, the manager feels it is important to stress that the firm is a long-term investment manager and steer onlookers to the 3- and 5-year performance numbers. They also tell clients that as an investor, the fund manager is a part-owner of a business, and it may take a longer period to reap profits from a business, even if it has bright prospects. Overall, it is very important to “manage client expectations” of short-term performance. The acceptable range of tracking error is 3% – 9%, which allows the manager flexibility with regards to the benchmark. The manager believes that clients need to keep this in mind when evaluating this strategy compared to a benchmark.
Incentive systems:The manager does not have many clients with performance-based fee arrangements, but those that exist evaluate on a rolling 3-year basis. The
firm has a global fee committee, which assists as an independent body in negotiating client specific fees. According to the manager, setting up performance-based fees can be quite complicated to negotiate, based on the lack of industry standards.
Within the firm, bonus pools for research teams are established based on overall performance relative to peer group over the last 12 months. They are divvied up based on the quality of company visit notes, since they are at the core of the firm’s process. For broader teams including the portfolio managers, bonus pools are determined the same way and are divvied up based on contributions to the overall team and firm, or the caliber of the commentary that team members are contributing in team meetings. The overall corporate culture promotes a team mentality and encourages critical thinking.
Additional views from the portfolio manager: Do you think the average market holding period affects how corporations create long-term value? The portfolio manager feels that the market’s reaction to short-term events must be extremely frustrating for company management, which is attempting to run its business in the best way it can for the long term. The interest in short-term performance, however, shouldn’t dissuade the most talented management teams from pursuing long-term goals.
What would need to change for the market to become more long-term-oriented?According to the manager, managing expectations is the key. Investment managers need to manage client expectations. Companies need to manage investor expectations. Equities are not meant to have large returns over short periods of time. Buying a share of a company represents buying a share in the business. If an investor doesn’t think of equities that way, then he or she is simply acting as a gambler and “betting on a horse.” Education about what equities are supposed to represent needs to start at the corporate level and trickle all the way down the system.

35
ReferencesOvercoming Short-termism: A Call for a More Responsible Approach to Investment and Business Management. Aspen Institute Business and Society Program, 2009.
Atherton, A., Lewis, J. and Plant, R. Causes of Short-termism in the Finance Sector. Institute for Sustainable Futures. University of Technology, Sydney, 2007.
Black, A. and Fraser, P. “Stock Market Short-termism – An International Perspective,” Journal of Multinational Financial Management, 12, 135 – 158, 2002.
“Breaking the Short-term Cycle”, CFA Centre for Financial Market Integrity and the Business Roundtable Institute for Corporate Ethics, 2006.
Demirag, I. “Boards of directors short-term perceptions and evidence of managerial short-termism in the UK,” European Journal of Finance, 4, 195 – 211, 1998.
Demirag, I. “Assessing Short-term Perceptions of Group Finance Directors of UK Companies,” British Accounting Review, 27, 247 – 281, 1995.
Gumbel, A. Myopic Traders, Efficiency and Taxation. University of Oxford, Said Business School working paper, 2000.
A Guidance Note for Long-term Investing. The Marathon Club, 2007 http://www.marathonclub.co.uk/Docs/MarathonClubFINALDOC.pdf
Marston, C.L., and Craven, B.M. “A Survey of Corporate Perceptions of Short-termism among Analysts and Fund Managers,” The European Journal of Finance, 4, 233 – 56, 1998.
Samad, Y. Active Equity and Bond Management: Do Managers Really Earn the Fees They Charge? Seeking Alignment with Manager, The Marathon Club working paper, 2009.
Waitzer, E. “Defeating Short-termism: Why Pension Funds Must Lead,” Rotman International Journal of Pension Management, 2.2, 4 – 8, 2009.
Appendix C

Important noticesThis contains confidential and proprietary informa-tion of Mercer and is intended for the exclusive use of the parties to whom it was provided by Mercer. Its content may not be modified, sold or otherwise provided, in whole or in part, to any other person or entity, without Mercer’s written permission.
The findings, ratings and/or opinions expressed herein are the intellectual property of Mercer and are subject to change without notice. They are not intended to convey any guarantees as to the future performance of the investment products, asset classes or capital markets discussed. Past performance does not guaran-tee future results.
This does not contain investment advice relating to your particular circumstances. No investment decision should be made based on this information without first obtaining appropriate professional advice and considering your circumstances.
Information contained herein has been obtained from a range of third party sources. While the information is believed to be reliable, Mercer has not sought to verify it. As such, Mercer makes no representations or warranties as to the accuracy of the information pre-sented and takes no responsibility or liability (includ-ing for indirect, consequential or incidental damages), for any error, omission or inaccuracy in the data sup-plied by any third party.
This does not constitute an offer or a solicitation of an offer to buy or sell securities, commodities and/or any other financial instruments or products.

Argentina
Australia
Austria
Belgium
Brazil
Canada
Chile
China
Colombia
Czech Republic
Denmark
Finland
France
Germany
Hong Kong
Hungary
India
Indonesia
Ireland
Italy
Japan
Malaysia
Mexico
Netherlands
New Zealand
Norway
Philippines
Poland
Portugal
Singapore
South Korea
Spain
Sweden
Switzerland
Taiwan
Thailand
Turkey
United Arab Emirates
United Kingdom
United States
Venezuela
Copyright 2010 Mercer LLC. All rights reserved.
For further information, please contact us at:
Mercer1166 Avenue of the AmericasNew York, NY 10036+1 212 345 7000
www.mercer.com
IRRC Institute1 Chase Manhattan Plaza44th FloorNew York, NY 10005+1 646 778 4193
www.irrcinstitute.org
03001-IC