Embed Size (px)
Citation preview
© 2015 by Indonesian Investment Coordinating Board. All rights reserved
Jakarta, 22th April 2015 Indonesia Investment Coordinating Board - BKPM
invest in
INVESTMENT CLIMATE IN INDONESIA
IFN INDONESIA FORUM
The Investment Coordinating Board of the Republic of Indonesia 2
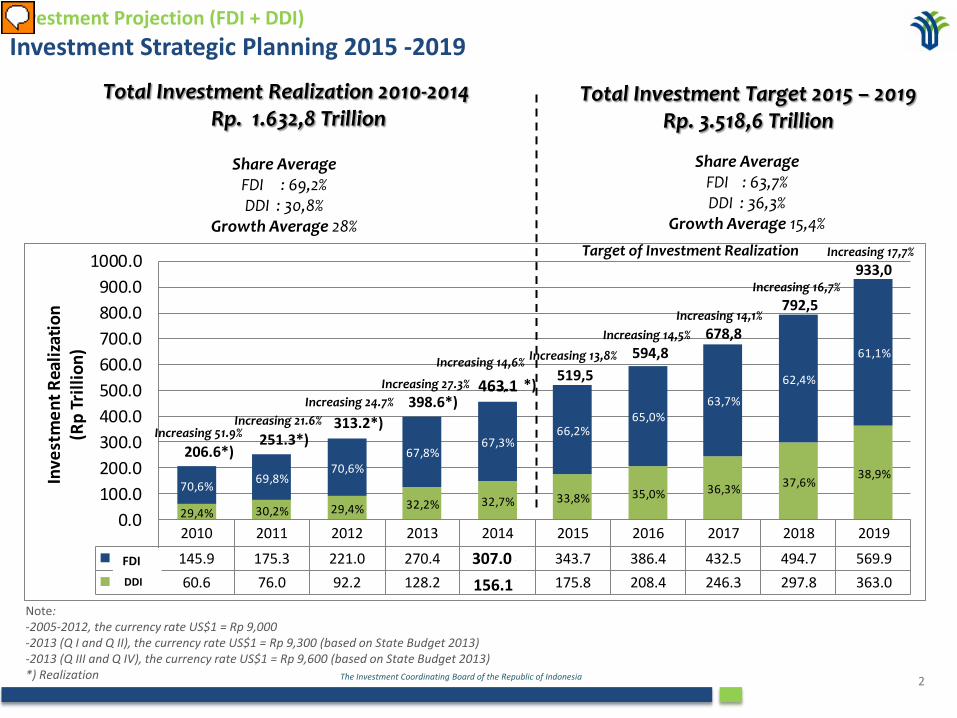
Investment Projection (FDI + DDI) Investment Strategic Planning 2015 -2019
2010 2011 2012 2013 2014 2015 2016 2017 2018 2019PMA 145.9 175.3 221.0 270.4 307.4 343.7 386.4 432.5 494.7 569.9PMDN 60.6 76.0 92.2 128.2 149.2 175.8 208.4 246.3 297.8 363.0
29,4% 30,2% 29,4% 32,2% 32,7% 33,8% 35,0% 36,3% 37,6%38,9%
70,6% 69,8%70,6%
67,8%67,3%
66,2%65,0%
63,7%
62,4%
61,1%
0.0100.0200.0300.0400.0500.0600.0700.0800.0900.0
1000.0
Inve
stm
ent R
ealiz
atio
n(R
p Tr
illio
n)
206.6*) 251.3*)
313.2*)
398.6*)
Increasing 24.7% Increasing 27.3%
Increasing 51.9% Increasing 21.6%
Share Average FDI : 69,2% DDI : 30,8%
Growth Average 28%
Share Average FDI : 63,7% DDI : 36,3%
Growth Average 15,4%
Total Investment Realization 2010-2014 Rp. 1.632,8 Trillion
Total Investment Target 2015 – 2019 Rp. 3.518,6 Trillion
Note: -2005-2012, the currency rate US$1 = Rp 9,000 -2013 (Q I and Q II), the currency rate US$1 = Rp 9,300 (based on State Budget 2013) -2013 (Q III and Q IV), the currency rate US$1 = Rp 9,600 (based on State Budget 2013) *) Realization
456,6**)
Increasing 14,6% 519,5
Increasing 13,8% 594,8 Increasing 14,5% 678,8
Increasing 14,1% 792,5
Increasing 16,7% 933,0
Increasing 17,7% Target of Investment Realization
FDI DDI 156.1
307.0
463.1
The Investment Coordinating Board of the Republic of Indonesia 3
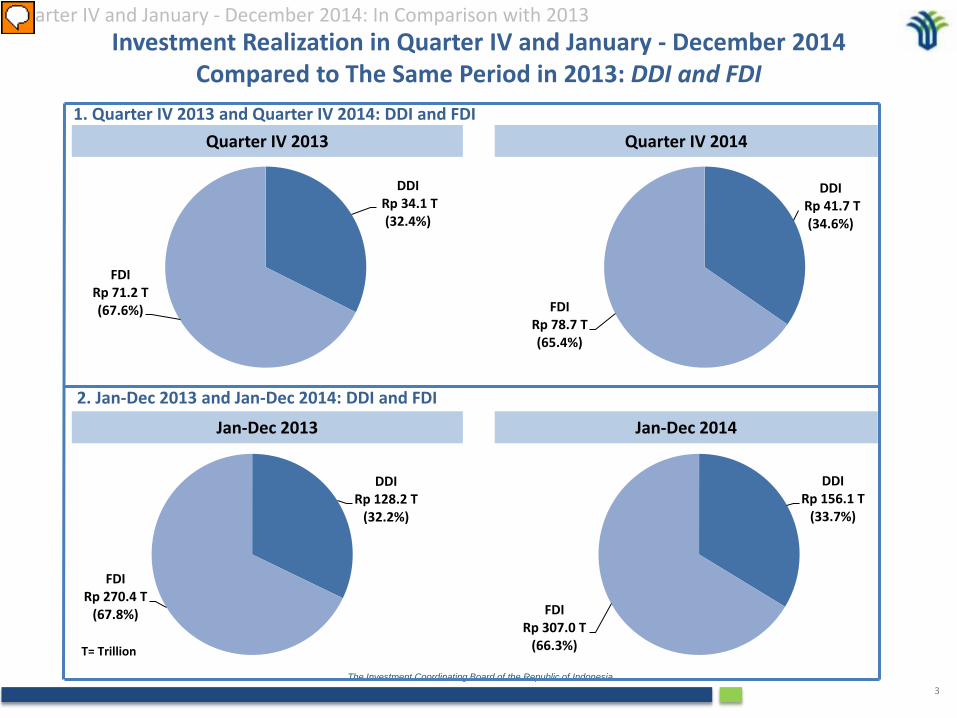
Investment Realization in Quarter IV and January - December 2014 Compared to The Same Period in 2013: DDI and FDI
Quarter IV 2013 Quarter IV 2014
Jan-Dec 2013 Jan-Dec 2014
Quarter IV and January - December 2014: In Comparison with 2013
1. Quarter IV 2013 and Quarter IV 2014: DDI and FDI
2. Jan-Dec 2013 and Jan-Dec 2014: DDI and FDI
T= Trillion
DDI Rp 41.7 T
(34.6%)
FDI Rp 78.7 T (65.4%)
DDI Rp 34.1 T
(32.4%)
FDI Rp 71.2 T (67.6%)
DDI Rp 128.2 T
(32.2%)
FDI Rp 270.4 T
(67.8%)
DDI Rp 156.1 T
(33.7%)
FDI Rp 307.0 T
(66.3%)
The Investment Coordinating Board of the Republic of Indonesia 4
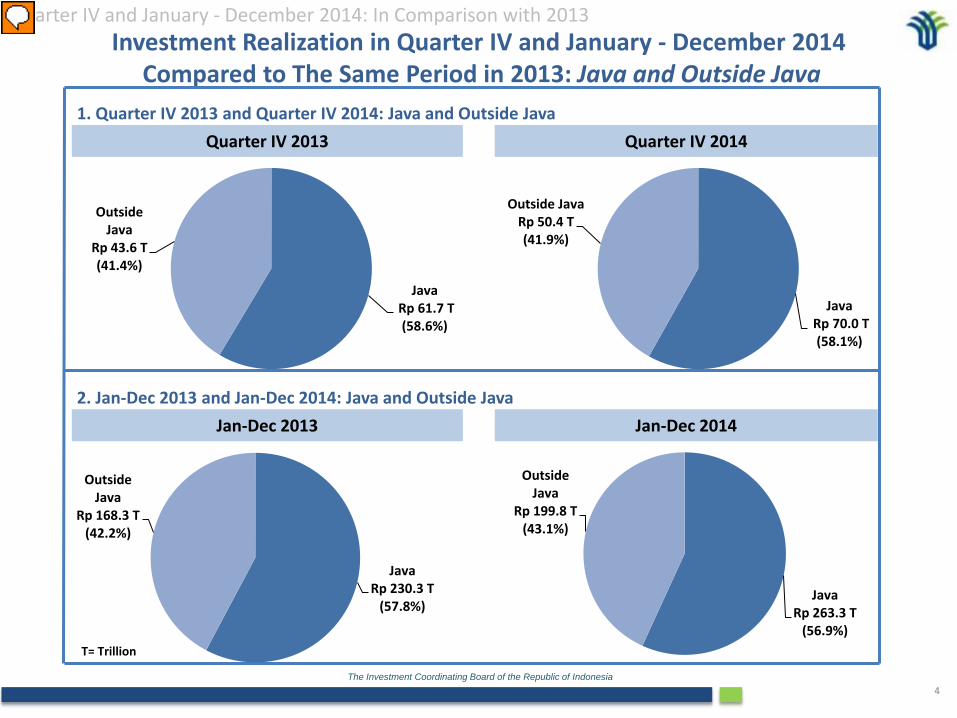
Investment Realization in Quarter IV and January - December 2014 Compared to The Same Period in 2013: Java and Outside Java
Quarter IV 2013 Quarter IV 2014
Jan-Dec 2013 Jan-Dec 2014
Quarter IV and January - December 2014: In Comparison with 2013
1. Quarter IV 2013 and Quarter IV 2014: Java and Outside Java
2. Jan-Dec 2013 and Jan-Dec 2014: Java and Outside Java
T= Trillion
Java Rp 61.7 T
(58.6%)
Outside Java
Rp 43.6 T (41.4%)
Java Rp 70.0 T
(58.1%)
Outside Java Rp 50.4 T (41.9%)
Java Rp 230.3 T
(57.8%)
Outside Java
Rp 168.3 T (42.2%)
Java Rp 263.3 T
(56.9%)
Outside Java
Rp 199.8 T (43.1%)
The Investment Coordinating Board of the Republic of Indonesia 5
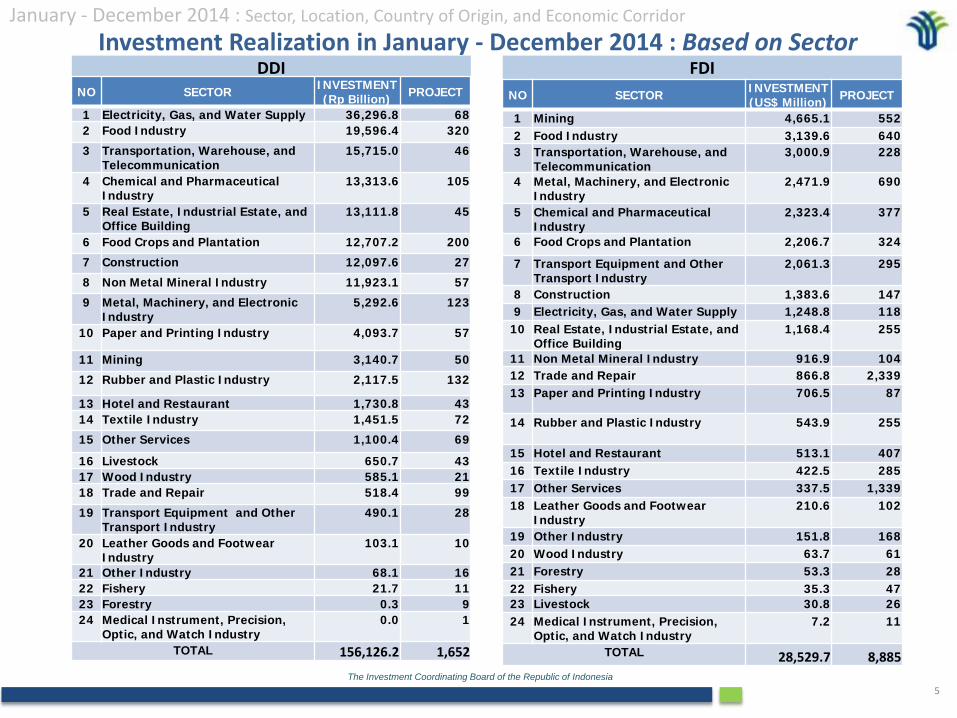
FDI DDI NO SECTOR INVESTMENT
(Rp Billion) PROJECT
1 Electricity, Gas, and Water Supply 36,296.8 68 2 Food Industry 19,596.4 320
3 Transportation, Warehouse, and Telecommunication
15,715.0 46
4 Chemical and Pharmaceutical Industry
13,313.6 105
5 Real Estate, Industrial Estate, and Office Building
13,111.8 45
6 Food Crops and Plantation 12,707.2 200
7 Construction 12,097.6 27
8 Non Metal Mineral Industry 11,923.1 57
9 Metal, Machinery, and Electronic Industry
5,292.6 123
10 Paper and Printing Industry 4,093.7 57
11 Mining 3,140.7 50
12 Rubber and Plastic Industry 2,117.5 132
13 Hotel and Restaurant 1,730.8 43 14 Textile Industry 1,451.5 72
15 Other Services 1,100.4 69
16 Livestock 650.7 43 17 Wood Industry 585.1 21 18 Trade and Repair 518.4 99
19 Transport Equipment and Other Transport Industry
490.1 28
20 Leather Goods and Footwear Industry
103.1 10
21 Other Industry 68.1 16 22 Fishery 21.7 11 23 Forestry 0.3 9 24 Medical Instrument, Precision,
Optic, and Watch Industry 0.0 1
TOTAL 156,126.2 1,652
Investment Realization in January - December 2014 : Based on Sector
NO SECTOR INVESTMENT (US$ Million) PROJECT
1 Mining 4,665.1 552 2 Food Industry 3,139.6 640 3 Transportation, Warehouse, and
Telecommunication 3,000.9 228
4 Metal, Machinery, and Electronic Industry
2,471.9 690
5 Chemical and Pharmaceutical Industry
2,323.4 377
6 Food Crops and Plantation 2,206.7 324
7 Transport Equipment and Other Transport Industry
2,061.3 295
8 Construction 1,383.6 147 9 Electricity, Gas, and Water Supply 1,248.8 118
10 Real Estate, Industrial Estate, and Office Building
1,168.4 255
11 Non Metal Mineral Industry 916.9 104 12 Trade and Repair 866.8 2,339 13 Paper and Printing Industry 706.5 87
14 Rubber and Plastic Industry 543.9 255
15 Hotel and Restaurant 513.1 407 16 Textile Industry 422.5 285 17 Other Services 337.5 1,339 18 Leather Goods and Footwear
Industry 210.6 102
19 Other Industry 151.8 168 20 Wood Industry 63.7 61 21 Forestry 53.3 28 22 Fishery 35.3 47 23 Livestock 30.8 26 24 Medical Instrument, Precision,
Optic, and Watch Industry 7.2 11
TOTAL 28,529.7 8,885
January - December 2014 : Sector, Location, Country of Origin, and Economic Corridor
The Investment Coordinating Board of the Republic of Indonesia 6
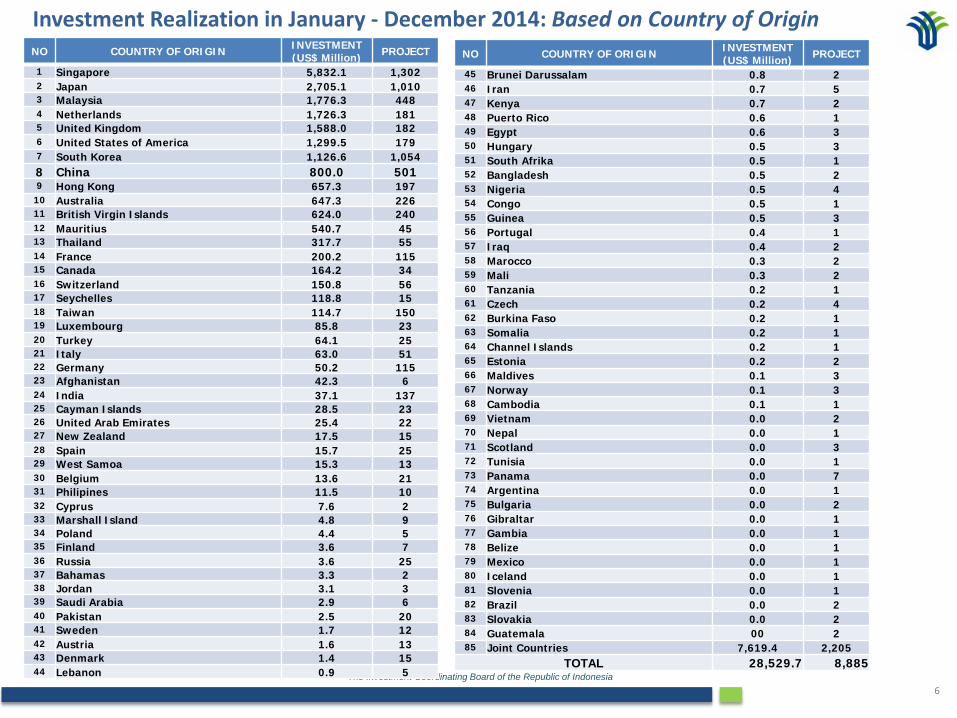
Investment Realization in January - December 2014: Based on Country of Origin NO COUNTRY OF ORIGIN INVESTMENT
(US$ Million) PROJECT
1 Singapore 5,832.1 1,302 2 Japan 2,705.1 1,010 3 Malaysia 1,776.3 448 4 Netherlands 1,726.3 181 5 United Kingdom 1,588.0 182 6 United States of America 1,299.5 179 7 South Korea 1,126.6 1,054 8 China 800.0 501 9 Hong Kong 657.3 197
10 Australia 647.3 226 11 British Virgin Islands 624.0 240 12 Mauritius 540.7 45 13 Thailand 317.7 55 14 France 200.2 115 15 Canada 164.2 34 16 Switzerland 150.8 56 17 Seychelles 118.8 15 18 Taiwan 114.7 150 19 Luxembourg 85.8 23 20 Turkey 64.1 25 21 Italy 63.0 51 22 Germany 50.2 115 23 Afghanistan 42.3 6 24 India 37.1 137 25 Cayman Islands 28.5 23 26 United Arab Emirates 25.4 22 27 New Zealand 17.5 15 28 Spain 15.7 25 29 West Samoa 15.3 13 30 Belgium 13.6 21 31 Philipines 11.5 10 32 Cyprus 7.6 2 33 Marshall Island 4.8 9 34 Poland 4.4 5 35 Finland 3.6 7 36 Russia 3.6 25 37 Bahamas 3.3 2 38 Jordan 3.1 3 39 Saudi Arabia 2.9 6 40 Pakistan 2.5 20 41 Sweden 1.7 12 42 Austria 1.6 13 43 Denmark 1.4 15 44 Lebanon 0.9 5
NO COUNTRY OF ORIGIN INVESTMENT (US$ Million) PROJECT
45 Brunei Darussalam 0.8 2 46 Iran 0.7 5 47 Kenya 0.7 2 48 Puerto Rico 0.6 1 49 Egypt 0.6 3 50 Hungary 0.5 3 51 South Afrika 0.5 1 52 Bangladesh 0.5 2 53 Nigeria 0.5 4 54 Congo 0.5 1 55 Guinea 0.5 3 56 Portugal 0.4 1 57 Iraq 0.4 2 58 Marocco 0.3 2 59 Mali 0.3 2 60 Tanzania 0.2 1 61 Czech 0.2 4 62 Burkina Faso 0.2 1 63 Somalia 0.2 1 64 Channel Islands 0.2 1 65 Estonia 0.2 2 66 Maldives 0.1 3 67 Norway 0.1 3 68 Cambodia 0.1 1 69 Vietnam 0.0 2 70 Nepal 0.0 1 71 Scotland 0.0 3 72 Tunisia 0.0 1 73 Panama 0.0 7 74 Argentina 0.0 1 75 Bulgaria 0.0 2 76 Gibraltar 0.0 1 77 Gambia 0.0 1 78 Belize 0.0 1 79 Mexico 0.0 1 80 Iceland 0.0 1 81 Slovenia 0.0 1 82 Brazil 0.0 2 83 Slovakia 0.0 2 84 Guatemala 00 2 85 Joint Countries 7,619.4 2,205
TOTAL 28,529.7 8,885
The Investment Coordinating Board of the Republic of Indonesia 7
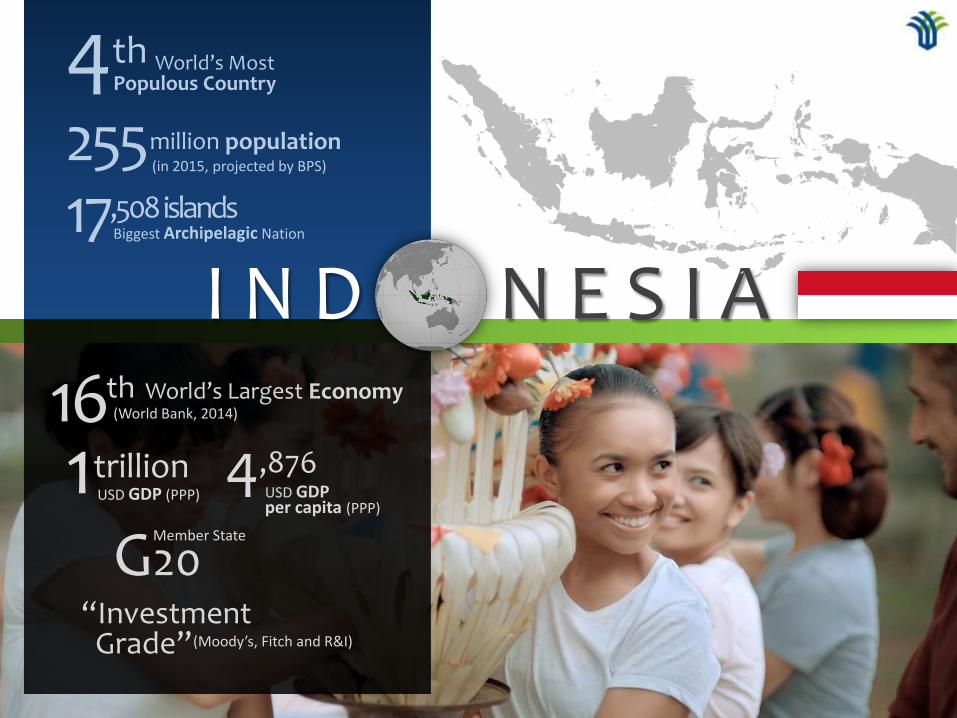
World’s Most Populous Country 4th
255 million population (in 2015, projected by BPS)
17,508 islands Biggest Archipelagic Nation
16th World’s Largest Economy
G20 Member State
1trillion USD GDP (PPP) 4,876
USD GDP per capita (PPP)
“Investment Grade” (Moody’s, Fitch and R&I)
I N D N E S I A (World Bank, 2014)
The Investment Coordinating Board of the Republic of Indonesia 8
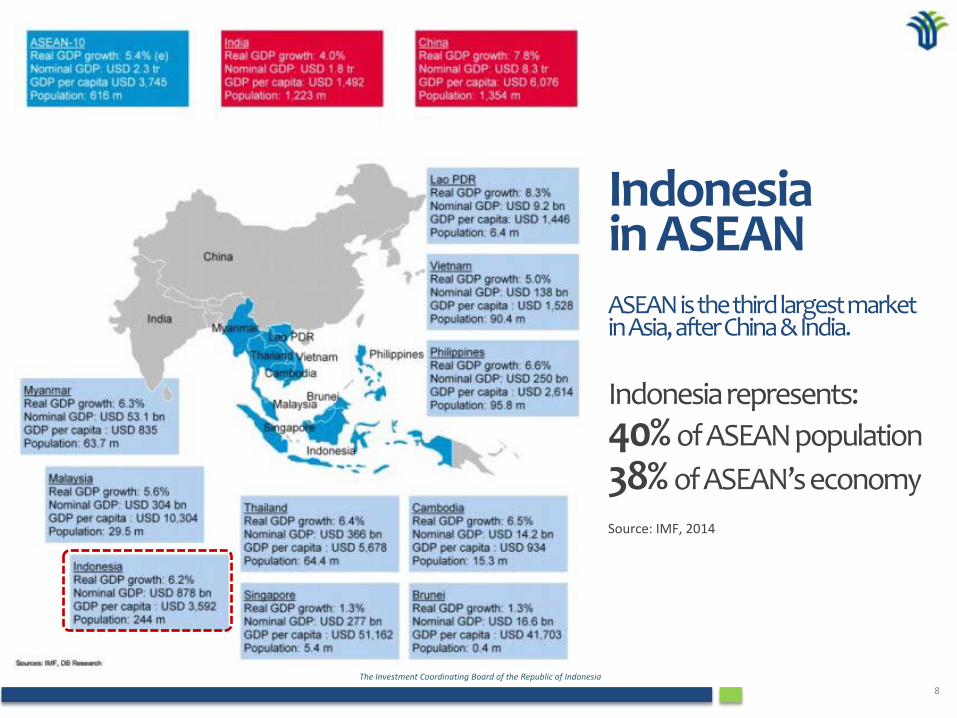
Indonesia in ASEAN ASEAN is the third largest market in Asia, after China & India. Indonesia represents: 40% of ASEAN population 38% of ASEAN’s economy Source: IMF, 2014
The Investment Coordinating Board of the Republic of Indonesia 9
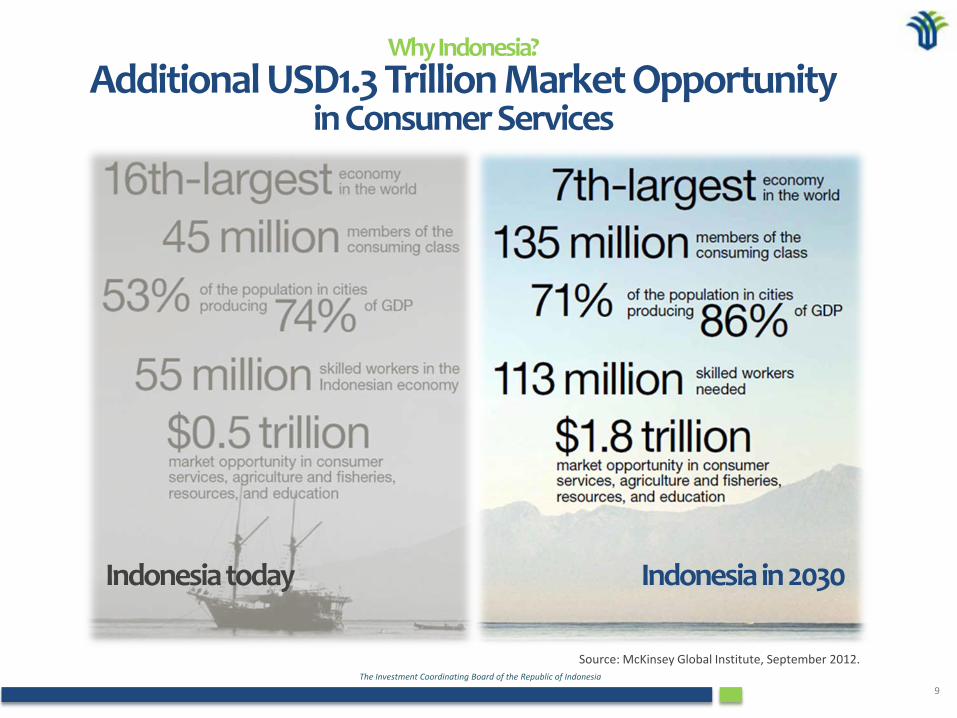
Source: McKinsey Global Institute, September 2012.
Why Indonesia? Additional USD1.3 Trillion Market Opportunity
in Consumer Services
Indonesia today Indonesia in 2030
The Investment Coordinating Board of the Republic of Indonesia 10
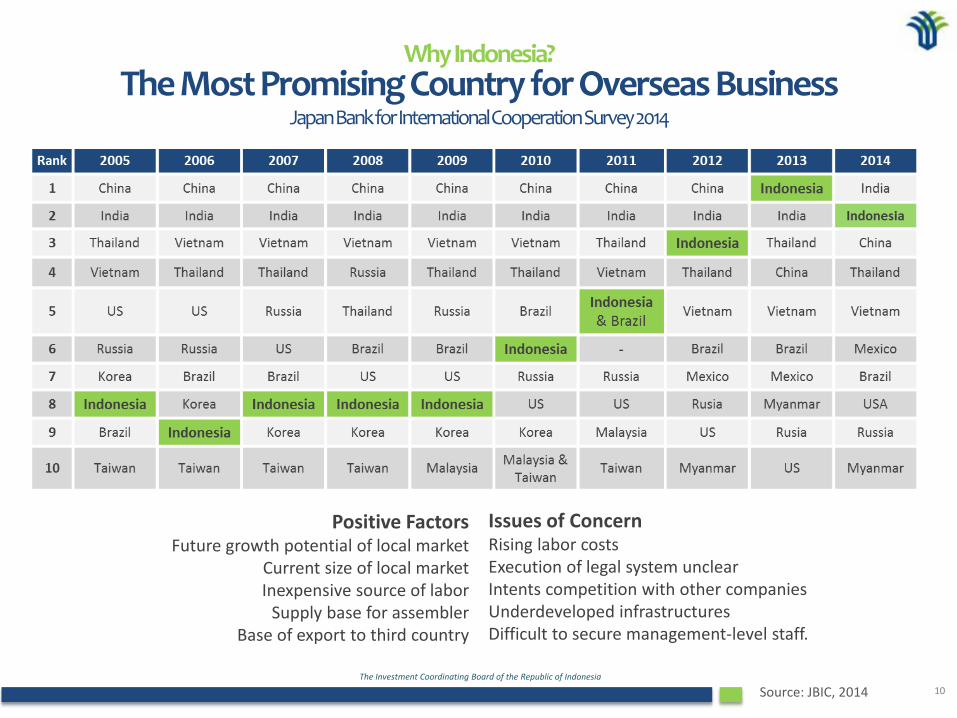
Why Indonesia? The Most Promising Country for Overseas Business
Japan Bank for International Cooperation Survey 2014
Source: JBIC, 2014
Positive Factors Future growth potential of local market
Current size of local market Inexpensive source of labor
Supply base for assembler Base of export to third country
Issues of Concern Rising labor costs Execution of legal system unclear Intents competition with other companies Underdeveloped infrastructures Difficult to secure management-level staff.

The Investment Coordinating Board of the Republic of Indonesia 11 Source: BKPM, 2015.
Rank Country 2010 2011 2012 2013 2014 Total
1 Singapore 5,565 5,123 4,856 4,671 5,832 26,047
2 Japan 713 1,516 2,457 4,713 2,705 12,104 3 United States 931 1,488 1,238 2,436 1,299 7,392
4 South Korea 329 1,219 1,950 2,205 1,127 6,829
5 Netherlands 608 1,354 967 928 1,726 5,583
6 British Virgin Islands 1,616 517 856 786 624 4,399
7 United Kingdom 276 419 934 1,076 1,588 4,293
8 Malaysia 472 618 530 711 1,776 4,108
9 Mauritius 23 73 1,059 780 541 2,475
10 Hong Kong, PRC 566 135 310 376 657 2,044
Total (Top-10 Countries) 11,099 12,462 15,156 18,682 17,876 75,275
12 China 174 128 141 297 800 1,540
14 Taiwan 47 243 647 403 115 1,455
Total (90 Countries) 16,215 19,475 24,565 28,616 28,530 117,400
Investment Performance Total FDI Realization by Country Based on Capex (USD million) in 2010-2014, not including financial, oil & gas sectors
The Investment Coordinating Board of the Republic of Indonesia 12
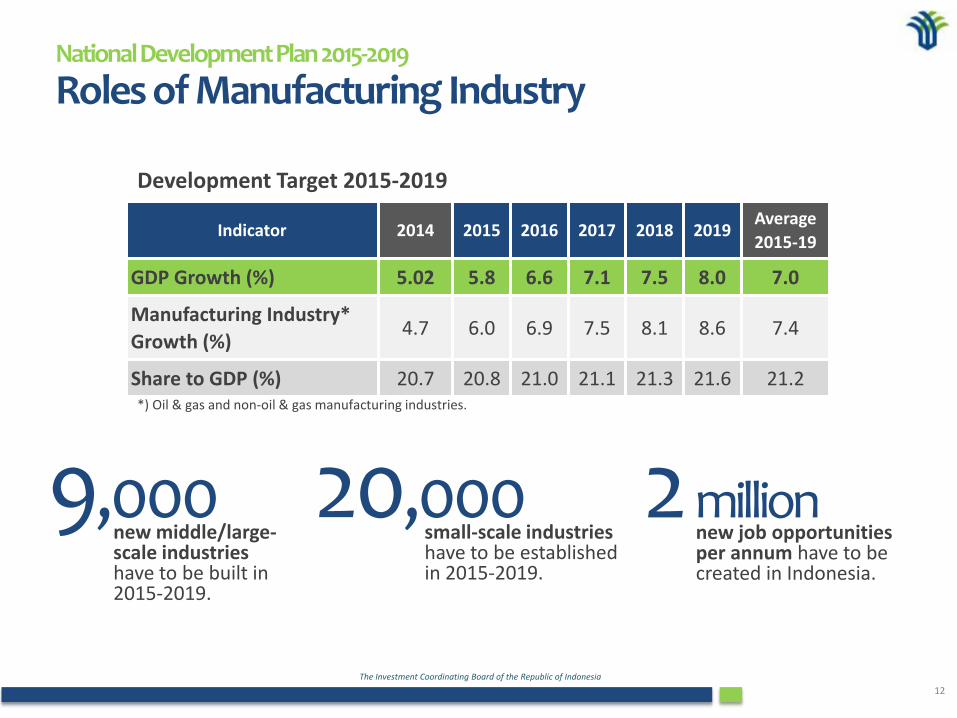
National Development Plan 2015-2019
Roles of Manufacturing Industry
Indicator 2014 2015 2016 2017 2018 2019 Average 2015-19
GDP Growth (%) 5.02 5.8 6.6 7.1 7.5 8.0 7.0
Manufacturing Industry* Growth (%)
4.7 6.0 6.9 7.5 8.1 8.6 7.4
Share to GDP (%) 20.7 20.8 21.0 21.1 21.3 21.6 21.2
Development Target 2015-2019
new middle/large-scale industries have to be built in 2015-2019.
9,000 20,000 small-scale industries have to be established in 2015-2019.
2 million new job opportunities per annum have to be created in Indonesia.
*) Oil & gas and non-oil & gas manufacturing industries.
The Investment Coordinating Board of the Republic of Indonesia 13
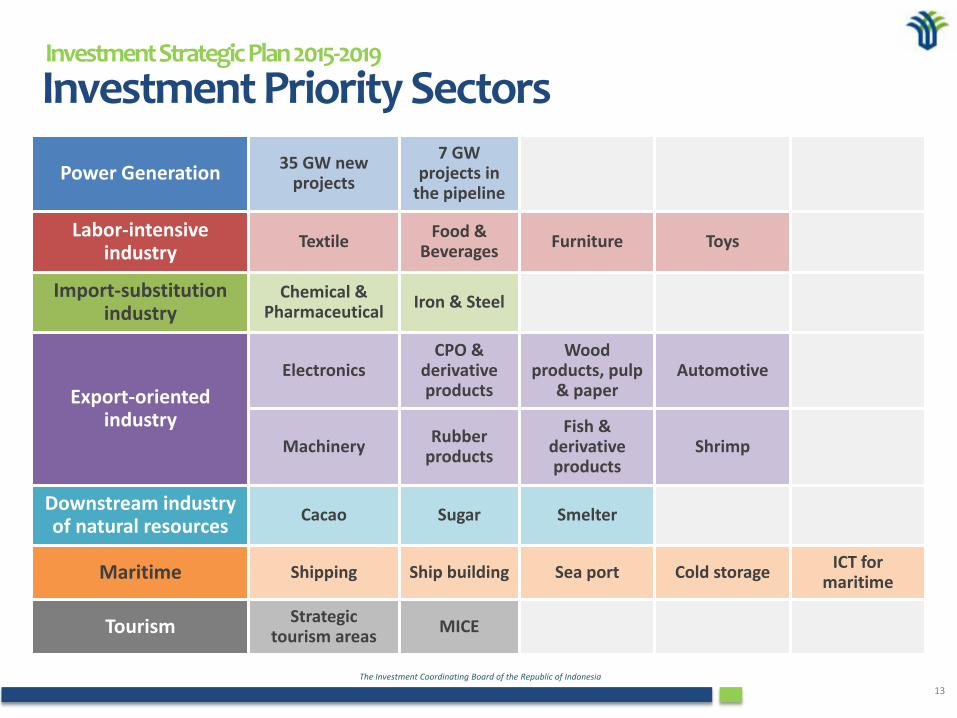
Power Generation 35 GW new projects
7 GW projects in
the pipeline
Labor-intensive industry Textile Food &
Beverages Furniture Toys
Import-substitution industry
Chemical & Pharmaceutical Iron & Steel
Export-oriented industry
Electronics CPO &
derivative products
Wood products, pulp
& paper Automotive
Machinery Rubber products
Fish & derivative products
Shrimp
Downstream industry of natural resources Cacao Sugar Smelter
Maritime Shipping Ship building Sea port Cold storage ICT for maritime
Tourism Strategic tourism areas MICE
Investment Strategic Plan 2015-2019
Investment Priority Sectors
The Investment Coordinating Board of the Republic of Indonesia 14
Enggano
Kertajati
Singkawang
Muara Teweh
Miangas
Maratua
Tojo Una-Una
Pohuwato
Moa
Namniwel
Taria
Kenyam Aboy
Koroway Batu
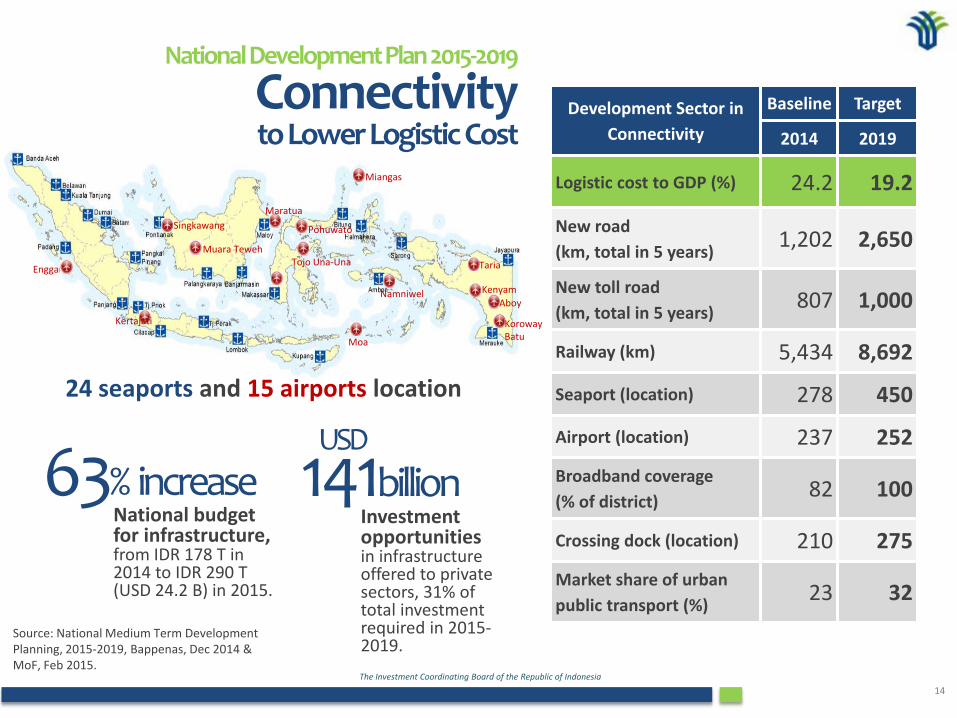
Development Sector in Connectivity
Baseline Target
2014 2019
Logistic cost to GDP (%) 24.2 19.2
New road (km, total in 5 years) 1,202 2,650
New toll road (km, total in 5 years) 807 1,000
Railway (km) 5,434 8,692
Seaport (location) 278 450
Airport (location) 237 252 Broadband coverage (% of district) 82 100
Crossing dock (location) 210 275 Market share of urban public transport (%) 23 32
National Development Plan 2015-2019
Connectivity to Lower Logistic Cost
Source: National Medium Term Development Planning, 2015-2019, Bappenas, Dec 2014 & MoF, Feb 2015.
24 seaports and 15 airports location
63% increase
National budget for infrastructure, from IDR 178 T in 2014 to IDR 290 T (USD 24.2 B) in 2015.
USD 141billion
Investment opportunities in infrastructure offered to private sectors, 31% of total investment required in 2015-2019.
IndonesiaInvestment Coordinating Board 15
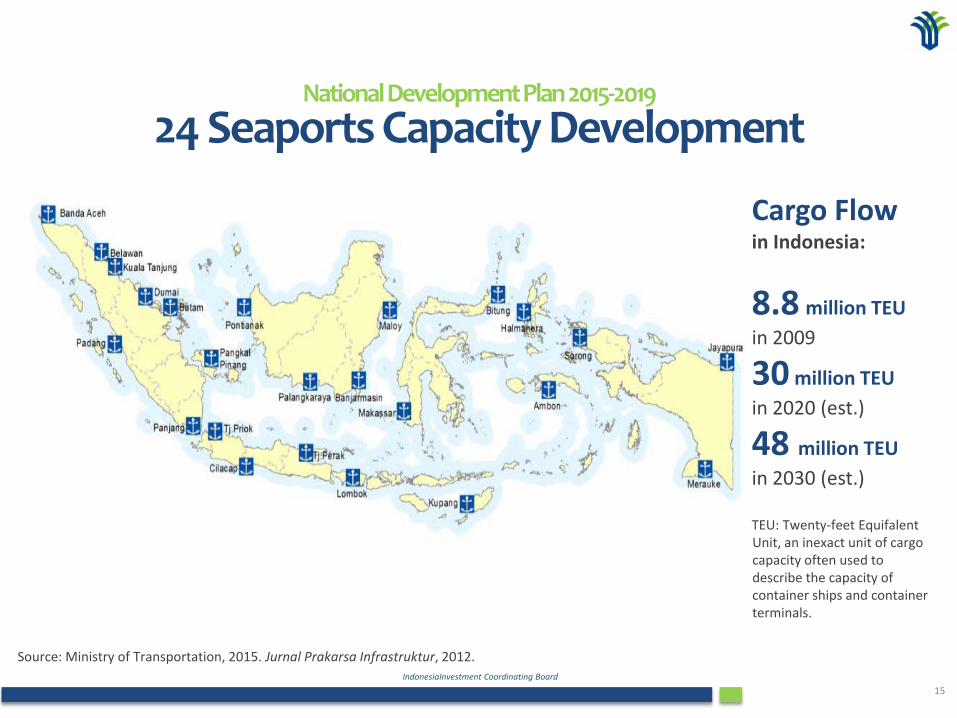
National Development Plan 2015-2019
24 Seaports Capacity Development
Cargo Flow in Indonesia:
8.8 million TEU in 2009
30 million TEU in 2020 (est.)
48 million TEU in 2030 (est.) TEU: Twenty-feet Equifalent Unit, an inexact unit of cargo capacity often used to describe the capacity of container ships and container terminals.
Source: Ministry of Transportation, 2015. Jurnal Prakarsa Infrastruktur, 2012.
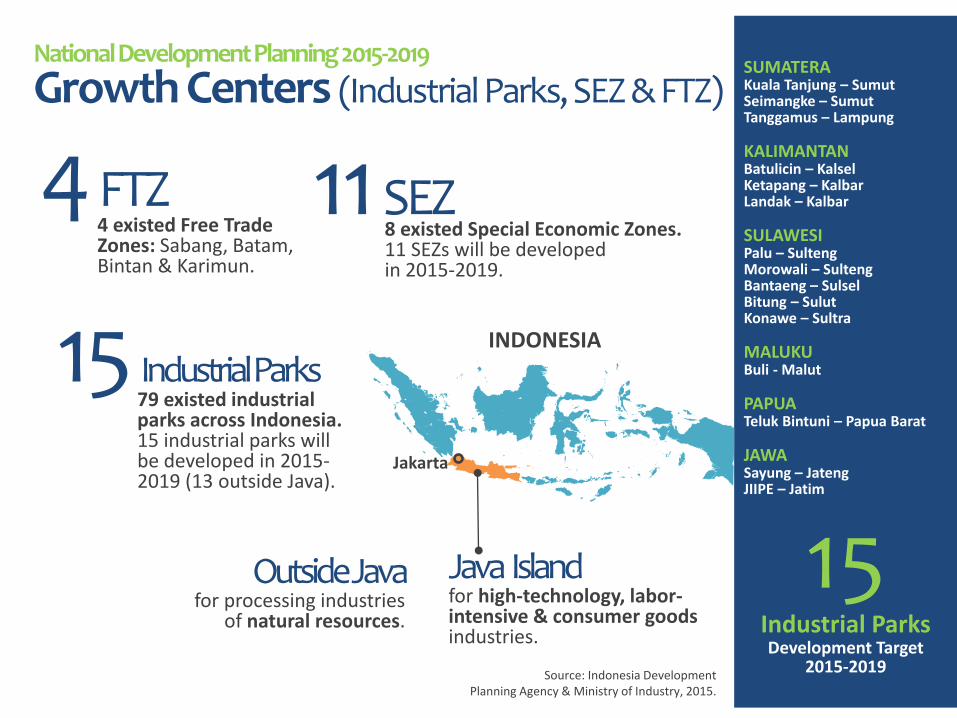
National Development Planning 2015-2019
Growth Centers (Industrial Parks, SEZ & FTZ)
SUMATERA Kuala Tanjung – Sumut Seimangke – Sumut Tanggamus – Lampung KALIMANTAN Batulicin – Kalsel Ketapang – Kalbar Landak – Kalbar SULAWESI Palu – Sulteng Morowali – Sulteng Bantaeng – Sulsel Bitung – Sulut Konawe – Sultra MALUKU Buli - Malut PAPUA Teluk Bintuni – Papua Barat JAWA Sayung – Jateng JIIPE – Jatim
15 Industrial Parks Development Target
2015-2019
Source: Indonesia Development Planning Agency & Ministry of Industry, 2015.
11 SEZ 8 existed Special Economic Zones. 11 SEZs will be developed in 2015-2019.
15 Industrial Parks
79 existed industrial parks across Indonesia. 15 industrial parks will be developed in 2015-2019 (13 outside Java).
4 FTZ 4 existed Free Trade Zones: Sabang, Batam, Bintan & Karimun.
Java Island for high-technology, labor-intensive & consumer goods industries.
Jakarta
INDONESIA
Outside Java for processing industries
of natural resources.
The Investment Coordinating Board of the Republic of Indonesia 17
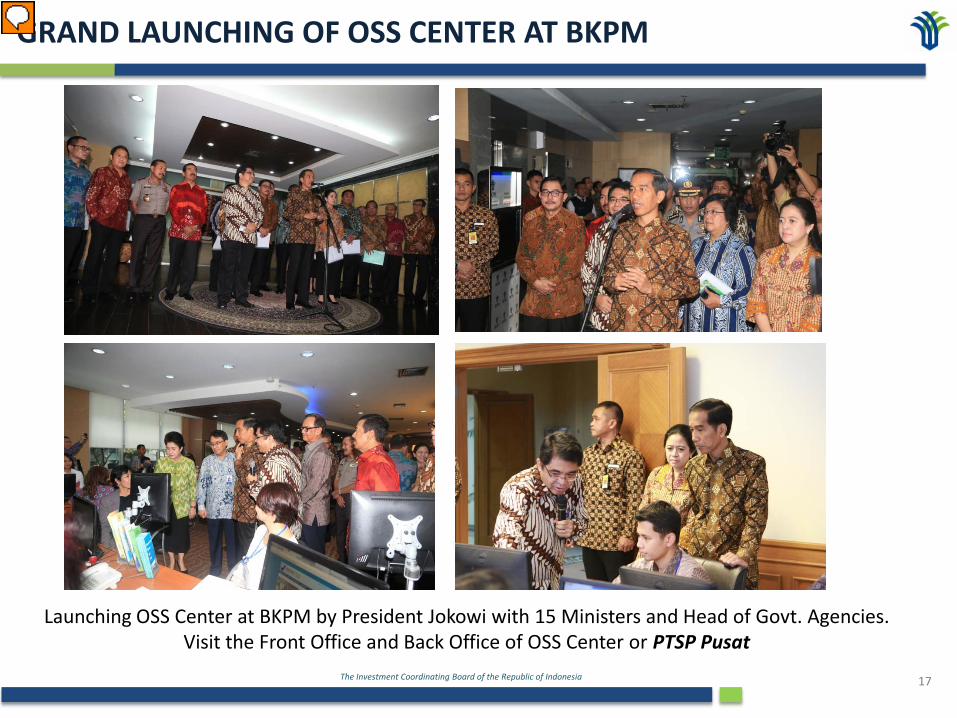
GRAND LAUNCHING OF OSS CENTER AT BKPM
Launching OSS Center at BKPM by President Jokowi with 15 Ministers and Head of Govt. Agencies. Visit the Front Office and Back Office of OSS Center or PTSP Pusat

The Investment Coordinating Board of the Republic of Indonesia 18
OSS CENTER IN BKPM
BACK OFFICE
FRONT OFFICE
The Investment Coordinating Board of the Republic of Indonesia 19
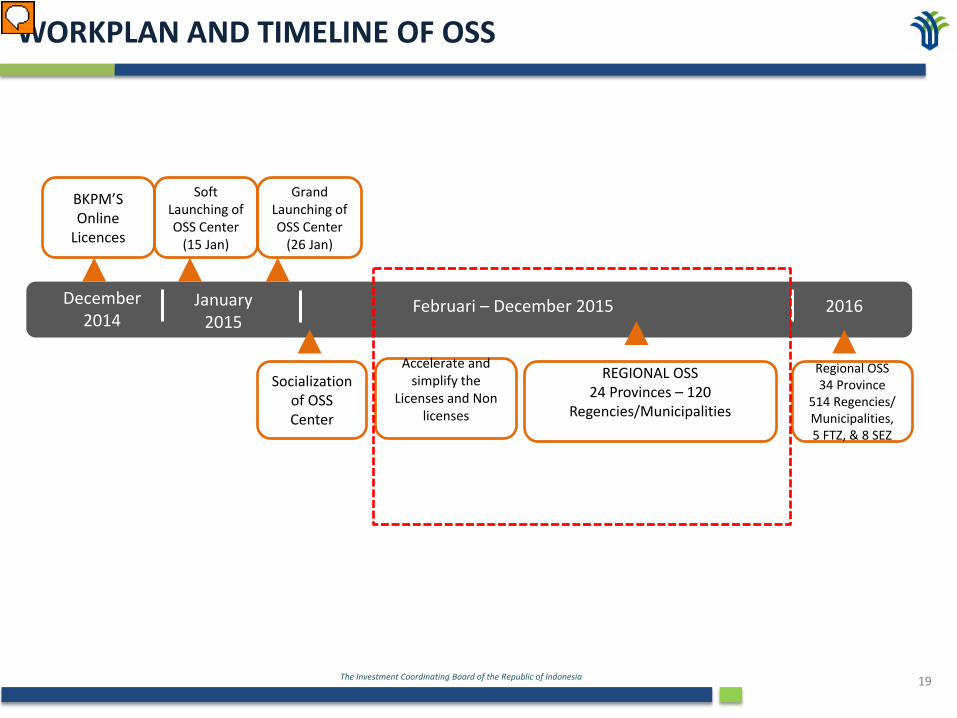
WORKPLAN AND TIMELINE OF OSS
BKPM’S Online
Licences
December 2014
January 2015
Februari – December 2015 2016
Grand Launching of OSS Center
(26 Jan)
REGIONAL OSS 24 Provinces – 120
Regencies/Municipalities
Regional OSS 34 Province
514 Regencies/ Municipalities, 5 FTZ, & 8 SEZ
Soft Launching of OSS Center
(15 Jan)
Socialization of OSS Center
Accelerate and simplify the
Licenses and Non licenses
The Investment Coordinating Board of the Republic of Indonesia 20
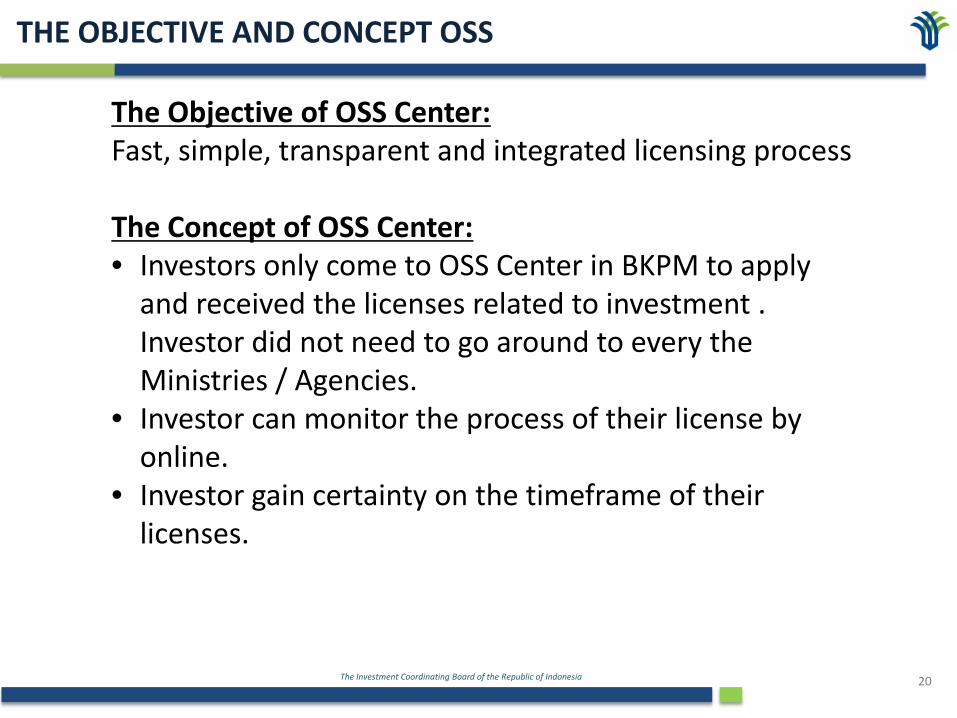
The Objective of OSS Center: Fast, simple, transparent and integrated licensing process The Concept of OSS Center: • Investors only come to OSS Center in BKPM to apply
and received the licenses related to investment . Investor did not need to go around to every the Ministries / Agencies.
• Investor can monitor the process of their license by online.
• Investor gain certainty on the timeframe of their licenses.
THE OBJECTIVE AND CONCEPT OSS
The Investment Coordinating Board of the Republic of Indonesia 21
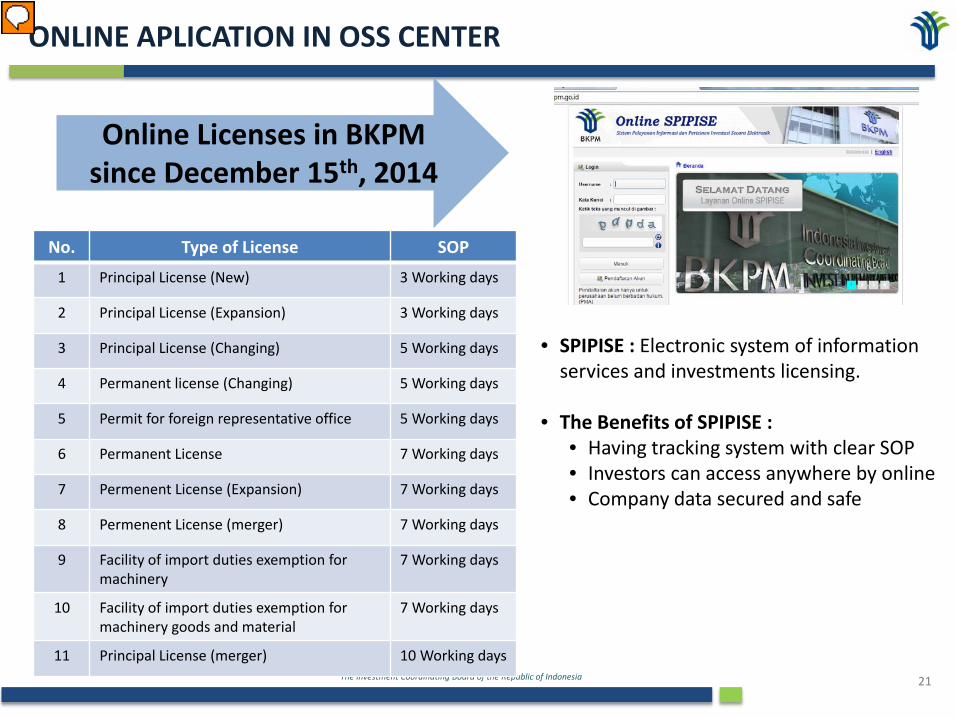
ONLINE APLICATION IN OSS CENTER
• SPIPISE : Electronic system of information services and investments licensing.
• The Benefits of SPIPISE :
• Having tracking system with clear SOP • Investors can access anywhere by online • Company data secured and safe
Online Licenses in BKPM since December 15th, 2014
No. Type of License SOP
1 Principal License (New) 3 Working days
2 Principal License (Expansion) 3 Working days
3 Principal License (Changing) 5 Working days
4 Permanent license (Changing) 5 Working days
5 Permit for foreign representative office 5 Working days
6 Permanent License 7 Working days
7 Permenent License (Expansion) 7 Working days
8 Permenent License (merger) 7 Working days
9 Facility of import duties exemption for machinery
7 Working days
10 Facility of import duties exemption for machinery goods and material
7 Working days
11 Principal License (merger) 10 Working days
The Investment Coordinating Board of the Republic of Indonesia 22
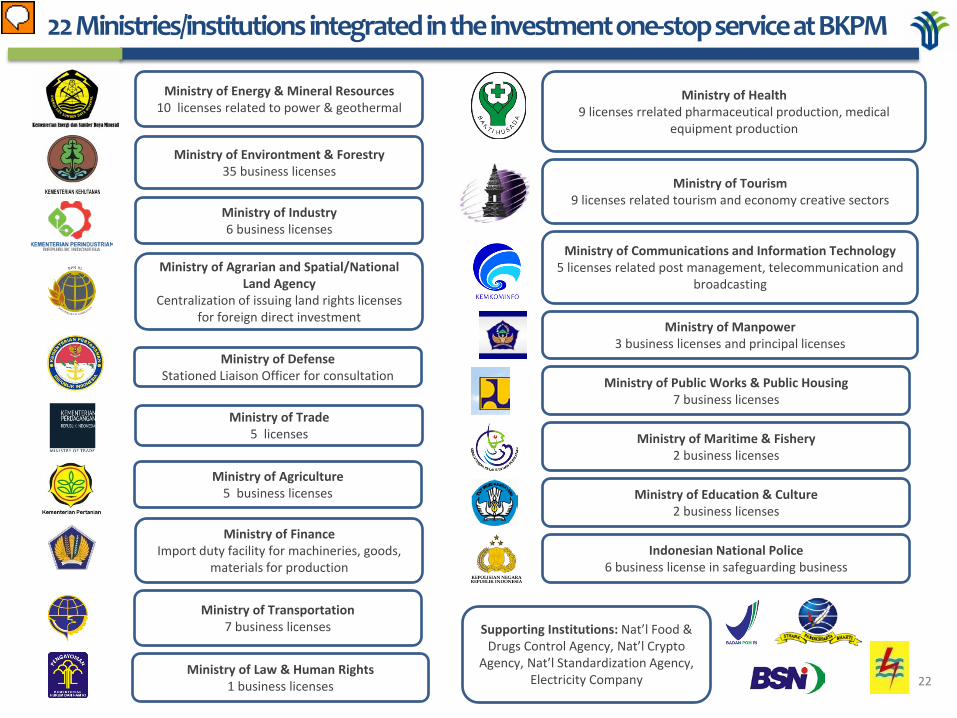
Ministry of Agrarian and Spatial/National Land Agency
Centralization of issuing land rights licenses for foreign direct investment
Ministry of Energy & Mineral Resources 10 licenses related to power & geothermal
Ministry of Environtment & Forestry 35 business licenses
Ministry of Industry 6 business licenses
Ministry of Health 9 licenses rrelated pharmaceutical production, medical
equipment production
Ministry of Tourism 9 licenses related tourism and economy creative sectors
Ministry of Communications and Information Technology 5 licenses related post management, telecommunication and
broadcasting
Ministry of Manpower 3 business licenses and principal licenses
Ministry of Agriculture 5 business licenses
Ministry of Public Works & Public Housing 7 business licenses
Ministry of Trade 5 licenses
Ministry of Finance Import duty facility for machineries, goods,
materials for production
Ministry of Transportation 7 business licenses
Indonesian National Police 6 business license in safeguarding business
Ministry of Maritime & Fishery 2 business licenses
Ministry of Education & Culture 2 business licenses
Ministry of Law & Human Rights 1 business licenses
Supporting Institutions: Nat’l Food & Drugs Control Agency, Nat’l Crypto
Agency, Nat’l Standardization Agency, Electricity Company
22 Ministries/institutions integrated in the investment one-stop service at BKPM
Ministry of Defense Stationed Liaison Officer for consultation
The Investment Coordinating Board of the Republic of Indonesia 23
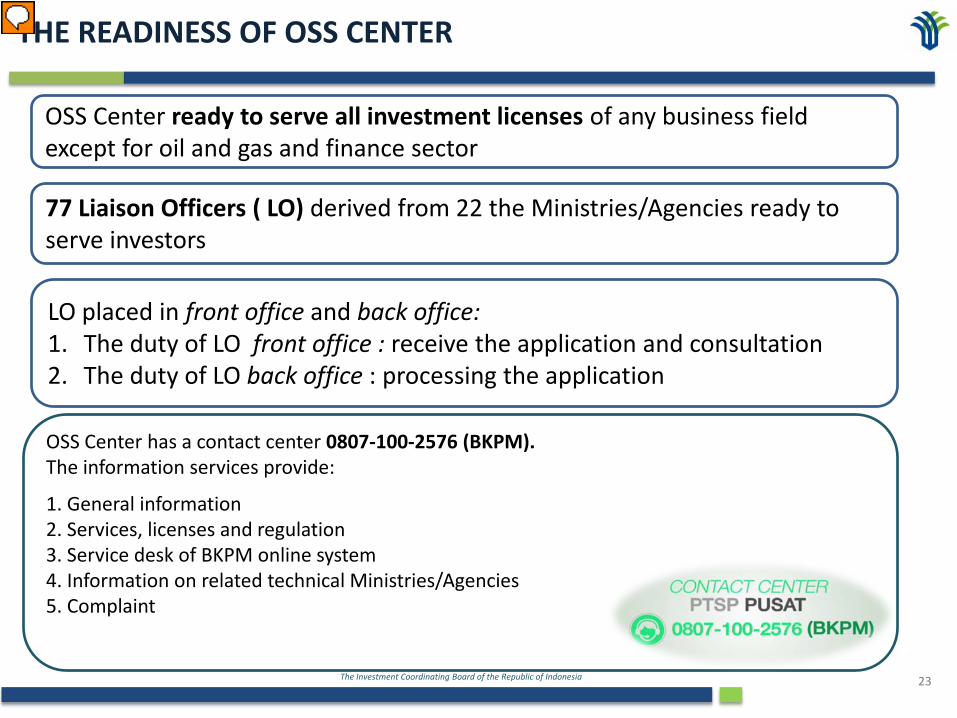
THE READINESS OF OSS CENTER
OSS Center ready to serve all investment licenses of any business field except for oil and gas and finance sector
77 Liaison Officers ( LO) derived from 22 the Ministries/Agencies ready to serve investors
LO placed in front office and back office: 1. The duty of LO front office : receive the application and consultation 2. The duty of LO back office : processing the application
OSS Center has a contact center 0807-100-2576 (BKPM). The information services provide:
1. General information 2. Services, licenses and regulation 3. Service desk of BKPM online system 4. Information on related technical Ministries/Agencies 5. Complaint
The Investment Coordinating Board of the Republic of Indonesia 24
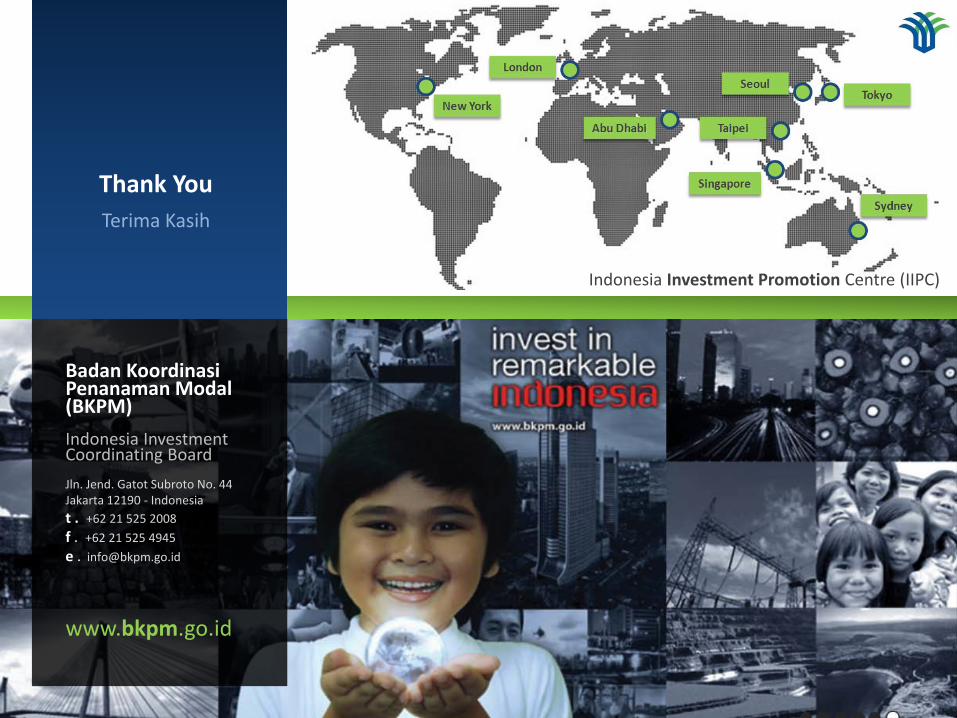
Badan Koordinasi Penanaman Modal (BKPM) Indonesia Investment Coordinating Board Jln. Jend. Gatot Subroto No. 44 Jakarta 12190 - Indonesia t . +62 21 525 2008 f . +62 21 525 4945 e . [email protected]
www.bkpm.go.id
Thank You Terima Kasih
Indonesia Investment Promotion Centre (IIPC)