Embed Size (px)
Citation preview

1
Università Commerciale Luigi Bocconi
Dipartimento di Finanza
Corso di Laurea in Economia e Management delle Istituzioni e dei
Mercati Finanziari
Investment Certificates: A Developing Frontier for
Structured Products
Advisor: Massimo Guidolin
Master of Science Thesis of:
Gioacchino Fittipaldi
Student ID: 1649102
Academic Year 2016/2017

6
Table of Contents
Abstract ............................................................................................................................................................... 8
1. Introduction .................................................................................................................................................. 9
2. Recent Evolution and Current Framework .................................................................................... 12
2.1 The Evolution of the Market in Europe .................................................................................... 12
2.2 The Evolution of the Market in Italy .......................................................................................... 12
2.3 Primary and Secondary Markets ................................................................................................ 14
3. The Different Categories ....................................................................................................................... 16
3.1 Capital Protection ............................................................................................................................. 17
3.2 Yield Enhancement........................................................................................................................... 24
3.3 Participation ....................................................................................................................................... 28
4. The Behavior of Investment Certificates During their Lifetime ............................................ 36
4.1 Options: An Essential Component of Investment Certificates ......................................... 36
4.2 Option Pricing Models: A Primer ................................................................................................ 38
4.3 Variables at Stake .............................................................................................................................. 40
4.4 Equity Protection .............................................................................................................................. 44
4.5 Bonus ..................................................................................................................................................... 45
5. A Comparison with other Financial Assets .................................................................................... 47
5.1 Certificates, Stocks and Bonds ..................................................................................................... 48
5.2 Certificates and Mutual Funds ..................................................................................................... 49
5.3 Certificates and ETFs ....................................................................................................................... 50
5.4 A Synoptic Framework ................................................................................................................... 52
6. Concluding Remarks ............................................................................................................................... 53
References ........................................................................................................................................................ 54
9
1. Introduction
Investment certificates belong to the category of structured products, i.e. financial
securities consisting of various elementary components which are combined together to
generate a specific risk-return profile to satisfy the needs of an investor. In the academic
literature, there are no consistently used and widely accepted definitions of structured
product. According to Wohlwend, “a structured product combines the payout structures of
at least two financial assets into one financial product, where at least one of these
components has to be a derivative financial instrument” (Wohlwend, 2001; p.5). The aim of
structured products is to set the return distribution of an underlying asset at one or more
specific points, or to change the distribution shape as compared to their underlying asset
altogether.
Investment Certificates are securitized derivatives, combining financial derivatives
(mainly options), risk-free zero-coupon bonds, and/or underlying asset(s). They
represent a vast class of financial products, characterized by a rich variety of risk-return
profiles that can be selected in the implementation of many investment strategies.
Certificates can be linked to many different underlying assets, from equity indexes to
stocks, from currencies to commodities, including interest rates.
Certificates can be divided in two main categories: Investment Certificates and
Leveraged Certificates. Investment Certificates can be used by investors for risk
management and yield enhancement purposes, while Leverage Certificates allow the
investor to be exposed to the performance of the underlying, in a magnified way thanks
to the leverage effect included in this category of financial products.
An investor can buy a certificate on the primary market during the offer period
(usually three weeks) from the distributor/manager/private banker or directly on the
secondary market if the product has been listed. In Italy for instance, certificates can be
traded either on the SeDeX of Borsa Italiana SpA or on the Cert-X of EuroTLX SIM. A
distinctive element characterizing those products is a low investment requirement as
certificates have a minimum size, in general, equal to 100 or 1000 euros and an investor
can acquire an amount as low as one unit of the issue.
In general, the price of a certificate is determined by its characteristics (type, payoff,
protection, maturity, etc.). In particular, the payoff of a structured product is equal to the
algebraic sum of the payoff of its financial components and in no-arbitrage conditions the
price of the product must be equal to the algebraic sum of the prices of the components.

10
However, during the offer period, the price of a certificate is not equal to the algebraic sum
of the price of each single component because the issuer includes in the issue price the
costs for the structuring, distribution and listing of the product. There is a further implicit
cost component for an investor who purchases a certificate: he does not receive any
dividend distributed by the underlying asset during the life of the product. Dividends are
exploited by the issuer to buy the basic elements that generate the desired characteristics
of an Investment Certificate. For instance, the dividends paid by the stock can be employed
by the issuer to “buy” the capital protection at maturity for a certificate offering capital
protection, or they can be used to grant the investor a remuneration even in case of a
moderate market decline as it happens for a Bonus Certificate. Hence, the forgone
dividends must not be understood as a profitability reduction but rather as a necessary
condition for the structuring of the financial product.
Investment Certificates are characterized by high flexibility: the great variety of
financial structures and maturities (in general from one to five years) allows investors to
select the certificate which best matches his/her portfolio needs. Besides, thanks to a wide
range of underlying assets, an investor can be exposed to an asset otherwise not available
or only available at very high costs. Moreover, despite being considered complex products,
they have an easy payoff structure and their offering must contain a final term-sheet to
facilitate their understanding. Plus, they can be listed on an exchange, and they are issued
by an institution through a specific Base Prospectus, previously approved by the CONSOB
(in Italy) or another National Authority.1 Indeed, after their distribution, almost all
certificates are admitted to trading on the secondary market. In this market, liquidity is
guaranteed by market makers and/or specialists, who commit to quote on a continuous
base bids and offers, with a maximum bid-ask spread defined by law.2,3 Independently
from the chosen structure and by the underlying asset, all certificates can be bought and
sold on a per-share basis anytime during market hours. It is important to highlight that by
1 See also “Consultation paper on the new reporting obligations for intermediaries (June 19, 2009)”. 2 For every product traded on the secondary market there exists a trading book, with offers to buy (bid) and sell (ask). When there is a match between the bid price and ask price, the two orders are matched, and a transaction occurs. All other orders placed are shown in the book in order of price, from the highest to the lowest for bids and from the lowest to the highest for asks (best bid and offer criterion). 3 There are different maximum spreads depending on the reference price of the product. However, since most of investment certificates have a price higher than 30 euros, the maximum spread allowed is 3.50% in this case.
11
investing in certificates, an investor may be able to recover losses linked to previous
investment made in other financial assets. Indeed, in Italy the taxation of certificates is
easy and more convenient than that of other investment products.4
However, by investing in certificates an investor bears many risks. Indeed,
certificates are a direct, unsubordinated, unconditional and unsecured obligation issued
by a bank or a financial intermediary, and rank equally with all other direct, unconditional
and unsecured obligations of the issuer. Therefore, the redemption of the invested capital
and the solvency of an Investment Certificate is determined by the capital solidity of the
issuer. The probability that the issuer would not be able to fulfill its obligations, that is to
liquidate at maturity the proceeds owed to the buyer of the financial instrument, is not
zero.5 Moreover, the value of these products is essentially linked to the performance of
the underlying asset(s). The return cannot be predetermined and in case of a negative
performance of the underlying(s), the value of the derivative can go to zero (market risk).
Besides, the underlying asset(s) may be denominated in a difference currency than that
of the certificate and hence, the value of the instrument may be subject to changes in the
value of the exchange rate between the two currencies. Eventually, the price of a
certificate can be affected by the liquidity on the market. The existence of a regulation
imposed by Borsa Italiana SpA in terms of quantity and maximum bid-ask spread lowers
this risk, but it does not exclude possible divestment issues before maturity.
The rest of the thesis has the following structure. Section 2 analyzes the recent
evolution of the market for Investment Certificates in Europe and Italy. Section 3
describes analytically the Investment Certificates types, grouping them in three main
categories: Capital Protection, Yield Enhancement, and Participation. Section 4 examines
the behavior of Investment Certificates during their lifetime: first it presents the most
common types of exotic options and describes the main risk factors taken into
consideration for the analysis and then it focuses on the behavior of an Equity Protection
and a Bonus Certificate. Section 5 continues with a synoptic comparison of different
investment products and Section 6 concludes.
4 For a detailed analysis please see section 5. 5 From January 1st, 2016, there is another risk that needs to be considered. This risk is linked to the application of the bail in, a mechanism, introduced by the 2014/59/EU Directive (BRDD), that allows BankItalia to activate a preventive measure if the financial institution is deemed to be in trouble, in order to preserve its business continuity.

12
2. Recent Evolution and Current Framework
2.1 The Evolution of the Market in Europe
Structured products experienced a great success before the financial crisis of 2008 but
then lost the trust of investors. According to the Federation of European Securities
Exchanges (FESE) the traded volumes of securitized derivatives reached its maximum in
2008, at around 200 billion of euros and 19 million of trades. Since then, those numbers
have decreased. Nevertheless, Exchange turnover in structured investment and leveraged
products on Europe’s financial markets stood at 27.6 billion euros at the end of September
2017, representing a significant 6.0% increase year on year. At the end of September,
exchanges located in Italy, Germany, France, Belgium, Holland, Switzerland, Sweden, UK,
and Austria (all EUSIPA member countries) were offering 565,533 investment products
and 1,127,562 leverage products (a 7.0% increase quarter on quarter, and a significant
23.0% year on year).6
At present, certificates are listed in at least fourteen European Exchanges, even if
most of the European contracts are negotiated on the SeDeX (the Italian market for
Covered Warrants and Certificates), Euwax (European Warrant Exchange) which is
Europe’s largest platform for exchange trading in securitized derivatives, Scoach and Nyse
Euronext (a pan-European exchange, spanning Belgium, France, the Netherlands,
Portugal and the UK).
All these exchanges share the following features:
- types of listed certificates: Bonus, Express, Discount, Outperformance, Equity
Protection and others
- main issuers: BNP Paribas, Société Générale, Deutsche Bank, Royal Bank of
Scotland, and UniCredit
- the European regulation: in particular the Markets in Financial Instruments
Directive 2014/65/EU (MiFID II), The Prospectus Directive 2003/71/EC (PD), and
The Market Abuse Regulation (EU) 596/2014 (MAR)
2.2 The Evolution of the Market in Italy
Investment Certificates were introduced on the market many years ago. The first
certificate was issued in Germany in 1989, whilst in Italy some certificates were already
6 Source: European Structured Investment Products Association (EUSIPA)

13
traded on the secondary market at the end of the 90s.7 Nevertheless, it is only in the last
decade that these products have gained in importance, with a strong acceleration in recent
years. This can be seen in Figure 1 and Figure 2 that show the evolution of the number
and the turnover of certificates issued every year by banks in Italy, starting from 2008.
The number of new ISIN on the market has shown a progressive increase until 2015:
after a first sharp increase in 2009 and a consolidation in the three following years, from
2013 to 2015 there has been a boom in the offering of certificates, followed by a drop in
2016. The numbers for 2017 are better than that of 2016, and in line with those recorded
in 2015. Indeed, according to ACEPI, 473 new certificates were issued last year (a 29%
increase year on year).
By looking at the issued, the growth process is even more noticeable. We had a first
significant raise between 2008 and 2010, when volumes recorded a 332% increase (for
an annual rate of 82%), going from 1.21 billion euros in 2008 to 4.03 billion in 2010.
However, it is from 2013 that we recorded an incredible jump in the issued, moving from
2.5 to 10.6 billion of euros in 2015, with an average annual growth rate of 62%. The drop
recorded in 2016, in line with the reduction, in the same year, in the numbers of issues,
could have been suggested a crisis for the market of certificates. However, first, it must be
noticed that, after three years of significant growth, a period of correction in the market
is not uncommon. Indeed, a similar path was already recorded after the first peak of 2010.
As a matter of fact, data from 2016 consolidate the growth seen in the previous three
years: 2016 volumes are more than double that of 2012. What is more, the recent figures
for 2017 shows a new rise in the issued (4.7 billion euros) even if the number is still below
the peak reached in 2015.
A different analysis can be performed using the statistics on certificates turnover on
the SeDeX, one of the two markets where certificates are regularly traded, and provided
by Borsa Italiana SpA, the manager of the market for securitized derivatives in Italy8.
Figure 3 shows the evolution of turnover in millions of euros on the trading platform
since 2011. The numbers, which comprise both investment and leveraged certificates,
confirm the trend shown in the issue of certificates: in the three years coinciding with the
boost of the former, the trading volume increased sevenfold.
7 See Camelia (2009), page 24. 8 Data are publicly available on Borsa Italiana SpA website. Figures are not exhaustive since trading volumes on the other available platform, EuroTLX, are not included.
14
Finally, the decomposition between the two macro categories of certificates
highlights that the main contribution to the growth of these products is mainly given by
leveraged certificates, which since 2013 have overtaken in terms of turnover the other
category, above all thanks to the success of the fixed leverage certificates. If it is natural
that leveraged certificates, more suitable for speculative short-term operations, are much
more traded, it is desirable that Investment Certificates, more suitable instead for a
medium-long term investment horizon, would return to take a larger market share
(Figure 4).
There are many reasons at the basis of the success of certificates in recent years.
First, the transparency of these products is considerably improved thanks to the detailed
documentation provided by financial intermediaries. This allows a better understanding
of the product for the investor, enhancing his/her trust in the instrument. Second, market
efficiency contributes to improve the liquidity of the market, making it easy to manage
investments. Therefore, always more investors approach these products independently,
and acquire consciousness of their potentials. Last, but not least, financial intermediaries
are focusing on the development of Investment Certificates to expand the range of offered
products and provide a valid alternative to other financial products. In recent years, the
main driving factor has been the low interest rate environment (we have experienced
even negative interest rates). In this phase, the investment in other instruments is
penalized. For instance, the return on short-term Italian government bonds (BOT and
CCT), historically appreciated by Italian households, is negative at the time of writing,
close to the -0.5% region, and even by extending the maturity (and hence risk), returns
remain unsatisfactory anyway.
Investment certificates represent an optimum alternative solution for putting capital at
work.
2.3 Primary and Secondary Markets
When an issuer structures an issue of a new certificate, it can opt for a direct listing on the
Exchange (secondary market) or for a distribution to clients through an offer (primary
market), usually followed by the listing on the Exchange (SeDeX or Cert-X). In the last ten
years, the market has progressively moved from the first to the second alternative and
today the offering activity preceding the issue represents a considerable part of the job of
a certificates’ issuer.
15
Following the example of the issue of BTP Italia, which recorded a great success,
since December 2013 the primary market has strengthened itself with the introduction of
the direct distribution of certificates through the market platform. This new distribution
method allows issuer banks to list certificates directly through the trading platform of
Borsa Italiana, ensuring a continuous link between the “primary” market (of the offer) and
the following listing on the SeDeX. This new offering method of certificates has many
advantages for investors in terms of transparency and simplification of the subscription
method. Besides, it generates less costs for intermediaries (which do not pay trading fees),
with a likely costs reduction for the certificate holder as well.
SeDeX is the acronym of Securitized Derivative Exchange. It is a non-regulated
market where certificates and covered warrants can be traded. It was established in 2004
to combine the trading of securitized derivatives. From November 27th SeDeX changed its
status as a regulated market, becoming a Multilateral Trading Facility (MTF). This
regulatory move was put in place to comply with a new provision in MiFID II requiring
the mandatory introduction of a Central Counterparty (CC&G), from January 3rd, 2018.
However, not only the name of the market remained unchanged, but it follows the same
set of rules of the regulated one.
It is divided into four segments: the first two are the ones dedicated to plain vanilla
and exotic covered warrants, while the other two to the trading of investment and
leveraged certificates. Leverage certificates are then divided into variable leverage (Class
A) and fixed leverage (Class B). A similar distinction is made for Investment Certificates:
the products whose payoff replicates linearly the underlying (e.g. tracker or open-end)
belong to the Class A, whilst all the other products are clustered in Class B.
Borsa Italiana S.p.A defines with its own rule book the issuers admitted to present
listing proposal, as well as the characteristics of the certificates, in terms of maturities,
underlying asset(s), and liquidation terms. SeDeX is an order-driven market, where price
formation is driven by the offers existing on the market. The orders are matched according
to the best bid and offer criterion and, in case of offers with the same price, the time of the
offer prevails, without opening and closing auctions (only continuous trading from 9.00
to 17.25). It is foreseen the mandatory figure of the Specialist, i.e. a financial intermediary,
most of the times coinciding with the intermediary that has issued the product, with the
obligation to quote bid and ask prices, with a minimum quantity and a maximum spread
defined by the market itself.

16
EuroTLX, on the other hand, has always been a MTF. MTFs were introduced in 2004
by MiFID I and the main differentiation point with respect to regulated markets is the
quality of the subject enabled to the management of the exchange. A regulated market can
be managed by a management company, as for example is Borsa Italiana SpA, whilst a
MTF can be managed by an investment firm as well. As a matter of fact, EuroTLX was
managed by Intesa Sanpaolo and UniCredit, both owning a 50% share until September
23rd, 2013, date in which the control of the platform passed to Borsa Italiana, which now
holds 70% of the shares.9
From an operating point of view, however, few are the changes with respect to the
organization and functioning of a regulated market (continuous trading from 9.0 to 17.30,
order-driven market with price and time criteria). As for the SeDeX, the presence of a
liquidity provider is mandatory, with the former obliged to continuously quote bid and
ask prices with minimum quantities and maximum spread limits. Within the platform, the
Cert-X segment is where the trading of Investment Certificates takes place (together with
that of covered warrants).
3. The Different Categories
In the following pages I describe the different categories of certificates. Every certificate
is analyzed with the following method: first, I give a brief description of the instrument.
Then I define the profit function and then I show which is the option strategy at the basis
of the certificate’s structure. I decided to postpone the analysis of the behavior of the
mark-to-market of Investment Certificates during their lifetime to the next chapter
because this analysis is at the heart of the identification process of the risks and
opportunities linked to an investment in these products.
The order followed in the presentation of the different categories follows the
European Product Categorization sponsored by EUSIPA. The association defines four
categories for structured products: Capital Protection, Yield Enhancement, Participation
and Leverage. I have decided to focus my analysis on the products with no leverage and
hence defined, stricto sensu, Investment Certificates.
The categorization proposed by EUSIPA differentiates the products by their risk-
return profile and in Figure 5 their risk is compared with that of familiar asset classes.
9 Source: EuroTLX website

17
However, it is important to remember that structured products in general and investment
certificates in particular are characterized by asymmetric return distributions. The risk of
each certificate will depend on its construction features. Therefore, the representation in
figure 5 is incomplete and should consider other parameters (described in section 4 of
this work) to become more accurate.
3.1 Capital Protection
Capital Protection instruments guarantee the redemption of the capital at maturity, in
addition to positive returns if the price of the underlying asset(s) touches or breaches a
certain level. Those products, having a strong prudential attitude that perfectly fits the
hedging needs of risk-averse investors, are viewed with a positive light by supervisors.
They have understandable payoff and are widespread among retail clients. Capital
guaranteed products guarantee the redemption of the invested capital at maturity in
addition to participating to a certain degree in the performance of an underlying risky
asset (Bluemke, 2009). In this category we find Equity Protection, Digital, Double Win,
Butterfly and Express Protection.
Equity Protection
Equity Protection are the simplest among capital protection products. They can be
suitable for an investor willing to participate in the positive performance of the underlying
asset, receiving at the same time a hedge if the price of the underlying drops badly. Indeed,
there is a protection level below which the liquidation amount cannot fall, even in case of
negative performances of the underlying.
To better understand the structure and the profit and loss profile of any type of
certificate it is worth knowing the elements characterizing them. In general, the date from
which the gain (or loss) of the underlying asset starts to be computed is known as the
fixing date (or pricing date) while the ending date of the period is known as the expiration
date (or valuation date). For the Equity Protection, the key elements are:
• Initial Level (S0): the value of the underlying asset on the fixing date. Usually the
strike price is set at the initial level and it is expressed as a percentage of it

18
• Protection Level (PL): minimum amount received at maturity, regardless of the
underlying value, expressed as a percentage of the invested capital10
• Participation Factor (PF): expressed in percentage points, it defines to what extent
the certificate participates in the performance, if positive, of the underlying asset
• Multiple (M): the quantity of the underlying asset controlled by each certificate. It
is obtained by dividing the issue price of the certificate by the market price of the
underlying asset
At maturity, two different scenarios can be observed: if the price of the underlying asset
(ST) is above the protection level, the investor receives the capital originally invested to
buy the certificate at issue plus the positive performance, weighted for the participation
factor. If instead 𝑆𝑇 is below the protection level, the liquidation value will be equal to the
minimum guaranteed. In analytical terms:
𝑃𝑎𝑦𝑜𝑓𝑓𝑇 = {𝑁𝑉 × 𝑃𝐿 , 𝑆𝑇 < 𝑃𝐿
{𝑃𝐿 + {{𝑃𝐹 × [(𝑆𝑇 − 𝑆0)]/𝑆0}}} × 𝑁𝑉, 𝑆𝑇 ≥ 𝑃𝐿 (1)
Where NV means Nominal Value. An Equity Protection is a combination of European
options, i.e. it incorporates options which can be exercised only at maturity. By buying this
certificate an investor is long a zero-strike call, which is equivalent to an investment in the
underlying asset, and a put option. The exercise price of the put coincides with the
protection level. This ensures capital protection at maturity in case of a negative
performance of the underlying. Moreover, if the participation factor is not equal to one,
the purchase or sale (depending on whether the it is greater or smaller than one,
respectively) of a quantity of calls is required. The quantity to be bought is equal to the
difference between the PF and 100% (in the opposite case the quantity to be sold is given
by the difference between 100% and the PF).
Two variants of the Equity Protection are the Equity Protection Cap (aka Collar
Certificate) and the Equity Protection Short. The former is characterized by the presence
of a cap, i.e. the participation to the positive performance of the underlying asset is capped
at a predefined level. The cap gives the structurer the possibility to increase the
participation factor or the protection level.11 The equity protection short instead allows
10 As invested capital is intended here and in what follows the amount of money spend by an investor to buy one unit of a certificate at the issue, i.e. the issue price. 11 The Cap is obtained by selling a call option whose strike coincides with the cap level. The sale proceed can then be reinvested for increasing the participation to the upside or the protection of the capital at maturity.
19
to participate in the downside performance of the underlying asset. In other words, if the
price of the underlying closes below the protection level the investor receives the capital
originally invested plus the negative performance (changed in sign), else he/she gets the
minimum guaranteed.12
It is worth noting that thanks to the put-call parity the financial structure behind an
equity protection can be obtained in different ways, all leading to the same result. Let’s
first illustrate this fundamental relationship of the option theory. The put-call states that
the value of an European call option with a given exercise price and maturity can be
obtained from the value of an European put option with the same strike and maturity and
vice versa. Two portfolios are considered to analyze this relationship: a portfolio made of
an European call option (C) and a zero-coupon bond with liquidation value corresponding
to the exercise price of the options (X), the same maturity of the options (T) and interest
rate r (portfolio A), and another built with an European put option (P) and the purchase
at the price (S) of the underlying stock (portfolio B).13 At maturity, both portfolios have
the same payoff, corresponding to the higher between the stock price (𝑆𝑇) and the
exercise price (X).14 If the value of the two portfolios is the same at maturity, they must
have the same value at the beginning. Consequently, the following relationship must hold:
𝑆 + 𝑃 = 𝐶 + 𝑋𝑒−𝑟𝑇 (2)
In the equation, X𝑒−𝑟𝑇represents the actuarial value of the zero-coupon bond, with
maturity T and yield r. Starting from equation (2), through some easy steps we can obtain
the formulae defining the value of each financial instrument as a function of the others, as
illustrated in table 1. For instance, the purchase of a put option can be replicated through
the short-sale of the underlying stock and the contemporaneous reinvestment of the
proceeds in a zero-coupon bond and a call option.
The put-call parity is fundamental in the financial analysis of certificates, both at
maturity and in any instant of the life of these products. An Equity Protection can then be
obtained as a combination of a zero-coupon bond (fiscally more efficient) and a call option
(synthetic hedge). In normal market conditions, the value of this certificate incorporates
12 An Equity Protection Short is constructed with a long zero-strike call option, a short call option, and two long put options. and a possible purchase/sale of several put options if the participation factor is not one. 13 In the following illustration we consider options on non-dividend paying stocks. 14 The options are European and hence they cannot be exercised before maturity.

20
the participation to the upside of the underlying and/or the expectation of a future
participation. Suppose, for instance, that during the lifetime of the certificate the price of
the underlying asset drops well below the protection level in a way that it would be highly
unlikely for the underling to close at maturity above this level. The value of the certificate
will then be a function of the yield remunerating the capital at maturity. For a better
understanding of what just said please consider the following example. Let’s consider a
certificate granting 100% capital protection with a nominal value of 100 euros and one-
year maturity. If the underlying asset value drops 50% below the protection level, next
year the certificate will probably pay just the protection level, that is 100 euros. If the
interest rate p.a. is 4% then the value of the certificate would have a market value of
approximately 96 euros and if we acquire it today, we would make a capital gain that will
be considered for tax purposes as “redditi diversi” and not “redditi da capitale”. In highly
volatile markets and bear (for long certificates) or bull (for short certificates) market
phases, the example is recurrent, and it holds for all certificates belonging to the capital
protection category but Double Win.
Digital
Digital certificates pay a coupon, usually annual, in case the underlying is above, on
predetermined observation dates, a predefined level and a premium at maturity if the
underlying is greater or equal to the initial level. If this is not the case, the product
provides partial or full capital protection. They can be considered a capital protection
variation of another certificate, the Cash Collect: that is why they are also known as Cash
Collect Protection. Other commercial definitions are Target Cedola and Protection
Premium.
The main features of this certificate are:
• Strike/Initial Level (K): underlying level, defined before the issue, from which
intermediate levels are computed
• Protection Level (PL): minimum amount that the investor receives at maturity,
regardless of the value of the underlying asset, expressed as a percentage of the
invested capital
• Digital Level (DL): predefined underlying level recorded on the observation dates
• Digital Coupons (DC): coupon paid when, on the observation dates, the price of the
underlying is above the digital level

21
• Premium (P): an amount of money paid at maturity if the underlying is at least
equal to the strike on the valuation date
• Multiple (M): the amount of the underlying asset(s) controlled by each certificate
At maturity we can observe three different scenarios: if the price of the underlying is
greater or equal to the strike, the certificate pays the nominal value and the Premium (P).
If the price is below the strike but above the protection level the certificate pays an
amount of money equal to the underlying price multiplied by the multiple. If instead the
underlying is below the protection level, the certificate ensures capital protection.
In analytical terms:
𝑃𝑎𝑦𝑜𝑓𝑓𝑇 = {𝑁𝑉 × 𝑃𝐿,
𝑆 × 𝑀, 𝑁𝑉 × 𝑀 + 𝑃,
𝑆𝑇 < 𝑃𝐿
𝑃𝐿 ≤ 𝑆𝑇 < 𝐾 𝑆𝑇 ≥ 𝐾
(3)
If the certificate offers full capital protection, Scenario two does not take place.
This payoff can be obtained with a combination of different options: the purchase of
a zero-strike call option and that of a put option with exercise price corresponding to the
protection level, the sale of a call option with strike K (to delete upside participation), and
the purchase of a stream of digital call options, all with digital level as strike, the coupon
as cash payment, and all with different expiration dates. The different maturities of these
digital options must coincide with the various observation dates of the certificate.
Double Win
Double Win certificates give the possibility to participate in the performance of the
underlying asset, regardless of its sign, and ensure at the same time capital protection.
The features characterizing the Double Win certificates are:
• Initial Level (S0): the value of the underlying asset on the fixing date and coinciding
with the strike of the certificate (K)
• Protection Level (PL): minimum amount received by the investor at maturity,
regardless of the value of the underlying asset, expressed in percentage of the
invested capital
• Participation Level UP (LU): percentage difference, on the upside, of the price of
the underlying from which the Participation Up begins
• Participation Level Down (LD): percentage difference, on the downside, of the
price of the underlying from which Down Participation begins

22
• Participation Factor Up (PU): percentage measure of the participation of the
certificate to the upside performance of the underlying asset
• Participation Factor Down (PD): percentage measure of the participation of the
certificate to the downside performance of the underlying asset
• Multiple (M): amount of the underlying asset controlled by the certificate
At maturity the investor will benefit both from a positive and a negative performance of
the underlying if the price of the underlying is above or below the participation level up
and the participation level down, respectively. If instead the underlying value is between
those two values the investor will receive the minimum guaranteed.
In analytical terms:
𝑃𝑎𝑦𝑜𝑓𝑓𝑇 = {
{𝑃𝐿 + 𝑃𝐷 × [(𝐾 − 𝑆𝑇)/ 𝐾 − 𝐿𝐷]} × 𝑁𝑉,𝑃𝐿 × 𝑉𝑁,
{𝑃𝐿 + 𝑃𝑈 × [(𝑆 − 𝐾 )/ 𝐾 − 𝐿𝐷]} × 𝑁𝑉,
𝑆𝑇 < 𝐿𝐷 𝐿𝐷 ≤ 𝑆𝑇 < 𝐿𝑈 𝑆𝑇 ≥ 𝐿𝑈
(4)
If participation level up and down coincides with the initial level, the investor receives at
maturity the capital originally invested and benefits of any performance of the underlying
asset (positive or negative) with respect to its initial value.
The payoff at maturity can be constructed with a long zero strike call option, a long
put option with exercise price equal to the protection level, a short call option with strike
coinciding with protection level, long an amount of call options equal to the participation
factor up and with strike equal to the participation level up, and long an amount of put
options equal to the participation factor down and with strike coinciding with the
participation level down.
Butterfly
This type of certificate gives an investor the opportunity to benefit from moderate positive
and negative performances of the underlying asset, provided that during its life the
underlying asset remains in a predefined range. It is basically a Double Win with the
addition of two elements: an Up Barrier (UB) and a Down Barrier (DB), whose upward or
downward violation, respectively, during the life of the certificate determines the loss of
the participation to the performance of the underlying asset.
The financial structure of a Butterfly is more elaborated and combines plain vanilla
and exotic options. It is obtained by combining the purchase of a zero-strike call option,
the purchase of a put option with strike equal to the protection level, the sale of a call
23
option with strike equal to the protection level, the purchase of a quantity (equal to the
PU) of up and out call options, with strike equal to the participation level, barrier equal to
UB and a possible rebate, and the purchase of a quantity (equal to PD) of down-and-out
put options, with strike equal to the initial level, barrier equal to DB and a possible rebate.
Express Protection
The Express Protection represents a capital protected variation of the Express Certificate.
This product allows to receive the payment of a premium, that increases over time (a
feature know as memory effect), upon occurrence of a predetermined event (trigger). In
such a case, the early redemption of the capital takes place (autocallability).
The product is characterized by:
• Initial Level (S0)/Strike (K): the value of the underlying asset on the fixing date and
coinciding with the strike of the certificate
• Protection Level (PL): minimum amount guaranteed at maturity, regardless of the
price of the underlying asset and expressed as a percentage of the invested capital
• Trigger (T): a predefined level of the underlying, usually coinciding with the strike,
whose achievement on one of the observation dates activates the payment of the
premium and the early redemption clause
• Premium (P): a predefined amount payable if the trigger is activated. The memory
effect ensures that the premium paid at every observation date is increasing,
depending on the number of observations already carried out, hence at the nth
observation the premium paid amount to n x P
• Multiple (M): quantity of the underlying asset controlled by each certificate
Differently from other types of securities, an investor in an Express Protection must not
consider the payoff at maturity but he/she will need to consider intermediate
observations as well. At the first observation date if the price of the underlying asset is
above the Trigger, the premium will be paid, and the certificate expires, i.e. the capital will
be redeemed because of to the autocallability feature. In all other cases, no premium is
paid, and the certificate goes on to the next observation date when the same evaluation is
made. At maturity if the underlying level is above the trigger, the investor receives the
invested capital and an amount comprising all the unpaid premiums. If the underlying is
below the protection level, the certificate pays a minimum guarantee level, whilst if it is

24
between the trigger and the protection level, the certificates pays an amount equal to the
value of the underlying multiplied by M.
In analytical terms:
𝑃𝑎𝑦𝑜𝑓𝑓𝑇 = {𝑃𝐿 × 𝑉𝑁, 𝑆𝑇 × 𝑀,
𝑃𝐿 × 𝑉𝑁 + 𝑛 × 𝑝,
𝑆𝑇 < 𝑃𝐿 𝑃𝐿 ≤ 𝑆𝑇 < 𝑇 𝑆𝑇 ≥ 𝑇
(5)
The Express Protection payoff can be obtained with the following combination: the
purchase of a zero-strike call option and a put option both with exercise price equal to the
protection level, the sale of a call option with strike at K and the purchase of a stream of
European binary options, with maturity matching the observation dates of the certificate
and payoff equal to the Premium (which is different at each date because of the memory
effect).
3.2 Yield Enhancement
Yield enhancement products are designed without unconditional capital protection and
with capped upside participation. They offer periodical returns strengthened by
conditional or unconditional coupons. They represent prudential products that aim to
generate a high return relative to bond yields; the risk may become comparable to their
underlying asset(s) in case of adverse market conditions (Bluemke, 2009). In this category
we find Discount, Express, Cash Collect and the variants with the cap of Bonus and
Outperformance certificates.
Discount
Discount Certificates belong to the category of yield enhancement products and are
financially equivalent to the purchase of the underlying asset at a discount, that is at a
lower price with respect to price available on the market. This implies a higher
performance of the certificate than that of the underlying asset. And it allows to obtain
positive returns in cases of small negative performances of the underlying. This advantage
is compensated by the presence of a cap, i.e. the investor does not participate to the upside
performance above a predefined level.
The key elements of this certificate are the Strike/Initial Level (K), the Cap (C),
representing the level of the underlying above which upside participation is capped, and
the Multiple (M).
25
At maturity we can have two possible scenarios, depending on whether the
underlying is above or below the cap. If it is below, the certificate linearly follows the
performance of the underlying, even if the discount provides a partial hedge. In particular,
between the discount price and the cap, the direct investment brings a loss which instead
corresponds to a lower profit for the buyer of the certificate.
The payoff function is the following:
𝑃𝑎𝑦𝑜𝑓𝑓𝑇 = { 𝑆𝑇 × 𝑀, 𝑆𝑇 < 𝐶 𝐶 × 𝑀, 𝑆𝑇 ≥ 𝐶
(6)
An investment in this type of certificate generates losses only below the strike level,
although they are lower than those born by an investor who investment in the underlying,
as in the previous case. On the other hand, in a bullish market, the certificate is penalized
above the break-even price, obtained by summing to the cap the discount offered to the
buyer of the certificate.
The Discount certificate is the result of the following combination of European call
options: the purchase of a zero-strike call option (equivalent to an investment in the
underlying asset) and the sale of a call option with strike price equal to the cap, to delate
the upside participation to the underlying performance above this level.
Cash Collect
Cash Collect certificates are characterized by a stream of conditional periodical coupons
and a capital protection which depends on the level of the underlying at maturity (it
should be above a predefined barrier level).15 The coupons are conditional because the
payments are made only if the underlying asset is above a predefined level. In the
autocallable variation of the Cash Collect the certificate expires before maturity if on the
early observation dates the value of the underlying is greater or equal than a
predetermined trigger level, usually coinciding with the initial level.
The main elements of a Cash Collect certificate are:
• Initial Level/Strike (K): underlying level, defined before the issue, from which
intermediate levels are defined
• Additional Amount Level (AL): level of the underlying (usually the same as K), if
exceeded on the valuation dates determines the payment of the additional amount
15 Usually Cash Collect certificates are built with an European style barrier, i.e. the barrier is observed only at maturity. However, there are some variations with the American barrier feature, in which the barrier is monitored for the whole life of the certificate.
26
• Additional Amount (A): periodic cash stream payable, on the valuation dates, if the
underlying is above the additional amount level
• Barrier Level (B): underlying level that if not violated at maturity ensures the
repayment of the capital
• Multiple (M): amount of the underlying controlled by each certificate
At maturity the possible outcomes are two: if the barrier is not violated the certificate
repays the capital originally invested, whilst if the underlying closes below the barrier the
investor participates to the negative performance of the underlying. What is more, the
investor has the possibility to receive periodical coupons on the intermediate observation
dates and at maturity. Those amounts concur to define the overall performance of the
product.
In analytical terms the profit function at maturity is the following (assuming B=AL):
𝑃𝑎𝑦𝑜𝑓𝑓𝑇 = { 𝑆𝑇 × 𝑀, 𝑆𝑇 < 𝐵
𝐴 + 𝑃𝐿 × 𝑉𝑁, 𝑆𝑇 ≥ 𝐵 (7)
The Cash Collect can be structured with a combination of a long zero-strike call option, a
long European down-and-out put option, knocking out at the barrier level and with
exercise price equal to the strike (for conditional capital protection), short a call option
with strike equal to K (capping the potential upside) and long a stream of digital calls.
These exotic options are needed to generate the conditional coupons offered to investors
and hence they must have maturity matching the different valuation dates (and maturity)
and an exercise price equal to the additional amount level.
Depending on the maturity and the payment frequency of the coupons, a Cash Collect
can used for a short or medium-term investment strategy. Indeed, the certificate can be
structured with a maturity of twelve months and monthly or quarterly coupons, or with a
2 or 3-year maturity and semiannual or annual coupons.
Cash Collect certificate can have as underlying a single asset or a basket of securities.
If a certificate has as underlying a basket of stocks, on the observation dates for the
conditional coupons, for the early redemption, and on the final valuation date the
valuations of the underlying will be made considering as underlying reference value the
weighted average of the values of all the stocks comprised in the basket, as it is shown in
the following equation:
∑ 𝑤𝑘
𝑛
𝑘=1
𝑆𝑘,𝑇
𝑆𝑘,0 (8)

27
Where n is the number of stocks included in the basket, wk the weight of the kth
component, Sk,T the price of the kth component at date T and Sk,T the price of the kth
component at the initial valuation date. The most used types of certificates on a basket of
stocks are the constant weights, worst of and best of. In the constant weight version, the
weights are determined before the issue and remain constant for the whole life of the
certificate. The worst of version instead gives a weight of 100% to the stock with the worst
performance in the timeframe considered, whilst the other components are not
considered. The best of version gives to the top performer a weight of 100% and to all
others a weight of zero.
Express
Express Certificates are like Cash Collect, except from two elements: the autocallability
feature and the memory effect. This product indeed pays a premium if the trigger event is
verified on the observation date. Differently from the Cash Collect however, the
occurrence of the trigger event determines the early redemption of the certificate.
Besides, if the trigger event is not verified on the first observation date, on the nth
observation date the additional amount will be equal to n-times the first premium
(memory effect). The main advantage of this certificate is given by the opportunity to
make an interesting profit in a short period of time. Indeed, it suffices that the underlying
price remains stable around the level it had at the fixing of the certificate to obtain the
early redemption together with a very attractive coupon.
The elements characterizing this type of certificate are:
• Initial Level/Strike (K): underlying level, defined before the issue
• the Trigger (TR): predefined underlying level, usually coinciding with the
strike, activating the payment of the premium if reached on the observation
dates
• the Premium (P): predefined amount payable on the premium payment dates
if the trigger is activated. Thanks to the memory effect, there is the possibility
to recover the premiums not paid during the life of the certificate.
• the Barrier (B): level of the underlying that if not reached allows to receive
the invested capital at maturity
• the Multiple (M): quantity of the underlying asset controlled by the certificate

28
In the case of Express certificates, the redemption does not occur necessarily at maturity.
To analyze the profit function, it is useful to start from the first observation date. On this
date if the underlying level is above the trigger the certificate pays the premium and it
ceases to exist, repaying the nominal value. If this is not the case, the certificate does not
pay any premium and continues to the next observation date. If no early redemption
occurs, at maturity we can have three different scenarios: if the underlying is above the
trigger the certificate pays the nominal value plus the n premiums. If instead the
underlying level is between the trigger and the barrier, the investor sees its capital
protected as he/she receives the nominal value originally paid. However, if the price of
the underlying asset is below the barrier, the investor lost his/her capital protection and
participate in the negative performance of the underlying.
In analytical terms:
𝑃𝑎𝑦𝑜𝑓𝑓𝜏 = {0, 𝑆𝜏 < 𝑇𝑅
𝑉𝑁 + 𝜏 × 𝑝, 𝑆𝜏 ≥ 𝑇𝑅 (9)
If no early redemption occurs, at maturity we have:
𝑃𝑎𝑦𝑜𝑓𝑓𝑇 = { 𝑆𝑇 × 𝑀,
𝑁𝑉,𝑁𝑉 + 𝑛 × 𝑝,
𝑆𝑇 < 𝐵
𝐵 ≤ 𝑆𝑇 < 𝑇𝑅 𝑆𝑇 ≥ 𝑇𝑅
(10)
The financial structure of an Express is similar to that of the Express Protection, except
from the fact that the put option purchased is not a plain vanilla. Indeed, it is a down-and-
out put option, which is cheaper than a plain vanilla put and therefore it allows, ceteris
paribus, to acquire digital calls that pay a greater sum of money.
3.3 Participation
Certificates belonging to this category participate in the positive performance of their
underlying asset(s) and can have no, or only conditional, capital protection.16 All the
products analyzed in this thesis are mostly equity based, however it must be said that they
can be based on any underlying asset. This category includes products with a more
speculative feature than those belonging to the categories previously described, and
therefore, they are less common among retail clients. The most common are: Bonus,
Airbag, Twin Win, Outperformance and Tracker Certificates.
16 Please note that this feature is different to the capital protection granted to the first category analyzed before, for which the protection is unconditional.
with 𝜏 = 1, 2, …, n
29
Bonus
Bonus Certificates are one of the most common participation products. The certificate
does not offer full capital protection, even if some technical measures allow to limit the
probability of losses. However, in the worst scenario the performance is equivalent to that
obtained by the underlying asset.
In their standard version, Bonus certificates give the possibility to participate
linearly and without any cap to the upside performance of the underlying asset, allowing
at the same time, in cases of poor performances or even slightly negative ones, the
payment of a bonus (from which the name of the instrument), provided that, during the
life of the certificate, the underlying asset does not violate on the downside a predefined
level (also known as Barrier Level). In this case, the certificate loses its benefits
instantaneously when the barrier is touched (Barrier Event) and from that moment
onward it linearly replicates the performance, positive or negative, of the underlying. The
barrier can be of two types: continuous barrier (American) or discrete at maturity
(European). The first relevant difference between the two different monitoring methods
of the barrier is observed during the structuring phase. When structuring a bonus, the
choice of the type of the barrier has a significant impact on the characteristics of the
certificate. For instance, let’s consider a Bonus with an American style barrier, with a given
price and bonus. The same certificate with discrete monitoring of the barrier at maturity
would be more expensive. To obtain the same price we need to reduce the bonus or
increase the barrier level. Moreover, the choice of the type of the barrier generates
differences in the pricing of the strategy before maturity (delta and vega) as well.
The key elements of the certificate are the Initial Level/ Strike (K), the Barrier Level
(BL), the Bonus (B) (expressed in percentage points), paid at maturity if the asset has not
touched the barrier, and the Multiple (M). Considering the payoff function of a Bonus
Certificate, at maturity, if the barrier has not been touched, there are two possible
scenarios: if the performance of the underlying is greater than the Bonus, the certificate
linearly replicates the underlying, whilst if the underlying performance is greater than the
barrier but smaller than the bonus level, the certificate pays the bonus and the capital
originally invested.
If the barrier is touched during the life of the certificate, the Bonus becomes a
Tracker certificate (analyzed in what follows), losing its bonus and capital protection. It is
important to highlight that a barrier event occurring does not necessarily imply a negative

30
performance for the certificate, since from that event to maturity the asset could recover
and close above the strike.
In analytical terms, at maturity if the barrier has not been violated during the lifetime
of the certificate we have:
𝑃𝑎𝑦𝑜𝑓𝑓𝑇 = {
𝑆𝑇 × 𝑀,𝑁𝑉 × (1 + 𝐵),
𝑆𝑇 × 𝑀,
𝑆𝑇 < 𝐵𝐿 𝐵𝐿 ≤ 𝑆𝑇 < 𝑁𝑉 × (1 + 𝐵) 𝑆𝑇 ≥ 𝑁𝑉 × (1 + 𝐵)
(11)
whereas if the barrier has been touched before maturity the certificate pays 𝑆𝑇 × 𝑀.
To structure a Bonus the combination of a zero-strike call option and a down-and-
out put option is required.17 Besides, if the upside participation is higher or lower than
100%, the purchase or sale, respectively, of a number of call options with exercise price K
would be required. From the point of view of an investor, a Bonus certificate on stocks or
indexes should have a short maturity, ranging between one and two years.
The great success of Bonus certificates is demonstrated by the number of offered
products. On the market there are different version, the most common are:
• Bonus Cap: in this version the participation of the certificate to the positive
performance of the underlying asset is capped thanks to the sale of a call
option. The strike of this option is set at the level that we want to “cap”.
• Top Bonus: differently from the standard version of the Bonus the barrier is
discrete at maturity, that is the essential condition to receive the Bonus is that
the underlying, at maturity and only on this date, is above the Barrier Level.
The certificate is not path-dependent because the evolution of the price of the
underlying is not relevant for the payment of the Bonus. Indeed, in this
version if the underlying drops below the barrier before maturity and then
recovers, the right to receive the Bonus does not vanish.
• Bonus Plus: a Bonus certificate with a discrete monitoring of the barrier at
maturity that allows to receive an unconditional bonus paid at maturity. The
issue price (usually 100 euros) is redeemed at maturity if on the final
valuation date, the underlying value is above the barrier level. Otherwise the
certificate replicates the negative performance of the underlying (the bonus
is paid in any case).
17 Another way to structure the certificate is to go short a down-and-in put option and long a call option with a contemporaneous money-market investment. The strike of the two options would be set at the same value equal to 1 + 𝐵.
31
• Reverse Bonus Cap: this version allows to participate to the negative
performance of the underlying stock or index up to a maximum level (Cap),
paying a premium, Bonus, if the underlying value has been stable or has
dropped slightly. The condition to receive the bonus is that the underlying
price does not touch the barrier level during the life of the certificate. If the
appreciation of the underlying is above this level, then the redemption value
will be inversely proportional to the performance of the underlying asset.
• Bonus Cap Worst Of: this version has the same functioning of a classical
Bonus Cap, with the only difference that the underlying is represented by a
basket of stocks. To receive the Bonus, none of the underlying asset must
reach its own barrier level during the life of the product. If one of the
underlying stock drops below its barrier, the redemption at maturity will be
linked to the worst performing stock comprised in the basket.
Twin Win
Twin Win certificates allow an investor to participate in the positive and negative
performance, within certain limits, of the underlying asset, hence the name, twin-win. The
differentiation from the Bonus certificate lies in the fact that instead of a bonus level, a
positive participation to the downside of the underlying asset is bought. They are also like
Double Win with capital protection, with the only difference being the presence of a
barrier, whose violation determines the loss of the relative benefits.
An investor should be willing to buy a Twin Win when on the market there exists a
version with an unconditional capital protection because the lower costs of an exotic put
option (for the Twin Win) with respect to a plain vanilla put option (for the Double Win)
implies a saving that can be reinvested in the purchase of other contracts, allowing to
increase the participation level, hence the expected performance of the Twin Win.
The certificate can be identified by the following essential elements:
• Initial Level/ Strike (K): predetermined level of the underlying asset before the
issue
• Barrier Level (B): predefined level of the underlying whose missed breach ensures
the liquidation at maturity of the absolute performance of the underlying, i.e.
negative performances are turned into positive ones.
• Upside Participation Factor (UF): measure of the participation in the positive
performance of the underlying, expressed in percentage terms

32
• Downside Participation Factor (DF): measure of the participation in the negative
performance of the underlying, expressed in percentage terms
• Multiple: quantity of the underlying asset controlled by each certificate
The structure of the Twin Win implies three possible different scenarios at maturity: if the
underlying level is above the Strike (K), the payoff is equal to the Nominal Value (NV)
augmented by the positive performance of the underlying, which could be weighted by
the upside participation factor. In a neutral scenario, when the underlying is between the
Strike (K) and the barrier (B), we can have two possible cases: if the barrier was not
violated, the investor receives negative performance in absolute value weighted for the
downside participation factor, whilst if the barrier was breached, the certificates becomes
a Tracker certificate, linearly replicating the underlying. If instead the underlying is below
the barrier level, the certificate records the same negative performance of the underlying
asset, repaying 𝑆𝑇 × 𝑀.
In analytical terms, if the barrier is not breached during the lifetime of the product,
at maturity we have:
𝑃𝑎𝑦𝑜𝑓𝑓𝑇 = {
𝑆𝑇 × 𝑀,𝑁𝑉 × |[(𝑆 − 𝐾 )/ 𝐾 ]| × 𝑈𝐹 + 𝑁𝑉,𝑁𝑉 × [(𝑆 − 𝐾 )/ 𝐾 ] × 𝑈𝐹 + 𝑁𝑉,
𝑆𝑇 < 𝐵 𝐵 ≤ 𝑆𝑇 < 𝐾 𝑆𝑇 ≥ 𝐾
(12)
The structure of a Twin Win requires the purchase of two down-and-out put options,
rather than one as in the Bonus, in addition to a zero-strike call option.
A variation of the classical Twin Win certificate is represented by the Twin Win
Autocallable that has, at maturity, the same functioning of the former, with an extra
autocallable clause, that allows the early redemption of the certificate in predefined dates
(early redemption dates) if certain conditions are met and at a determined liquidation
amount. Thanks to the callability option the investor has the opportunity to cash-in the
initial investment before the natural maturity of the certificate, receiving the capital
invested plus a premium that is already known at the moment of the subscription. In
particular, these certificates early redeem if on one early observation date the value of the
underlying is above its initial value; in case of early redemption the liquidation value is
equal to the invested capital, augmented by an amount defined since the issue for each
early redemption date. Therefore, the occurrence or not of an early redemption
determines the amount and the terms of the liquidation for the certificate.
33
Airbag
As the Bonus, the Airbag Certificate has an exposure to the performance of an underlying
asset with a certain amount of downside protection. Differently from the Bonus, at
maturity they do not have any discontinuity in their profit and loss function: the
protection continues below the protection level thanks to the airbag. What is more, the
amount to be repaid is defined at maturity, hence the path followed by the underlying
asset during the life of the certificate is not considered. Those considerations make the
Airbag Certificate an efficient investment option, above all if considered as an alternative
to a direct investment in stocks or stock indexes.
Airbag certificate are characterized by the following elements:
• Initial Level/ Strike (K): predefined initial level of the underlying
• Protection Level (PL): level of the underlying defining the protection at maturity
• Airbag Factor (AF): obtained dividing the strike (K) by the protection level (PL)
• Participation Factor (PF): measure of the participation of the certificate in the
upside of the underlying, expressed in percentage terms
• Multiple (M): the quantity of the underlying asset controlled by each certificate
The profit and loss function of an Airbag is simple. At maturity we can have three
scenarios: if the underlying ends above its initial level (K), the certificate replicates the
performance of the former. If the underlying value is below the strike but above the
protection level, the investor does not lose any of his capital regardless of the negative
performance of the underlying asset. If instead the underlying is below the protection
level, the certificate records a negative performance, mitigated by the existence of the
airbag.
In analytical terms:
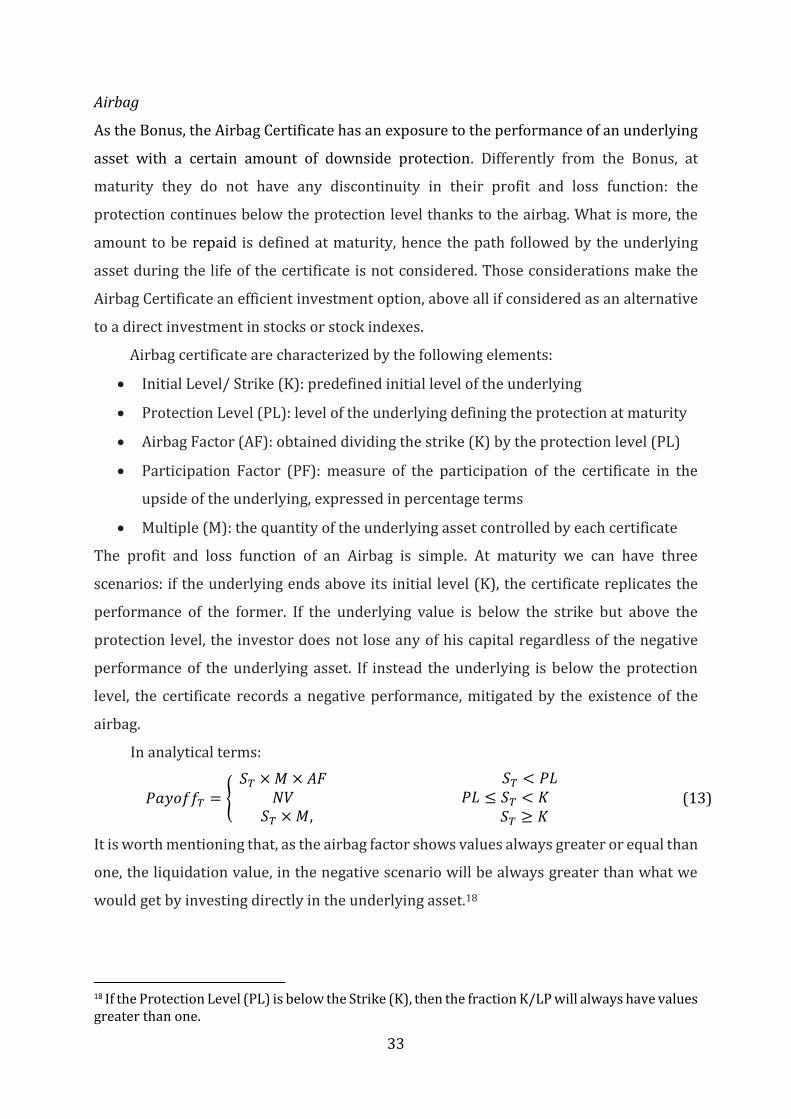
𝑃𝑎𝑦𝑜𝑓𝑓𝑇 = { 𝑆𝑇 × 𝑀 × 𝐴𝐹
𝑁𝑉 𝑆𝑇 × 𝑀,
𝑆𝑇 < 𝑃𝐿
𝑃𝐿 ≤ 𝑆𝑇 < 𝐾 𝑆𝑇 ≥ 𝐾
(13)
It is worth mentioning that, as the airbag factor shows values always greater or equal than
one, the liquidation value, in the negative scenario will be always greater than what we
would get by investing directly in the underlying asset.18
18 If the Protection Level (PL) is below the Strike (K), then the fraction K/LP will always have values greater than one.
34
As stated above, airbags are different from Bonus or Twin Win as their structure
does not include barriers that could be knocked-out in case of adverse market conditions.
The product includes plain vanilla European-style options only. It is structured by a long
zero-strike call option, a long put option with exercise price equal to K, short a quantity
(equal to the Airbag Factor) of put options with strike equal to the PL.19 Plus, if the upside
participation is higher or lower than 100%, the purchase or sale, respectively, of call
options with exercise price K would be required.
Tracker
Tracker certificates are structures that linearly replicate an underlying asset, usually
stock or stock indexes. In practice, trackers have as underlying excess return assets, like
a basket of stocks, or an index like the Eurostoxx50.20 In this case they represent a valid
option to invest in underlying assets, often characterized by high volatility, exploiting the
diversification effect incorporated in the notion of Tracker: this investment is not exposed
to the idiosyncratic risk associated with the purchase of a single asset, exposing to
systemic risk only.
Conceptually it is close to an investment in an Exchange Traded Fund (ETF), from
which it differentiates itself for a different exposure to the issuer risk and for the greater
fiscal efficiency, other than, in the specific, for the absence of periodic flows (dividends or
yields), found instead in an ETF. A Tracker is characterized by two factors only: Initial
Level/Strike (K) and Multiple (M) and can be structured with a long zero-strike call
option.
Please note that during its life a Tracker having as underlying an excess return index
tends to trade at a discount, that is at lower values than those it has at maturity. The value
of the certificate is discounted at an intermediate date of a value equal to the expected
dividends from that day until maturity, dividends that the holder of the certificate is not
going to receive and that however, contributes to decrease the value of the index at each
ex-dividend date.
19 if the upside participation is higher or lower than 100%, the purchase or sale, respectively, of calls with exercise price K would be required. 20 A total return index includes any dividends or yield, whilst an excess return index is ex-dividends, i.e. it does not include any dividends or yield. Please note that a total return index always overperforms an excess return index on the same underlying asset.

35
Eventually, it is worth noting that a change in realized or expected dividends has an
impact on all certificates having as underlying dividend paying stocks. Before the issue,
the structurer first discounts the future dividends expected to be paid during the life of
the product and then subtracts this value from the spot price. Therefore, the expected
dividends are comprised in the issue price of the certificate that will redeem at maturity
100% of the issue price. This means that the issuer, not the investor, is exposed to the
dividend risk, i.e. if the realized dividends will be lower than what expected the issuer will
make a loss and vice versa if dividends will be higher than what previously expected the
issuer will make a profit.
Outperformance
Outperformance certificates have no capital protection and offer the possibility to
participate more than proportionally to the positive performance of the underlying,
thanks to the so-called leverage effect, whilst replicating exactly the trend of the asset in
case of negative ones. Hence, they allow to amplify a positive move of the underlying
without an increase of losses in case of negative performance of the underlying asset.
Indeed, in negative market conditions an investor bears the same losses of those born by
a direct investment in the underlying.
The elements characterizing these certificates are:
• Initial Level/Strike (K): value of the underlying on the strike date, starting from
which upside participation begins to be computed
• Outperformance (Up Participation Factor) (UP): percentage measure of the
upside participation of the certificate
• Multiple (M): underlying quantity controlled by the certificate
At maturity, depending on the price of the underlying asset with respect to its initial value
(K) we can have two different scenarios.
In analytical terms:
𝑃𝑎𝑦𝑜𝑓𝑓𝑇 = {𝑆𝑇 × 𝑀, 𝑆𝑇 < 𝐾
𝑁𝑉 + (𝑆 − 𝐾) × 𝑈𝑃 × 𝑀 , 𝑆𝑇 ≥ 𝐾 (14)
The financial structure of an Outperformance is not complicated, comprising only
European call options exercisable at maturity. It is a combination of a long zero-strike call
option and a ratio of long at-the-money call options, the ratio depends on the difference
between the outperformance (UP) and 100%. This portfolio is financed by the level of

36
dividends of the underlying asset, and therefore the certificate is used with dividend
paying stocks or excess return indexes.
Two variations of this certificate are the Outperformance Cap and the
Outperformance Conditional Protection. The former has a higher upside participation
than the standard Outperformance, together with a cap to the positive performance. The
latter instead provides capital protection unless a barrier is touched during its life.21
4. The Behavior of Investment Certificates During their Lifetime
4.1 Options: An Essential Component of Investment Certificates
Options are at the heart of investment certificates. As stated before, investment
certificates are obtained as a portfolio of options and their price depends on the value of
each option included in this portfolio. A depth knowledge of the elements that
characterize every single option allows both to understand the choices made by an issuer
in terms of offered products, and to know in which way and to what extent the price of the
certificate is going to be affected by a change in one of the drivers of options valuation.
Options are derivative contracts which incorporate the right to buy (call) or sell (put) a
predetermined underlying asset at a predefined price (strike). Depending on when the
right can be exercised we can distinguish between American or European options. If the
right can be exercised every moment until maturity we are dealing with American options,
whilst if the right can be exercised only at maturity the option is European.22
With the term exotic options instead, we identify all options with a more sophisticated
payoff than that of plain vanilla options: this can refer both to the formation process of the
payoff over time and the configuration of the same at maturity. In general, these options
are traded over the counter between qualified counterparties. Their extensive use in the
construction of investment certificates can be explained by the need of higher flexibility
in the operational strategy of the issuers that thanks to these contracts can satisfy the
different preferences of investors, and by the possibility to trade certain types of exotic
21 The financial structure of an Outperformance Cap is the same to that of the standard version, plus short a call option with exercise price equal to the cap. The Outperformance Conditional Protection is obtained by adding to the standard version an at-the-money down-and-out put option. 22 Please note that a third type of option is the so-called Bermudan option. It is exercisable only on predetermined dates, typically every month.

37
options at a lower price than that of plain vanilla options. In the structuring of certificates,
the most used exotic options are barrier options and binary options.
Barrier Options
Barrier options are used in the structuring of many certificates, as for instance Bonus,
Express and Twin Win. They are characterized by two reference levels: the first is equal
to the traditional exercise price, at which it is possible to buy or sell the underlying asset,
the second is the barrier level: the option come into existence (knock-in) or ceases to exist
(knock-out) if this level is violated before maturity. Barrier options are options whose
payoff depends on whether the underlying asset’s price touches a predetermined level
during a certain time period (Hull, 2018). As seen in section 3, the most used barrier
option among the investment certificates structures is the down-and-out put option. This
option allows to guarantee the conditional protection of some typologies of certificates. In
fact, it protects the investor when the underlying asset records a negative performance
up to the barrier, but once this level is reached, the option “dies” and with it the capital
protection offered to the investor.
Barrier options are cheaper than plain vanilla options because after a predetermined
level of the underlying asset, their value becomes zero. This explains why we buy a down-
and-out-put rather than a plain vanilla put option that provides full capital protection in
case the underlying asset drops below the strike. If the probability of reaching the barrier
were equal to zero, the value of the two options would be the same.
Among the properties of barrier options there is one that makes them uncommon
and useful: in certain cases, the vega of these options is negative. When there is a barrier,
an increase in volatility does not represent only an advantage, because the higher
variability of the price of the underlying increases the probability of a knock-out as well.
In addition to the basic forms of barrier options a number of more exotic barrier options
exist on the market. Examples of such options are options with partial barriers, double
barriers, time-dependent barriers and compound barriers (Brockhaus et al., 1999).
Binary Options
Also known as digital options, they are the easiest class of exotic options. They present a
discontinuous payoff at maturity: they represent real bets on the fact that the price of the
underlying would reach or be above the strike. They differ from plain vanilla options for

38
the discontinuity in the payoff (in plain vanilla options the payoff is a continuous function
of the price of the underlying).
There exist different typologies of binary options: the most common are the cash or
nothing and the asset or nothing. Cash or nothing option represents the easiest type of
digital options: if the price of the underlying is above (below) the strike for a call (put),
the investor receives the payment of a predefined amount (X), otherwise the option
expires worthless.
The payoff function of a cash or nothing can be described as follow:
cash or nothing call = {0 𝑖𝑓 𝑆 ≤ 𝐾𝑋 𝑖𝑓 𝑆 > 𝐾
(15)
cash or nothing put = {𝑋 𝑖𝑓 𝑆 ≤ 𝐾0 𝑖𝑓 𝑆 > 𝐾
(16)
4.2 Option Pricing Models: A Primer
The correct pricing of options allows ex-ante to give a right price to the certificate, while
providing an efficient hedging ex-post. To this aim, the structurer can use different option
pricing models. The most used in practice are: Black & Scholes, Local Volatility and
Stochastic Volatility.
The model of Black & Scholes (1973) is the easiest and the most famous among
option pricing models. This model allows to derive the value of an European option
starting from the following inputs: implied volatility, spot price of the underlying asset,
strike price, maturity, expected dividends, and risk-free interest rate. All these factors will
be described in the following paragraph. This model is usually implemented for the
valuation of plain vanilla options, whilst not very common in the valuation of many exotic
options. Indeed, the hypothesis at the basis of this model are in contrast with the
characteristics of these options. For instance, the Black & Scholes approach does not
directly suit barrier option. Merton (1973) modified the model and derived a first
relationship to calculate the price of a down-and-out European call option. Later
Rubinstein and Reiner (1991) used the Merton formula on eight types of barrier options,
while Haug (1998) on all sixteen single types. Besides, Nishiba (2012) discusses a new
method for pricing exotic options in his work “Pricing Exotic Options and American
Options: A Multidimensional Asymptotic Expansion Approach”.
What is more, the Black & Scholes model prescribes that the volatility of the
underlying asset is constant over time and over all the strike levels, hypothesis that

39
represents a theoretical simplification. Empirically, we observe that among options with
different strike or maturity there is instead a different implied volatility. In the past, to
solve this inconvenient it was tried to introduce a variant to the model, using implied
volatility as a variable, but with poor results. Therefore, other models have been
developed.
The first step in this direction is the Local Volatility model. It allows to consider the
skewness without adding variability elements and it is the easiest way to take into account
the volatility skew and term structure.23 In this model, volatility is neither constant nor a
random variable, rather it is a function of the price of the underlying asset and time
(Gatheral, 2006). The process that allows to find this function is called calibration: it
consists of the analysis of implied volatilities of vanilla options to find a “rule” (the
function mentioned above), that makes consistent all the prices observed on the market
as described in Derman and Kani (1994). The model, once calibrated, can be used to value
different exotic options. However, Dupire (1993) comes up with an explicit formula that
derives the local volatility function, meaning that the model does not have to be calibrated
to market prices. This is the approach that is generally implemented by issuing banks for
the pricing of path-dependent options.
Stochastic Volatility models, Heston (1993) being the most famous, are the most
articulated because they start from assumptions closer to reality than the models
described before. In particular, in Stochastic Volatility models, volatility is neither
constant, as in Black & Scholes, nor a function of other parameters, as in Local Volatility.
It is considered instead, like the price of the underlying asset, as a random variable. This
approach has two advantages. Firstly, if volatility is a random variable, it must have its
own volatility that the model allows to compute. We are talking in this case of volatility of
volatility or vol-of-vol. Some derivatives show a non-linear sensitivity to volatility, i.e.
there is a non-zero second-order price sensitivity (or convexity) to a change in volatility.
We are talking in this case of Vega Convexity. Vol-of-vol allows to consider Vega convexity.
(Bouzoubaa and Osseiran, 2010). Secondly, stochastic models do generate forward skew,
that is the skew of an option that starts on a future date t(1) and ends at t(2). The options of
this type, that have a high sensitivity to the skewness, would not be correctly priced with
23 The term structure shows how the maturity date of an option will change the implied volatility over time, while volatility skew refers to fact that options on the same underlying asset, with different strike prices, but which expire at the same time, have a different implied volatility.

40
the two models previously described. Stochastic Volatility models, instead, are able to
generate a coherent computation of the forward skew, allowing consequently to value in
a more accurate way these types of options.
4.3 Variables at Stake
As described by Black and Scholes (1973), if at maturity the value of an option coincides
with its intrinsic value, in every moment before this date, instead, the price of an option is
a function of different variables: underlying asset price, strike price, volatility of the
underlying, maturity, risk-free interest rate, and dividends.24 All these factors (except the
strike) represent a potential source of risk (and return) and to each of them synthetic
indicators, also known as sensitivity coefficients or Greeks, are associated (Figure 6
provides a definition of the most common greeks). These parameters allow to measure
the variation of the value of an option corresponding to a change in one of the risk factors,
keeping all the others constant.25 The theoretical value of a Certificate is computed by
banks with pricing models that have as inputs these factors.
The price of the underlying asset is the main risk factor influencing the price of an
option (hence a certificate). The delta of an option measures the variation of the option
price for a given change in the price of the underlying asset, and from a mathematical point
of view it is computed as the first derivative of the option price with respect to the
underlying asset price.26 As it can be seen in Figure 8, the delta of a call option is a positive
number between 0 and 1, whilst that of a put is a negative number, ranging from -1 and 0.
The value of delta is affected mainly by the spot level and time to maturity. Figure 7 plots
24 The premium of an option has two components: intrinsic value (IV) and time value (TV). The former is the value obtainable today from the implicit right of the option. If the option is American: IV = Max [S - E, 0] for the call, whilst IV = Max [E - S, 0] for the put. Time value is the second component of the premium: for out of the money options it coincides with the value of the “hope of exercise”, while for in the money options it coincides with the value of the right to abandon. Time value is maximum for at the money options. 25 Greeks can be computed both with an analytical procedure and with a numerical procedure (for both methods we need an option pricing model). The former approach consists in the computation of the first derivative of the option price (given by the model equation) with respect to the parameter whose sensitivity is being measured. It is standard practice however to compute the greeks by changing the considered risk factor in the pricing method of a certain amount and then computing the difference between the new value of the option and the initial one. 26 The delta of an option is represented by the steepness of the slope: a payoff line of 45° implies a delta of 1. To compute the delta of a certificate, we need to draw a tangent line to the desired point on the payoff line: the delta is the slope at that point. A horizontal line indicates a point where participation is zero whilst a vertical line implies an infinite delta. We have infinite participation where the barrier of a in or out option is located or where the strike of a digital option is set.

41
the delta of an in-the-money call (assuming a 100% strike and asset’s price of 110%) and
the delta of an out-of-the-money call (assuming 100% strike and asset’s price of 90%) as
a function of time to maturity. The delta of the ITM call is 73% at the beginning and that
of the OTM call is 43%. Both figures are stable at the beginning, and only when around
40% time to maturity is left they start to move to their final values. This behavior of the
delta explains why the mark-to-market of investment certificates do not behave as
implied by their final payoff diagrams before expiration. Indeed, at maturity, the delta of
an option can be either 1 (or −1 for puts) if the option ends up in-the-money or zero (for
both calls and puts) if it is out-of-the-money. And therefore, at maturity the final payoff
diagrams of investment certificates is made of straight lines with sharp angles, whilst
before maturity we see instead smooth lines. The risk-free interest rate and dividends
play a minor role in determining the value of delta, even if they are needed to compute the
forward price of the underlying asset.27 The value of delta is also considered as the
probability that the option ends in the money (N(d1) in the Black & Scholes model).
The second sensitivity coefficient linked to the underlying price is gamma. It
measures how delta changes for a given change in the price of the underlying. It is
important to compute it because there exists a risk factor defined of second order and
determined by the presence of a non-linear relationship between the price of the option
and that of the underlying and hence non-perfectly detectable by delta that assumes
instead a linearity between these two values. We say that gamma increases the knowledge
of delta, avoiding a static view of the latter. It is computed as the second derivative of the
option price with respect to price of the underlying and it is positive for an option buyer.28
Volatility is a statistical indicator measuring the variability of the returns of the
underlying with respect to their average value. This factor constitutes one of the
indicators employed to measure the risk of an investment. We can measure volatility ex-
post, computing the standard deviation of the daily returns recorded in the past (historical
27 The formula for the forward price in case the underlying pays a continuous dividend yield is the following: F = Se(r−q) τ. 28 As a measure of risk, gamma is influenced by the variation of the other parameters as well, in particular by the time to maturity and volatility. For at the money options, gamma sharply increases with the passing of time because the delta becomes discontinuous close to maturity and jumps from 0 to 1 (call) just because of a small movement in the underlying price; if the option is out the money or in the money instead gamma decreases progressively with the passing of time, converging rapidly to 0. If the option is at the money, gamma decreases if volatility increases and increases up to infinite if volatility decreases, differently from what happens for out and in the money options.

42
volatility), or we can measure that expected by the market in a determined time horizon
by finding the value that makes the theoretical price (obtained through an option pricing
model) equal to the market price of an option. Empirically, it has been shown that
volatility is not constant over time, even though, as stated before, in the Black & Scholes
option pricing model it is assumed to be constant. The price of an option is linked in a
positive way to volatility, in the sense that an increase in the latter determines an increase
in the value of the option. Vega measures the sensitivity of the value of the option to
changes in implied volatility. In analytical terms it is computed as the first derivative of
the option price with respect to implied volatility and as stated before, it has a positive
value for plain vanilla options. Therefore, if an equity investor does not see volatility as a
positive concept, one who buys plain vanilla options sees volatility has one of his/her best
allies. Vega is maximum for at-the-money options and it is positively correlated to the
maturity of the option, i.e. the longer the maturity the greater the variation of the option
value following a change in implied volatility.
For an investment in certificates, without caps and barriers, an increase in implied
volatility determines an increase in the value of the selected product, because, in this case,
the investor has bought volatility. The presence of barriers in the structure of the
certificate modifies what has been just said: the possible volatility increase produces a
higher probability of hitting the barriers and hence of losing the capital protection
foreseen at its issue, if the barriers are set below the strike price. Generally, an increase in
the volatility of the underlying generates a reduction in the value of the certificate for
products such as Bonus, Airbag, Express, Cash Collect, and Twin Win. However, the
departure from the barriers and the approximation of the maturity of the certificate
contribute to decrease this type of behavior. Vice versa, a reduction in volatility
determines an increase in the market value of these certificates.
Even if all the inputs of the pricing method remain constant from a moment of time
to another, the price of an option changes. Theta expresses the effect of the passing of time
on the option value. It is positive for an option seller and negative for an options buyer,
because the passing of time, ceteris paribus, reduces the probability associated to a change
in the underlying and volatility. The configuration of theta for a certificate can be very
different depending on the type of contract. The problem lies in the fact that the passing
of time can affect: time value only (e.g. options on Bund Future), time value and intrinsic
value (e.g. options on non-dividend paying stock). In the first case the effect is more

43
symmetric. The passing of time can generate, depending on the product and the
underlying level, a reduction or an increase in the value of the certificate. The presence of
barriers and caps allow to be positively exposed to time decay.
The risk-free interest rate (usually identified with the Euribor/Swap rate on the
maturity of the option) is used to compute the forward price of the underlying asset. An
increase in the interest rate, ceteris paribus, tends to increase the forward price and hence
the value of a call option, whilst decreasing the value of a put option. Therefore, rho, that
measure the sensitivity of the option price to changes in interest rates, is positive for call
options and negative for put options. However, the variations of interest rates affect the
value of certificates not always in an intuitive way and to a limited extent compared to
what happens for volatility. What is more, if the certificate has the quanto feature, that is
if it offers protection to the exchange rate risk, the combined dynamic of the interest rates
of the Euro Zone and of that in which the underlying is denominated must be considered
to compute the value of the certificate. 29
The stream of dividends always constitutes a source of income relevant for equity
investors. The exposure to this asset class in an indirect way, i.e. through derivatives,
deprives of these streams the investor. Besides, dividends distribution causes a
(theoretical) reduction in the price of the underlying stock/index on the ex-dividend date
and this event naturally affects the price of the options: a higher dividend implies a
reduction of the call option price and an increase of the put option.
For basket options, the implied correlation between the underlying risky assets must
be considered as it influences the value of those options.30 The linear relationship
characterizing the movements of the returns of the various underlying asset included in
the basket is important. If two assets have a similar price behavior their correlation will
be close to 1, while if their prices diverge in a symmetric way the correlation will be equal
to -1. This variable is not stable over time and changes with the implied volatility. A higher
correlation can determine an increase in the value of multi-asset certificates with the
“worst-of” feature and on the other hand a lower correlation decreases their value. In
29 The term “quanto” derives from “quantity adjusted option”. A quanto option is an option in which the underlying asset is denominated in one currency (e.g. US Dollar) but the derivative itself is settled in another currency (e.g Euro) at a predefined exchange rate. 30 Options whose payoff depends on the value of a portfolio, that is a basket of assets.

44
these cases, the value in the implied correlation of two assets is transformed into higher
coupons or bigger discounts.31
In the following paragraphs the behavior of the mark-to-market of an equity
protection and a bonus certificate during their lifetime is presented. The examples have
been obtained using the closed form equations of Black & Scholes for plain vanilla options
and the formula proposed by Haug (1999) for the down-and-out put option.
4.4 Equity Protection
As stated before, thanks to the put-call parity, the payoff of an equity protection at
maturity can be obtained either with a long zero-strike call option and a long put option
or with a zero-coupon bond and a long call option. For illustration purposes I analyze an
Equity Protection with 100% participation and 100% capital protection, using as
underlying the EuroStoxx 50 Index. The implied volatility and the dividend yield of the
former are obtained from Bloomberg (13% and 4% respectively) while the risk-free rate
is assumed to be 2%. Figure 9 plots the mark-to-market of the certificate as a function of
time to maturity and price of the underlying asset. There are five lines, each line
corresponds to a different period during the time of the certificate: at issue (green line),
with 70% time remaining (violet line), with 50% time remaining (yellow line), with 25%
time remaining (red line) and maturity (blue line).
It can be observed that the delta for the certificate is positive, implying a positive
relationship between the price of the underlying and that of the certificate. However, the
behavior of the mark-to-market of the equity protection over time depends on the
moneyness of the product. When the product is out-of-the-money, the call is practically
worthless, and the certificate tends to its bond floor. In this area, the passing of time has
a positive impact on the certificate’s price (theta is positive). Around the at-the-money
point we observe a similar behavior at the beginning of the product’s life because the value
lost for the call is smaller than the interest gained on the zero-coupon bond. However, this
behavior changes after a point in time, i.e. theta becomes negative and the payoff lines
move back towards the blue line. This can be explained by the fact that from that moment
onward the time value of the call decreases at a faster rate than the interest gained on the
bond.32
31 These conclusions are inversely valid for “best-of” options. 32 Please note that this is true for the great majority of certificates where the interest rate level of the zero-coupon bond is medium to high but not for extremely low levels (e.g JPY bonds).

45
An Equity Protection is long volatility. This means that an increase in implied
volatility increases the value of the certificate. Figure 10 is obtained by shifting volatility
from 13% to 21%. Compared to figure 9, certificate’s value is increased, and the lines are
now steeper. Besides, it is worth mentioning that now the index can fall by over 10%
before the certificate’s value declines below the strike. This is relevant for investors
because usually the implied volatility spikes in times of crisis, i.e. when prices fall: in such
a case, the decrease of the underlying asset price is partly offset by a gain in the implied
volatility of the option.
The interest rate level influences both the price of the embedded zero-coupon bond
and that of the call. However, the impact on the option price is smaller than that it can
have on the bond value. In general, when interest rates rise, bond prices fall and vice versa.
Plus, zero-coupon bonds have the greatest sensitivity to changes in interest rates
(duration coincides with remaining time to maturity).33 Considering that usually the zero-
coupon bond has a weight of 80% or more on the product’s value, any change in interest
rate has a great impact on the certificate. In figure 11 the effects of an increase in interest
rates can be observed: by shifting the interest rate level from 2% to 4%, the whole
certificate’s value has dropped significantly. Whilst the bond price decreases linearly in
all points of the graph (horizontal shift of the bond component), the effect on the call value
depends on its moneyness. Indeed, when the call is far out-of-the-money the impact of a
change in interest rates on the equity protection is greatest, while when the call is deep
in-the-money, an interest rate shift is less effective. Eventually, when there is a change in
expected dividends, the call option is negatively affected. Hence, the overall effect on the
certificate value is negative.
4.5 Bonus
The Bonus certificate considered is constructed with a 10% bonus and an 80% barrier,
while all the other inputs coincides with those of the equity protection described above.
These data are used for the payoff diagrams explained in what follows. The variables with
a higher influence on the Bonus are the price of the underlying, implied volatility and
dividends. It is important to note that the Bonus is the certificate with the greatest
difference between the mark-to-market value and its payoff at maturity: at the issue the
33 The duration of a bond is the weighted average maturity of a bond’s cash flows. Since a zero-coupon bond pays only one cash-flow at maturity, its duration always equals its maturity.
46
delta of the product is almost 1. Indeed, in Figure 12 the mark-to-market of the certificate
at the issue date (green line) is almost a 45° straight line. This means that the down-and-
out put option, providing the bonus and the protection to the certificate, gives a small
contribution to the price development of the certificate at inception. However, it can be
seen in Figure 12 that as times goes by the intermediate lines move closer to the blue line,
representing the final payoff at maturity, that is the certificate starts behaving like the
final payoff line only after most of its lifetime has passed. This behavior can also be
explained in a different way. At the issue date, variations in the price of the underlying do
not have a significant effect on the down-and-out option value. Indeed, when the
underlying asset’s price increases, the down-and-out put loses in intrinsic value but at the
same time it is less probable that the barrier will be touched. On the other hand, when the
underlying value decreases, the put intrinsic value increases but the underlying is closer
to the barrier, and the chances that the it will be touched are higher. This behavior is better
exemplified in Figure 14, that shows the delta of a down-and-out put option as a function
of the underlying price. Although we are dealing with a put option, close to the barrier the
delta is positive because if the price of the underlying asset increases it is true that we are
less in-the-money, but it is also true that we are moving away from the barrier, decreasing
the chances that the option will be exercised worthless. The higher the price of the
underlying, the lower the influence of the barrier on the price of the option and delta turns
negative as with plain vanilla put options.
Besides, it is worth noting the behavior of the delta of the certificate around the
strike. In Figure 12, all the payoff lines become steeper around the knock-out level (80%
of spot) and the delta assumes values greater than 100% as it is clearly verifiable in Figure
15. Therefore, for a given change in the underlying price the certificate value increases or
declines more than proportionally: there exists a leverage effect that depends on the
remaining time to maturity and the distance between the barrier and the underlying value
(the payoff lines tend to a vertical asymptote the lower those two values become).
The impact of a change in implied volatility is not easy to analyze because of the
presence of the down-and-out put option. We need to consider many variables, but
generally, the longer the maturity, the greater the impact of the implied volatility on the
certificate’s value. Usually an increase in implied volatility corresponds to a reduction for
the mark-to-market of the certificate, but this is not always true as it will be explained in
what follows. Figure 13 has been obtained by increasing volatility from 13% to 21%. As it

47
can be seen, the payoff lines are less sinuous, i.e. their curvatures are less pronounced.
Between the barrier and the strike all payoff lines are lower because the probability of
violating the barrier is higher, in other words, the vega of the certificate is negative around
the barrier. Indeed, in this area vega represents a great risk because an increase in implied
volatility can determine a violation of the barrier. Above the strike of the certificate
instead the payoff lines of one-year and 0.5 year remaining to maturity seem to be higher,
because considering the time left to maturity and the distance of the underlying price to
the barrier the probability of a knock-out decreases and the model assumes that the
barrier will not be violated, Hence, an increase in volatility can only have positive effects
on the value of the certificate. Eventually, below the barrier the situation is easier because
once the barrier has been touched the down-and-out option ceases to exist and the
certificate is not affected anymore by volatility (only the zero-strike call remains),
transforming itself in a delta 1 product.
Dividends are essential because in their absence the structuring of some certificates
would not be possible, bonus included. Dividend amount and payment date have a strong
effect on the price of the zero-strike call: an increase in the dividend yield decreases the
forward price and the zero-strike call becomes cheaper, allowing to invest more money
on the purchase of the put option. A more expensive put with a lower barrier can be
bought. In the extreme case, when the dividend yield is so high (19% in our example) that
the barrier can be set at zero, the bonus becomes an equity protection. After the issue, an
increase in dividends has a negative impact on the certificate value.
To conclude, it is important to note that the two examples above are two of many
possibilities to structure an equity protection and a bonus certificate. I decided to
illustrate two “classical” examples that have a similar structure to those most seen in the
market place. Therefore, what stated above may not hold for certificates structured in a
different way and with different features.
5. A Comparison with other Financial Assets
After having analyzed all the main characteristics of Investment Certificates, I proceed
with a useful comparison with other financial securities typically selected in the
implementation of a portfolio by investors or asset managers. The selected assets are:
bonds, stocks, ETFs, and mutual funds. The purpose of this analysis is to highlight the main

48
advantages and drawbacks of Investment Certificates with respect to the other financial
assets considered. To perform this analysis, I use the following four drivers:
• Diversification
• Management fees
• Transaction costs
• Taxation
5.1 Certificates, Stocks and Bonds
The issuer of stocks and bonds establishes with the underwriter a relationship that
enables the investor to receive an interest agreed by contract (bonds) or dividends in case
of profits (stocks).
Stocks or bonds are financial asset issued by a company to raise funds. They qualify
themselves as an investment alternative by nature non-diversifiable: to invest in a single
stock or bond means on one side to be exposed to the volatility of the stock or interest
rate, without the benefit of compensatory mechanisms, and on the other to concentrate
the exposure risk to negative events related to the issuer. A person investing exclusively
in these instruments will have to build a portfolio with many different assets, each
representing a small percentage of the whole portfolio, and with a low correlation level.
Besides, if many instruments are issued by the same entity, an investor needs to avoid
concentrating his/her investments in those assets.
Investment Certificates share with stocks and bonds this source of risk, i.e. issuer
risk. On the other side, the possibility for certificates to link their performance to an index
or a basket of financial assets makes them a more efficient alternative in terms of
diversification.
Management costs are not an issue for a stock or bond holder (since there is no need
of a professional asset manager to manage those kind of investments), whilst with respect
to transaction costs, a lot depends on two factors: costs charged by the intermediary and
the bid-ask spread. The first factor, usually does not differentiate financial assets issued
by a firm and certificates, because the fees charged to trade these securities are similar,
being around 0.2% and 0.5%. The second factor instead depends on the type of
instrument that is being traded. The most liquid securities (for instance the stocks of
companies with a large market capitalization or government bonds) have a negligible

49
spread, which is higher for corporate bonds, especially for high yield.34 The bid-ask spread
is not fixed in time: it depends on the liquidity conditions of the market (liquidity not
always granted by market makers or liquidity providers), and usually it tends to elapse
during financial turmoil. In general, however, the spread of a stock or bond is on average
lower than that empirically observed for Investment Certificates (Candia, 2017), expect
for high yield bonds.
By looking at the taxation, earnings generated by stocks or bonds can be of two
types: periodical stream of cash flows (dividends and coupons) or capital gains and losses.
In Italy, as stated before, the periodical streams of cash flows are fiscally treated as “redditi
di capitale”, whilst the potential capital gain or loss are considered instead “redditi diversi”,
which can be used for netting purposes. Hence, although a portion of the earnings
associated with stocks and bonds can be labeled as “redditi diversi”, these instruments are
less efficient than Investment Certificates, since the latter generate “redditi diversi” only.
5.2 Certificates and Mutual Funds
Mutual funds are investment vehicles established to manage the savings of investors. They
provide liquidity and diversification for investors, who know that their money is managed
by a professional investor. A fund can be associated with passive or active management.
A fund’s manager with an active style of management attempts to beat the reference
market. To assess the ability of the manager, his/her performance is usually compared
with a benchmark. However, there exists funds without benchmark, with “flexible”
investment strategies, that try to achieve positive performances in every possible market
condition.
Mutual funds provide a high degree of diversification as they give the possibility to
buy a basket of securities with only one instrument. What is more, they are not exposed
to the issuer risk, differently from Investment Certificates. In Italy there exists a
separation between the assets of the fund and those of the management company: if the
latter goes bankrupt, the capital invested by the fund would not be touched.
An investment in a fund is subject to management fees (measured by the TER).35
Those fees can range from an average 0.5% of money market funds, to 2.5% for equity
34 High yield bonds are bonds issued by entities which are deemed to be risky, with a low rating and high coupons. 35 The Total Expense Ratio (TER), is a synthetic indicator of costs, and it is computed as the sum of management and administrative costs, divided by the net asset value of the fund.

50
funds, with some exceptions above this threshold. Performance fees must be added, if
foreseen by the contract, to the management fees. The former are fees recognized to the
portfolio manager in case of positive excess returns of the fund with respect to a
predefined benchmark. Given that there are no standard criteria to establish these fees, it
can prove useful to know in advance the amount and the application criteria. Eventually,
since investment funds are underwritten directly through an authorized intermediary,
there are no direct transaction costs. However, in certain categories of funds (also known
as load) entry fees are charged by the management company.
From a fiscal point of view, investment funds are basically inefficient. Indeed, the
profits generated by a fund are considered as “redditi da capitale”, both if they are
periodical payments and if they generate from the redemption at a price above the
purchase price. In case of losses (sale at a price below the purchase price) instead, they
are treated as “redditi diversi”. An investor holding a fund-only portfolio would not be able
to compensate the possible losses with gains of the same amount.
5.3 Certificates and ETFs
Exchange Traded Funds (ETFs), have gained in importance in recent years for their
peculiar characteristic of being a mutual investment fund or SICAV freely exchangeable
on the market, combining the possibility to make a diversified investment in a single
instrument, with the comfortability of acquiring or selling its shares in every moment.
An ETF shares with a traditional mutual fund the legal form (both are structured as
mutual fund, or SICAV), but differently from the latter, it has the peculiarity of being
traded on a regulated market. Another difference between the two alternatives is the
management philosophy: mutual funds are actively managed, with the aim of beating a
reference market, whilst ETFs are mostly passively managed, that is they passively mimic
the return of a predetermined benchmark.36
ETFs replicate a series of equity, fixed income or commodities indexes, sometimes
ad hoc built by specialized companies (index providers). To replicate the index different
procedures have emerged over time: the most relevant are physical and synthetic
replication.
36 A debate on active versus passive investing has existed since the inception of these investment structures. For a detailed analysis see Grima, Hili, Pace, 2016.

51
Physical replication consists in the purchase of the underlying assets of the index
that the manager wants to track. There are two methods: full or stratified sampling. In the
first case 100% of the assets included in the index are purchased, in the same proportion
as their weighting on the index being replicated. In the second method instead, a sample
of securities is selected whose behavior is as similar as the one of the index as a whole.
Synthetic replication is obtained using derivatives contracts. In particular, the ETF
manager enters a swap contract with an investment bank. The latter agrees to pay the
index return in exchange for a small fee, plus any returns on collateral held in the portfolio
of the ETF.
The physical replication is the one that allows to benefit completely from the
diversification effects, as it happens for traditional mutual funds, because the investor
purchase with just one trade the ownership of each of the underlying assets of the tracked
index. With synthetic replication there is the counterparty risk. Indeed, in the ETF case
there is the risk that the counterparty of the swap contract would not be able to fulfill its
obligation of payment with respect to the ETF manager. Therefore, some adjustments are
foreseen to mitigate this risk, even though whoever invests in a synthetic replication ETF
must consider this negative event.
ETFs have relatively low management costs, above all by virtue of the passive
management, enabling the ETF manager to minimize the costs associated with the market
analysis and the trades. The annual fee of the most common ETFs, tracking the most
known indexes, is around 0.20% whilst the most expensive ETFs, usually linked to indexes
built ad hoc, almost never exceed 1.1%. For the ETF, as well as for stocks and bonds by
virtue of their trading on the market, there exists implicit and explicit trading costs. The
first, i.e. the ones applied directly by the financial intermediary are in general similar to
what has been already seen for stocks and bonds (many intermediaries associate ETFs to
stocks for fees purposes). Instead, the bid-ask spread depends on the category of the ETF:
the most common have a minimum spread of 0.20% or 0.30%, whilst less traded ETF can
reach spread of 1% or even greater ones.
Considering all the financial instruments traded on the market, ETFs have a
substantial fiscal inefficiency, inefficiency shared with the traditional mutual funds. Even
ETFs, in fact, generate “redditi diversi” only in case of losses, whilst they generate

52
exclusively “redditi da capitale” both in case of payment of periodical proceeds, and in case
of capital gains.37
5.4 A Synoptic Framework
At the end of this chapter I briefly summarize the key aspects of all the financial
instruments described to highlight in a synthetic and immediate way the strengths and
weaknesses of each of them.
With respect to diversification, mutual funds ensure the greatest guarantees, as on
one side they enable the purchase of a diversified basket of securities and on the other the
investor is not exposed to the counterparty risk, thanks to the balance sheet separation
imposed to the management company. The same guarantees are offered by ETFs, but only
by those with physical replication. Synthetic replication ETFs, instead, while guaranteeing
the same results of a diversified basket, expose an investor to counterparty risk.
Investment Certificates lies in between, because while they can have as underlying an
index, linking their returns to that of a diversified basket, there exists a counterparty risk
related to the issuer of the certificate. Stocks and bonds instead do not provide any type of
diversification.
However, if we look at management fees, different considerations must be made.
Generally, Investment Certificates, single stocks, and bonds are not associated with any
type of management fee. ETFs instead have relatively low management fees (no more than
1%), while for mutual funds, as already said, higher fees are charged by the management
company.
For transaction costs it is more difficult to make a classification which can hold as a
rule of thumb. Certainly, no load mutual funds have an advantage as they do not have any
entry and exit fees even though they have on average higher management fees than load
funds. For the remaining assets I define an average total cost. Trading fees applied by an
intermediary are almost the same for all the traded financial products, whilst the bid-ask
37 The legislative decree n.44/2014 has finally equated ETFs to traditional mutual funds. Before the decree, earnings generated by ETFs were divided into Delta Nav (the difference between the Nav in the acquisition day and the Nav in the day of the sale), considered “redditi da capitale”, and differential on the Delta Nav (obtained from the difference between acquisition price and sale price, minus the Delta Nav), considered “redditi diversi”. There was hence a residual possibility to determine nettable capital gains. The stated decree delated this eventuality. From April 9th, 2014 the difference between the two prices is considered only (independently from the Nav of the relevant days) and, in case of positive difference this is considered “redditi da capitale”.

53
spread can be wider or tighter depending on whether we consider a certificate, ETF, stock
or bond. If we assume an average cost of 0.30% for a transaction, depending on the spread
of the various instruments, the total costs of an operation on the market, whether it is for
buying or selling a security, can be approximately 0.35% for a stock, 0.50% for a liquid
bond, up to 0.80% or 1.00% for a high yield bond; for a widely traded ETF this can be
around 0.40%, but also in this case it can raise up to 0.80% or 1.00% for the less liquid
products; for Investment Certificates, the total costs would be around 0.80%. Eventually,
load mutual funds have on average entry fees around 1.00% but differently from the
securities traded on the market, they do not have exit fees.
Last, but not least, the taxation. By looking at this aspect, Investment Certificates are
the most efficient among all products considered in the analysis. They are followed by
stocks and bonds, whilst mutual funds and ETFs are the worst performers.
All the considerations made are summarized in table 4, that compares all these
financial products with respect to diversification, management fees, transaction costs, and
taxation.
6. Concluding Remarks
The purpose of our thesis was to investigate the world of Investment Certificates. They
are a large family of financial products. Since they were introduced in Italy in 1999 (2002
for leveraged certificate), certificates have grown significantly, and they represent now a
relevant, and increasing, share of the holding of investors. Indeed, these financial products
are characterized by a high flexibility: new asset(s) can be selected as underlying and new
investment strategies can be realized. In this way, issuers are put in the perfect condition
to propose to investors new innovative products for their portfolio optimization. Besides,
for an investor who autonomously manages his/her savings, the market of Investment
Certificates offers multiple financial solutions designed to satisfy every investment need.
Starting from the categorization realized by EUSIPA (European Structured
Investment Products Association), this thesis analyzes the main types of certificates,
describing their features and how they can be structured as a combination of different
plain vanilla and exotic options. Then, we proceed with a brief description of the most
used option pricing models and we examine the main risk factors affecting the value of an

54
option and therefore of an Investment Certificate to get to the analysis of the behavior of
these products during their lifetime. Finally, we conclude with a comparison of
Investment Certificates with other asset classes.
There is much more to know and learn about this fascinating world. There are many
more structures, where small variations can make big differences. As stated above, the
segment of modern Investment Certificates has been gaining in popularity and is still
going through a continuous development. Our analysis offers the possibility to understand
the structure of these complicated investment instruments. The methodology adopted in
this thesis can be used as an inspiration for an analysis of other structured products.
Besides, further studies are needed to compare the analyzed Investment Certificates with
other structured products existent on the market.
References
Black, F. and Scholes, M., 1973, “The pricing of options and corporate liabilities”. Journal
of Political Economy, 81: 637-654
Bluemke, A., 2009, How to Invest in Structured Products: a Guide for Investors and Asset
Managers. John Wiley & Sons.
Bouzoubaa, M. and Osseiran, A., 2010, Exotic Options and Hybrids: A Guide to Structuring,
Pricing and Trading. John Wiley & Sons
Brockhaus, O., Ferraris, A., Gallus C., Douglas, L., Martin, R. & Overhaus, M., 1999, Modelling
and hedging equity derivatives. London: Risk.
Burth, S., Kraus, T. and Wohlwend H., 2001, "The pricing of structured products in the
Swiss market". The Journal of Derivatives, 9: 30-40.
Camelia, M., 2009, I certificati di investimento. Mercati, strutture finanziarie, strategie
gestionali. Milan: Gruppo 24 ORE.
Camelia, M. and Zanaboni, B., 2015, I prodotti strutturati nel private banking. Milan: AIFB
Editrice
Candia, G., 2017, I Certificati di Investimento: Guida completa per consulenti e investitori.
Milan: Hoepli
Chriss, N.A., 1997, Black-Scholes and beyond. New York: McGraw Hill.
Di Franco, M., Polimeni, F. and Proietti M., 2002. Opzioni e Titoli Strutturati: le recenti
evoluzioni dell'ingegneria finanziaria. Milan: Gruppo 24 ORE.
Degregori and Partners, 2016, I Certificati di Investimento. Edizioni R.E.I.

55
Derman, E. and Kani, I., 1994, "The volatility smile and its implied tree". Goldman Sachs
Quantitative Strategies Research Notes.
Dupire, B., 1993, "Pricing and hedging with smiles". Proceedings of AFFI Conference, La
Baule
Gatheral, J., 2002, “Stochastic volatility and local volatility”. Case Studies in Financial
Modelling Course. Merryll Lynch.
Grunbichler, A. and Wohlwend, H., 2005, “The valuation of structured products: empirical
findings for the swiss market”. Swiss Society for Financial Market Research, 2: 361–380
Haug, E.G., 2006, The Complete Guide to Option Pricing Formulas. McGraw-Hill.
Hernandez, R., Brusa, J. and Liu, P., 2008, “An Economic Analysis of Bonus Certificates:
Second-Generation of Structured Products”. Review of Futures Markets: 16, 419-451.
Hernandez, R., Lee, W., and Liu, P., 2007, “The Market and the Pricing of Outperformance
Certificates”. 16th Annual Meeting of the European Financial Management Association.
Heston, S. L., 1993, “A closed form solution for options with stochastic volatility with
applications to bond and currency options”. The Review of Financial Studies: vol. 6.
Hull, J. C. ,2018, Options, futures and other derivatives. 10th Edition. Pearson
Mangia M., 2006, Covered warrant e certificates: Guida pratica ai securitised derivatives,
Milano: Franco Angeli.
McCann, C. and Luo, D., 2006, Are Structured Products Suitable for Retail Investors?
Securities Litigation and Consulting Group
Merton, R., 1973, “The Theory of Rational Option Pricing”. Bell Journal of Economics and
Management Science: 4, 141-183.
Reiner, F. and Rubinstein, M., 1991, “Breaking down the barriers”. RISK: 4, 8, 28-35
Taleb, N.N., 2007, Dynamic Hedging: Managing Vanilla and Exotic Options. John Wiley &
Sons. 115-402.
Wilmott, P., 2007, Paul Wilmott introduces Quantitative Finance. John Wiley & Sons. 245-
316.

56
Source: Acepi (2018)
Source: Acepi (2018)
Figure 1
The evolution of the number of issued certificates in Italy
The chart reports the number of new certificates issued by financial
intermediaries in the last ten years in Italy.
Figure 2
The evolution of turnover (€ m) in Italy
The chart shows the euro value (in million) of the issued in Italy between 2008
and 2017.
1214
2717
4031
2772 2531
6327
8164
10647
70067671
0
2000
4000
6000
8000
10000
12000
2008 2009 2010 2011 2012 2013 2014 2015 2016 2017
208
272241 260 273
361
429
535
367
473
0
100
200
300
400
500
600
2008 2009 2010 2011 2012 2013 2014 2015 2016 2017
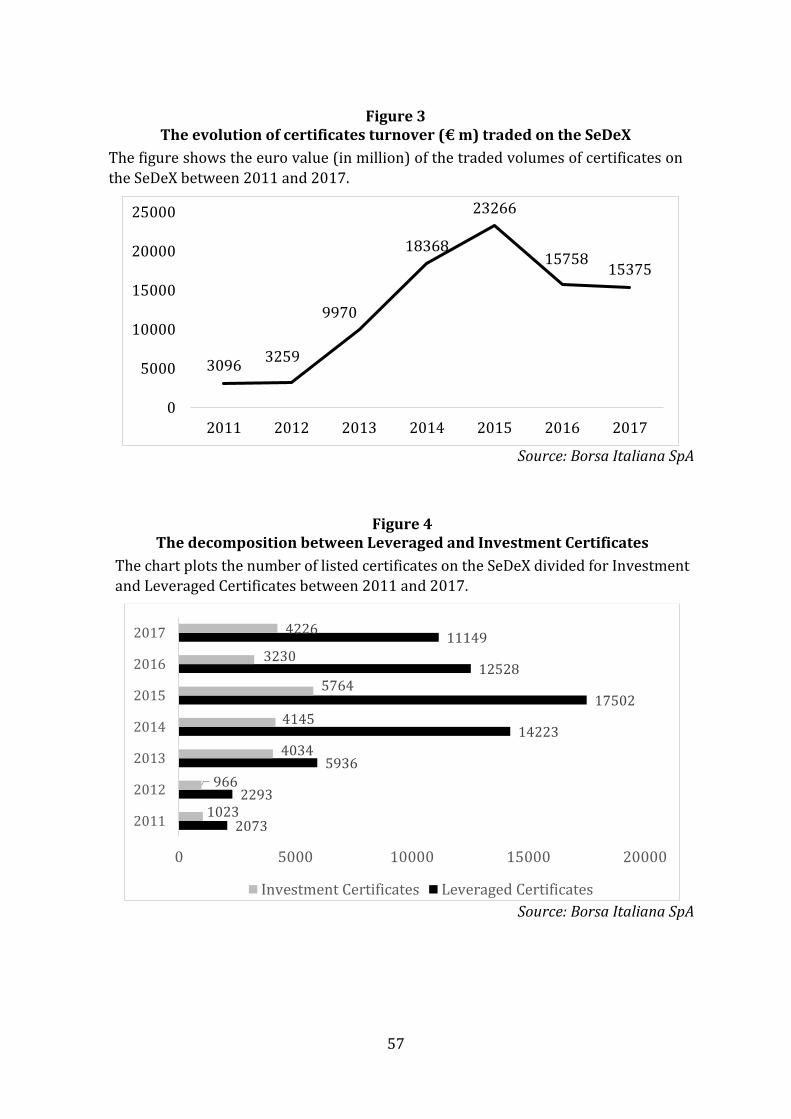
57
Source: Borsa Italiana SpA
Source: Borsa Italiana SpA
2073
2293
5936
14223
17502
12528
11149
1023
966
4034
4145
5764
3230
4226
0 5000 10000 15000 20000
2011
2012
2013
2014
2015
2016
2017
Investment Certificates Leveraged Certificates
Figure 4 The decomposition between Leveraged and Investment Certificates
The chart plots the number of listed certificates on the SeDeX divided for Investment
and Leveraged Certificates between 2011 and 2017.
30963259
9970
18368
23266
1575815375
0
5000
10000
15000
20000
25000
2011 2012 2013 2014 2015 2016 2017
Figure 3 The evolution of certificates turnover (€ m) traded on the SeDeX
The figure shows the euro value (in million) of the traded volumes of certificates on
the SeDeX between 2011 and 2017.
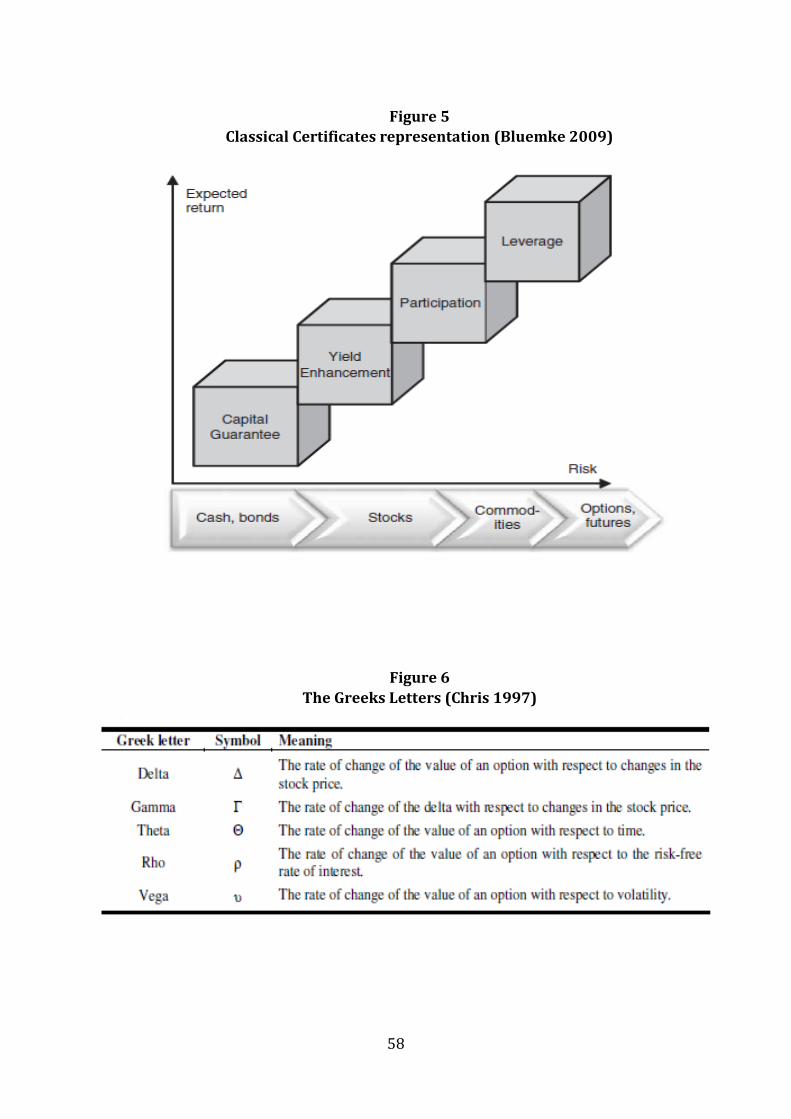
58
Figure 6
The Greeks Letters (Chris 1997)
Figure 5
Classical Certificates representation (Bluemke 2009)
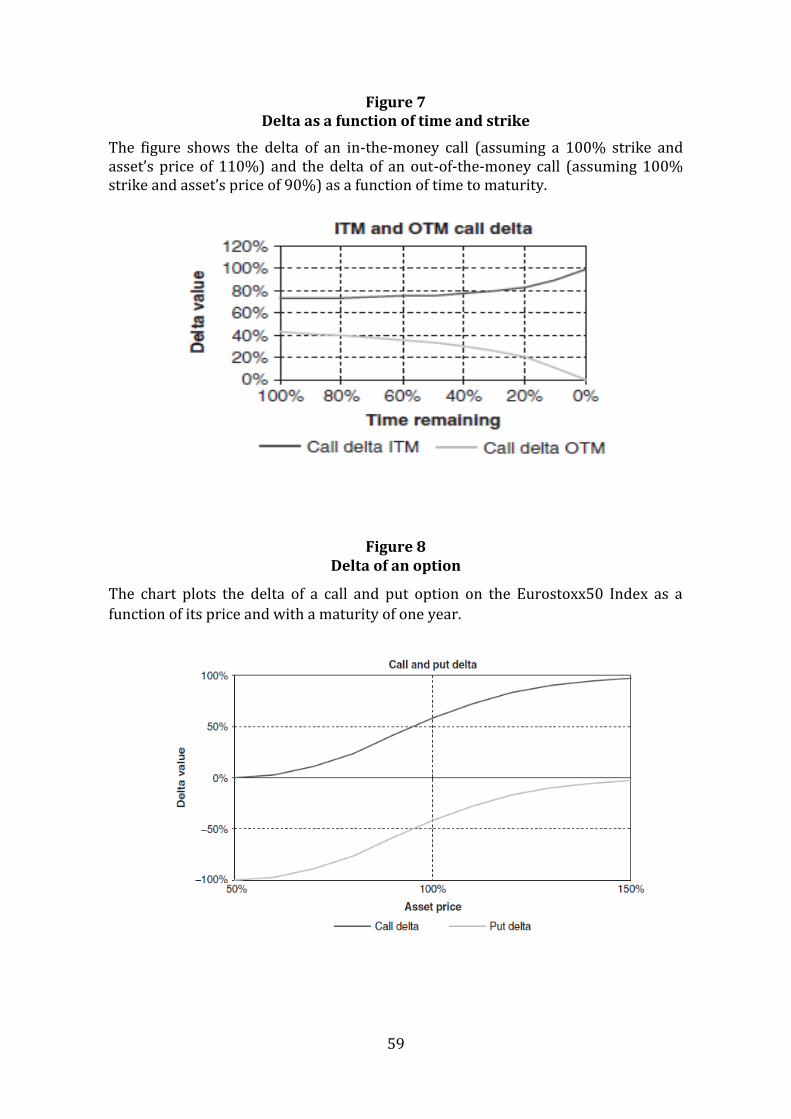
59
Figure 7 Delta as a function of time and strike
The figure shows the delta of an in-the-money call (assuming a 100% strike and asset’s price of 110%) and the delta of an out-of-the-money call (assuming 100% strike and asset’s price of 90%) as a function of time to maturity.
Figure 8 Delta of an option
The chart plots the delta of a call and put option on the Eurostoxx50 Index as a
function of its price and with a maturity of one year.

60
Figure 9 Payoff 1: Equity protection price as a function of spot price
The figure shows the mark-to-market of the certificate as a function of time to maturity and price of the underlying asset. There are five lines, each line corresponds to a different period during the time of the certificate: at issue (green line), with 70% time remaining (violet line), with 50% time remaining (yellow line), with 25% time remaining (red line) and maturity (blue line).
Figure 10 Payoff 2: Implied Volatility increase
The figure shows the impact of a volatility increase on the price of the equity protection. It is obtained by shifting volatility from 13% to 21%. Compared to figure 8, certificate’s value is increased, and the lines are now steeper.

61
Figure 11 Payoff 3: Interest rate increase
The figure shows the effects of an increase in interest rates on the mark-to-market of an equity protection and it is obtained by shifting the interest rate level from 2% to 4%. Compared to Figure 9, it is clear that the certificate’s value has dropped.
Figure 12 Payoff 4: Bonus price as a function of spot price
The figure shows the price of the Bonus as a function of time to maturity and price of the underlying asset. There are five lines, each line corresponds to a different period during the time of the certificate: at issue (green line), with 70% time remaining (violet line), with 50% time remaining (yellow line), with 25% time remaining (red line) and maturity (blue line).

62
Figure 14 Delta of a down-and-out put
The figure shows the delta of a down-and-out put option as a function of the underlying price and for different time to maturity. Close to the barrier the delta is positive while the higher the price of the underlying, the lower the influence of the barrier and delta turns negative as with a plain vanilla put option.
Figure 13 Payoff 5: Implied volatility increase
The figure shows the impact of a volatility increase on the price of the equity protection. It is obtained by increasing volatility from 13% to 21%.

63
Figure 15 Delta of the Bonus Certificate
The figure shows the delta of a Bonus Certificate. Below the barrier, the Bonus becomes a delta 1 product. Just above the barrier, delta is large and positive- if price moves slightly higher the probability of knock-out is reduced. At much higher price levels, the barrier’s impact is lighter and delta is lower than one because the delta of the put is slightly negative while that of the call is one.

64
Table 1
Fundamental relationship derived from the put-call parity
Table 2
Variables influencing the Equity Protection
Position Relationship
Long Stock (S) = C – P + X𝒆−𝒓𝑻
Long Zero-coupon bond (X𝒆−𝒓𝑻) = S + P – C
Long call option (C) = S + P – X𝒆−𝒓𝑻
Long put option(P) = C – S + X𝒆−𝒓𝑻
Variables
Variables’ tendency Spot Price Implied Volatility Interest rate Dividend Yield
Up ⬆ ⬆ ⬇ ⬇
Down ⬇ ⬇ ⬆ ⬆
Impact Maximum Medium-high Low Low
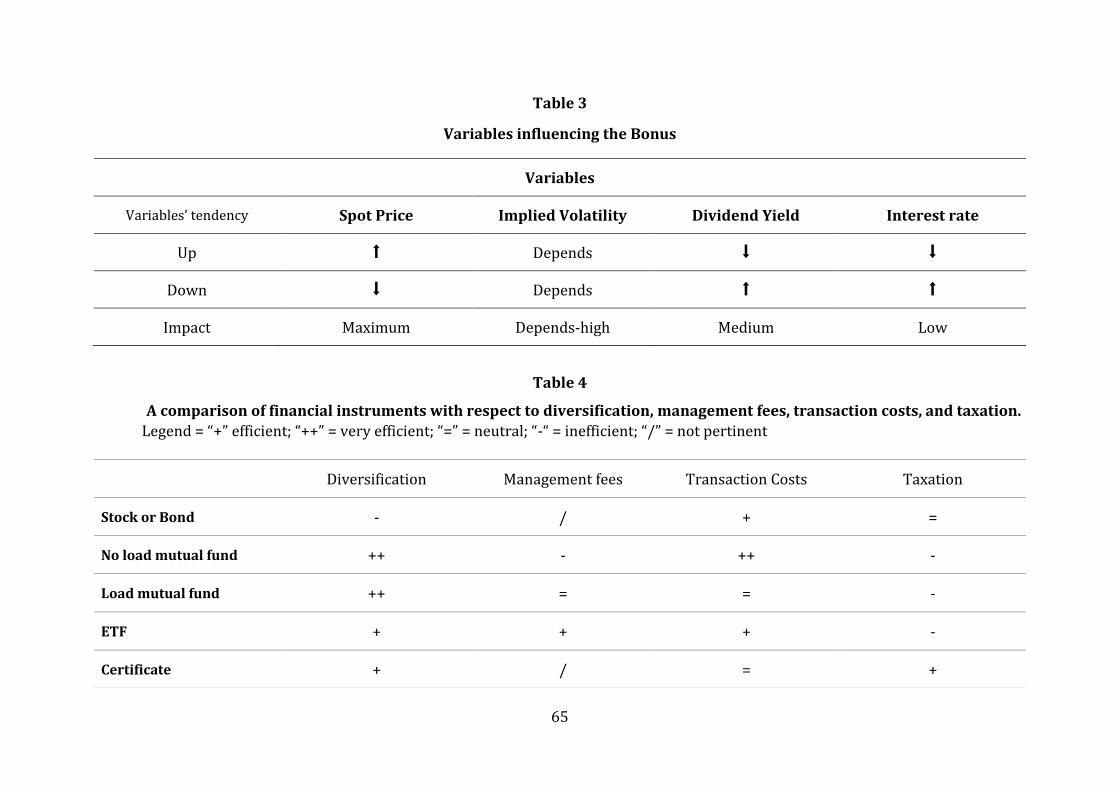
65
Table 3
Variables influencing the Bonus
Table 4
A comparison of financial instruments with respect to diversification, management fees, transaction costs, and taxation.
Legend = “+” efficient; “++” = very efficient; “=” = neutral; “-“ = inefficient; “/” = not pertinent
Variables
Variables’ tendency Spot Price Implied Volatility Dividend Yield Interest rate
Up ⬆ Depends ⬇ ⬇
Down ⬇ Depends ⬆ ⬆
Impact Maximum Depends-high Medium Low
Diversification Management fees Transaction Costs Taxation
Stock or Bond - / + =
No load mutual fund ++ - ++ -
Load mutual fund ++ = = -
ETF + + + -
Certificate + / = +

66