Embed Size (px)
Citation preview

TWEEDY, BROWNE FUND INC.
This booklet consists of two separate documents:
INVESTMENT ADVISER’S LETTERTO SHAREHOLDERS
SEMI-ANNUAL REPORT
Tweedy, Browne Global Value Fund (TBGVX)Tweedy, Browne Global Value Fund II – Currency Unhedged (TBCUX)
Tweedy, Browne Value Fund (TWEBX)Tweedy, Browne Worldwide High Dividend Yield Value Fund (TBHDX)
September 30, 2018

TWEEDY, BROWNE FUND INC.
Investment Adviser’s Letter to Shareholders . . . . . . . . . . . . . . . . . . . . . . . . . . . . . . . . . . . . . . I-1
Semi-Annual Report . . . . . . . . . . . . . . . . . . . . . . . . . . . . . . . . . . . . . . . . . . . . . . . . . . . . . . . . . . II-1
Tweedy, Browne Fund Inc.Expense Information . . . . . . . . . . . . . . . . . . . . . . . . . . . . . . . . . . . . . . . . . . . . . . . . . . . . . II-2
Tweedy, Browne Global Value FundPortfolio of Investments . . . . . . . . . . . . . . . . . . . . . . . . . . . . . . . . . . . . . . . . . . . . . . . . . . . II-3Sector Diversification . . . . . . . . . . . . . . . . . . . . . . . . . . . . . . . . . . . . . . . . . . . . . . . . . . . . II-5Portfolio Composition . . . . . . . . . . . . . . . . . . . . . . . . . . . . . . . . . . . . . . . . . . . . . . . . . . . . II-5Schedule of Forward Exchange Contracts . . . . . . . . . . . . . . . . . . . . . . . . . . . . . . . . . . . . . II-5
Tweedy, Browne Global Value Fund II – Currency UnhedgedPortfolio of Investments . . . . . . . . . . . . . . . . . . . . . . . . . . . . . . . . . . . . . . . . . . . . . . . . . . . II-8Sector Diversification . . . . . . . . . . . . . . . . . . . . . . . . . . . . . . . . . . . . . . . . . . . . . . . . . . . . II-9Portfolio Composition . . . . . . . . . . . . . . . . . . . . . . . . . . . . . . . . . . . . . . . . . . . . . . . . . . . . II-9
Tweedy, Browne Value FundPortfolio of Investments . . . . . . . . . . . . . . . . . . . . . . . . . . . . . . . . . . . . . . . . . . . . . . . . . . . II-10Sector Diversification . . . . . . . . . . . . . . . . . . . . . . . . . . . . . . . . . . . . . . . . . . . . . . . . . . . . II-11Portfolio Composition . . . . . . . . . . . . . . . . . . . . . . . . . . . . . . . . . . . . . . . . . . . . . . . . . . . . II-11Schedule of Forward Exchange Contracts . . . . . . . . . . . . . . . . . . . . . . . . . . . . . . . . . . . . . II-11
Tweedy, Browne Worldwide High Dividend Yield Value FundPortfolio of Investments . . . . . . . . . . . . . . . . . . . . . . . . . . . . . . . . . . . . . . . . . . . . . . . . . . . II-13Sector Diversification . . . . . . . . . . . . . . . . . . . . . . . . . . . . . . . . . . . . . . . . . . . . . . . . . . . . II-13Portfolio Composition . . . . . . . . . . . . . . . . . . . . . . . . . . . . . . . . . . . . . . . . . . . . . . . . . . . . II-13
Tweedy, Browne Fund Inc.Statements of Assets and Liabilities . . . . . . . . . . . . . . . . . . . . . . . . . . . . . . . . . . . . . . . . . II-14Statements of Operations . . . . . . . . . . . . . . . . . . . . . . . . . . . . . . . . . . . . . . . . . . . . . . . . . . II-15Statements of Changes in Net Assets . . . . . . . . . . . . . . . . . . . . . . . . . . . . . . . . . . . . . . . . II-16Financial Highlights . . . . . . . . . . . . . . . . . . . . . . . . . . . . . . . . . . . . . . . . . . . . . . . . . . . . . . II-18Notes to Financial Statements . . . . . . . . . . . . . . . . . . . . . . . . . . . . . . . . . . . . . . . . . . . . . . II-20Other Information . . . . . . . . . . . . . . . . . . . . . . . . . . . . . . . . . . . . . . . . . . . . . . . . . . . . . . . II-27Investment in the Fund by Managing Directors and Employees of the
Investment Advisor . . . . . . . . . . . . . . . . . . . . . . . . . . . . . . . . . . . . . . . . . . . . . . . . . . . . II-27

TWEEDY, BROWNE FUND INC.
Investment Team
Olivier Berlage
Jay Hill, CFA*
Dave Krasne, CFA Elliot H. Larner Sean McDonald, CFA
Amelia KohFrank H. Hawrylak, CFA*
Andrew EwertRoger R. de Bree*William H. Browne*
Thomas H. Shrager* John D. Spears* Robert Q. Wyckoff, Jr.*
* Investment Committee Member

This page left blank intentionally.

TWEEDY, BROWNE FUND INC.
Investment Adviser’s Letter to Shareholders
For over a thousand years, Roman conquerors returning fromthe wars enjoyed the honor of triumph, a tumultuous parade. Inthe procession came trumpeters, musicians and strange animalsfrom conquered territories, together with carts laden withtreasure and captured armaments. The conqueror rode in atriumphal chariot, the dazed prisoners walking in chains beforehim. Sometimes his children robed in white stood with him in thechariot or rode the trace horses. A slave stood behind theconqueror holding a golden crown and whispering in his ear awarning: that all glory is fleeting.
George S. Patton, Jr.“Patton” (1970)
To Our Shareholders:
The bull market in U.S. equities is now in its 10th
consecutive year, making this the longest uninterruptedexpansion in the post-war era. To a great degree, the heroes ofthis triumph have been a handful of highly innovativeentrepreneurs who have created large dominant companiesthat today have almost monopoly power in their respectivemarkets. This group includes Mark Zuckerberg of Facebook,Jeff Bezos of Amazon, Tim Cook and the late Steve Jobs ofApple, Reed Hastings of Netflix, and Sergey Brin and LarryPage of Google. Together they constitute the ubiquitousFAANG (Facebook, Amazon, Apple, Netflix, Google) stocks.According to Scott Galloway, author of The Four: The HiddenDNA of Amazon, Apple, Facebook, and Google, these fourcompanies have generated unprecedented wealth – by ourcalculation approximately $3 trillion through 9/30/18, fortheir shareholders. If you add in Netflix, the numberapproaches $3.5 trillion.
The great bulk of this wealth was produced over the lastfive years, as these companies helped to power the U.S. andglobal stock indexes forward. Amazon, for example, year todate through September 30, is up 71%, growing its marketcapitalization this year alone by over $413 billion. To put thatgrowth in perspective, there are only five other companies inthe world today that have a total market capitalization of$400 billion or more: Microsoft, Apple, Google, BerkshireHathaway, and Facebook. Amazon was able to essentiallygrow a company the size of Facebook ($407.10B as of11/12/2018) in just nine months.
To quote Galloway:
Our governments grant them special treatment regardingantitrust regulation, taxes, even labor laws. Andinvestors bid their stocks up, providing near-infinitecapital and firepower to attract the most talented peopleon the planet or crush adversaries.
As of September 30, 2018, the FAANGs accounted for13% of the valuation of the S&P 500, and over the last twoyears their stock prices are up cumulatively approximately88%. With this meteoric rise, none of the FAANGs todaytrade, in our view, at a reasonable discount to a conservativeestimate of intrinsic value. During 2012, we did have anunusual opportunity to purchase Google at a price which fitour value framework. While we believe the business is fullyvalued today, we still own Google because we believe thevalue will continue to compound at an above-average rate.From a quantitative standpoint, Apple certainly fit ourframework for a better part of the last five years. Qualitativeconcerns regarding the history of technology hardwarebusinesses led to our inaction. While Facebook’s valuationtoday is not terribly excessive, we do not believe that it istrading at a discount to underlying value. Conversely,Amazon and Netflix are both currently trading at priceearnings ratios above 100 times earnings and have neverremotely appeared cheap to us. In fact, Amazon and Netflixare emblematic of the venture capital mentality in publicmarkets that we have observed more frequently in the lastseveral years. This Silicon Valley inspired ethos seeminglyprioritizes customer and revenue growth over all other goals,including profitability. To quote Elizabeth Winkler of TheWall Street Journal in a recent article (August 26, 2018)entitled Why No One Can Catch Netflix, “Netflix’s greatadvantage over its rivals is it doesn’t need to show profits, aslong as the subscriber numbers keep climbing.” While thisapproach is common in the early years of a company’s life, it isincreasingly being applied to many large, more mature publiccompanies. We remember a time 18 years ago when numerousinnovative technology companies achieved similar nosebleedvaluations based on something other than underlyingprofitability. It did not end well for investors in thosebusinesses.
Thanks in large part to the extraordinary performance ofthese technology companies, the S&P 500 Index in themonth of September hit an all-time high valuation. Also,thanks to the FAANGs, the growth style of investing has faroutstripped the results produced by value investors over thelast many years, causing some market prognosticators toconclude that value investing is once again dead. Havingbeen at this investment game for a long time here at Tweedy,Browne, we know that this goes on until it doesn’t. Eventuallythese disparities are almost invariably corrected by the sheerweight of the companies’ valuations.
I-1

Value investors should not despair. Numerous academicand empirical studies suggest that over the longer term, valueinvesting has generally outperformed growth investing ... thatthe proverbial tortoise more often than not beats the hare1.There are many theories that seek to explain the reason forvalue investing’s empirical return advantage over time. In ourview, one of the most notable reasons is behavioral. Growthinvesting feels better. It’s easier, more comfortable and oftenlulls the investor into a sense of complacency. Lakonishok,Shleifer and Vishny, in their classic study, “ContrarianInvestment, Extrapolation, and Risk” (1993), found thatinvestors appear to consistently overestimate the futuregrowth rates of glamour stocks relative to value stocks, puttingexcessive weight on recent past history despite the fact thatfuture growth rates are highly mean reverting. In addition,they found that investors often confuse well run companieswith good investments. This often translates into buyingglamour securities with widely recognized competitiveadvantages and lofty expectations for future growth, regardlessof price. In addition, recent favorable stock price action oftenreinforces the growth investor’s conviction. As WarrenBuffett has observed, investors tend to gravitate toward acheery consensus.
Conversely, value investing often feels uncomfortable andchallenging. Buying out-of-favor stocks with low expectationsand well publicized issues, however temporary, requiresfortitude and a contradictory mix of conviction and humilitythat is often in short supply in the investor community. Italmost always requires the ability to look wrong for a while,and a willingness to embrace uncertainty, price volatility, andthe recognition that a fair number of individual ideas will losemoney for one reason or another. Behaviorally, valueinvesting is simply harder; however, the Lakonishok et al.study confirmed that this hardship has historically beenrewarded with returns that over time exceeded thoseproduced by growth (glamour) stocks.
With considerably less exposure to technology stocks, thereturns of non-U.S. equity markets of late, while quite solid,have paled in comparison to the returns of the U.S. equitymarket. Non-U.S. equities in the near term have beenweighed down in part by projections of slowing economicgrowth, political upheavals, trade war concerns, and highlyvolatile currencies, while U.S. stocks have had the benefit ofincreased fiscal stimulus in the form of corporate and personaltax cuts, increased defense spending, and capital investment,which gave a significant boost to economic growth, reported
corporate earnings, and in turn U.S. stock prices. Beset bythese headwinds, non-U.S. equities have emotionally beenharder to own. Over the last ten years, the S&P 500 hascompounded at over twice the rate of the MSCI EAFE Index.Year to date through September 30, 2018, that spreadwidened. The S&P 500 is up 10.56% year to date throughSeptember 30, versus 1.38% for the MSCI EAFE Index inlocal currency and -1.43% when translated back into U.S.dollars. These robust U.S. equity returns have, in our view,caused U.S. equity valuations to become stretched comparedto their non-U.S. counterparts. According to Bloomberg, on asimple price-to-earnings ratio basis, the S&P 500, at the endof October, traded at approximately a 33% premium to theMSCI EAFE Index. Jason Zweig, the writer of The IntelligentInvestor column in The Wall Street Journal, commented onthis contrast in valuations between U.S. and non-U.S.equities in a recent article entitled “The ‘Dumb’ Money IsBailing on U.S. Stocks. That’s Smart.” He cautioned:
If U.S. growth merely slows relative to other economies,stock markets elsewhere in the world are likely to catch upto or surpass the S&P 500.
Stocks in the U.S. may be more vulnerable than usual tosuch a reversal, given how expensive they are. Comparedwith the rest of the world, U.S. stocks are at their highestvaluations on record, according to Bank of AmericaMerrill Lynch – trading for twice as much, as measuredby price to net worth, as international shares.
This dichotomy between U.S. and non-U.S. returns hasnot always been in favor of the United States. In fact, in hisarticle, Jason Zweig pointed out that there have beennumerous multi-year periods where non-U.S. returns havesignificantly outpaced those of their U.S. counterparts.Moreover, as you can see in the chart below, between 1974and 2018, the S&P 500, on a rolling ten-year return basis,outperformed the MSCI EAFE Index only 52% of the time.The Zweig article also indicated that, for the ten years endingDecember 1986, non-U.S. equities on average surpassed theperformance of stocks in the U.S. by over 6.2% per year. Thisalso held true for the ten-year period ending December 2007,when non-U.S. equities outperformed U.S. equities by 3.1%per year. He also noted that retail investors had redeemed$34 billion out of U.S.-based funds while adding over $1trillion to non-U.S. funds over the last 10 years, leading himto comment that, “sooner or later, that’s going to make theso-called dumb money look smart.” We would agree.
1 See, for example: What Has Worked in Investing, Tweedy,Browne (Revised 2009); Value and Growth Investing: Reviewand Update by Louis K.C. Chan and Josef Lakonishok, FinancialAnalysts Journal (January/February 2004); What Works OnWall Street by James P. O’Shaughnessy, McGraw-HillEducation (Fourth Edition, November 2012).
I-2

S&P 500 Index & MSCI EAFE Index (in U.S.$)10-Year Rolling Returns | December 31, 1974 through September 30, 2018
U.S. equity markets (S&P 500 Index) outperformed international markets (MSCI EAFE Index (in U.S.$)) in justover half of the 10-year rolling periods (52% of observed periods).
-5%
0%
5%
10%
15%
20%
25%
-5% 0% 5% 10% 15% 20% 25%
S&P
500
Inde
x
MSCI EAFE Index (in U.S.$)
Source: Bloomberg. Past performance is no guarantee of future results.
The vertical axis represents the returns for the S&P 500 whilethe horizontal axis represents the returns for the MSCI EAFEIndex (in U.S.$). The diagonal axis is a line of demarcationseparating periods of outperformance from periods ofunderperformance. Plot points above the diagonal axis areindicative of the S&P’s relative outperformance, while pointsbelow the diagonal axis are indicative of its relativeunderperformance.
As with life, there is an ebb and a flow to investing. Asvalue investors, we seek to take advantage of the fact that,empirically, “Mr. Market” has a proven behavioral tendencyto overreact on the upside as well as the downside. And wecan have faith that equity valuations should mean revert overtime. But we can never know when the mean reversion willoccur, and value investing can remain out of favor for periodsof time that are disconcerting at best and sometimesdownright uncomfortable. That said, redemption has
generally come for patient, disciplined, price conscious valueinvestors who stay the course. As we write, volatility hasreturned to public equity markets. Technology stocks havebegun to falter; fears of a trade war and projections of slowingeconomic growth have driven the Chinese stock market(including dividends) down more than 26% through October31, 2018, from its late January highs; Europe is bracing for thepossibility of a hard Brexit; and numerous emerging marketsare in turmoil due to high levels of U.S. and euro-denominated debt. On top of all this, inflation, interest ratesand oil prices are on the rise. On an optimistic note, theseconcerns are also producing near term pricing opportunities inan increasing number of non-U.S. equities. Idea flow haspicked up considerably for us of late and, as you will see laterin this report, we have been busy planting the seeds forpotential future returns.
I-3

Investment Performance
Year to date, the Tweedy, Browne Funds continued to make financial progress in this dichotomous environment. However,on a relative basis, the Funds’ results were mixed. Our flagship Tweedy, Browne Global Value Fund marginally trailed itshedged benchmark year to date through September 30, but bested the unhedged benchmark by 378 basis points (3.78%). TheTweedy, Browne Global Value Fund II – Currency Unhedged, our unhedged international fund, bested its unhedgedbenchmark by 264 basis points. The Tweedy, Browne Value Fund, however, trailed its global benchmark by a considerablemargin. The Tweedy, Browne Worldwide High Dividend Yield Value Fund outpaced the MSCI World High Dividend YieldIndex by 187 basis points, but trailed its benchmark, the MSCI World Index. The Value Fund and the Worldwide HighDividend Yield Value Fund, our two global funds, have had relatively modest exposure to U.S. equities and, as a result, havenot compared favorably in the short run to the MSCI World Index, where U.S. equities represent as much as 60% to 65% ofassets.
Presented below are the performance results of the Tweedy, Browne Funds for various periods with comparisons to theirrespective benchmark indices. Following those comparisons are the Funds’ complete performance histories.
Annualized periods through September 30, 2018
6 monthsending
09/30/18YTD thru09/30/18 1 year 5 years 10 years
SinceInception
Global Value Fund*(inception 06/15/93) 4.55% 2.35% 5.28% 5.51% 8.10% 9.29%
MSCI EAFE Index (Hedged to U.S.$)†(1)(2)(3) 6.97 2.94 7.09 8.53 7.36 6.22
MSCI EAFE Index (in U.S.$)†(1)(2)(3) 0.10 -1.43 2.74 4.42 5.38 5.36
Total Annual Fund Operating Expense Ratio as of 03/31/18: 1.36% ††
Global Value Fund II*(inception 10/26/09) 1.86% 1.21% 5.21% 3.62% - 6.55%
MSCI EAFE Index (in U.S.$)†(1)(2) 0.10 -1.43 2.74 4.42 - 5.48
Total Annual Fund Operating Expense Ratios as of 03/31/18: 1.38% (gross); 1.37% (net) ††§
Value Fund*(inception 12/08/93) 4.74% 1.84 6.34% 6.30% 7.81% 8.36%
MSCI World Index (Hedged to U.S.$)†(1)(3)(5) 9.44 7.25 13.10 11.13 9.41 7.76
S&P 500/MSCI World Index (Hedged to U.S.$)¶†(1)(4)(5) 9.44 7.25 13.10 11.13 9.41 8.58
Total Annual Fund Operating Expense Ratios as of 03/31/18: 1.38% (gross); 1.37% (net) ††§
¶ S&P 500 Index (12/08/93-12/31/06)/MSCI World Index (Hedged to U.S.$) (01/01/07-present)
Worldwide High Dividend Yield Value Fund*(inception 09/05/07) 4.03% 3.12% 7.82% 4.94% 7.10% 4.56%
MSCI World Index (in U.S.$)†(1)(5) 6.80 5.43 11.24 9.28 8.56 5.28
MSCI World High Dividend Yield Index†(1)(5) 4.54 1.25 4.80 6.62 7.25 3.71
Total Annual Fund Operating Expense Ratios as of 03/31/18: 1.38% (gross); 1.37% (net) ††§
30-day Standardized Yield as of 09/30/18: 1.69% (subsidized); 1.63% (unsubsidized)
* The performance data shown represents past performance and is not a guarantee of future results. Total return and principal value of aninvestment will fluctuate so that an investor’s shares, when redeemed, may be worth more or less than their original cost. The returnsshown do not reflect the deduction of taxes that a shareholder would pay on Fund distributions or the redemption of Fund shares. Currentperformance may be lower or higher than the performance data shown. Please visit www.tweedy.com to obtain performance data that iscurrent to the most recent month end, or to obtain after-tax performance information. Please refer to footnotes 1 through 5 at the end ofthis letter for descriptions of the Funds’ indexes. Results are annualized for all periods greater than one year.
† Investors cannot invest directly in an index. Index returns are not adjusted to reflect the deduction of taxes that an investorwould pay on distributions or the sale of securities comprising the index.
†† Each Fund’s expense ratio has been restated to reflect decreases in the Fund’s custody fees that became effective on August 1,2017.
§ Tweedy, Browne has voluntarily agreed, effective December 1, 2017 through at least July 31, 2019, to waive a portion of theGlobal Value Fund II’s, the Value Fund’s and the Worldwide High Dividend Yield Value Fund’s investment advisory fees and/or reimburse a portion of each Fund’s expenses to the extent necessary to keep each Fund’s expense ratio in line with theexpense ratio of the Global Value Fund. (For purposes of this calculation, each Fund’s acquired fund fees and expenses,brokerage costs, interest, taxes and extraordinary expenses are disregarded, and each Fund’s expense ratio is rounded to twodecimal points.) The net expense ratios set forth above reflect this limitation, while the gross expense ratios do not. Please referto the Funds’ prospectus for additional information on the Funds’ expenses. The Global Value Fund II’s, Value Fund’s andWorldwide High Dividend Yield Value Fund’s performance data shown above would have been lower had certain fees andexpenses not been waived and/or reimbursed during certain periods.
I-4

The Funds do not impose any front-end or deferred sales charges. However, Global Value Fund, Global Value Fund II and WorldwideHigh Dividend Yield Value Fund each impose a 2% redemption fee on redemption proceeds for redemptions or exchanges made less than15 days after purchase. Performance data does not reflect the deduction of the redemption fee, and, if reflected, the redemption fee wouldreduce any performance data quoted for periods of 14 days or less. The expense ratios shown reflect the inclusion of acquired fund fees andexpenses (i.e., the fees and expenses attributable to investing cash balances in money market funds) and may differ from those shown inthe Funds’ financial statements.
Annual Returns Through 09/30/2018
YearGlobal Value Fund(inception 06/15/93)
MSCI EAFE Index(Hedged to
U.S.$)(1)(2)(3)
(beginning 05/31/93)
MSCI EAFE Index(in U.S.$)(1)(2)(3)
(beginning 05/31/93)
Global ValueFund II
(inception 10/26/09)
MSCI EAFE Index(in U.S.$)(1)(2)
(beginning 10/26/09)
1993 15.40% 10.33% 5.88%1994 4.36 -1.67 7.781995 10.70 11.23 11.211996 20.23 13.53 6.051997 22.96 15.47 1.781998 10.99 13.70 20.001999 25.28 36.47 26.962000 12.39 -4.38 -14.172001 -4.67 -15.87 -21.442002 -12.14 -27.37 -15.942003 24.93 19.17 38.592004 20.01 12.01 20.252005 15.42 29.67 13.542006 20.14 19.19 26.342007 7.54 5.32 11.172008 -38.31 -39.90 -43.382009 37.85 25.67 31.78 2.04% 0.58%2010 13.82 5.60 7.75 9.43 7.752011 -4.13 -12.10 -12.14 -1.73 -12.142012 18.39 17.54 17.32 17.98 17.322013 19.62 26.67 22.78 19.64 22.782014 1.51 5.67 -4.90 -4.50 -4.902015 -1.46 5.02 -0.81 -5.39 -0.812016 5.62 6.15 1.00 2.34 1.002017 15.43 16.84 25.03 21.60 25.032018 (thru 09/30) 2.35 2.94 -1.43 1.21 -1.43Cumulative SinceInception
846.13% 360.80% 275.46% 76.25% 61.03%
YearValue Fund
(inception 12/08/93)
MSCI World Index(Hedged to
U.S.$)(1)(3)(5)
(beginning 11/30/93)
S&P 500/MSCIWorld Index(Hedged to
U.S.$)(1)(4)(5)
(beginning 12/08/93)
Worldwide HighDividend Yield
Value Fund(inception 09/05/07)
MSCI World Index(in U.S.$)(1)(5)
(beginning 09/05/07)
MSCI WorldHigh Dividend
Yield Index(in U.S.$)(1)(5)
(beginning 09/05/07)
1993 -0.60% 5.53% 0.18%1994 -0.56 -0.99 1.321995 36.21 20.55 37.591996 22.45 17.94 22.971997 38.87 23.64 33.381998 9.59 21.55 28.581999 2.00 29.09 21.042000 14.45 -8.45 -9.132001 -0.09 -14.00 -11.882002 -14.91 -24.71 -22.092003 23.24 24.43 28.692004 9.43 11.01 10.882005 2.30 16.08 4.912006 11.63 16.89 15.792007 0.60 5.61 5.61 0.32% 2.57% 1.15%2008 -24.37 -38.45 -38.45 -29.35 -40.71 -42.982009 27.60 26.31 26.31 28.18 29.99 32.482010 10.51 10.46 10.46 7.73 11.76 6.292011 -1.75 -5.46 -5.46 4.04 -5.54 3.892012 15.45 15.77 15.77 12.34 15.83 12.242013 22.68 28.69 28.69 18.77 26.68 21.912014 4.02 9.71 9.71 -0.92 4.94 2.482015 -5.39 2.01 2.01 -7.51 -0.87 -3.202016 9.69 9.39 9.39 4.56 7.51 9.292017 16.46 19.13 19.13 22.06 22.40 18.142018 (thru 09/30) 1.84 7.25 7.25 3.12 5.43 1.25Cumulative SinceInception
632.85% 539.89% 670.25% 63.84% 76.71% 49.73%
Past performance is no guarantee of future results.
I-5
Rolling 5-Year Returns for the Tweedy, Browne GlobalValue Fund
As we have written in past reports, equity return streamsare lumpy by their nature, and perhaps nothing illustrates thatbetter than an examination of rolling five-year returns. Thefollowing scatterplot chart tracks the rolling five-year returnsfor our flagship fund since its inception in the summer of1993, and compares those five-year returns to the rolling fiveyear results for its benchmark, the MSCI EAFE Index(Hedged to U.S. dollars). If you take the time to examine it
carefully, the chart reveals a recurring pattern in what hasbeen a 25-plus-year index beating cumulative return stream –the Fund has consistently bested its benchmark in difficultand challenging stock market environments (97% of rollingfive-year down-market periods). In our view, it is the Fund’sresiliency in the face of adversity that has allowed the bulk ofour investors to remain committed during those times whenequity markets are uncooperative. The ability to “stay on thebus” during those bumpy periods is perhaps the mostimportant factor in long-term wealth-building.
Global Value Fund5-Year Rolling Monthly Returns (Net of fees) | June 30, 1993 through September 30, 2018
Out of 244 five-year measurement periods, the Global Value Fund has outperformed the MSCI EAFE Index (Hedgedto U.S.$) 186 times, or 76% of measured periods. Note: periods of relative outperformance have generally clustered in“down” and “normal” markets, while periods of underperformance have generally clustered in “normal” and very“robust,” more speculative market environments.
5-Year Rolling Returns | Global Value Fund & MSCI EAFE Index (Hedged to U.S.$)
Twee
dy, B
row
ne G
loba
l Val
ue F
und
MSCI EAFE Index (Hedged to U.S.$)
Down Market Normal Market Robust Market
-10%
-5%
0%
5%
10%
15%
20%
25%
-10% -5% 0% 5% 10% 15% 20% 25%
TB Global Value FundMSCI EAFE Index(Hedged to U.S.$)
Down Market (Below 0%)5-Year Average Returns – 65 periodsFund beats Index in 97% of periods
4.12% -3.26%*
Normal Market (0-10%)5-Year Average Returns – 99 periodsFund beats Index in 71% of periods
7.85% 5.47%
Robust Market (Above 10%**)5-Year Average Returns – 80 periodsFund beats Index in 66% of periods
14.48% 13.43%
* Corrected from originally published version in which this number was stated as 3.26%.** Corrected from originally published version in which this number was stated as 0%.
The above chart illustrates the five-year rolling returns(monthly data) for the Tweedy, Browne Global Value Fund(the “Fund”), net of fees, since June 30, 1993 (15 days after itsinception) compared to the five-year rolling returns for itsbenchmark, the MSCI EAFE Index (Hedged to U.S.$) (the
“Index”). The horizontal axis represents the returns for theIndex while the vertical axis represents the returns for theFund. The diagonal axis is a line of demarcation separatingperiods of outperformance from periods of underperformance.Plot points above the diagonal axis are indicative of the
I-6

Fund’s relative outperformance, while points below thediagonal axis are indicative of relative Fund underperformance.Returns were plotted for three distinct equity marketenvironments: a “down market” (benchmark return was lessthan 0%); a “normal market” (benchmark return was between0% and 10%); and a “robust market” (benchmark return wasgreater than 10%). There were 244 rolling return periodsbetween June 30, 1993 and September 30, 2018. Pastperformance is no guarantee of future results.
Peer Group Comparisons for the Global Value Fund
The performance of the Global Value Fund also comparesextremely favorably to its value based peers, as evidenced bythe Fund’s high percentile rankings, as of September 30, 2018,in virtually all standardized reporting periods (see thefollowing table created utilizing data provided byMorningstar).
Global Value Fund Rankings vs. Morningstar’s Foreign Large Value UniversePercentile Rank For Various Periods ending September 30, 2018*
Fund/Category Name 6 Month YTD 1 Year 5 Year 10 Year 15 Year 20 Year
TBGVX/ ForeignLarge Value
Top 2%out of
323 Funds
Top 2%out of
318 Funds
Top 3%out of
317 Funds
Top 7%out of
225 Funds
Top 3%out of
146 Funds
Top 5%out of
71 Funds
Top 1%out of
39 Funds
* Morningstar has ranked the Global Value Fund among its peers in the Foreign Large Value Category. Percentile rank in a category isthe Fund’s total-return percentile rank relative to all funds that have the same Morningstar Category. The highest (or most favorable)percentile rank is 1 and the lowest (or least favorable) percentile rank is 100. The top-performing fund in a category will always receive arank of 1. The “out of” number represents the total number of funds in the category for the listed time period. Percentile rank in a categoryis based on total returns, which include reinvested dividends and capital gains, if any, and exclude sales charges. The precedingperformance data represents past performance and is not a guarantee of future results.
“Bonfire of the Currencies”
Jim Grant, in the September 7th issue of his eponymousnewsletter, Grant’s Interest Rate Observer, referenced the“bonfire of the currencies” currently raging in Argentina,Turkey and Brazil. Investor confidence in these markets hasbeen shattered by slowing economic growth, political turmoil,and high Euro and U.S. dollar-based debts. In fact, as you can
see from the chart below, year to date, all major currenciesand nearly all emerging market currencies have lost valuerelative to the U.S. dollar. This rather abrupt turn-around insentiment from last year’s forecasts of continued U.S. dollarweakness has been quite extraordinary, and caught manyinvestors by surprise. It just reinforces what we have alwaysknown: that predicting the future direction of foreigncurrencies is a fruitless exercise.
Selected Global Currencies versus the U.S. dollar (01/01/2018 – 09/30/2018)
-54.92
-37.28
-18.29
-12.09
-11.89
-8.96
-7.94
-7.49
-6.30
-5.27
-3.57
-3.48
-3.34
-2.61
-2.27
-0.89
-0.75
-0.18
Argentine Peso
Turkish Lira
Brazilian Real
Russian Ruble
Indian Rupee
Indonesian Rupiah
Swedish Krona
Australian Dollar
Chilean Peso
Chinese Renminbi
British Pound
South Korean Won
Euro
Canadian Dollar
Singapore Dollar
Japanese Yen
Swiss Franc
Hong Kong Dollar
Source: Bloomberg. Past performance is no guarantee of future results.
I-7

As we have explained in past letters, possible losses fromchanges in currency exchange rates are a risk of investingunhedged in foreign stocks. While a stock may perform wellon the London Stock Exchange, if the British pound declinesagainst the U.S. dollar, your gain can disappear or evenbecome a loss when translated back into U.S. dollars. In
addition, currency fluctuations can be more extreme thanstock market fluctuations. The following chart illustrates theextraordinary interim exchange rate volatility faced by U.S.dollar-based investors in Euro denominated securities sincethe currency’s introduction in 1999.
U.S. dollar/Euro Historical Exchange Rate
0.80
0.90
1.00
1.10
1.20
1.30
1.40
1.50
1.60
1.70
EUR launches 1/1/99Rate: 1.18 at 1/4/99
Current: 1.16 at 9/30/18
Max: 1.60 at 4/22/08
Low: 0.83 at 10/25/00
Recent low: 1.04 at 1/3/17
1/4/992000
2001
2002
2003
2004
2005
2006
2007
2008
2009
2010
2011
2012
2013
2014
2015
2016
2017
20189/30/18
Source: Bloomberg, as of 9/30/18. Past performance is no guarantee of future results.
As we have said before, we pick stocks, but do not pretendto understand the vagaries of foreign currencies. We countour wealth in U.S. dollars and try to avoid the dilution of ourinvestment returns caused by losses in non-U.S. currencies.To that end, the Global Value Fund and Value Fund havechosen to hedge perceived foreign currency exposure backinto the U.S. dollar. The process of hedging allows thoseFunds to largely eliminate perceived currency risk and thusreduce potential currency losses when they investinternationally. Furthermore, we believe that there mayindeed be a “free lunch” in currency hedging, providinghedged investors with significant reductions in interimvolatility at what would appear to be very little to no overallcost in terms of foregone return. For example, since May 31,1993, the closest month end to the inception of the GlobalValue Fund through October 31, 2018 (25 plus year period),the MSCI EAFE Index (Hedged to U.S.$) has compoundedat 5.93% versus 5.00% for the MSCI EAFE Index(Unhedged) while producing a level of volatility that wassignificantly less than that produced by the unhedged index(14.02 versus 15.90). Of course, in the shorter term, there canbe significant unpredictable fluctuations in foreign currencies,which can cause hedged and unhedged returns to varymarkedly.
We realize that while many investors prefer the lessvolatile return stream associated with currency-hedged fundssuch as the Global Value Fund and the Value Fund, otherinvestors prefer to remain exposed to foreign currencies. Forthose investors, the Global Value Fund II – CurrencyUnhedged or the Worldwide High Dividend Yield Value
Fund (unhedged) may be the better choice. At the end of theday, we have no axe to grind when it comes to being hedgedor unhedged. What we would caution against, however, areattempts to time the currency markets by moving moneybetween hedged and unhedged vehicles. Our advice toinvestors is to simply take a hedged or unhedged posture andstick with it over the long term. Either path is likely to lead toa similar destination, but with potentially different levels ofintraperiod volatility.
For shareholders who have further interest in learningmore about how we go about hedging foreign currencyexposure, please read our internal whitepaper entitled, “HowHedging Can Substantially Reduce Foreign Stock CurrencyRisk,” which can be found on the Papers and Speeches pageon our website, www.tweedy.com.
Please note that the individual companies discussed herein were heldin one or more of our Funds during the six-month period endedSeptember 30, 2018, but were not necessarily held in all four ofour Funds. Please refer to the footnotes at the end of this letter foreach Fund’s respective holdings in each of these companies as ofSeptember 30, 2018.
The Evolution of Tweedy, Browne’s InvestmentApproach
Tweedy, Browne will celebrate its 100th birthday in 2020.The firm’s long and colorful history has been intertwined withthe legends of value investing including Benjamin Graham,Warren Buffett, Charlie Munger, and Walter Schloss, amongothers. Over the years, Tweedy, Browne has witnessed the
I-8

post World War II bull market, the rise and fall of the “NiftyFifty,” the punishing stagflation of the late 1970s, the MichaelMilken fed LBO (leveraged buyout) and takeover boom of the1980s, the birth and eventual collapse of the technologybubble in March of 2000, and the debt and real estate fueledfinancial crisis of 2008-2009. In part because of our longtenure and experience, we are often asked to reflect on ourpast in an effort to uncover lessons for the future. Morerecently, we were asked by a prospective investor just how thefirm’s investment approach may have evolved or changedover the years. We thought you would be interested in ourresponse, which began by highlighting what has not changed.
What Has Not Changed
Our adherence to a value approach to investing hasremained the same since the firm began managing its firstinvestment account in the late 1950s. We often say that wehad our first and only investment policy meeting back in1958, when Tom Knapp came over to Tweedy from BenjaminGraham’s firm, Graham-Newman Corporation, and broughtwith him Graham’s framework for evaluating common stocks.We, like Graham, think of stocks as representing fractionalownership interests in businesses. At the heart of ourinvestment operation, we seek to determine the intrinsicvalue of businesses and then invest in those companies sellingin the stock market at a substantial discount to that value.Our hope is that the value gap, or the differential betweenprice and our estimate of the underlying value, closes, and weearn a satisfactory return during the interim. We believe thatrequiring a large discount, which Graham called an investor’s“margin of safety,” as a precondition to investing, protects usagainst permanent capital losses on a fund or portfolio basis.As Graham postulated, such a margin is “available forabsorbing the effect of miscalculations or worse than averageluck,” and he placed “particular emphasis on the ability of theinvestment to withstand adverse developments.”
The intrinsic value of a business can be thought of as theprice a knowledgeable buyer and seller would agree to in anarm’s length negotiated transaction involving the sale of thebusiness. We tend to be conservative appraisers of businessesand have an aversion to investing in highly leveragedbusinesses, in part, because we do not want to compromise ourstaying power. We agree with the notion that “to finish first,you first must finish.” Moreover, since small changes tovaluation metrics can cause large changes in intrinsic value inhighly leveraged businesses, we remain very humble about ourability to predict future events or get the timing right.
Another important and underappreciated aspect of ourapproach is our respect for the behavioral dimension ofinvesting. The awareness and understanding that a stockinvestment is an interest in a business can provide an objectiveanchor, and help to comfort investors during inevitableperiods of stress. With few exceptions, the temperament ofinvestors is often at cross-purposes with good decision-making,and swamps the ability to think logically and unemotionallyduring difficult markets. Remembering that you own aninterest in a business focuses the mind on more knowable andobjective factors, and it helps to avoid being swept up in theemotional optimism or pessimism of the day.
Although there are many approaches to investing in thestock market, we believe our approach is theoretically sound;the Firm is both culturally and temperamentally suited toadhering to it; it works worldwide; and the approach hashistorically produced a very long, albeit lumpy, record ofinvestment success.
What Has Changed
Business Valuation Multiples Have Increased The key driversof business valuations over time – interest rates and growth inearnings per share – have not changed. However, the sharpdecline in interest rates over the last 38 years has caused us toincrementally increase our valuation multiples, althoughreluctantly and with a lag. Readily observable increases inmerger and acquisition deal multiples provide real life proof ofthe power that significant changes in interest rates can haveon business values. That said, Graham’s requirement of asignificant “margin of safety” when evaluating businesses anddetermining purchase prices remains paramount in ourinvestment process.
Emphasis on the Qualitative Aspects of a Business Advancesin technology have dramatically increased the speed, quantityand type of information available to investors. However, moredata does not always mean better judgment. There is a naturalhuman tendency to focus on the most recent data or news,regardless of long-term impact. With the push of a button, acompany’s financial record is instantly available, and anyonewith financial acumen can readily assess a company’s businessand financial position. This instant and ubiquitous flow ofinformation, in our view, has contributed to a narrowing ofvaluation discrepancies in our markets, and the opportunitiesto buy statistically cheap “cigar butt” type stocks are fewer andfewer today.
We have adapted to the realities of the opportunity setavailable to us by placing greater emphasis on the qualitativeaspects of businesses. This has often drawn us to businesses thathave what we perceive to be durable and sustainablecompetitive advantages, which can act as a moat to help fendoff Schumpeterian2 attacks from competitors. Such advantageswould include high switching costs, valuable intangible assets,lower costs of production, and network effects, among a host ofothers. These companies are often able to earn outsized returnson capital, which would have a tendency to mean revertwithout the protection of the moat. We often refer to thesehigher quality businesses as “compounders,” because they cansustain these high returns on capital over long periods of time.Assuming a reasonable price to value relationship ismaintained, we may own these types of companies for manyyears, and in some instances, decades.
The softer, qualitative side of security analysis involves, asCharlie Munger has said, “the hard to measure stuff” that isoften more important in investment decision-making, and isoften critical in giving us the confidence to take a longer-termpoint of view. In this part of our research, we read the sourcedocuments, speak directly to management, query competitors2 References Joseph Schumpeter, the Austrian economist (1883-1950), and his theory of the “creative destruction” of capitalismthat results from competitive innovation.
I-9

and industry experts in an effort to examine in detail theefficacy of their business models, all the while paying heed tothe presence of characteristics that may indicate the existenceof a durable competitive advantage. Our experienced team isable to separate the key factors impacting an investment fromthe deluge of information that comes at us as quickly (itseems) as water from a fire hose. Although we are by nomeans perfect, our institutional memory helps us avoidrepeating mistakes made in the past. Examining insiderbuying activity often tips us to either accept or reject aninvestment idea. We think long term, and try to block out theday-to-day noise and temptation to trade that comes from aflood of brokerage house recommendations hitting our emailin-boxes and the continuous news flow from financial serviceproviders and market commentators.
The key take away is that we still operate with a strongvaluation discipline, but we have increasingly incorporatedthe qualitative aspects of a business into our analysis. While“compounders” have played an increasing role in our Fundportfolios over time, we are still quite happy to buystatistically cheap “cigar butt” value stocks when available.
Owner Earnings Yield – Metric that Considers Corporate TaxRates In an effort to better incorporate disparities in corporatetax rates around the world, we have added what we call an“owner earnings yield” to our valuation analysis. A metric(multiple) such as Enterprise Value to Earnings BeforeInterest and Taxes (EV to EBIT) is designed to adjust fordifferent capital structures among corporations, but it fallsshort in capturing the impact of different corporate tax rates.The owner earnings yield helps solve this problem and iscalculated by dividing Net Operating Profit After Tax byEnterprise Value (NOPAT to EV). As we have written inpast reports, we believe the “Happy Zone” in terms of anacceptable purchase price for an investment is an ownerearnings yield of 8% to 10%, which translates inversely into adebt free price earnings ratio of between 12.5x and 10x.
Increasing Exposure to Technology Stocks Investing intechnology businesses has generally been difficult for many, ifnot most, value investors, largely due to high potential rates oftechnological obsolescence and high entry point pricing,often predicated on rapid rates of future revenue and/orearnings growth. While this continues to be the case in mostinstances, there have been opportunities of late where ourconfidence in the prospective business dynamics of atechnology company and its price have come together toprovide what we believe to be an attractive investmentopportunity. What is noteworthy about our more recenttechnology investments is that, in our view, the businessesgenerally are financially strong, have a favorable outlooksupported by a strong competitive position, and have hadrapidly growing earnings. By contrast, the few investments wehad made in technology stocks decades ago often involvedcompanies whose growth had begun to slow. While cheap byany statistical measure at the time, in retrospect we think ofthem as “melting icebergs.” Our thinking has evolved withrespect to investing in the technology sector. What hasn’tchanged when it comes to investing in technology is ourinsistence on a reasonable price. Our more recent investmentsin higher quality technology companies have all traded at
entry point prices that were at discounts to reasonablyconservative estimates of intrinsic value. It is this latter pricediscount component that is often missing in most prospectivetechnology investments.
The technology component of the equity markets hasexpanded over the decades from semiconductors, computinghardware and communications equipment businesses toinclude more asset-light businesses such as software, internet,e-commerce, social media and payment companies. They allrely heavily on some form of technology to operate, but theirbusiness models are diverse, and dividing them into subsectorsmay be a better way to think about them. For example, areGoogle and Facebook really tech companies, or more in thenature of media and advertising companies? Is Apple really atech company, or a luxury branded consumer productscompany? Is Amazon really a tech company, or a retailing anddistribution business?
Today, we own a number of technology holdings acrosssome or all of our four mutual funds, including companiessuch as Cisco, Google, Baidu, Sina and MasterCard. In ourflagship fund, as of September 30, 2018, we had a modestlyhigher than market index weighting in technology stocks(including Information Technology and the CommunicationServices subgroup, Interactive Media & Services), a far cryfrom where we were just six years ago. All but Cisco andMasterCard are advertising-based business models with highreturns on capital, dominant market shares and havedisruptive business models. It is much easier for us tounderstand these business models than, say, a computerhardware maker where research and development (R&D)spending is large, there is a high risk of product obsolescence,and the rate of change is high. The trick, of course, is to buythese businesses at sensible prices, which is what we believewe have been able to do.
We have largely avoided the FAANG stocks, as we havebeen unable to get comfortable with their respectivevaluations. We did have a pricing opportunity in Googlemany years back when the stock traded at around 10 timesone-year forward earnings before interest, taxes andamortization (EBITA), and had a forward cash adjusted price/earnings ratio of 12x. In addition, we felt that it couldcontinue to grow revenue at 20% or more annually. Today, ittrades at over $1,000 per share or at roughly 16 timesestimated 2019 EBITA; however, Google is a compounderand we believe that it can continue to grow its revenues at awell above average rate for many years to come. More recentinvestments, Baidu and Sina, qualified for purchase using asimilar valuation framework to that used in our Googleanalysis.
New Investments in China We have been investing inChina indirectly for many years through our holdings inmultinational businesses and have become reasonablyknowledgeable about the economic landscape in that country.Until recently, we have limited our investments in China toHong Kong-based businesses. Lately, however, perhaps in partbecause familiarity may be breeding grudging respect, we havemade investments in two mainland Chinese companiesthrough U.S. listed securities. China is unique in that, while itis still very much led by a communist government, it has
I-10

implemented a highly effective form of controlled capitalism,which has produced the economic growth engine for much ofthe world over the last 20 years. It is no longer a market thatwe can simply ignore. That said, we have a healthy skepticismaround Chinese corporate governance issues and accept thatits stock market is relatively immature, and thus at timesprone to wild fluctuations in prices. The government stillowns or controls many of the listed and traded companiesboth on the Shanghai and Hong Kong exchanges, andinvestors remain somewhat silent partners with limitedrecourse should the government decide to intercede in thesebusinesses. Our approach in managing this risk is to be highlyselective with respect to the companies in which we invest,and disciplined, price sensitive buyers of the stocks we pick.Our first Chinese investment, Baidu, met all of our qualifyingcriteria. It is by all appearances one of the crown jewels ofChinese internet commerce, along with two other dominantChinese technology companies, Alibaba and Tencent. Todate, China has been highly protective of these enterprisesand, in our view, wants them to succeed.
In response to a question posed at the Berkshire Hathawayannual meeting back in May, Charlie Munger remarked,“American investors are missing China, and they’re missing itbecause it is a long way away, it looks different, they’re not usedto it, it’s complicated, the headlines confuse them. In otherwords, it just looks too hard, sitting in Omaha to outsmart theChinese market. But I think you are absolutely right, it’s wherethey should be looking.” We would agree.
Market Anxiety Equals Opportunity: New Ideas
As the bull market gained momentum over the last tenyears, it often presented a difficult environment for priceconscious investors. Bargains were simply hard to come by.More recently, however, the screw appears to be turning,particularly in equity markets outside the United States.Slowing economic growth, the beginnings of monetaryrestraint, political upheavals, and increasing fear of tradedisputes has fueled greater volatility in equity markets andcurrencies that has in turn spawned a richer opportunity setthan we have seen in some time.
Over the last year and a half, we have added a number ofnew investments to our Fund portfolios. In all but oneinstance, these new investments have consisted of non-U.S.businesses, with several coming from the emerging markets,where fear of slowing growth and roiling currencies hassparked pricing opportunities. This includes companies thatare either based, or have business interests in, South Korea,Hong Kong, Africa and China. Several of our newinvestments have been in smaller and medium capitalizationcompanies, and in a number of instances, undervaluation hassurfaced because of fear of disruption from Amazon or othertechnology companies such as Google and Facebook. In othercases, insider buying by officers and directors and/or by thecompany itself has tipped our decision.
Among others, these new buys have included Baidu, oftenreferred to as the Chinese Google; AutoZone, the U.S.-basedauto parts retailer; LG Corporation, the South Koreanindustrial conglomerate; Inchcape, the UK-based automobiledistributor; Vertu, a local UK-based auto dealership; Tarkett,
the French-based commercial flooring company; Hang Lung,a Hong Kong-based real estate developer; CNH, an Italian-based agricultural equipment manufacturer and truckingbusiness; Sina, a Chinese holding company with a controllinginterest in Weibo (popular social media company); andBollore, the French-based holding company with investmentsin African logistics businesses and a European mediacompany. Let’s take a look at two of these new positions ingreater detail.
Tarkett, which is owned and controlled by the Deconinckfamily of France, is the world’s third largest flooring companyafter Shaw and Mohawk. With an approximate marketcapitalization of €1.24 billion, it is a small to mediumcapitalization company. Flooring essentially consists ofdesigning, manufacturing and then distributing things likecarpet and vinyl for commercial (70% of sales) and residentialuse (30% of sales). While the business is economically cyclical,approximately 80% of Tarkett’s end demand is driven byrenovation and just 20% by new construction. Despite beingsomewhat cyclical and sensitive to raw material inflation, webelieve flooring is a very good business. Tarkett hasconsistently earned a 20% return on tangible invested capital,and Mohawk, a U.S.-based player, generates a high-teensfigure. Both companies appear to have “pricing power” andhave earned relatively stable-to-increasing margins over time.
Flooring is very much a local business, yet it benefitsgreatly from economies of scale. Each region has differentproduct preferences, and flooring products are expensive todistribute relative to their underlying cost. They are also soldto a fragmented customer base of contractors and architects.These dynamics necessitate local production, distribution andsales. However, the business also requires manufacturing anddistributing a wide variety of inventory quickly, whichbenefits larger players with purchasing power and scale.
As a result of its high returns on capital, Tarkett is verycash generative. Given the benefits of scale and thefragmented nature of the industry, management has allocatedmuch of the company’s free cash flow to acquisitions and itappears that it will continue to do so. In fact, Tarkett hasacquired 22 companies since 2007. We believe the companyshould be able to grow its revenues organically at a 2.5% to3% rate, continue to make acquisitions, and generate somemodest margin increases over time. As we write, the dividendyield is approximately 3%, and the company’s leverage isreasonably low at ~1.6x net debt/earnings before interest,taxes, depreciation and amortization (EBITDA).
We got a pricing opportunity in Tarkett’s shares in Maylargely due to increasing raw material prices, i.e., oil prices,which reduced Tarkett’s operating income. As noted above,the company appears to enjoy pricing power, which shouldallow it to offset these increases in raw material costs overtime. However, given its cyclicality, we used a normalizedEBITA figure for valuation purposes. Management believesthat the company can achieve a 12% EBITDA margin on asustainable basis. It also estimates “ongoing” or maintenancecapital expenditures (capex) to be 3.5% of sales (consistentwith historical figures), which would imply an 8.5% EBITAmargin. Assuming such a margin, our first share purchaseswere made at roughly 8.8x EV to normalized EBITA, which
I-11
works out to an 8% owner earnings yield, assuming thecompany’s current 30% tax rate.
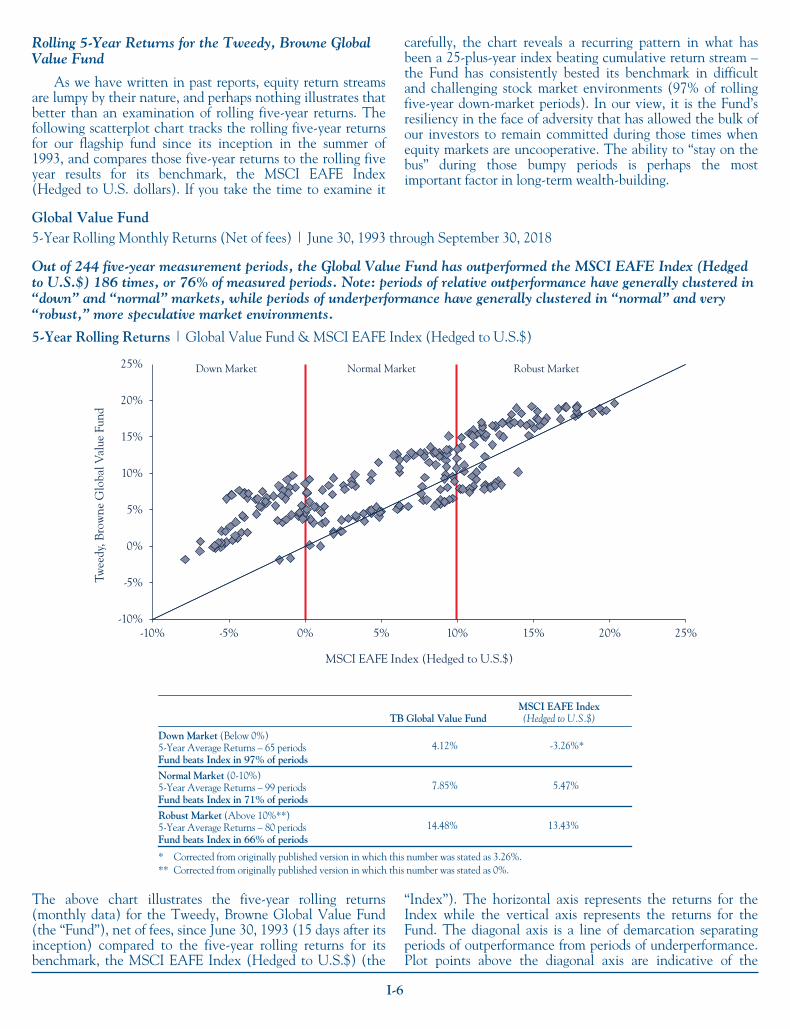
Sina Corporation is a Chinese internet company whosemain asset is its 45.7% stake in Weibo. Weibo is a leadingsocial media platform in China, with 431 million monthlyactive users (MAU) and 190 million daily active users(DAU). Weibo was launched by Sina in 2009 (three yearsafter Twitter in the U.S.), and since inception it hascultivated an ecosystem of online celebrities on its platform(known in China as Key Opinion Leaders, ‘KOLs’), whogenerate significant content on Weibo. These KOLs producecontent that attracts large numbers of ‘followers’, helpingWeibo to grow its user base. The KOLs rely on Weibo to growand engage with their fan base, and they are able to monetizeuser traffic through social commerce, for example, throughbrand sponsorship or promoting their own private labelproducts on Weibo. The commercial opportunitiesincentivize more content creation, which in turn attractsmore Weibo users and also other KOLs, thus reinforcing thenetwork effects of Weibo’s platform.
Weibo monetizes its user traffic primarily throughadvertising, which accounted for 87% of 2017 revenues. Weiboonly started generating revenues in 2012, and revenues havegrown significantly since then. Weibo grew total revenues75.4% in 2017, driven by an 85% increase in advertisingrevenues from Key Accounts (large brand advertisers), and a73% increase from SMEs (small and medium enterprises). In2018, Weibo is expected to grow total reported revenues (inUSD) at a rate of 50% or more year over year, which includesthe impact of depreciation of Chinese currency (the renminbi)this year. Overall online advertising in China grew 29% in2017, and, in our view, has the potential to grow at a 25%compound average growth rate (CAGR) from 2017 through2019. More specifically, social advertising in China isforecasted to grow at a higher rate (47% CAGR) over the sameperiod. Social advertising only comprised 11% of total onlineadvertising spend in China in 2017, much lower than the 25%in the U.S., which suggests significant room for growth.
The rest of Sina’s businesses include a portal advertisingbusiness and investments in fintech services (online paymentsand online loan facilitation). These businesses (the “Sinastub”) generated an operating loss in 2017, and are alsoexpected to generate a loss in 2018, due to tightening ofgovernment regulation in fintech. However, assigning zerovalue for the Sina stub, and assuming book value for Sina’sparent-level cash and investments portfolio, we acquiredexposure to Weibo through Sina at a ‘look through’ multipleof under 10x (based on Weibo’s one-year forward EBIT),which we viewed as an attractive valuation for a companywith significant growth prospects.
Our purchase of Sina shares are not without considerablecorporate governance and fundamental risks, which includegovernance concerns related to the CEO, risk of tighteninggovernment regulation in the Chinese internet sector, andrisk of increasing competition from other social or newsfeedcompanies. However, we feel these risks are more than offsetby a compelling pricing opportunity and what we perceive tobe a long runway of attractive future growth. On a positivenote, the latest second quarter earnings for Weibo showed
solid user growth (MAU and DAU up 19% each year overyear), so Weibo looks to be growing users nicely despiteincreasing competition.
All of that said, the Chinese equity market has beenhighly volatile of late and the market as a whole is off morethan 26% from its highs due in part to perceptions of slowingeconomic growth, increasing fears of a full-out trade war, anda depreciating renminbi. While we believe this enhancedvolatility is giving us an attractive pricing opportunity in afinancially strong company that has grown at a very attractiverate, our investment in Sina will likely require patience andfortitude.
Great Reads
We are often asked about what we are reading and wouldbe willing to recommend to others. Here are just a few of thebooks that have crossed our desks of late. Enjoy!
A Man For All Markets Edward O. Thorp’s engagingautobiography of one of our industry’s first hedge fundmanagers and quantitative investment pioneers.
The End of Theory Richard Bookstaber’s engrossingexamination of the dynamics of a financial crisis and thehuman component that is at its core.
The Four Scott Galloway’s entertaining and insightfullook at Amazon, Facebook, Apple, and Google and thepromise and threat they present.
Misbehaving: The Making of Behavioral EconomicsRichard H. Thaler, the Nobel Memorial Prize winningeconomist, tracks the evolution of behavioral economics, itsimpact on the field of finance, and most importantlyinvestment decision-making.
Mastering the Market Cycle As a follow up to hisilluminating classic, The Most Important Thing, HowardMarks examines market cycles and how investors canstructure their portfolios to take advantage of them. It is amust read for value investors.
Factfulness Hans Rosling’s refreshing and optimistic newbook about using factfulness to overcome misconception,hyperbole, and ignorance.
On A Humble Note
The humble attitude is a flexible attitude. Just as the treeand the building must sway with the wind, our agility indealing with whatever life throws our way can become ourstrength. Inherent in humility resides an open andreceptive mind. We don’t know all the answers to life,and sometimes not even the right questions have beenrevealed to us. Humility can be a strength that serves well;it leaves us more open to learn from others and refrainsfrom seeing issues and people only in blacks and whites ...The opposite of humility is arrogance – the belief that weare wiser or better than others. Arrogance promotesseparation rather than community. It looms like a brickwall between us and those from whom we could learn.
- Sir John Templeton, Worldwide Laws of Life (1997)
I-12

Ben Graham and David Dodd’s magnum opus, SecurityAnalysis, offers investors an elegant framework for investingand building wealth. Of all the investment disciplines, valueinvesting is the one most grounded in humility. It focuses onthe knowable and seeks to protect against that which couldcause loss. It rewards curiosity, constrains overconfidence, isfact dependent, and requires a significant margin of safety forinvestment. As we reflect on this aging bull market’scontinuing advance, and the remarkable performance to dateof the FAANGs, we remind ourselves of the admonition tothe Roman conqueror at the beginning of this report ... that“all glory is fleeting.”
Thank you for investing with us, and for your continuedconfidence. We work hard to earn and keep your trust, andwe believe it is critical to our mutual success.
Sincerely,
William H. Browne, Roger R. de Bree,Frank H. Hawrylak, Jay Hill, Thomas H. Shrager,John D. Spears, Robert Q. Wyckoff, Jr.Investment CommitteeTweedy, Browne Company LLC
October 2018
Footnotes:(1) Indexes are unmanaged, and the figures for the indexes
shown include reinvestment of dividends and capital gainsdistributions and do not reflect any fees or expenses.Investors cannot invest directly in an index.
(2) The MSCI EAFE Index is a free float-adjusted, marketcapitalization weighted index that is designed to measure theequity market performance of developed markets, excludingthe U.S. and Canada. The MSCI EAFE Index (in U.S.$)reflects the return of the MSCI EAFE Index for a U.S.dollar investor. The MSCI EAFE Index (Hedged toU.S.$) consists of the results of the MSCI EAFE Indexhedged 100% back into U.S. dollars and accounts forinterest rate differentials in forward currency exchangerates. Results for both indexes are inclusive of dividends andnet of foreign withholding taxes.
(3) Inception dates for the Global Value Fund, Global ValueFund II, Value Fund and Worldwide High Dividend YieldValue Fund are June 15, 1993, October 26, 2009,December 8, 1993, and September 5, 2007, respectively.Prior to 2004, information with respect to the MSCI EAFEand MSCI World Indexes used was available at month endonly; therefore, the since-inception performance of theMSCI EAFE Indexes quoted for the Global Value Fundreflects performance from May 31, 1993, the closest monthend to the Global Value Fund’s inception date, and thesince inception performance of the MSCI World Indexquoted for the Value Fund reflects performance fromNovember 30, 1993, the closest month end to the ValueFund’s inception date.
(4) The S&P 500/MSCI World Index (Hedged to U.S.$) is acombination of the S&P 500 Index and the MSCI World
Index (Hedged to U.S.$), linked together by Tweedy,Browne, and represents the performance of the S&P 500Index for the periods 12/8/93 – 12/31/06 and theperformance of the MSCI World Index (Hedged to U.S.$)beginning 1/01/07 and thereafter (beginning December2006, the Fund was permitted to invest more significantly innon-U.S. securities). The S&P 500 Index is a marketcapitalization weighted index composed of 500 widely heldcommon stocks that assumes the reinvestment of dividends.The index is generally considered representative of U.S.large capitalization stocks.
(5) The MSCI World Index is a free float-adjusted marketcapitalization weighted index that is designed to measure theequity market performance of developed markets. TheMSCI World Index (in U.S.$) reflects the return of thisindex for a U.S. dollar investor. The MSCI World Index(Hedged to U.S.$) consists of the results of the MSCIWorld Index with its foreign currency exposure hedged100% back into U.S. dollars. The index accounts forinterest rate differentials in forward currency exchangerates. The MSCI World High Dividend Yield Index reflectsthe performance of equities in the index (excluding REITs)with higher dividend income and quality characteristics thanaverage dividend yields that are both sustainable andpersistent. The index also applies quality screens andreviews 12-month past performance to omit stocks withpotentially deteriorating fundamentals that could force themto cut or reduce dividends. The MSCI World HighDividend Yield Index (in U.S.$) reflects the return of theMSCI World High Dividend Yield Index for a U.S. dollarinvestor. Results for each index are inclusive of dividendsand net of foreign withholding taxes.
(6) As of September 30, 2018, Global Value Fund, GlobalValue Fund II, Value Fund and Worldwide High DividendYield Value Fund had each invested the followingpercentages of its net assets, respectively, in the followingportfolio holdings:
Global Value Global Value II Value Worldwide
Alibaba 0.0% 0.0% 0.0% 0.0%
Alphabet (Google) 1.9% 0.0% 2.9% 0.0%
Amazon 0.0% 0.0% 0.0% 0.0%
Apple 0.0% 0.0% 0.0% 0.0%
Baidu 1.9% 1.9% 2.2% 0.0%
Bollore 0.0% 1.0% 0.0% 0.0%
Cisco Systems 2.3% 2.4% 2.8% 2.8%
CNH Industrial 0.5% 1.2% 1.2% 0.0%
Facebook 0.0% 0.0% 0.0% 0.0%
Hang Lung Group 0.4% 0.4% 0.5% 0.0%
Inchcape 0.5% 0.5% 0.5% 0.8%
LG Corp 0.6% 1.1% 0.7% 0.0%
MasterCard 0.0% 1.8% 3.3% 0.0%
Mohawk 0.0% 0.0% 0.0% 0.0%
Netflix 0.0% 0.0% 0.0% 0.0%
Shaw 0.0% 0.0% 0.0% 0.0%
Sina Corp 0.9% 0.8% 0.0% 0.0%
Tarkett 0.7% 0.0% 0.7% 0.0%
I-13

Global Value Global Value II Value Worldwide
Tencent 0.0% 0.0% 0.0% 0.0%
Vertu Motors 0.1% 0.0% 0.0% 0.0%
Mention of a specific security should not be considered arecommendation to buy or a solicitation to sell that security.Holdings are subject to change at any time.
The views expressed represent the opinions of Tweedy,Browne Company LLC as of the date of this letter, are notintended as a forecast or guarantee of future results, and aresubject to change without notice.
Current and future portfolio holdings are subject to risk.Investing in foreign securities involves additional risks beyondthe risks of investing in U.S. securities markets. These risksinclude currency fluctuations; political uncertainty; differentaccounting and financial standards; different regulatoryenvironments; and different market and economic factors invarious non-U.S. countries. In addition, the securities ofsmall, less well known companies may be more volatile thanthose of larger companies. Value investing involves the riskthat the market will not recognize a security’s intrinsic valuefor a long time, or that a security thought to be undervaluedmay actually be appropriately priced when purchased.Dividends are not guaranteed, and a company currentlypaying dividends may cease paying dividends at any time.Diversification does not guarantee a profit and does notprotect against a loss in a declining market. Please refer to theFunds’ prospectus for a description of risk factors associatedwith investments in securities which may be held by theFunds.
Although the practice of hedging against currency exchangerate changes utilized by the Tweedy, Browne Global ValueFund and Tweedy, Browne Value Fund reduces the risk of lossfrom exchange rate movements, it also reduces the ability ofthe Funds to gain from favorable exchange rate movementswhen the U.S. dollar declines against the currencies in whichthe Funds’ investments are denominated and in some interestrate environments may impose out-of-pocket costs on theFunds.
Stocks and bonds are subject to different risks. In general,stocks are subject to greater price fluctuations and volatilitythan bonds and can decline significantly in value in responseto adverse issuer, political, regulatory, market or economic
developments. Unlike stocks, if held to maturity, bondsgenerally offer to pay both a fixed rate of return and a fixedprincipal value. Bonds are subject to interest rate risk (asinterest rates rise bond prices generally fall), the risk of issuerdefault, issuer credit risk, and inflation risk, although U.S.Treasuries are backed by the full faith and credit of the U.S.Government.
Price/earnings (or P/E) ratio is a comparison of thecompany’s closing stock price and its trailing 12-monthearnings per share. Enterprise Value (or EV) is a measure of acompany’s total value (market value of common stock +market value of preferred equity + market value of debt +minority interest – cash and investments). Earnings beforeinterest and tax (or EBIT) is an indicator of a company’sprofitability, calculated as revenue minus expenses, excludingtax and interest. Earnings before interest, taxes andamortization (or EBITA) is used to gauge a company’soperating profitability (earnings before tax + interest expense+ amortization expense). Net operating profit after tax (orNOPAT) is earnings before interest and taxes (EBIT)adjusted for the impact of taxes.
This letter contains opinions and statements on investmenttechniques, economics, market conditions and other matters.There is no guarantee that these opinions and statements willprove to be correct, and some of them are inherentlyspeculative. None of them should be relied upon asstatements of fact.
Morningstar, Inc. All Rights Reserved. The informationcontained herein: (1) is proprietary to Morningstar and/or itscontent providers; (2) may not be copied or distributed; and(3) is not warranted to be accurate, complete or timely.Neither Morningstar nor its content providers are responsiblefor any damage or losses arising from any use of thisinformation. Past performance is no guarantee of futureresults.
Tweedy, Browne Global Value Fund, Tweedy, Browne GlobalValue Fund II – Currency Unhedged, Tweedy, Browne ValueFund, and Tweedy, Browne Worldwide High Dividend YieldValue Fund are distributed by AMG Distributors, Inc.,Member FINRA/SIPC.
This material must be preceded or accompanied by aprospectus for Tweedy, Browne Fund Inc.
I-14

TWEEDY, BROWNE FUND INC.
Tweedy, Browne Global Value FundTweedy, Browne Global Value Fund II – Currency UnhedgedTweedy, Browne Value FundTweedy, Browne Worldwide High Dividend Yield Value Fund
SEMI-ANNUAL REPORT
September 30, 2018
II-1

TWEEDY, BROWNE FUND INC.
Expense Information (Unaudited)
A shareholder of the Global Value Fund, Global ValueFund II – Currency Unhedged, Value Fund or WorldwideHigh Dividend Yield Value Fund (collectively, the “Funds”)incurs two types of costs: (1) transaction costs and(2) ongoing costs, including management fees and otherFund expenses. The Example below is intended to help ashareholder understand the ongoing costs (in U.S. dollars) ofinvesting in the Funds and to compare these costs with theongoing costs of investing in other mutual funds.
The Example is based on an investment of $1,000invested at the beginning of the period and held for theentire period of April 1, 2018 to September 30, 2018.
Actual Expenses. The first part of the table presentedbelow, under the heading “Actual Expenses,” providesinformation about actual account values and actualexpenses. The information in this line may be used with theamount a shareholder invested to estimate the expenses thatwere paid by the shareholder over the period. Simply dividethe shareholder’s account value by $1,000 (for example, an$8,600 account value divided by $1,000 = 8.6), thenmultiply the result by the number in the first line under theheading entitled “Expenses Paid During Period” to estimatethe expenses paid during this period.
Hypothetical Example for Comparison Purposes. Thesecond part of the table presented below, under the heading“Hypothetical Expenses,” provides information abouthypothetical account values and hypothetical expensesbased on each Fund’s actual expense ratio and an assumed
rate of return of 5% per year before expenses, which is noteach Fund’s actual return. The hypothetical account valuesand expenses may not be used to estimate the actual endingaccount balance or expenses paid by the shareholder of theFunds for the period. This information may be used tocompare the ongoing costs of investing in the Funds to otherfunds. To do so, compare this 5% hypothetical example withthe 5% hypothetical examples that appear in theshareholder reports of the other funds.
Please note that the expenses shown in the table beloware meant to highlight a shareholder’s ongoing costs onlyand do not reflect redemption fees. Redemptions from theGlobal Value Fund, the Global Value Fund II – CurrencyUnhedged and the Worldwide High Dividend Yield ValueFund, including exchange redemptions, made less than15 days after purchase are subject to a redemption fee equalto 2% of the redemption proceeds, which will be retained bythe Funds. There are no other transactional expensesassociated with the purchase and sale of shares charged byany of the Funds, such as commissions, sales loads and/orredemption fees on shares held longer than 14 days. Othermutual funds may have such transactional charges.Therefore, the second part of the table is useful in comparingongoing costs only, and will not help a shareholderdetermine the relative total costs of owning different funds.In addition, if redemption fees were included, a shareholder’scosts (if the shareholder redeemed during the applicableredemption period) would have been higher.
Actual ExpensesHypothetical Expenses
(5% Return before Expenses)
BeginningAccountValue4/1/18
EndingAccountValue
9/30/18
ExpensesPaid During
Period*4/1/18 –9/30/18
BeginningAccountValue4/1/18
EndingAccountValue
9/30/18
ExpensesPaid During
Period*4/1/18 –9/30/18
AnnualizedExpense
Ratio
Global Value Fund $1,000.00 $1,045.50 $6.92 $1,000.00 $1,018.30 $6.83 1.35%
Global Value Fund II –Currency Unhedged $1,000.00 $1,018.60 $6.83 $1,000.00 $1,018.30 $6.83 1.35%
Value Fund $1,000.00 $1,047.40 $6.93 $1,000.00 $1,018.30 $6.83 1.35%
Worldwide High DividendYield Value Fund $1,000.00 $1,040.30 $6.90 $1,000.00 $1,018.30 $6.83 1.35%
* Expenses are equal to each Fund’s annualized expense ratio, multiplied by the average account value over the period,multiplied by the number of days in the period (183), divided by 365 (to reflect the one-half year period).
II-2

Tweedy, Browne Global Value Fund
Portfolio of InvestmentsSeptember 30, 2018 (Unaudited)
Shares Value*
COMMON STOCKS—88.8%
Canada—1.4%89,692 E-L Financial Corp., Ltd. . . . . . . . . . . . . . . . $56,907,513
1,489,895 National Bank of Canada . . . . . . . . . . . . . . . 74,356,434131,263,947
Chile—1.5%12,841,526 Antofagasta plc . . . . . . . . . . . . . . . . . . . . . . . 143,178,560
China—2.7%778,577 Baidu Inc., Sponsored ADR(a) . . . . . . . . . . . . 178,044,988
1,172,400 Sina Corp.(a) . . . . . . . . . . . . . . . . . . . . . . . . . 81,458,352259,503,340
Czech Republic—0.0%(b)
2,800 Philip Morris CR a.s. . . . . . . . . . . . . . . . . . . . 1,879,554
France—15.0%755,237 Cie Generale des Etablissements Michelin . . 90,308,085
6,011,377 CNP Assurances . . . . . . . . . . . . . . . . . . . . . . 144,950,0403,798,080 Safran SA . . . . . . . . . . . . . . . . . . . . . . . . . . . 532,461,7365,957,840 SCOR SE . . . . . . . . . . . . . . . . . . . . . . . . . . . 276,799,8512,706,412 Tarkett SA . . . . . . . . . . . . . . . . . . . . . . . . . . 69,282,3374,749,815 Total SA . . . . . . . . . . . . . . . . . . . . . . . . . . . 308,062,709
1,421,864,758
Germany—6.9%3,639,033 Axel Springer SE . . . . . . . . . . . . . . . . . . . . . 244,938,1651,747,030 Henkel AG & Company, KGaA . . . . . . . . . 185,567,150
647,607 Krones AG . . . . . . . . . . . . . . . . . . . . . . . . . . 67,960,52442,354 KSB AG . . . . . . . . . . . . . . . . . . . . . . . . . . . . 15,545,280
226,799 Linde AG . . . . . . . . . . . . . . . . . . . . . . . . . . . 53,659,817377,440 Muenchener Rueckversicherungs AG . . . . . . 83,623,722
651,294,658
Hong Kong—1.0%26,265,000 Emperor Entertainment Hotel Ltd. . . . . . . . . 5,034,8895,639,882 Great Eagle Holdings Ltd. . . . . . . . . . . . . . . . 28,181,751
15,995,508 Hang Lung Group Ltd. . . . . . . . . . . . . . . . . . 42,518,954434,500 Jardine Strategic Holdings Ltd. . . . . . . . . . . . 15,772,35059,000 Miramar Hotel & Investment . . . . . . . . . . . . 110,838
2,561,000 Tai Cheung Holdings Ltd. . . . . . . . . . . . . . . 2,618,30894,237,090
Italy—0.6%144,268 Buzzi Unicem SpA . . . . . . . . . . . . . . . . . . . . 2,996,088
4,763,086 SOL SpA(c) . . . . . . . . . . . . . . . . . . . . . . . . . . 57,093,30060,089,388
Japan—1.7%2,111,900 Ebara Corporation . . . . . . . . . . . . . . . . . . . . 72,885,0461,359,500 Honda Motor Company Ltd. . . . . . . . . . . . . 41,161,425
36,000 Konishi Company Ltd. . . . . . . . . . . . . . . . . . 567,3281,433,800 NGK Spark Plug Company Ltd. . . . . . . . . . . 41,782,612
164,400 Nippon Kanzai Company Ltd. . . . . . . . . . . . . 3,111,855193,700 Shizuoka Gas Company Ltd. . . . . . . . . . . . . . 1,717,268
161,225,534
Shares Value*
Mexico—0.3%516,608 Coca-Cola Femsa SA de CV, Sponsored
ADR(e) . . . . . . . . . . . . . . . . . . . . . . . . . . . $31,637,074
Netherlands—6.5%3,138,711 Heineken Holding NV . . . . . . . . . . . . . . . . . 284,356,3677,484,098 Royal Dutch Shell plc, Class A . . . . . . . . . . . 257,087,6681,369,620 Unilever NV, CVA . . . . . . . . . . . . . . . . . . . 76,302,991
617,747,026
Norway—0.0%(b)
75,000 Schibsted ASA, Class B . . . . . . . . . . . . . . . . 2,597,227
Singapore—4.2%11,470,201 DBS Group Holdings Ltd. . . . . . . . . . . . . . . . 219,019,6839,208,541 United Overseas Bank Ltd. . . . . . . . . . . . . . . 182,506,159
401,525,842
South Korea—4.3%248,749 Chokwang Paint Ltd. . . . . . . . . . . . . . . . . . . 1,731,208150,900 Daegu Department Store Company Ltd. . . . . 1,251,548144,547 Hankook Tire Worldwide Company Ltd. . . . 2,345,590210,000 Hyundai Mobis Company Ltd. . . . . . . . . . . . 43,164,300
1,481,635 Hyundai Motor Company . . . . . . . . . . . . . . . 172,974,291131,339 Kangnam Jevisco Company Ltd. . . . . . . . . . . 3,303,456
3,815,017 Kia Motors Corporation . . . . . . . . . . . . . . . . 120,718,591815,800 LG Corporation . . . . . . . . . . . . . . . . . . . . . . 53,393,807132,553 Samchully Company Ltd. . . . . . . . . . . . . . . . 12,427,777
411,310,568
Spain—0.5%6,022,676 Mediaset España Comunicacion SA . . . . . . . 44,000,455
Sweden—0.0%(b)
63,360 Cloetta AB, B Shares . . . . . . . . . . . . . . . . . . 195,782
Switzerland—13.3%218,165 Coltene Holding AG . . . . . . . . . . . . . . . . . . 25,014,824
3,558,380 Nestle SA, Registered . . . . . . . . . . . . . . . . . . 298,061,68380 Neue Zuercher Zeitung(a) . . . . . . . . . . . . . . . . 419,738
3,252,936 Novartis AG, Registered . . . . . . . . . . . . . . . . 281,068,59068,178 Phoenix Mecano AG(c) . . . . . . . . . . . . . . . . . 45,438,041
1,271,096 Roche Holding AG . . . . . . . . . . . . . . . . . . . 309,380,706429,703 Tamedia AG . . . . . . . . . . . . . . . . . . . . . . . . 52,569,112801,975 Zurich Insurance Group AG . . . . . . . . . . . . . 254,681,250
1,266,633,944
Taiwan—0.0%(b)
665,100 Lumax International Corp., Ltd. . . . . . . . . . . 1,529,166365,000 Thinking Electronic Industrial Company
Ltd. . . . . . . . . . . . . . . . . . . . . . . . . . . . . . . 985,0332,514,199
Thailand—1.0%14,171,579 Bangkok Bank Public Company Ltd.,
NVDR . . . . . . . . . . . . . . . . . . . . . . . . . . . 92,023,240
SEE NOTES TO FINANCIAL STATEMENTSII-3

Tweedy, Browne Global Value Fund
Portfolio of InvestmentsSeptember 30, 2018 (Unaudited)
Shares Value*
United Kingdom—18.1%12,793,526 BAE Systems plc . . . . . . . . . . . . . . . . . . . . . . $105,072,2794,297,248 CNH Industrial NV . . . . . . . . . . . . . . . . . . . 51,659,2145,387,483 Daily Mail & General Trust plc, Class A . . . 49,319,4557,801,388 Diageo plc . . . . . . . . . . . . . . . . . . . . . . . . . . . 276,615,382
43,503,100 G4S plc . . . . . . . . . . . . . . . . . . . . . . . . . . . . 137,287,44211,731,627 GlaxoSmithKline plc . . . . . . . . . . . . . . . . . . 235,109,85821,778,260 HSBC Holdings plc . . . . . . . . . . . . . . . . . . . 190,223,235
752,280 Imperial Brands plc . . . . . . . . . . . . . . . . . . . . 26,202,8575,273,360 Inchcape plc . . . . . . . . . . . . . . . . . . . . . . . . . 46,005,397
16,803,140 Lookers plc . . . . . . . . . . . . . . . . . . . . . . . . . . 23,314,56525,301,347 Standard Chartered plc . . . . . . . . . . . . . . . . . 209,975,7092,706,685 Unilever plc . . . . . . . . . . . . . . . . . . . . . . . . . 148,810,495
16,040,607 Vertu Motors plc . . . . . . . . . . . . . . . . . . . . . . 9,052,17914,786,874 WPP plc . . . . . . . . . . . . . . . . . . . . . . . . . . . . 216,835,843
1,725,483,910
United States—9.8%590,251 AGCO Corp . . . . . . . . . . . . . . . . . . . . . . . . 35,881,35875,488 Alphabet Inc., Class A(a) . . . . . . . . . . . . . . . . 91,120,05575,695 Alphabet Inc., Class C(a) . . . . . . . . . . . . . . . . 90,339,71214,503 American National Insurance Company . . . . 1,875,093
396,719 Avnet, Inc. . . . . . . . . . . . . . . . . . . . . . . . . . . 17,761,1101,306,916 Bank of New York Mellon
Corporation/The . . . . . . . . . . . . . . . . . . . . 66,639,647433 Berkshire Hathaway Inc., Class A(a) . . . . . . . . 138,560,022301 Berkshire Hathaway Inc., Class B(a) . . . . . . . . 64,447
4,567,023 Cisco Systems, Inc. . . . . . . . . . . . . . . . . . . . . 222,185,669583,045 ConocoPhillips . . . . . . . . . . . . . . . . . . . . . . . 45,127,683539,000 Devon Energy Corporation . . . . . . . . . . . . . . 21,527,660
1,090,760 Halliburton Company . . . . . . . . . . . . . . . . . . 44,208,503860,002 Johnson & Johnson . . . . . . . . . . . . . . . . . . . 118,826,476291,523 Phillips 66 . . . . . . . . . . . . . . . . . . . . . . . . . . . 32,860,473
926,977,908
TOTAL COMMON STOCKS(Cost $5,628,873,018) . . . . . . . . . . . . . . . . 8,447,184,004
Shares Value*
PREFERRED STOCKS—0.5%
Chile—0.4%10,000,000 Embotelladora Andina SA . . . . . . . . . . . . . . $33,505,155
Croatia—0.1%166,388 Adris Grupa d.d. . . . . . . . . . . . . . . . . . . . . . . 11,128,502
Germany—0.0%(b)
103,830 Villeroy & Boch AG . . . . . . . . . . . . . . . . . . 1,922,331
TOTAL PREFERRED STOCKS(Cost $34,220,102) . . . . . . . . . . . . . . . . . . . 46,555,988
REGISTERED INVESTMENT COMPANY—4.9%471,693,649 Dreyfus Treasury Securities Cash
Management – Institutional Shares(Cost $471,693,649) . . . . . . . . . . . . . . . . . 471,693,649
Face Value
U.S. TREASURY BILL—3.1%$300,000,000 2.162%(e) due 01/17/2019(d)
(Cost $298,101,000) . . . . . . . . . . . . . . . . . 298,032,375
INVESTMENTS IN SECURITIES(Cost $6,432,887,769) . . . . . . . . . . . . . . . . . . 97.3% 9,263,466,016
UNREALIZED APPRECIATION ONFORWARD CONTRACTS (Net) . . . . . . . . 1.9 179,023,535
OTHER ASSETSAND LIABILITIES (Net) . . . . . . . . . . . . . . . 0.8 73,323,734
NET ASSETS . . . . . . . . . . . . . . . . . . . . . . . . . . . 100.0% $9,515,813,285
* See Note 2 in Notes to Financial Statements.(a) Non-income producing security.(b) Amount represents less than 0.1% of net assets.(c) “Affiliated company” as defined by the Investment Company Act of 1940. See Note 4.(d) All or a portion of this position has been segregated to cover certain open forward contracts.
At September 30 2018, liquid assets totaling $155,817,230 have been segregated to coversuch open forward contracts.
(e) Rate represents annualized yield at date of purchase.
Abbreviations:ADR — American Depositary ReceiptCVA — Certificaaten van aandelen (Share Certificates)
NVDR — Non Voting Depository Receipt
SEE NOTES TO FINANCIAL STATEMENTSII-4

Tweedy, Browne Global Value Fund
Sector DiversificationSeptember 30, 2018 (Unaudited)
Sector DiversificationPercentage ofNet Assets
COMMON STOCKS:Capital Goods . . . . . . . . . . . . . . . . . . . . . . . . . . . . . . . . . . . . . . . . . . 10.7%Banks . . . . . . . . . . . . . . . . . . . . . . . . . . . . . . . . . . . . . . . . . . . . . . . . . 10.2Insurance . . . . . . . . . . . . . . . . . . . . . . . . . . . . . . . . . . . . . . . . . . . . . . 10.1Pharmaceuticals, Biotechnology & Life Sciences . . . . . . . . . . . . . . . . 9.9Energy . . . . . . . . . . . . . . . . . . . . . . . . . . . . . . . . . . . . . . . . . . . . . . . . 7.4Media . . . . . . . . . . . . . . . . . . . . . . . . . . . . . . . . . . . . . . . . . . . . . . . . . 6.4Beverage . . . . . . . . . . . . . . . . . . . . . . . . . . . . . . . . . . . . . . . . . . . . . . 6.2Food . . . . . . . . . . . . . . . . . . . . . . . . . . . . . . . . . . . . . . . . . . . . . . . . . . 5.5Automobiles & Components . . . . . . . . . . . . . . . . . . . . . . . . . . . . . . . 5.4Technology Hardware & Equipment . . . . . . . . . . . . . . . . . . . . . . . . . 2.8Internet Software & Services . . . . . . . . . . . . . . . . . . . . . . . . . . . . . . . 2.8Materials . . . . . . . . . . . . . . . . . . . . . . . . . . . . . . . . . . . . . . . . . . . . . . 2.8Household & Personal Products . . . . . . . . . . . . . . . . . . . . . . . . . . . . . 2.0Software & Services . . . . . . . . . . . . . . . . . . . . . . . . . . . . . . . . . . . . . . 1.9Commercial Services & Supplies . . . . . . . . . . . . . . . . . . . . . . . . . . . . 1.5Retailing . . . . . . . . . . . . . . . . . . . . . . . . . . . . . . . . . . . . . . . . . . . . . . 0.8Real Estate . . . . . . . . . . . . . . . . . . . . . . . . . . . . . . . . . . . . . . . . . . . . . 0.8Diversified Financials . . . . . . . . . . . . . . . . . . . . . . . . . . . . . . . . . . . . . 0.7Tobacco . . . . . . . . . . . . . . . . . . . . . . . . . . . . . . . . . . . . . . . . . . . . . . . 0.3Health Care Equipment & Services . . . . . . . . . . . . . . . . . . . . . . . . . . 0.3Electronic Equipment & Instruments . . . . . . . . . . . . . . . . . . . . . . . . . 0.2Utilities . . . . . . . . . . . . . . . . . . . . . . . . . . . . . . . . . . . . . . . . . . . . . . . 0.1Consumer Services . . . . . . . . . . . . . . . . . . . . . . . . . . . . . . . . . . . . . . . 0.0(a)
Total Common Stocks . . . . . . . . . . . . . . . . . . . . . . . . . . . . . . . . . . . 88.8Preferred Stocks . . . . . . . . . . . . . . . . . . . . . . . . . . . . . . . . . . . . . . . . 0.5Registered Investment Company . . . . . . . . . . . . . . . . . . . . . . . . . . . 4.9U.S. Treasury Bill . . . . . . . . . . . . . . . . . . . . . . . . . . . . . . . . . . . . . . . 3.1Unrealized Appreciation on Forward Contracts (Net) . . . . . . . . . . . 1.9Other Assets and Liabilities (Net) . . . . . . . . . . . . . . . . . . . . . . . . . . 0.8
Net Assets . . . . . . . . . . . . . . . . . . . . . . . . . . . . . . . . . . . . . . . . . . . . . 100.0%
(a) Amount represents less than 0.1% of net assets
Portfolio CompositionSeptember 30, 2018 (Unaudited)
Money Market Funds, Money Market Funds, Treasury Bills andTreasury Bills andOther Assets andOther Assets andLiabilities (Net)Liabilities (Net)(b)(b) 11% 11%
Switzerland 13%Switzerland 13%
United Kingdom 18%United Kingdom 18%
Netherlands 7%Netherlands 7%
United States 10%nited States 10%
France 15%rance 15%South Korea 4%South Korea 4%
(b)(b) Includes Unrealized Appreciation on Forward Contracts (Net) Includes Unrealized Appreciation on Forward Contracts (Net)
(a)(a) "Other Countries" include Canada, Chile, China, Croatia, Czech Republic, "Other Countries" include Canada, Chile, China, Croatia, Czech Republic, Hong Kong, Italy, Japan, Mexico, Norway, Spain, Sweden, Taiwan andHong Kong, Italy, Japan, Mexico, Norway, Spain, Sweden, Taiwan and Thailand Thailand
Singapore 4%Singapore 4%
Germany 7%Germany 7%
OthertherCountriesCountries(a)(a) 11% 11%
Schedule of Forward Exchange ContractsSeptember 30, 2018 (Unaudited)
ContractsCounter-
partySettlement
DateContract Value onOrigination Date Value 09/30/18*
UnrealizedAppreciation
(Depreciation)
FORWARD EXCHANGE CONTRACTS TO BUY(a)
40,000,000 Great Britain Pound Sterling . . . . . . . . . . . . . . . . . . . . . . . . . . . . NTC 10/22/18 $51,585,600 $52,218,776 $633,17630,000,000 Great Britain Pound Sterling . . . . . . . . . . . . . . . . . . . . . . . . . . . . NTC 11/13/18 39,820,200 39,202,462 (617,738)
297,500,000 Norwegian Krone . . . . . . . . . . . . . . . . . . . . . . . . . . . . . . . . . . . . . JPM 1/17/19 36,029,338 36,715,910 686,572
TOTAL . . . . . . . . . . . . . . . . . . . . . . . . . . . . . . . . . . . . . . . . . . . . . . . . . . . . . . . . . . . $127,435,138 $128,137,148 $702,010
FORWARD EXCHANGE CONTRACTS TO SELL(a)
35,000,000 Canadian Dollar . . . . . . . . . . . . . . . . . . . . . . . . . . . . . . . . . . . . . NTC 12/18/18 $(27,352,746) $(27,125,475) $227,27127,000,000 Canadian Dollar . . . . . . . . . . . . . . . . . . . . . . . . . . . . . . . . . . . . . SSB 12/20/18 (21,303,456) (20,926,534) 376,92256,000,000 Canadian Dollar . . . . . . . . . . . . . . . . . . . . . . . . . . . . . . . . . . . . . NTC 8/27/19 (43,134,225) (43,584,530) (450,305)17,000,000 Canadian Dollar . . . . . . . . . . . . . . . . . . . . . . . . . . . . . . . . . . . . . NTC 9/4/19 (13,200,808) (13,232,742) (31,934)28,000,000 Canadian Dollar . . . . . . . . . . . . . . . . . . . . . . . . . . . . . . . . . . . . . NTC 10/1/19 (21,821,129) (21,804,586) 16,543
18,000,000,000 Chilean Peso . . . . . . . . . . . . . . . . . . . . . . . . . . . . . . . . . . . . . . . . SSB 12/12/18 (27,318,258) (27,313,933) 4,3258,000,000,000 Chilean Peso . . . . . . . . . . . . . . . . . . . . . . . . . . . . . . . . . . . . . . . . SSB 3/11/19 (13,320,013) (12,137,387) 1,182,626
180,000,000 Chinese Yuan . . . . . . . . . . . . . . . . . . . . . . . . . . . . . . . . . . . . . . . SSB 10/9/18 (26,470,978) (26,160,623) 310,355540,000,000 Chinese Yuan . . . . . . . . . . . . . . . . . . . . . . . . . . . . . . . . . . . . . . . BNY 3/11/19 (83,337,192) (78,018,516) 5,318,676375,000,000 Chinese Yuan . . . . . . . . . . . . . . . . . . . . . . . . . . . . . . . . . . . . . . . JPM 4/1/19 (58,193,669) (54,147,409) 4,046,260100,000,000 Chinese Yuan . . . . . . . . . . . . . . . . . . . . . . . . . . . . . . . . . . . . . . . SSB 9/11/19 (14,445,231) (14,385,211) 60,020100,000,000 European Union Euro . . . . . . . . . . . . . . . . . . . . . . . . . . . . . . . . . SSB 10/22/18 (121,061,000) (116,374,334) 4,686,66680,000,000 European Union Euro . . . . . . . . . . . . . . . . . . . . . . . . . . . . . . . . . SSB 10/31/18 (96,328,800) (93,166,500) 3,162,300
200,000,000 European Union Euro . . . . . . . . . . . . . . . . . . . . . . . . . . . . . . . . . SSB 11/13/18 (237,715,000) (233,154,231) 4,560,76965,000,000 European Union Euro . . . . . . . . . . . . . . . . . . . . . . . . . . . . . . . . . SSB 11/19/18 (77,444,250) (75,810,875) 1,633,375
SEE NOTES TO FINANCIAL STATEMENTSII-5

Tweedy, Browne Global Value Fund
Schedule of Forward Exchange ContractsSeptember 30, 2018 (Unaudited)
ContractsCounter-
partySettlement
DateContract Value onOrigination Date Value 09/30/18*
UnrealizedAppreciation
(Depreciation)
FORWARD EXCHANGE CONTRACTS TO SELL(a) (continued)100,000,000 European Union Euro . . . . . . . . . . . . . . . . . . . . . . . . . . . . . . . . NTC 11/21/18 $(119,455,000) $(116,650,461) $2,804,53925,000,000 European Union Euro . . . . . . . . . . . . . . . . . . . . . . . . . . . . . . . . NTC 11/23/18 (30,157,000) (29,167,203) 989,79740,000,000 European Union Euro . . . . . . . . . . . . . . . . . . . . . . . . . . . . . . . . SSB 11/27/18 (48,137,200) (46,685,886) 1,451,314
100,000,000 European Union Euro . . . . . . . . . . . . . . . . . . . . . . . . . . . . . . . . NTC 12/20/18 (121,041,000) (116,985,061) 4,055,93940,000,000 European Union Euro . . . . . . . . . . . . . . . . . . . . . . . . . . . . . . . . BNY 12/31/18 (48,668,000) (46,845,630) 1,822,370
120,000,000 European Union Euro . . . . . . . . . . . . . . . . . . . . . . . . . . . . . . . . NTC 1/17/19 (147,300,000) (140,743,936) 6,556,064100,000,000 European Union Euro . . . . . . . . . . . . . . . . . . . . . . . . . . . . . . . . JPM 3/18/19 (127,049,200) (117,899,657) 9,149,543120,000,000 European Union Euro . . . . . . . . . . . . . . . . . . . . . . . . . . . . . . . . NTC 3/20/19 (153,406,800) (141,504,243) 11,902,557125,000,000 European Union Euro . . . . . . . . . . . . . . . . . . . . . . . . . . . . . . . . SSB 4/1/19 (158,507,500) (147,556,894) 10,950,60680,000,000 European Union Euro . . . . . . . . . . . . . . . . . . . . . . . . . . . . . . . . BNY 5/3/19 (99,976,000) (94,712,909) 5,263,091
100,000,000 European Union Euro . . . . . . . . . . . . . . . . . . . . . . . . . . . . . . . . NTC 5/7/19 (124,848,000) (118,434,482) 6,413,518100,000,000 European Union Euro . . . . . . . . . . . . . . . . . . . . . . . . . . . . . . . . BNY 5/10/19 (123,450,000) (118,467,011) 4,982,98970,000,000 European Union Euro . . . . . . . . . . . . . . . . . . . . . . . . . . . . . . . . BNY 10/7/19 (84,084,000) (84,079,614) 4,38640,000,000 Great Britain Pound Sterling . . . . . . . . . . . . . . . . . . . . . . . . . . . NTC 10/22/18 (53,500,400) (52,218,776) 1,281,62470,000,000 Great Britain Pound Sterling . . . . . . . . . . . . . . . . . . . . . . . . . . . NTC 11/13/18 (93,184,000) (91,472,411) 1,711,58975,000,000 Great Britain Pound Sterling . . . . . . . . . . . . . . . . . . . . . . . . . . . SSB 11/27/18 (100,665,750) (98,071,265) 2,594,48575,000,000 Great Britain Pound Sterling . . . . . . . . . . . . . . . . . . . . . . . . . . . BNY 12/31/18 (101,775,000) (98,272,114) 3,502,88685,000,000 Great Britain Pound Sterling . . . . . . . . . . . . . . . . . . . . . . . . . . . JPM 2/25/19 (121,325,345) (111,683,740) 9,641,60585,000,000 Great Britain Pound Sterling . . . . . . . . . . . . . . . . . . . . . . . . . . . NTC 2/25/19 (121,312,000) (111,683,740) 9,628,26050,000,000 Great Britain Pound Sterling . . . . . . . . . . . . . . . . . . . . . . . . . . . NTC 3/18/19 (70,296,250) (65,764,668) 4,531,58260,000,000 Great Britain Pound Sterling . . . . . . . . . . . . . . . . . . . . . . . . . . . JPM 3/20/19 (85,302,000) (78,925,422) 6,376,57820,000,000 Great Britain Pound Sterling . . . . . . . . . . . . . . . . . . . . . . . . . . . SSB 4/24/19 (29,048,000) (26,355,600) 2,692,40035,000,000 Great Britain Pound Sterling . . . . . . . . . . . . . . . . . . . . . . . . . . . NTC 5/3/19 (49,608,300) (46,143,744) 3,464,55685,000,000 Great Britain Pound Sterling . . . . . . . . . . . . . . . . . . . . . . . . . . . BNY 5/8/19 (119,068,000) (112,092,333) 6,975,66775,000,000 Great Britain Pound Sterling . . . . . . . . . . . . . . . . . . . . . . . . . . . BNY 5/29/19 (102,682,500) (99,012,444) 3,670,05675,000,000 Great Britain Pound Sterling . . . . . . . . . . . . . . . . . . . . . . . . . . . SSB 6/10/19 (101,506,125) (99,073,946) 2,432,17975,000,000 Great Britain Pound Sterling . . . . . . . . . . . . . . . . . . . . . . . . . . . NTC 7/15/19 (101,130,000) (99,253,763) 1,876,23785,000,000 Great Britain Pound Sterling . . . . . . . . . . . . . . . . . . . . . . . . . . . SSB 8/19/19 (111,121,775) (112,692,131) (1,570,356)
3,000,000,000 Japanese Yen . . . . . . . . . . . . . . . . . . . . . . . . . . . . . . . . . . . . . . . SSB 12/7/18 (27,942,327) (26,557,481) 1,384,846450,000,000 Japanese Yen . . . . . . . . . . . . . . . . . . . . . . . . . . . . . . . . . . . . . . . JPM 2/14/19 (4,216,211) (4,008,504) 207,707
3,500,000,000 Japanese Yen . . . . . . . . . . . . . . . . . . . . . . . . . . . . . . . . . . . . . . . JPM 3/5/19 (32,734,755) (31,224,964) 1,509,7913,000,000,000 Japanese Yen . . . . . . . . . . . . . . . . . . . . . . . . . . . . . . . . . . . . . . . BNY 3/20/19 (27,894,003) (26,796,630) 1,097,3732,500,000,000 Japanese Yen . . . . . . . . . . . . . . . . . . . . . . . . . . . . . . . . . . . . . . . BNY 3/25/20 (23,310,023) (23,099,143) 210,880
420,000,000 Mexican Peso . . . . . . . . . . . . . . . . . . . . . . . . . . . . . . . . . . . . . . NTC 11/27/18 (20,745,658) (22,244,584) (1,498,926)250,000,000 Mexican Peso . . . . . . . . . . . . . . . . . . . . . . . . . . . . . . . . . . . . . . BNY 3/20/19 (12,714,882) (13,015,557) (300,675)365,000,000 Norwegian Krone . . . . . . . . . . . . . . . . . . . . . . . . . . . . . . . . . . . JPM 1/17/19 (45,870,983) (45,046,410) 824,57370,000,000 Singapore Dollar . . . . . . . . . . . . . . . . . . . . . . . . . . . . . . . . . . . . JPM 12/12/18 (52,215,426) (51,316,237) 899,18965,000,000 Singapore Dollar . . . . . . . . . . . . . . . . . . . . . . . . . . . . . . . . . . . . SSB 12/31/18 (48,618,123) (47,671,550) 946,57360,000,000 Singapore Dollar . . . . . . . . . . . . . . . . . . . . . . . . . . . . . . . . . . . . NTC 3/11/19 (45,616,449) (44,082,460) 1,533,98980,000,000 Singapore Dollar . . . . . . . . . . . . . . . . . . . . . . . . . . . . . . . . . . . . JPM 5/7/19 (60,896,704) (58,870,016) 2,026,68875,000,000 Singapore Dollar . . . . . . . . . . . . . . . . . . . . . . . . . . . . . . . . . . . . JPM 5/29/19 (56,475,904) (55,225,819) 1,250,08540,000,000 Singapore Dollar . . . . . . . . . . . . . . . . . . . . . . . . . . . . . . . . . . . . SSB 6/10/19 (30,108,012) (29,464,014) 643,99880,000,000 Singapore Dollar . . . . . . . . . . . . . . . . . . . . . . . . . . . . . . . . . . . . JPM 6/17/19 (60,537,268) (58,939,987) 1,597,28122,000,000 Singapore Dollar . . . . . . . . . . . . . . . . . . . . . . . . . . . . . . . . . . . . SSB 8/27/19 (16,242,995) (16,241,926) 1,06925,000,000 Singapore Dollar . . . . . . . . . . . . . . . . . . . . . . . . . . . . . . . . . . . . SSB 10/1/19 (18,455,633) (18,474,953) (19,320)
45,000,000,000 South Korean Won . . . . . . . . . . . . . . . . . . . . . . . . . . . . . . . . . . JPM 10/31/18 (39,945,674) (40,596,403) (650,729)25,000,000,000 South Korean Won . . . . . . . . . . . . . . . . . . . . . . . . . . . . . . . . . . SSB 12/31/18 (23,362,303) (22,594,207) 768,096
100,000,000,000 South Korean Won . . . . . . . . . . . . . . . . . . . . . . . . . . . . . . . . . . JPM 2/19/19 (92,988,655) (90,542,759) 2,445,89685,576,000,000 South Korean Won . . . . . . . . . . . . . . . . . . . . . . . . . . . . . . . . . . SSB 3/4/19 (80,003,740) (77,519,876) 2,483,86440,000,000,000 South Korean Won . . . . . . . . . . . . . . . . . . . . . . . . . . . . . . . . . . SSB 10/1/19 (36,215,482) (36,580,708) (365,226)
65,000,000 Swiss Franc . . . . . . . . . . . . . . . . . . . . . . . . . . . . . . . . . . . . . . . . BNY 11/13/18 (66,940,608) (66,822,486) 118,12280,000,000 Swiss Franc . . . . . . . . . . . . . . . . . . . . . . . . . . . . . . . . . . . . . . . . JPM 11/19/18 (82,580,645) (82,287,267) 293,378
100,000,000 Swiss Franc . . . . . . . . . . . . . . . . . . . . . . . . . . . . . . . . . . . . . . . . BNY 11/21/18 (103,241,792) (102,877,517) 364,27560,000,000 Swiss Franc . . . . . . . . . . . . . . . . . . . . . . . . . . . . . . . . . . . . . . . . SSB 11/23/18 (62,182,932) (61,737,574) 445,35870,000,000 Swiss Franc . . . . . . . . . . . . . . . . . . . . . . . . . . . . . . . . . . . . . . . . JPM 11/27/18 (72,617,874) (72,059,459) 558,41580,000,000 Swiss Franc . . . . . . . . . . . . . . . . . . . . . . . . . . . . . . . . . . . . . . . . JPM 12/18/18 (83,157,490) (82,555,932) 601,55860,000,000 Swiss Franc . . . . . . . . . . . . . . . . . . . . . . . . . . . . . . . . . . . . . . . . BNY 12/20/18 (62,591,279) (61,932,160) 659,119
100,000,000 Swiss Franc . . . . . . . . . . . . . . . . . . . . . . . . . . . . . . . . . . . . . . . . NTC 3/20/19 (109,650,325) (104,142,367) 5,507,95865,000,000 Swiss Franc . . . . . . . . . . . . . . . . . . . . . . . . . . . . . . . . . . . . . . . . NTC 4/1/19 (70,841,212) (67,772,607) 3,068,60530,000,000 Swiss Franc . . . . . . . . . . . . . . . . . . . . . . . . . . . . . . . . . . . . . . . . NTC 6/17/19 (31,649,242) (31,526,723) 122,51990,000,000 Swiss Franc . . . . . . . . . . . . . . . . . . . . . . . . . . . . . . . . . . . . . . . . BNY 8/27/19 (94,300,084) (95,274,039) (973,955)
825,000,000 Thai Baht . . . . . . . . . . . . . . . . . . . . . . . . . . . . . . . . . . . . . . . . . JPM 5/24/19 (25,967,894) (25,727,222) 240,672900,000,000 Thai Baht . . . . . . . . . . . . . . . . . . . . . . . . . . . . . . . . . . . . . . . . . BNY 6/17/19 (28,391,167) (28,092,914) 298,253
SEE NOTES TO FINANCIAL STATEMENTSII-6

Tweedy, Browne Global Value Fund
Schedule of Forward Exchange ContractsSeptember 30, 2018 (Unaudited)
ContractsCounter-
partySettlement
DateContract Value onOrigination Date Value 09/30/18*
UnrealizedAppreciation
(Depreciation)
FORWARD EXCHANGE CONTRACTS TO SELL(a) (continued)500,000,000 Thai Baht . . . . . . . . . . . . . . . . . . . . . . . . . . . . . . . . . . . . . . . . . . . . . . . JPM 6/24/19 $(15,698,587) $(15,611,531) $87,056640,000,000 Thai Baht . . . . . . . . . . . . . . . . . . . . . . . . . . . . . . . . . . . . . . . . . . . . . . . BNY 9/4/19 (19,713,538) (20,040,298) (326,760)
TOTAL . . . . . . . . . . . . . . . . . . . . . . . . . . . . . . . . . . . . . . . . . . . . . . . . . . . . . . . . . . . $(5,416,687,779) $(5,238,366,254) $178,321,525
Unrealized Appreciation on Forward Contracts (Net) . . . . . . . . . . . . . . . . . . . . . . . $179,023,535
* See Note 2 in Notes to Financial Statements.(a) Primary risk exposure being hedged against is currency risk.
Counterparty Abbreviations:BNY — The Bank of New York MellonJPM — JPMorgan Chase Bank NA
NTC — Northern Trust CompanySSB — State Street Bank and Trust Company
SEE NOTES TO FINANCIAL STATEMENTSII-7

Tweedy, Browne Global Value Fund II – Currency Unhedged
Portfolio of InvestmentsSeptember 30, 2018 (Unaudited)
Shares Value*
COMMON STOCKS—89.0%
Canada—0.5%3,500 E-L Financial Corp., Ltd. . . . . . . . . . . . . . . . . . . . $2,220,670
China—2.7%36,900 Baidu Inc., Sponsored ADR(a) . . . . . . . . . . . . . . . . 8,438,29251,615 Sina Corp.(a) . . . . . . . . . . . . . . . . . . . . . . . . . . . . . 3,586,210
12,024,502
France—15.8%1,019,585 Bollore SA . . . . . . . . . . . . . . . . . . . . . . . . . . . . . . 4,405,380
242,425 CNP Assurances . . . . . . . . . . . . . . . . . . . . . . . . . 5,845,502167,400 Safran SA . . . . . . . . . . . . . . . . . . . . . . . . . . . . . . 23,468,198382,960 SCOR SE . . . . . . . . . . . . . . . . . . . . . . . . . . . . . . . 17,792,232154,330 Tarkett SA . . . . . . . . . . . . . . . . . . . . . . . . . . . . . . 3,950,745218,433 Total SA . . . . . . . . . . . . . . . . . . . . . . . . . . . . . . . 14,167,091
69,629,148
Germany—6.3%171,538 Axel Springer SE . . . . . . . . . . . . . . . . . . . . . . . . . 11,545,98050,800 Henkel AG & Company, KGaA . . . . . . . . . . . . . 5,395,90726,726 Krones AG . . . . . . . . . . . . . . . . . . . . . . . . . . . . . . 2,804,65313,543 Muenchener Rueckversicherungs AG . . . . . . . . . 3,000,51936,984 Siemens AG . . . . . . . . . . . . . . . . . . . . . . . . . . . . 4,739,842
27,486,901
Hong Kong—1.4%4,870,000 Emperor Entertainment Hotel Ltd. . . . . . . . . . . . . 933,558
316,349 Great Eagle Holdings Ltd. . . . . . . . . . . . . . . . . . . 1,580,754734,000 Hang Lung Group Ltd. . . . . . . . . . . . . . . . . . . . . . 1,951,10520,587 Jardine Strategic Holdings Ltd. . . . . . . . . . . . . . . . 747,308
109,796 Miramar Hotel & Investment . . . . . . . . . . . . . . . 206,265655,000 Tai Cheung Holdings Ltd. . . . . . . . . . . . . . . . . . . 669,657
6,088,647
Italy—0.7%113,408 Buzzi Unicem SpA . . . . . . . . . . . . . . . . . . . . . . . . 2,355,20266,455 SOL SpA . . . . . . . . . . . . . . . . . . . . . . . . . . . . . . . 796,571
3,151,773
Japan—1.7%110,200 Ebara Corporation . . . . . . . . . . . . . . . . . . . . . . . . 3,803,17827,700 Konishi Company Ltd. . . . . . . . . . . . . . . . . . . . . . 436,52883,600 NGK Spark Plug Company Ltd. . . . . . . . . . . . . . . 2,436,20267,300 Shizuoka Gas Company Ltd. . . . . . . . . . . . . . . . . 596,655
7,272,563
Netherlands—6.0%37,400 Heineken NV . . . . . . . . . . . . . . . . . . . . . . . . . . . 3,508,20558,500 Heineken Holding NV . . . . . . . . . . . . . . . . . . . . . 5,299,898
244,300 Royal Dutch Shell plc, Class A . . . . . . . . . . . . . . 8,391,996161,712 Unilever NV, CVA . . . . . . . . . . . . . . . . . . . . . . . 9,009,148
26,209,247
Singapore—5.1%657,813 DBS Group Holdings Ltd. . . . . . . . . . . . . . . . . . . . 12,560,721488,670 United Overseas Bank Ltd. . . . . . . . . . . . . . . . . . 9,685,061
22,245,782
Shares Value*
South Korea—6.1%156,763 Chokwang Paint Ltd. . . . . . . . . . . . . . . . . . . . . . . $1,091,017132,823 Hankook Tire Worldwide Company Ltd. . . . . . . . 2,155,34317,345 Hyundai Mobis Company Ltd. . . . . . . . . . . . . . . . 3,565,16656,125 Hyundai Motor Company . . . . . . . . . . . . . . . . . . 6,552,34437,361 Kangnam Jevisco Company Ltd. . . . . . . . . . . . . . . 939,709
211,700 Kia Motors Corporation . . . . . . . . . . . . . . . . . . . . 6,698,82470,860 LG Corporation . . . . . . . . . . . . . . . . . . . . . . . . . . 4,637,76113,800 Samchully Company Ltd. . . . . . . . . . . . . . . . . . . . 1,293,847
26,934,011
Switzerland—12.6%17,047 Coltene Holding AG . . . . . . . . . . . . . . . . . . . . . . 1,954,611
156,100 Nestle SA, Registered . . . . . . . . . . . . . . . . . . . . . 13,075,452161,339 Novartis AG, Registered . . . . . . . . . . . . . . . . . . . 13,940,430
5,015 Phoenix Mecano AG . . . . . . . . . . . . . . . . . . . . . . 3,342,30656,300 Roche Holding AG . . . . . . . . . . . . . . . . . . . . . . . 13,703,240
665 Tamedia AG . . . . . . . . . . . . . . . . . . . . . . . . . . . . 81,35529,539 Zurich Insurance Group AG . . . . . . . . . . . . . . . . 9,380,628
55,478,022
Thailand—1.8%1,220,100 Bangkok Bank Public Company Ltd., NVDR . . . . 7,922,727
United Kingdom—17.8%996,343 BAE Systems plc . . . . . . . . . . . . . . . . . . . . . . . . . 8,182,891427,080 CNH Industrial NV . . . . . . . . . . . . . . . . . . . . . . . 5,134,127238,503 Daily Mail & General Trust plc, Class A . . . . . . . 2,183,364352,603 Diageo plc . . . . . . . . . . . . . . . . . . . . . . . . . . . . . . 12,502,315
2,477,190 G4S plc . . . . . . . . . . . . . . . . . . . . . . . . . . . . . . . . 7,817,537317,540 GlaxoSmithKline plc . . . . . . . . . . . . . . . . . . . . . . 6,363,720
1,090,626 HSBC Holdings plc . . . . . . . . . . . . . . . . . . . . . . . 9,526,12473,462 Imperial Brands plc . . . . . . . . . . . . . . . . . . . . . . . 2,558,774
245,155 Inchcape plc . . . . . . . . . . . . . . . . . . . . . . . . . . . . . 2,138,760722,985 Lookers plc . . . . . . . . . . . . . . . . . . . . . . . . . . . . . . 1,003,151
1,015,243 Standard Chartered plc . . . . . . . . . . . . . . . . . . . . 8,425,4951,656,123 Vertu Motors plc . . . . . . . . . . . . . . . . . . . . . . . . . 934,598
782,650 WPP plc . . . . . . . . . . . . . . . . . . . . . . . . . . . . . . . . 11,476,83978,247,695
United States—10.5%7,345 AutoZone Inc.(a) . . . . . . . . . . . . . . . . . . . . . . . . . . 5,697,516
100,100 Avnet, Inc. . . . . . . . . . . . . . . . . . . . . . . . . . . . . . 4,481,477212,500 Cisco Systems, Inc. . . . . . . . . . . . . . . . . . . . . . . . . 10,338,12529,399 ConocoPhillips . . . . . . . . . . . . . . . . . . . . . . . . . . 2,275,48370,900 Halliburton Company . . . . . . . . . . . . . . . . . . . . . 2,873,57778,600 Johnson & Johnson . . . . . . . . . . . . . . . . . . . . . . . 10,860,16236,100 MasterCard, Inc., Class A . . . . . . . . . . . . . . . . . . 8,036,22114,700 Phillips 66 . . . . . . . . . . . . . . . . . . . . . . . . . . . . . . 1,656,984
46,219,545
TOTAL COMMON STOCKS(Cost $304,984,795) . . . . . . . . . . . . . . . . . . . . . 391,131,233
PREFERRED STOCKS—0.8%
Chile—0.7%940,000 Embotelladora Andina SA . . . . . . . . . . . . . . . . . . 3,149,485
SEE NOTES TO FINANCIAL STATEMENTSII-8

Tweedy, Browne Global Value Fund II – Currency Unhedged
Portfolio of InvestmentsSeptember 30, 2018 (Unaudited)
Shares Value*
Germany—0.1%648 KSB AG . . . . . . . . . . . . . . . . . . . . . . . . . . . . . . . $234,074
TOTAL PREFERRED STOCKS(Cost $3,051,153) . . . . . . . . . . . . . . . . . . . . . . . 3,383,559
REGISTERED INVESTMENT COMPANY—10.5%46,294,156 Dreyfus Government Securities Cash
Management – Institutional Shares(Cost $46,294,156) . . . . . . . . . . . . . . . . . . . . . . 46,294,156
INVESTMENTS IN SECURITIES(Cost $354,330,104) . . . . . . . . . . . . . . . . . . . . . 100.3% 440,808,948
OTHER ASSETSAND LIABILITIES (Net) . . . . . . . . . . . . . . . . (0.3) (1,147,003)
NET ASSETS . . . . . . . . . . . . . . . . . . . . . . . . . . . . 100.0% $439,661,945
* See Note 2 in Notes to Financial Statements.(a) Non-income producing security.
Abbreviations:ADR — American Depositary ReceiptCVA — Certificaaten van aandelen (Share Certificates)
NVDR — Non Voting Depository Receipt
Sector DiversificationSeptember 30, 2018 (Unaudited)
Sector DiversificationPercentage ofNet Assets
COMMON STOCKS:Capital Goods . . . . . . . . . . . . . . . . . . . . . . . . . . . . . . . . . . . . . . . . . 13.1%Banks . . . . . . . . . . . . . . . . . . . . . . . . . . . . . . . . . . . . . . . . . . . . . . . . 10.9Pharmaceuticals, Biotechnology & Life Sciences . . . . . . . . . . . . . . . 10.2Insurance . . . . . . . . . . . . . . . . . . . . . . . . . . . . . . . . . . . . . . . . . . . . . 8.7Energy . . . . . . . . . . . . . . . . . . . . . . . . . . . . . . . . . . . . . . . . . . . . . . . 6.7Media . . . . . . . . . . . . . . . . . . . . . . . . . . . . . . . . . . . . . . . . . . . . . . . 5.8Food . . . . . . . . . . . . . . . . . . . . . . . . . . . . . . . . . . . . . . . . . . . . . . . . 5.0Beverage . . . . . . . . . . . . . . . . . . . . . . . . . . . . . . . . . . . . . . . . . . . . . 4.9Software & Services . . . . . . . . . . . . . . . . . . . . . . . . . . . . . . . . . . . . . 4.6Automobiles & Components . . . . . . . . . . . . . . . . . . . . . . . . . . . . . . 4.4Technology Hardware & Equipment . . . . . . . . . . . . . . . . . . . . . . . . 3.1Retailing . . . . . . . . . . . . . . . . . . . . . . . . . . . . . . . . . . . . . . . . . . . . . 2.2Commercial Services & Supplies . . . . . . . . . . . . . . . . . . . . . . . . . . . 1.8Materials . . . . . . . . . . . . . . . . . . . . . . . . . . . . . . . . . . . . . . . . . . . . . 1.3Household & Personal Products . . . . . . . . . . . . . . . . . . . . . . . . . . . . 1.2Electronic Equipment & Instruments . . . . . . . . . . . . . . . . . . . . . . . . 1.0Transportation . . . . . . . . . . . . . . . . . . . . . . . . . . . . . . . . . . . . . . . . . 1.0Real Estate . . . . . . . . . . . . . . . . . . . . . . . . . . . . . . . . . . . . . . . . . . . . 0.9Tobacco . . . . . . . . . . . . . . . . . . . . . . . . . . . . . . . . . . . . . . . . . . . . . . 0.6Diversified Financials . . . . . . . . . . . . . . . . . . . . . . . . . . . . . . . . . . . . 0.5Health Care Equipment & Services . . . . . . . . . . . . . . . . . . . . . . . . . 0.4Utilities . . . . . . . . . . . . . . . . . . . . . . . . . . . . . . . . . . . . . . . . . . . . . . 0.4Consumer Services . . . . . . . . . . . . . . . . . . . . . . . . . . . . . . . . . . . . . 0.3
Total Common Stocks . . . . . . . . . . . . . . . . . . . . . . . . . . . . . . . . . . 89.0Preferred Stocks . . . . . . . . . . . . . . . . . . . . . . . . . . . . . . . . . . . . . . . 0.8Registered Investment Company . . . . . . . . . . . . . . . . . . . . . . . . . . 10.5Other Assets and Liabilities (Net) . . . . . . . . . . . . . . . . . . . . . . . . . (0.3)
Net Assets . . . . . . . . . . . . . . . . . . . . . . . . . . . . . . . . . . . . . . . . . . . 100.0%
Portfolio CompositionSeptember 30, 2018 (Unaudited)
(a)(a) "Other Countries" include Canada, Chile, China, Hong Kong, Italy,"Other Countries" include Canada, Chile, China, Hong Kong, Italy, Japan and Thailand Japan and Thailand
Money Market FundsMoney Market Fundsand Other Assets andand Other Assets andLiabilities (Net) 10%Liabilities (Net) 10%
France 16%France 16%
Switzerland 13%Switzerland 13%
United Kingdom 18%United Kingdom 18%
South Korea 6%South Korea 6%
Netherlands 6%Netherlands 6%
Singapore 5%Singapore 5%
OtherOtherCountriesCountries(a)(a) 10% 10%
United States 10%United States 10%Germany 6%Germany 6%
SEE NOTES TO FINANCIAL STATEMENTSII-9

Tweedy, Browne Value Fund
Portfolio of InvestmentsSeptember 30, 2018 (Unaudited)
Shares Value*
COMMON STOCKS—89.5%
Chile—1.9%846,500 Antofagasta plc . . . . . . . . . . . . . . . . . . . . . . . . . . $9,438,181
China—2.2%49,610 Baidu Inc., Sponsored ADR(a) . . . . . . . . . . . . . . . . 11,344,815
France—6.5%360,300 CNP Assurances . . . . . . . . . . . . . . . . . . . . . . . . . 8,687,777146,155 Tarkett SA . . . . . . . . . . . . . . . . . . . . . . . . . . . . . . 3,741,470318,566 Total SA . . . . . . . . . . . . . . . . . . . . . . . . . . . . . . . 20,661,501
33,090,748
Germany—4.5%135,094 Axel Springer SE . . . . . . . . . . . . . . . . . . . . . . . . . 9,092,98684,400 Henkel AG & Company, KGaA . . . . . . . . . . . . . 8,964,85322,070 Muenchener Rueckversicherungs AG . . . . . . . . . 4,889,719
22,947,558
Hong Kong—0.5%906,000 Hang Lung Group Ltd. . . . . . . . . . . . . . . . . . . . . . 2,408,312
Japan—0.5%87,000 Honda Motor Company Ltd. . . . . . . . . . . . . . . . . 2,634,089
Netherlands—9.5%230,702 Heineken Holding NV . . . . . . . . . . . . . . . . . . . . . 20,900,804499,509 Royal Dutch Shell plc, Class A . . . . . . . . . . . . . . 17,158,728183,946 Unilever NV, ADR . . . . . . . . . . . . . . . . . . . . . . . 10,218,200
48,277,732
Singapore—2.1%550,917 United Overseas Bank Ltd. . . . . . . . . . . . . . . . . . 10,918,749
South Korea—2.8%92,075 Hyundai Motor Company . . . . . . . . . . . . . . . . . . 10,749,34656,800 LG Corporation . . . . . . . . . . . . . . . . . . . . . . . . . . 3,717,539
14,466,885
Switzerland—11.4%190,881 Nestle SA, Registered, Sponsored ADR . . . . . . . . 15,881,299197,762 Novartis AG, Registered . . . . . . . . . . . . . . . . . . . 17,087,54467,490 Roche Holding AG . . . . . . . . . . . . . . . . . . . . . . . 16,426,85027,192 Zurich Insurance Group AG . . . . . . . . . . . . . . . . 8,635,297
58,030,990
United Kingdom—11.7%494,540 CNH Industrial NV . . . . . . . . . . . . . . . . . . . . . . . 5,945,095121,251 Diageo plc, Sponsored ADR . . . . . . . . . . . . . . . . . 17,177,629460,669 GlaxoSmithKline plc . . . . . . . . . . . . . . . . . . . . . . 9,232,123282,425 Inchcape plc . . . . . . . . . . . . . . . . . . . . . . . . . . . . . 2,463,908952,235 Standard Chartered plc . . . . . . . . . . . . . . . . . . . . 7,902,59291,190 Unilever plc, Sponsored ADR . . . . . . . . . . . . . . . 5,012,714
805,920 WPP plc . . . . . . . . . . . . . . . . . . . . . . . . . . . . . . . . 11,818,07259,552,133
Shares Value*
United States—35.9%50,610 3M Company . . . . . . . . . . . . . . . . . . . . . . . . . . $10,664,0336,150 Alphabet Inc., Class A(a) . . . . . . . . . . . . . . . . . . 7,423,5426,166 Alphabet Inc., Class C(a) . . . . . . . . . . . . . . . . . . 7,358,936
17,610 AutoZone Inc.(a) . . . . . . . . . . . . . . . . . . . . . . . . 13,660,077283,089 Bank of New York Mellon Corporation/The . . . 14,434,708
80 Berkshire Hathaway Inc., Class A(a) . . . . . . . . . . 25,600,004297,389 Cisco Systems, Inc. . . . . . . . . . . . . . . . . . . . . . . 14,467,975277,521 Comcast Corporation, Class A . . . . . . . . . . . . . 9,827,019142,136 ConocoPhillips . . . . . . . . . . . . . . . . . . . . . . . . . 11,001,326100,063 Johnson & Johnson . . . . . . . . . . . . . . . . . . . . . . 13,825,70575,900 MasterCard, Inc., Class A . . . . . . . . . . . . . . . . . 16,896,099
488,706 MRC Global, Inc.(a) . . . . . . . . . . . . . . . . . . . . . . 9,173,01236,818 National Western Life Insurance Company,
Class A . . . . . . . . . . . . . . . . . . . . . . . . . . . . . 11,752,306315,163 Wells Fargo & Company . . . . . . . . . . . . . . . . . . 16,564,967
182,649,709
TOTAL COMMON STOCKS(Cost $232,327,041) . . . . . . . . . . . . . . . . . . . . 455,759,901
REGISTERED INVESTMENT COMPANY—6.2%31,613,438 Dreyfus Government Securities Cash
Management – Institutional Shares(Cost $31,613,438) . . . . . . . . . . . . . . . . . . . . 31,613,438
Face Value
U.S. TREASURY BILL—2.7%$14,000,000 2.121%(b), due 12/06/2018(c)
(Cost $13,946,870) . . . . . . . . . . . . . . . . . . . . 13,945,394
INVESTMENTS IN SECURITIES(Cost $277,887,349) . . . . . . . . . . . . . . . . . . . . . 98.4% 501,318,733
UNREALIZED APPRECIATIONON FORWARD CONTRACTS (Net) . . . . . . 1.4 6,907,809
OTHER ASSETSAND LIABILITIES (Net) . . . . . . . . . . . . . . . . 0.2 1,140,904
NET ASSETS . . . . . . . . . . . . . . . . . . . . . . . . . . . . 100.0% $509,367,446
* See Note 2 to Notes to Financial Statements.(a) Non-income producing security.(b) Rate represents annualized yield at date of purchase.(c) This security has been segregated to cover certain open forward contracts. At
September 30, 2018, liquid assets totaling $13,945,394 have been segregated to cover suchopen forward contracts.
Abbreviations:ADR — American Depositary Receipt
SEE NOTES TO FINANCIAL STATEMENTSII-10

Tweedy, Browne Value Fund
Sector DiversificationSeptember 30, 2018 (Unaudited)
Sector DiversificationPercentage ofNet Assets
COMMON STOCKS:Insurance . . . . . . . . . . . . . . . . . . . . . . . . . . . . . . . . . . . . . . . . . . . . . . 11.7%Pharmaceuticals, Biotechnology & Life Sciences . . . . . . . . . . . . . . . . 11.1Energy . . . . . . . . . . . . . . . . . . . . . . . . . . . . . . . . . . . . . . . . . . . . . . . . 9.6Software & Services . . . . . . . . . . . . . . . . . . . . . . . . . . . . . . . . . . . . . . 8.4Beverage . . . . . . . . . . . . . . . . . . . . . . . . . . . . . . . . . . . . . . . . . . . . . . 7.5Banks . . . . . . . . . . . . . . . . . . . . . . . . . . . . . . . . . . . . . . . . . . . . . . . . . 7.0Capital Goods . . . . . . . . . . . . . . . . . . . . . . . . . . . . . . . . . . . . . . . . . . 6.5Food . . . . . . . . . . . . . . . . . . . . . . . . . . . . . . . . . . . . . . . . . . . . . . . . . . 6.1Media . . . . . . . . . . . . . . . . . . . . . . . . . . . . . . . . . . . . . . . . . . . . . . . . . 6.0Retailing . . . . . . . . . . . . . . . . . . . . . . . . . . . . . . . . . . . . . . . . . . . . . . 3.2Technology Hardware & Equipment . . . . . . . . . . . . . . . . . . . . . . . . . 2.8Diversified Financials . . . . . . . . . . . . . . . . . . . . . . . . . . . . . . . . . . . . . 2.8Automobiles & Components . . . . . . . . . . . . . . . . . . . . . . . . . . . . . . . 2.6Materials . . . . . . . . . . . . . . . . . . . . . . . . . . . . . . . . . . . . . . . . . . . . . . 1.9Household & Personal Products . . . . . . . . . . . . . . . . . . . . . . . . . . . . . 1.8Real Estate . . . . . . . . . . . . . . . . . . . . . . . . . . . . . . . . . . . . . . . . . . . . . 0.5
Total Common Stocks . . . . . . . . . . . . . . . . . . . . . . . . . . . . . . . . . . . 89.5Registered Investment Company . . . . . . . . . . . . . . . . . . . . . . . . . . . 6.2U.S. Treasury Bill . . . . . . . . . . . . . . . . . . . . . . . . . . . . . . . . . . . . . . . 2.7Unrealized Appreciation on Forward Contracts (Net) . . . . . . . . . . . 1.4Other Assets and Liabilities (Net) . . . . . . . . . . . . . . . . . . . . . . . . . . 0.2
Net Assets . . . . . . . . . . . . . . . . . . . . . . . . . . . . . . . . . . . . . . . . . . . . . 100.0%
Portfolio CompositionSeptember 30, 2018 (Unaudited)
Money Market Funds,Money Market Funds,Treasury Bills andTreasury Bills andOther Assets andOther Assets andLiabilities (Net)Liabilities (Net)(b)(b) 11% 11%
(a)(a) "Other Countries" include Chile, China, Hong Kong, Japan and Singapore"Other Countries" include Chile, China, Hong Kong, Japan and Singapore(b)(b) Includes Unrealized Appreciation on Forward Contracts (Net)Includes Unrealized Appreciation on Forward Contracts (Net)
France 6%France 6%
UnitedUnited Statestates 36%36%South Korea 3%South Korea 3%
UnitedUnited KingdomKingdom 12%12%
OtherOtherCountriesCountries(a)(a) 7% 7%
Switzerland 11%Switzerland 11%
Netherlands 9%Netherlands 9%
Germany 5%Germany 5%
Schedule of Forward Exchange ContractsSeptember 30, 2018 (Unaudited)
ContractsCounter-
partySettlement
DateContract Value onOrigination Date Value 09/30/18*
UnrealizedAppreciation
(Depreciation)
FORWARD EXCHANGE CONTRACTS TO BUY(a)
6,000,000 European Union Euro . . . . . . . . . . . . . . . . . . . . . . . . . . . . . . . . . SSB 11/13/18 $7,020,852 $6,994,627 $(26,225)
FORWARD EXCHANGE CONTRACTS TO SELL(a)
20,000,000 Chinese Yuan . . . . . . . . . . . . . . . . . . . . . . . . . . . . . . . . . . . . . . . SSB 10/9/18 $(2,941,220) $(2,906,736) $34,48435,000,000 Chinese Yuan . . . . . . . . . . . . . . . . . . . . . . . . . . . . . . . . . . . . . . . BNY 3/11/19 (5,401,485) (5,056,756) 344,72923,000,000 Chinese Yuan . . . . . . . . . . . . . . . . . . . . . . . . . . . . . . . . . . . . . . . JPM 4/1/19 (3,569,212) (3,321,041) 248,1716,000,000 European Union Euro . . . . . . . . . . . . . . . . . . . . . . . . . . . . . . . . . SSB 11/13/18 (7,131,450) (6,994,627) 136,8231,700,000 European Union Euro . . . . . . . . . . . . . . . . . . . . . . . . . . . . . . . . . SSB 11/27/18 (2,045,831) (1,984,150) 61,6817,000,000 European Union Euro . . . . . . . . . . . . . . . . . . . . . . . . . . . . . . . . . NTC 12/20/18 (8,472,870) (8,188,954) 283,916
25,000,000 European Union Euro . . . . . . . . . . . . . . . . . . . . . . . . . . . . . . . . . NTC 3/20/19 (31,959,750) (29,480,051) 2,479,69914,000,000 European Union Euro . . . . . . . . . . . . . . . . . . . . . . . . . . . . . . . . . BNY 5/3/19 (17,495,800) (16,574,759) 921,0414,500,000 European Union Euro . . . . . . . . . . . . . . . . . . . . . . . . . . . . . . . . . JPM 7/15/19 (5,447,178) (5,363,424) 83,7541,500,000 Great Britain Pound Sterling . . . . . . . . . . . . . . . . . . . . . . . . . . . NTC 10/9/18 (2,031,435) (1,957,053) 74,3825,500,000 Great Britain Pound Sterling . . . . . . . . . . . . . . . . . . . . . . . . . . . NTC 11/13/18 (7,321,600) (7,187,118) 134,4822,200,000 Great Britain Pound Sterling . . . . . . . . . . . . . . . . . . . . . . . . . . . SSB 12/20/18 (2,998,820) (2,880,763) 118,0574,500,000 Great Britain Pound Sterling . . . . . . . . . . . . . . . . . . . . . . . . . . . JPM 2/19/19 (6,316,366) (5,910,913) 405,4536,000,000 Great Britain Pound Sterling . . . . . . . . . . . . . . . . . . . . . . . . . . . JPM 2/25/19 (8,564,142) (7,883,558) 680,5844,500,000 Great Britain Pound Sterling . . . . . . . . . . . . . . . . . . . . . . . . . . . NTC 7/15/19 (6,067,800) (5,955,226) 112,5743,000,000 Great Britain Pound Sterling . . . . . . . . . . . . . . . . . . . . . . . . . . . BNY 8/27/19 (3,924,900) (3,979,023) (54,123)
122,000,000 Japanese Yen . . . . . . . . . . . . . . . . . . . . . . . . . . . . . . . . . . . . . . . JPM 2/14/19 (1,143,062) (1,086,750) 56,3121,250,000 Singapore Dollar . . . . . . . . . . . . . . . . . . . . . . . . . . . . . . . . . . . . JPM 11/13/18 (922,237) (915,781) 6,4569,000,000 Singapore Dollar . . . . . . . . . . . . . . . . . . . . . . . . . . . . . . . . . . . . SSB 12/31/18 (6,731,740) (6,600,676) 131,0644,300,000 Singapore Dollar . . . . . . . . . . . . . . . . . . . . . . . . . . . . . . . . . . . . SSB 8/27/19 (3,174,767) (3,174,558) 209
7,500,000,000 South Korean Won . . . . . . . . . . . . . . . . . . . . . . . . . . . . . . . . . . SSB 12/20/18 (6,917,543) (6,775,639) 141,9045,000,000,000 South Korean Won . . . . . . . . . . . . . . . . . . . . . . . . . . . . . . . . . . JPM 2/19/19 (4,649,433) (4,527,138) 122,295
6,000,000 Swiss Franc . . . . . . . . . . . . . . . . . . . . . . . . . . . . . . . . . . . . . . . . . NTC 10/9/18 (6,355,663) (6,148,692) 206,9717,000,000 Swiss Franc . . . . . . . . . . . . . . . . . . . . . . . . . . . . . . . . . . . . . . . . . BNY 11/13/18 (7,208,989) (7,196,268) 12,7218,000,000 Swiss Franc . . . . . . . . . . . . . . . . . . . . . . . . . . . . . . . . . . . . . . . . . JPM 11/27/18 (8,299,186) (8,235,367) 63,819
SEE NOTES TO FINANCIAL STATEMENTSII-11

Tweedy, Browne Value Fund
Schedule of Forward Exchange ContractsSeptember 30, 2018 (Unaudited)
ContractsCounter-
partySettlement
DateContract Value onOrigination Date Value 09/30/18*
UnrealizedAppreciation
(Depreciation)
FORWARD EXCHANGE CONTRACTS TO SELL(a) (continued)13,000,000 Swiss Franc . . . . . . . . . . . . . . . . . . . . . . . . . . . . . . . . . . . . . . . . . . . . . BNY 12/20/18 $(13,561,444) $(13,418,635) $142,8091,500,000 Swiss Franc . . . . . . . . . . . . . . . . . . . . . . . . . . . . . . . . . . . . . . . . . . . . . BNY 8/27/19 (1,571,668) (1,587,901) (16,233)
TOTAL . . . . . . . . . . . . . . . . . . . . . . . . . . . . . . . . . . . . . . . . . . . . . . . . . . . . . . . . . . . $(182,225,591) $(175,291,557) $6,934,034
Unrealized Appreciation on Forward Contracts (Net) . . . . . . . . . . . . . . . . . . . . . . . $6,907,809
* See Note 2 in Notes to Financial Statements.(a) Primary risk exposure being hedged against is currency risk.
Counterparty Abbreviations:BNY — The Bank of New York MellonJPM — JPMorgan Chase Bank NA
NTC — Northern Trust CompanySSB — State Street Bank and Trust Company
SEE NOTES TO FINANCIAL STATEMENTSII-12

Tweedy, Browne Worldwide High Dividend Yield Value Fund
Portfolio of InvestmentsSeptember 30, 2018 (Unaudited)
Shares Value*
COMMON STOCKS—81.5%
France—17.9%62,157 Cie Generale des Etablissements Michelin . . . . . . $7,432,474
169,500 CNP Assurances . . . . . . . . . . . . . . . . . . . . . . . . . 4,087,08975,070 Safran SA . . . . . . . . . . . . . . . . . . . . . . . . . . . . . . 10,524,239
206,300 SCOR SE . . . . . . . . . . . . . . . . . . . . . . . . . . . . . . . 9,584,650165,903 Total SA . . . . . . . . . . . . . . . . . . . . . . . . . . . . . . . 10,760,109
42,388,561
Germany—7.8%88,544 Axel Springer SE . . . . . . . . . . . . . . . . . . . . . . . . . 5,959,77211,335 Muenchener Rueckversicherungs AG . . . . . . . . . 2,511,32676,854 Siemens AG . . . . . . . . . . . . . . . . . . . . . . . . . . . . 9,849,552
18,320,650
Netherlands—4.3%298,794 Royal Dutch Shell plc, Class A . . . . . . . . . . . . . . 10,263,929
Singapore—5.4%340,200 DBS Group Holdings Ltd. . . . . . . . . . . . . . . . . . . 6,496,006318,400 United Overseas Bank Ltd. . . . . . . . . . . . . . . . . . 6,310,442
12,806,448
Switzerland—14.7%125,965 Nestle SA, Registered . . . . . . . . . . . . . . . . . . . . . 10,551,24597,870 Novartis AG, Registered . . . . . . . . . . . . . . . . . . . 8,456,41734,015 Roche Holding AG . . . . . . . . . . . . . . . . . . . . . . . 8,279,14223,142 Zurich Insurance Group AG . . . . . . . . . . . . . . . . 7,349,149
34,635,953
Thailand—1.1%386,200 Bangkok Bank Public Company Ltd., NVDR . . . . 2,507,792
Shares Value*
United Kingdom—16.6%411,100 BAE Systems plc . . . . . . . . . . . . . . . . . . . . . . . . . $3,376,334295,280 Diageo plc . . . . . . . . . . . . . . . . . . . . . . . . . . . . . . 10,469,802
1,534,205 G4S plc . . . . . . . . . . . . . . . . . . . . . . . . . . . . . . . . 4,841,657303,937 GlaxoSmithKline plc . . . . . . . . . . . . . . . . . . . . . . 6,091,106710,014 HSBC Holdings plc . . . . . . . . . . . . . . . . . . . . . . . 6,201,651228,905 Inchcape plc . . . . . . . . . . . . . . . . . . . . . . . . . . . . . 1,996,994431,645 WPP plc . . . . . . . . . . . . . . . . . . . . . . . . . . . . . . . . 6,329,675
39,307,219
United States—13.7%135,251 Cisco Systems, Inc. . . . . . . . . . . . . . . . . . . . . . . . . 6,579,96151,990 Johnson & Johnson . . . . . . . . . . . . . . . . . . . . . . . 7,183,458
190,605 Verizon Communications, Inc. . . . . . . . . . . . . . . . 10,176,401160,116 Wells Fargo & Company . . . . . . . . . . . . . . . . . . . 8,415,697
32,355,517
TOTAL COMMON STOCKS(Cost $129,607,734) . . . . . . . . . . . . . . . . . . . . . 192,586,069
REGISTERED INVESTMENT COMPANY—18.0%42,456,352 Dreyfus Government Securities Cash
Management – Institutional Shares(Cost $42,456,352) . . . . . . . . . . . . . . . . . . . . . . 42,456,352
INVESTMENTS IN SECURITIES(Cost $172,064,086) . . . . . . . . . . . . . . . . . . . . . 99.5% 235,042,421
OTHER ASSETSAND LIABILITIES (Net) . . . . . . . . . . . . . . . . 0.5 1,245,640
NET ASSETS . . . . . . . . . . . . . . . . . . . . . . . . . . . . 100.0% $236,288,061
* See Note 2 in Notes to Financial Statements.
Abbreviations:NVDR — Non Voting Depository Receipt
Sector DiversificationSeptember 30, 2018 (Unaudited)
Sector DiversificationPercentage ofNet Assets
COMMON STOCKS:Pharmaceuticals, Biotechnology & Life Sciences . . . . . . . . . . . . . . . 12.7%Banks . . . . . . . . . . . . . . . . . . . . . . . . . . . . . . . . . . . . . . . . . . . . . . . . 12.7Capital Goods . . . . . . . . . . . . . . . . . . . . . . . . . . . . . . . . . . . . . . . . . 10.1Insurance . . . . . . . . . . . . . . . . . . . . . . . . . . . . . . . . . . . . . . . . . . . . . 10.0Energy . . . . . . . . . . . . . . . . . . . . . . . . . . . . . . . . . . . . . . . . . . . . . . . 8.9Media . . . . . . . . . . . . . . . . . . . . . . . . . . . . . . . . . . . . . . . . . . . . . . . 5.2Food . . . . . . . . . . . . . . . . . . . . . . . . . . . . . . . . . . . . . . . . . . . . . . . . 4.5Beverage . . . . . . . . . . . . . . . . . . . . . . . . . . . . . . . . . . . . . . . . . . . . . 4.4Telecommunication Services . . . . . . . . . . . . . . . . . . . . . . . . . . . . . . 4.3Automobiles & Components . . . . . . . . . . . . . . . . . . . . . . . . . . . . . . 3.1Technology Hardware & Equipment . . . . . . . . . . . . . . . . . . . . . . . . 2.8Commercial Services & Supplies . . . . . . . . . . . . . . . . . . . . . . . . . . . 2.0Retailing . . . . . . . . . . . . . . . . . . . . . . . . . . . . . . . . . . . . . . . . . . . . . 0.8Total Common Stocks . . . . . . . . . . . . . . . . . . . . . . . . . . . . . . . . . . 81.5Registered Investment Company . . . . . . . . . . . . . . . . . . . . . . . . . . 18.0Other Assets and Liabilities (Net) . . . . . . . . . . . . . . . . . . . . . . . . . 0.5
Net Assets . . . . . . . . . . . . . . . . . . . . . . . . . . . . . . . . . . . . . . . . . . . 100.0%
Portfolio CompositionSeptember 30, 2018 (Unaudited)
Money Market FundsMoney Market Fundsand Other Assets and and Other Assets and Liabilities (Net) 18%Liabilities (Net) 18%
Switzerland Switzerland 15%15%
United Kingdom 17%United Kingdom 17%
FranceFrance 18% 18%
Germany 8%Germany 8%
United States 14%United States 14%
Singapore 5%Singapore 5%
Netherlands 4%Netherlands 4%
Thailand 1Thailand 1%
SEE NOTES TO FINANCIAL STATEMENTSII-13

TWEEDY, BROWNE FUND INC.
Statements of Assets and LiabilitiesSeptember 30, 2018 (Unaudited)
Global ValueFund
Global ValueFund II –CurrencyUnhedged
ValueFund
Worldwide HighDividend Yield
Value Fund
ASSETSInvestments, at cost(a) . . . . . . . . . . . . . . . . . . . . . . . . . . . . . . . . $6,432,887,769 $354,330,104 $277,887,349 $172,064,086
Investments in unaffiliated issuers, at value (Note 2) . . . . . . . . $9,160,934,675 $440,808,948 $501,318,733 $235,042,421Investments in affiliated issuers, at value (Note 4) . . . . . . . . . . . 102,531,341 — — —Foreign currency(b) . . . . . . . . . . . . . . . . . . . . . . . . . . . . . . . . . . 1,223 — — —Dividends and interest receivable . . . . . . . . . . . . . . . . . . . . . . . 18,000,812 771,954 758,690 552,179Receivable for investment securities sold . . . . . . . . . . . . . . . . . . 66,604,168 — — —Recoverable foreign withholding taxes . . . . . . . . . . . . . . . . . . . 31,233,201 1,388,099 1,047,835 1,081,903Receivable for Fund shares sold . . . . . . . . . . . . . . . . . . . . . . . . . 11,097,988 124,402 17,515 11,190Unrealized appreciation of forward exchange contracts
(Note 2) . . . . . . . . . . . . . . . . . . . . . . . . . . . . . . . . . . . . . . . . 185,829,459 — 7,004,390 —Prepaid expense . . . . . . . . . . . . . . . . . . . . . . . . . . . . . . . . . . . . 205,746 8,643 11,392 5,670
Total Assets . . . . . . . . . . . . . . . . . . . . . . . . . . . . . . . . . . . . . . . . $9,576,438,613 $443,102,046 $510,158,555 $236,693,363
LIABILITIESUnrealized depreciation of forward exchange contracts
(Note 2) . . . . . . . . . . . . . . . . . . . . . . . . . . . . . . . . . . . . . . . . $6,805,924 $ — $96,581 $ —Payable for Fund shares redeemed . . . . . . . . . . . . . . . . . . . . . . . 41,151,191 131,403 267,898 84,106Investment advisory fee payable (Note 3) . . . . . . . . . . . . . . . . . 6,101,618 281,642 327,269 151,618Payable for investment securities purchased . . . . . . . . . . . . . . . — 2,663,563 — —Shareholder servicing and administration fees payable
(Note 3) . . . . . . . . . . . . . . . . . . . . . . . . . . . . . . . . . . . . . . . . 315,681 11,960 17,227 10,380Due to custodian . . . . . . . . . . . . . . . . . . . . . . . . . . . . . . . . . . . . 1,375 — — —Accrued foreign capital gains taxes . . . . . . . . . . . . . . . . . . . . . . 4,610,289 271,360 — 111,187Accrued expenses and other payables . . . . . . . . . . . . . . . . . . . . 1,639,250 80,173 82,134 48,011
Total Liabilities . . . . . . . . . . . . . . . . . . . . . . . . . . . . . . . . . . . . . 60,625,328 3,440,101 791,109 405,302NET ASSETS . . . . . . . . . . . . . . . . . . . . . . . . . . . . . . . . . . . . . . . $9,515,813,285 $439,661,945 $509,367,446 $236,288,061
NET ASSETS consist ofUndistributed net investment income . . . . . . . . . . . . . . . . . . . . $125,763,494 $5,265,629 $4,732,932 $1,997,300Accumulated net realized gain (loss) on securities, forward
exchange contracts and foreign currencies . . . . . . . . . . . . . . 319,304,786 (8,509,463) 59,651,923 31,729,718Net unrealized appreciation of securities, forward exchange
contracts, foreign currencies and net other assets . . . . . . . . . 3,009,657,604 86,486,528 230,340,381 62,989,512Paid-in capital . . . . . . . . . . . . . . . . . . . . . . . . . . . . . . . . . . . . . 6,061,087,401 356,419,251 214,642,210 139,571,531
Total Net Assets . . . . . . . . . . . . . . . . . . . . . . . . . . . . . . . . . . . . $9,515,813,285 $439,661,945 $509,367,446 $236,288,061
CAPITAL STOCK (common stock outstanding) . . . . . . . . . . . . 326,328,047 27,657,493 20,959,587 22,479,220
NET ASSET VALUE, offering and redemption price pershare(c) . . . . . . . . . . . . . . . . . . . . . . . . . . . . . . . . . . . . . . . . . . . $29.16 $15.90 $24.30 $10.51
(a) Includes investments in affiliated issuers for Global Value Fund, Global Value Fund II – Currency Unhedged, Value Fund and Worldwide High Dividend YieldValue Fund of $38,072,759, $0, $0 and $0, respectively (Note 4).
(b) Foreign currency held at cost for the Global Value Fund, Global Value Fund II – Currency Unhedged, Value Fund and Worldwide High Dividend Yield Value Fundwas $1,224, $0, $0 and $0, respectively.
(c) Global Value Fund, Global Value Fund II – Currency Unhedged and Worldwide High Dividend Yield Value Fund charge a redemption fee equal to 2% of theredemption proceeds on redemptions made less than 15 days after purchase. Application of the redemption fee would have the effect of reducing the redemptionprice per share.
SEE NOTES TO FINANCIAL STATEMENTSII-14

TWEEDY, BROWNE FUND INC.
Statements of OperationsFor the Six Months Ended September 30, 2018 (Unaudited)
Global ValueFund
Global ValueFund II –CurrencyUnhedged
ValueFund
Worldwide HighDividend Yield
Value Fund
INVESTMENT INCOMEDividends(a) . . . . . . . . . . . . . . . . . . . . . . . . . . . . . . . . . . . $195,409,204 $8,274,336 $7,438,484 $6,077,371Less foreign withholding taxes . . . . . . . . . . . . . . . . . . . . . (20,329,861) (883,510) (613,556) (484,402)Interest . . . . . . . . . . . . . . . . . . . . . . . . . . . . . . . . . . . . . . 7,500,880 488,805 405,868 201,652
Total Investment Income 182,580,223 7,879,631 7,230,796 5,794,621
EXPENSESInvestment advisory fee (Note 3) . . . . . . . . . . . . . . . . . . . 60,569,668 2,727,870 3,332,087 1,586,410Transfer agent fees (Note 3) . . . . . . . . . . . . . . . . . . . . . . 1,699,104 39,260 98,905 57,812Fund administration and accounting fees (Note 3) . . . . . . 994,715 46,110 56,019 27,390Custodian fees (Note 3) . . . . . . . . . . . . . . . . . . . . . . . . . . 939,823 49,385 33,542 22,918Directors’ fees and expenses (Note 3) . . . . . . . . . . . . . . . . 365,993 15,345 20,688 9,505Legal and audit fees . . . . . . . . . . . . . . . . . . . . . . . . . . . . . 276,729 17,668 31,234 12,841Shareholder servicing and administration fees
(Note 3) . . . . . . . . . . . . . . . . . . . . . . . . . . . . . . . . . . . 212,145 7,836 11,979 6,193Other . . . . . . . . . . . . . . . . . . . . . . . . . . . . . . . . . . . . . . . . 495,715 51,646 44,053 39,705
Total expenses before waivers . . . . . . . . . . . . . . . . . 65,553,892 2,955,120 3,628,507 1,762,774Investment advisory fees waived and/or expenses
reimbursed (Note 3) . . . . . . . . . . . . . . . . . . . . . . . . . . — — (16,372) (42,796)Net Expenses 65,553,892 2,955,120 3,612,135 1,719,978
NET INVESTMENT INCOME . . . . . . . . . . . . . . . . . . . 117,026,331 4,924,511 3,618,661 4,074,643
REALIZED AND UNREALIZED GAIN (LOSS) ON INVESTMENTSNet realized gain (loss) on:
Securities(a) . . . . . . . . . . . . . . . . . . . . . . . . . . . . . . . . . 331,085,392 (21,554) 32,500,736 18,792,273Forward exchange contracts . . . . . . . . . . . . . . . . . . . . . (46,744,976) — (1,554,453) —Foreign currencies and net other assets . . . . . . . . . . . . . (1,264,715) (95,793) (68,314) (75,044)
Net realized gain (loss) on investments during theperiod . . . . . . . . . . . . . . . . . . . . . . . . . . . . . . . . . . . . . 283,075,701 (117,347) 30,877,969 18,717,229
Net unrealized appreciation (depreciation) of:Securities(b)(c) . . . . . . . . . . . . . . . . . . . . . . . . . . . . . . . . (342,663,585) 2,114,410 (22,747,165) (12,577,880)Forward exchange contracts . . . . . . . . . . . . . . . . . . . . . 374,419,294 — 13,104,775 —Foreign currencies and net other assets . . . . . . . . . . . . . (1,177,373) (40,274) (49,921) (40,838)
Net change in unrealized appreciation (depreciation) ofinvestments . . . . . . . . . . . . . . . . . . . . . . . . . . . . . . . . . 30,578,336 2,074,136 (9,692,311) (12,618,718)
NET REALIZED AND UNREALIZED GAIN ONINVESTMENTS . . . . . . . . . . . . . . . . . . . . . . . . . . . . . . 313,654,037 1,956,789 21,185,658 6,098,511
NET INCREASE IN NET ASSETS RESULTINGFROM OPERATIONS . . . . . . . . . . . . . . . . . . . . . . . . . $430,680,368 $6,881,300 $24,804,319 $10,173,154
(a) Dividend income and net realized gain on securities from affiliated issuers for Global Value Fund were $2,277,444 and $614,977, respectively (Note 4).(b) Net of decrease in accrued foreign capital gain taxes of $619,885, $60,947, $0 and $18,427, respectively.(c) Net unrealized depreciation from affiliated issuers for Global Value Fund was $(5,431,465) (Note 4).
SEE NOTES TO FINANCIAL STATEMENTSII-15

TWEEDY, BROWNE FUND INC.
Statements of Changes in Net Assets
Global Value FundGlobal Value Fund II –
Currency UnhedgedSix Months
Ended9/30/2018
(Unaudited)Year Ended3/31/2018
Six MonthsEnded
9/30/2018(Unaudited)
Year Ended3/31/2018
INVESTMENT ACTIVITIES:Net investment income . . . . . . . . . . . . . . . . . . . . . . . . . . . . . . . . $117,026,331 $91,684,840 $4,924,511 $3,478,022
Net realized gain (loss) on securities, forward exchange contractsand currency transactions . . . . . . . . . . . . . . . . . . . . . . . . . . . . . 283,075,701 132,601,555 (117,347) 8,661,855
Net change in unrealized appreciation (depreciation) of securities,forward exchange contracts, foreign currencies and net otherassets . . . . . . . . . . . . . . . . . . . . . . . . . . . . . . . . . . . . . . . . . . . . 30,578,336 344,315,312 2,074,136 29,664,756
Net increase in net assets resulting from operations . . . . . . . . . . . 430,680,368 568,601,707 6,881,300 41,804,633
DISTRIBUTIONS:Dividends to shareholders from net investment income . . . . . . . . — (111,972,219) — (4,606,757)
Distributions to shareholders from net realized gain oninvestments . . . . . . . . . . . . . . . . . . . . . . . . . . . . . . . . . . . . . . . — (35,657,899) — —
Total distributions . . . . . . . . . . . . . . . . . . . . . . . . . . . . . . . . . . . . — (147,630,118) — (4,606,757)
Net increase (decrease) in net assets from Fund share transactions(Note 5) . . . . . . . . . . . . . . . . . . . . . . . . . . . . . . . . . . . . . . . . . (587,183,765) (328,420,392) 54,583,338 (12,619,381)
Redemption fees . . . . . . . . . . . . . . . . . . . . . . . . . . . . . . . . . . . . . 44,801 50,243 2 678
Net increase (decrease) in net assets . . . . . . . . . . . . . . . . . . . . . . . (156,458,596) 92,601,440 61,464,640 24,579,173
NET ASSETSBeginning of period . . . . . . . . . . . . . . . . . . . . . . . . . . . . . . . . . . . 9,672,271,881 9,579,670,441 378,197,305 353,618,132
End of period . . . . . . . . . . . . . . . . . . . . . . . . . . . . . . . . . . . . . . . . $9,515,813,285 $9,672,271,881 $439,661,945 $378,197,305
Undistributed net investment income at end of period . . . . . . . . . $125,763,494 $8,737,163 $5,265,629 $341,118
SEE NOTES TO FINANCIAL STATEMENTSII-16

TWEEDY, BROWNE FUND INC.
Statements of Changes in Net Assets
Value FundWorldwide High Dividend
Yield Value FundSix Months
Ended9/30/2018
(Unaudited)Year Ended3/31/2018
Six MonthsEnded
9/30/2018(Unaudited)
Year Ended3/31/2018
INVESTMENT ACTIVITIES:Net investment income . . . . . . . . . . . . . . . . . . . . . . . . . . . . . . . . . . . $3,618,661 $3,542,044 $4,074,643 $4,637,595
Net realized gain on securities, forward exchange contracts andcurrency transactions . . . . . . . . . . . . . . . . . . . . . . . . . . . . . . . . . . . 30,877,969 30,486,826 18,717,229 21,292,346
Net change in unrealized appreciation (depreciation) of securities,forward exchange contracts, foreign currencies and net otherassets . . . . . . . . . . . . . . . . . . . . . . . . . . . . . . . . . . . . . . . . . . . . . . . (9,692,311) 14,572,434 (12,618,718) 13,906,184
Net increase in net assets resulting from operations . . . . . . . . . . . . . . 24,804,319 48,601,304 10,173,154 39,836,125
DISTRIBUTIONS:Dividends to shareholders from net investment income . . . . . . . . . . . — (4,466,740) (3,437,165) (5,267,715)
Distributions to shareholders from net realized gain oninvestments . . . . . . . . . . . . . . . . . . . . . . . . . . . . . . . . . . . . . . . . . . — (4,587,633) — (9,462,310)
Total distributions . . . . . . . . . . . . . . . . . . . . . . . . . . . . . . . . . . . . . . . — (9,054,373) (3,437,165) (14,730,025)
Net decrease in net assets from Fund share transactions (Note 5) . . . . (49,455,502) (82,260,162) (37,090,221) (54,571,348)
Redemption fees . . . . . . . . . . . . . . . . . . . . . . . . . . . . . . . . . . . . . . . . — — — 355
Net decrease in net assets . . . . . . . . . . . . . . . . . . . . . . . . . . . . . . . . . . (24,651,183) (42,713,231) (30,354,232) (29,464,893)
NET ASSETSBeginning of period . . . . . . . . . . . . . . . . . . . . . . . . . . . . . . . . . . . . . . 534,018,629 576,731,860 266,642,293 296,107,186
End of period . . . . . . . . . . . . . . . . . . . . . . . . . . . . . . . . . . . . . . . . . . . $509,367,446 $534,018,629 $236,288,061 $266,642,293
Undistributed net investment income at end of period . . . . . . . . . . . . $4,732,932 $1,114,271 $1,997,300 $1,359,822
SEE NOTES TO FINANCIAL STATEMENTSII-17

TWEEDY, BROWNE FUND INC.
Financial HighlightsTweedy, Browne Global Value FundFor a Fund share outstanding throughout each period/year.
Six MonthsEnded
9/30/18(Unaudited)
YearEnded
3/31/18
YearEnded
3/31/17
YearEnded
3/31/16
YearEnded
3/31/15
YearEnded
3/31/14Net asset value, beginning of period/year . . . . . . . . . . . . . . . $27.89 $26.74 $23.89 $26.97 $26.98 $25.11Income from investment operations:Net investment income . . . . . . . . . . . . . . . . . . . . . . . . . . . . 0.36 0.25 0.32 0.22 0.24 0.32Net realized and unrealized gain (loss) on investments . . . . . 0.91 1.31 3.32 (2.09) 0.74 2.73
Total from investment operations . . . . . . . . . . . . . . . 1.27 1.56 3.64 (1.87) 0.98 3.05Distributions:Dividends from net investment income . . . . . . . . . . . . . . . . — (0.31) (0.29) (0.21) (0.33) (0.32)Distributions from net realized gains . . . . . . . . . . . . . . . . . . . — (0.10) (0.50) (1.00) (0.66) (0.86)
Total distributions . . . . . . . . . . . . . . . . . . . . . . . . . . — (0.41) (0.79) (1.21) (0.99) (1.18)Redemption fees(a) . . . . . . . . . . . . . . . . . . . . . . . . . . . . . . . . 0.00 0.00 0.00 0.00 0.00 0.00Net asset value, end of period/year . . . . . . . . . . . . . . . . . . . . $29.16 $27.89 $26.74 $23.89 $26.97 $26.98Total return(b) . . . . . . . . . . . . . . . . . . . . . . . . . . . . . . . . . . . . 4.55% 5.82% 15.49% (7.08)% 3.69%(c) 12.25%(c)
Ratios/Supplemental Data:Net assets, end of period/year (in 000s) . . . . . . . . . . . . . . . . . $9,515,813 $9,672,272 $9,579,670 $8,718,479 $9,603,856 $7,977,755Ratio of operating expenses to average net assets . . . . . . . . . . 1.35%(d) 1.36% 1.38% 1.37% 1.36% 1.37%Ratio of net investment income to average net assets . . . . . . 2.42%(d) 0.91% 1.25% 0.83% 0.94% 1.30%Portfolio turnover rate . . . . . . . . . . . . . . . . . . . . . . . . . . . . . 3% 5% 3% 1% 8% 4%
(a) Amount represents less than $0.01 per share.(b) Total return represents aggregate total return for the periods indicated.(c) The net asset value (NAV) disclosed in the March 31, 2014 annual report reflects adjustments in accordance with accounting principles generally accepted in the
United States of America and as such, differs from the NAV reported on March 31, 2014. The total return reported is based on the unadjusted NAV which was theofficial NAV for executing transactions on March 31, 2014.
(d) Annualized.
Tweedy, Browne Global Value Fund II – Currency UnhedgedFor a Fund share outstanding throughout each period/year.
Six MonthsEnded
9/30/18(Unaudited)
YearEnded
3/31/18
YearEnded
3/31/17
YearEnded
3/31/16
YearEnded
3/31/15
YearEnded
3/31/14Net asset value, beginning of period/year . . . . . . . . . . . . . . . $15.61 $14.10 $12.88 $14.02 $14.90 $13.18Income from investment operations:Net investment income . . . . . . . . . . . . . . . . . . . . . . . . . . . . 0.18 0.14 0.21 0.17 0.15 0.15Net realized and unrealized gain (loss) on investments . . . . . 0.11 1.56 1.21 (1.12) (0.84) 1.72
Total from investment operations . . . . . . . . . . . . . . . 0.29 1.70 1.42 (0.95) (0.69) 1.87Distributions:Dividends from net investment income . . . . . . . . . . . . . . . . — (0.19) (0.20) (0.19) (0.19) (0.15)Redemption fees(a) . . . . . . . . . . . . . . . . . . . . . . . . . . . . . . . . 0.00 0.00 0.00 0.00 0.00 0.00Net asset value, end of period/year . . . . . . . . . . . . . . . . . . . . $15.90 $15.61 $14.10 $12.88 $14.02 $14.90Total return(b) . . . . . . . . . . . . . . . . . . . . . . . . . . . . . . . . . . . . 1.86% 12.08% 11.17% (6.79)% (4.72)%(c) 14.27%(c)
Ratios/Supplemental Data:Net assets, end of period/year (in 000s) . . . . . . . . . . . . . . . . . $439,662 $378,197 $353,618 $341,727 $447,103 $443,382Ratio of operating expenses to average net assets . . . . . . . . . . 1.35%(d) 1.36% 1.40% 1.38% 1.37% 1.37%Ratio of operating expenses to average net assets excluding
recoupments and/or waivers/reimbursements ofexpenses . . . . . . . . . . . . . . . . . . . . . . . . . . . . . . . . . . . . . . 1.35%(d) 1.37% 1.40% 1.38% 1.36% 1.37%
Ratio of net investment income to average net assets . . . . . . 2.26%(d) 0.93% 1.51% 1.12% 1.00% 1.23%Portfolio turnover rate . . . . . . . . . . . . . . . . . . . . . . . . . . . . . 0% 6% 4% 14% 9% 4%
(a) Amount represents less than $0.01 per share.(b) Total return represents aggregate total return for the periods indicated.(c) The net asset value (NAV) disclosed in the March 31, 2014 annual report reflects adjustments in accordance with accounting principles generally accepted in the
United States of America and as such, differs from the NAV reported on March 31, 2014. The total return reported is based on the unadjusted NAV which was theofficial NAV for executing transactions on March 31, 2014.
(d) Annualized.
SEE NOTES TO FINANCIAL STATEMENTSII-18

TWEEDY, BROWNE FUND INC.
Financial HighlightsTweedy, Browne Value FundFor a Fund share outstanding throughout each period/year.
Six MonthsEnded
9/30/18(Unaudited)
YearEnded
3/31/18
YearEnded
3/31/17
YearEnded
3/31/16
YearEnded
3/31/15
YearEnded
3/31/14Net asset value, beginning of period/year . . . . . . . . . . . . . . . $23.20 $21.78 $19.51 $22.14 $23.21 $21.68
Income from investment operations:Net investment income . . . . . . . . . . . . . . . . . . . . . . . . . . . . 0.18 0.16 0.20 0.20 0.24 0.27Net realized and unrealized gain (loss) on investments . . . . . 0.92 1.64 2.99 (1.97) 0.47 2.81
Total from investment operations . . . . . . . . . . . . . . . 1.10 1.80 3.19 (1.77) 0.71 3.08
Distributions:Dividends from net investment income . . . . . . . . . . . . . . . . — (0.19) (0.19) (0.21) (0.26) (0.21)Distributions from net realized gains . . . . . . . . . . . . . . . . . . . — (0.19) (0.73) (0.65) (1.52) (1.34)
Total distributions . . . . . . . . . . . . . . . . . . . . . . . . . . — (0.38) (0.92) (0.86) (1.78) (1.55)Net asset value, end of period/year . . . . . . . . . . . . . . . . . . . . $24.30 $23.20 $21.78 $19.51 $22.14 $23.21
Total return(a) . . . . . . . . . . . . . . . . . . . . . . . . . . . . . . . . . . . . 4.74% 8.19% 16.57% (8.09)% 3.08% 14.38%
Ratios/Supplemental Data:Net assets, end of period/year (in 000s) . . . . . . . . . . . . . . . . . $509,367 $534,019 $576,732 $506,152 $619,158 $638,000Ratio of operating expenses to average net assets . . . . . . . . . . 1.35% 1.36% 1.38% 1.37% 1.36% 1.37%Ratio of operating expenses to average net assets excluding
waivers and/or reimbursements of expenses . . . . . . . . . . . . 1.36%(b) 1.37% 1.38% 1.37% 1.36% 1.37%Ratio of net investment income to average net assets . . . . . . 1.36%(b) 0.61% 0.97% 0.91% 0.98% 1.17%Portfolio turnover rate . . . . . . . . . . . . . . . . . . . . . . . . . . . . . 3% 6% 8% 7% 6% 7%
(a) Total return represents aggregate total return for the periods indicated.(b) Annualized.
Tweedy, Browne Worldwide High Dividend Yield Value FundFor a Fund share outstanding throughout each period/year.
Six MonthsEnded
9/30/18(Unaudited)
YearEnded
3/31/18
YearEnded
3/31/17
YearEnded
3/31/16
YearEnded
3/31/15
YearEnded
3/31/14Net asset value, beginning of period/year . . . . . . . . . . . . . . . $10.23 $9.47 $8.75 $10.84 $12.01 $10.67
Income from investment operations:Net investment income . . . . . . . . . . . . . . . . . . . . . . . . . . . . 0.18 0.17 0.23 0.21(c) 0.25 0.23Net realized and unrealized gain (loss) on investments . . . . . 0.24 1.10 0.87 (1.15) (0.50) 1.33
Total from investment operations . . . . . . . . . . . . . . . 0.42 1.27 1.10 (0.94) (0.25) 1.56
Distributions:Dividends from net investment income . . . . . . . . . . . . . . . . (0.14) (0.18) (0.23) (0.26) (0.25) (0.20)Distributions from net realized gains . . . . . . . . . . . . . . . . . . . — (0.33) (0.15) (0.89) (0.67) (0.02)
Total distributions . . . . . . . . . . . . . . . . . . . . . . . . . . (0.14) (0.51) (0.38) (1.15) (0.92) (0.22)Redemption fees(a) . . . . . . . . . . . . . . . . . . . . . . . . . . . . . . . . 0.00 0.00 0.00 0.00 0.00 0.00Net asset value, end of period/year . . . . . . . . . . . . . . . . . . . . $10.51 $10.23 $9.47 $8.75 $10.84 $12.01
Total return(b) . . . . . . . . . . . . . . . . . . . . . . . . . . . . . . . . . . . . 4.03%(d) 13.58%(d) 13.04% (9.03)% (2.23)% 14.81%
Ratios/Supplemental Data:Net assets, end of period/year (in 000s) . . . . . . . . . . . . . . . . . $236,288 $266,642 $296,107 $334,621 $568,540 $754,786Ratio of operating expenses to average net assets . . . . . . . . . . 1.35% 1.36% 1.38% 1.37% 1.35% 1.36%Ratio of operating expenses to average net assets excluding
waiver and/or reimbursements of expenses . . . . . . . . . . . . 1.39%(e) 1.37% 1.38% 1.37% 1.35% 1.36%Ratio of net investment income to average net assets . . . . . . 3.18%(e) 1.54% 2.43% 2.11% 1.96% 2.07%Portfolio turnover rate . . . . . . . . . . . . . . . . . . . . . . . . . . . . . 1% 5% 5% 5% 7% 10%
(a) Amount represents less than $0.01 per share.(b) Total return represents aggregate total return for the periods indicated.(c) Based on average shares outstanding.(d) The net asset value (NAV) disclosed in the March 31, 2018 annual report reflects adjustments in accordance with accounting principles generally accepted in the
United States of America and as such, differs from the NAV reported on March 31, 2018. The total return reported is based on the unadjusted NAV which was theofficial NAV for executing transactions on March 31, 2018.
(e) Annualized.
SEE NOTES TO FINANCIAL STATEMENTSII-19

TWEEDY, BROWNE FUND INC.
Notes to Financial Statements (Unaudited)
1. OrganizationTweedy, Browne Fund Inc. (the “Company”) is an open-
end management investment company registered with theUnited States Securities and Exchange Commission (“SEC”)under the Investment Company Act of 1940, as amended(the “1940 Act”). The Company was organized as a Marylandcorporation on January 28, 1993. Tweedy, Browne GlobalValue Fund (“Global Value Fund”), Tweedy, Browne GlobalValue Fund II – Currency Unhedged (“Global Value Fund II– Currency Unhedged”), Tweedy, Browne Value Fund(“Value Fund”), and Tweedy, Browne Worldwide HighDividend Yield Value Fund (“Worldwide High DividendYield Value Fund”) (each a “Fund” and together, the “Funds”)are each diversified series of the Company.
The Funds commenced operations as follows:
Global Value Fund 06/15/93
Global Value Fund II – Currency Unhedged 10/26/09
Value Fund 12/08/93
Worldwide High Dividend Yield Value Fund 09/05/07
Global Value Fund and Global Value Fund II – CurrencyUnhedged seek long-term capital growth by investingprimarily in foreign equity securities that Tweedy, BrowneCompany LLC (the “Investment Adviser”) believes areundervalued. Value Fund seeks long-term capital growth byinvesting primarily in U.S. and foreign equity securities thatthe Investment Adviser believes are undervalued. WorldwideHigh Dividend Yield Value Fund seeks long-term capitalgrowth by investing primarily in U.S. and foreign equitysecurities that the Investment Adviser believes to have above-average dividend yields and valuations that are reasonable.
2. Significant Accounting PoliciesThe Funds are investment companies and, accordingly,
follow the investment company accounting and reportingguidance of the Financial Accounting Standards BoardAccounting Standards Codification Topic 946 – InvestmentCompanies, which is part of U.S. generally accepted accountingprinciples (“U.S. GAAP”). The preparation of financialstatements in accordance with U.S. GAAP requires managementto make estimates and assumptions that affect the reportedamounts and disclosures in the financial statements. Actualresults could differ from those estimates. The following is asummary of significant accounting policies consistently followedby the Funds in the preparation of their financial statements.
Portfolio Valuation. Portfolio securities and other assetslisted on a U.S. national securities exchange, comparableforeign securities exchange or through any system providing forcontemporaneous publication of actual prices (and not subjectto restrictions against sale by the Fund on such exchange orsystem) are valued at the last quoted sale price at or prior to theclose of regular trading on the New York Stock Exchange or, if
applicable, the NASDAQ Official Closing Price (“NOCP”).Portfolio securities and other assets that are readily marketablebut for which there are no reported sales on the valuation date,whether because they are not traded in a system providing forsame day publication of sales or because there were no salesreported on such date, are generally valued at the mean betweenthe last asked price and the last bid price prior to the close ofregular trading. Forward exchange contracts are valued at theforward rate. Securities and other assets for which currentmarket quotations are not readily available, and those securitieswhich are generally not readily marketable due to significantlegal or contractual restrictions, are valued at fair value asdetermined in good faith by the Investment Adviser under thedirection of the Company’s Board of Directors. Securities andother assets for which the most recent market quotations maynot be reliable (including because the last sale price does notreflect current market value at the time of valuing the Fund’sassets due to developments since such last price) may be valuedat fair value if the Investment Adviser concludes that fairvaluation will likely result in a more accurate net assetvaluation. The Funds’ use of fair value pricing may cause the netasset value of a Fund’s shares to differ from the net asset valuethat would be calculated using market quotations. Fair valuepricing involves subjective judgments, and it is possible that thefair value determined for a security may be materially differentthan the value that could be realized upon the sale of thatsecurity. Debt securities purchased with a remaining maturity ofmore than 60 days are valued through pricing obtained bypricing services approved by the Company’s Board of Directors.Debt securities purchased with a remaining maturity of 60 daysor less are valued at amortized cost, which approximates fairvalue, or by reference to other factors (i.e., pricing services ordealer quotations) by the Investment Adviser.
Fair Value Measurements. The inputs and valuationtechniques used to determine fair value of the Funds’investments are summarized into three levels as described inthe hierarchy below:
• Level 1 – quoted prices in active markets for identicalsecurities
• Level 2 – other significant observable inputs (includingquoted prices for similar securities, interest rates, creditrisk, etc.)
• Level 3 – significant unobservable inputs (including aFund’s own assumptions in determining the fair valueof investments)
The inputs or methodology used for valuing securities are notnecessarily an indication of the risk associated with investing inthose securities. The following is a summary of the inputs used tovalue each Fund’s assets carried at fair value as of September 30,2018. See each Fund’s respective Portfolio of Investments fordetails on portfolio holdings.
II-20

TWEEDY, BROWNE FUND INC.
Notes to Financial Statements (Unaudited)
Global Value Fund
TotalValue at
September 30, 2018
Level 1QuotedPrice
Level 2Other
SignificantObservable
Inputs
Level 3Significant
UnobservableInputs
Investments in Securities:Common Stocks
Canada . . . . . . . . . . . . . . . . . . . . . . . . . . . . . . . . . . . . . . . . . . . . . . . $ 131,263,947 $ 74,356,434 $ 56,907,513 $ —Czech Republic . . . . . . . . . . . . . . . . . . . . . . . . . . . . . . . . . . . . . . . . . 1,879,554 — 1,879,554 —Switzerland . . . . . . . . . . . . . . . . . . . . . . . . . . . . . . . . . . . . . . . . . . . . 1,266,633,944 1,266,214,206 419,738 —All Other Countries . . . . . . . . . . . . . . . . . . . . . . . . . . . . . . . . . . . . . 7,047,406,559 7,047,406,559 — —
Preferred Stocks . . . . . . . . . . . . . . . . . . . . . . . . . . . . . . . . . . . . . . . . . . . . . 46,555,988 46,555,988 — —Registered Investment Company . . . . . . . . . . . . . . . . . . . . . . . . . . . . . . . . 471,693,649 471,693,649 — —U.S. Treasury Bills . . . . . . . . . . . . . . . . . . . . . . . . . . . . . . . . . . . . . . . . . . . 298,032,375 — 298,032,375 —Total Investments in Securities . . . . . . . . . . . . . . . . . . . . . . . . . . . . . . . . . 9,263,466,016 8,906,226,836 357,239,180 —
Other Financial Instruments:Asset
Unrealized appreciation of forward exchange contracts . . . . . . . . . . . 185,829,459 — 185,829,459 —Liability
Unrealized depreciation of forward exchange contracts . . . . . . . . . . . (6,805,924) — (6,805,924) —Total $9,442,489,551 $8,906,226,836 $536,262,715 $ —
Global Value Fund II – Currency Unhedged
TotalValue at
September 30, 2018
Level 1QuotedPrice
Level 2Other
SignificantObservable
Inputs
Level 3Significant
UnobservableInputs
Investments in Securities:Common Stocks
Canada . . . . . . . . . . . . . . . . . . . . . . . . . . . . . . . . . . . . . . . . . . . . . . . $ 2,220,670 $ — $ 2,220,670 $ —All Other Countries . . . . . . . . . . . . . . . . . . . . . . . . . . . . . . . . . . . . . 388,910,563 388,910,563 — —
Preferred Stocks . . . . . . . . . . . . . . . . . . . . . . . . . . . . . . . . . . . . . . . . . . . . . 3,383,559 3,383,559 — —Registered Investment Company . . . . . . . . . . . . . . . . . . . . . . . . . . . . . . . . 46,294,156 46,294,156 — —
Total $ 440,808,948 $ 438,588,278 $ 2,220,670 $ —
Value Fund
TotalValue at
September 30, 2018
Level 1QuotedPrice
Level 2Other
SignificantObservable
Inputs
Level 3Significant
UnobservableInputs
Investments in Securities:Common Stocks . . . . . . . . . . . . . . . . . . . . . . . . . . . . . . . . . . . . . . . . . . . . $ 455,759,901 $ 455,759,901 $ — $ —Registered Investment Company . . . . . . . . . . . . . . . . . . . . . . . . . . . . . . . . 31,613,438 31,613,438 — —U.S. Treasury Bill . . . . . . . . . . . . . . . . . . . . . . . . . . . . . . . . . . . . . . . . . . . 13,945,394 — 13,945,394 —Total Investments in Securities . . . . . . . . . . . . . . . . . . . . . . . . . . . . . . . . . 501,318,733 487,373,339 13,945,394 —
Other Financial Instruments:Asset
Unrealized appreciation of forward exchange contracts . . . . . . . . . . . 7,004,390 — 7,004,390 —Liability
Unrealized depreciation of forward exchange contracts . . . . . . . . . . . (96,581) — (96,581) —Total $ 508,226,542 $ 487,373,339 $ 20,853,203 $ —
Worldwide High Dividend Yield Value Fund
TotalValue at
September 30, 2018
Level 1QuotedPrice
Level 2Other
SignificantObservable
Inputs
Level 3Significant
UnobservableInputs
Investments in Securities . . . . . . . . . . . . . . . . . . . . . . . . . . . . . . . . . . . . . . . . $ 235,042,421 $ 235,042,421 $ — $ —
II-21

TWEEDY, BROWNE FUND INC.
Notes to Financial Statements (Unaudited)
Foreign Currency. The books and records of the Fundsare maintained in U.S. dollars. Foreign currencies,investments and other assets and liabilities are translated intoU.S. dollars at the exchange rates prevailing at the end of theperiod, and purchases and sales of investment securities,income and expenses are translated on the respective dates ofsuch transactions. Unrealized gains and losses frominvestments in securities that result from changes in foreigncurrency exchange rates, have been included in net unrealizedappreciation/depreciation of securities. All other unrealizedgains and losses that result from changes in foreign currencyexchange rates have been included in net unrealizedappreciation/depreciation of foreign currencies and net otherassets. Net realized foreign currency gains and losses resultingfrom changes in exchange rates include foreign currency gainsand losses between trade date and settlement date oninvestments, securities transactions, foreign currencytransactions and the difference between the amounts ofinterest and dividends recorded on the books of a Fund andthe amount actually received. The portion of foreign currencygains and losses related to fluctuation in the exchange ratesbetween the initial purchase trade date and subsequent saletrade date is included in realized gains and losses oninvestment securities sold.
Forward Exchange Contracts. Global Value Fund andValue Fund enter into forward exchange contracts for hedgingpurposes in order to reduce their exposure to fluctuations inforeign currency exchange on their portfolio holdings. Forwardexchange contracts are valued at the forward rate and aremarked-to-market daily. The change in market value isrecorded by each Fund as an unrealized gain or loss on theFund’s Statement of Operations. When the contract is closed,each Fund records a realized gain or loss on the Statement ofOperations equal to the difference between the value of thecontract at the time that it was opened and the value of thecontract at the time that it was closed. The difference betweenthe value of a Fund’s open contracts at September 30, 2018 andthe value of those contracts at the time they were opened isincluded on the Statement of Assets and Liabilities asunrealized appreciation of forward exchange contracts (forcontracts with unrealized gains) or unrealized depreciation offorward exchange contracts (for contracts with unrealizedlosses). A Fund may be required to post collateral with respectto certain “non-deliverable” forward exchange contracts in anunrealized loss position, and may receive collateral from thecounterparty for certain non-deliverable forward exchangecontracts in an unrealized gain position. Daily movementof collateral is subject to minimum threshold amounts.Collateral posted by a Fund is held in a segregated account atthe Fund’s custodian bank, and is reported on the Statement ofAssets and Liabilities as “Cash segregated as collateral.”Collateral received by a Fund is held in escrow in the Fund’scustodian bank, and is not reported on the Fund’s Statement ofAssets and Liabilities, but would be disclosed in Note 8.
The use of forward exchange contracts does not eliminatefluctuations in the underlying prices of the Global Value Fund’sand Value Fund’s investment securities, but it does establish arate of exchange that can be achieved in the future. Althoughforward exchange contracts limit the risk of loss due to adecline in the value of the hedged currency, they also limit anypotential gain that might result should the value of the hedgedcurrency increase. In addition, the Global Value and ValueFunds could be exposed to risks if the counterparties to thecontracts are unable to meet the terms of their contracts.
Securities Transactions and Investment Income.Securities transactions are recorded as of the trade date.Realized gains and losses from securities transactions arerecorded on the identified cost basis. Dividend income anddistributions to shareholders are recorded on the ex-dividenddate. In the case of certain foreign securities, dividend incomeis recorded as soon after the ex-date as the Funds becomeaware of such dividend. Interest income and expenses arerecorded on an accrual basis.
Foreign Taxes. The Funds may be subject to foreign taxeson dividend and interest income, gains on investments orcurrency purchase/repatriation, a portion of which may berecoverable. The Funds’ custodian applies for refunds onbehalf of each Fund where available. The Funds will accruesuch taxes and recoveries as applicable, based on their currentinterpretation of tax rules and regulations that exist in themarkets in which they invest.
Dividends and Distributions to Shareholders. Dividendsfrom net investment income, if any, will be declared and paidannually for Global Value Fund, Global Value Fund II –Currency Unhedged, and Value Fund and semi-annually forWorldwide High Dividend Yield Value Fund. Distributionsfrom realized capital gains after utilization of capital losscarryforwards, if any, will be declared and paid annually foreach of the Funds. Additional distributions of net investmentincome and capital gains from the Funds may be made at thediscretion of the Board of Directors in order to avoid theapplication of a 4% non-deductible federal excise tax oncertain undistributed amounts of ordinary income and capitalgains. Income dividends and capital gain distributions aredetermined in accordance with income tax regulations whichmay differ from U.S. GAAP. These differences are primarilydue to differing treatments of income and gains on variousinvestment securities held by the Funds, timing differences anddiffering characterization of distributions made by the Funds.
Federal Income Taxes. Each Fund has qualified andintends to continue to qualify as a regulated investmentcompany by complying with the requirements of the U.S.Internal Revenue Code of 1986, as amended (the “Code”),applicable to regulated investment companies and bydistributing substantially all of its taxable income to itsshareholders. Therefore, no federal income tax provision isrequired.
II-22

TWEEDY, BROWNE FUND INC.
Notes to Financial Statements (Unaudited)
The Funds are not aware of any events that are reasonablypossible to occur in the next twelve months that would resultin the amounts of any unrecognized tax benefits significantlyincreasing or decreasing for the Funds. However, the Funds’conclusions may be subject to future review based on changesin accounting standards or tax laws and regulations or theinterpretation thereof. In addition, utilization of any capitalloss carryforwards could be subject to limitations imposed bythe Code related to share ownership changes. Each of theFunds’ tax positions for the tax years for which the applicablestatutes of limitations have not expired are subject toexamination by the Internal Revenue Service, statedepartments of revenue and by foreign tax authorities.
Expenses. Expenses directly attributable to each Fund as adiversified series of the Company are charged to such Fund.Other expenses of the Company are allocated to each seriesbased on the average net assets of each series or otherequitable allocation method.
3. Investment Advisory Fee, Other Related PartyTransactions and Administration Fee
The Company, on behalf of each Fund, has entered intoseparate investment advisory agreements with the InvestmentAdviser (each, an “Advisory Agreement”). Under theAdvisory Agreement with respect to Global Value Fund,Global Value Fund pays the Investment Adviser a fee at theannual rate of 1.25% on the Fund’s average daily net assets upto $10.3 billion, and 0.75% on the remaining amount, if any.Under the Advisory Agreements with respect to each ofGlobal Value Fund II – Currency Unhedged, Value Fund andWorldwide High Dividend Yield Value Fund, each Fund paysthe Investment Adviser a fee at the annual rate of 1.25% ofthe Fund’s average daily net assets. The fee is payablemonthly, provided that each Fund makes interim payments asmay be requested by the Investment Adviser of up to 75% ofthe amount of the fee then accrued on the books of the Fundand unpaid. For the six months ended September 30, 2018,the Investment Adviser earned $60,569,668, $2,727,870,$3,332,087, and $1,586,410 in fees, prior to any waiversand/or reimbursements, from Global Value Fund, GlobalValue Fund II – Currency Unhedged, Value Fund andWorldwide High Dividend Yield Value Fund, respectively.
With respect to Global Value Fund II – CurrencyUnhedged, Value Fund and Worldwide High Dividend YieldValue Fund, the Investment Adviser has voluntarily agreed,through at least July 31, 2019, to waive a portion of eachFund’s investment advisory fees and/or reimburse a portion ofeach Fund’s expenses to the extent necessary to keep eachFund’s expense ratio in line with the expense ratio of GlobalValue Fund. (For purposes of this calculation, each Fund’sacquired fund fees and expenses, brokerage costs, interest,taxes and extraordinary expenses are disregarded, and eachFund’s expense ratio is rounded to two decimal points.) For
the six months ended September 30, 2018, the InvestmentAdviser waived and/or reimbursed $16,372 and $42,796 infees from Value Fund and Worldwide High Dividend YieldValue Fund, respectively.
The Company pays the Investment Adviser for certainshareholder servicing and administration services provided tothe Funds at an annual amount of $475,000, which isallocated pro-rata based on the relative average net assets ofthe Funds.
No officer, director or employee of the InvestmentAdviser, the Funds’ administrator, The Bank of New YorkMellon (“BNY Mellon”) or any parent or subsidiary of thosecorporations receives any compensation from the Companyfor serving as a director or officer of the Company. TheCompany pays each Independent Director $130,000 annually,in quarterly increments of $32,500, plus out-of-pocketexpenses for their services as directors. The Lead IndependentDirector receives an additional annual fee of $26,000. Thesefees are allocated pro-rata based on the relative average netassets of the Funds.
The Company, on behalf of the Funds, has entered intoan administration agreement (the “AdministrationAgreement”) with BNY Mellon, a subsidiary of The Bank ofNew York Mellon Corporation. Under the AdministrationAgreement, the Company pays BNY Mellon anadministration fee and a fund accounting fee computed dailyand payable monthly at the following annual rates of theaggregate average daily net assets of the Funds, allocatedaccording to each Fund’s net assets:
Up to$1 Billion
Between$1 Billion
and$5 Billion
Between$5 Billion
and$10 Billion
Exceeding$10 Billion
Administration Fees 0.0300% 0.0180% 0.0100% 0.0090%
Accounting Fees 0.0075% 0.0060% 0.0050% 0.0040%
BNY Mellon, serves as the Funds’ custodian pursuant to acustody agreement. BNY Mellon Investment Servicing (US)Inc., a subsidiary of The Bank of New York MellonCorporation, serves as the Funds’ transfer agent.
AMG Distributors, Inc., an affiliate of the InvestmentAdviser, serves as the distributor to the Funds. TheInvestment Adviser pays all distribution-related expenses. Nodistribution fees are paid by the Funds.
At September 30, 2018, two shareholders owned 18.3% ofGlobal Value Fund II – Currency Unhedged’s outstandingshares; three shareholders owned 23.6% of Value Fund’soutstanding shares; and two shareholders owned 24.1% ofWorldwide High Dividend Yield Value Fund’s outstandingshares. Investment activities of these shareholders could havean impact on each respective Fund.
II-23

TWEEDY, BROWNE FUND INC.
Notes to Financial Statements (Unaudited)
4. Securities TransactionsThe 1940 Act defines “affiliated companies” to include securities in which a fund owns 5% or more of the outstanding voting
shares of an issuer. The following chart lists the issuers owned by Global Value Fund that may be deemed “affiliated companies,” aswell as transactions that occurred in the securities of such issuers during the six months ended September 30, 2018:
Shares Heldat 3/31/18 Name of Issuer†
Value at3/31/18
PurchaseCost
SalesProceeds
Value at9/30/18
Shares Heldat 9/30/18
DividendIncome 4/1/18
to 9/30/18
Net Realized Gain4/1/18
to 9/30/18
Change inNet UnrealizedAppreciation
4/1/18to 9/30/18
218,165 Coltene Holding AG* $ 20,777,619 $ — $ — $ 25,014,824 218,165 $ 546,124 $ — $ 4,237,20568,640 Phoenix Mecano AG 47,451,629 — 60,417 45,438,041 68,178 884,696 260,013 (1,953,171)
4,795,392 SOL SpA 64,873,525 — 64,726 57,093,300 4,763,086 846,624 354,964 (7,715,499)$133,102,773 $ — $125,143 $127,546,165 $2,277,444 $614,977 $(5,431,465)
* As of September 30, 2018, Global Value Fund owns less than 5% of the outstanding voting shares.† Issuer countries: Switzerland, Switzerland and Italy, respectively.
None of the other Funds owned 5% or more of the outstanding voting shares of any issuer.The cost of purchases and proceeds from sales of investment securities, excluding short-term investments, for the six
months ended September 30, 2018, are as follows:
Global ValueFund
Global ValueFund II –CurrencyUnhedged Value Fund
WorldwideHigh
DividendYield
Value Fund
Purchases $241,638,042 $58,333,779 $15,701,883 $2,219,000Sales $660,821,849 $1,529,256 $62,051,920 $62,871,510
5. Capital StockThe Company is authorized to issue 2.0 billion shares of $0.0001 par value capital stock, of which 600,000,000, 600,000,000,
400,000,000 and 400,000,000 shares have been designated as shares of Global Value Fund, Global Value Fund II – CurrencyUnhedged, Value Fund and Worldwide High Dividend Yield Value Fund, respectively. Redemptions from the Global Value Fund,Global Value Fund II – Currency Unhedged and Worldwide High Dividend Yield Value Fund, including exchange redemptions,made less than 15 days after purchase are subject to a redemption fee equal to 2% of the redemption proceeds, which is retained byeach Fund. Changes in shares outstanding were as follows:
Six Months EndedSeptember 30, 2018
Year EndedMarch 31, 2018
Global Value Fund Shares Amount Shares Amount
Sold 19,187,983 $555,052,499 55,082,200 $1,544,766,563Reinvested — — 4,530,676 128,898,345Redeemed (39,634,728) (1,142,236,264) (71,025,934) (2,002,085,300)Net Decrease (20,446,745) $(587,183,765) (11,413,058) $(328,420,392)
Global Value Fund II – Currency Unhedged Shares Amount Shares Amount
Sold 5,203,230 $82,427,874 2,906,498 $44,529,205Reinvested — — 234,328 3,662,551Redeemed (1,770,619) (27,844,536) (4,003,414) (60,811,137)Net Increase (Decrease) 3,432,611 $54,583,338 (862,588) $(12,619,381)
Value Fund Shares Amount Shares Amount
Sold 96,029 $2,296,707 1,707,343 $38,952,673Reinvested — — 360,872 8,621,244Redeemed (2,151,160) (51,752,209) (5,537,036) (129,834,079)Net Decrease (2,055,131) $(49,455,502) (3,468,821) $(82,260,162)
Worldwide High Dividend Yield Value Fund Shares Amount Shares Amount
Sold 183,351 $1,909,152 3,091,091 $31,558,861Reinvested 325,347 3,263,228 1,392,221 14,238,829Redeemed (4,081,942) (42,262,601) (9,689,617) (100,369,038)Net Decrease (3,573,244) $(37,090,221) (5,206,305) $(54,571,348)
II-24

TWEEDY, BROWNE FUND INC.
Notes to Financial Statements (Unaudited)
6. Income Tax InformationAs of March 31, 2018, Global Value Fund and Global
Value Fund II – Currency Unhedged had short-term capitalloss carryforward of $134,140,501 and $8,193,522,respectively, which under current federal income tax rulesmay be available to reduce future net realized gains oninvestments in any future period to the extent permitted bythe Code. Utilization of these capital loss carryforwards couldbe subject to limitations imposed by the Code related to shareownership changes.
As of September 30, 2018, the aggregate cost of securitiesin each Fund’s portfolio for federal tax purposes was as follows:
Global Value Fund $6,432,887,769
Global Value Fund II – Currency Unhedged $354,330,104
Value Fund $277,887,349
Worldwide High Dividend Yield Value Fund $172,064,086
The aggregate gross unrealized appreciation/depreciationand net unrealized appreciation as computed on a federalincome tax basis at September 30, 2018 for each Fund is asfollows:
GrossAppreciation
GrossDepreciation
NetAppreciation
Global Value Fund $3,277,111,745 $(446,533,498) $2,830,578,247
Global Value Fund II –Currency Unhedged 103,877,296 (17,398,452) 86,478,844
Value Fund 232,543,280 (9,111,896) 223,431,384
Worldwide High DividendYield Value Fund 65,434,441 (2,456,106) 62,978,335
7. Foreign SecuritiesInvesting in securities of foreign companies and foreign
governments involves economic and political risks andconsiderations not typically associated with investing in U.S.companies and the U.S. Government. These considerationsinclude changes in exchange rates and exchange rate controls(which may include suspension of the ability to transfercurrency from a given country), costs incurred in conversionsbetween currencies, non-negotiable brokerage commissions,less publicly available information, not generally being subjectto uniform standards, practices and requirements with respectto accounting, auditing and financial reporting, lower tradingvolume, delayed settlements and greater market volatility, thedifficulty of enforcing obligations in other countries, lesssecurities regulation, different tax provisions (includingwithholding on dividends paid to a Fund), war, seizure,political and social instability and diplomatic developments.
8. Derivative InstrumentsDuring the six months ended September 30, 2018, Global
Value Fund and Value Fund had derivative exposure to forwardforeign currency exchange contracts. Global Value Fund II –Currency Unhedged and Worldwide High Dividend YieldValue Fund had no exposure to derivatives. For open contractsat September 30, 2018, see the Portfolio of Investments.
The following summarizes the volume of the Global Valueand Value Funds’ forward foreign currency exchange contractactivity during the six months ended September 30, 2018:
Global Value Fund Value Fund
Average Notional Amount $(5,290,571,314) $(179,957,500)
Notional Amount at March 31, 2018 $(5,289,252,641) $(175,204,739)
The following table presents the value of derivatives heldas of September 30, 2018, by their primary underlying riskexposure and respective location on the Statements of Assetsand Liabilities:
Statement of Assets and Liabilities
Derivative Assets Location Global Value Fund Value Fund
Forwardexchange contracts
Unrealizedappreciation offorward exchangecontracts $185,829,459 $7,004,390
Derivative Liabilities Location Global Value Fund Value Fund
Forwardexchange contracts
Unrealizeddepreciation offorward exchangecontracts $6,805,924 $96,581
The following table presents the effect of derivatives onthe Statements of Operations for the six months endedSeptember 30, 2018, by primary risk exposure:
Statement of Operations
Derivative Global Value Fund Value Fund
Forwardexchange contracts
Net realized gain (loss)on forward exchangecontracts $(46,744,976) $(1,554,453)
Derivative Global Value Fund Value Fund
Forwardexchange contracts
Net change inunrealized appreciation(depreciation) of forwardexchange contracts $374,419,294 $13,104,775
For financial reporting purposes, the Funds do not offsetassets and liabilities across derivative types that are subject tomaster netting arrangements on the Statement of Assets andLiabilities.
II-25

TWEEDY, BROWNE FUND INC.
Notes to Financial Statements (Unaudited)
The following table presents derivative assets net ofamounts available for offset under a master netting agreementand any related collateral received by the Fund for forwardcurrency contracts as of September 30, 2018:
CounterpartyDerivative
Assets – Gross(a)
DerivativeAvailablefor Offset
DerivativeAssets – Net(b)
Global Value FundBNY $34,288,143 $1,601,390 $32,686,753JPM 42,442,847 650,729 41,792,118NTC 66,326,323 2,598,903 63,727,420SSB 42,772,146 1,954,902 40,817,244Total $185,829,459 $6,805,924 $179,023,535
Value FundBNY $1,421,300 $70,356 $1,350,944JPM 1,666,844 — 1,666,844NTC 3,292,024 — 3,292,024SSB 624,222 26,225 597,997Total $7,004,390 $96,581 $6,907,809
The following table presents derivative liabilities net ofamounts available for offset under a master netting agreementand any related collateral posted by the Fund for forwardcurrency contracts as of September 30, 2018:
CounterpartyDerivative
Liabilities – Gross(a)
DerivativeAvailablefor Offset
DerivativeLiabilities – Net(c)
Global Value FundBNY $1,601,390 $1,601,390 $ —
JPM 650,729 650,729 —
NTC 2,598,903 2,598,903 —
SSB 1,954,902 1,954,902 —
Total $6,805,924 $6,805,924 $ —
Value FundBNY $70,356 $70,356 $ —
JPM — — —
NTC — — —
SSB 26,225 26,225 —
Total $96,581 $96,581 $ —
(a) As presented in the Statement of Assets and Liabilities.(b) Net amount represents the net receivable due from counterparty in the
event of default(c) Net amount represents the net payable due to counterparty in the event
of default
Counterparty Abbreviations:BNY — The Bank of New York MellonJPM — JPMorgan Chase Bank NA
NTC — Northern Trust CompanySSB — State Street Bank and Trust Company
9. IndemnificationsUnder the Company’s organizational documents, its
directors and officers are indemnified against certain liabilitiesthat may arise out of the performance of their duties to theFunds. Additionally, in the course of business, the Companyenters into contracts that contain a variety of indemnificationclauses. The Funds’ maximum exposure under thesearrangements is unknown, as this would involve future claimsthat may be made against the Funds that have not yetoccurred. However, the Investment Adviser believes the riskof loss under these arrangements to be remote.
10. LitigationCertain holders of notes issued by Tribune Company
initiated litigation against Value Fund and thousands of otherpublic shareholders, seeking to recover payments made toTribune Company shareholders in connection with the 2007leveraged buyout of Tribune Company. A litigation trustarising out of the Tribune Company bankruptcy proceedingalso initiated claims against a substantially similar group ofpublic shareholders, including Value Fund. The claims werepursued in a consolidated multidistrict litigation format.Value Fund tendered its shares in a tender offer from TribuneCompany and received proceeds of approximately$3.4 million (the “Transfers”). The plaintiffs’ claims allegethat the shareholder payments were made in violation ofvarious laws prohibiting constructive and/or actual fraudulenttransfers. The complaints allege no misconduct by ValueFund or any member of the putative defendant class.
The Value Fund entered into a settlement agreementwith the aforementioned plaintiffs, pursuant to which it paidapproximately $1.2 million to settle all claims against itarising from its receipt of the Transfers. The settlement waseffective as of May 3, 2018 and resolved the matter in full.The settlement payment was recorded by the Value Fund as arealized loss on May 3, 2018.
II-26

TWEEDY, BROWNE FUND INC.
Other Information (Unaudited)
1. Investment in the Funds by Managing Directors andEmployees of the Investment Adviser
As of September 30, 2018, the current and retiredmanaging directors and their families, as well as employees ofthe Investment Adviser, have approximately $140.4 million,$6.6 million, $82.2 million and $8.8 million of their ownmoney invested in Global Value Fund, Global ValueFund II – Currency Unhedged, Value Fund and WorldwideHigh Dividend Yield Value Fund, respectively.
2. Portfolio InformationThe Company files each Fund’s complete schedule of
portfolio holdings with the SEC for the first and third quartersof each fiscal year on Form N-Q. The Company’s Form N-Qis available (1) on the SEC’s website at www.sec.gov; (2) forreview and copying at the SEC’s Public Reference Room(“PRR”) in Washington, DC; or (3) by calling the Fund at800-432-4789. Information regarding the operation of thePRR may be obtained by calling 202-551-8090.
3. Proxy Voting InformationThe policies and procedures that the Company uses to
determine how to vote proxies relating to portfolio securitiesheld by the Funds are included in the Company’s Statementof Additional Information, which is available without chargeand upon request by calling the Funds at 800-432-4789 or byvisiting the Funds’ website at www.tweedy.com. Informationregarding how the Funds voted proxies relating to portfoliosecurities during the most recent twelve-month period endedJune 30 is available, without charge, at www.sec.gov.
4. Advisory Agreement
Approval of the Renewal of the Investment AdvisoryAgreement for Each Fund
On May 15, 2018, the Board of Directors (the “Board”) ofTweedy, Browne Fund Inc. (the “Company”), including amajority of the Independent Directors, approved the renewalof the Investment Advisory Agreements (the “AdvisoryAgreements”) between Tweedy, Browne Company LLC(“Tweedy, Browne” or the “Adviser”) and the Company onbehalf of the Tweedy, Browne Global Value Fund (the“Global Value Fund”), the Tweedy, Browne Value Fund (the“Value Fund”), the Tweedy, Browne Worldwide HighDividend Yield Value Fund (the “Worldwide High DividendYield Value Fund”) and the Tweedy, Browne Global ValueFund II – Currency Unhedged (the “Global Value Fund II”)(each a “Fund” and collectively, the “Funds”) for anadditional one-year term. In considering whether to approvethe continuation of the Advisory Agreements, the Boardreviewed materials provided for its evaluation, and theIndependent Directors were advised by independent legalcounsel with respect to these and other relevant matters. Theinformation, material factors and conclusions that formed thebasis for the Board’s approval are described below.
A. Information ReceivedIn considering whether to approve the renewal of the
Advisory Agreements, the Board took into account thewritten materials, oral presentations and other informationreceived throughout the year and carefully reviewed thespecific materials provided in advance of the meeting, whichincluded a Memorandum from independent legal counselregarding the duties and standards of review in connectionwith the consideration of the continuation of the AdvisoryAgreements; a narrative discussion prepared by Tweedy,Browne describing factors relevant to the 2018 contractrenewal process; comparative information regarding theperformance, fees and expense ratios of the Funds;information for several of Tweedy, Browne’s managed accountperformance composites; a sample report illustrating Tweedy,Browne’s extensive research process; fact sheets andperformance histories for each of the Funds since inception;fee schedules; memoranda and related information fromTweedy, Browne concerning Tweedy, Browne’s brokeragepractices and best execution policy; a description of keypersonnel of Tweedy, Browne; a profitability analysis ofTweedy, Browne; a Statement of Financial Condition forTweedy, Browne; the Form ADV of Tweedy, Browne; andcopies of the Advisory Agreements. The Board examined thedetailed materials provided by Tweedy, Browne for itsevaluation, and the Independent Directors were advised byDechert LLP, their independent legal counsel, at the meetingand during periodic executive sessions throughout the year atwhich no representatives of management were present withrespect to these and other relevant matters.
B. Nature, Extent and Quality of the Services ProvidedUnder the Advisory Agreements
Among the factors considered by the Board as part of itsreview, the Board considered the nature, extent and quality ofthe services provided by Tweedy, Browne to the Funds. Inexamining Tweedy, Browne’s management of the Funds’portfolios, the Board reviewed the narrative discussionprovided by Tweedy, Browne, which includes a description ofTweedy, Browne’s fees, performance, research process andinvestment approach.
The Board assessed the variety of services provided byTweedy, Browne to the Funds, including: the experience,reputation and skills of Tweedy, Browne management and staff;the extensive shareholder communications provided byTweedy, Browne; “behind the scenes” services, such as thoseprovided by Tweedy, Browne’s order desk, which seeks bestexecution for transactions effected on behalf of the Funds;monitoring of the Funds’ service providers and the performancein certain instances of shadowing functions; implementing andmonitoring, as appropriate, business continuity planningmatters related to the Funds and their service providers;monitoring of information with respect to corporatereorganizations involving portfolio companies; preparing theFunds’ semi-annual and annual reports to shareholders and the
II-27

TWEEDY, BROWNE FUND INC.
Other Information (Unaudited)
accompanying Adviser’s letters; monitoring of aspects oftransfer agency services on a daily basis; assisting brokers,consultants, financial advisors, intermediaries and third-partyadministrators with questions or problems of an operationalnature; developing and enforcing procedures to monitor tradingactivity in the Funds; monitoring the collection of redemptionfees for the Global Value Fund, the Global Value Fund II andthe High Dividend Yield Value Fund; monitoring 13D-likefiling requirements in 22 foreign jurisdictions; arranging forproxy voting of portfolio securities; qualifying the Funds asapproved purchasers in certain foreign jurisdictions; wherenecessary, consulting with an outside accounting firm withrespect to the proper treatment of corporate actions andaccounting requirements; and actively monitoring and assessingvaluation issues for the Funds. The Board noted the substantialpersonal investment by the members of the Adviser’sInvestment Committee in the Funds, which may encourage analignment of management’s interests with the interests of Fundshareholders. The Board also noted actions that have been orwill be taken in the future by Tweedy, Browne to comply withvarious regulatory requirements, including consulting withoutside accounting and law firms, as needed in this regard.
In addition, the Board noted that Tweedy, Browneprovides a variety of administrative services not otherwiseprovided by the Funds’ third-party service providers,including: preparing Board reports; overseeing the preparationand submission of regulatory filings; overseeing and assistingin the annual audit of the Funds’ financial statements;maintaining the Funds’ website; assisting with the preparationand filing of the Funds’ tax returns; monitoring theregistration of shares of the Funds under applicable federaland state securities laws; assisting in the resolution ofaccounting and legal issues; establishing and monitoring theFunds’ operating budgets; approving, auditing and processingthe payment of the Funds’ bills; assisting the Funds in, andotherwise arranging for, the payment of distributions anddividends; communicating with the Funds’ shareholders withmarket commentary; participating in ongoing training andmonitoring of BNY Mellon’s shareholder servicesrepresentatives; and generally assisting each Fund in theconduct of its business.
The Board discussed with management various issues relatingto Tweedy, Browne’s ability to continue to provide high qualityadvisory and administrative services to the Funds, includingstaffing, long-term planning and contingency planning atTweedy, Browne. In particular, the Board noted that themembers of Tweedy, Browne’s Management Committee (WillBrowne, Tom Shrager, Bob Wyckoff and John Spears) haveworked at Tweedy, Browne for between 27 and 44 years, and thatTweedy, Browne generally maintained a consistent managementapproach that was facilitated by the very low personnel turnoverat the firm. The Board acknowledged that Tweedy, Browne wasnominated and considered for the Morningstar “InternationalManager of the Year” award in 2008 and was namedMorningstar’s “International Manager of the Year” in 2011 for its
management of the Global Value Fund. The Board discussed withmanagement the efforts of Tweedy, Browne to establish andimplement succession plans for management.
In considering Tweedy, Browne’s services in managing theFunds’ portfolios and overseeing all aspects of the Funds’ business,the Board concluded that Tweedy, Browne was providingessential services to the Funds and that Tweedy, Browne likelywill continue to be in a position to do so for the long term.
C. Investment PerformanceThe Board carefully scrutinized each Fund’s performance,
both in absolute terms and relative to the various benchmarksagainst which the Funds were compared. The Board weighedthe performance each Fund achieved in light of each Fund’sinvestment objective, strategies and risks as disclosed toinvestors in the Company’s registration statement.
With respect to the Global Value Fund, the Boardconsidered the Adviser’s analysis that the Fund had exhibitedexcellent absolute and relative performance since itsinception and that the Fund’s annualized rate of return was9.29% (net of all fees and expenses) from its inceptionthrough March 31, 2018, and had exceeded the returns ofrelevant indices in U.S. dollars (both hedged and unhedged).The Board took into account that the Global Value Fund’spolicy was to seek to hedge its perceived non-U.S. currencyexposure, to the extent practicable, back to the U.S. dollar,and thus considered the Fund’s total returns against thereturns of the MSCI EAFE Index (Hedged to U.S. $), notingthat the Fund outperformed that Index as of March 31, 2018,for the year to date, 3-year, 10-year, 15-year, 20-year and sinceinception periods. The Board also noted that the GlobalValue Fund had outperformed its benchmark index in 12 outof the last 18 calendar years. The Board considered Tweedy,Browne’s analysis that, over the long term, the Global ValueFund had enjoyed favorable performance when compared toother funds in its peer group. In addition, the Board notedthat for the past 3-year, 5-year and 10-year periods, theGlobal Value Fund has been categorized as “low risk” byMorningstar’s Risk Ratings, which means it is in the top 10%of funds within its category with respect to lowest measuredrisk, and that the Fund has consistently maintained these lowrisk ratings.
The Board also observed that from 2014 until March 2018the Global Value Fund had maintained a 5 star Morningstarrating and that the Fund currently has a four star rating, upfrom a 2 star rating ten years ago. The Board took intoaccount the fact that the Global Value Fund closed to newinvestors in May 2005 and reopened in January 2008 whenTweedy, Browne believed that the economic landscapeprovided new investment opportunities and would offerattractive discounts from intrinsic value estimates. In 2012,the Global Value Fund won the Street’s “Best Funds 2012”award winner in the category of International Core Stock.
II-28

TWEEDY, BROWNE FUND INC.
Other Information (Unaudited)
The Board reviewed the Value Fund’s performance,observing that the Fund has performed well over the longterm on both an absolute and relative basis since its inceptionthrough March 31, 2018. In particular, the Board consideredthat as of March 31, 2018, the Value Fund’s total returnsoutperformed a combined index of the S&P 500 Index andMSCI World Index (Hedged to U.S. $) over the past 20-yearperiod, although the Board took notice of the Fund’s relativeunderperformance over the 1-year, 3-year, 5-year 10-year andsince inception periods.
The Board took into consideration the Adviser’s analysisthat the Value Fund has exhibited good relative long-termperformance and has held up well in down marketenvironments. The Board noted that the Value Fund iscategorized as a World Stock Fund within the Morningstaruniverse, and it outperformed the Morningstar average of allWorld Stock Funds by 17.54% in calendar year 2008. TheBoard acknowledged that in 2009, the Value Fund returned27.6%, while the World Stock Fund average category returnwas 35.27%, for a net outperformance of the Value Fund overthe two-year period of 9.87%. The Board noted that fromFebruary 28, 2009, through March 31, 2018, the Fundreturned 182.74% versus the 231.40% return of the MSCIWorld Index (Hedged to U.S. $).
The Board also noted that the Value Fund has beencharacterized as “low risk” for the last 3-year, 5-year and10-year periods by Morningstar’s Risk Ratings, which means itis in the top 10% of funds within Morningstar’s World Stockcategory in terms of low risk. The Board observed that theFund has received a 4 star rating from Morningstar and tooknote that the Fund has performed well in down markets. TheBoard further noted that the Fund had closed to new investorsin May 2005 and reopened to new investors in May 2007following a change in the Fund’s investment strategy topermit holding more non-U.S. stocks, which affordedTweedy, Browne greater flexibility in managing the Fund.
The Board noted that the Value Fund was a finalist in theGlobal Equity category for Standard & Poor’s (“S&P”)Mutual Fund Excellence Awards in 2010, which recognizesfunds that have achieved the highest overall ranking on themost consistent basis during the previous year. Among thefactors considered by S&P were: consistently strongperformance; high quality holdings as measured by S&PSTARS (Stock Appreciation Ranking System); S&P CreditRatings; S&P Quality Ranks; and favorable cost factors.Lastly, the Board noted that the Fund’s ability to hold up sowell on a relative basis in 2008 qualified Tweedy, Browne forthe “Manager of the Year” nomination by Morningstar.
The Board reviewed the performance of the HighDividend Yield Value Fund, taking into account that theFund commenced operations on September 5, 2007. TheBoard observed that since the High Dividend Yield ValueFund’s inception date, the Fund has gained 57.50% versus a
gain of 65.45% for the Fund’s Index, the MSCI World Index(in U.S. $). The Board then considered the long termperformance history of Tweedy, Browne’s Global HighDividend Strategy, which has been implemented by Tweedy,Browne since 1979 and on which the High Dividend YieldValue Fund’s investment strategy is based. Since its inceptionon July 1, 1979, through March 31, 2018, the Global HighDividend Strategy has compounded at an annualized rate ofreturn of 11.96% (net of actual and hypothetical fees), whichhas outpaced the S&P 500 Index and the MSCI World Index(in U.S. $) on an annualized basis by 0.26% and 2.33%,respectively. The Board observed that Tweedy, Browne’sGlobal High Dividend Strategy has performed well in downmarket years, noting that in 2008 the Fund was ranked in thetop 12% of all World Stock Funds in the Morningstaruniverse and in 2009 the Fund was up 28.18% compared to29.99% for the Fund’s Index. The Board noted that the Fundhas a Morningstar risk score of “below average” and “low” forthe past 5-year and 10-year periods, respectively andacknowledged the Adviser’s analysis of the Fund’s defensivecharacteristics.
The Board examined the performance of the GlobalValue Fund II, noting that the Fund commenced operationson October 26, 2009. The Board considered that the GlobalValue Fund II has performed well over the long term on bothan absolute and relative basis since its inception throughMarch 31, 2018, gaining 73.04% compared to 60.87% for theMSCI EAFE Index (in U.S. $) for the period. The Board thenreviewed the Fund’s performance and compared it with theperformance of the Global Value Fund, which is managedusing the same philosophy and approach as the Global ValueFund II, and Tweedy, Browne’s unhedged internationalseparate accounts, which provide substantive informationabout the ability and quality of Tweedy, Browne’smanagement team and justification for the management ofanother international fund without a currency hedge. TheBoard noted Tweedy, Browne’s analysis that while short termperformance of the Global Value Fund II may varyconsiderably from that of the Global Value Fund due tocurrency fluctuations, the long-term performance of the Fundsis expected to be similar. The Board considered that acomposite of Tweedy, Browne’s unhedged internationalseparate accounts (the “Unhedged International EquityComposite”), which has returns that are similar to those ofthe Global Value Fund, has outperformed the MSCI EAFEIndex (in U.S. $) for the year to date, 10-year, 15-year,20-year and since inception periods ended March 31, 2018.
In addition, the Board noted that the long-termperformance of the Global Value Fund II should correlate tothe performance of Tweedy, Browne’s unhedged internationalseparate accounts. The Board considered that the UnhedgedInternational Equity Composite has exhibited both goodabsolute and relative performance since inception in July1995. Tweedy, Browne’s Unhedged International EquityComposite’s annualized rate of return of 9.0% (after assumed
II-29

TWEEDY, BROWNE FUND INC.
Other Information (Unaudited)
fees and expenses) through March 31, 2018, significantlyexceeded relevant indices in U.S. dollars. In contrast, theMSCI EAFE Index (in U.S. $) returned 5.3%. The Boardnoted that the unhedged international separate accountsparticipated strongly during positive market periods and thatthe Unhedged International Equity Composite’s relativeresults are significantly better for the down markets thatoccurred in 2000, 2001, 2002, 2008 and 2011. The Boardacknowledged that 2014 was the first year that Tweedy,Browne’s Unhedged International Equity Compositeunderperformed during a down market, and 2015 was the firstyear that the Global Value Fund II underperformed during adown market. Additionally, the Board acknowledged thatMorningstar has given the Fund a 3 star rating.
D. Advisory Fees and Total ExpensesThe Board reviewed the advisory fees and total expenses
of the Funds. In so doing, the Board reviewed several sets ofinformation, including comparative fee and expense data forcomparable funds and the costs associated with Tweedy,Browne’s management of non-fund accounts. The Boardnoted that the Adviser has approximately 355 separate clientrelationships, including partnerships and offshore funds. TheBoard considered that the Adviser generally charges (i)1.50% on the first $25 million, 1.25% on the next$50 million, 1.0% on the next $25 million and 0.75%thereafter annually based on the market value of equity assetsfor domestic separate account portfolios; (ii) 1.50% on thefirst $100 million and 0.75% thereafter annually based on themarket value of equity assets for international and globalseparate account portfolios; and (iii) 1.25% on the first$25 million and 0.75% thereafter for separate accounts inTweedy, Browne’s Global High Dividend Strategy. The Boardalso considered that the Adviser generally gives a 10%discount for eleemosynary accounts invested in any strategy.The Board noted that there is no charge on cash reserves. TheBoard further noted that there is a standard fee rate of 1.25%for offshore funds, including cash reserves. With respect totwo notable account exceptions to the standard fee rates forwhich the Adviser charges a lower fee, the Board noted thatthe two accounts are distinguishable from the Funds by thedifference in the level of services required to manage andadminister the accounts, and that these efficiencies are notavailable in the management of the Funds. In addition tothese efficiencies, the Board further noted that one of thesetwo accounts employs an investment strategy that isdistinguishable and significantly less demanding than thatemployed in the management of other separately managedaccounts and the Funds.
The Board considered that Tweedy, Browne implementeda breakpoint into the fee schedule of the Global Value Fundeffective October 15, 2017, so that the Fund pays Tweedy,Browne a fee of 1.25% on the first $10.3 billion of assetsunder management and 0.75% thereafter, in order to helpmake the Fund more competitive in today’s market
environment. The Board also considered that the GlobalValue Fund II, the Value Fund and the High Dividend YieldValue Fund each pay Tweedy, Browne a fee of 1.25% of assetsunder management and that Tweedy, Browne implemented avoluntary fee waiver/expense reimbursement effectiveDecember 1, 2017, with respect to these Funds to the extentnecessary to keep each Fund’s expense ratio in line with thatof the Global Value Fund in order to make these Funds morecompetitive as they grow their assets. The Board noted thatthis voluntary fee waiver/expense reimbursement will remainin place until at least July 31, 2019, and will continue fromyear to year thereafter at the Adviser’s option, but may not beterminated earlier than July 31, 2019, without the approval ofthe Board.
The Board noted Tweedy, Browne’s analysis that the1.25% fee rate applicable to the Global Value Fund II, theValue Fund, the High Dividend Yield Value Fund and thefirst $10.3 billion in assets of the Global Value Fund is 16.7%less than Tweedy, Browne’s standard fee rate of 1.50% formost domestic, global and international separate accountportfolios, 15.7% higher than the weighted average fee on allof Tweedy, Browne’s global high dividend strategy separateaccounts, and equal to Tweedy, Browne’s standard fee rate of1.25% for the first $25 million of invested equity in mostglobal high dividend strategy separate accounts.
The Board reviewed the narrative discussion provided byTweedy, Browne that examined the Funds’ portfolio turnoverrates and brokerage commission data. The Board consideredthat, as of February 28, 2018, the average World Stock Fundin the Morningstar database had a 51% annual portfolioturnover rate and the average Foreign Stock Fund had a 52%portfolio turnover rate. The Board noted that the GlobalValue Fund’s portfolio turnover rate was 5%, and the ValueFund’s portfolio turnover rate was 6% for the fiscal year endedMarch 31, 2018. The Board also noted that the HighDividend Yield Value Fund’s average annual portfolioturnover rate was 5%, and the Global Value Fund II’s averageannual portfolio turnover rate was 6% for the fiscal yearended March 31, 2018.
Turning its attention to comparative fund feeinformation, the Board noted at the outset that although theFunds pay higher investment advisory fees than certain otherpeer funds, the Funds’ overall expense ratios were competitivewith peer funds and represented a good deal for investors inlight of the Funds’ performance and investor services. TheBoard noted that the Global Value Fund’s total expense ratioof 1.36% as of March 31, 2018, was 20 basis points higherthan the average net expense ratio of the Morningstar ForeignStock Funds category average and 2 basis points lower thanthe Fund’s expense ratio last year.
The Board considered the comparative fee data regardingthe Global Value Fund II and noted that the Fund’s netexpense ratio of 1.36% as of March 31, 2018, is 20 basis points
II-30

TWEEDY, BROWNE FUND INC.
Other Information (Unaudited)
higher than the average net expense ratio of the MorningstarForeign Stock Funds category and 8 basis points higher thanthe average net expense ratio of the Fund’s perceivedcompetitors, based on data from Morningstar.
The Board examined the comparative fee data regardingthe Value Fund and noted that the Value Fund’s net expenseratio of 1.36% as of March 31, 2018, was 14 basis pointshigher than the average expense ratio of the MorningstarWorld Stock Fund category and 5 basis points higher than theaverage net expense ratio for the Fund’s perceivedcompetitors, based on data from Morningstar. The Boardfurther noted that the total expense ratio for the Value Fundis now 22% lower than its inception expense ratio of 1.75%.
The Board considered comparative fee data regarding theHigh Dividend Yield Value Fund and noted that the net totalexpense ratio of the Fund as of March 31, 2018, was 1.36%,which was 14 basis points higher than the average expenseratio of the Morningstar World Stock Funds category and 21basis points higher than the average net expense ratio for theFund’s perceived competitors, based on data fromMorningstar.
E. Adviser Costs, Level of Profits and Economies ofScale
The Board reviewed information regarding Tweedy,Browne’s costs of providing services to the Funds, as well asthe resulting level of profits to Tweedy, Browne. In so doing,the Board reviewed materials relating to Tweedy, Browne’sfinancial condition and reviewed the wide variety of servicesand intensive research performed for the Funds. The Boardfurther noted that most of the Adviser’s employees work onFund-related issues or projects on a regular basis. Pursuant to aService Agreement approved annually by the Board, theFunds reimburse the Adviser for certain compliance,shareholder servicing and fund accounting services performedby three of these employees who are not officers or directors ofthe Company. The Board noted that the amount to bereimbursed, approximately $475,000 in 2018, is approvedannually by the Board.
The Board considered materials regarding the profitabilityof Tweedy, Browne’s relationship with the Funds as a whole,and with each of the Funds separately. The Board examinedthe net profitability of Tweedy, Browne and its profit marginsfor each Fund for the fiscal year ended March 31, 2018. TheBoard noted that as of March 31, 2018, the total assets undermanagement of Tweedy, Browne was approximately$17.3 billion, of which approximately $10.75 billionrepresented the assets of the Funds.
The Board took into account Tweedy, Browne’s researchprocess and, in particular, Tweedy, Browne’s research withregard to non-U.S. securities. The Board considered Tweedy,Browne’s investment discipline for the Global Value Fund,Value Fund and Global Value Fund II with respect to smaller
and medium market capitalization issues and noted that thecost of research per dollar of assets under management forthose Funds is likely higher than it would be for aninvestment adviser that invests in concentrated positions and/or only in larger market capitalization companies.
The Board considered whether economies of scale existthat may be shared with the Funds’ investors, given the Funds’asset levels and expense structures. The Board recognized thateconomies of scale may be shared with the Funds in a numberof ways, including, for example, through lower initial advisoryfees, the imposition of advisory fee breakpoints, fee reductionsor waivers and the continued enhancement of advisory andadministrative services of the Adviser and specifically withrespect to those services provided to the Funds in return forfees paid. The Board acknowledged that Tweedy, Browneimplemented a breakpoint in the advisory fee schedule of theGlobal Value Fund in October 2017 and a voluntary feewaiver/expense reimbursement effective December 1, 2017,with respect to the Global Value Fund II, the Value Fund andthe High Dividend Yield Value Fund. The Trustees notedthat breakpoint schedules can reverse when assets decline,leading to higher fees for fund shareholders when marketsdecline or assets leave a fund complex. Additionally, theBoard recognized Tweedy, Browne’s view that its investmentdiscipline and extensive research process for broadlydiversified groups of companies in approximately 22 differentcountries is likely not as conducive to economies of scale thatwould be potentially realizable in the management of otherlarge pools of capital invested exclusively in large marketcapitalization stocks. With respect to the High DividendYield Value Fund, which generally has a higher proportion oflarge market capitalization holdings in its portfolio (becausesmaller capitalization companies usually do not pay aboveaverage dividends), the Board noted that Tweedy, Brownemust still perform extensive research regarding companiesthat pay above-average dividends and that satisfy a differentlevel of undervaluation than Tweedy, Browne requires for theother Funds. The Board considered that such research wouldtherefore not be less intensive or less expensive than theresearch performed for the other three Funds. The Board alsonoted the continued enhancements made at the Adviser,including the Adviser’s approach to reinvesting in theimportant areas of the business that support the Funds, andthe continued enhancements specifically to the servicesprovided to the Funds. While the Board recognized that nochanges to advisory fees or additional breakpoints were beingproposed at this time, the Board noted that it would continueto evaluate whether the Funds’ asset levels and expensestructures appropriately reflected economies of scale thatcould be shared with Fund investors.
After discussion, the Independent Directors concludedthat Tweedy, Browne’s profitability from its relationship withthe Funds is reasonable, fair and consistent with theanticipated results of an arm’s-length negotiation.
II-31

TWEEDY, BROWNE FUND INC.
Other Information (Unaudited)
F. Ancillary BenefitsFinally, the Board considered a variety of other benefits
received by Tweedy, Browne as a result of its relationship withthe Funds, including any benefits derived by Tweedy, Brownefrom soft dollar arrangements with broker-dealers. Inparticular, the Board considered materials concerningTweedy, Browne’s brokerage allocation policies. The Boardalso reviewed Tweedy, Browne’s policies and proceduresprohibiting the use of brokerage commissions to finance thedistribution of Fund shares.
G. ConclusionAfter taking into consideration a number of matters
relating to Tweedy, Browne’s relationship with the Funds, theIndependent Directors concluded that Tweedy, Browne wasproviding essential services and high quality personnel to theFunds and that Tweedy, Browne likely will continue to be ina position to do so for the long-term; the nature, extent andquality of the services provided by Tweedy, Browne havebenefited and likely will continue to benefit the Funds andtheir shareholders; they were satisfied with each Fund’sperformance and Tweedy, Browne’s performance record inmanaging the Funds warranted the continuation of theAdvisory Agreements; and the advisory fee for each Fund andTweedy, Browne’s profitability from its relationship with eachFund is reasonable. Accordingly, the Independent Directorsunanimously recommended that the Board approve thecontinuation of the Advisory Agreements at the presentcontractual rates.
II-32


TWEEDY, BROWNE FUND INC.One Station Place, Stamford, CT 06902
800-432-4789www.tweedy.com
TB-SA-0918


![· Interim Report and Unaudited Accounts [1] Contents General Information 2 Chairman’s Letter to Shareholders 5 Investment Adviser’s Report 7 Statement of Net Assets 12 Three](https://img.pdfslide.us/doc/110x75/604b7f370098861141399dec/interim-report-and-unaudited-accounts-1-contents-general-information-2-chairmanas.jpg)