Embed Size (px)
Citation preview
FUNDAMENTALS
™
October 2015
United States and Canada Hewes Communications + 1 (212) 207-9450 [email protected]
EuropeJPES Partners (London)+44 (0) 20 7520 [email protected]
Media Contacts
Chris Brightman, CFA
I have the good fortune to live and work in Newport Beach, California. Among the global investment community, Newport Beach may be known as home to PIMCO (and, of course, Research Affiliates). Locally, however, the business of Newport Beach is real estate finance. Many of my local friends have made a bundle in recent years flipping houses in Orange County (the OC). I have also purchased some houses over recent years, but as an investment rather than as a flip. In this article, I explain the difference between investing and speculating by shar-ing my personal experience investing in residential real estate. A Fireside ChatThis story begins four years ago when Dave, a longtime friend and real estate investor from Atlanta, was visiting my wife, Donna, and me in Newport Beach. Sitting by the fire pit in our backyard after dinner one evening, sipping a nightcap, we chatted about business.
Dave explained that the residential real estate crisis had hit Atlanta hard. Countless thousands of homes had been foreclosed and were owned by banks across the sprawling metropolis. The best bargains, he explained, were houses in the older and less wealthy areas of the city. The big private equity firms (BlackRock, Starwood Waypoint, and Colony Capital) were starting to gobble up foreclosures and bid up prices in the easy-to-value suburbs, but
they were ignoring the less homogeneous urban areas, some of which then, as now, may seem unsafe, but many more are solid working-class neighborhoods. Dave was buying vacant single-family homes out of foreclosure in decent neighborhoods for $10,000 to $20,000, investing another $10,000 to $20,000 in renovations, and then renting the renovated properties for $800 a month. His problem was that he couldn’t sell the houses—not for any price. Credit was then, and still is, unavailable to most of the folks who live in Atlanta’s lower income neighborhoods.
Before the housing crisis, banks were fighting each other to lend money, to buy houses at ridiculous prices and on ridiculous terms. As a result, after the crisis, Dave owned many properties across Atlanta, all leveraged to the hilt. Even though he was comfortably solvent and current on all his properties, he couldn’t get another dime out of any lender to buy rental properties.
How do you know, I asked, that these houses are sensible investments? Houses in Detroit are cheap too, I observed. Unlike Detroit, with an aging and shrinking population, Dave explained, Atlanta is a vibrant growing city. How do you know the price is right? Are you kidding, he asked? I am buying houses at a small fraction of replacement and renting them at 25% of my cost. I get my money back in rent in four years!
Investing versus Flipping
KEY POINTS1. High stock prices, just like high
house prices, are harbingers of low returns.
2. Investing in price-depressed resi-dential rental property in Atlanta is like investing in EM equities today—the future expected long-term yield is much superior to their respective high-priced alternatives.
3. Many parallels exist between the political/economic environ-ment and the relative valuation of U.S. and EM equities in the periods from 1994 to 2002 and 2008 to 2015.
4. Our forecast of the 10-year real return for U.S. equities is 1% compared to that of EM equities at 8%, now valued at less than half the U.S. CAPE.
As a long-term investor, we experience
short-term price volatility as opportunity, and high prices as risk.
“ “
October 2015
2Page
FUNDAMENTALS
620 Newport Center Drive, Suite 900 | Newport Beach, CA 92660 | + 1 (949) 325 - 8700 | www.researchaffiliates.com
Over the coming days, Donna and I talked about getting into the residential real estate business. Our alternative investment opportunities in the U.S. capital markets at the time, much like today, were 2% bond yields and 2% dividend yields. Investing in houses seemed an attractive alternative. Thus began our business of investing in houses in Atlanta. We are still buying there today.
Relative Value of HousesLet’s compare the housing market here, where we live in the OC, to Atlanta. The best bargain we can find in the OC is a three-bedroom, two-bath house that sells for $500,000. Yep, for those of you unaccustomed to California real estate
and capital gains taxes. I don’t like this investment. House prices can go down as well as up. The high prices in the OC seem risky to me.
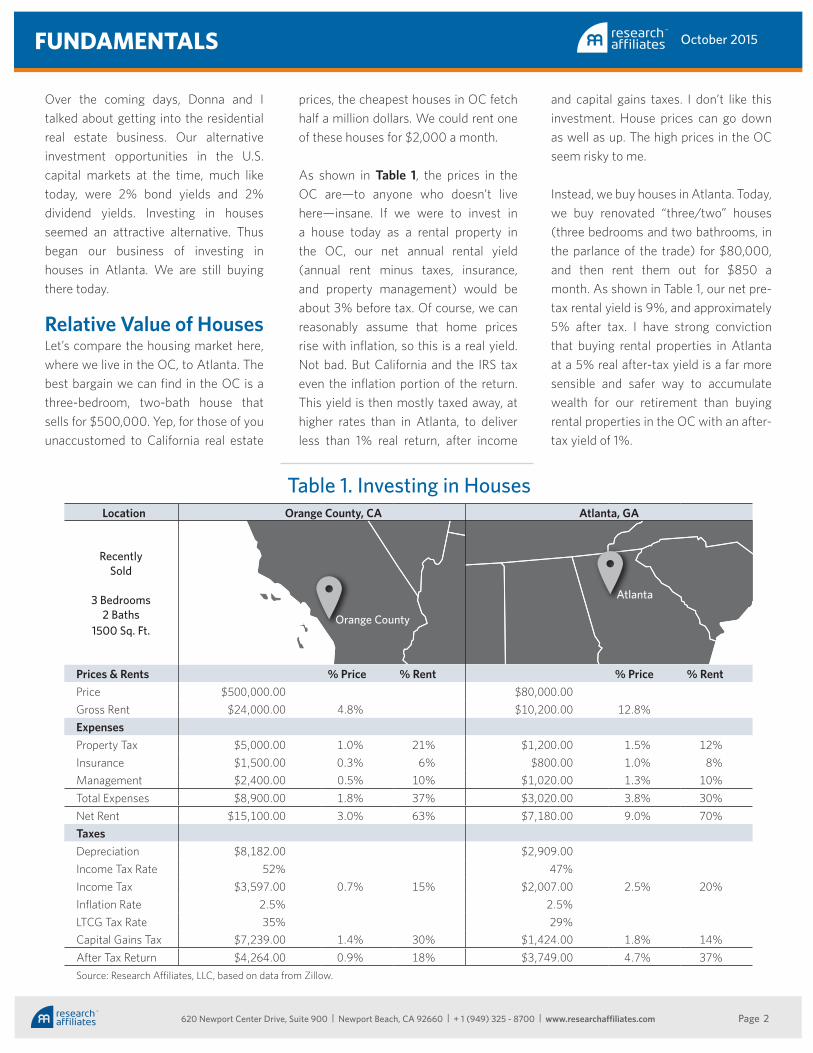
Instead, we buy houses in Atlanta. Today, we buy renovated “three/two” houses (three bedrooms and two bathrooms, in the parlance of the trade) for $80,000, and then rent them out for $850 a month. As shown in Table 1, our net pre-tax rental yield is 9%, and approximately 5% after tax. I have strong conviction that buying rental properties in Atlanta at a 5% real after-tax yield is a far more sensible and safer way to accumulate wealth for our retirement than buying rental properties in the OC with an after-tax yield of 1%.
prices, the cheapest houses in OC fetch half a million dollars. We could rent one of these houses for $2,000 a month.
As shown in Table 1, the prices in the OC are—to anyone who doesn’t live here—insane. If we were to invest in a house today as a rental property in the OC, our net annual rental yield (annual rent minus taxes, insurance, and property management) would be about 3% before tax. Of course, we can reasonably assume that home prices rise with inflation, so this is a real yield. Not bad. But California and the IRS tax even the inflation portion of the return. This yield is then mostly taxed away, at higher rates than in Atlanta, to deliver less than 1% real return, after income
Location Orange County, CA Atlanta, GA
RecentlySold
3 Bedrooms2 Baths
1500 Sq. Ft.
Prices & Rents % Price % Rent % Price % RentPrice $500,000.00 $80,000.00Gross Rent $24,000.00 4.8% $10,200.00 12.8%ExpensesProperty Tax $5,000.00 1.0% 21% $1,200.00 1.5% 12%Insurance $1,500.00 0.3% 6% $800.00 1.0% 8%Management $2,400.00 0.5% 10% $1,020.00 1.3% 10%Total Expenses $8,900.00 1.8% 37% $3,020.00 3.8% 30%Net Rent $15,100.00 3.0% 63% $7,180.00 9.0% 70%TaxesDepreciation $8,182.00 $2,909.00Income Tax Rate 52% 47%Income Tax $3,597.00 0.7% 15% $2,007.00 2.5% 20%Inflation Rate 2.5% 2.5%LTCG Tax Rate 35% 29%Capital Gains Tax $7,239.00 1.4% 30% $1,424.00 1.8% 14%After Tax Return $4,264.00 0.9% 18% $3,749.00 4.7% 37%Source: Research Affiliates, LLC, based on data from Zillow.
Table 1. Investing in Houses
Orange County
Atlanta
Orange County
Atlanta
October 2015
3Page
FUNDAMENTALS
620 Newport Center Drive, Suite 900 | Newport Beach, CA 92660 | + 1 (949) 325 - 8700 | www.researchaffiliates.com
Flip That House?Now, to some of my house-flipper friends in Newport Beach, the OC seems the better bet. The OC is local, prosperous, and safe. House prices have been rising rapidly for many years; they’ve even recovered the full damage wrought from the 2008 global financial crisis. Atlanta, in contrast, seems far away and scary. They have a point; the urban neighborhoods of Atlanta have a very different socioeconomic profile than Newport Beach and must deal with the corresponding issues of a less educated renter base, a less prosperous population, and a higher crime rate. I can confirm that Donna and I don’t feel quite as safe when wandering the streets of the neighborhoods in Atlanta where we search for houses as we do during evening strolls through our quiet neighborhood in Newport Beach. That’s, in part, why a comparable house costs $500,000 in the OC, but only $80,000 in parts of Atlanta.
When my local house-flipper friends ask how I can be sure that house price appreciation in Atlanta will outpace house price appreciation in the OC over
the coming year, I respond that I have no clue about the prospects for short-term price changes. If I had to guess, I would pick the OC as the hotter market. But I am not flipping houses, I explain. I am investing to build long-term wealth.
When my local house-flipper friends ask how I can be sure that, when the next housing crisis comes, house prices in Atlanta will decline less than houses prices in the OC, I say that I expect and hope that they will decline more. For savers like me, price volatility is opportunity not risk. Three years ago, we were buying houses in Atlanta for less than $50,000. I wish we had that opportunity again!
When investing, I ignore the popular game of trying to predict short-term price changes. Instead, I pay attention to valuation, which can be simply observed as the long-term after-tax real yield—less than 1% for houses in the OC and nearly
5% for houses in Atlanta. The high prices/low yields of houses in the OC seem risky to me. Because I am a long-term investor, Atlanta seems the better choice.
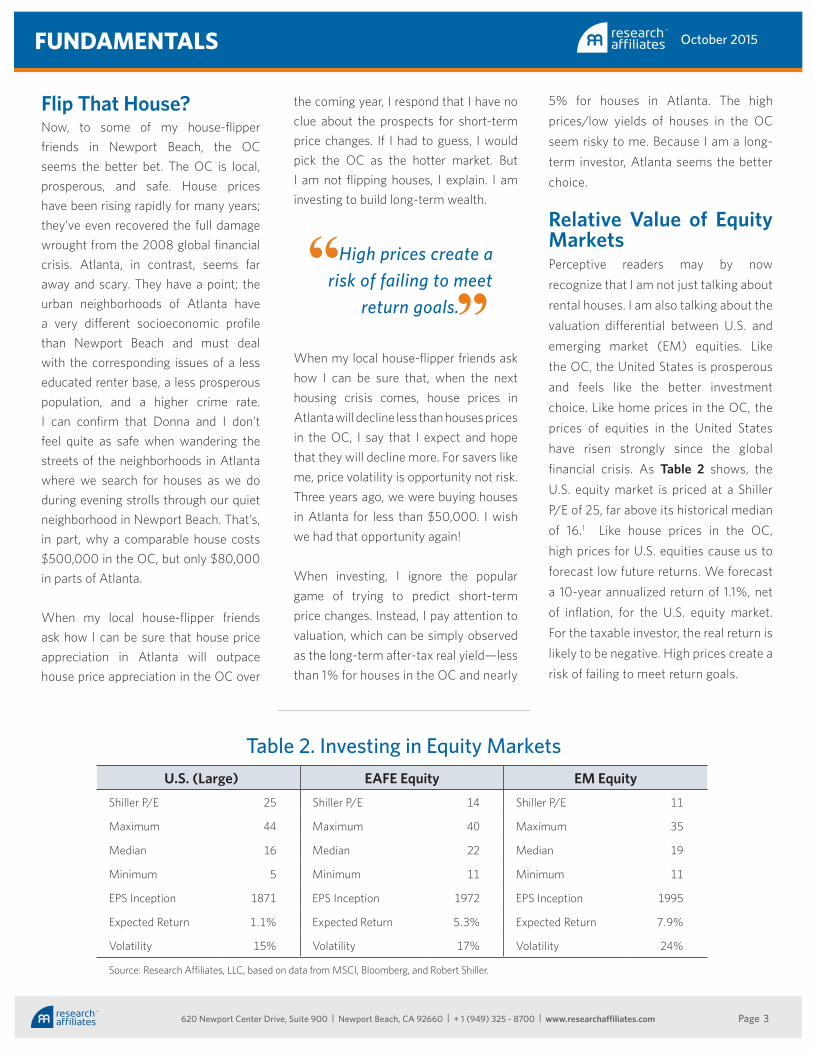
Relative Value of Equity MarketsPerceptive readers may by now recognize that I am not just talking about rental houses. I am also talking about the valuation differential between U.S. and emerging market (EM) equities. Like the OC, the United States is prosperous and feels like the better investment choice. Like home prices in the OC, the prices of equities in the United States have risen strongly since the global financial crisis. As Table 2 shows, the U.S. equity market is priced at a Shiller P/E of 25, far above its historical median of 16.1 Like house prices in the OC, high prices for U.S. equities cause us to forecast low future returns. We forecast a 10-year annualized return of 1.1%, net of inflation, for the U.S. equity market. For the taxable investor, the real return is likely to be negative. High prices create a risk of failing to meet return goals.
High prices create a risk of failing to meet
return goals.
“ “Table 2. Investing in Equity Markets
U.S. (Large) EAFE Equity EM EquityShiller P/E 25 Shiller P/E 14 Shiller P/E 11
Maximum 44 Maximum 40 Maximum 35
Median 16 Median 22 Median 19
Minimum 5 Minimum 11 Minimum 11
EPS Inception 1871 EPS Inception 1972 EPS Inception 1995
Expected Return 1.1% Expected Return 5.3% Expected Return 7.9%
Volatility 15% Volatility 17% Volatility 24%
Source: Research Affiliates, LLC, based on data from MSCI, Bloomberg, and Robert Shiller.
October 2015
4Page
FUNDAMENTALS
620 Newport Center Drive, Suite 900 | Newport Beach, CA 92660 | + 1 (949) 325 - 8700 | www.researchaffiliates.com
Like the neighborhoods in which we buy houses in Atlanta, EM equity markets seem far away and scary. Many of the inhabitants in these geographies are less educated and less prosperous than my neighbors in Newport Beach. Like the houses in Atlanta that Donna and I are buying, prices of EM equities rose to lofty levels in 2008 before the global financial crisis, fueled by overly optimistic buyers extrapolating past price gains. And like home prices in Atlanta during the financial crisis, prices of EM equities have plunged as credit conditions have tightened. Also like house prices in Atlanta compared to those in the OC, prices for EM equities are now far below prices for U.S. equities. As displayed in Table 2, we forecast an annualized 10-year real return for the EM equity index just under 8% a year compared to just over 1% for the United States. This is for a passive index and doesn’t even count the incremental returns that we think “smart beta” strategies are likely to deliver in these markets.
Speculating in EquitiesLike my house-flipper friends, speculators in equities ask how I can be sure that equity prices in emerging markets will rise more than equity prices in the United States over the coming year. I respond that I have no clue about the prospects for short-term price changes. I am not speculating on price changes, I explain. I am investing to build long-term wealth.
Like my house-flipper friends, speculators in equities ask how I can be sure that when the next financial crisis comes, equity prices in emerging markets will decline less than equity prices in the United States. I respond that I expect, and welcome, that they will decline more. I have a long investment time horizon and add to my savings each year. I hope that I can
buy assets more cheaply next year than those I am buying this year. For me, price volatility is opportunity not risk.
When investing, I ignore the popular game of trying to predict short-term price changes. Instead, I pay attention to valuation. On the asset allocation section of our website, we explain our methodology for estimating the 10-year real returns of equity markets, as well as other global asset markets. Today’s high price of the U.S. equity market seems risky to me. Because I am a long-term investor, emerging markets seems a safer investment.
The Return of CapitalThe next issue that speculators raise when I explain this opportunity is the return of capital rather the return on capital. How can I be sure that, in these risky countries, I will not lose all of my investment? Well, I have no certainty when making return forecasts. I could be wrong. Yet, I vividly remember these same questions being asked back in the late 1990s. Whatever problems with corruption and geopolitical uncertainty in EM markets we face today, the environment in the late 1990s seemed much worse.
In July 1997, the Thai baht collapsed, seeming to bring to an end the Asian economic miracle. The currencies and stock markets of emerging Southeast Asia (Thailand, Malaysia, Indonesia, and the Philippines) collapsed along with
the relatively more developed markets of Singapore, Hong Kong, Taiwan, and South Korea. Meanwhile, Russia was waging war in its neighborhood (Chechnya then, rather than Ukraine now). The ruble crisis followed a year later with Russia dramatically devaluing its currency and defaulting on its internal debt. Oil prices collapsed to below $10 a barrel. By 1998, everyone just knew that EM equity was too risky to be a prudent investment and that U.S. tech stocks were on a tear.
“History doesn’t repeat itself, but it often rhymes.” —Mark Twain
The political/economic environment and resulting relative valuation of U.S. and EM equities from the 2008 EM market peak through 2015 rhymes with the span from the 1994 EM market peak through 2002.
From 1990 to 1992, both the U.S. and EM equity indices were valued, as shown in Figure 1, at about the same cyclically adjusted price-to-earnings (CAPE) ratio.
Like in the early 1990s, in late 2006 and early 2007, the U.S. and EM equity indices were again valued at about the same CAPE.
By year-end 1993 and again in 1994, enthusiasm for the Asia-centered growth of EM markets propelled the EM CAPE to above 30, a 30% premium to the U.S. CAPE.
Like in late 1993, in 2008, enthusiasm for the China-centered growth of emerging markets propelled the EM CAPE to above 35, a 25% premium to the U.S. CAPE.
In 1994, problems in emerging markets resulting from Fed tightening (the Tequila crisis) caused EM stock prices to decline back to a CAPE of 20.
In 2013, fear of Fed tightening (the Taper Tantrum) caused EM stock prices to decline to a CAPE of 15.
Like house prices in the OC, high prices for U.S. equities cause us to forecast low future
returns.
“ “

October 2015
5Page
FUNDAMENTALS
620 Newport Center Drive, Suite 900 | Newport Beach, CA 92660 | + 1 (949) 325 - 8700 | www.researchaffiliates.com
From 1995 to 1999, U.S. equity market prices, led by tech stocks, soared while the EM market tanked.
Like in the late 1990s, from 2012 through 2014, U.S. equity market prices soared, again led by tech stocks, while the EM markets tanked.
From the end of 1997 to early 2003, the U.S. market was priced at a CAPE more than double that of the EM market, depicted by shading in Figure 1.
Today, in 2015, the U.S. market is again priced at a CAPE more than double that of the EM market.
I feel like I have seen this movie before. I remember how it ends.
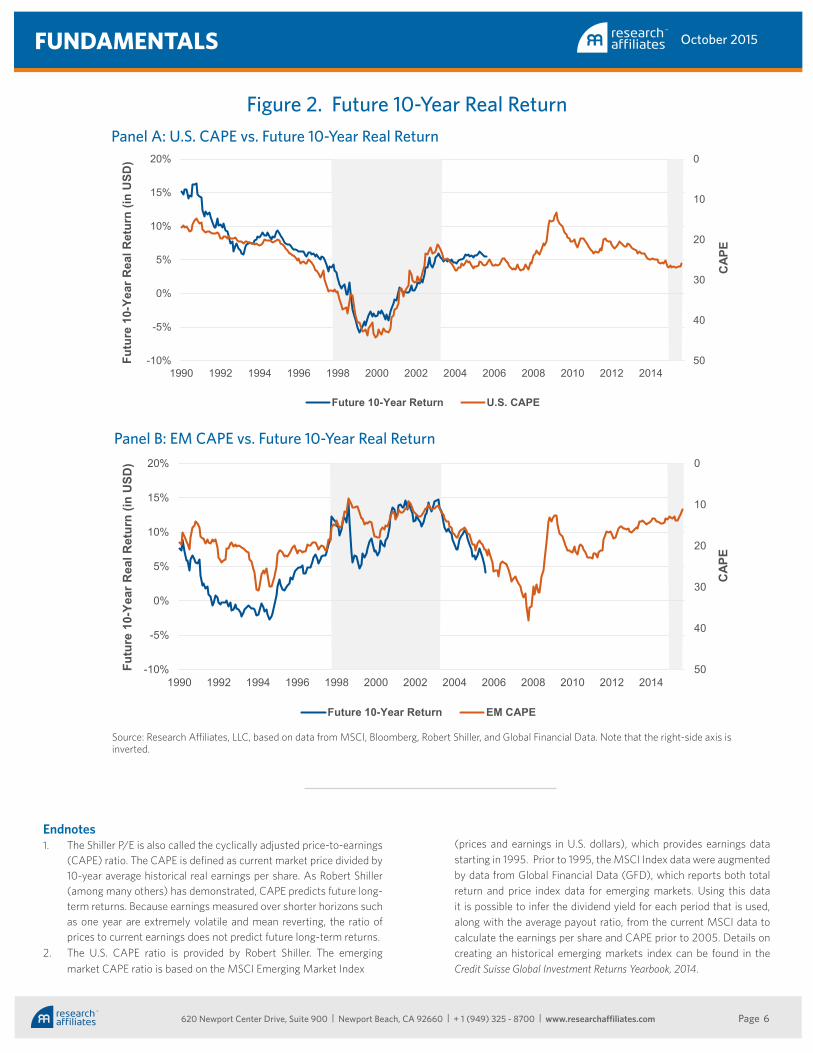
Future 10-year real returns are plotted in Figure 2. The 10-year real return from investing in the U.S. market at the peak prices from October 1997 through April 2003 ranged from 5% to −5% and averaged 0%, as shown in the shaded area of Panel A. The
10-year real return from investing in the EM equity market over this period, priced at less than half of the U.S. CAPE, ranged from 5% to 15% and averaged 11%, as shown in the shaded area of Panel B.
The future 10-year real return lines in Figure 2 end at 2005 because we will not know the 10-year return from investing beginning in 2006 until we reach 2016. And although the future is uncertain, the CAPE does provide some information. What do we expect from investing in equity markets in 2015? Our forecast of the 10-year real return for investing in the U.S. equity market at today’s high prices is 1%. In contrast, our forecast of the 10-year real return for investing in the EM market, at less than half the U.S. CAPE, is 8%.
Volatility Is Opportunity and High Price Is RiskAs a long-term investor, we experience short-term price volatility as opportu-
nity, and high prices as risk. The volatility of house prices leads to opportunity for investing in residential real estate. I am buying cheap houses in Atlanta with long-term expected after-tax returns of 5%. These investments in houses seem safe to me. Comparable houses in the OC are far more expensive. I estimate long-term after-tax returns of only 1% for investing in houses in the OC. I judge these high house prices as creating risk to achieving my return goal for retirement.
The volatility of equity prices leads to opportunity for investing in equity markets. I am invested in cheaply priced EM equity. We estimate an 8% long-term real return from investing in EM equity at today’s low prices. These EM equity market investments seem safe to me. In contrast, equities in the United States are far more expensive. We estimate long-term real returns of only 1% for investing in the U.S. market at today’s high prices. I judge today’s high U.S. equity prices as creating risk to achieving my return goal for retirement saving.
0
5
10
15
20
25
30
35
40
45
50
1990 1992 1994 1996 1998 2000 2002 2004 2006 2008 2010 2012 2014
CAP
E
U.S. CAPE EM CAPE
Figure 1. U.S. and EM CAPE, 1990–2015
Source: Research Affiliates, LLC, based on data from MSCI, Bloomberg, Robert Shiller, and Global Financial Data.2
October 2015
6Page
FUNDAMENTALS
620 Newport Center Drive, Suite 900 | Newport Beach, CA 92660 | + 1 (949) 325 - 8700 | www.researchaffiliates.com
Figure 2. Future 10-Year Real Return
0
10
20
30
40
50-10%
-5%
0%
5%
10%
15%
20%
1990 1992 1994 1996 1998 2000 2002 2004 2006 2008 2010 2012 2014
CAP
E
Futu
re 1
0-Ye
ar R
eal R
etur
n (in
USD
)
Future 10-Year Return U.S. CAPE
Panel A: U.S. CAPE vs. Future 10-Year Real Return
Panel B: EM CAPE vs. Future 10-Year Real Return
Source: Research Affiliates, LLC, based on data from MSCI, Bloomberg, Robert Shiller, and Global Financial Data. Note that the right-side axis is inverted.
0
10
20
30
40
50-10%
-5%
0%
5%
10%
15%
20%
1990 1992 1994 1996 1998 2000 2002 2004 2006 2008 2010 2012 2014
CAP
E
Futu
re 1
0-Ye
ar R
eal R
etur
n (in
USD
)
Future 10-Year Return EM CAPE
Endnotes1. The Shiller P/E is also called the cyclically adjusted price-to-earnings
(CAPE) ratio. The CAPE is defined as current market price divided by 10-year average historical real earnings per share. As Robert Shiller (among many others) has demonstrated, CAPE predicts future long-term returns. Because earnings measured over shorter horizons such as one year are extremely volatile and mean reverting, the ratio of prices to current earnings does not predict future long-term returns.
2. The U.S. CAPE ratio is provided by Robert Shiller. The emerging market CAPE ratio is based on the MSCI Emerging Market Index
(prices and earnings in U.S. dollars), which provides earnings data starting in 1995. Prior to 1995, the MSCI Index data were augmented by data from Global Financial Data (GFD), which reports both total return and price index data for emerging markets. Using this data it is possible to infer the dividend yield for each period that is used, along with the average payout ratio, from the current MSCI data to calculate the earnings per share and CAPE prior to 2005. Details on creating an historical emerging markets index can be found in the Credit Suisse Global Investment Returns Yearbook, 2014.
October 2015
7Page
FUNDAMENTALS
620 Newport Center Drive, Suite 900 | Newport Beach, CA 92660 | + 1 (949) 325 - 8700 | www.researchaffiliates.com
DisclosuresThe material contained in this document is for general information purposes only. It is not intended as an offer or a solicitation for the purchase and/or sale of any security, derivative, commodity, or financial instrument, nor is it advice or a recommendation to enter into any transaction. Research results relate only to a hypothetical model of past performance (i.e., a simulation) and not to an asset management product. No allowance has been made for trading costs or management fees, which would reduce investment performance. Actual results may differ. Index returns represent back-tested performance based on rules used in the creation of the index, are not a guarantee of future performance, and are not indicative of any specific investment. Indexes are not managed investment products and cannot be invested in directly. This material is based on information that is considered to be reliable, but Research Affiliates™ and its related entities (collectively “Research Affiliates”) make this information available on an “as is” basis without a duty to update, make warranties, express or implied, regarding the accuracy of the information contained herein. Research Affiliates is not responsible for any errors or omis-sions or for results obtained from the use of this information. Nothing contained in this material is intended to constitute legal, tax, securities, financial or investment advice, nor an opinion regarding the appropriateness of any investment. The information contained in this material should not be acted upon without obtaining advice from a licensed professional. Research Affiliates, LLC, is an investment adviser registered under the Investment Advisors Act of 1940 with the U.S. Securities and Exchange Commission (SEC). Our registration as an investment adviser does not imply a certain level of skill or training.
Investors should be aware of the risks associated with data sources and quantitative processes used in our investment management process. Errors may exist in data acquired from third party vendors, the construction of model portfolios, and in coding related to the index and portfolio construction process. While Research Affiliates takes steps to identify data and process errors so as to minimize the potential impact of such errors on index and portfolio performance, we cannot guarantee that such errors will not occur.
The trademarks Fundamental Index™, RAFI™, Research Affiliates Equity™, RAE™, and the Research Affiliates™ trademark and corporate name and all related logos are the exclusive intellectual property of Research Affiliates, LLC and in some cases are registered trademarks in the U.S. and other countries. Various features of the Fundamental Index™ methodology, including an accounting data-based non-capitalization data processing system and method for creating and weighting an index of securities, are protected by various patents, and patent-pending intellectual property of Research Affiliates, LLC. (See all applicable US Patents, Patent Publications, Patent Pending intellectual property and protected trademarks located at http://www.researchaffiliates.com/Pages/ legal.aspx#d, which are fully incorporated herein.) Any use of these trademarks, logos, patented or patent pending methodologies without the prior written permission of Research Affiliates, LLC, is expressly prohibited. Research Affiliates, LLC, reserves the right to take any and all necessary action to preserve all of its rights, title, and interest in and to these marks, patents or pending patents.
The views and opinions expressed are those of the author and not necessarily those of Research Affiliates, LLC. The opinions are subject to change without notice.
©2015 Research Affiliates, LLC. All rights reserved.