Embed Size (px)
Citation preview
Princeton Research Market Strategies Newsletter P a g e 1
August 27, 2018 Market Strategies Newsletter
Balanced Investing Strategies To Make Money In Up Or Down Markets
A Publication of Princeton Research, Inc. (www.PrincetonResearch.com) Contributing Staff: Michael King, Charles Moskowitz
Investing Trade Alerts
Charles Moskowitz Discussion
Net Loss For The Week $240
Year To Date Total Returns $8592
Over 85% Returns
Week 34 was quiet for our trading and we had just one execution on a 50% Down Rule in PCAR calls, resulting in a $240 loss and bringing YTD gains back down to $8,592. We added positions in CTL calls and another strike in BOX calls making total funds in use of $1,610. We saw new record highs in all in the major indexes with the lone exception of the DJIA. Even the DJ Transports managed, making the DJIA the non-confirming Dow Theory member, a switch from the pattern of the Transports playing catch up for the last several years. What has been the new pattern is that the broader the index, the better it has performed. Also, the new highs / new lows list has continued to improve on the daily numbers. This is different and even on several of the down days, the ratio mentioned in my Daily Notes has been no worse than 1:1 and many days 4 or 5:1. The A.A.I.I. numbers are nowhere near excessive (page 3) with Bulls gaining 2.2% but just getting back to their long term average and Bears -2% and Neutral the only numbers elevated above
Princeton Research Market Strategies Newsletter P a g e 2
average. It may seem inconclusive, but I consider it an indication that there is no issue of over-exuberance in either direction. Add that to incredible amount of concern about trade, tariffs, and general discontent that we’re bombarded with every night on the news, and we have a solid “wall of worry” to climb. The political and geopolitical issues could not look worse with everyday a new issue relating to our president and his inner circle. At this point every day is a new surprise. And yet, we are at all-time new highs. The vast majority of earnings continue to surprise on the upside and although there have been misses and poor guidance from some, the majority of these have rebounded within a short time frame and some resuming solid uptrends to new highs. The most important feature of this market is that with all of the discussion about how narrow the advance has been, we have morphed into a rotation that the FAANG stocks have not driven (some even falling sharply) and yet we are still moving higher. CAM
Investing Trade Alerts Summary
$10,000 Trading Account Trade Table
DATE TRADE
PRICE COST PROCEEDS RESULTS
08/24 Bought 4 BOX September 29 Calls 0.80 320
08/23 Sold 6 PCAR September 70 Calls 0.40
240 240 Loss
08/22 Bought 8 CTL September 22.50 Calls 0.55 440
08/20 Bought 6 PCAR September 70 Calls 0.80 480
08/16 Bought 4 BOX September 27 Calls 1.15 460
08/14 Bought 1 CVEO November 3rd Call 1.05 105
08/14 Bought 3 CVEO November 3rd Calls 0.95 285
3rd Week expiration when the month is listed without a date The Quantity and Strike Price for each trade is specific. 1=January, 2=February
Remember, these trades are based on your participation in the Subscriber Members TEXTING SERVICE
TO RECEIVE ALL UPDATES.
This is a Sample of the Information Our Where To Invest Now
Market Strategies Newsletter
Princeton Research Market Strategies Newsletter P a g e 3
Members Get
You Don’t Need To Learn Any Trading Skills Or
Do Any Time Consuming Analysis and Tracking
+++ We DO IT ALL FOR YOU! +++
Proven Trading Success
TRADE LIKE THIS:
175% Profits on SPY Puts in 3 Days 57% Profits on JBLU Calls in 8 Days
100% Profits on SPY Puts in 1 Day 163% Profits on SPY Calls in 2 Days 20% Profits on AGQ Calls in 15 Days
89% Profits on SPY Calls in 1 Day 130% Profits on GS Calls in 9 Days
217% Profits on XOM Calls in 9 Days 105% Profits on XOM Calls in 3 Days 117% Profits on GLD Calls in 3 days 62% Profits on XOM Calls in 20 days 50% Profits on PFE Calls in 2 Days 31% Profits TWTR Calls in 2 Days
316% Profits on MOS Calls in 13 Days 87% Profits on AMZN Calls in 2 Days
96% Profits on K Calls in 17 Days 16% Profits on HOG Calls in 8 Days
163% Profits on SJM Calls in 23 Days 102% Profits on AMBA Calls in 7 days 250% Profits on WTW Calls in 1 Day 128% Profits on WTW Calls in 1 Day
148% Profits on NVDA Puts in 2 Days
See all trades in past newsletter issues.
Remember, these trades are based on your participation in the
Subscriber Members TEXTING SERVICE.
New Trades Will Be TEXTED To MEMBERS

Princeton Research Market Strategies Newsletter P a g e 4
For Free Where To Invest Your Money Now
High Return Investments Trade Alerts Go To: PrincetonResearch.com/alerts.htm
SPECIAL RATES Available for VIP MEMBERSHIP Get the lowest full membership rates available.
NOTE: This is a Sample Issue Only! TO GET OUR TRADE ALERTS BY TEXT MESSAGE AND
THE COMPLETE VIP MEMBERS ONLY MARKET STRATEGIES NEWSLETTER ISSUES Visit: PrincetonResearch.com/join.htm
Follow Our Marketed Weathered, Time Tested Trading Rules That
PROTECT YOUR CAPITAL And SECURE PROFITS Now you can profit from investing trade alerts from our traders with over 75 combined years of successful investing experience.
Make Money In Up Or Down Markets -- Our trading alerts balanced investing strategies are designed and proven to make money in up or down markets.
Done For You - All the stock options picking, research and trading analysis is done for
subscribers. This is not a ‘class’ or a ‘training course’… this is us doing ALL the work… from research to sending you a text on what to trade, along with recommended amounts…
SAFETY - We strictly follow our Tested, Market Weathered Trading Rules that are proven
time and time again to protect our (and now your) investment capital from losses while effectively allowing us to Keep The Profits We Make.
So even though we trade options to get the profits you see above -- We can do it with minimal risk and Maximum Profit Potential.
You Don’t Need To Learn Any Trading Skills Or Do Any Time Consuming Analysis and Tracking

Princeton Research Market Strategies Newsletter P a g e 5
+++ We DO IT ALL FOR YOU! +++ We tell you where, when and how much to trade and you get to sit back and enjoy the rewards! The specific buy and sell trading alerts are sent directly to you by e-mail and text message. So you can get in on and cash out on our winning trades fast and at the right time. Get Started with Any Amount - Follow our recommended trading guidelines for a $10,000 portfolio or invest more or invest less -- Whatever you are comfortable with. Your investment is protected because Time Tested Trading Rules PROTECT YOUR CAPITAL And KEEP YOUR PROFITS.
Join Us Today.
Lock in the Lowest Membership Rates Available HERE
The Market Investing Strategies Newsletter Full Members Only Edition
Our Where To Invest Now For Profits In Up or Down Markets Newsletter is more compact, informative, effective and quicker to read then the major, big name publications. AND there are NO ADS to wade through. The Members Edition Newsletter is sent to you by e-mail Monday Mornings and available in the Members Area along with our archive of past issues.
SPECIAL RATES Available for VIP MEMBERSHIP
Get the lowest full membership rates available.
Princeton Research Market Strategies Newsletter P a g e 6
NEW TRADES OPTIONS ACCOUNT:
(1) BUY 12 FLEX SEPTEMBER $14 CALLS @ $ .30 NEW TRADES $100 000 ACCOUNT: (1) BUY 25 FLEX SEPTEMBER $14 CALLS @ $ .30
MARKET LABORATORY – WEEKLY CHANGES
Prices are copied from Barron's Weekly and Yahoo Finance and may be incorrect.
Dow 25,790.35 +121.03
+0.47%
Nasdaq 7945.98 +129.65 +1.66%
S&P 500 2874.69 +24.56
+0.86%
Transportation 11,284.99
+57.19 +0.51%
Russell 2000 1725.67 +32.72 +1.93%
Nasdaq100 7485.40 +107.86 +1.46%
Gold (Aug) 1206.30 +29.80
+2.5%
Silver Sept 14.631
-0.664 -4.3%
Crude Sept
68.72 +2.81 +4.3%
Heating Oil 2.0982 -0.0456 -2.1%
Unleaded Gas 1.884 -0.0443 -1.2%
Natural Gas 2.93
-0.016 -8.4%
VIX 11.99 -0.65
-5.1%
Put/Call Ratios S&P 100
194/100’s +94/100’s
Put/Call Ratios CBOE Equity
58/100’s -7/100’s
Bonds 145-19 +1-02 3.03% -0.06%
10 Yr. Note 120-10 +.244 2.87%-0.08%
Copper Sept
2.8020 +0.0460 +1.7%
CRB Inflation Index
192.08 +3.34
+1.8%
Barron’s* Confidence
80.2 +0.5
S&P100 1272.43 +10.11
+0.80%
5 YR Note 113-224
+0.13 2.75%-0.07%
Dollar 95.17 -0.93
-1.0%
DJ Utilities 731.08 -12.88
-1.73%
AAII Confidence
Index
Average
Bullish 38.4% +2.2%
38.4%
Bearish 27.1% -2.0%
30.30%
Neutral 34.5% -0.2%
30.96%
Money Supply M1
August 13th
3.71%
Money Supply
M2 August 13th
4.21%
Princeton Research Market Strategies Newsletter P a g e 7
* Component Change in the Confidence Index M1...all money in hands of the public, Time Deposits Traveler's Checks, Demand Deposits M2.. adds Savings and Money Market Accounts both compared with the previous year.
Market Strategies Technical Information
SUPPORT RESISTANCE
S&P 500 2815 2970 NASDAQ (QQQ) 178.10 183.50 Trans 109.70 115.70 DOW 25,150 26,340 TLT 120.45 124.10
FINALLY, A PULLBACK
I’ve changed the time frame on this chart to get a better look at where we came from because the current breakout, I believe, is a major change in trend. While there is some formidable resistance between the highs this week ($24.20) and $26.25 from the 8 months of distribution after the merger announcement, we have also spent 14 months under accumulation. Fundamentally, the story is new and greatly improved and the downgrade this week by a firm I’ve never heard of (after only 45 years in the business) made no sense whatsoever. This link https://seekingalpha.com/article/4201832-
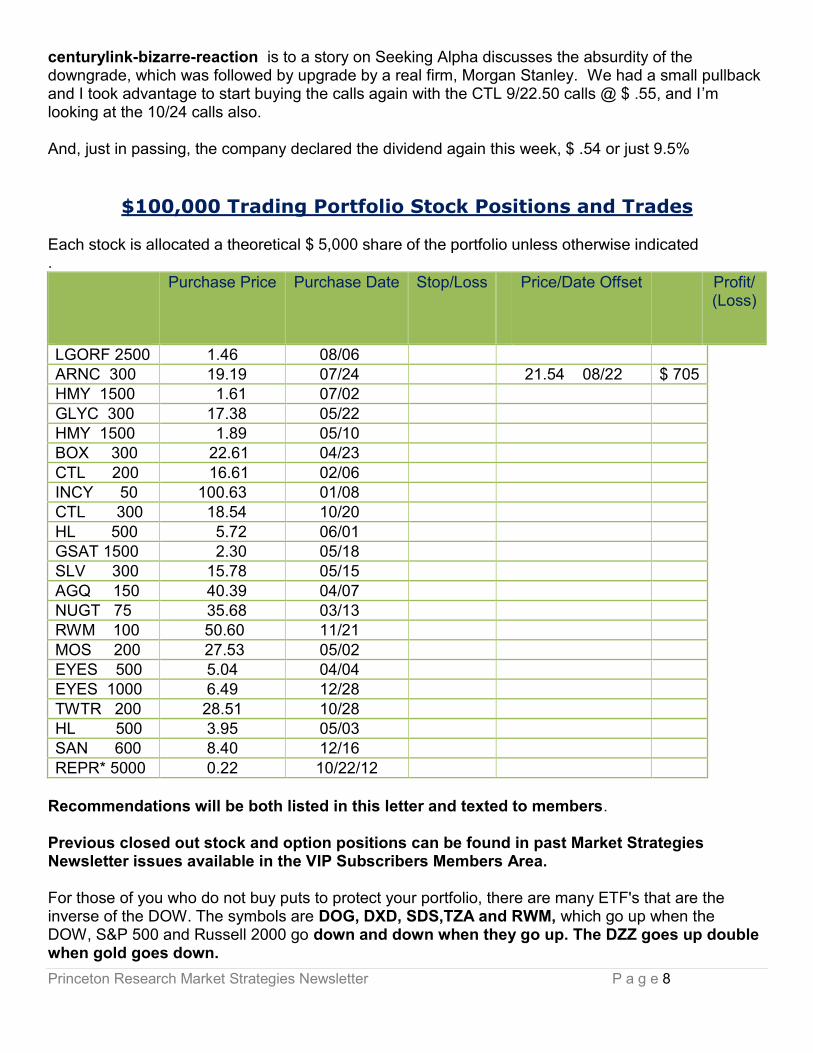
Princeton Research Market Strategies Newsletter P a g e 8
centurylink-bizarre-reaction is to a story on Seeking Alpha discusses the absurdity of the downgrade, which was followed by upgrade by a real firm, Morgan Stanley. We had a small pullback and I took advantage to start buying the calls again with the CTL 9/22.50 calls @ $ .55, and I’m looking at the 10/24 calls also. And, just in passing, the company declared the dividend again this week, $ .54 or just 9.5%
$100,000 Trading Portfolio Stock Positions and Trades Each stock is allocated a theoretical $ 5,000 share of the portfolio unless otherwise indicated .
Purchase Price Purchase Date Stop/Loss Price/Date Offset Profit/ (Loss)
LGORF 2500 1.46 08/06 ARNC 300 19.19 07/24 21.54 08/22 $ 705 HMY 1500 1.61 07/02
GLYC 300 17.38 05/22 HMY 1500 1.89 05/10 BOX 300 22.61 04/23
CTL 200 16.61 02/06 INCY 50 100.63 01/08 CTL 300 18.54 10/20
HL 500 5.72 06/01 GSAT 1500 2.30 05/18 SLV 300 15.78 05/15
AGQ 150 40.39 04/07 NUGT 75 35.68 03/13 RWM 100 50.60 11/21
MOS 200 27.53 05/02 EYES 500 5.04 04/04 EYES 1000 6.49 12/28
TWTR 200 28.51 10/28 HL 500 3.95 05/03 SAN 600 8.40 12/16
REPR* 5000 0.22 10/22/12
Recommendations will be both listed in this letter and texted to members. Previous closed out stock and option positions can be found in past Market Strategies Newsletter issues available in the VIP Subscribers Members Area. For those of you who do not buy puts to protect your portfolio, there are many ETF's that are the inverse of the DOW. The symbols are DOG, DXD, SDS,TZA and RWM, which go up when the DOW, S&P 500 and Russell 2000 go down and down when they go up. The DZZ goes up double when gold goes down.
Princeton Research Market Strategies Newsletter P a g e 9
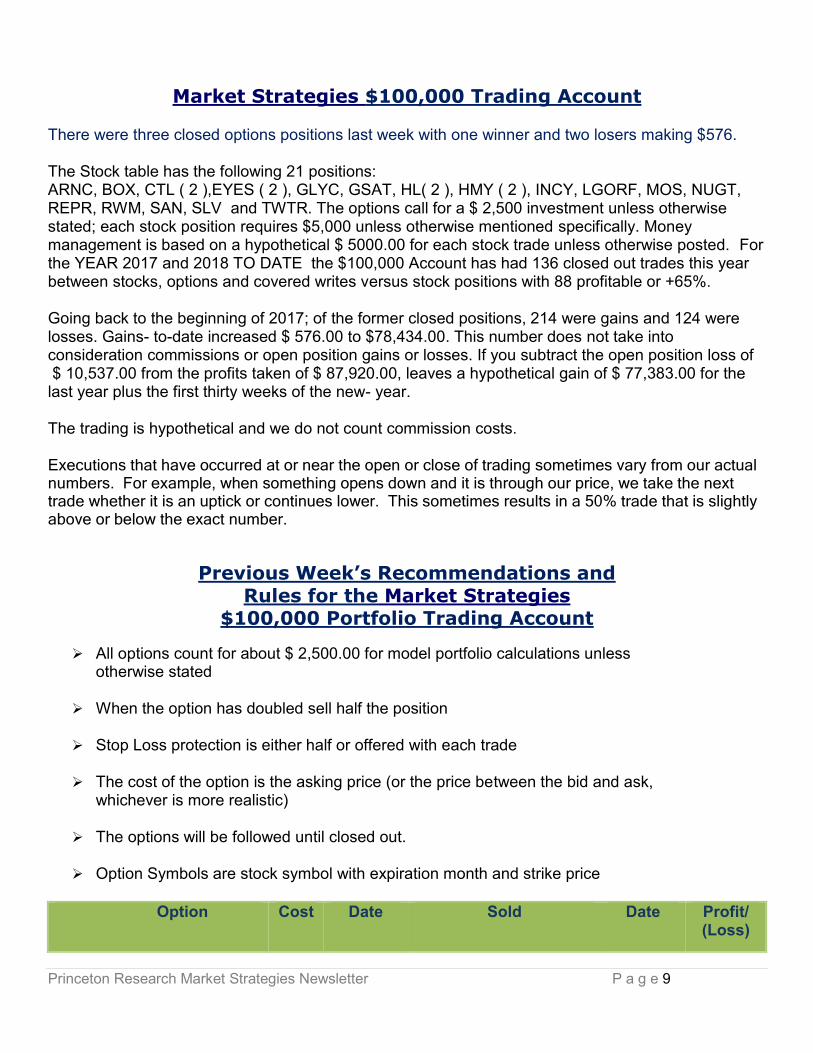
Market Strategies $100,000 Trading Account There were three closed options positions last week with one winner and two losers making $576. The Stock table has the following 21 positions: ARNC, BOX, CTL ( 2 ),EYES ( 2 ), GLYC, GSAT, HL( 2 ), HMY ( 2 ), INCY, LGORF, MOS, NUGT, REPR, RWM, SAN, SLV and TWTR. The options call for a $ 2,500 investment unless otherwise stated; each stock position requires $5,000 unless otherwise mentioned specifically. Money management is based on a hypothetical $ 5000.00 for each stock trade unless otherwise posted. For the YEAR 2017 and 2018 TO DATE the $100,000 Account has had 136 closed out trades this year between stocks, options and covered writes versus stock positions with 88 profitable or +65%. Going back to the beginning of 2017; of the former closed positions, 214 were gains and 124 were losses. Gains- to-date increased $ 576.00 to $78,434.00. This number does not take into consideration commissions or open position gains or losses. If you subtract the open position loss of $ 10,537.00 from the profits taken of $ 87,920.00, leaves a hypothetical gain of $ 77,383.00 for the last year plus the first thirty weeks of the new- year. The trading is hypothetical and we do not count commission costs. Executions that have occurred at or near the open or close of trading sometimes vary from our actual numbers. For example, when something opens down and it is through our price, we take the next trade whether it is an uptick or continues lower. This sometimes results in a 50% trade that is slightly above or below the exact number.
Previous Week’s Recommendations and Rules for the Market Strategies
$100,000 Portfolio Trading Account
All options count for about $ 2,500.00 for model portfolio calculations unless otherwise stated
When the option has doubled sell half the position
Stop Loss protection is either half or offered with each trade
The cost of the option is the asking price (or the price between the bid and ask, whichever is more realistic)
The options will be followed until closed out.
Option Symbols are stock symbol with expiration month and strike price
Option Cost Date Sold Date Profit/ (Loss)
Princeton Research Market Strategies Newsletter P a g e 10
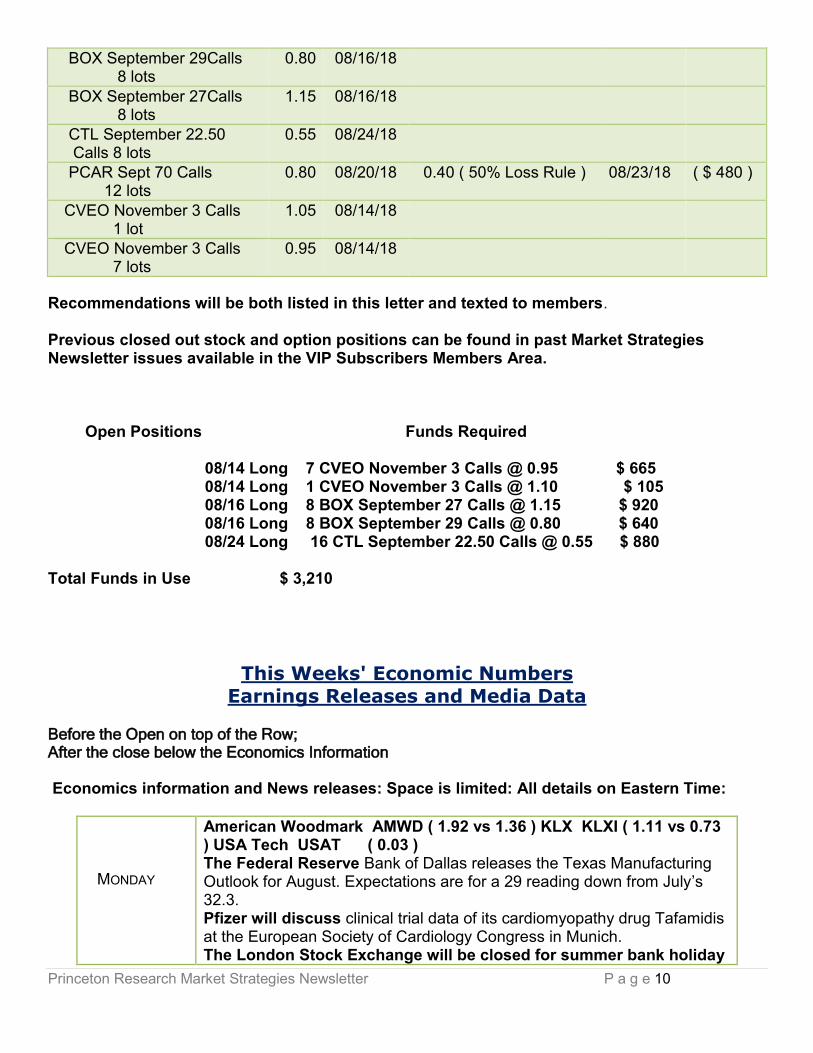
BOX September 29Calls 8 lots
0.80 08/16/18
BOX September 27Calls 8 lots
1.15 08/16/18
CTL September 22.50 Calls 8 lots
0.55 08/24/18
PCAR Sept 70 Calls 12 lots
0.80 08/20/18 0.40 ( 50% Loss Rule ) 08/23/18 ( $ 480 )
CVEO November 3 Calls 1 lot
1.05 08/14/18
CVEO November 3 Calls 7 lots
0.95 08/14/18
Recommendations will be both listed in this letter and texted to members. Previous closed out stock and option positions can be found in past Market Strategies Newsletter issues available in the VIP Subscribers Members Area.
Open Positions Funds Required 08/14 Long 7 CVEO November 3 Calls @ 0.95 $ 665 08/14 Long 1 CVEO November 3 Calls @ 1.10 $ 105 08/16 Long 8 BOX September 27 Calls @ 1.15 $ 920 08/16 Long 8 BOX September 29 Calls @ 0.80 $ 640 08/24 Long 16 CTL September 22.50 Calls @ 0.55 $ 880
Total Funds in Use $ 3,210
This Weeks' Economic Numbers
Earnings Releases and Media Data Before the Open on top of the Row; After the close below the Economics Information Economics information and News releases: Space is limited: All details on Eastern Time:
MONDAY
American Woodmark AMWD ( 1.92 vs 1.36 ) KLX KLXI ( 1.11 vs 0.73 ) USA Tech USAT ( 0.03 ) The Federal Reserve Bank of Dallas releases the Texas Manufacturing Outlook for August. Expectations are for a 29 reading down from July’s 32.3. Pfizer will discuss clinical trial data of its cardiomyopathy drug Tafamidis at the European Society of Cardiology Congress in Munich. The London Stock Exchange will be closed for summer bank holiday
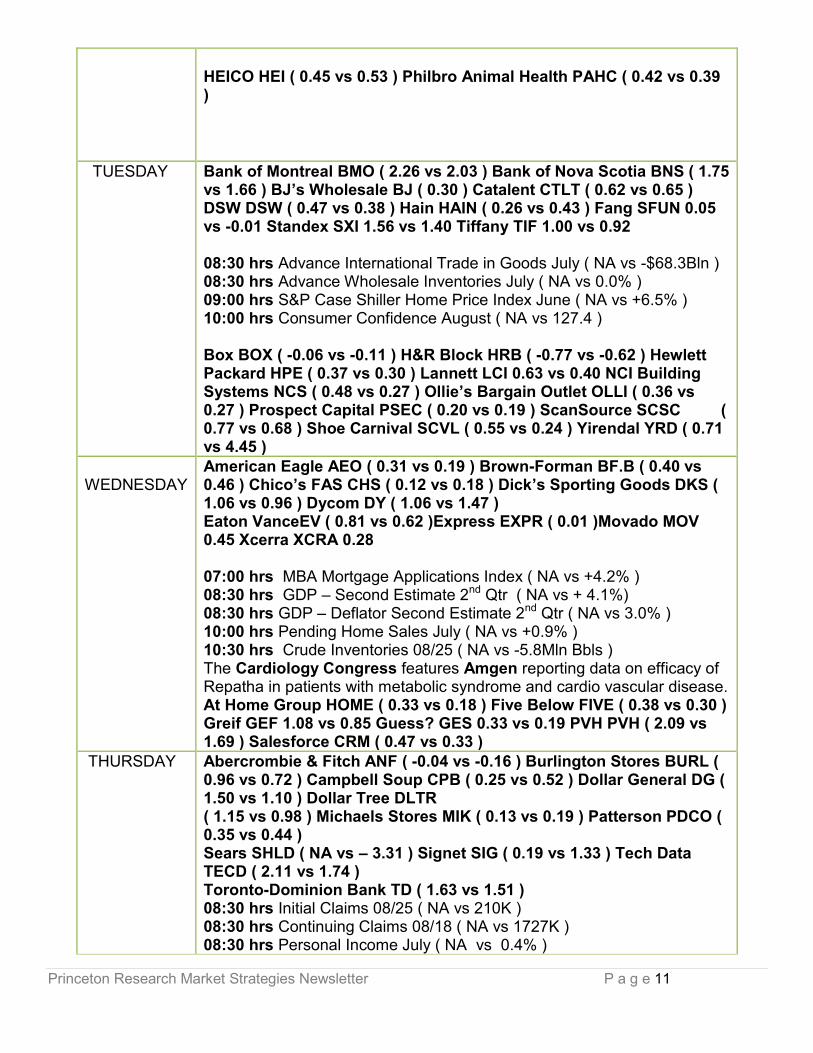
Princeton Research Market Strategies Newsletter P a g e 11
HEICO HEI ( 0.45 vs 0.53 ) Philbro Animal Health PAHC ( 0.42 vs 0.39 )
TUESDAY Bank of Montreal BMO ( 2.26 vs 2.03 ) Bank of Nova Scotia BNS ( 1.75 vs 1.66 ) BJ’s Wholesale BJ ( 0.30 ) Catalent CTLT ( 0.62 vs 0.65 ) DSW DSW ( 0.47 vs 0.38 ) Hain HAIN ( 0.26 vs 0.43 ) Fang SFUN 0.05 vs -0.01 Standex SXI 1.56 vs 1.40 Tiffany TIF 1.00 vs 0.92 08:30 hrs Advance International Trade in Goods July ( NA vs -$68.3Bln ) 08:30 hrs Advance Wholesale Inventories July ( NA vs 0.0% ) 09:00 hrs S&P Case Shiller Home Price Index June ( NA vs +6.5% ) 10:00 hrs Consumer Confidence August ( NA vs 127.4 ) Box BOX ( -0.06 vs -0.11 ) H&R Block HRB ( -0.77 vs -0.62 ) Hewlett Packard HPE ( 0.37 vs 0.30 ) Lannett LCI 0.63 vs 0.40 NCI Building Systems NCS ( 0.48 vs 0.27 ) Ollie’s Bargain Outlet OLLI ( 0.36 vs 0.27 ) Prospect Capital PSEC ( 0.20 vs 0.19 ) ScanSource SCSC ( 0.77 vs 0.68 ) Shoe Carnival SCVL ( 0.55 vs 0.24 ) Yirendal YRD ( 0.71 vs 4.45 )
WEDNESDAY American Eagle AEO ( 0.31 vs 0.19 ) Brown-Forman BF.B ( 0.40 vs 0.46 ) Chico’s FAS CHS ( 0.12 vs 0.18 ) Dick’s Sporting Goods DKS ( 1.06 vs 0.96 ) Dycom DY ( 1.06 vs 1.47 ) Eaton VanceEV ( 0.81 vs 0.62 )Express EXPR ( 0.01 )Movado MOV 0.45 Xcerra XCRA 0.28 07:00 hrs MBA Mortgage Applications Index ( NA vs +4.2% ) 08:30 hrs GDP – Second Estimate 2nd Qtr ( NA vs + 4.1%) 08:30 hrs GDP – Deflator Second Estimate 2nd Qtr ( NA vs 3.0% ) 10:00 hrs Pending Home Sales July ( NA vs +0.9% ) 10:30 hrs Crude Inventories 08/25 ( NA vs -5.8Mln Bbls ) The Cardiology Congress features Amgen reporting data on efficacy of Repatha in patients with metabolic syndrome and cardio vascular disease. At Home Group HOME ( 0.33 vs 0.18 ) Five Below FIVE ( 0.38 vs 0.30 ) Greif GEF 1.08 vs 0.85 Guess? GES 0.33 vs 0.19 PVH PVH ( 2.09 vs 1.69 ) Salesforce CRM ( 0.47 vs 0.33 )
THURSDAY Abercrombie & Fitch ANF ( -0.04 vs -0.16 ) Burlington Stores BURL ( 0.96 vs 0.72 ) Campbell Soup CPB ( 0.25 vs 0.52 ) Dollar General DG ( 1.50 vs 1.10 ) Dollar Tree DLTR ( 1.15 vs 0.98 ) Michaels Stores MIK ( 0.13 vs 0.19 ) Patterson PDCO ( 0.35 vs 0.44 ) Sears SHLD ( NA vs – 3.31 ) Signet SIG ( 0.19 vs 1.33 ) Tech Data TECD ( 2.11 vs 1.74 ) Toronto-Dominion Bank TD ( 1.63 vs 1.51 ) 08:30 hrs Initial Claims 08/25 ( NA vs 210K ) 08:30 hrs Continuing Claims 08/18 ( NA vs 1727K ) 08:30 hrs Personal Income July ( NA vs 0.4% )
Princeton Research Market Strategies Newsletter P a g e 12
08:30 hrs Personal Spending July ( NA vs 0.4% ) 08:30 hrs PCE Prices July ( NA vs 0.1% ) 08:30 hrs PCE Prices – CORE ( NA vs 0.1% ) 10:30 hrs Natural Gas Inventories 08/25 ( NA vs +48bcf ) The Federal Reserve Bank of Kansas hosts its annual Economic Symposium in Jackson Hole, Wyo Autodesk ADSK ( 0.16 vs -0.11 ) Gap GPS ( 0.72 vs 0.58 ) Globant GLOB ( 0.39 vs 0.27 ) HP HPQ ( 0.51 vs 0.43 ) Intuit INTU ( 0.23 vs 0.20 ) Lannett LCI ( 0.66 vs 0.40 ) OSI Systems OSIS ( 0.94 vs 1.02 ) Ross Stores ROST ( 1.00 vs 0.82 ) Splunk SPLK ( 0.05 vs 0.08 ) Veeva Systems VEEV ( 0.34 vs 0.23 ) VMware VMW ( 1.49 vs 1.19 )
FRIDAY Big Lots BIG ( 0.67 vs 0.67 ) MiMedx Group MDXG ( 0.10 vs 0.05 )
09:45 hrs Chicago PMI Aug ( NA vs 65.5 ) 10:00 hrs U of Michigan Consumer Sentiment – Final Aug ( NA vs 95.3 )
Market Strategies Fundamentals Stocks continued their upward course in late August with the S&P making a new contra-seasonal high at 2876 in a most bullish pattern during what had been the normal troubled months of August through October. The S&P gained 0.9% for the week potting it up 7.5% on the year. Bond yields were lower. The 10-yr Note yield index, which made a new Monthly high at 30.16 on August 1st, ended the week lower at 28.26 down another 0.33 to 28.26. The US Dollar Index fell 0.93 or -1% to 95.17, while the CBOE volatility dropped sharply – 1.12 to 11.99 points or -8.6% to below its 50 day moving average and now further below the 200 day moving average, looking more negative at a time when interest rates were likely to rise from near its lower levels for the year. The lower volatility is generally a positive for stocks.
Following this week's gain, with the S&P 500 gaining 0.9% for the week, is up 7.5% on the year; The Dow gained 121.03 points or 0.5% on the week and now up 4.3% on the year. The Russell gained 32.72 points or + 1.9% for the week is up 12.4% for the year. The NASDAQ increase of 129.65 points increased its gains to plus 15.1% for the year, which kept the index well ahead of the other indexes and remaining in first place.
DJ Transportartion Avg ( DJT: 11,284.99 ) +57.19 or +0.51% New all-time highs made at 11,475.40
NSC ( 174.86 +0.43 or +0.3%) continueslevitating near all-time highs. CSX ( 74.65 +0.94 or +1.3%); Landstar System Inc continued surging LSTR (115.70 +$ 0.95 or +0.8%) continued strong, now into a bullish consolidationr having traded to the February highs, above all moving averages. LSTR remains a market leader in one of the most bullish industries.
Princeton Research Market Strategies Newsletter P a g e 13
Index tarted Week nded Week Change Change TD %
DJIA 25669.32 25790.35 121.03 0.5 4.3
Nasdaq 7816.33 7945.98 129.65 1.7 15.1
&P 500 2850.13 2874.69 24.56 0.9 7.5
Russell 2000 1692.95 1725.67 32.72 1.9 12.4
Semiconductors SMH: $ 106.94 +4.51 or +4.4% Rebounded above both the 50 and 200 day moving averages.and now testing the downside 108 gap resistance area. Russell 2000 IWM $ 171.59 +3.92 or +2.3% Continued surging from bullish consolidation to new all-time highs. Alibaba ( BABA: $174.23 ) +1.45 or 0.8% Rebounded following its huge correction after moving to the lowest yearly levels since August last year. Amazon (AMZN: $1905.39 +$28.68 or +1.5%) Still consolidating at new all-time highs, the strongest stock in a bullish stock market. Rallied to new all-time highs at 1921 on August 14th GDX Gold Miners ( ETF $ 18.95 +0.23 or +1.2%) Small rebound following the bearish avalanche of the last 3 weeks. GLD: $114.16 + $ 2.03 or +1.8% Rebound from yearly lows. VXGDX: Gold Miners ETF Volatility Index 25.34 -4.99 or -16%: The Gold volatility declined following a week of consolidation but still held abive the 200 day moving average. THE TECHNICAL PICTURE FOR GOLD –Turning now to the charts for gold and silver, the technical action for both price and volatility turned more neutral.
TYX-X CBOE 30 Yr. (29.75 -0.39 or -1.3%) Treasury Bond Yield Index turned more bearish following its break below the 200 day moving average.
TNX-X CBOE 10 Yr. (28.26 -0.33 or -1.2% for the week) Treasury 10-Yr Yield Index: Treasury yields have reversed from their bullish consolidation pattern to a bearish head and shoulders pattern.
CBOE OEX Volatility Index (VXO: $10.98 -0.65 -5.6%; Volatility collapsed below the 50-day price moving average. Low volatility has been bullish for stocks. The CBOE Market Volatility Index (VIX: $ 11.99 -1.12 or -8.5% Collapsed after failing to regain both the 50 & 200 day moving average
CBOE NASDAQ Volatility Index (VXN-X: $15.16 - $1.43 or -8.6%% NASDAQ volatility collapsed unable to hold the rallies of the previous month, which is constructive for stocks.
Nasdaq Banking Index (Bank-X: 4277.26) +29.35 or +0.7%: Holding well above both the 50 and 200day price moving averages.
Crude Oil ($ 68.72 +$ 2.81) +4.3%: I was surprised with the degree of the selloff in the oil and said I’d like to see some sideways action before committing to the long side again. We rallied hard on both Wednesday and Friday, but in the grand scheme of things we are still pretty much confined by the supply around $70 and the support at $65. This market feels a bit overbought to
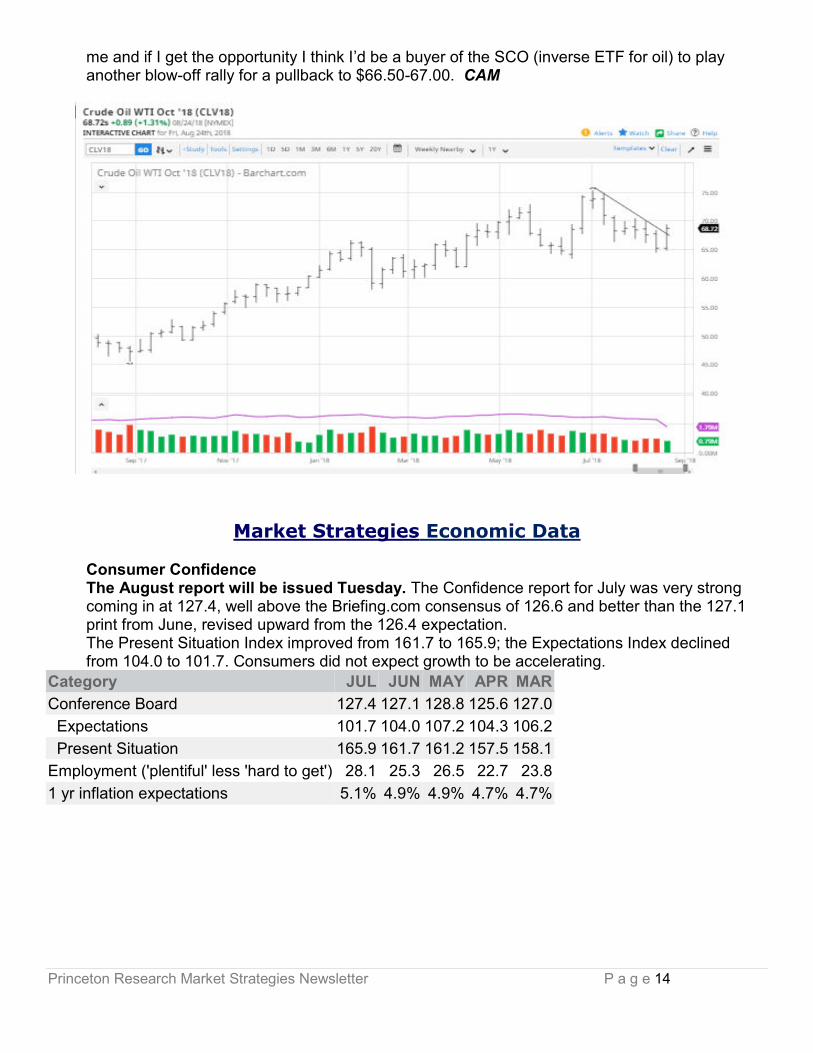
Princeton Research Market Strategies Newsletter P a g e 14
me and if I get the opportunity I think I’d be a buyer of the SCO (inverse ETF for oil) to play another blow-off rally for a pullback to $66.50-67.00. CAM
Market Strategies Economic Data
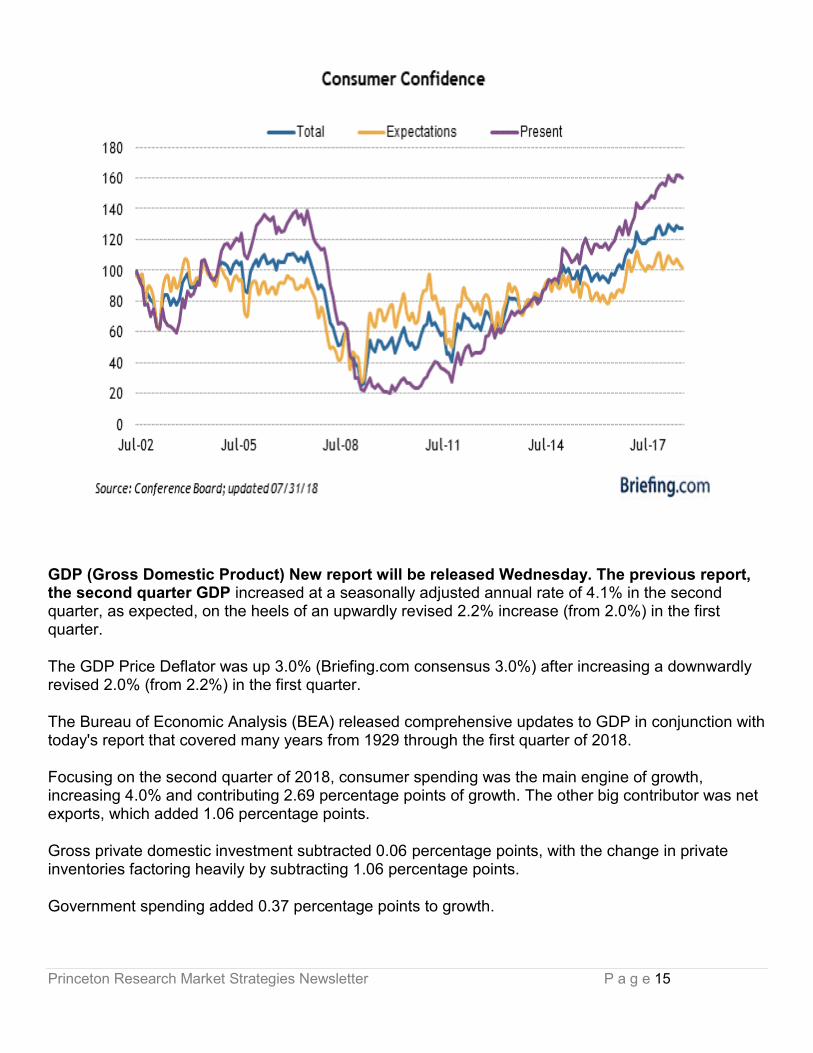
Consumer Confidence The August report will be issued Tuesday. The Confidence report for July was very strong coming in at 127.4, well above the Briefing.com consensus of 126.6 and better than the 127.1 print from June, revised upward from the 126.4 expectation. The Present Situation Index improved from 161.7 to 165.9; the Expectations Index declined from 104.0 to 101.7. Consumers did not expect growth to be accelerating.
Category JUL JUN MAY APR MAR
Conference Board 127.4 127.1 128.8 125.6 127.0
Expectations 101.7 104.0 107.2 104.3 106.2
Present Situation 165.9 161.7 161.2 157.5 158.1
Employment ('plentiful' less 'hard to get') 28.1 25.3 26.5 22.7 23.8
1 yr inflation expectations 5.1% 4.9% 4.9% 4.7% 4.7%
Princeton Research Market Strategies Newsletter P a g e 15
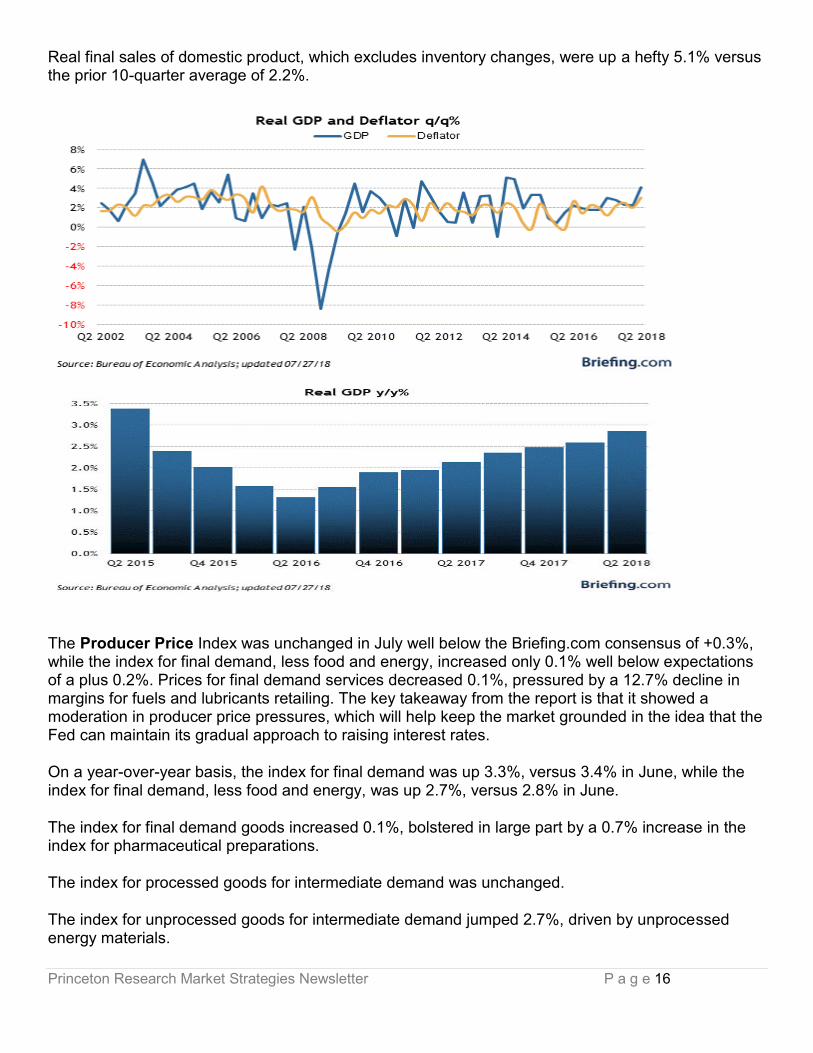
GDP (Gross Domestic Product) New report will be released Wednesday. The previous report, the second quarter GDP increased at a seasonally adjusted annual rate of 4.1% in the second quarter, as expected, on the heels of an upwardly revised 2.2% increase (from 2.0%) in the first quarter.
The GDP Price Deflator was up 3.0% (Briefing.com consensus 3.0%) after increasing a downwardly revised 2.0% (from 2.2%) in the first quarter.
The Bureau of Economic Analysis (BEA) released comprehensive updates to GDP in conjunction with today's report that covered many years from 1929 through the first quarter of 2018.
Focusing on the second quarter of 2018, consumer spending was the main engine of growth, increasing 4.0% and contributing 2.69 percentage points of growth. The other big contributor was net exports, which added 1.06 percentage points.
Gross private domestic investment subtracted 0.06 percentage points, with the change in private inventories factoring heavily by subtracting 1.06 percentage points.
Government spending added 0.37 percentage points to growth.
Princeton Research Market Strategies Newsletter P a g e 16
Real final sales of domestic product, which excludes inventory changes, were up a hefty 5.1% versus the prior 10-quarter average of 2.2%.
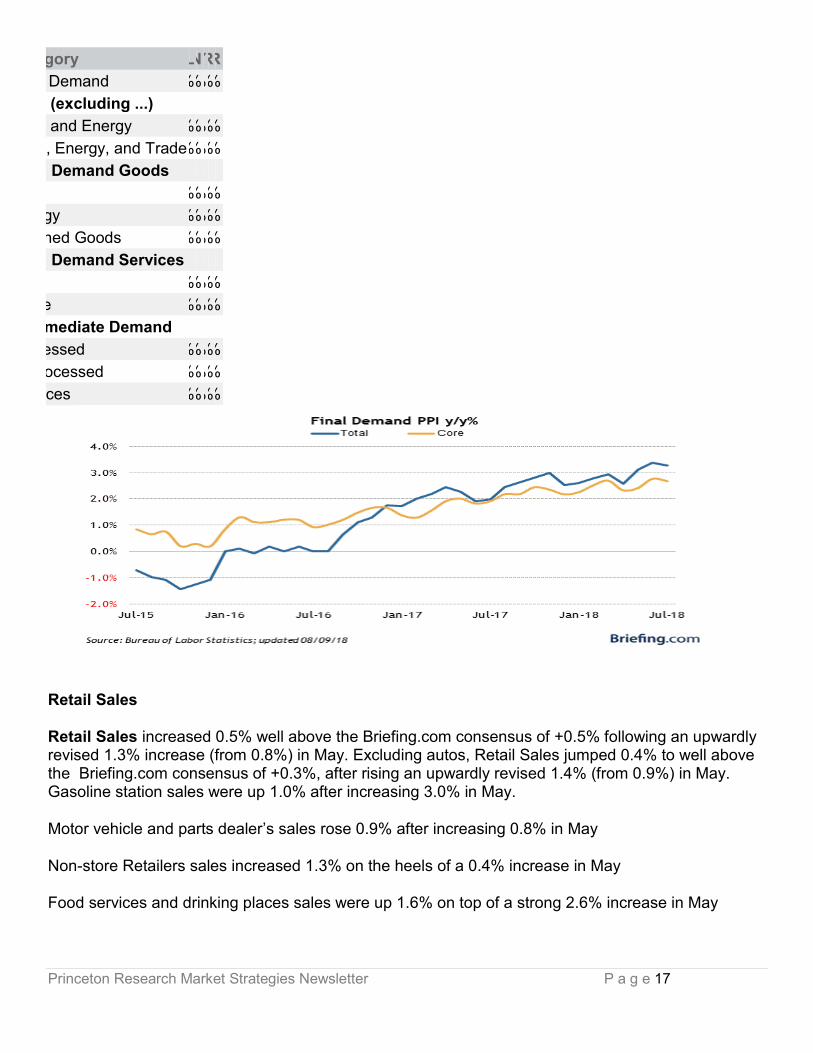
The Producer Price Index was unchanged in July well below the Briefing.com consensus of +0.3%, while the index for final demand, less food and energy, increased only 0.1% well below expectations of a plus 0.2%. Prices for final demand services decreased 0.1%, pressured by a 12.7% decline in margins for fuels and lubricants retailing. The key takeaway from the report is that it showed a moderation in producer price pressures, which will help keep the market grounded in the idea that the Fed can maintain its gradual approach to raising interest rates.
On a year-over-year basis, the index for final demand was up 3.3%, versus 3.4% in June, while the index for final demand, less food and energy, was up 2.7%, versus 2.8% in June.
The index for final demand goods increased 0.1%, bolstered in large part by a 0.7% increase in the index for pharmaceutical preparations.
The index for processed goods for intermediate demand was unchanged.
The index for unprocessed goods for intermediate demand jumped 2.7%, driven by unprocessed energy materials.
Princeton Research Market Strategies Newsletter P a g e 17
Category JUL JUN AY APR MAR
Final Demand 0.0% 0.3% .5% 0.1% 0.3%
Core (excluding ...)
Food and Energy 0.1% 0.3% .3% 0.2% 0.3%
Food, Energy, and Trade 0.3% 0.3% .1% 0.1% 0.4%
Final Demand Goods
otal 0.1% 0.1% .0% 0.0% 0.3%
nergy 0.5% 0.8% .6% 0.1% 2.1%
Finished Goods 0.2% 0.0% .0% 0.1% 0.2%
Final Demand Services
otal 0.1% 0.4% .3% 0.1% 0.3%
rade 0.8% 0.7% .9% 0.2% 0.2%
Intermediate Demand
rocessed 0.0% 0.7% .5% 0.5% 0.3%
Unprocessed 2.7% 1.0% .5% 0.9% 4.8%
ervices 0.2% 0.1% .3% 0.3% 0.3%
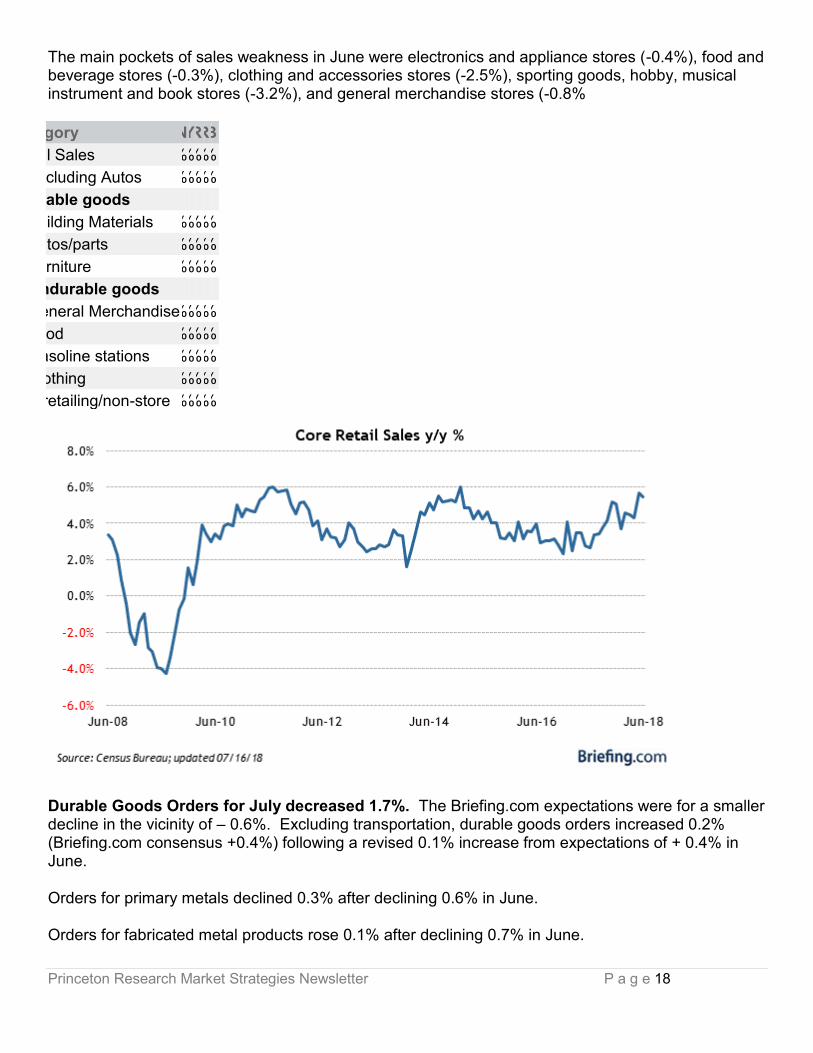
Retail Sales
Retail Sales increased 0.5% well above the Briefing.com consensus of +0.5% following an upwardly revised 1.3% increase (from 0.8%) in May. Excluding autos, Retail Sales jumped 0.4% to well above the Briefing.com consensus of +0.3%, after rising an upwardly revised 1.4% (from 0.9%) in May. Gasoline station sales were up 1.0% after increasing 3.0% in May.
Motor vehicle and parts dealer’s sales rose 0.9% after increasing 0.8% in May
Non-store Retailers sales increased 1.3% on the heels of a 0.4% increase in May
Food services and drinking places sales were up 1.6% on top of a strong 2.6% increase in May
Princeton Research Market Strategies Newsletter P a g e 18
The main pockets of sales weakness in June were electronics and appliance stores (-0.4%), food and beverage stores (-0.3%), clothing and accessories stores (-2.5%), sporting goods, hobby, musical instrument and book stores (-3.2%), and general merchandise stores (-0.8%
Category JUN MAY APR MAR FEB
Retail Sales 0.5% 1.3% 0.3% 0.7% 0.1%
Excluding Autos 0.4% 1.4% 0.4% 0.4% 0.4%
Durable goods
Building Materials 0.8% 2.5% 0.6% 1.2% 1.4%
Autos/parts 0.9% 0.8% 0.2% 1.9% 1.1%
Furniture 0.6% 1.4% 2.7% 0.7% 0.2%
Nondurable goods
General Merchandise 0.8% 1.2% 0.5% 0.4% 0.1%
Food 0.3% 0.2% 0.4% 0.4% 0.2%
Gasoline stations 1.0% 3.0% 0.4% 0.0% 0.2%
Clothing 2.5% 2.9% 1.5% 0.1% 0.5%
e*retailing/non-store 1.3% 0.4% 1.2% 0.9% 1.1%
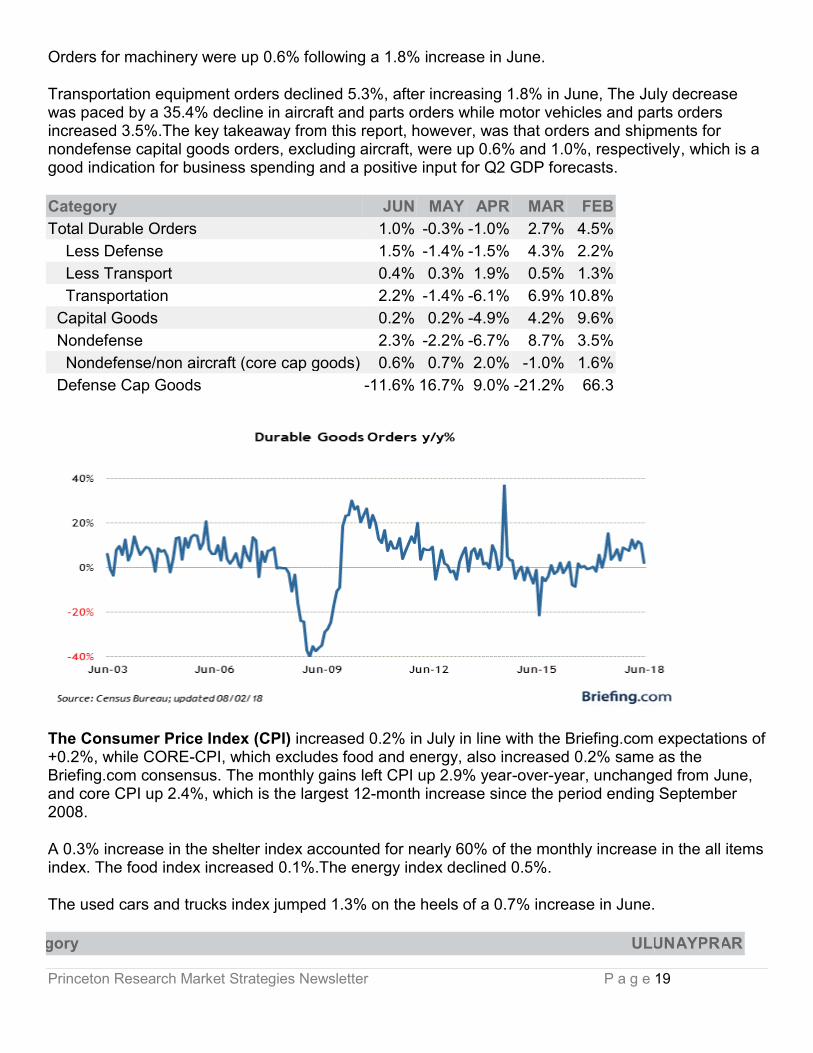
Durable Goods Orders for July decreased 1.7%. The Briefing.com expectations were for a smaller decline in the vicinity of – 0.6%. Excluding transportation, durable goods orders increased 0.2% (Briefing.com consensus +0.4%) following a revised 0.1% increase from expectations of + 0.4% in June.
Orders for primary metals declined 0.3% after declining 0.6% in June.
Orders for fabricated metal products rose 0.1% after declining 0.7% in June.
Princeton Research Market Strategies Newsletter P a g e 19
Orders for machinery were up 0.6% following a 1.8% increase in June.
Transportation equipment orders declined 5.3%, after increasing 1.8% in June, The July decrease was paced by a 35.4% decline in aircraft and parts orders while motor vehicles and parts orders increased 3.5%.The key takeaway from this report, however, was that orders and shipments for nondefense capital goods orders, excluding aircraft, were up 0.6% and 1.0%, respectively, which is a good indication for business spending and a positive input for Q2 GDP forecasts.
Category JUN MAY APR MAR FEB
Total Durable Orders 1.0% -0.3% -1.0% 2.7% 4.5%
Less Defense 1.5% -1.4% -1.5% 4.3% 2.2%
Less Transport 0.4% 0.3% 1.9% 0.5% 1.3%
Transportation 2.2% -1.4% -6.1% 6.9% 10.8%
Capital Goods 0.2% 0.2% -4.9% 4.2% 9.6%
Nondefense 2.3% -2.2% -6.7% 8.7% 3.5%
Nondefense/non aircraft (core cap goods) 0.6% 0.7% 2.0% -1.0% 1.6%
Defense Cap Goods -11.6% 16.7% 9.0% -21.2% 66.3
The Consumer Price Index (CPI) increased 0.2% in July in line with the Briefing.com expectations of +0.2%, while CORE-CPI, which excludes food and energy, also increased 0.2% same as the Briefing.com consensus. The monthly gains left CPI up 2.9% year-over-year, unchanged from June, and core CPI up 2.4%, which is the largest 12-month increase since the period ending September 2008.
A 0.3% increase in the shelter index accounted for nearly 60% of the monthly increase in the all items index. The food index increased 0.1%.The energy index declined 0.5%.
The used cars and trucks index jumped 1.3% on the heels of a 0.7% increase in June.
Category JUL JUN MAY APR MAR
Princeton Research Market Strategies Newsletter P a g e 20
ll Items 0.2% 0.1% 0.2% 0.2% -0.1%
Food and Beverages 0.1% 0.2% 0.0% 0.3% 0.1%
Housing 0.2% 0.0% 0.2% 0.3% 0.3%
Equivalent Rent 0.3% 0.3% 0.2% 0.3% 0.3%
Apparel -0.3% -0.9% 0.0% 0.3% -0.6%
Transportation 0.3% 0.4% 0.4% 0.2% -1.2%
Vehicles 0.7% 0.6% -0.1% -0.9% -0.1%
Motor Fuel -0.6% 0.5% 1.7% 3.0% -4.9%
Medical Care -0.2% 0.4% 0.2% 0.1% 0.4%
Education and Communication 0.2% 0.2% 0.4% 0.0% -0.2%
pecial Indices
Core 0.2% 0.2% 0.2% 0.1% 0.2%
Energy -0.5% -0.3% 0.9% 1.4% -2.8%
Services 0.3% 0.1% 0.2% 0.1% 0.2%
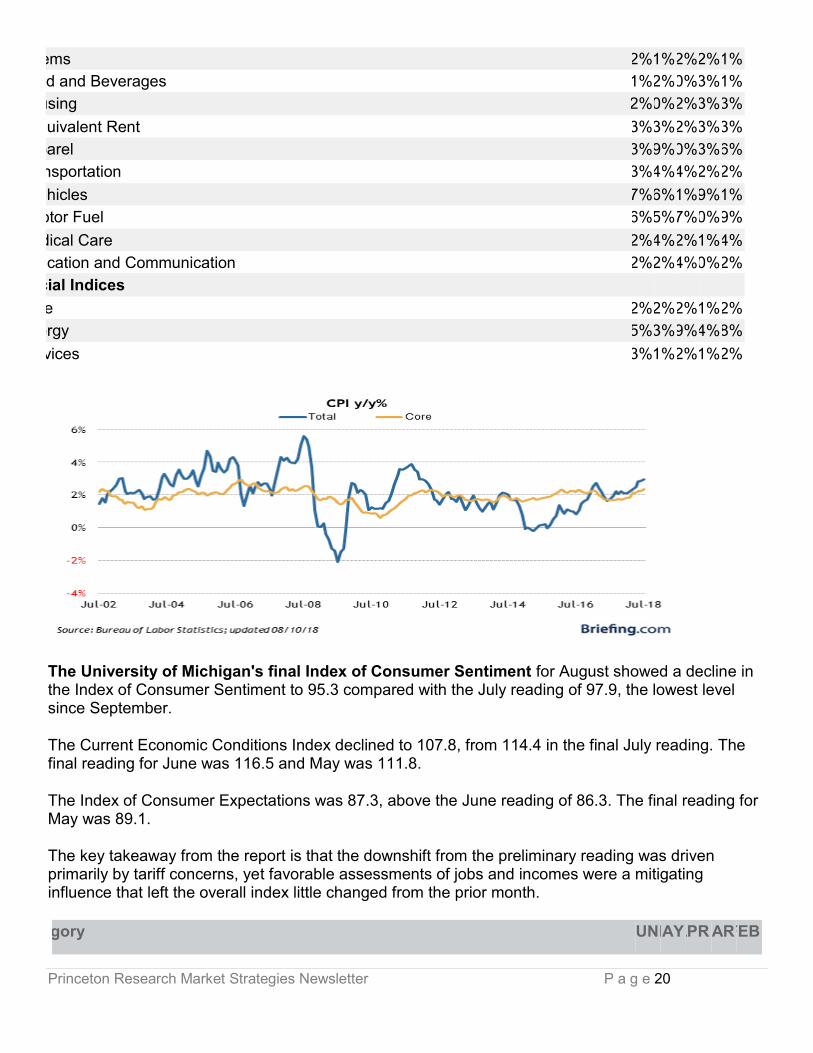
The University of Michigan's final Index of Consumer Sentiment for August showed a decline in the Index of Consumer Sentiment to 95.3 compared with the July reading of 97.9, the lowest level since September.
The Current Economic Conditions Index declined to 107.8, from 114.4 in the final July reading. The final reading for June was 116.5 and May was 111.8.
The Index of Consumer Expectations was 87.3, above the June reading of 86.3. The final reading for May was 89.1.
The key takeaway from the report is that the downshift from the preliminary reading was driven primarily by tariff concerns, yet favorable assessments of jobs and incomes were a mitigating influence that left the overall index little changed from the prior month.
Category JUN MAY APR MAR FEB
Princeton Research Market Strategies Newsletter P a g e 21
entiment 98.2 98.0 98.8 101.4 99.7
Outlook 86.3 89.1 88.4 88.8 90.0
Present conditions 116.5 111.8 114.9 121.2 114.9
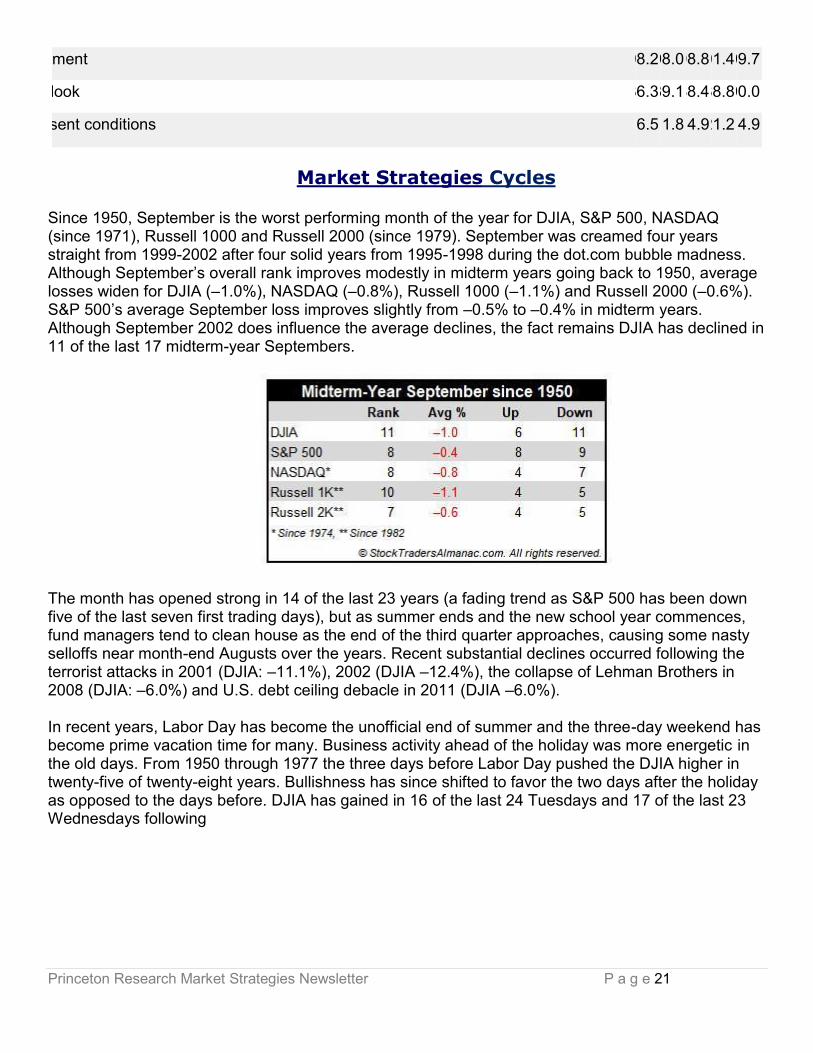
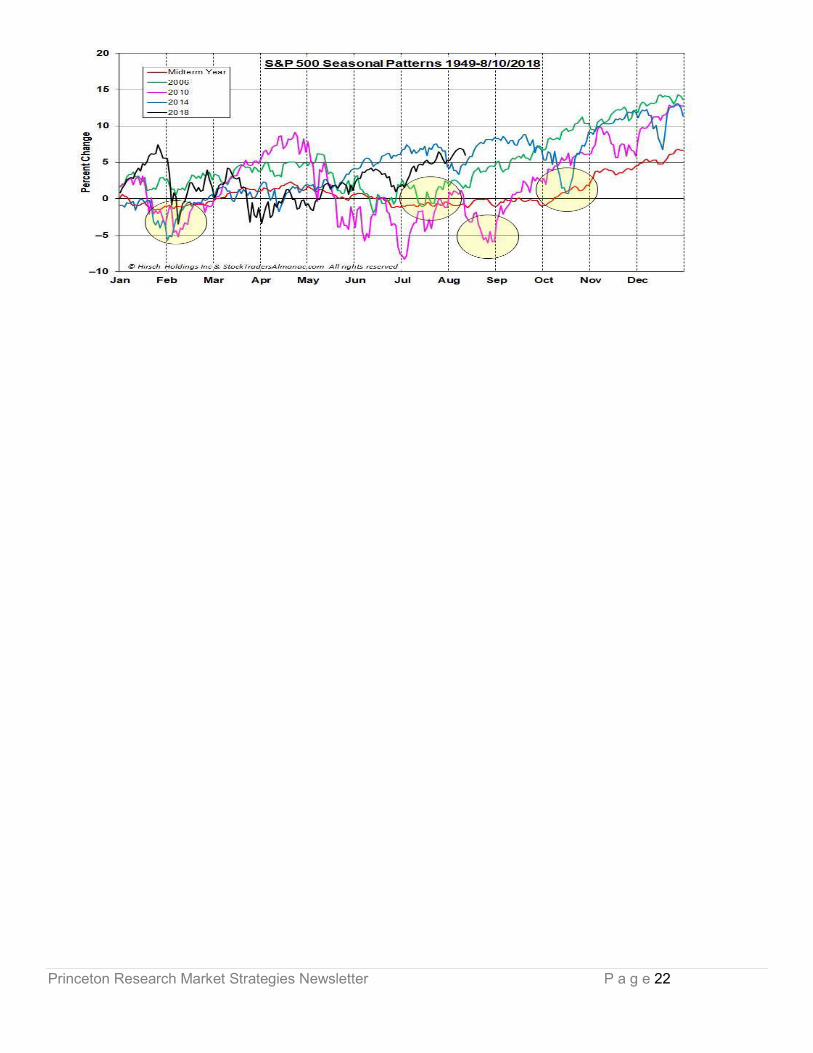
Market Strategies Cycles
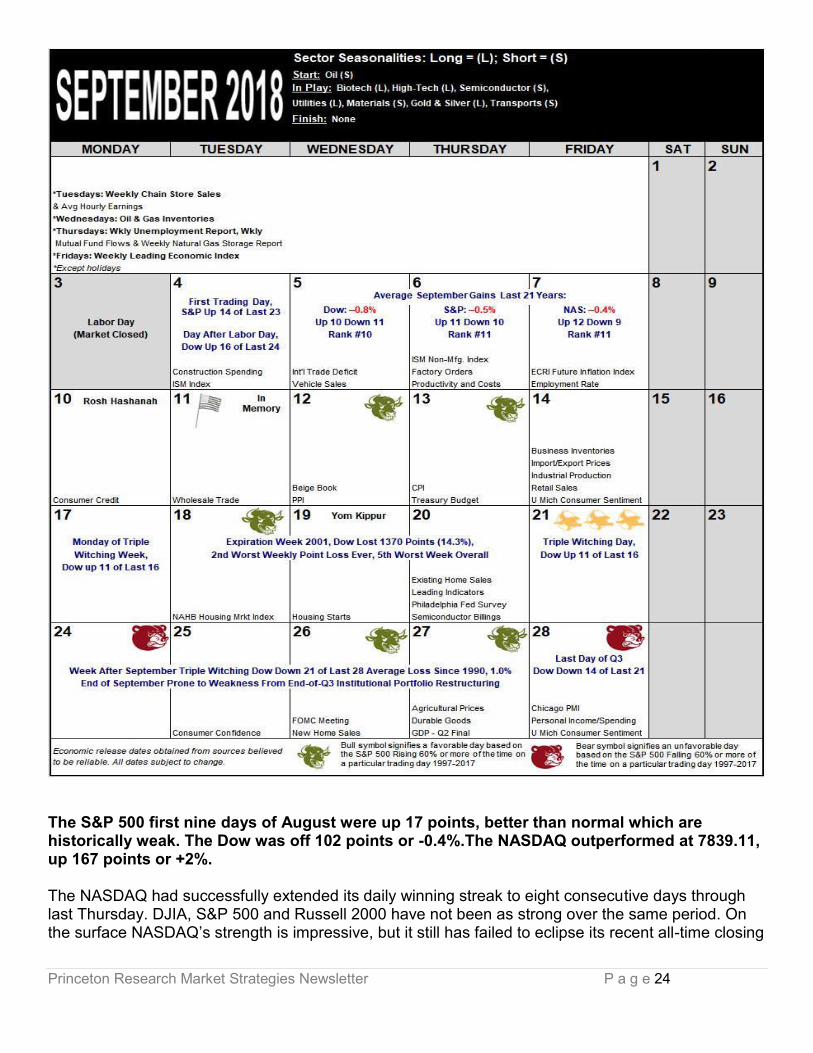
Since 1950, September is the worst performing month of the year for DJIA, S&P 500, NASDAQ (since 1971), Russell 1000 and Russell 2000 (since 1979). September was creamed four years straight from 1999-2002 after four solid years from 1995-1998 during the dot.com bubble madness. Although September’s overall rank improves modestly in midterm years going back to 1950, average losses widen for DJIA (–1.0%), NASDAQ (–0.8%), Russell 1000 (–1.1%) and Russell 2000 (–0.6%). S&P 500’s average September loss improves slightly from –0.5% to –0.4% in midterm years. Although September 2002 does influence the average declines, the fact remains DJIA has declined in 11 of the last 17 midterm-year Septembers.
The month has opened strong in 14 of the last 23 years (a fading trend as S&P 500 has been down five of the last seven first trading days), but as summer ends and the new school year commences, fund managers tend to clean house as the end of the third quarter approaches, causing some nasty selloffs near month-end Augusts over the years. Recent substantial declines occurred following the terrorist attacks in 2001 (DJIA: –11.1%), 2002 (DJIA –12.4%), the collapse of Lehman Brothers in 2008 (DJIA: –6.0%) and U.S. debt ceiling debacle in 2011 (DJIA –6.0%). In recent years, Labor Day has become the unofficial end of summer and the three-day weekend has become prime vacation time for many. Business activity ahead of the holiday was more energetic in the old days. From 1950 through 1977 the three days before Labor Day pushed the DJIA higher in twenty-five of twenty-eight years. Bullishness has since shifted to favor the two days after the holiday as opposed to the days before. DJIA has gained in 16 of the last 24 Tuesdays and 17 of the last 23 Wednesdays following
Princeton Research Market Strategies Newsletter P a g e 22

Princeton Research Market Strategies Newsletter P a g e 23
Princeton Research Market Strategies Newsletter P a g e 24
The S&P 500 first nine days of August were up 17 points, better than normal which are historically weak. The Dow was off 102 points or -0.4%.The NASDAQ outperformed at 7839.11, up 167 points or +2%. The NASDAQ had successfully extended its daily winning streak to eight consecutive days through last Thursday. DJIA, S&P 500 and Russell 2000 have not been as strong over the same period. On the surface NASDAQ’s strength is impressive, but it still has failed to eclipse its recent all-time closing
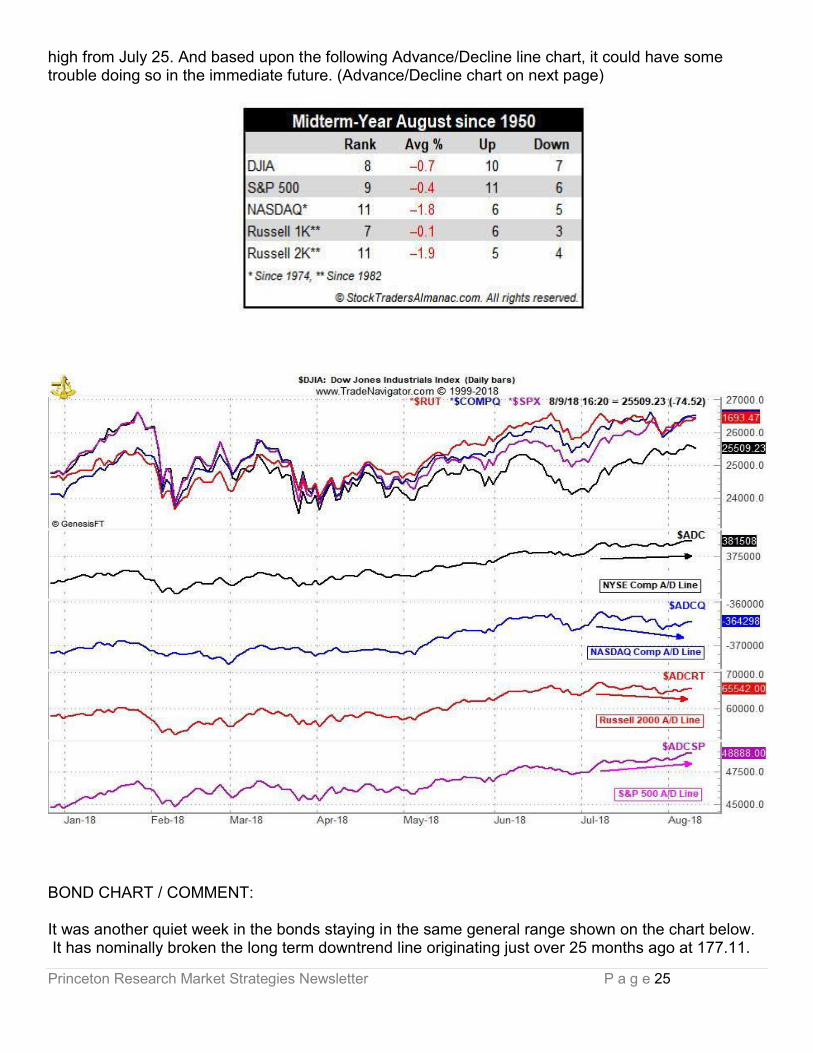
Princeton Research Market Strategies Newsletter P a g e 25
high from July 25. And based upon the following Advance/Decline line chart, it could have some trouble doing so in the immediate future. (Advance/Decline chart on next page)
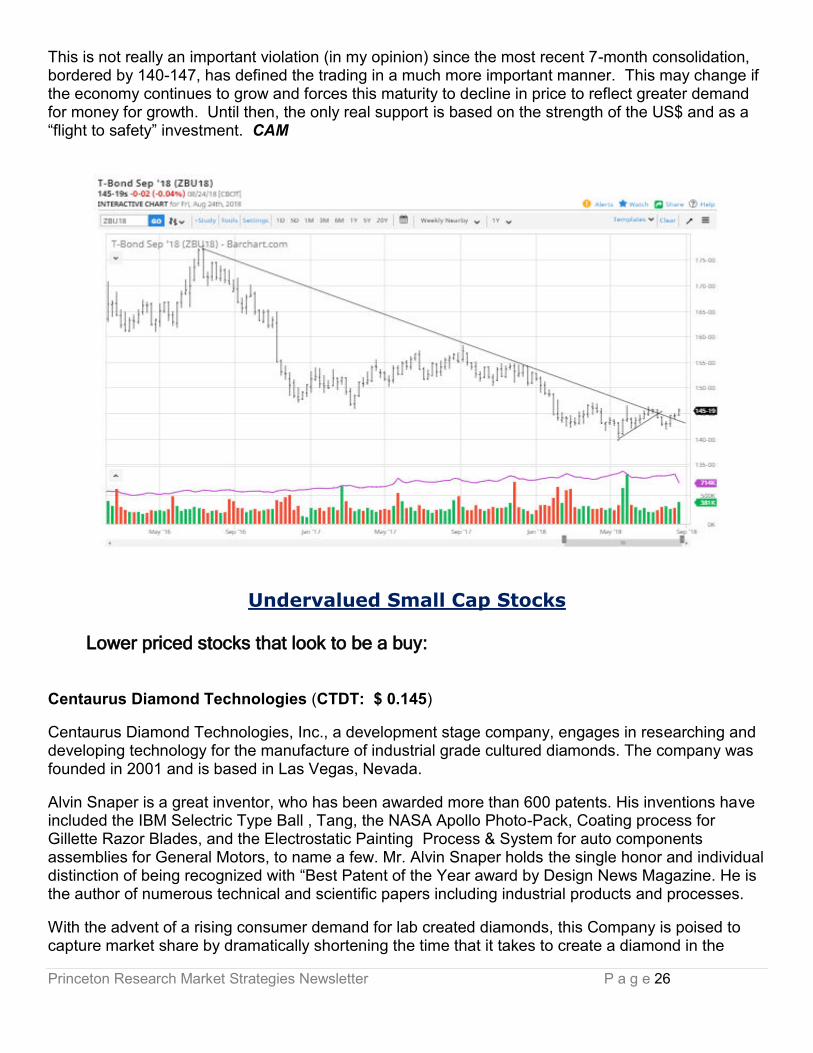
BOND CHART / COMMENT: It was another quiet week in the bonds staying in the same general range shown on the chart below. It has nominally broken the long term downtrend line originating just over 25 months ago at 177.11.
Princeton Research Market Strategies Newsletter P a g e 26
This is not really an important violation (in my opinion) since the most recent 7-month consolidation, bordered by 140-147, has defined the trading in a much more important manner. This may change if the economy continues to grow and forces this maturity to decline in price to reflect greater demand for money for growth. Until then, the only real support is based on the strength of the US$ and as a “flight to safety” investment. CAM
Undervalued Small Cap Stocks
Lower priced stocks that look to be a buy: Centaurus Diamond Technologies (CTDT: $ 0.145)
Centaurus Diamond Technologies, Inc., a development stage company, engages in researching and developing technology for the manufacture of industrial grade cultured diamonds. The company was founded in 2001 and is based in Las Vegas, Nevada.
Alvin Snaper is a great inventor, who has been awarded more than 600 patents. His inventions have included the IBM Selectric Type Ball , Tang, the NASA Apollo Photo-Pack, Coating process for Gillette Razor Blades, and the Electrostatic Painting Process & System for auto components assemblies for General Motors, to name a few. Mr. Alvin Snaper holds the single honor and individual distinction of being recognized with “Best Patent of the Year award by Design News Magazine. He is the author of numerous technical and scientific papers including industrial products and processes.
With the advent of a rising consumer demand for lab created diamonds, this Company is poised to capture market share by dramatically shortening the time that it takes to create a diamond in the
Princeton Research Market Strategies Newsletter P a g e 27
laboratory. CTDT’s Magnatech process is creating diamond material with tremendous heat and pressure in a fraction of a second by dropping out a magnetic field and using other proprietary technology The Company also has a proprietary lab refinement technology in its manufacturing process. In the mining and minerals sectors, Centaurus is positioning to revolutionize the milling process through the manufacture and distribution of a piece of equipment called the Autogenous Impact Mill. Still yet another innovative technological advancement from the mind of Alvin Snaper, the AIM machine uses physics to crush or mill hard materials such as mining ore, to as fine as 600 mesh. Because there is no direct metal on metal contact to accomplish this milling, the machines simply do not wear out or breakdown. As it replaces the Ball, Hammer, and Impact Mills where the highest amount of breakdown occurs, this technology provides a great boon to the industry, by dramatically increasing the surface area of the milled material, resulting in greater yield per ton of ore, and reducing costs, downtime, and maintenance, which is critical in the mining Industry for staying profitable.
Corporate Governance Centaurus Diamond Technologies, Inc. is run by very conservative thinking people who are ready to build a great company. Management is very knowledgeable about Public Markets and Reporting.
Leo Motors (LEOM: $0.11 )* +0.02 Leo Motors is a premier company that develops technology for boats and electric vehicles (EV's) that can travel at higher speed along roads, freeways and waterways. After 10 years of field tests, the Company has surpassed obstacles of speed, torque and reliability over other e-vehicles. Leo motors has developed an array of electric vehicles and boats, including armored military vehicles, sports cars, utility trucks, passenger buses and electronic title water boats.
Leo Motors primary division, LGM, is producing and marketing electric boats (E- boats). LGM is one of the few companies in the world that produces a safe high power electric boat. March 2017, LGM unveiled their proprietary new electric powerboat propulsion system at the 2017 Busan Boat Show in Korea. The new LGM powerboat electric propulsion system produces up to 660 horse power (HP) and is compatible with most power boats and yachts.
LGM’s electric inboard and outboard propulsion systems now range from 40 HP to 700 HP and also includes their Sailing Generation System that uses wind to recharge batteries while under way, eliminating conventional charging processes. LGM is communicating with potential partners in America for their conversion enterprise.
LGM will enter into the U.S. market this year providing electric conversion services. LGM will replace old internal combustion engine yachts and powerboats to the LGM electric power system.
Smart E-Vehicle Technology
LEO's proprietary electronic vehicle ecosystem has intelligent software which controls a cloud system. LEO developed the Vehicle to Everything (V2E) platform which uses smart technology to manage a cloud in the operating system (OS). The integrated OS allows connectivity with a smart device for improved driving solutions. The smart applications help reduce battery exchange recharge time and provides roadside assistance. A GPS application uses satellite and mobile networks connected to Android systems using a Bluetooth®. The app sends updates, battery status and swap service information.
Princeton Research Market Strategies Newsletter P a g e 28
Pressure Bio Sciences OTCQB: PBIO $3.37*-0.28 or -7.7%
Pressure BioSciences, Inc. (OTCQB: PBIO) is a leader in the development and sale of innovative, broadly enabling, pressure-based platform solutions for the worldwide life sciences industry. The Company’s products and services are based on the unique properties of three patented, pressure-enhanced platforms: (i) Pressure Cycling Technology (“PCT”), (ii) Pressure Enabled Protein Manufacturing Technology (“PreEMT”), and (iii) Ultra Shear Technology (“UST”). The PCT Platform uses alternating cycles of hydrostatic pressure between ambient and ultra-high levels to safely and reproducibly control bio-molecular interactions (e.g., critical research steps routinely performed by hundreds of thousands of scientists worldwide, such as cell lysis and biomolecule extraction). PBIO’s primary focus is in making their recently-released, GMP-compliant, next generation PCT-based Barocycler EXT instrument available to biopharmaceutical drug manufacturers around the world for use in the design, development, characterization and quality control of their biotherapeutic drugs. The PCT Platform is also used in biomarker and target discovery, soil & plant biology, anti-bioterror, and forensics. PBIO currently has over 300 PCT instrument systems placed in approximately 175 academic, government, pharmaceutical, and biotech research laboratories worldwide. There are over 120 independent publications highlighting the advantages of using the PCT Platform in scientific research studies, many from worldwide key opinion leaders. The PCT Platform is offered through the Company’s Research Products & Services Group. The PreEMT Platform can be used to significantly impact and improve the quality of protein therapeutics. It employs high pressure for the disaggregation and controlled refolding of proteins to their native structures at yields and efficiencies not achievable using existing technologies. The PreEMT Platform has been shown to remove protein aggregates in biotherapeutic drug manufacturing, thereby improving product efficacy and safety for both new-drug entities and biosimilar products. The PreEMT Platform can help companies create novel protein therapeutics, accelerate therapeutic protein development, manufacture follow-on biologics, and enable life-cycle management of protein therapeutics. It is scaleable and practical for standard manufacturing processes. This unique technology platform can help protein-based biopharmaceutical companies create and manufacture high quality, novel protein therapeutics and lower the cost of existing formulations. The PreEMT Platform is offered as a service by PBI’s Biological Contract Research Services Group. Manufacturing licenses are available. The UST Platform is based on the use of intense shear forces generated from ultra-high pressure (greater than 20,000 psi) valve discharge. UST has been shown to turn hydrophobic extracts into stable, water-soluble formulations, on a small, laboratory scale. Thus, the UST Platform offers the potential to produce stable nanoemulsions of oil-like products in water. Such formulations could potentially have enormous success in many markets, including inks, industrial lubricants, paints, and cosmetics, as well as in pharmaceuticals and nutraceuticals, such as medically important plant oil extracts, i.e., making CBD-enriched plant oil water soluble. The Company believes that UST has the potential to play a significant role in a number of commercially important areas, including (i) the creation of stable nanoemulsions of otherwise immiscible fluids (e.g., oils and water), and (ii) the preparation of higher quality, homogenized, extended shelf-life or room temperature stable low-acid liquid foods that cannot be effectively preserved using existing non-thermal technologies, e.g., dairy products. The UST Platform is currently offered as a service through PBI’s Research Products and Services Group.
Princeton Research Market Strategies Newsletter P a g e 29
2018 Accomplishments May 15, 2018: the Company announced that it had converted $6.39M of debt into equity. The Company also reported continued increases in revenue for the first quarter of 2018, including an 11% increase in products and services sales, an 8% increase in instrument sales, and an 18% increase in consumable sales Y/Y. May 3: the Company announced receipt of the first contract utilizing the recently acquired high pressure technology from BaroFold, Inc. to evaluate PBI’s patented Pre-EMT platform to enhance the manufacturing process and improve the quality of protein therapeutic drug candidates. April 3: the Company reported Q4 and FY2017 financial results and offered a business update. Instruments, consumables, products & services and total revenue continued to show double-digit growth. Quarterly revenue has increased eight quarters in a row, on a Y/Y basis. Total revenue has increased three years in a row, on a Y/Y basis. February 14: the Company announced a two-year, worldwide co-marketing and distribution agreement with ISS, Inc., a global supplier of high pressure optical cell systems. The companies plan to replace the current manual pressure generator for the ISS optical cell with PBI’s computer-controlled, automated instruments. Investment Highlights Seasoned Management Team & Board of Directors Novel, Enabling, Patent Protected, Proprietary Platform (PCT) Proven Core Technology with Multiple Applications (over 270 PCT systems placed) Razor/Razorblade Business Model Sales into the Research Market (fast market penetration with minimal approvals required) Increasing Number of 3rd Party Publications from Marquee Laboratories PCT Breaks Through Bottlenecks and Barriers to Enable and Accelerate Scientific Discovery PCT Exquisitely Controls Test Variables, Providing Methods Standardization/Reproducibility Significant Market Opportunity (~$6 Billion from ~500K scientists in 80K labs worldwide)
Skinvisible, Inc. (OTCQB: SKVI 0.015 ) Has announced a merger with Quoin Pharmaceuticals: Through its wholly owned subsidiary Skinvisible Pharmaceuticals, Inc., is a Research and Development company whose patented Invisicare® technology can be used to revitalize or create new medical or skincare products, allowing a company that licenses Skinvisible’s formulations to sell their own patented product and combat generic competitors.
Skinvisible, Quoin Pharmaceuticals, Proposed Merger to Address Opioid Pain Management Market
A merger between Skinvisible and Quoin will enable a successful entry on the post-surgical pain management market.
Opioids – which typically refer to oxycodone, hydrocodone, and fentanyl – are highly addictive painkillers. Nearly 3 in 10 Americans prescribed opioids for chronic pain will abuse them.
Opioids are becoming increasingly deadly to Americans. In 2016, two-thirds of drug-related deaths involved opioids. In fact, since 1999 opioid-related deaths in the United States have increased nearly fourfold.
Princeton Research Market Strategies Newsletter P a g e 30
Drug abuse is a burden shared by every state. Nearly 63,600 Americans lost their lives to drug overdoses in 2016 – a 21 percent increase over the previous year. From 2000 to 2016 the U.S. Centers for Disease Control and Prevention estimates that more than 600,000 people died from drug overdoses in the United States.
Every 25 minutes, a baby in the United States is born suffering from opioid withdrawal. DJ Press Release: Skinvisible Provides Update on Proposed Merger with Quoin Pharmaceuticals Mar 26, 2018 16:05:00 (ET)
Combined company to address both the Opioid and PTSD crises
LAS VEGAS, March 26, 2018 (GLOBE NEWSWIRE) -- via NetworkWire - Skinvisible, Inc. ("Skinvisible") (OTCQB:SKVI), is pleased to announce the signing of a merger agreement with Quoin Pharmaceuticals, Inc. ("Quoin") subject to tax, accounting, legal, regulatory, and other considerations, including both SEC and Skinvisible shareholder approval. The merger proposal specifies that privately-held Quoin Pharmaceuticals, Inc. will merge into a wholly-owned subsidiary of Skinvisible. Post-merger, Quoin shareholders will own approximately 72.5% of the outstanding shares and Skinvisible shareholders will retain approximately 27.5% of the outstanding shares, prior to the effect of required financings and conversion of a certain portion of Skinvisible's debt. Skinvisible's Board of Directors has unanimously approved the merger agreement and recommends that all Skinvisible shareholders vote in favor of the transaction.
"We are very pleased to announce this exciting milestone for Quoin. We believe that the combination of our proprietary drug delivery platform with Skinvisible's fully patented technology will pave the way for the development of highly differentiated products with broad IP protection," said Dr. Michael Myers, Chairman and CEO of Quoin Pharmaceuticals.
The combined company plans to focus initially on major societal problems that result in the death of over 135 people in the US every day, the US opioid epidemic and the military veteran suicide crisis, by developing treatments that target these major unmet medical needs using Quoin's differentiated product portfolio.
Skinvisible is currently quoted on the OTCQB, operated by OTC Markets Group Inc., under the ticker symbol SKVI. Upon closing of the merger, Skinvisible will be renamed Quoin Pharmaceuticals and the company's symbol will be changed to something that more resembles the new name. The transaction is subject to customary closing conditions, including the receipt of Skinvisible shareholder approval and certain other conditions, and is expected to close by the end of the second quarter of 2018.
About Skinvisible Pharmaceuticals, Inc.
Skinvisible Pharmaceuticals is a research and development company that licenses its proprietary formulations made with Invisicare(R), its patented polymer delivery system that offers life-cycle management and unique enhancements for topically delivered products. Invisicare holds active ingredients on the skin for extended periods of time, allowing for the controlled release of actives. For more information, visit www.skinvisible.com or www.invisicare.com
About Quoin Pharmaceuticals, Inc.
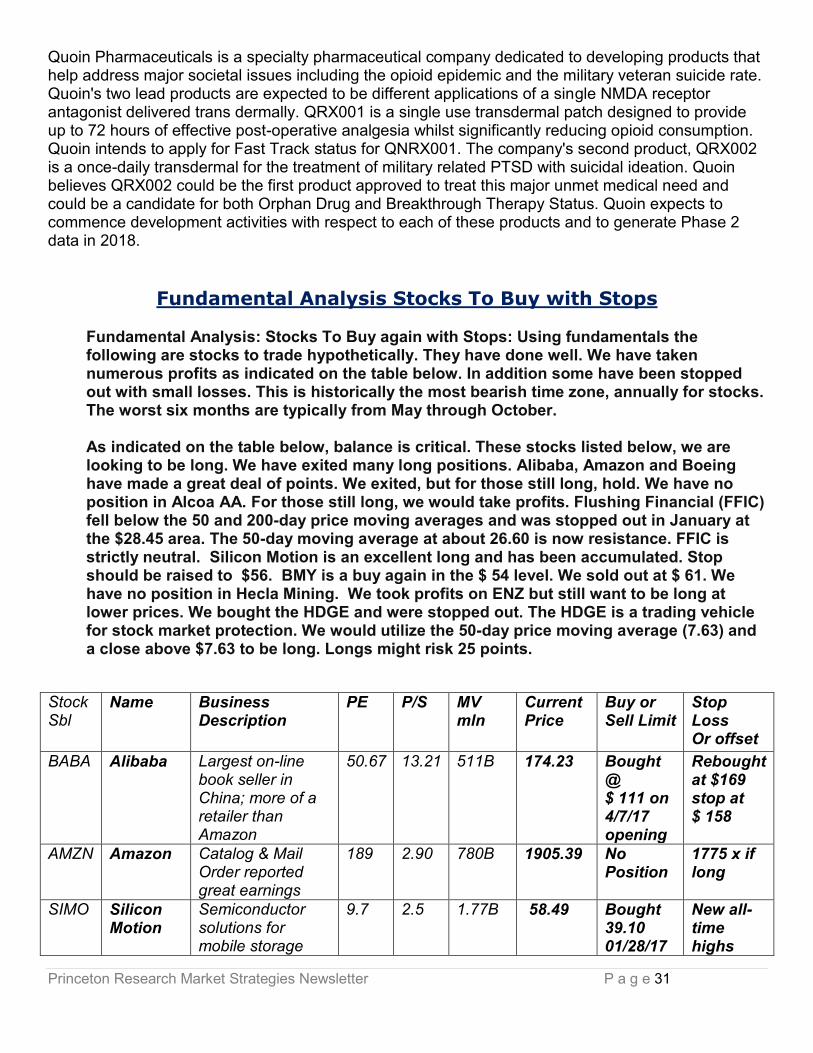
Princeton Research Market Strategies Newsletter P a g e 31
Quoin Pharmaceuticals is a specialty pharmaceutical company dedicated to developing products that help address major societal issues including the opioid epidemic and the military veteran suicide rate. Quoin's two lead products are expected to be different applications of a single NMDA receptor antagonist delivered trans dermally. QRX001 is a single use transdermal patch designed to provide up to 72 hours of effective post-operative analgesia whilst significantly reducing opioid consumption. Quoin intends to apply for Fast Track status for QNRX001. The company's second product, QRX002 is a once-daily transdermal for the treatment of military related PTSD with suicidal ideation. Quoin believes QRX002 could be the first product approved to treat this major unmet medical need and could be a candidate for both Orphan Drug and Breakthrough Therapy Status. Quoin expects to commence development activities with respect to each of these products and to generate Phase 2 data in 2018.
Fundamental Analysis Stocks To Buy with Stops
Fundamental Analysis: Stocks To Buy again with Stops: Using fundamentals the following are stocks to trade hypothetically. They have done well. We have taken numerous profits as indicated on the table below. In addition some have been stopped out with small losses. This is historically the most bearish time zone, annually for stocks. The worst six months are typically from May through October.
As indicated on the table below, balance is critical. These stocks listed below, we are looking to be long. We have exited many long positions. Alibaba, Amazon and Boeing have made a great deal of points. We exited, but for those still long, hold. We have no position in Alcoa AA. For those still long, we would take profits. Flushing Financial (FFIC) fell below the 50 and 200-day price moving averages and was stopped out in January at the $28.45 area. The 50-day moving average at about 26.60 is now resistance. FFIC is strictly neutral. Silicon Motion is an excellent long and has been accumulated. Stop should be raised to $56. BMY is a buy again in the $ 54 level. We sold out at $ 61. We have no position in Hecla Mining. We took profits on ENZ but still want to be long at lower prices. We bought the HDGE and were stopped out. The HDGE is a trading vehicle for stock market protection. We would utilize the 50-day price moving average (7.63) and a close above $7.63 to be long. Longs might risk 25 points.
Stock Sbl
Name Business Description
PE P/S MV mln
Current Price
Buy or Sell Limit
Stop Loss Or offset
BABA Alibaba Largest on-line book seller in China; more of a retailer than Amazon
50.67 13.21 511B 174.23 Bought @ $ 111 on 4/7/17 opening
Rebought at $169 stop at $ 158
AMZN Amazon Catalog & Mail Order reported great earnings
189 2.90 780B 1905.39 No Position
1775 x if long
SIMO Silicon Motion
Semiconductor solutions for mobile storage
9.7 2.5 1.77B 58.49
Bought 39.10 01/28/17
New all-time highs
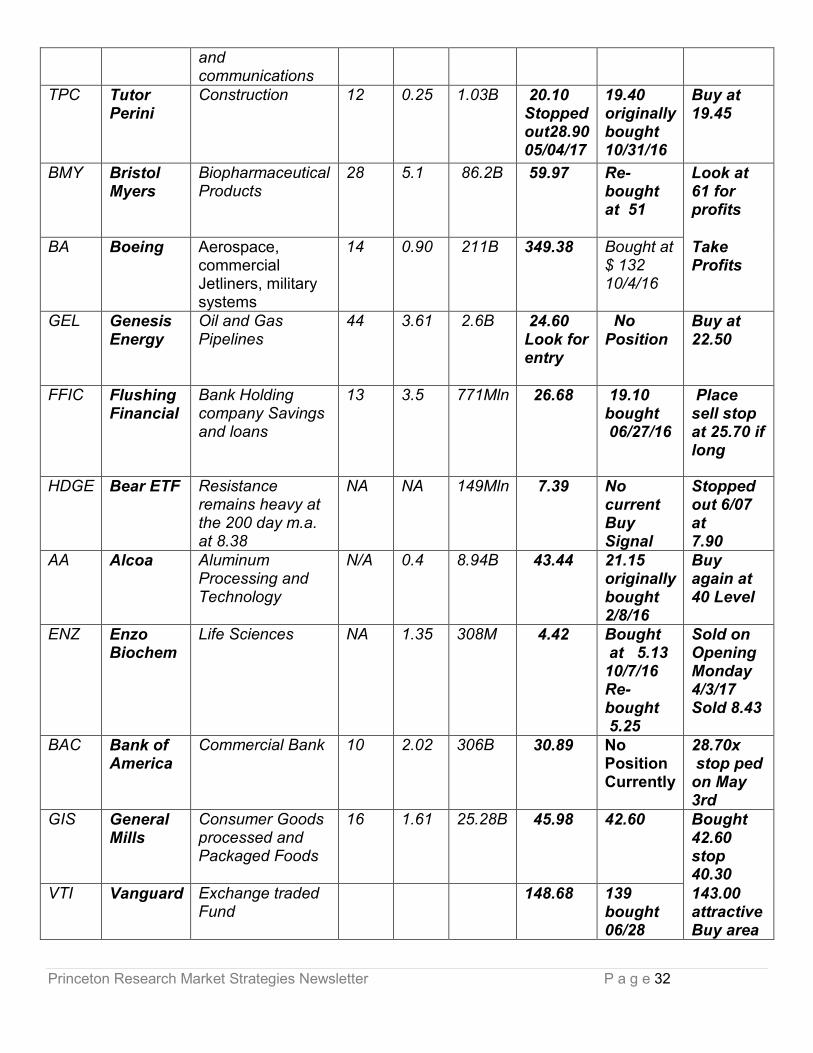
Princeton Research Market Strategies Newsletter P a g e 32
and communications
TPC Tutor Perini
Construction 12 0.25 1.03B 20.10 Stopped out28.90 05/04/17
19.40 originally bought 10/31/16
Buy at 19.45
BMY Bristol Myers
Biopharmaceutical Products
28 5.1 86.2B 59.97
Re-bought at 51
Look at 61 for profits
BA Boeing Aerospace, commercial Jetliners, military systems
14 0.90 211B 349.38 Bought at $ 132 10/4/16
Take Profits
GEL Genesis Energy
Oil and Gas Pipelines
44 3.61 2.6B 24.60 Look for entry
No Position
Buy at 22.50
FFIC Flushing Financial
Bank Holding company Savings and loans
13 3.5 771Mln 26.68 19.10 bought 06/27/16
Place sell stop at 25.70 if long
HDGE Bear ETF Resistance remains heavy at the 200 day m.a. at 8.38
NA NA 149Mln 7.39
No current Buy Signal
Stopped out 6/07 at 7.90
AA Alcoa Aluminum Processing and Technology
N/A 0.4 8.94B 43.44
21.15 originally bought 2/8/16
Buy again at 40 Level
ENZ Enzo Biochem
Life Sciences NA 1.35 308M 4.42 Bought at 5.13 10/7/16 Re-bought 5.25
Sold on Opening Monday 4/3/17 Sold 8.43
BAC Bank of America
Commercial Bank 10 2.02 306B 30.89
No Position Currently
28.70x stop ped on May 3rd
GIS General Mills
Consumer Goods processed and Packaged Foods
16 1.61 25.28B 45.98 42.60 Bought 42.60 stop 40.30
VTI Vanguard Exchange traded Fund
148.68 139 bought 06/28
143.00 attractive Buy area
Princeton Research Market Strategies Newsletter P a g e 33
Rule 17B Attestations and Disclaimers Princeton is paid $ 1,500 per month from RMS Medical Products. The SITS contract calls for $ 1,500 per month. Princeton had been engaged by Target Energy. No contract is currently in place. Princeton is paid $ 2500 per month by Pressure Biosciences. Princeton was paid about 300,000 restricted shares of Leo Motors. Princeton is paid $ 2,500 per month for International Star. Princeton is paid $ 2,500 from Leo Motors.
Pursuant to the provisions of Rule 206 (4) of the Investment Advisers Act of 1940, readers should recognize that not all recommendations made in the future will be profitable or will equal the performance of any recommendations referred to in this Email issue. Princeton may buy or sell its free-trading shares in companies it represents at any time. Y means the writer has a position of 10,000 shares in the stock recommended.
CONTACT
Please Direct All Inquiries To:
Mike King
(702) 650-3000
Charles Moskowitz (781) 826-8882
Princeton Research 3887 Pacific Street,
Las Vegas, Nevada 89121
Fax: (702) 697-8944
www.PrincetonResearch.com