Embed Size (px)
Citation preview
Department Of Economics
Investing in the roots of your political ancestors
Pantelis Kammas, Maria Poulima and Vassilis Sarantides
Sheffield Economic Research Paper Series SERPS no. 2021004 ISSN 1749-8368 April 2021
1
Investing in the roots of your political ancestors
Pantelis Kammasa, Maria Poulimab and Vassilis Sarantidesc
a Athens University of Economics and Business, Patission 76, Athens 10434, Greece. [email protected]
b Department of Economics, University of Ioannina, P.O. Box 1186, 45110 Ioannina, Greece [email protected]
c Department of Economics, University of Sheffield, 9 Mappin Str, Sheffield S1 4DT, UK. Corresponding Author: [email protected]
April 22, 2021
Abstract: This paper seeks to investigate the role of electoral personalism and long-run partisan loyalty on the allocation of local public goods. To this end, we exploit the discontinuity in the political landscape of Greece after a brief military junta (1967-1974) to link the parties established after 1974 with their political ancestors during the pre-dictatorial era. In particular, after 1974 Greece is a ‘new democracy’ with infant political parties that were trying to increase their political power by maintaining the networks of their (pre-junta) political ancestor parties. Consistent with expectations, empirical findings suggest that incumbents directed public investment resources to regions characterized by long-run loyalty in favor of their party. Moreover, our analysis illuminates the channel of this association by highlighting the important role of strong Members of Parliament (MPs) with ministerial positions. This result is in line with the literature suggesting that powerful MPs typically favor their home districts under an Open-List Proportional Representation (OLPR) electoral system. This is because OLPR induces intra-party competition as candidates compete over their co-partisans in order to get elected. In this political environment, powerful MPs attempt to maintain their networks of political patronage in the loyal prefectures of their affiliated party, whereas the party expropriates their electoral influence.
JEL classification: H1; H4; D7
Keywords: public investment, partisan loyalty, open-list proportional representation
Acknowledgments: We have benefited from comments and suggestions by Nikos Benos, Anastasia Litina, Panagiotis Konstantinou, Harry Pickard, Thanasis Stavrakoudis, Spyros Symeonides, Nikos Tsakiris, Dimitris Xefteris and the conference participants at 8th International Ioannina Meeting on Applied Economics and Finance (IMAEF) and the 19th Conference on Research on Economic Theory and Econometrics (CRETE). Any remaining errors are ours.
2
1. Introduction
In recent years, there has been a surge in scholarly contributions investigating how political and
partisan motives of the central government can distort the geographical allocation of public capital
even if the latter can be proven detrimental to economic growth and efficiency (for a review of this
literature see Bom and Ligthart, 2014).1 The theoretical literature offers competing models of pork-
barrel politics, producing conflicting predictions that incumbents could follow either a ‘core voter’
strategy, targeting regions of their core voters, or a ‘swing voter’ strategy, in which they target voters
who are indifferent about the candidates (see Cox and McCubbins, 1986, and Lindbeck and Weibull,
1987).2 Contradictory theoretical predictions were followed by a large number of empirical studies -
undertaken mostly within single countries- providing conflicting findings concerning the behavior of
the central government in different countries.3
In an effort to reconcile these findings, a strand of the literature places the spotlight on political
institutions and especially on the electoral system (see, e.g., McGillivray, 2004; Kemmerling and
Stephan, 2015).4 A major characteristic of the political system that is expected to affect the allocation
of public investment is the degree of personalism in the electoral contests (see, e.g., McGillivray, 2004;
Golden and Picci, 2008) and consequently the relative strength of the party vis-à-vis local legislators
(i.e., MPs). Practically, party strength can be thought as the degree of central party control over
candidate selection. McGillivray (2004) contends that in the context of a majoritarian voting system,
weak parties are not able to effectively discipline their MPs. Therefore, MPs with greater seniority or
greater influence within the party direct resources to their home districts even when the latter appears
to be safe and not marginal. Similarly, Golden and Picci (2008) suggest that also under an Open-List
Proportional Representation (OLPR) system, powerful MPs typically favor their home districts. This
is because OLPR induces intra-party competition -as candidates compete over their co-partisans in
1 For many years, research in pork-barrel politics was confined almost exclusively to the United States (for a review see, e.g., Golden and Min, 2013). However, in the past two decades, the increasing availability of relevant data allowed well-established studies for other countries, like Albania (Case, 2001), Australia (Worthington and Dollery, 1998), Brazil (Ames, 1995), Canada (Joanis, 2011), Germany (Kauder et al. 2016), India (Arulampalam et al., 2009), Italy (Golden and Picci, 2008), Japan (Yamano and Okhawara, 2000), Mexico (Costa-i-Font et al., 2003) and Spain (Solé-Ollé and Sorribas-Navarro, 2008; Solé-Ollé, 2013) among others. A large number of these studies focuses exclusively on the geographical allocation of public capital (see, e.g., Golden and Picci, 2008; Arulampalam et al., 2009; Joanis, 2011). 2 Public infrastructure is best described as a centrally provided local public good (i.e., public good that generates localized benefits) or as a geographically targetable private good. See Knight (2004) for more details on this. 3 A large number of empirical studies supports the “swing voter” hypothesis (see, e.g., Arulampalam et al., 2009; Hellald and Sørensen, 2009), whereas others provide evidence in favor of incumbency bias towards party’s strongholds (see, e.g., Costa-i-Font et al., 2003; Joanis, 2011). 4 Building on the pioneer studies of Lizzeri and Persico (2001) and Milesi-Ferretti et al. (2002), this literature argues that under majoritarian (or plurality) voting systems, politicians prefer to distribute benefits through geographically targetable public goods directed to marginal districts. This is because legislative seats require plurality of votes in each district, and, therefore, votes in contested districts matter more to politicians than votes in safe districts. As a result, politicians face incentives to behave along the predictions of the “swing voter” hypothesis. In contrast, proportional voting systems are less vulnerable to regional pork-barrel strategies (see, e.g., Persson and Tabellini, 2002).
3
order to be elected- and this may lead candidates to cultivate their own personal reputation among the
voters (see, e.g., Carey and Shugart, 1995) as well as to develop clientelistic linkages between them
and the electorate (see, e.g., Ames, 1995; Kitschelt, 2000).5
The paper at hand employs a novel dataset to explore potential political incentives behind the
regional distribution of public investment spending in Greece from 1974 to 1989. The political
landscape in Greece consists an ideal setup for the purposes of our analysis since it was characterized
by a substantial degree of electoral personalism (see, e.g., Mavrogordatos, 1983a). This is due to the
electoral system, which was a standard OLPR, but, more importantly, because Greece during the
period under investigation was a “new democracy” characterized by infant and relatively weak
political parties that were drawing electoral support from powerful MPs and their personalistic patron-
client networks.6 More precisely, the Greek political arena was traditionally dominated by
interpersonal patron-client networks which belong personally to specific MPs benefiting primarily
them and only indirectly benefiting their political parties (see, e.g., Meynaud, 2002).7 These MPs could
not be disciplined effectively by their parties and had incentives -when they would be in office- to
direct resources to their home districts to further maintain their clientelistic linkages (see, e.g., Ames,
1995; Kitschelt, 2000) and, also, to prevent voters from switching support to another co-partisan (see,
e.g., Golden and Picci, 2008). On top of that, electoral personalism was reinforced because after 1974
Greece was a ‘new democracy’ with infant political parties. These parties were trying to increase their
political power by reviving the networks of their (pre-junta) political ancestors which were structured
around politically powerful MPs.8
5 Proportional Representation (PR) electoral systems are based on the principle that, first, seats are allocated to each party according to its electoral strength and, second, are distributed to the individual candidates following different formulas. More specifically, in Closed-List Proportional Representation (CLPR), it is the party that ranks the candidates (prior to the elections) and after the elections the seats are allocated to individual candidates according to their rank in the party list. In OLPR, parties present a set of candidates running under their label, but they do not rank them prior to the election. So, voters cast a ballot for an individual candidate and the parties receive seats in proportion to the sum of votes received by all the candidates running under their label. After the elections, seats are distributed to individual candidates according to the number of personal votes they received. For example, suppose that a party is allocated n seats. The top n candidates, as determined by the number of votes they personally received, are those who win the legislative seats (for more details on this see Cheibub and Sin, 2020). 6 This classification of Greece as a ‘new democracy’ is consistent with the relevant literature (see, e.g., Brender and Drazen, 2005; Brender and Drazen, 2007) 7 More precisely, these patron-client linkages form pyramids with powerful MPs at their peak, local party bosses in the middle and individual voters at the base (see, e.g., Mavrogordatos, 1983a). Traditionally, these networks of local bosses and middlemen belonged personally to the powerful MPs and it was a common practice to be transmitted as inheritance -or even as dowry- within the same family from one generation to the other. It is obvious that in such a political context, powerful MPs were the ultimate centre of political power and consequently the political parties were built structurally around these networks of local notables (see Meynaud, 2002, for more details on this). The absence of effective party organization and mass membership constituted to the party’s parliamentary group being extremely powerful; this situation is often described as vouleftokratia (“rule of the MPs”) in the relevant literature. 8 It has been argued that, since 1974, the pre-junta party system, which was based on traditional interpersonal patron-client relationships, was starting to be transformed. In particular, the new parties that emerged after the establishment of the Third Hellenic Republic (referred to as the Metapolitefsi, i.e., change of regime) were developing stronger organizational
4
Moreover, Greece is characterized by a remarkable degree of long-run partisan loyalty in most
of its constituencies. In particular, the electoral strength of parties that belong to the same political
family appears to be constant over a very long period, starting from the decade of 1960’s and remained
relatively intact despite the interruption of the seven-year military dictatorship (1967-1974) (see, e.g.,
Featherstone and Katsoudas, 1985; Papadopoulos, 1989; Kalyvas, 2010). This characteristic is also
expected to affect the geographical allocation of public investment (see Case, 2001; Larcinese et al.,
2006; Joanis, 2011).9 However, since existing studies focus on majoritarian voting systems, it remains
an open question whether long-run partisan loyalty also affects the allocation of public investment
under an OLPR electoral system. Moreover, an additional open issue is to verify whether there is a
linkage between long run partisan loyalty and electoral personalism. In other words, whether the
loyalty of constituencies is -in practice- ensured through the existence of strong patron-client linkages
which are structured around powerful MPs.
The period of focus (1974-1989) fits perfectly in this framework for three reasons. First, the
interruption of democracy due to the military regime for seven years creates a discontinuity in the
political landscape; the creation of new parties, after 1974, which can be linked to their ancestor parties
in the pre-dictatorial era, allow to test the loyalty effect when Greece is a new democracy.10 Second,
after 1974, the Greek economy is characterized by a significant expansion of the public sector and high
levels of primary public deficits that led public debt to rise from less than 20 percent of GDP in 1973
to more than 100 percent in less than two decades (see, e.g., Meghir et al., 2017; Alogoskoufis, 2019).
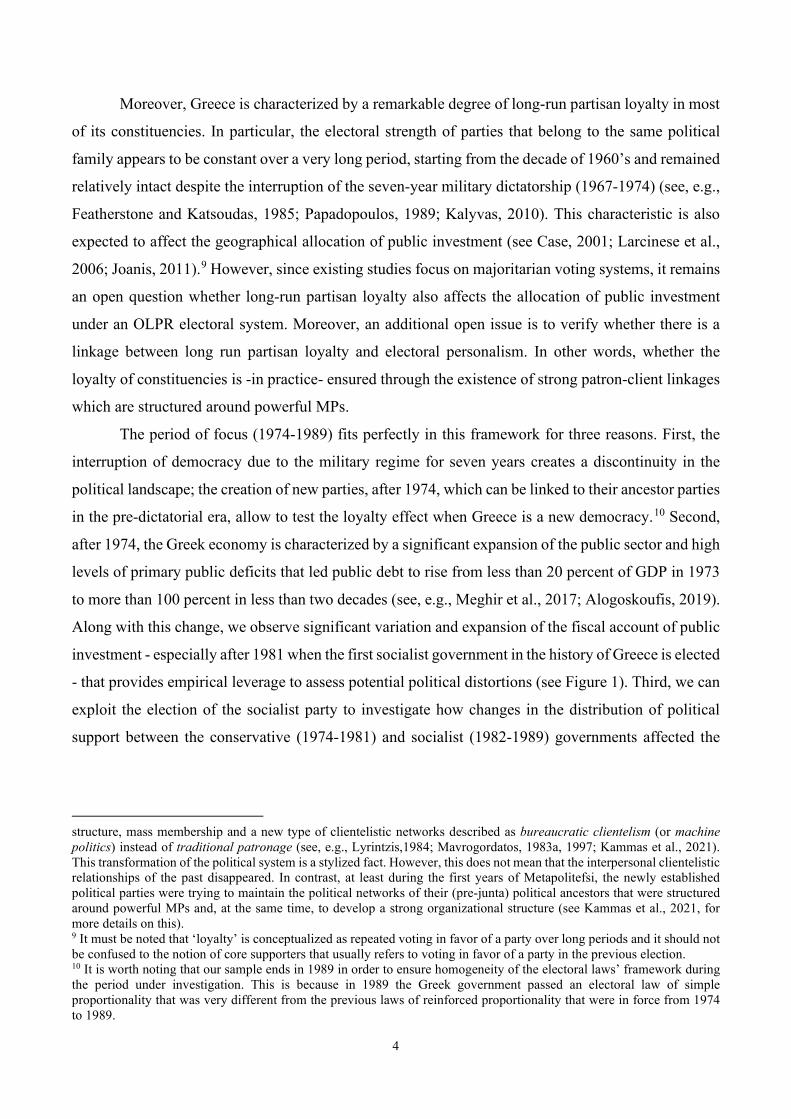
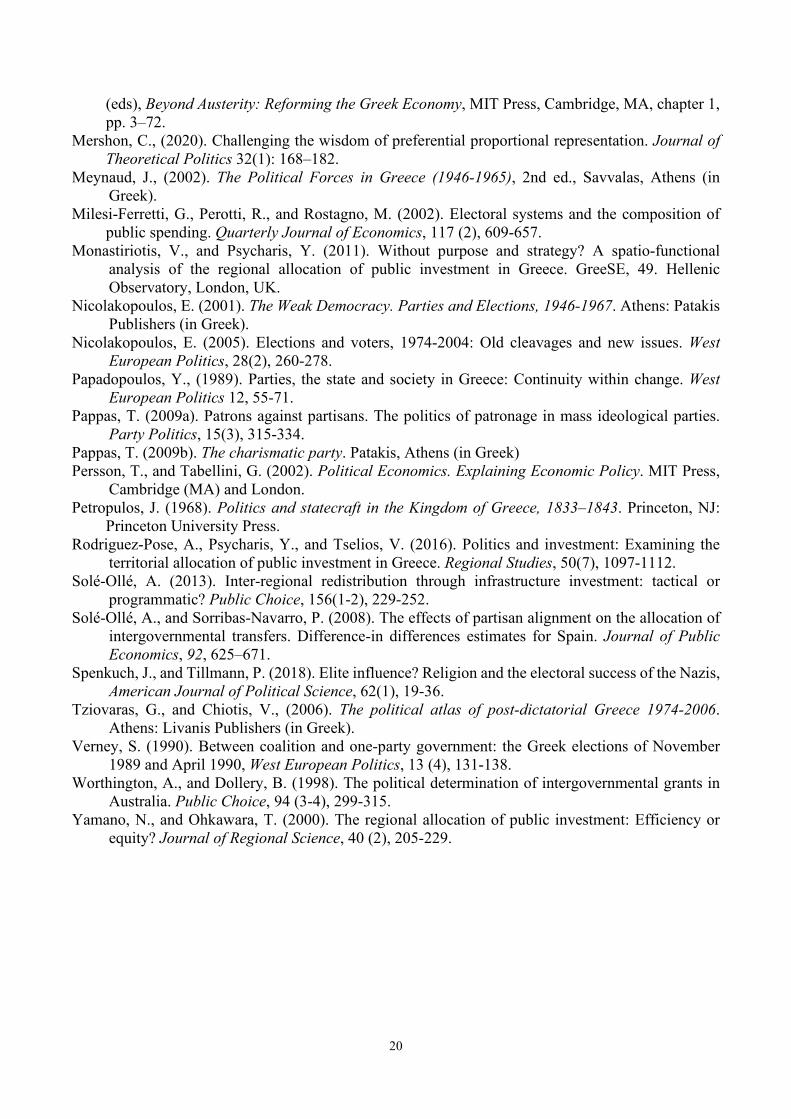
Along with this change, we observe significant variation and expansion of the fiscal account of public
investment - especially after 1981 when the first socialist government in the history of Greece is elected
- that provides empirical leverage to assess potential political distortions (see Figure 1). Third, we can
exploit the election of the socialist party to investigate how changes in the distribution of political
support between the conservative (1974-1981) and socialist (1982-1989) governments affected the
structure, mass membership and a new type of clientelistic networks described as bureaucratic clientelism (or machine politics) instead of traditional patronage (see, e.g., Lyrintzis,1984; Mavrogordatos, 1983a, 1997; Kammas et al., 2021). This transformation of the political system is a stylized fact. However, this does not mean that the interpersonal clientelistic relationships of the past disappeared. In contrast, at least during the first years of Metapolitefsi, the newly established political parties were trying to maintain the political networks of their (pre-junta) political ancestors that were structured around powerful MPs and, at the same time, to develop a strong organizational structure (see Kammas et al., 2021, for more details on this). 9 It must be noted that ‘loyalty’ is conceptualized as repeated voting in favor of a party over long periods and it should not be confused to the notion of core supporters that usually refers to voting in favor of a party in the previous election. 10 It is worth noting that our sample ends in 1989 in order to ensure homogeneity of the electoral laws’ framework during the period under investigation. This is because in 1989 the Greek government passed an electoral law of simple proportionality that was very different from the previous laws of reinforced proportionality that were in force from 1974 to 1989.
5
regional allocation of public investment within a Difference-in-Differences (DD) approach (see, e.g.,
Jablonski, 2014; Anaxagorou et al., 2020).
[Insert Figure 1, here]
Our empirical analysis suggests that both conservative and socialist governments directed
public investment resources to their political bailiwicks. Moreover, obtained findings indicate that the
socialist governments tended to serve their political objectives through the allocation of regional
investment, whereas the conservative governments mostly through public investment on education
and housing/sanitation.11 Moreover, by linking the political parties that dominated the political
landscape since 1974 (i.e., ND and PASOK) with their political ancestors during the pre-dictatorial
period (i.e., ERE and EK), our analysis suggests that incumbents allocated public investment flows to
regions characterized by long-run loyalty in favor of their party. To illuminate the potential mechanism
though which the latter takes place, we investigate the role of powerful MPs (i.e., those who were
appointed as ministers or deputy ministers). Our analysis concludes that loyal prefectures with
powerful MPs appointed as ministers receive more public investment flows from the central
government. This finding is in line with the theoretical literature suggesting that powerful MPs
typically favor their home districts under an OLPR system (see, e.g., Golden and Picci, 2008) as they
try to cultivate their own personal reputation and to maintain clientelistic linkages with the electorate
(see, e.g., Ames, 1995; Kitschelt, 2000). Finally, our analysis also suggests that there is a linkage
between electoral personalism and long-run partisan loyalty in Greece during the period under
investigation.
The rest of the paper is organized as follows. Section 2 discusses the Greek political landscape
and presents descriptive evidence on the electoral strength of the parties and the evolution of public
investment flows. Section 3 describes the empirical strategy and the main econometric results. Finally,
Section 4 offers some concluding remarks.
2. Data description and preliminary evidence
2.1 The Greek political landscape: Ancestors, descendants, and electoral outcomes
In this section, we describe the political system in Greece and the electoral influence of the main
political parties at the NUTS-3 level (i.e., 52 prefectures, see Figure C1 in the Appendix) in 6 electoral
11 Regional investment includes devolved public funds to regions and prefectures for investment purposes. In Section 2.2 which follows, and also in Table C2 in the Appendix, we provide further information of all nine subcategories of investment spending.
6
campaigns (1961, 1964, 1974, 1977, 1981 and 1985). The election of 1964 was the last before a brief
military junta, referred to as the “Regime of the Colonels” (1967-1974) that, in 1974, turned in the
government to Konstantinos Karamanlis - a towering figure of Greek politics prior to the interlude of
the autocratic regime (see Nicolakopoulos, 2001). Karamanlis formed a government of national unity
that prepared the country for free elections which were finally held in November 1974. Most of the
parties that took part in this electoral campaign were newly founded but -at the same time- they had
deep historical roots based on the traditional clientelistic networks of the parties that were dominant
during the pre-dictatorial period. In particular, New Democracy (ND - Nea Dimokratia), the right-wing
party founded by Konstantinos Karamanlis a few days before the announcement of the 1974 election,
was the obvious political successor of the pre-coup party of National Radical Union (ERE - Ethniki
Rizospastiki Enosis) purged of its extreme right-wing elements (see, e.g., Clogg, 1987). Similarly, the
traditional centre was represented by the alliance of Centre Union - New Forces (EKND - Enosi
Kentrou-Nees Dynameis), headed by Georgios Mavros, and was clearly the political descendent of the
pre-dictatorship moderate liberal party, Centre Union (EK- Enosis Kentrou). A new element in the
political scene of that period was the Panhellenic Socialist Movement (PASOK - Panellinio
Socialistiko Kinima), founded by Andreas Papandreou some days before the announcement of the
election. Andreas Papandreou was elected as MP with the pre-dictatorship EK and was the son of
Georgios Papandreou - the leader of EK before the military junta.
In the parliamentary elections of November 1974, ND won a landslide victory with 54.37
percent of the valid votes cast. The EKND achieved 20.42 percent, whereas PASOK obtained 13.58
percent. The open-list reinforced proportional representation system in the election of 1974 guaranteed
absolute dominance for ND with 220 seats in the 300-seat parliament. In Appendix A, we describe the
electoral system in detail.12 In 1977, Prime Minister Konstantinos Karamanlis called for early
elections, and ND retained its majority with 41.47 percent (171 seats). The big surprise was the success
of PASOK that almost doubled its electoral strength (25.3 percent), making Andreas Papandreou a
prominent figure in Greek politics (see Nicolakopoulos, 2005).13 In 1981, the party in power changes
after the triumphant dominance of PASOK with 48.1 percent (172 seats) - against the 35.9 percent of
ND - allowing Andreas Papandreou to form the first socialist government in the history of Greece. In
1985, PASOK won its second four-year period in government with 45.8 percent (161 seats), despite
12 It should be noted that similar electoral systems ensured total control of the parliament by all subsequent one-party governments between 1974-1989. In contrast, the electoral law of proportional representation passed by PASOK before the elections of 1989 prevented ND to form a government despite its 5 percent lead in the popular vote against PASOK (see Verney, 1990). 13 Because of PASOK's success, the vote share obtained by George Mavros' centrist party slumped to 11.95 percent, leading within a few years to its gradual disintegration from the political system (Mavrogordatos, 1984).
7
the relative rise of ND (40.8 percent). Table C1, in the Appendix, provides more details about the
electoral outcomes over this period, and the laws under which these electoral campaigns took place.
Using the electoral outcomes of 1974, 1977, 1981 and 1985 we construct three ‘political
support’ variables for the period 1974-1989.14 First, the share of votes received by the incumbent party
(incumbent share); second, the share of votes received by the two leading opposition parties between
1974-1981 (i.e, EKND and PASOK), or the leading opposition party between 1982-1989 (i.e., ND)
(opposition share)15; third, the difference between incumbent share and opposition share (victory
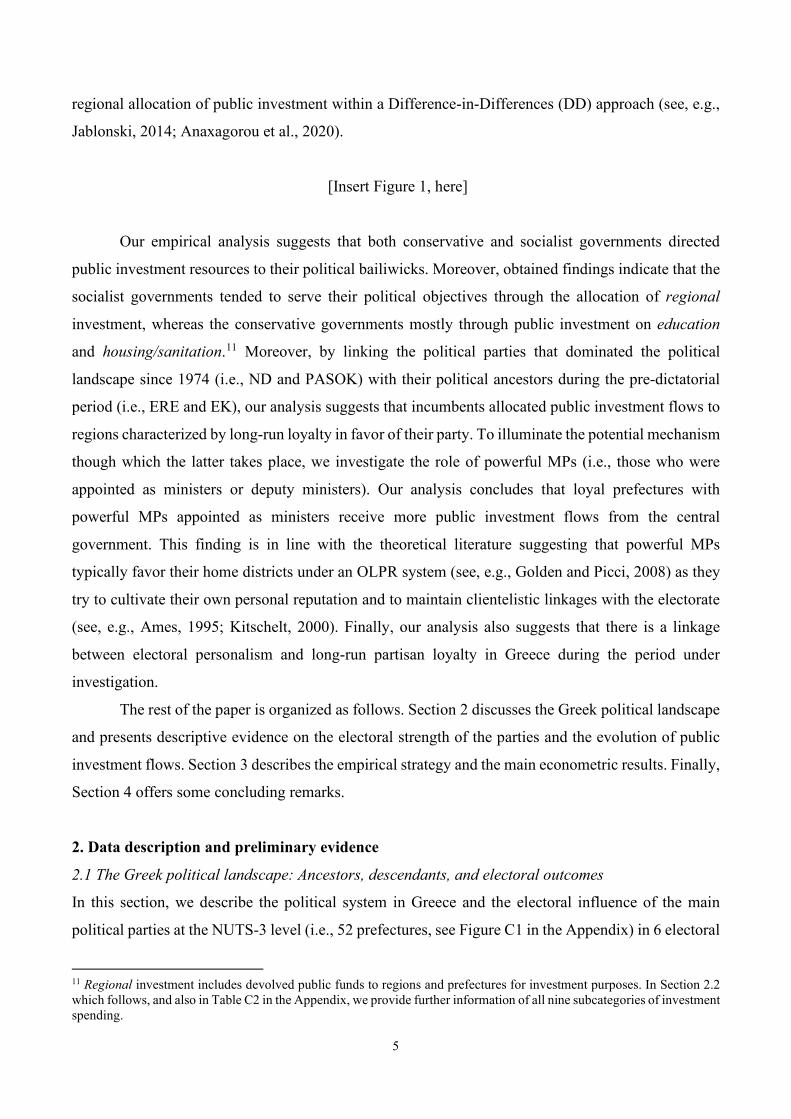
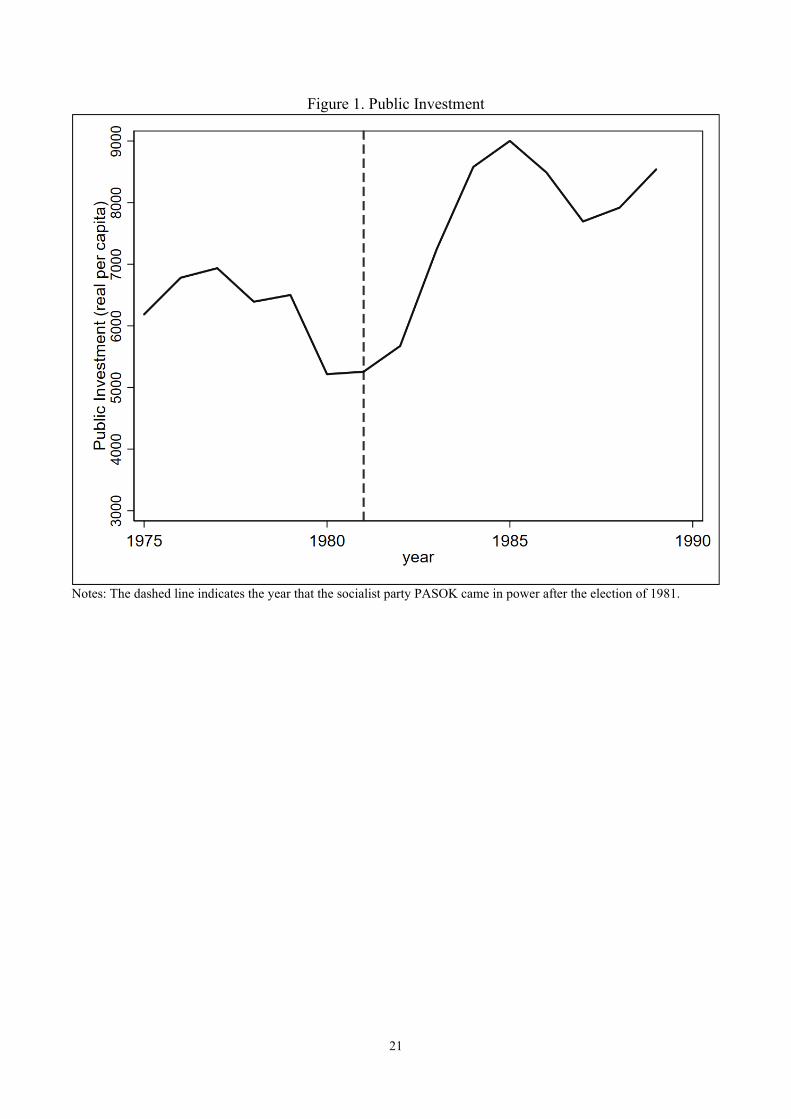
margin). We calculate these shares relative to the entire voting-eligible population.16 Figure 2 maps
the voting margin of ND and PASOK after their first electoral wins in the elections of 1974 and 1981,
respectively. As can be seen in Panel A, areas in Northern Greece like Serres, the place of origin of
Konstantinos Karamanlis voted strongly in favor of ND. In contrast, it is apparent in Panel B that
prefectures such as the Crete Island and Achaia - the place of origin of Andreas Papandreou - are
political strongholds of PASOK. Explicit definitions, descriptive statistics and sources of the variables
employed throughout the analysis are provided in Table C2 in the Appendix.
[Insert Figure 2, here]
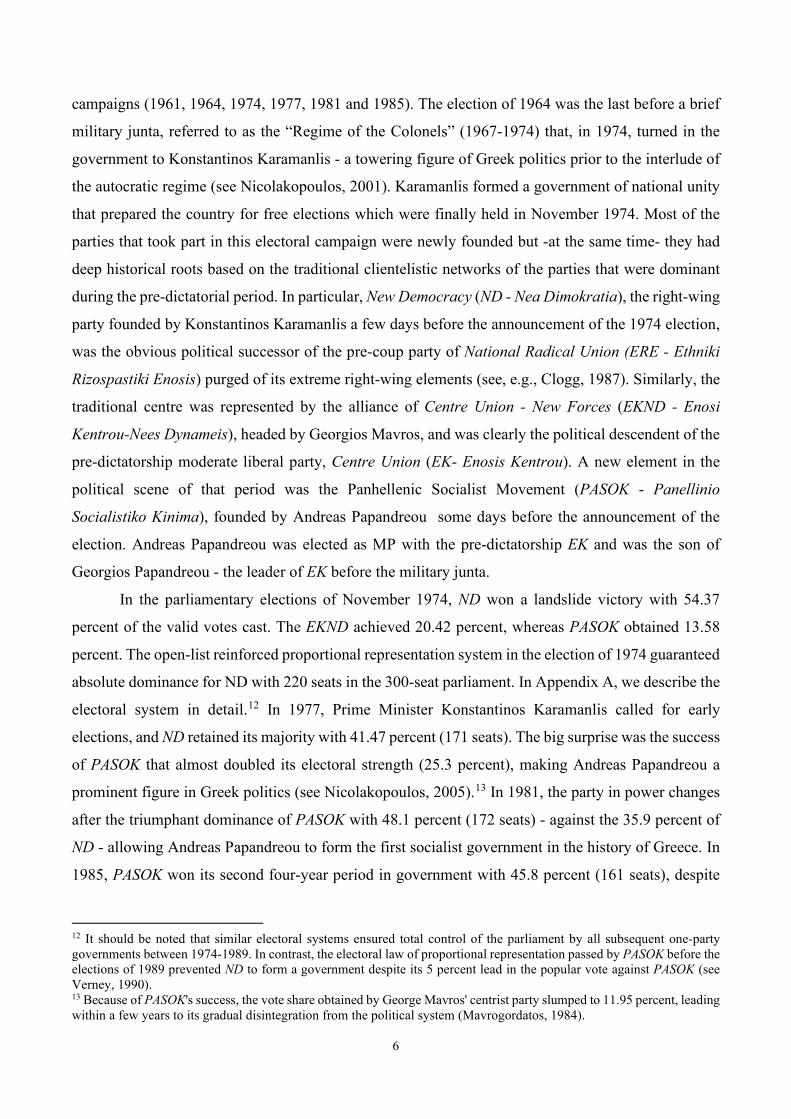
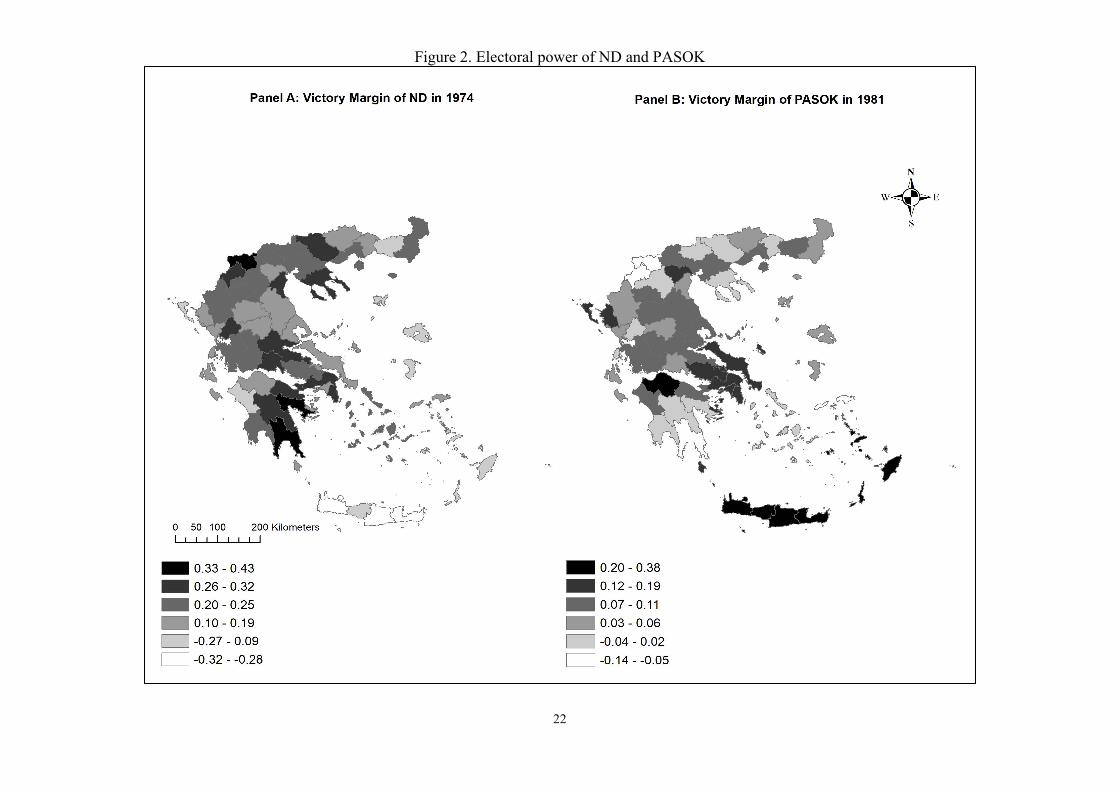
To provide some evidence for the long-run partisan loyalty in Greek prefectures, Figure 3 plots the
victory margin of ERE (EK) after its last electoral victory in the pre-dictatorial period in 1961 (1964)
against the victory margin of ND (PASOK) in its first post-dictatorial victory in 1974 (1981). The
correlation of electoral influence between the two right-wing parties in the upper part of Figure 3 is
80.65 percent leaving no doubt that ND is the political successor of the pre-coup party ERE. Regarding
the relationship between PASOK and EK, a number of scholars contends that PASOK cannot be
considered as the lineal descendant of the pre-coup centrist party, mostly because of its more radical
political agenda and the extensive renewal of ideas and practices which brought to the Greek political
arena (see Elephantis, 1981; Lyrintzis, 1984). Others have placed the political origins of PASOK firmly
14 Specifically, we forward prefecture level electoral results up to (and including) the year of the next general election (see, e.g., Jablonski, 2014). For instance, we forward the election results of 1974 up to (and including) the next election year of 1977. In addition, we restrict our dataset after 1975 because this is the first year that the incumbent party of ND had discretion over fiscal policy after its victory in the election held in November 1974. 15 The reason for this differentiation is that during 1982-1989 we have a dominant opposition party (ND), while between 1974-1981 the centrist party EKND and PASOK alter in the second and third place with the summation of their strength close to 35 percent. More importantly, as explained below, PASOK absorbed the majority of EKND supporters in the transition of its growing influence. 16 We opt for this measurement since it allows us to better account for endogenous turnout (see Spenkuch and Tillmann, 2018). However, in the Appendix, we also report empirical results using the voting shares relative to valid votes cast. Our main conclusions remain unaffected.
8
in the traditional centre (see, e.g., Mavrogordatos, 1983b); a view that is also in line with more recent
studies suggesting that the political power of PASOK was basically based on the pre-dictatorship
interpersonal patronage networks of the EK (see, e.g., Pappas, 2009a; 2009b).17 As a result, the
majority of the centrist supporters turned to PASOK in the transition period of its growing influence,
whereas eventually the centrist party was absorbed by PASOK in the election of 1985 (see
Mavrogordatos, 1984; Nicolakopoulos, 2005). The correlation of 81.39 percent between the victory
margins of the centrist pre-dictatorship party EK and the left-wing post-dictatorship party PASOK
strongly supports the latter approach. Taking into account this evidence, our aim is to investigate if
there exists some sort of a political bias in the allocation of public investment related to the deep
historical roots of PASOK and ND in the Greek territory. To this end, we also construct the variable
historical victory margin that takes into account the victory margins of ERE and EK in 1961 and 1964,
for the years that ND and PASOK were in power between 1974-1981 and 1982-1989, respectively.
[Insert Figure 3, here]
2.2. Public investment data
To investigate whether public investment policies by ND and PASOK governments served solely
developmental needs or they were also influenced by pork-barrel politics, we construct the following
variables (all expressed in per capita Drachmas at 1980 prices). First, our main dependent variable is
the total public investment disbursements (total) - under the Greek Public Investment Programme (PIP)
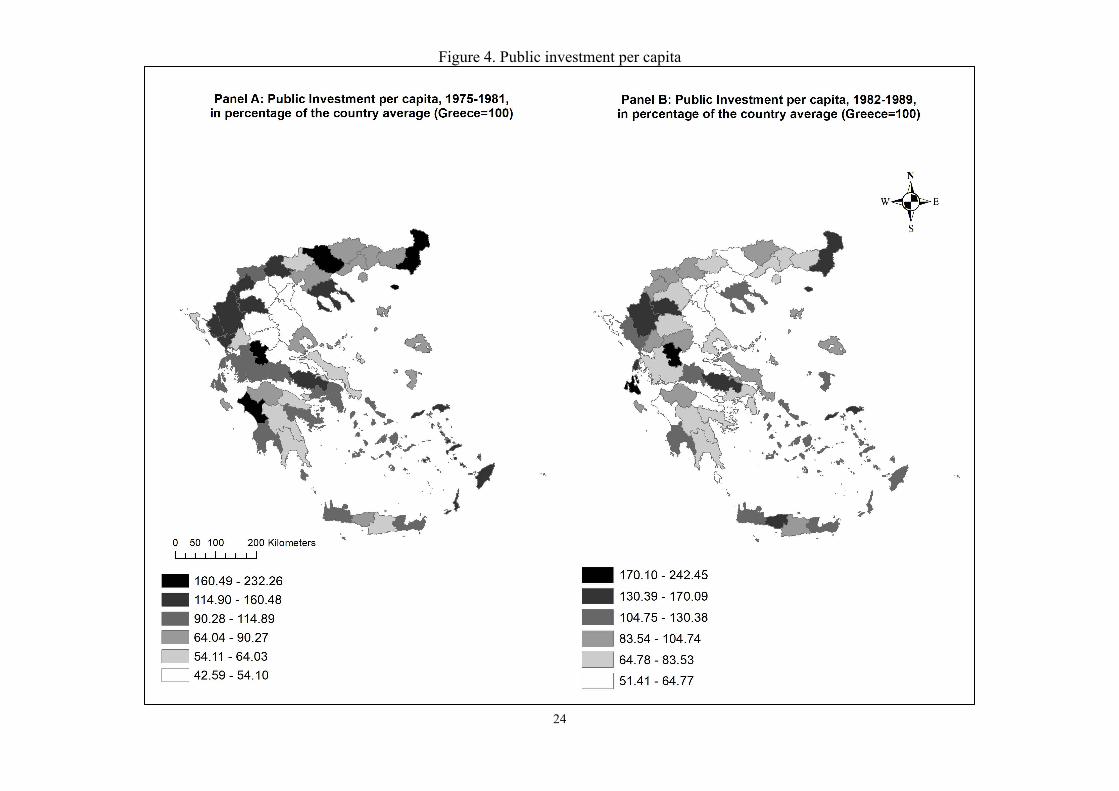
- across all sectors of the economy that are regionally identified at the NUTS-3 level.18 Figure 4 shows
the spatial distribution of total investment for the sub-periods 1975-1981 and 1982-1989 -in per
country percentage and sub-period average- that ND and PASOK were in office, respectively. Both
figures below indicate a significant change in the distribution of investment projects between the terms
of ND and PASOK. For instance, Northern Greece, where ND is more powerful, absorbs less funds on
average during PASOK’s administration. Serres, a stronghold of ND in this region, receives investment
17 Pappas (2009a; 2009b) contends that the MPs elected with PASOK in both 1974 and 1977 elections had not only political origins but also extensive electoral clienteles from pre-dictatorship EK. More precisely, he provides evidence that nine of the fifteen PASOK MPs in 1974 had sought elections under the banner of pre-dictatorship EK (e.g., Papandreou, Alevras). Another two (Akrita and Vgenopoulos) were family relatives of former EK parliamentarians from whom they inherited large electoral clienteles. The remaining four of the 1974 MPs (Kaklamanis, Koutsogiorgas, Skoularikis, Psarakis) had also been members of the EK but had not run as party candidates in elections before 1974. 18 The PIP includes information that distinguishes the policy purpose of the investment (e.g., education) and the amount of investment committed to a specific geographical location. Total public investment fluctuated around the value of 4 percent of GDP during ND’s term in office, whereas this figure increased (on average) by one percent when PASOK came in power. We can identify that each fiscal year around 60 percent of this budget is targeted to a specific NUTS-3 region. The remaining 40 percent concerns more general funds ‘targeted’ at the NUTS-2 level and above (see also Monastiriotis and Psycharis, 2011).
9
flows 86 percent above Greece’s average between 1975-1981, which drops 43 percent below Greece’s
average during PASOK’s term in office. On the contrary, we observe that strongholds of PASOK in
the Crete Island (e.g., Rethymno) experience remarkable increases in investment funds from 1982 to
1989. Overall, this is a first indication that the distribution of investment projects can be affected by
political motivations.
[Insert Figure 4, here]
Second, our dataset decomposes total investment to nine broad subcategories: (i) regional
investment that includes devolved public funds to regions and prefectures for investment purposes; (ii)
transportation investment; (iii) education investment; (iv) primary sector investment; (v) industrial
investment; (vi) housing and sanitation investment; (vii) health and public welfare investment; (viii)
culture and administration investment; (ix) other investment which includes funds not elsewhere
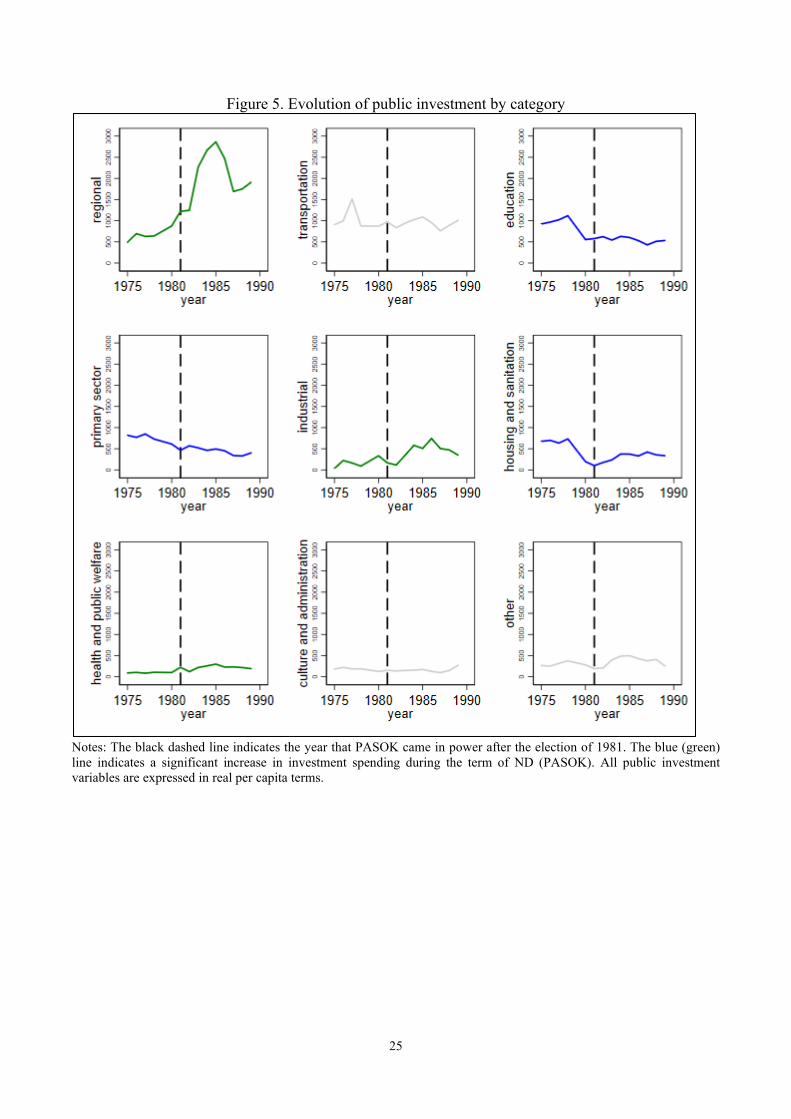
classified.19 Figure 5 shows the evolution of these investment categories expressed in real per capita
terms. The figures presented with a blue (green) line indicate higher level during ND’s (PASOK’s)
administration between 1975-1981 (1982-1989), whereas the grey line indicates no significant change
before and after 1981. Regional investment seems to be the main driving force of the increase in total
investment during PASOK’s term. This category includes funds that complement main investment
flows in various sector of the economy like health, education or agriculture. The reason we observe
this significant inflation after 1982 is that prefecture authorities (appointed by the central government)
were given higher discretion in fund management and more responsibilities within sectors. In that way,
PASOK established a powerful “decentralized” network of local “bosses” that could identify more
easily the demands of the local society which, to a great extent, are aligned with the interests of the
party. Other categories that seem to increase between 1982-1989, though at a more moderate level,
include industrial and health and public welfare investments. The latter is driven by the creation of a
national health service system in 1983, an ambitious social reform of the PASOK government. This
allowed the mass recruitment of doctors and initiated a programme of building hospitals and health
centres (see, e.g., Guillen and Matsaganis, 2000). It should be noted that big projects of this expansion
(e.g., hospitals) were covered by health investment, whereas more localised goods by regional
investment. When ND was in office, educational, primary sector and housing and sanitation
investments appear higher, especially during its first term. Educational investment was the most
19 Observations for investment flows by type (e.g., regional) are fewer since the regional fiscal account of 1979 was missing from the collection of the Ministry of Economy and Development.
10
prominent category during ND’s term accompanied by a significant reform in 1976 aiming at the
expansion of the educational system (see Kazamias, 1978). The total reformation of the educational
system was seen by the political system as a priority that could promote the re-introduction of
parliamentary legitimacy in a new democracy with the consent of the lower classes (see Frangoudakis,
1981).
[Insert Figure 5, here]
It should be noted that the geographical allocation of public investment in Greece during this
period is not based on any particular formula. This fact makes funding vulnerable to political
manipulation (see Rodriguez-Pose et al., 2016a). Overall, the preliminary evidence - so far - seems to
suggest that the two political parties had different priorities concerning the spatial distribution of public
investment’s funds, as well as distinct preferences with respect to the policy purpose of these funds.
In the next section, we seek to investigate in a more formal way whether these different priorities came
as a result of pork-barrel politics. In particular, we seek to explore whether long-run partisan loyalty
is critical (see Case, 2001; Larcinese et al., 2006; Joanis, 2011), and whether loyalty works through
powerful MPs who attempt to maintain their influence in an OLPR voting system (see Golden and
Picci, 2008).
3. Empirical Analysis
3.1 Fixed effects regressions
To estimate the association between political support and public investment, we begin by estimating a
prefecture-level fixed-effects model for the total flows that are allocated within the Greek territory:
𝑡𝑡𝑡𝑡𝑡𝑡𝑡𝑡𝑡𝑡𝑖𝑖𝑖𝑖 = 𝛼𝛼0 + 𝛼𝛼1𝑝𝑝𝑡𝑡𝑡𝑡𝑝𝑝𝑡𝑡𝑝𝑝𝑝𝑝𝑡𝑡𝑡𝑡 𝑠𝑠𝑠𝑠𝑝𝑝𝑝𝑝𝑡𝑡𝑜𝑜𝑡𝑡𝑖𝑖𝑖𝑖−1 + 𝛽𝛽𝑋𝑋𝑖𝑖𝑖𝑖 + 𝛿𝛿𝑖𝑖 + 𝛾𝛾𝑖𝑖 + 𝜀𝜀𝑖𝑖𝑖𝑖 (1)
where 𝑡𝑡𝑡𝑡𝑡𝑡𝑡𝑡𝑡𝑡𝑖𝑖𝑖𝑖 denotes the natural logarithm of real per capita total public investment in prefecture i at
time t; 𝑝𝑝𝑡𝑡𝑡𝑡𝑝𝑝𝑡𝑡𝑝𝑝𝑝𝑝𝑡𝑡𝑡𝑡 𝑠𝑠𝑠𝑠𝑝𝑝𝑝𝑝𝑡𝑡𝑜𝑜𝑡𝑡𝑖𝑖𝑖𝑖−1 is measured by the variables incumbent share, opposition share, victory
margin and historical victory margin in prefecture i in the last election; 𝑋𝑋𝑖𝑖𝑖𝑖 is a vector of control
variables that includes population density; the share of households with access to electricity (electricity
access); and, the share of individuals employed in the agricultural sector (agricultural share). These
variables are intended to capture the effect of urbanisation, prosperity and development that are
expected to affect the allocation of public investment (see Joanis, 2011; Solé-Ollé, 2013). The model
11
also includes prefecture, δi, and year fixed effects, γt, to control for time-invariant prefecture
characteristics and shocks common to all prefectures. Finally, 𝜀𝜀𝑖𝑖𝑖𝑖 is the error term clustered at the
prefecture i level. If regions with core supporters of the incumbent in an OLPR electoral system receive
more investment flows, the coefficient on incumbent share (opposition share) must have a positive
(negative) sign, which, in turn, will result in a positive coefficient on victory margin. Moreover, if
intertemporal party strength is critical, we would expect that the variable historical victory margin will
also be positively correlated with total investment flows.
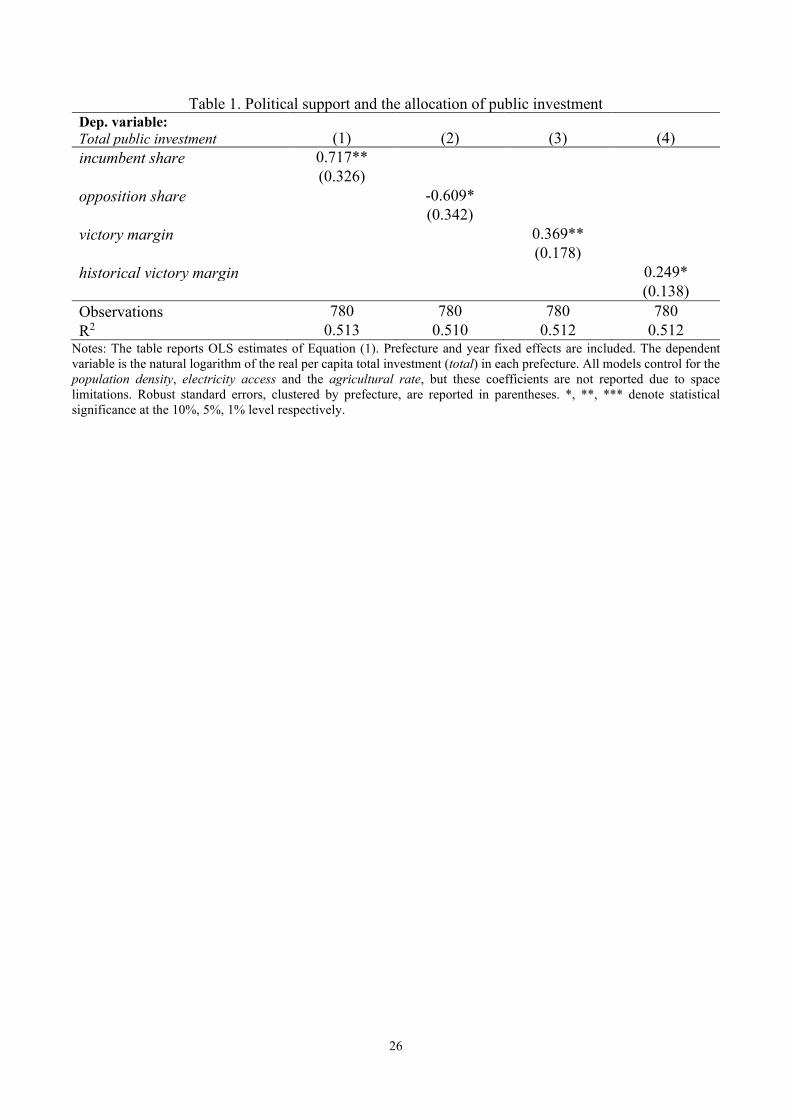
Table 1 displays our first empirical results. We can notice that the coefficient on incumbent
share (opposition share) has the expected positive (negative) sign and it is statistically significant at
the 5 (10) percent confidence level. These coefficients produce, in turn, a positive and highly
significant impact of victory margin on the allocation of public investment. Qualitatively, the estimates
in column (3) suggest that prefectures with the highest value of victory margin receive, on average, 27
percent more public investment funds compared to prefectures with the lowest value. In column (4),
we use instead the historical victory margin of the political ancestors of PASOK and ND. As it can be
seen, the coefficient is positive and statistically significant at the 10 percent level, supporting the
possibility that deep roots of political support affect the contemporary allocation of investment flows
by incumbent parties. In the Appendix, we re-estimate these models using political support variables
as shares of valid votes cast, and testing for outlier observations. As can be seen in Tables C3-C4 in
the Appendix, the relationship between contemporary and historical political support and total public
investment remains intact.
[Insert Table 1, here]
3.2 Difference-in-Differences (DD) approach
3.2.1 Empirical specification
Next, we exploit the political change that occurred in 1981 as a source of exogenous variation in the
distribution of political support within the Greek territory, employing a DD specification that allows
us to move closer to a causal interpretation. To get as much information as possible, we add in the
estimations public investment by type (e.g., education). The DD specification allows us to explore
whether there are ND or PASOK specific interactions driving the allocation of public investment takes
the following form (see, e.g., Jablonski, 2014; Anaxagorou et al., 2020):
𝑝𝑝𝑖𝑖𝑖𝑖𝑖𝑖𝑠𝑠𝑡𝑡𝑖𝑖𝑖𝑖𝑖𝑖𝑡𝑡𝑖𝑖𝑖𝑖 = 𝛼𝛼0 + 𝛼𝛼1𝑝𝑝𝑡𝑡𝑜𝑜𝑡𝑡𝑝𝑝𝑖𝑖 · 𝑖𝑖𝑝𝑝𝑝𝑝𝑡𝑡𝑡𝑡𝑜𝑜𝑝𝑝 𝑖𝑖𝑡𝑡𝑜𝑜𝑚𝑚𝑝𝑝𝑖𝑖𝑖𝑖 + 𝛽𝛽𝑋𝑋𝑖𝑖𝑖𝑖 + 𝛿𝛿𝑖𝑖 + 𝛾𝛾𝑖𝑖 + 𝜀𝜀𝑖𝑖𝑖𝑖 (2)
12
where 𝑝𝑝𝑖𝑖𝑖𝑖𝑖𝑖𝑠𝑠𝑡𝑡𝑖𝑖𝑖𝑖𝑖𝑖𝑡𝑡𝑖𝑖𝑖𝑖 is the natural logarithm of total, or by-type, real per-capita investment in
prefecture i at time t.20 The variable 𝑝𝑝𝑡𝑡𝑜𝑜𝑡𝑡𝑝𝑝𝑖𝑖 is an indicator variable which takes the value of one in
years greater than or equal to 1982, and zero otherwise, when PASOK is in power (PASOKt), whereas
its values are reversed when we estimate the effect of the ND regime (NDt). In addition, when PASOKt
(NDt) is interacted with 𝑖𝑖𝑝𝑝𝑝𝑝𝑡𝑡𝑡𝑡𝑜𝑜𝑝𝑝 𝑖𝑖𝑡𝑡𝑜𝑜𝑚𝑚𝑝𝑝𝑖𝑖𝑖𝑖, the latter takes values of the victory margin of PASOK
(ND) in the election of 1981 (1974) , the 𝑖𝑖𝑝𝑝𝑝𝑝𝑡𝑡𝑡𝑡𝑜𝑜𝑝𝑝 𝑖𝑖𝑡𝑡𝑜𝑜𝑚𝑚𝑝𝑝𝑖𝑖1981 (𝑖𝑖𝑝𝑝𝑝𝑝𝑡𝑡𝑡𝑡𝑜𝑜𝑝𝑝 𝑖𝑖𝑡𝑡𝑜𝑜𝑚𝑚𝑝𝑝𝑖𝑖1974). This method
builds on the idea that PASOK's (ND’s) political support should only affect investment distribution
during 1982-1989 (1975-1981) when the party is in power. Thus, by subtracting the effect of victory
margin during the PASOK (ND) regime from the effect during the ND (PASOK) regime, 𝛼𝛼1 provides
a reasonable estimate of the extent to which each party shaped Greece’s investment portfolio within
the Greek territory. We prefer fixed measures to estimate the effect of the two parties - 1981 (1974)
victory margin of PASOK (ND) - since it is less likely to be endogenous to investment trends than a
voting share that changes over time (see, e.g., Carruthers and Wanamaker, 2015). Of course, even
fixed voting shares across prefectures are not exogenously assigned and can be correlated with
potential confounders. To mitigate this issue, as in the previous section, our estimations include
prefecture (δi) and year fixed effects (𝛾𝛾𝑖𝑖). Moreover, covariates in vector 𝑋𝑋𝑖𝑖𝑖𝑖, as discussed above, are
employed to control for important time-variant factors that could still confound these estimates.
Finally, 𝜀𝜀𝑖𝑖𝑖𝑖 is the error term clustered at the prefecture i level.
3.2.2 Results
Our priority in this section is to explore the possibility that political motivation is one of the driving
forces behind the inflated PIP (see Figure 1). Thus, we start our DD analysis focusing on the effect of
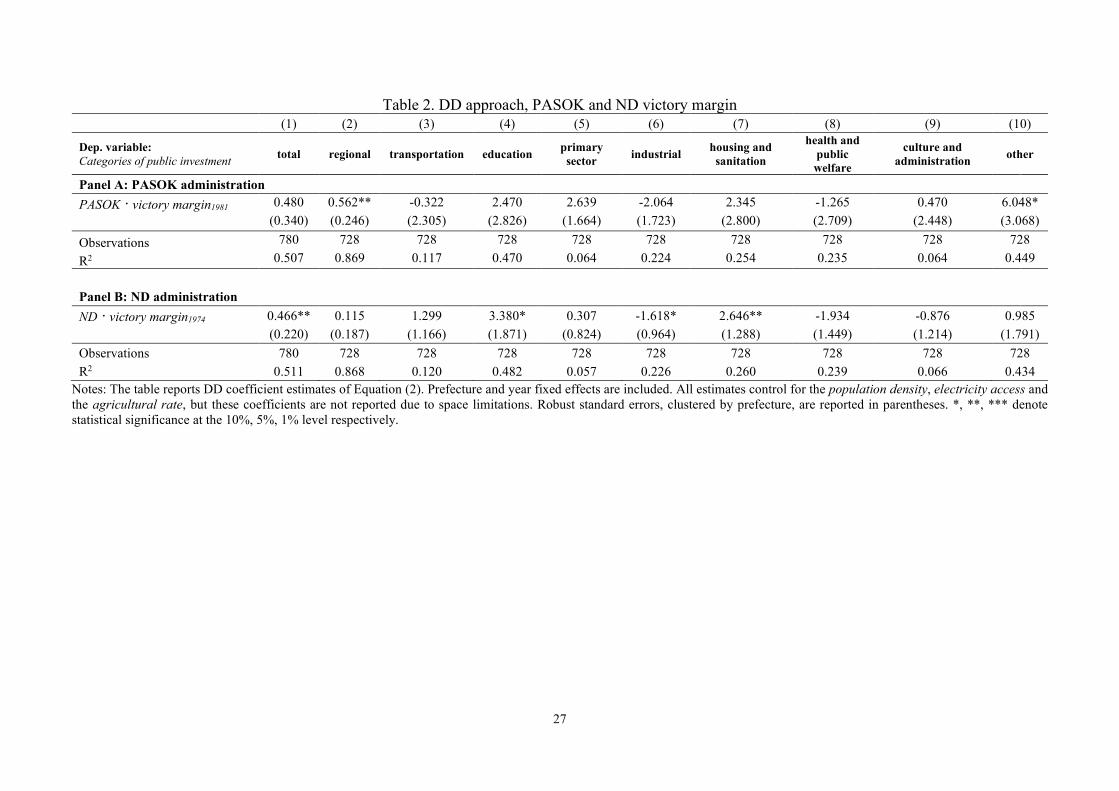
the PASOK administration. As can be seen in Panel A of Table 2, the DD coefficient (PASOK ·victory
margin1981) is positive and statistically significant, in columns (2) and (10), when related to the
variables regional and other investment, respectively. Related to the evidence provided in Figure 5,
regional investment is the main investment category that drives the increase of total public investment
between 1982-1989, which in turn, according to the DD analysis, seems to be directed more intensively
in areas where the victory margin of PASOK is higher. As already discussed, after 1982, appointed
prefecture authorities had the autonomy to demand investment funds from the central government.
Also, within this context, they were vested with more sectoral responsibilities allowing them to identify
and channel more resources according to the demands of the local society which, to a great extent, can
be aligned with the priorities of the party. In column (1), the coefficient in the specification of total
20 To avoid taking the log of zero for some investment by type variables, we added the value of 1 before taking logarithms.
13
public investment is very close to that reported in column (2) for regional investment, but more noisy
and marginally insignificant. In the Appendix, and more specifically in Table C5, we present three
modifications of the above empirical specification by splitting the DD coefficient in two sub-periods
(1982-1985 and 1986-1989), by restricting the sample between 1978-1985, and testing for the parallel
trend hypothesis. Overall, the empirical evidence seems to verify that regional investment was a
significant instrument of PASOK administration to target its core supporters.
[Insert Table 2, here]
Next, in Panel B of Table 2, we estimate Equation (2) for the ND regime. As can be seen in
column (1), the DD coefficient of ND · victory margin1974 is positive and statistically significant when
related to the total public investment. Interestingly, this change seems to be driven by increases in
education and housing and sanitation investments that, according to Figure 5, are two of the most
prevalent investment categories during the first term of ND in power (i.e., 1975-1977). In Table C6 in
the Appendix, we provide two additional tests of these results by splitting this effect in two sub-periods
(1975-1977 and 1978-1981), and by restricting the sample between 1978-1985 - as is in Panels A and
B of Table C5.21 These results indicate a significant political bias which is more prevalent during the
first years of the establishment of the democratic regime in 1974; which coincides with the first term
of ND in power. One could argue that the conservative party was increasing investment flows in an
attempt to convince the citizenry in a newly established regime that “democracy works” and, therefore,
to mitigate the risk of a democratic regime’s collapse (see, e.g., Linz and Stepan, 1996; Brender and
Drazen, 2007; Kammas and Sarantides, 2016 for more details on this). However, this argument does
not explain the reasons why the increased investment flows were directed in prefectures with more
supporters of the incumbent party.
3.2.3 Long-run partisan loyalty
So far, our empirical findings suggest that both the conservative and the socialistic governments
directed resources to areas of their core supporters. Our next step is to investigate whether, beyond the
results of the previous election, long-run partisan loyalty is also critical for the geographical allocation
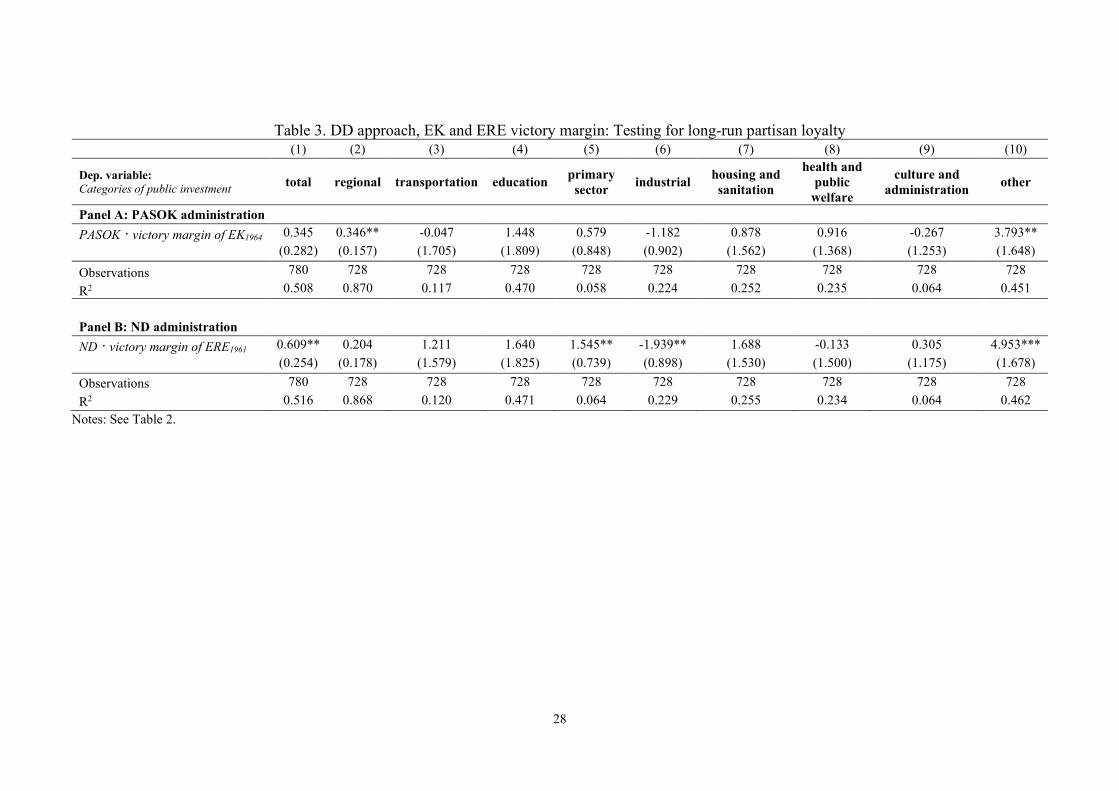
of public investment (see Joanis, 2011). To this end, in Panel A of Table 3, we re-estimate Equation
(2) by replacing the victory margin of PASOK (victory margin1981) with the victory margin of its
21 We do not test the hypothesis of pre-existing trends in the case of ND (as in Panel C of Table C5) since its terms are ahead of PASOK’s administration.
14
political ancestor, EK, after its last electoral victory in the pre-dictatorial period in 1964 (victory
margin EK1964). Following the same rationale, in Panel B of Table 3, the victory margin of ND (victory
margin1974) is replaced with the victory margin of its political ancestor, ERE, after its last electoral
victory in the pre-dictatorial period in 1961 (victory margin ERE1961).
As can be seen in Panel A, the DD coefficient of PASOK · victory margin EK1964, reported in
column (2), is positive and statistically significant at the 5% level when related to the variable regional
investment. Together with our results in Table 2, we see that PASOK administration directs regional
investment funds to core supporters who, at the same time, show long-run loyalty to the centre-left
political spectrum. In column (1) of Panel B, we see that the DD coefficient of ND · victory margin
ERE1961 is positive and statistically significant at the 5% level when related to the variable total public
investment. Therefore, total public investment seems to be directed to the most loyal prefectures of
the right-wing party.
In Tables C7 and C8 in the Appendix, we repeat the same robustness checks introduced in the
previous section. The results remain unaffected and, interestingly, appear to be less noisy when
compared to the estimates in Tables C5 and C6. For instance, comparing Panel A of Tables C5 and
C7, we see that the DD coefficients of the ancestor party of PASOK are statistically significant in both
cases using the regional investment; see column (2). Furthermore, comparing Panel B of Tables C6
and C8, we see that the DD coefficient in the specification using the total investment is significant
only for the ancestor party of ND; see column (1). Overall, this evidence suggests that long-run partisan
loyalty is crucial when political parties in Greece make decisions on the spatial allocation of investment
funds.
[Insert Table 3, here]
3.3 The key role of politically powerful MPs
Finally, in this section, we seek to investigate the potential mechanism through which the political bias
and the long-run loyalty effects in the allocation of investment funds, as analyzed in the previous
section, occur. Following the rationale developed by Golden and Picci (2008), in an OLPR system,
MPs from the same party compete against each other in search for individual votes. As a result, it is
expected that powerful MPs will direct resources to their home districts in an attempt to get re-elected.
To investigate whether the ultimate driving force behind pork-barrel politics in Greece is, indeed, the
existence of powerful MPs, we employ data from Tziovaras and Chiotis (2006) and construct a dummy
variable, ministers, that equals to one when an appointed minister (or deputy minister) of the
government is elected in prefecture i and year t, and zero otherwise. The idea behind this is that we
15
expect prominent and popular MPs of both parties to be assigned in ministerial positions, whereas, at
the same time, these positions offer them discretion over the allocation of investment funds to benefit
their home districts. It should be noted that simple Logit estimates, reported in Table C9 in the
Appendix, indicate a positive correlation between electoral strength and the probability to have a
powerful MP as minister. Our first empirical specification in this section takes the following form:
𝑡𝑡𝑡𝑡𝑡𝑡𝑡𝑡𝑡𝑡𝑖𝑖𝑖𝑖 = 𝛼𝛼0 + 𝛼𝛼0 + 𝛼𝛼1𝑖𝑖𝑝𝑝𝑝𝑝𝑡𝑡𝑡𝑡𝑜𝑜𝑝𝑝 𝑖𝑖𝑡𝑡𝑜𝑜𝑚𝑚𝑝𝑝𝑖𝑖𝑖𝑖𝑖𝑖 + 𝛼𝛼2𝑖𝑖𝑝𝑝𝑖𝑖𝑝𝑝𝑠𝑠𝑡𝑡𝑖𝑖𝑜𝑜𝑠𝑠𝑖𝑖𝑖𝑖 + 𝛼𝛼3𝑖𝑖𝑝𝑝𝑝𝑝𝑡𝑡𝑡𝑡𝑜𝑜𝑝𝑝 𝑖𝑖𝑡𝑡𝑜𝑜𝑚𝑚𝑝𝑝𝑖𝑖𝑖𝑖𝑖𝑖 ·
𝑖𝑖𝑝𝑝𝑖𝑖𝑝𝑝𝑠𝑠𝑡𝑡𝑖𝑖𝑜𝑜𝑠𝑠𝑖𝑖𝑖𝑖 + 𝛽𝛽𝑋𝑋𝑖𝑖𝑖𝑖 + 𝛿𝛿𝑖𝑖 + 𝛾𝛾𝑖𝑖 + 𝜀𝜀𝑖𝑖𝑖𝑖 (3)
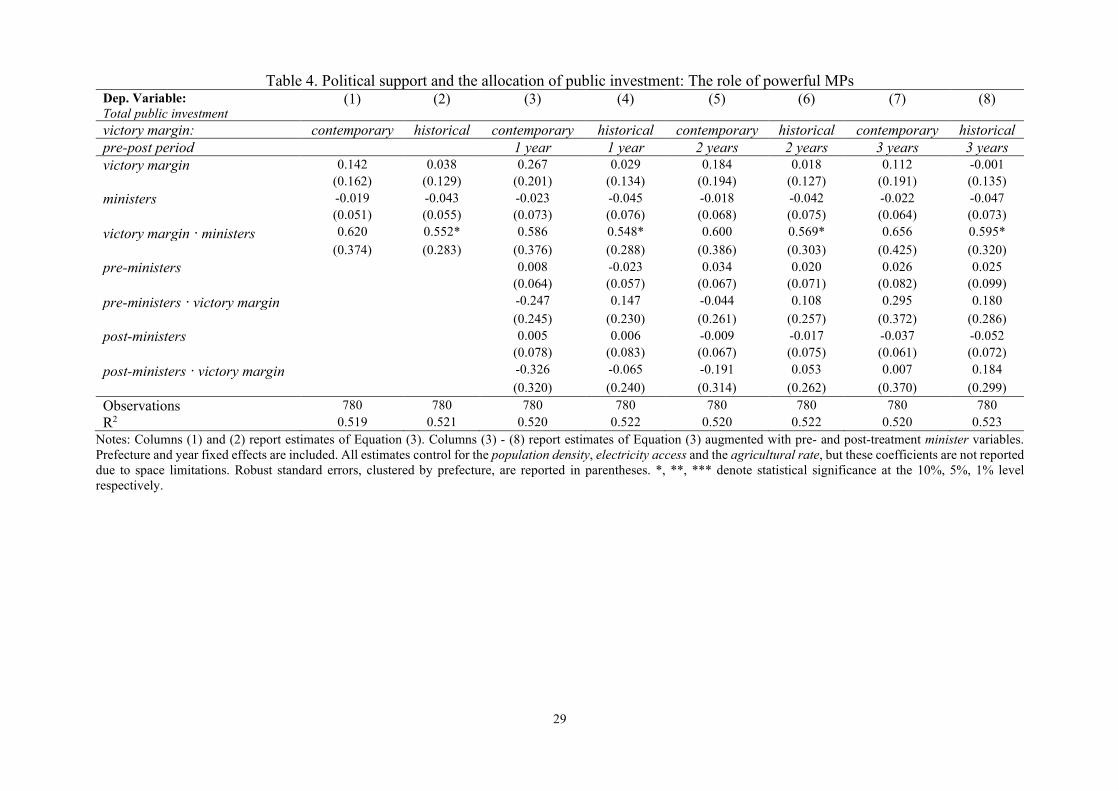
As it can be seen, Equation (3) is an augmented version of Equation (1) which includes the variable
ministers and the interaction term victory margin · ministers. It should be noted that, we experiment
both with contemporary and historical victory margins. The rest of the variables remain the same as in
the previous analysis. In column (2) of Table 4, we see that, interestingly, only the interaction term
which includes the historical victory margin and the ministers is positive and statistically significant.
This is consistent with our expectations that loyal prefectures receive more public investment when
they have powerful MPs as ministers, since the latter attempt to support their patron-client linkages in
order to increase their re-election prospects in an OLPR system.
To alleviate potential endogeneity concerns, we go one step further and control for the years
before and after a prefecture has an elected MP appointed as minister. The idea here is that prefectures
which will have ministers in the future, or used to have ministers in the past, should exhibit the same
underlying traits, in these pre- and post-treatment years, as in the years when they actually have
ministers (see, e.g., De Luca et al., 2018). Statistically significant coefficients on the pre- and post-
treatment variables would indicate the presence of omitted variable bias and would cast doubt on our
interpretation that prefectures receive more investment only when loyal prefectures have powerful
MPs as ministers. We start with one year before and one year after a prefecture has a minister and,
then, extend the time frame to two and three year periods so as to increase the number of available
placebo events. As can be seen in columns (3)-(8) of Table 4, the pre- and post-treatment variables fail
to reach statistical significance. Moreover, consistent with our expectations, the effect of loyal
prefectures with ministers reported in columns (4), (6) and (8) remains intact.
[Insert Table 4, here]
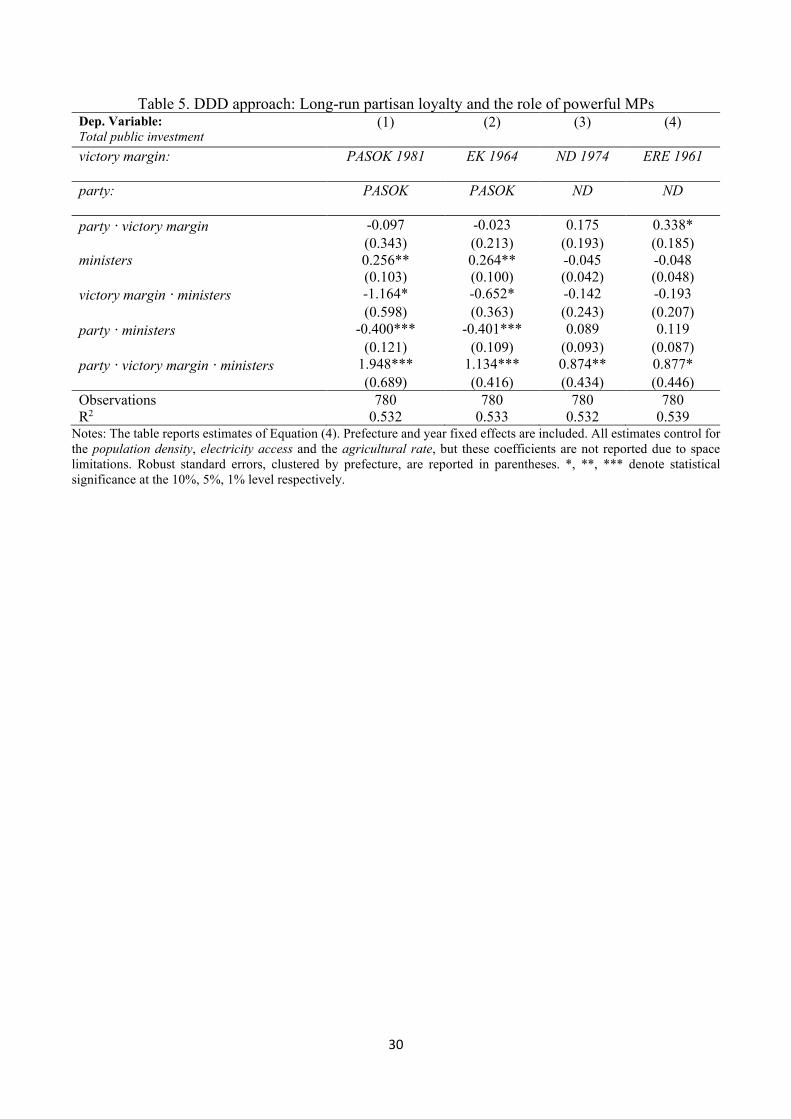
Finally, we modify Equation (2) to the following Difference-in-Difference-in-Difference (DDD)
specification:
16
𝑡𝑡𝑡𝑡𝑡𝑡𝑡𝑡𝑡𝑡𝑖𝑖𝑖𝑖 = 𝛼𝛼0 + 𝛼𝛼1𝑝𝑝𝑡𝑡𝑜𝑜𝑡𝑡𝑝𝑝𝑖𝑖 · 𝑖𝑖𝑝𝑝𝑝𝑝𝑡𝑡𝑡𝑡𝑜𝑜𝑝𝑝 𝑖𝑖𝑡𝑡𝑜𝑜𝑚𝑚𝑝𝑝𝑖𝑖𝑖𝑖 + 𝛼𝛼2𝑖𝑖𝑝𝑝𝑖𝑖𝑝𝑝𝑠𝑠𝑡𝑡𝑖𝑖𝑜𝑜𝑠𝑠𝑖𝑖𝑖𝑖 + 𝛼𝛼3𝑖𝑖𝑝𝑝𝑝𝑝𝑡𝑡𝑡𝑡𝑜𝑜𝑝𝑝 𝑖𝑖𝑡𝑡𝑜𝑜𝑚𝑚𝑝𝑝𝑖𝑖𝑖𝑖 ·
𝑖𝑖𝑝𝑝𝑖𝑖𝑝𝑝𝑠𝑠𝑡𝑡𝑖𝑖𝑜𝑜𝑠𝑠𝑖𝑖𝑖𝑖 + 𝛼𝛼4𝑝𝑝𝑡𝑡𝑜𝑜𝑡𝑡𝑝𝑝𝑖𝑖 · 𝑖𝑖𝑝𝑝𝑖𝑖𝑝𝑝𝑠𝑠𝑡𝑡𝑖𝑖𝑜𝑜𝑠𝑠𝑖𝑖𝑖𝑖 + 𝛼𝛼5𝑝𝑝𝑡𝑡𝑜𝑜𝑡𝑡𝑝𝑝𝑖𝑖 · 𝑖𝑖𝑝𝑝𝑝𝑝𝑡𝑡𝑡𝑡𝑜𝑜𝑝𝑝 𝑖𝑖𝑡𝑡𝑜𝑜𝑚𝑚𝑝𝑝𝑖𝑖𝑖𝑖 · 𝑖𝑖𝑝𝑝𝑖𝑖𝑝𝑝𝑠𝑠𝑡𝑡𝑖𝑖𝑜𝑜𝑠𝑠𝑖𝑖𝑖𝑖 + 𝛽𝛽𝑋𝑋𝑖𝑖𝑖𝑖 +
𝛿𝛿𝑖𝑖 + 𝛾𝛾𝑖𝑖 + 𝜀𝜀𝑖𝑖𝑖𝑖 (4)
The coefficient of interest here is α5 that switches on loyalty when a party is in power that has assigned
from a prefecture an elected (deputy) minister. Columns (1) and (2) of Table 5 report the DDD
specification when PASOK is in power, whereas columns (3) and (4) provide similar estimates during
the governance of ND. In all cases, we see that the DDD coefficients are positive and statistically
significant. The above findings suggest that long-run partisan loyalty establishes strong MPs in the
governing party which, in turn, allocate more resources to their home prefectures. It is important to
highlight that we cannot conclusively exclude other ways to proxy powerful MPs. However, we
suggest that ministerial positions is a prime candidate for the channel through which loyalty causes
pork-barrel politics in Greece.
[Insert Table 5, here]
4. Conclusions
At the beginning of the post-dictatorial period (starting in 1974), the Greek economy was characterized
by a public debt of less than 20 percent of GDP, whereas in the late 1980’s the public debt was
exceeding 100 percent of GDP (see, e.g., Meghir et al., 2017). The stylized fact of this severe fiscal
destabilization during that period -which proved to be also the starting point of a malicious cycle that
has been haunting the Greek economy ever since- calls for a detailed analysis of the institutional and
political framework that produced these economic outcomes.
The paper at hand builds on the literature of electoral personalism in OLPR systems (see, e.g.,
Mershon, 2020, for a recent review) and long-run partisan loyalty (see, e.g., Joanis, 2011) and
investigates potential political incentives behind the geographical allocation of public investment in
Greece from 1974 to 1989. Using a novel dataset of disaggregated public investment categories for 52
prefectures (NUTS-3), our analysis provides evidence that incumbents in Greece were systematically
directing public resources to their political strongholds characterized by long-run partisan loyalty.
Moreover, our analysis illuminates the channel of this association highlighting the important role of
powerful MPs and their personalistic patron-client networks. In this political environment, MPs
17
attempt to maintain their networks of political patronage in the loyal prefectures of their affiliated
party, whereas the party expropriates their electoral influence.
Our study could be viewed as a first step towards the investigation of the institutional and the
political framework of Greece during the period of the so-called Metapolitefsi applying modern
econometric techniques. Obviously, there are many more things that could be done. For example, there
are important spending categories (such as spending on pensions, wages and salaries of public
employees, etc.) that contributed significantly to the fiscal derailment of the Greek state and, to the
best of our knowledge, have not been investigated using advanced quantitative methods. More
generally, an advantageous field for future research would be to use cross-country comparisons (with
regional level data within countries) under different electoral rules when investigating the role of
intertemporal party strength. Finally, an issue of paramount importance, which remains unexplored, is
the investigation of the factors which determine intertemporal party strength beforehand.
18
References
Alogoskoufis, G., (2019). Greece and the Euro: A Mundellian Tragedy. CGK Working Paper 2019-01.
Ames, B. (1995). Electoral strategy under open-list proportional representation. American Journal of Political Science, 39(2), 406-33.
Anaxagorou, C., Efthyvoulou, G., and Sarantides, V. (2020). Electoral motives and the subnational allocation of foreign aid in sub-Saharan Africa, European Economic Review, 127, 103430.
Arulampalam, W., Dasgupta, S., Dhillon, A., and Dutta, B. (2009). Electoral goals and center-state transfers: A theoretical model and empirical evidence from India. Journal of Development Economics, 88(1), 103-119.
Bom, P., and Ligthart, J. (2014). What have we learned from three decades of research on the productivity of public capital? Journal of Economic Surveys, 28(5), 889-916.
Brender, A., & Drazen, A. (2005). Political budget cycles in new versus established democracies. Journal of Monetary Economics, 52(7), 1271–1295.
Brender, A., and Drazen, A. (2007). Why is economic policy different in new democracies? Affecting attitudes. NBER Working Paper No. 13457.
Carey, J.M. and Shugart, M.S., (1995) Incentives to cultivate a personal vote: A rank ordering of electoral formulas. Electoral Studies 14(4): 417–439.
Carruthers, C., and Wanamaker, M. (2015). Municipal housekeeping: The impact of women's suffrage on public education. Journal of Human Resources, 50(4), 837-872.
Case, A. (2001). Election goals and income redistribution: Recent evidence from Albania. European Economic Review, 45(3), 405-23.
Cheibub, J.A., and Sin, G., (2020). Preference vote and intra-party competition in open list PR systems. Journal of Theoretical Politics 32(1): 70–95.
Clogg, R. (1987). Parties and elections in Greece: The search for legitimacy, Duke University Press, Durham, NC.
Costa-i-Font, J., Rodriguez-Oreggia, E., and Lunapla, D. (2003). Political competition and pork-barrel politics in the allocation of public investment in Mexico. Public Choice 116 (1-2), 185-203.
Cox, G., and McCubbins, M. (1986). Electoral politics as a redistributive game. Journal of Politics, 48 (2), 370-389.
De Luca, G., Hodler, R., Raschky, P., and Valsecchi, M. (2018). Ethnic favoritism: an axiom of politics? Journal of Development Economics, 132, 115-29.
Dixit, A., and Londregan, J. (1998). Fiscal federalism and redistributive politics. Journal of Public Economics, 68(2), 153-180.
Elephantis, A., (1981). PASOK and the elections of 1977: The rise of the populist movement, in Penniman H. (eds.) Greece at the polls: The national elections of 1974 and 1977, Washington, DC: American Enterprise Institute for Public Policy.
Featherstone, K., and Katsoudas, D., (1985). Change and continuity in Greek voting behavior. European Journal of Political Research 13, 27-40.
Frangoudakis, A. (1981). The impasse of educational reform in Greece: An introduction. Journal of the Hellenic Diaspora, 8, 7-18.
Golden, M, and Min, B. (2013). Distributive politics around the World. Annual Review of Political Science, 16, 73–99.
Golden M, and Picci L. (2008). Pork barrel politics in postwar Italy, 1953–1994. American Journal of Political Science, 52(2):268-89.
Guillén A. and Matsaganis M. (2000). Testing the social dumping hypothesis in Southern Europe: Welfare policies in Spain and Greece during the last 20 years. Journal of European Social Policy, 10 (2), 120-145.
19
Helland, L., and Sørensen, R.J. (2009). Geographical redistribution with disproportional representation: a politico-economic model of Norwegian road projects. Public Choice, 139 (1–2), 5–19.
Jablonski, R. (2014). How aid targets votes: The impact of electoral incentives on foreign aid distribution. World Politics, 66(2), 1-39.
Joanis, M. (2011). The road to power: Partisan loyalty and the centralized provision of local infrastructure, Public Choice, 146, (1-2), 117-143.
Kalyvas, S., (2010). Irregular warfare and electoral bahavior: The civil war as a crucial determinant. in Gounaris, V., Kalyvas, S., Stefanidis, J., (Eds). Irregular Warfares: Macedonia, Civil War, Cyprus. Patakis Publications (in Greek)
Kammas, P., and Sarantides, V. (2016). Fiscal redistribution around elections when democracy is not ‘‘the only game in town’’. Public Choice, 168(3), 279-311.
Kammas, P., Poulima, M., Sarantides, V. (2021). Fuelling the (party) machine: The political origins of the Greek debt during Metapolitefsi. Working Paper. Sheffield Economic Research Paper Series, 2021002. Department of Economics, University of Sheffield ISSN 1749-8368
Kauder, B., Potrafke, N. and Reischmann M. (2016). Do politicians reward core supporters? Evidence from a discretionary grant program, European Journal of Political Economy, 45, 39-56
Kazamias, A. (1978). The politics of educational reform in Greece: Law 309/1976. Comparative Education Review, 22(1), 21-45.
Kemmerling, A., and Stephan, A. (2015). Comparative political economy of regional transport infrastructure in Europe. Journal of Comparative Economics, 43(1), 227–239.
Kitschelt, H., (2000), Linkages between citizens and politicians in democratic polities. Comparative Political Studies 33(6–7): 845–879.
Knight, B. (2004). Parochial interests and the centralized provision of local public goods: Evidence from congressional voting on transportation projects. Journal of Public Economics, 88, 845–866.
Larcinese, V., Rizzo, L., and Testa, C. (2006). Allocating the U.S. federal budget to the states: The impact of the President. Journal of Politics, 68(2), 447–456.
Legg, K. (1969). Politics in modern Greece. Stanford University Press. Lindbeck, A., and Weibull, J. (1987). Balanced-budget redistribution as the outcome of political
competition. Public Choice, 52(3), 273–297. Linz, J., and Stepan, A. (1996). Problems of democratic transition and consolidation: southern
Europe, South America, and post-communist Europe. Baltimore: Johns Hopkins University Press.
Lizzeri, A., and Persico, N. (2001). The provision of public goods under alternative electoral incentives. American Economic Review, 91(1), 225-45.
Lyrintzis, C. (1984). Political parties in post-junta Greece: A case of “bureaucratic clientelism? West European Politics, 7(2), 99-118.
Mavrogordatos, G. (1983a). Stillborn republic: Social coalitions and party strategies in Greece, 1922–1936. Berkeley, CA: University of California Press.
Mavrogordatos, G. (1983b). The rise of the green sun: The Greek election of 1981. London: King’s College, Centre for Contemporary Greek Studies.
Mavrogordatos, G. (1984). The Greek party system: a case of limited but polarized pluralism?, West European Politics, 7(4), 156-169.
Mavrogordatos, G. (1997). From traditional clientelism to machine politics: The impact of PASOK populism in Greece. South European Society and Politics, 2(3), 1-26.
McGillivray, F. (2004). Privileging industry: The comparative politics of trade and industrial policy. Princeton University Press, Princeton.
Meghir, C., Pissarides, C., Vayanos, D., Vettas, N., (2017). The Greek economy before and during the crisis-and policy options going forward, in C. Meghir, C. A. Pissarides, D. Vayanos and N. Vettas
20
(eds), Beyond Austerity: Reforming the Greek Economy, MIT Press, Cambridge, MA, chapter 1, pp. 3–72.
Mershon, C., (2020). Challenging the wisdom of preferential proportional representation. Journal of Theoretical Politics 32(1): 168–182.
Meynaud, J., (2002). The Political Forces in Greece (1946-1965), 2nd ed., Savvalas, Athens (in Greek).
Milesi-Ferretti, G., Perotti, R., and Rostagno, M. (2002). Electoral systems and the composition of public spending. Quarterly Journal of Economics, 117 (2), 609-657.
Monastiriotis, V., and Psycharis, Y. (2011). Without purpose and strategy? A spatio-functional analysis of the regional allocation of public investment in Greece. GreeSE, 49. Hellenic Observatory, London, UK.
Nicolakopoulos, E. (2001). The Weak Democracy. Parties and Elections, 1946-1967. Athens: Patakis Publishers (in Greek).
Nicolakopoulos, E. (2005). Elections and voters, 1974-2004: Old cleavages and new issues. West European Politics, 28(2), 260-278.
Papadopoulos, Y., (1989). Parties, the state and society in Greece: Continuity within change. West European Politics 12, 55-71.
Pappas, T. (2009a). Patrons against partisans. The politics of patronage in mass ideological parties. Party Politics, 15(3), 315-334.
Pappas, T. (2009b). The charismatic party. Patakis, Athens (in Greek) Persson, T., and Tabellini, G. (2002). Political Economics. Explaining Economic Policy. MIT Press,
Cambridge (MA) and London. Petropulos, J. (1968). Politics and statecraft in the Kingdom of Greece, 1833–1843. Princeton, NJ:
Princeton University Press. Rodriguez-Pose, A., Psycharis, Y., and Tselios, V. (2016). Politics and investment: Examining the
territorial allocation of public investment in Greece. Regional Studies, 50(7), 1097-1112. Solé-Ollé, A. (2013). Inter-regional redistribution through infrastructure investment: tactical or
programmatic? Public Choice, 156(1-2), 229-252. Solé-Ollé, A., and Sorribas-Navarro, P. (2008). The effects of partisan alignment on the allocation of
intergovernmental transfers. Difference-in differences estimates for Spain. Journal of Public Economics, 92, 625–671.
Spenkuch, J., and Tillmann, P. (2018). Elite influence? Religion and the electoral success of the Nazis, American Journal of Political Science, 62(1), 19-36.
Tziovaras, G., and Chiotis, V., (2006). The political atlas of post-dictatorial Greece 1974-2006. Athens: Livanis Publishers (in Greek).
Verney, S. (1990). Between coalition and one-party government: the Greek elections of November 1989 and April 1990, West European Politics, 13 (4), 131-138.
Worthington, A., and Dollery, B. (1998). The political determination of intergovernmental grants in Australia. Public Choice, 94 (3-4), 299-315.
Yamano, N., and Ohkawara, T. (2000). The regional allocation of public investment: Efficiency or equity? Journal of Regional Science, 40 (2), 205-229.
21
Figure 1. Public Investment
Notes: The dashed line indicates the year that the socialist party PASOK came in power after the election of 1981.
22
Figure 2. Electoral power of ND and PASOK
23
Figure 3. Long-run partisan loyalty in Greek prefectures
24
Figure 4. Public investment per capita
25
Figure 5. Evolution of public investment by category
Notes: The black dashed line indicates the year that PASOK came in power after the election of 1981. The blue (green) line indicates a significant increase in investment spending during the term of ND (PASOK). All public investment variables are expressed in real per capita terms.
26
Table 1. Political support and the allocation of public investment Dep. variable: Total public investment (1) (2) (3) (4) incumbent share 0.717**
(0.326) opposition share
-0.609*
(0.342) victory margin 0.369** (0.178) historical victory margin 0.249* (0.138) Observations 780 780 780 780 R2 0.513 0.510 0.512 0.512
Notes: The table reports OLS estimates of Equation (1). Prefecture and year fixed effects are included. The dependent variable is the natural logarithm of the real per capita total investment (total) in each prefecture. All models control for the population density, electricity access and the agricultural rate, but these coefficients are not reported due to space limitations. Robust standard errors, clustered by prefecture, are reported in parentheses. *, **, *** denote statistical significance at the 10%, 5%, 1% level respectively.
27
Table 2. DD approach, PASOK and ND victory margin (1) (2) (3) (4) (5) (6) (7) (8) (9) (10)
Dep. variable: Categories of public investment total regional transportation education primary
sector industrial housing and sanitation
health and public welfare
culture and administration other
Panel A: PASOK administration PASOK · victory margin1981 0.480 0.562** -0.322 2.470 2.639 -2.064 2.345 -1.265 0.470 6.048*
(0.340) (0.246) (2.305) (2.826) (1.664) (1.723) (2.800) (2.709) (2.448) (3.068)
Observations 780 728 728 728 728 728 728 728 728 728 R2 0.507 0.869 0.117 0.470 0.064 0.224 0.254 0.235 0.064 0.449 Panel B: ND administration ND · victory margin1974 0.466** 0.115 1.299 3.380* 0.307 -1.618* 2.646** -1.934 -0.876 0.985
(0.220) (0.187) (1.166) (1.871) (0.824) (0.964) (1.288) (1.449) (1.214) (1.791) Observations 780 728 728 728 728 728 728 728 728 728 R2 0.511 0.868 0.120 0.482 0.057 0.226 0.260 0.239 0.066 0.434
Notes: The table reports DD coefficient estimates of Equation (2). Prefecture and year fixed effects are included. All estimates control for the population density, electricity access and the agricultural rate, but these coefficients are not reported due to space limitations. Robust standard errors, clustered by prefecture, are reported in parentheses. *, **, *** denote statistical significance at the 10%, 5%, 1% level respectively.
28
Table 3. DD approach, EK and ERE victory margin: Testing for long-run partisan loyalty (1) (2) (3) (4) (5) (6) (7) (8) (9) (10)
Dep. variable: Categories of public investment total regional transportation education primary
sector industrial housing and sanitation
health and public
welfare
culture and administration other
Panel A: PASOK administration PASOK · victory margin of EK1964 0.345 0.346** -0.047 1.448 0.579 -1.182 0.878 0.916 -0.267 3.793**
(0.282) (0.157) (1.705) (1.809) (0.848) (0.902) (1.562) (1.368) (1.253) (1.648)
Observations 780 728 728 728 728 728 728 728 728 728 R2 0.508 0.870 0.117 0.470 0.058 0.224 0.252 0.235 0.064 0.451 Panel B: ND administration ND · victory margin of ERE1961 0.609** 0.204 1.211 1.640 1.545** -1.939** 1.688 -0.133 0.305 4.953***
(0.254) (0.178) (1.579) (1.825) (0.739) (0.898) (1.530) (1.500) (1.175) (1.678) Observations 780 728 728 728 728 728 728 728 728 728 R2 0.516 0.868 0.120 0.471 0.064 0.229 0.255 0.234 0.064 0.462
Notes: See Table 2.
29
Table 4. Political support and the allocation of public investment: The role of powerful MPs Dep. Variable: Total public investment
(1) (2) (3) (4) (5) (6) (7) (8)
victory margin: contemporary historical contemporary historical contemporary historical contemporary historical pre-post period 1 year 1 year 2 years 2 years 3 years 3 years victory margin 0.142 0.038 0.267 0.029 0.184 0.018 0.112 -0.001 (0.162) (0.129) (0.201) (0.134) (0.194) (0.127) (0.191) (0.135) ministers -0.019 -0.043 -0.023 -0.045 -0.018 -0.042 -0.022 -0.047 (0.051) (0.055) (0.073) (0.076) (0.068) (0.075) (0.064) (0.073) victory margin · ministers 0.620 0.552* 0.586 0.548* 0.600 0.569* 0.656 0.595* (0.374) (0.283) (0.376) (0.288) (0.386) (0.303) (0.425) (0.320) pre-ministers 0.008 -0.023 0.034 0.020 0.026 0.025 (0.064) (0.057) (0.067) (0.071) (0.082) (0.099) pre-ministers · victory margin -0.247 0.147 -0.044 0.108 0.295 0.180 (0.245) (0.230) (0.261) (0.257) (0.372) (0.286) post-ministers 0.005 0.006 -0.009 -0.017 -0.037 -0.052 (0.078) (0.083) (0.067) (0.075) (0.061) (0.072) post-ministers · victory margin -0.326 -0.065 -0.191 0.053 0.007 0.184 (0.320) (0.240) (0.314) (0.262) (0.370) (0.299) Observations 780 780 780 780 780 780 780 780 R2 0.519 0.521 0.520 0.522 0.520 0.522 0.520 0.523
Notes: Columns (1) and (2) report estimates of Equation (3). Columns (3) - (8) report estimates of Equation (3) augmented with pre- and post-treatment minister variables. Prefecture and year fixed effects are included. All estimates control for the population density, electricity access and the agricultural rate, but these coefficients are not reported due to space limitations. Robust standard errors, clustered by prefecture, are reported in parentheses. *, **, *** denote statistical significance at the 10%, 5%, 1% level respectively.
30
Table 5. DDD approach: Long-run partisan loyalty and the role of powerful MPs Dep. Variable: Total public investment
(1) (2) (3) (4)
victory margin: PASOK 1981 EK 1964 ND 1974 ERE 1961
party: PASOK PASOK ND ND
party · victory margin -0.097 -0.023 0.175 0.338* (0.343) (0.213) (0.193) (0.185) ministers 0.256** 0.264** -0.045 -0.048 (0.103) (0.100) (0.042) (0.048) victory margin · ministers -1.164* -0.652* -0.142 -0.193 (0.598) (0.363) (0.243) (0.207) party · ministers -0.400*** -0.401*** 0.089 0.119 (0.121) (0.109) (0.093) (0.087) party · victory margin · ministers 1.948*** 1.134*** 0.874** 0.877* (0.689) (0.416) (0.434) (0.446) Observations 780 780 780 780 R2 0.532 0.533 0.532 0.539
Notes: The table reports estimates of Equation (4). Prefecture and year fixed effects are included. All estimates control for the population density, electricity access and the agricultural rate, but these coefficients are not reported due to space limitations. Robust standard errors, clustered by prefecture, are reported in parentheses. *, **, *** denote statistical significance at the 10%, 5%, 1% level respectively.
31
Appendix Α. 1974 electoral law of reinforced proportionality
The parliamentary elections of November 1974 were held under an electoral system of reinforced
proportionality established by the Legislative Decree No 650/1974 (LD 65/1974).22 The system
employed was based on a Hagenbach-Bischoff system and appeared to be similar to that in force during
the pre-dictatorial elections of 1961, 1963 and 1964 (see, e.g., Clogg, 1987). More precisely, the
number of members in parliament has been fixed at 300, of whom 12 are “state”MPs. The country was
divided into 56 electoral districts which were based on 52 different prefectures.23 The allocation of
MPs to each electoral district is determined by dividing the number of the eligible voters countrywide
by the number of seats in the parliament (currently 288, i.e. 300 minus the 12 “state”MPs). This gives
a quota of electors per seat (i.e., the number of votes that are required in order to gain a seat in the
parliament). In turn, the number of eligible voters in each electoral district is divided by this quota of
electors per seat in order to give the number of seats in each electoral district.
After the elections, the distribution of seats among parties in each district takes place according
to the following formula: in the first distribution, the number of seats allocated to each party in a district
was obtained by dividing the number of valid votes gained by the party in the district with the electors
per seat of this specific district. In turn, the seats that were not allocated in the first distribution were
held over to the second distribution in which they had the right to participate only the parties that
received at least 17% of the vote countrywide. Finally, any seats that had still not been allocated –
during the second distribution- were distributed in the third distribution (see Clogg, 1987, for more
details on this). It is important to note that the electoral system in Greece was an OLPR during the
period under investigation where the voters are entitled to express their preferences over a candidate
by marking a cross on the ballot paper on the left of the name of the candidate (this is the so called
“stavrodosia”). Obviously, in such an open list system, the electorate rather than the party (or the
leader of the party) determines the order in which the MPs were elected (depending -of course- on the
number of the seats won by the party) and,therefore, local candidates have incentives to direct
resources to their bailiwicks in order to prevent voters from switching support to another local
candidate on the same party list (see, e.g., Golden and Picci, 2008).
22 It must be noted that all the elections until the year 1989 were held under similar electoral laws of reinforced proportionality. More precisely, the elections of November 1977 were held under the Electoral Law: 626/ 1977, the elections of October 1981 under the Electoral Law: 1180/ 1981 and the elections of June 1985 under the Electoral Law: 1516/1985. Then, in 1989 the socialist government of Andreas Papandreou passed an electoral law of simple proportionality -that was very different from the previous laws of reinforced proportionality- changing in that way drastically the “rules of the game” of the political system in Greece. 23 Because of the concentration of population in the two major urban centres, Athens and Thessaloniki, the prefecture of Athens was divided into four electoral constituencies (i.e., Athens-A, Athens-B, Piraeus-A and Piraeus-B), whereas the prefecture of Thessaloniki was divided into two electoral constituencies (i.e., Thessaloniki-A and Thessaloniki-B).
32
Appendix B. Robustness Checks
Tables C5 and C6 present the estimation results for three modifications of Equation (2). This helps us
to check the consistency and reliability of the results reported in Table 2. First, we investigate whether
the estimated effects are consistent across the two terms that PASOK stayed in power during 1982-
1989. To explore this, we allow the effect of PASOK administration to vary over two horizons, 1982-
1985 and 1986-1989, as follows:
𝑝𝑝𝑖𝑖𝑖𝑖𝑖𝑖𝑠𝑠𝑡𝑡𝑖𝑖𝑖𝑖𝑖𝑖𝑡𝑡𝑖𝑖𝑖𝑖 = 𝛼𝛼0 + 𝛼𝛼1𝑃𝑃𝑃𝑃𝑃𝑃𝑃𝑃𝑃𝑃1982−1985 · 𝑖𝑖𝑝𝑝𝑝𝑝𝑡𝑡𝑡𝑡𝑜𝑜𝑝𝑝 𝑖𝑖𝑡𝑡𝑜𝑜𝑚𝑚𝑝𝑝𝑖𝑖1981+𝛼𝛼2𝑃𝑃𝑃𝑃𝑃𝑃𝑃𝑃𝑃𝑃1986−1989 ·
𝑖𝑖𝑝𝑝𝑝𝑝𝑡𝑡𝑡𝑡𝑜𝑜𝑝𝑝 𝑖𝑖𝑡𝑡𝑜𝑜𝑚𝑚𝑝𝑝𝑖𝑖1981 + 𝛽𝛽𝑋𝑋𝑖𝑖𝑖𝑖 + 𝛿𝛿𝑖𝑖 + 𝛾𝛾𝑖𝑖 + 𝜀𝜀𝑖𝑖𝑖𝑖 (A1)
As can be seen in Panel A of Table C5, the effect of regional investment seems to be stronger in the
second term of PASOK, whereas the effect on other investment is constant over time. We do not obtain
a significant effect for any other category of investment. The effect on total investment is close to
conventional levels of statistical significance only in the second term, thus, again it appears closely
related with regional investment. A possible explanation is that in the second term of PASOK, when
the government faced budget constraints due to an unpopular stabilization program which was put in
place to reduce deficits (during 1985-1987), the targeting of the available resources became more
important.
A primary concern in our analysis is that we rely on a voting share from a point in time that
increases measurement error in other years. To alleviate this issue, we opt to reduce our sample
between 1978-1985, the last term of ND, and the first term of PASOK. As can be seen in Panel B of
Table C5, the effect on regional and other investment persists, whereas other coefficients are not
statistically significant. The effect on total investment becomes significantly weaker, indicating that
in the first term of PASOK, that we observe this significant rise on investment flows, their composition
mattered more in terms of political allocation rather than its level.
It remains possible that, heterogeneous trends are present and induced changes in investment
flows in prefectures that voted more intensively for PASOK - even before 1982 that the socialist party
came in power. To examine this possibility, we restrict our sample prior to 1982 and assess the
importance of our key independent variable in determining trends in investment flows. Specifically,
we modify Equation (2) to estimate the following for the fiscal years of 1975-1981:
𝑝𝑝𝑖𝑖𝑖𝑖𝑖𝑖𝑠𝑠𝑡𝑡𝑖𝑖𝑖𝑖𝑖𝑖𝑡𝑡𝑖𝑖𝑖𝑖 = 𝛼𝛼0 + 𝛼𝛼1𝑡𝑡𝑜𝑜𝑖𝑖𝑖𝑖𝑡𝑡 + 𝛼𝛼2𝑡𝑡𝑜𝑜𝑖𝑖𝑖𝑖𝑡𝑡 · 𝑖𝑖𝑝𝑝𝑝𝑝𝑡𝑡𝑡𝑡𝑜𝑜𝑝𝑝 𝑖𝑖𝑡𝑡𝑜𝑜𝑚𝑚𝑝𝑝𝑖𝑖1981 + 𝛽𝛽𝑋𝑋𝑖𝑖𝑖𝑖 + 𝛿𝛿𝑖𝑖 + 𝛾𝛾𝑖𝑖 + 𝜀𝜀𝑖𝑖𝑖𝑖 (A2)
33
The main aim is to test whether prefectures with high victory margin1981 had different trends before
1982 (i.e., 𝛼𝛼2≠0). The results reported in Panel C show an upward trend in regional investment, but,
more importantly, no evidence of a differential trend related to the size of victory margin1981.
Moreover, all other coefficients are not statistically significant.
Table C6 reports results from additional robustness checks for the period when ND was in
power. In particular, in Panel A, we present the results splitting the effect of ND administration in two
sub-periods (1975-1977 and 1978-1981).We also restrict the sample between 1978-1985 - as is the
case reported in Panels A and B of Table C5. We do not test the hypothesis of pre-existing trends in
the case of ND (as we did in Panel C of Table C5) since its terms are ahead of PASOK’s administration.
As discussed in the main text (see Section 3.2.2), our results indicate a significant bias especially
during the first term of ND in power. Finally, in Tables C7 and C8, we repeat the same robustness
exercises for the ancestor parties of PASOK and ND, EK and ERE respectively. As already analyzed
in the main text (see Section 3.2.3), the results appear stronger and less noisy in comparison to the
corresponding estimates reported in Tables C5 and C6.
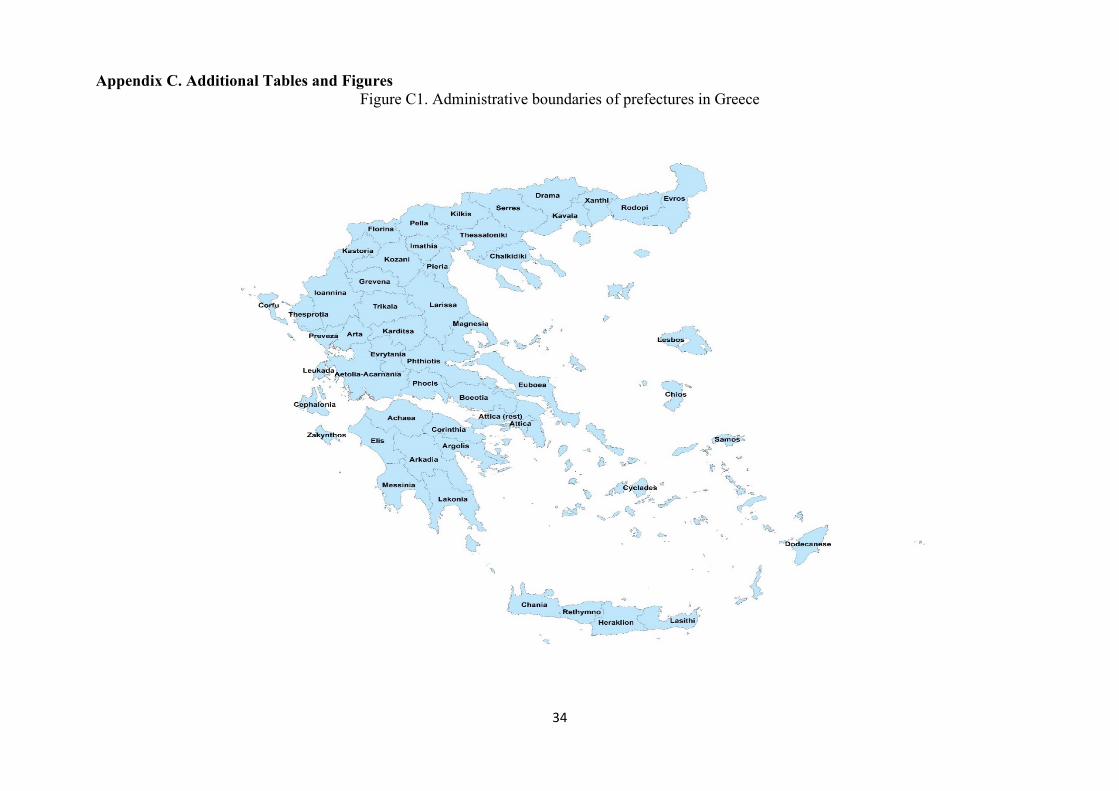
34
Appendix C. Additional Tables and Figures Figure C1. Administrative boundaries of prefectures in Greece
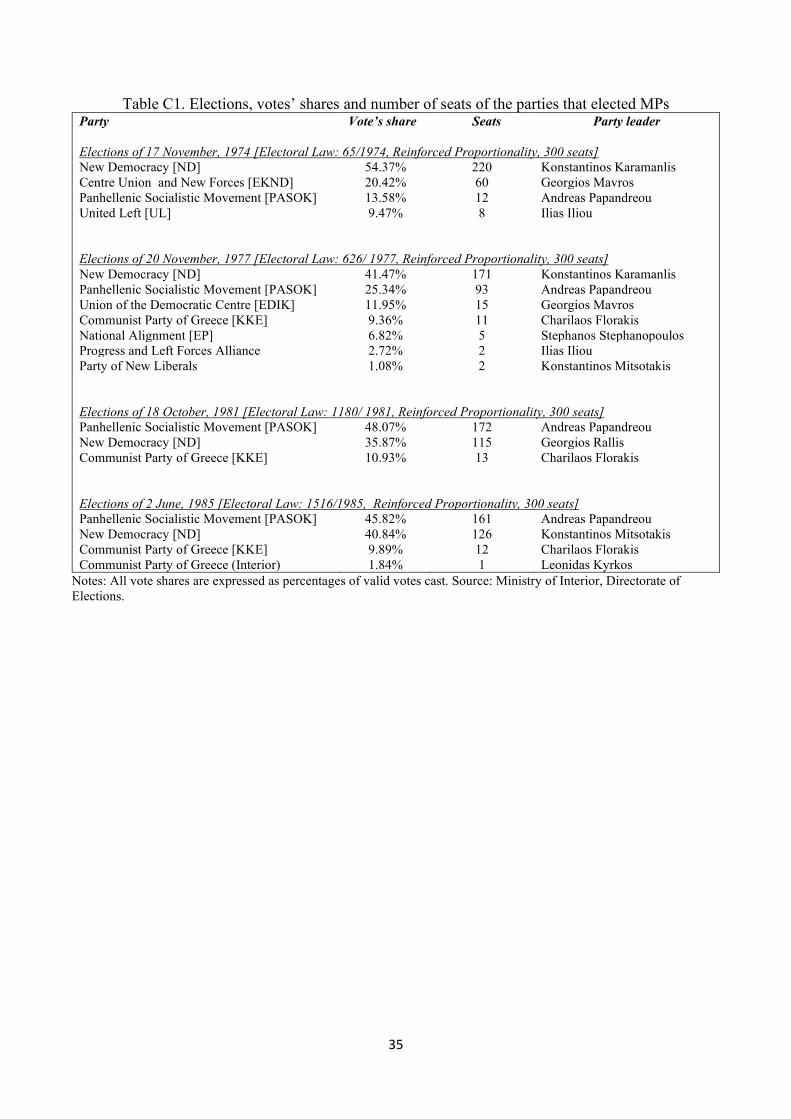
35
Table C1. Elections, votes’ shares and number of seats of the parties that elected MPs Party Vote’s share Seats Party leader Elections of 17 November, 1974 [Electoral Law: 65/1974, Reinforced Proportionality, 300 seats] New Democracy [ND] 54.37% 220 Konstantinos Karamanlis Centre Union and New Forces [EKND] 20.42% 60 Georgios Mavros Panhellenic Socialistic Movement [PASOK] 13.58% 12 Andreas Papandreou United Left [UL] 9.47% 8 Ilias Iliou Elections of 20 November, 1977 [Electoral Law: 626/ 1977, Reinforced Proportionality, 300 seats] New Democracy [ND] 41.47% 171 Konstantinos Karamanlis Panhellenic Socialistic Movement [PASOK] 25.34% 93 Andreas Papandreou Union of the Democratic Centre [EDIK] 11.95% 15 Georgios Mavros Communist Party of Greece [KKE] 9.36% 11 Charilaos Florakis National Alignment [EP] 6.82% 5 Stephanos Stephanopoulos Progress and Left Forces Alliance 2.72% 2 Ilias Iliou Party of New Liberals 1.08% 2 Konstantinos Mitsotakis Elections of 18 October, 1981 [Electoral Law: 1180/ 1981, Reinforced Proportionality, 300 seats] Panhellenic Socialistic Movement [PASOK] 48.07% 172 Andreas Papandreou New Democracy [ND] 35.87% 115 Georgios Rallis Communist Party of Greece [KKE] 10.93% 13 Charilaos Florakis Elections of 2 June, 1985 [Electoral Law: 1516/1985, Reinforced Proportionality, 300 seats] Panhellenic Socialistic Movement [PASOK] 45.82% 161 Andreas Papandreou New Democracy [ND] 40.84% 126 Konstantinos Mitsotakis Communist Party of Greece [KKE] 9.89% 12 Charilaos Florakis Communist Party of Greece (Interior) 1.84% 1 Leonidas Kyrkos
Notes: All vote shares are expressed as percentages of valid votes cast. Source: Ministry of Interior, Directorate of Elections.
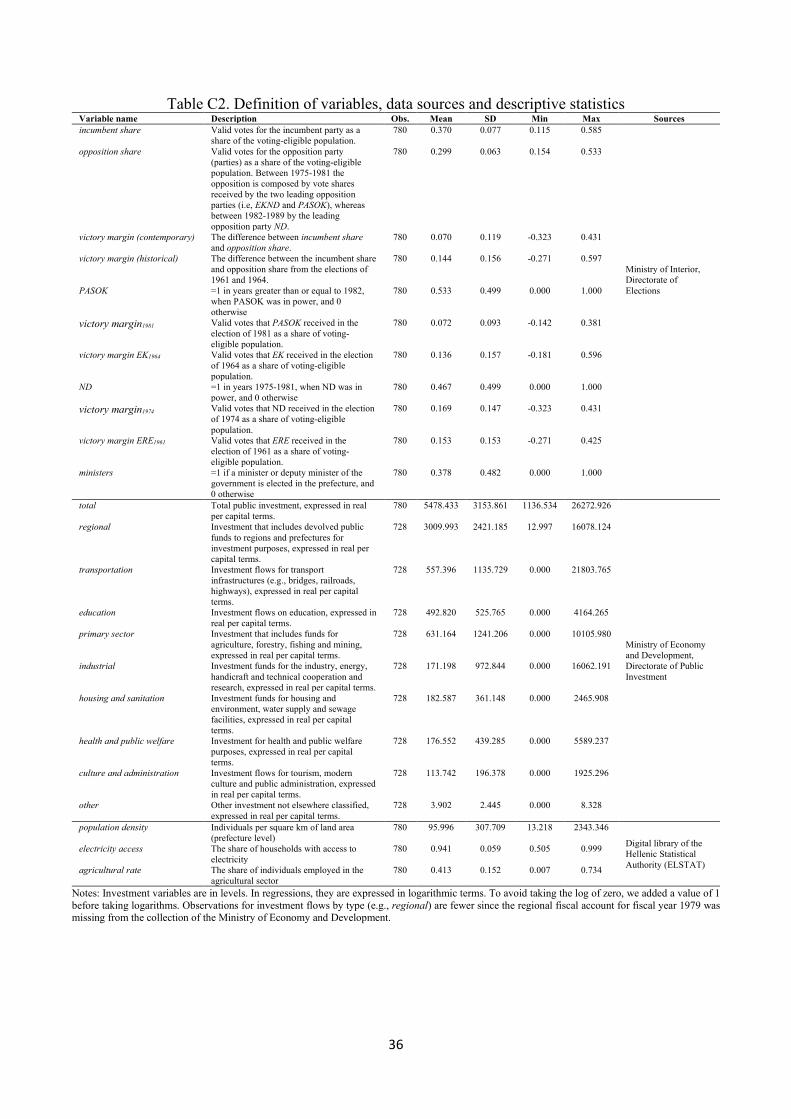
36
Table C2. Definition of variables, data sources and descriptive statistics Variable name Description Obs. Mean SD Min Max Sources incumbent share Valid votes for the incumbent party as a
share of the voting-eligible population. 780 0.370 0.077 0.115 0.585
Ministry of Interior, Directorate of Elections
opposition share Valid votes for the opposition party (parties) as a share of the voting-eligible population. Between 1975-1981 the opposition is composed by vote shares received by the two leading opposition parties (i.e, EKND and PASOK), whereas between 1982-1989 by the leading opposition party ND.
780 0.299 0.063 0.154 0.533
victory margin (contemporary) The difference between incumbent share and opposition share.
780 0.070 0.119 -0.323 0.431
victory margin (historical) The difference between the incumbent share and opposition share from the elections of 1961 and 1964.
780 0.144 0.156 -0.271 0.597
PASOK =1 in years greater than or equal to 1982, when PASOK was in power, and 0 otherwise
780 0.533 0.499 0.000 1.000
victory margin1981 Valid votes that PASOK received in the election of 1981 as a share of voting-eligible population.
780 0.072 0.093 -0.142 0.381
victory margin EK1964 Valid votes that EK received in the election of 1964 as a share of voting-eligible population.
780 0.136 0.157 -0.181 0.596
ND =1 in years 1975-1981, when ND was in power, and 0 otherwise
780 0.467 0.499 0.000 1.000
victory margin1974 Valid votes that ND received in the election of 1974 as a share of voting-eligible population.
780 0.169 0.147 -0.323 0.431
victory margin ERE1961 Valid votes that ERE received in the election of 1961 as a share of voting-eligible population.
780 0.153 0.153 -0.271 0.425
ministers =1 if a minister or deputy minister of the government is elected in the prefecture, and 0 otherwise
780 0.378 0.482 0.000 1.000
total Total public investment, expressed in real per capital terms.
780 5478.433 3153.861 1136.534 26272.926
Ministry of Economy and Development, Directorate of Public Investment
regional Investment that includes devolved public funds to regions and prefectures for investment purposes, expressed in real per capital terms.
728 3009.993 2421.185 12.997 16078.124
transportation Investment flows for transport infrastructures (e.g., bridges, railroads, highways), expressed in real per capital terms.
728 557.396 1135.729 0.000 21803.765
education Investment flows on education, expressed in real per capital terms.
728 492.820 525.765 0.000 4164.265
primary sector Investment that includes funds for agriculture, forestry, fishing and mining, expressed in real per capital terms.
728 631.164 1241.206 0.000 10105.980
industrial Investment funds for the industry, energy, handicraft and technical cooperation and research, expressed in real per capital terms.
728 171.198 972.844 0.000 16062.191
housing and sanitation Investment funds for housing and environment, water supply and sewage facilities, expressed in real per capital terms.
728 182.587 361.148 0.000 2465.908
health and public welfare Investment for health and public welfare purposes, expressed in real per capital terms.
728 176.552 439.285 0.000 5589.237
culture and administration Investment flows for tourism, modern culture and public administration, expressed in real per capital terms.
728 113.742 196.378 0.000 1925.296
other Other investment not elsewhere classified, expressed in real per capital terms.
728 3.902 2.445 0.000 8.328
population density Individuals per square km of land area (prefecture level)
780 95.996 307.709 13.218 2343.346
Digital library of the Hellenic Statistical Authority (ELSTAT)
electricity access The share of households with access to electricity
780 0.941 0.059 0.505 0.999
agricultural rate The share of individuals employed in the agricultural sector
780 0.413 0.152 0.007 0.734
Notes: Investment variables are in levels. In regressions, they are expressed in logarithmic terms. To avoid taking the log of zero, we added a value of 1 before taking logarithms. Observations for investment flows by type (e.g., regional) are fewer since the regional fiscal account for fiscal year 1979 was missing from the collection of the Ministry of Economy and Development.
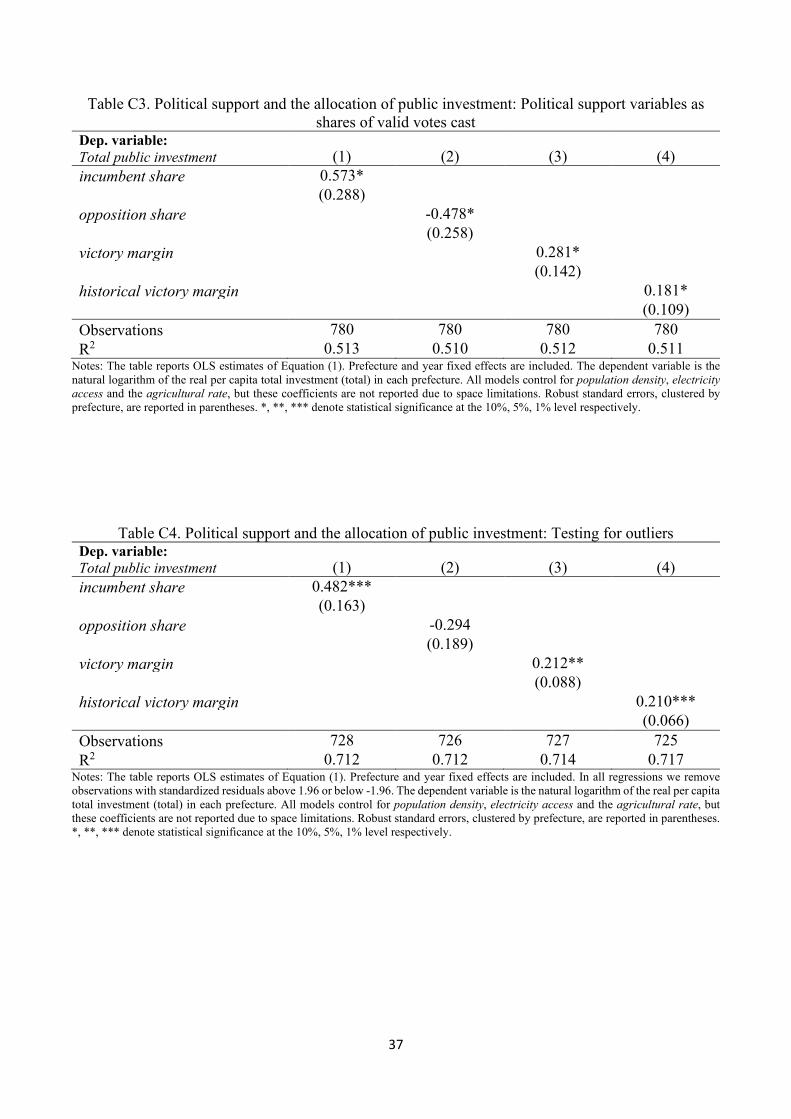
37
Table C3. Political support and the allocation of public investment: Political support variables as shares of valid votes cast
Dep. variable: Total public investment (1) (2) (3) (4) incumbent share 0.573*
(0.288) opposition share
-0.478*
(0.258) victory margin 0.281* (0.142) historical victory margin 0.181* (0.109) Observations 780 780 780 780 R2 0.513 0.510 0.512 0.511
Notes: The table reports OLS estimates of Equation (1). Prefecture and year fixed effects are included. The dependent variable is the natural logarithm of the real per capita total investment (total) in each prefecture. All models control for population density, electricity access and the agricultural rate, but these coefficients are not reported due to space limitations. Robust standard errors, clustered by prefecture, are reported in parentheses. *, **, *** denote statistical significance at the 10%, 5%, 1% level respectively.
Table C4. Political support and the allocation of public investment: Testing for outliers
Dep. variable: Total public investment (1) (2) (3) (4) incumbent share 0.482***
(0.163) opposition share
-0.294
(0.189) victory margin 0.212** (0.088) historical victory margin 0.210*** (0.066) Observations 728 726 727 725 R2 0.712 0.712 0.714 0.717
Notes: The table reports OLS estimates of Equation (1). Prefecture and year fixed effects are included. In all regressions we remove observations with standardized residuals above 1.96 or below -1.96. The dependent variable is the natural logarithm of the real per capita total investment (total) in each prefecture. All models control for population density, electricity access and the agricultural rate, but these coefficients are not reported due to space limitations. Robust standard errors, clustered by prefecture, are reported in parentheses. *, **, *** denote statistical significance at the 10%, 5%, 1% level respectively.
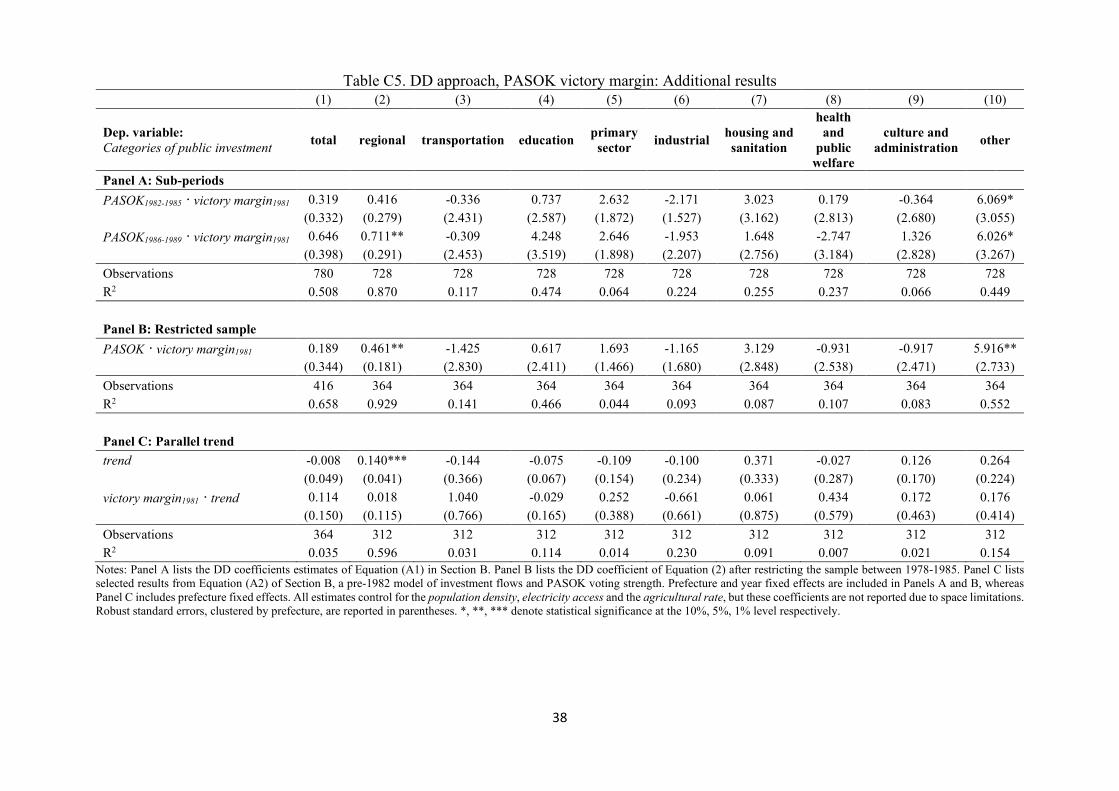
38
Table C5. DD approach, PASOK victory margin: Additional results (1) (2) (3) (4) (5) (6) (7) (8) (9) (10)
Dep. variable: Categories of public investment total regional transportation education primary
sector industrial housing and sanitation
health and
public welfare
culture and administration other
Panel A: Sub-periods PASOK1982-1985 · victory margin1981 0.319 0.416 -0.336 0.737 2.632 -2.171 3.023 0.179 -0.364 6.069*
(0.332) (0.279) (2.431) (2.587) (1.872) (1.527) (3.162) (2.813) (2.680) (3.055) PASOK1986-1989 · victory margin1981 0.646 0.711** -0.309 4.248 2.646 -1.953 1.648 -2.747 1.326 6.026*
(0.398) (0.291) (2.453) (3.519) (1.898) (2.207) (2.756) (3.184) (2.828) (3.267) Observations 780 728 728 728 728 728 728 728 728 728 R2 0.508 0.870 0.117 0.474 0.064 0.224 0.255 0.237 0.066 0.449 Panel B: Restricted sample PASOK · victory margin1981 0.189 0.461** -1.425 0.617 1.693 -1.165 3.129 -0.931 -0.917 5.916**
(0.344) (0.181) (2.830) (2.411) (1.466) (1.680) (2.848) (2.538) (2.471) (2.733) Observations 416 364 364 364 364 364 364 364 364 364 R2 0.658 0.929 0.141 0.466 0.044 0.093 0.087 0.107 0.083 0.552 Panel C: Parallel trend trend -0.008 0.140*** -0.144 -0.075 -0.109 -0.100 0.371 -0.027 0.126 0.264
(0.049) (0.041) (0.366) (0.067) (0.154) (0.234) (0.333) (0.287) (0.170) (0.224) victory margin1981 · trend 0.114 0.018 1.040 -0.029 0.252 -0.661 0.061 0.434 0.172 0.176
(0.150) (0.115) (0.766) (0.165) (0.388) (0.661) (0.875) (0.579) (0.463) (0.414) Observations 364 312 312 312 312 312 312 312 312 312 R2 0.035 0.596 0.031 0.114 0.014 0.230 0.091 0.007 0.021 0.154
Notes: Panel A lists the DD coefficients estimates of Equation (A1) in Section B. Panel B lists the DD coefficient of Equation (2) after restricting the sample between 1978-1985. Panel C lists selected results from Equation (A2) of Section B, a pre-1982 model of investment flows and PASOK voting strength. Prefecture and year fixed effects are included in Panels A and B, whereas Panel C includes prefecture fixed effects. All estimates control for the population density, electricity access and the agricultural rate, but these coefficients are not reported due to space limitations. Robust standard errors, clustered by prefecture, are reported in parentheses. *, **, *** denote statistical significance at the 10%, 5%, 1% level respectively.
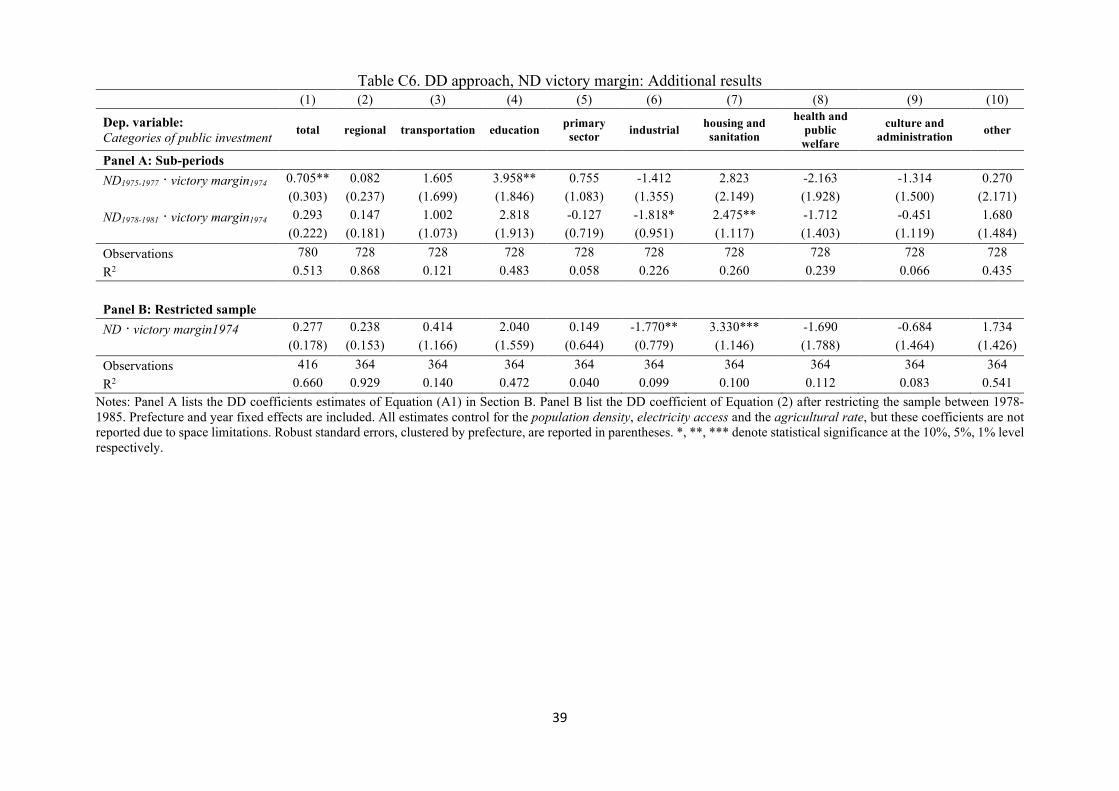
39
Table C6. DD approach, ND victory margin: Additional results (1) (2) (3) (4) (5) (6) (7) (8) (9) (10)
Dep. variable: Categories of public investment total regional transportation education primary
sector industrial housing and sanitation
health and public welfare
culture and administration other
Panel A: Sub-periods ND1975-1977 · victory margin1974 0.705** 0.082 1.605 3.958** 0.755 -1.412 2.823 -2.163 -1.314 0.270
(0.303) (0.237) (1.699) (1.846) (1.083) (1.355) (2.149) (1.928) (1.500) (2.171) ND1978-1981 · victory margin1974 0.293 0.147 1.002 2.818 -0.127 -1.818* 2.475** -1.712 -0.451 1.680
(0.222) (0.181) (1.073) (1.913) (0.719) (0.951) (1.117) (1.403) (1.119) (1.484) Observations 780 728 728 728 728 728 728 728 728 728 R2 0.513 0.868 0.121 0.483 0.058 0.226 0.260 0.239 0.066 0.435 Panel B: Restricted sample ND · victory margin1974 0.277 0.238 0.414 2.040 0.149 -1.770** 3.330*** -1.690 -0.684 1.734
(0.178) (0.153) (1.166) (1.559) (0.644) (0.779) (1.146) (1.788) (1.464) (1.426) Observations 416 364 364 364 364 364 364 364 364 364 R2 0.660 0.929 0.140 0.472 0.040 0.099 0.100 0.112 0.083 0.541
Notes: Panel A lists the DD coefficients estimates of Equation (A1) in Section B. Panel B list the DD coefficient of Equation (2) after restricting the sample between 1978-1985. Prefecture and year fixed effects are included. All estimates control for the population density, electricity access and the agricultural rate, but these coefficients are not reported due to space limitations. Robust standard errors, clustered by prefecture, are reported in parentheses. *, **, *** denote statistical significance at the 10%, 5%, 1% level respectively.
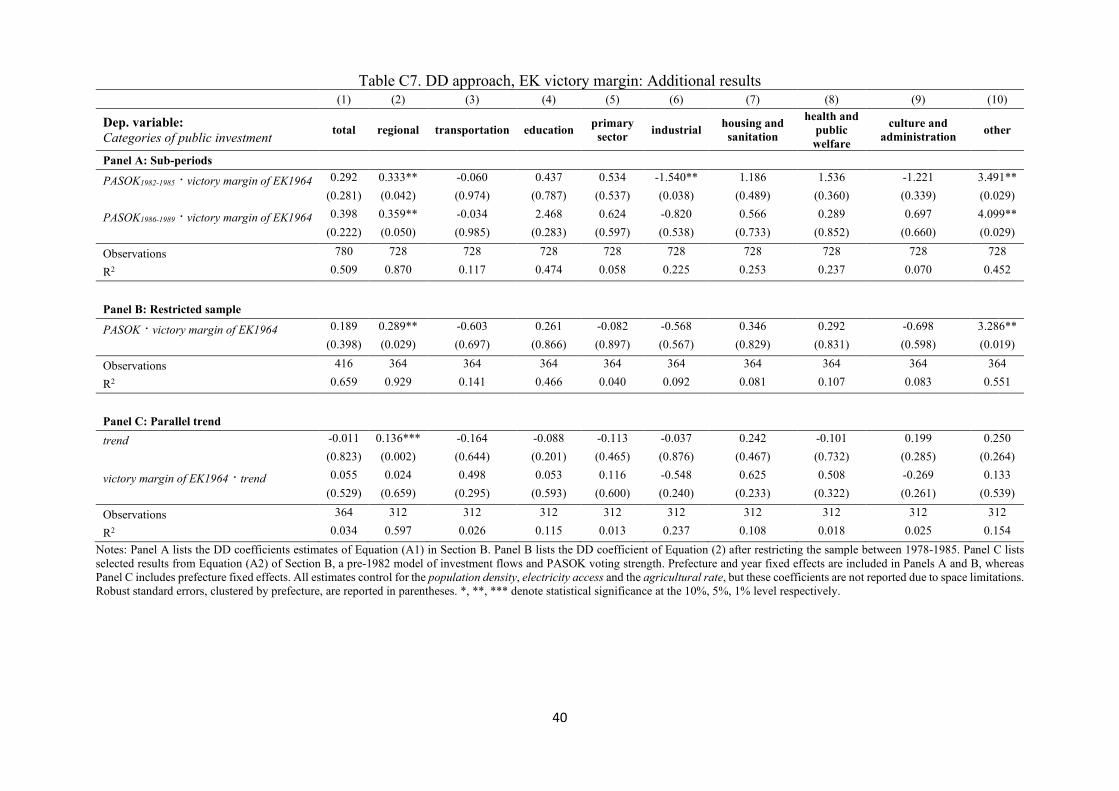
40
Table C7. DD approach, EK victory margin: Additional results (1) (2) (3) (4) (5) (6) (7) (8) (9) (10)
Dep. variable: Categories of public investment total regional transportation education primary
sector industrial housing and sanitation
health and public welfare
culture and administration other
Panel A: Sub-periods
PASOK1982-1985 · victory margin of EK1964 0.292 0.333** -0.060 0.437 0.534 -1.540** 1.186 1.536 -1.221 3.491** (0.281) (0.042) (0.974) (0.787) (0.537) (0.038) (0.489) (0.360) (0.339) (0.029)
PASOK1986-1989 · victory margin of EK1964 0.398 0.359** -0.034 2.468 0.624 -0.820 0.566 0.289 0.697 4.099** (0.222) (0.050) (0.985) (0.283) (0.597) (0.538) (0.733) (0.852) (0.660) (0.029)
Observations 780 728 728 728 728 728 728 728 728 728
R2 0.509 0.870 0.117 0.474 0.058 0.225 0.253 0.237 0.070 0.452
Panel B: Restricted sample
PASOK · victory margin of EK1964 0.189 0.289** -0.603 0.261 -0.082 -0.568 0.346 0.292 -0.698 3.286** (0.398) (0.029) (0.697) (0.866) (0.897) (0.567) (0.829) (0.831) (0.598) (0.019)
Observations 416 364 364 364 364 364 364 364 364 364
R2 0.659 0.929 0.141 0.466 0.040 0.092 0.081 0.107 0.083 0.551
Panel C: Parallel trend trend -0.011 0.136*** -0.164 -0.088 -0.113 -0.037 0.242 -0.101 0.199 0.250
(0.823) (0.002) (0.644) (0.201) (0.465) (0.876) (0.467) (0.732) (0.285) (0.264)
victory margin of EK1964 · trend 0.055 0.024 0.498 0.053 0.116 -0.548 0.625 0.508 -0.269 0.133 (0.529) (0.659) (0.295) (0.593) (0.600) (0.240) (0.233) (0.322) (0.261) (0.539)
Observations 364 312 312 312 312 312 312 312 312 312
R2 0.034 0.597 0.026 0.115 0.013 0.237 0.108 0.018 0.025 0.154 Notes: Panel A lists the DD coefficients estimates of Equation (A1) in Section B. Panel B lists the DD coefficient of Equation (2) after restricting the sample between 1978-1985. Panel C lists selected results from Equation (A2) of Section B, a pre-1982 model of investment flows and PASOK voting strength. Prefecture and year fixed effects are included in Panels A and B, whereas Panel C includes prefecture fixed effects. All estimates control for the population density, electricity access and the agricultural rate, but these coefficients are not reported due to space limitations. Robust standard errors, clustered by prefecture, are reported in parentheses. *, **, *** denote statistical significance at the 10%, 5%, 1% level respectively.
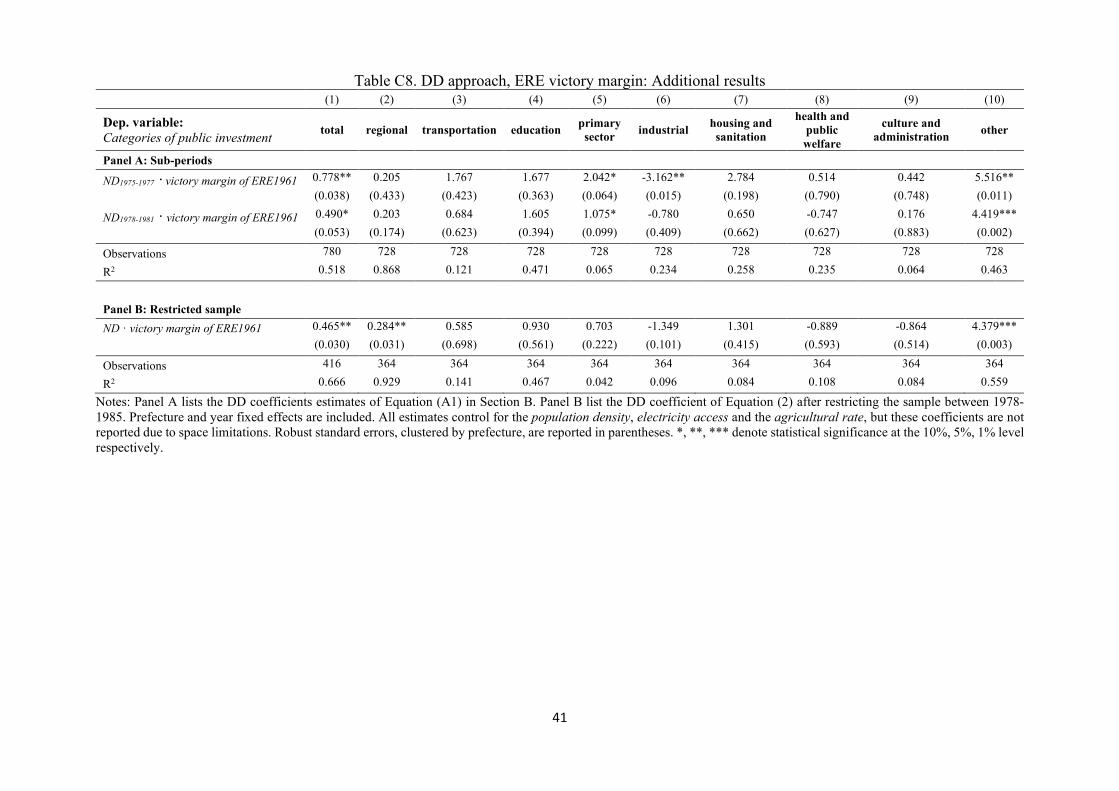
41
Table C8. DD approach, ERE victory margin: Additional results (1) (2) (3) (4) (5) (6) (7) (8) (9) (10)
Dep. variable: Categories of public investment total regional transportation education primary
sector industrial housing and sanitation
health and public welfare
culture and administration other
Panel A: Sub-periods
ND1975-1977 · victory margin of ERE1961 0.778** 0.205 1.767 1.677 2.042* -3.162** 2.784 0.514 0.442 5.516** (0.038) (0.433) (0.423) (0.363) (0.064) (0.015) (0.198) (0.790) (0.748) (0.011)
ND1978-1981 · victory margin of ERE1961 0.490* 0.203 0.684 1.605 1.075* -0.780 0.650 -0.747 0.176 4.419*** (0.053) (0.174) (0.623) (0.394) (0.099) (0.409) (0.662) (0.627) (0.883) (0.002)
Observations 780 728 728 728 728 728 728 728 728 728
R2 0.518 0.868 0.121 0.471 0.065 0.234 0.258 0.235 0.064 0.463
Panel B: Restricted sample ND · victory margin of ERE1961 0.465** 0.284** 0.585 0.930 0.703 -1.349 1.301 -0.889 -0.864 4.379***
(0.030) (0.031) (0.698) (0.561) (0.222) (0.101) (0.415) (0.593) (0.514) (0.003)
Observations 416 364 364 364 364 364 364 364 364 364
R2 0.666 0.929 0.141 0.467 0.042 0.096 0.084 0.108 0.084 0.559
Notes: Panel A lists the DD coefficients estimates of Equation (A1) in Section B. Panel B list the DD coefficient of Equation (2) after restricting the sample between 1978-1985. Prefecture and year fixed effects are included. All estimates control for the population density, electricity access and the agricultural rate, but these coefficients are not reported due to space limitations. Robust standard errors, clustered by prefecture, are reported in parentheses. *, **, *** denote statistical significance at the 10%, 5%, 1% level respectively.
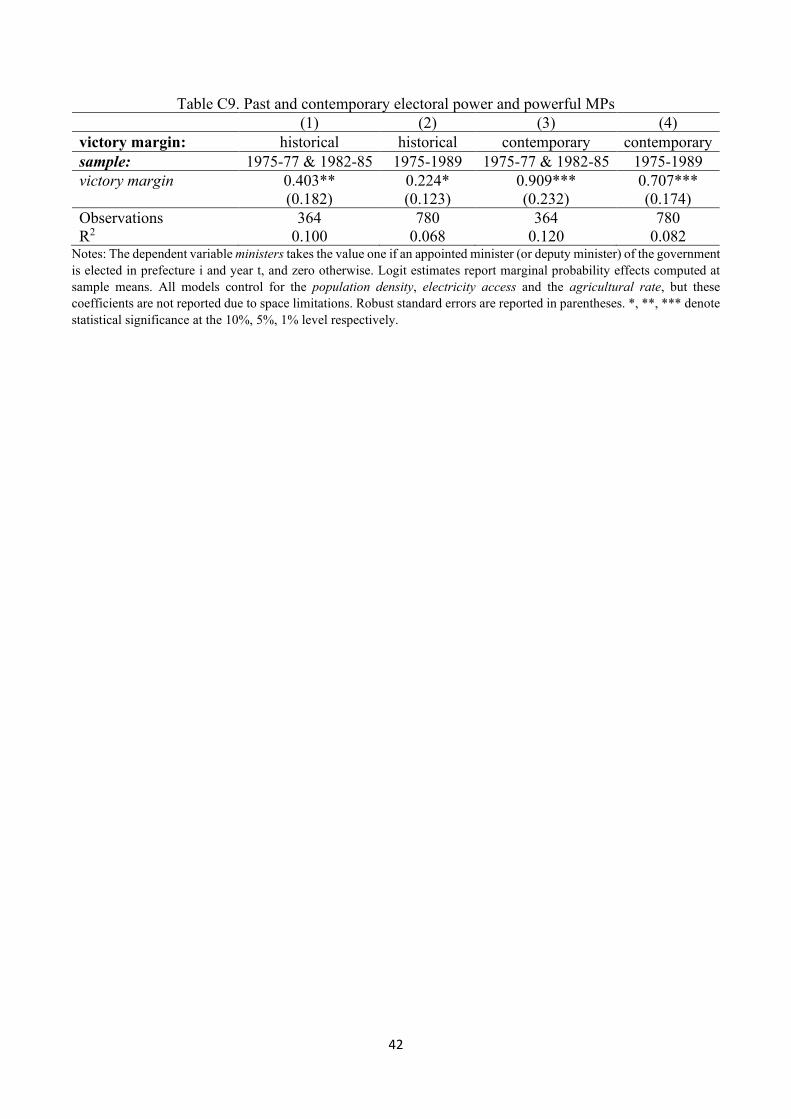
42
Table C9. Past and contemporary electoral power and powerful MPs (1) (2) (3) (4) victory margin: historical historical contemporary contemporary sample: 1975-77 & 1982-85 1975-1989 1975-77 & 1982-85 1975-1989 victory margin 0.403** 0.224* 0.909*** 0.707***
(0.182) (0.123) (0.232) (0.174) Observations 364 780 364 780 R2 0.100 0.068 0.120 0.082
Notes: The dependent variable ministers takes the value one if an appointed minister (or deputy minister) of the government is elected in prefecture i and year t, and zero otherwise. Logit estimates report marginal probability effects computed at sample means. All models control for the population density, electricity access and the agricultural rate, but these coefficients are not reported due to space limitations. Robust standard errors are reported in parentheses. *, **, *** denote statistical significance at the 10%, 5%, 1% level respectively.