Embed Size (px)
Citation preview

INVESTING IN SUPPLY CHAIN PREPAREDNESS A COOPERATIVE STUDY BY HELP LOGISTICS AG, KUEHNE LOGISTICS UNIVERSITY
AND SAVE THE CHILDREN INTERNATIONAL
DECEMBER 2018


Investing in Supply Chain Preparedness I
INVESTING IN SUPPLY CHAIN PREPAREDNESS
A Cooperative Study by HELP Logistics AG, Kuehne Logistics University and Save the Children International
EXECUTIVE SUMMARY
In view of the ever-increasing humanitarian needs and the growing funding gap (Figure 1), actors in
the humanitarian space are asked to look into different and new ways of operating to ultimately achieve more with less.
Figure 1: Funding gap (OCHA 2017)
Recent studies carried out by HELP Logistics and the Kuehne Logistics University (KLU) have analysed
the expenditures of 5 organisations in 23 emergency operations of different kinds between 2005 and 2018. The studies revealed that an average of 73% of the total expenditure was spent in the supply
chain (Figure 2). It follows that efficiencies must be found here if the humanitarian community is to
effectively meet the increasing needs with the available resources. A number of organisations such
as Action Contre la Faim (ACF) France, the International Federation of Red Cross and Red Crescent Societies (IFRC) and Save the Children International (SCI) picked up on those findings and launched a
second series of studies to identify potential triggers for cost and time savings in the supply chain.

Investing in Supply Chain Preparedness II
Figure 2: Worldwide expenditure analysis
Following the statement that every dollar (USD) invested prior to a disaster can save up to 7 dollars
(USD) in the response (United Nations Development Programme (UNDP), 2012) and based on a pre-
existing preparedness framework (Wassenhove 2006), HELP Logistics and KLU developed a dynamic return on investment model to investigate the saving potential of supply chain preparedness
investments.
The model analyses data from a real disaster context and compares scenarios without and with investments considering the available preparedness time until the disaster strikes. It takes into
consideration the interdependencies across the different investments and the impact generated.
SCI, being an organisation that aims at using a holistic, efficient and sustainable approach to improve the situation of children around the globe, chose the disaster context of the Haiyan typhoon
response in the Philippines and the distribution of Non-food Items (NFI), namely blankets, to the
affected population. The model showed that by investing in key elements such as Personnel, IT/Processes, Supplier Engagement, Prepositioning as well as Local Actors/Community, significant
time and cost savings are possible (Figure 3).

Investing in Supply Chain Preparedness III
After 90 days of preparation and investments of around USD 145’000 in supply chain preparedness
measures, cost savings of USD 1’164’000 and a maximum return on investment ratio of 1:7 were
generated. Furthermore, the model showed that the maximum possible lead time reduction (16 days) to reach the affected population could be achieved with slightly higher investment expenses
(USD +1’000) and additional 16 days of preparedness efforts.
These results reassert the fact that supply chains are the backbone and key success factor of emergency operations. Critical stakeholders such as humanitarian organisations, commercial
companies, governments and donors should feel encouraged to put more focus on the optimisation
of supply chain processes by investing earlier and smarter to elevate humanitarian assistance to a
more effective and efficient level.
Figure 3: Study results

Investing in Supply Chain Preparedness IV
CONTENTS
EXECUTIVE SUMMARY ................................................................................................................... I
CONTENTS .................................................................................................................................... IV
LIST OF FIGURES ............................................................................................................................ V
LIST OF ABBREVATIONS ............................................................................................................... VI
1. INTRODUCTION ......................................................................................................................... 1
2. METHODOLOGY AND MODEL FRAMEWORK ........................................................................... 1
3. APPLICATION OF THE MODEL ................................................................................................... 3
3.1 Phase 1: Define Baseline Scenario ............................................................................................................. 3 3.1.1 Develop Common Understanding of the Emergency Supply Chain .......................................................... 3 3.1.2 Define the Disaster Context and Response Operation Parameters .......................................................... 4 3.1.3 Describe the Baseline Scenario ................................................................................................................. 5 3.1.4 Inject Data for the Baseline Scenario Model ............................................................................................. 6
3.2 Phase 2 Design Investment Scenario ......................................................................................................... 6
3.3 Phase 3 Calculate the Return on Investment ........................................................................................... 12
4. CONCLUSION .......................................................................................................................... 15
ACKNOWLEDGEMENTS .............................................................................................................. 17
REFERENCES ................................................................................................................................ 17

Investing in Supply Chain Preparedness V
LIST OF FIGURES
FIGURE 1: FUNDING GAP (OCHA 2017) .................................................................................................... I
FIGURE 2: WORLDWIDE EXPENDITURE ANALYSIS ................................................................................... II
FIGURE 3: STUDY RESULTS ..................................................................................................................... III
FIGURE 4: ARCHITECTURE OF THE ROI MODEL ....................................................................................... 1
FIGURE 5: METHODOLOGY OF THE ROI MODEL ..................................................................................... 2
FIGURE 6: GENERAL SCI SUPPLY CHAIN IN THE CONTEXT OF THE PHILIPPINES ...................................... 4
FIGURE 7: LOADING OF BLANKETS DURING THE TYPHOON HAIYAN RESPONSE .................................... 5
FIGURE 8: SUPPLY CHAIN IN SCI'S BASELINE SCENARIO .......................................................................... 6
FIGURE 9: INVESTMENTS AND COST SAVINGS OVER TIME ................................................................... 12
FIGURE 10: TREND OF COST ROI ........................................................................................................... 12
FIGURE 11: INVESTMENTS MADE ......................................................................................................... 13
FIGURE 12: OVERALL RESULTS AT DAY 90 ............................................................................................. 13
FIGURE 13: REDUCTIONS IN COST AND TIME AT DAY 90 ...................................................................... 14

Investing in Supply Chain Preparedness VI
LIST OF ABBREVATIONS
ACF: Action Contre la Faim
GIK: Gift in-kind
HQ: Headquarters
IFRC: International Federation of Red Cross and Red Crescent Societies
KLU: Kuehne Logistics University
NFI: Non-food Item
NGO: Non-governmental Organisation
RoI: Return on Investment
RoRo: Roll-on-roll-off
SCI: Save the Children International
UNDP: United Nations Development Programme
USD: United States Dollar
VMI: Vendor-managed Inventory

Investing in Supply Chain Preparedness 1
1. INTRODUCTION
This report outlines the methodology of the Return on Investment (RoI) model and its application in
the supply chain preparedness project with SCI conducted from May to September 2018. It furthermore presents and discusses the findings of the project and concludes on potential next steps
to further enhance the response capacity of Save the Children and other actors operating in the
humanitarian space.
2. METHODOLOGY AND MODEL FRAMEWORK In the aftermath of the World Humanitarian Summit 2016, HELP Logistics and KLU developed an
analytical approach that equips humanitarian actors with an enhanced understanding of investment
opportunities in the context of supply chain preparedness. The approach resulted in a dynamic
model which outlines potential investment elements and evaluates their impact in terms of cost and time savings. The architecture of the model is based on Van Wassenhove’s Preparedness Framework
(2006) and is illustrated in Figure 4.
Figure 4: Architecture of the RoI model
The model operates under the following conditions and assumptions: § As proven in several supply chain expenditure studies conducted by HELP Logistics and KLU,
the majority of the expenditure of a relief operation is in the supply chain.
Assumption: saving potentials should be found here
§ Supply chains are complex systems with a great level of interconnectedness amongst actors
involved.

Investing in Supply Chain Preparedness 2
Assumption: supply chain investments cannot be looked at in isolation but from a holistic view point
§ The RoI model has been designed to reflect and analyse a real operational environment.
Assumption: the successful set-up and application of the model depend heavily on a critical
mass of data input provided by the participating organisation
§ Preparedness investments take time until they fully unfold.
Assumption: the time between investment decision and disaster to happen has strong impact on the calculated return of investment
§ Investments cost can be one-off (e.g. development of IT system) or continuous (e.g. holding
cost for pre-positioned items)
To apply the model in practice as part of an analysis project the methodology in Figure 5 is followed.
Figure 5: Methodology of the RoI model
Define Baseline Scenario (Without Investment)
• Develop common understanding of the emergency supply chain
• Define the disaster context and response operation parameters
• Describe the baseline scenario
• Inject data for the baseline scenario model
Design Investment Scenario
• Identify and discuss investment opportunities
• Analyse interrelations and synergies
• Evaluate impact on supply chain
Calculate Return of Investment
• Compare baseline and investment scenario
• Identify maximum RoI ratio in terms of cost and time
• Show trend of RoI over time

Investing in Supply Chain Preparedness 3
3. APPLICATION OF THE MODEL
3.1 Phase 1: Define Baseline Scenario The baseline scenario forms the foundation of the subsequent modelling process as it frames the
operational context and provides the first set of supply chain data. The following steps are essential
elements of the design phase and were completed in close collaboration with SCI staff from Headquarters, Regional Office Asia Pacific and Country Office Philippines.
3.1.1 Develop Common Understanding of the Emergency Supply Chain SCI is an international non-governmental organisation (NGO) operating across the world to give
children a healthy start in life, the opportunity to learn and protection from harm. When a major
disaster strikes, SCI follows its humanitarian crisis protocol to plan and design the response according to the identified needs. Depending on the scale of the disaster, the response is either coordinated by
the national office (Category 3-5), regional office (Category 2) or international headquarters
(Category 1). To provide assistance to the affected population in a timely manner, a well-functioning
supply chain is of utmost importance for SCI. Despite the fact that cash transfer programmes are on the rise, there is, in most cases, still large amounts of cargo (relief items as well as equipment) which
have to be moved to the country and to the disaster zone. Critical supply chain processes encompass
needs assessment, procurement and sourcing, transportation, storage and distribution. To source for
the urgently needed relief goods, SCI can draw upon the following sourcing options:
§ International suppliers
§ Established prepositioning hubs in Brindisi (Europe), Dubai (world-wide coverage) and
Subang (Asia)
§ Local suppliers in the country
§ In-kind donations (both internationally and locally)
The goods are then, subject to the chosen sourcing option, flown or shipped into the affected country. Within the country, road transport is the usual choice to move goods further to the
response destination. However, in some countries, for example in the Philippines, boats or ferries as
well as smaller aircrafts or helicopters are needed to overcome access constraints (e.g. due to
infrastructure damages). Figure 6 shows SCI’s general supply set up in the context of a major response in the Philippines.

Investing in Supply Chain Preparedness 4
Figure 6: General SCI supply chain in the context of the Philippines
3.1.2 Define the Disaster Context and Response Operation Parameters The disaster which is to be analysed by the model should be an operation of significant size and
relevance to the organisation. The duration of the response reflects the time the organisation is
operating in emergency mode. The commodity is recommended to have a certain degree of
standardisation, long shelf life, be distributed in large volume and to be available both locally and internationally. SCI selected the context of the typhoon Haiyan in the Philippines (November 2013)
due to its magnitude, available operational data and the advanced preparedness level the country
has reached over recent years. The response period was estimated at 180 days which reflects the
time SCI operated in emergency mode after the typhoon made landfall. In regards the chosen commodity, blankets met the criteria and were procured in large quantities (68’533) throughout the
actual Haiyan response.

Investing in Supply Chain Preparedness 5
Figure 7: Loading of blankets during the typhoon Haiyan response
3.1.3 Describe the Baseline Scenario For the SCI baseline scenario, the needed blankets are neither pre-positioned at any of the hubs, nor available locally and are also not donated in-kind. Therefore, international sourcing from a supplier in
Nairobi (Kenya) is the only valid option. The blankets are flown into Cebu which, besides Manila, is
the main entry point for international humanitarian cargo in the Philippines. The onward
transportation from Cebu to the affected locations is done through a combination of sea and road. Trucks are the predominant transport means using so-called roll-on-roll-off (RoRo) services or
general ferry boats when crossing waters. The main warehouse of the baseline scenario is based in
Cebu and serves as the critical transhipment point for large volumes arriving at the airport. Field
warehouses, rub halls as well as trucks parked on government compounds, are used as temporary storage in the disaster-hit regions of Roxas/Estancia, Tacloban and Ormoc. From these locations,
items are distributed to the beneficiaries.
Classified as category 1, the Haiyan response was led by SCI’s Headquarters in the UK. Overall, 25 international supply chain staff were deployed to manage and support the operation together with
86 local staff with supply chain relevant functions. Figure 8 shows SCI’s supply chain in the baseline
scenario.

Investing in Supply Chain Preparedness 6
Figure 8: Supply chain in SCI's baseline scenario
3.1.4 Inject Data for the Baseline Scenario Model Specific data on lead times, costs and capacities across all supply chain functions starting from assessment to final distribution were collected for injection in the baseline scenario model. Detailed
data and information provided can be found in the Annex.
3.2 Phase 2 Design Investment Scenario Based on the preparedness framework by Van Wassenhove (2006), 5 different investment elements (i.e. Personnel, IT/Processes, Prepositioning, Supplier Management and Local Actors/Communities)
were discussed with SCI. Concrete investment opportunities were gathered and put into the context
of the Haiyan response. The data that was used to identify the investment elements and evaluate
their impact is both quantitative and qualitative. Most data comes from historical sources and brainstorming sessions with relevant experts. Nevertheless, several assumptions were taken, jointly
with the SCI experts, in order to model the chosen scenario.

Investing in Supply Chain Preparedness 7
Personnel Context
The performance of SCI’s supply chain and, therefore, the overall response, depends heavily on the
capacity, productivity and the skill set of its staff. At the same time, Personnel expenses represent a major cost component in particular in the case of international deployments.
Investment Opportunity Investment Impact
For the case of the Philippines, SCI
identified the establishment of a roster of local and regional staff, a
comprehensive training and mentoring
programme to develop special
knowledge on particular supply chain functions as potential investment
opportunities.
In the model, those investments result, first of all, in a
reduced need for international deployments in the future. Based on the data collected, the cost of an international
deployment for a month can be as high as the yearly salary
of a staff from the country or the region. To reach the
maximal possible level of (local) staff capacity through investments related to Personnel, a time period of 730
days is anticipated. These days include not only trainings,
but also the build-up of a regional roster. During that time
period, the capacity is growing steadily which is reflected in the country readiness level in the model.
Synergies with other Investment Elements
Having dedicated staff capacity for improvement activities such as trainings and rosters will facilitate
the activities related to other investment elements such as Supplier Management and Local Actors. Likewise, investments in elements such as IT/Processes also increase the productivity and therefore
complement the enhancement of staff capacity.

Investing in Supply Chain Preparedness 8
IT/Processes Context
The speed and quality of information flowing in a supply chain is determined by the establishment of
streamlined processes, the information technology and systems backing those processes up.
Investment Opportunity Investment Impact
Based on SCI’s input, this investment element is
related to types of information technology and
the impact on SCI’s supply chain processes. Firstly, this would be telecommunication
equipment to be used on the ground such as
generators, satellite phones and laptops.
Communication between the field and the national office or global HQ is critical for SCI
response operations. Secondly, SCI considers
systems which are matching the operational
requirements, are well implemented and have great potential to increase the transparency and
streamline working processes. SCI has recognised
that potential and started investing into a world-wide procurement system Source-to-Pay, and is
currently analysing an upgrade of the warehouse
Inventory Management system (TIM) or,
alternatively, an investment in data analysis software such as Kobo.
Investing into this element will generate lead
time savings, in particular during the early stage
of the response such as needs assessment phase.
Synergies with other Investment Elements
Investments in IT/Processes will increase the productivity of staff as it reduces the need for manual data input as well as lengthy authorisation processes and increases the visibility on available stock
piles and suppliers.
Investing in Supply Chain Preparedness 9
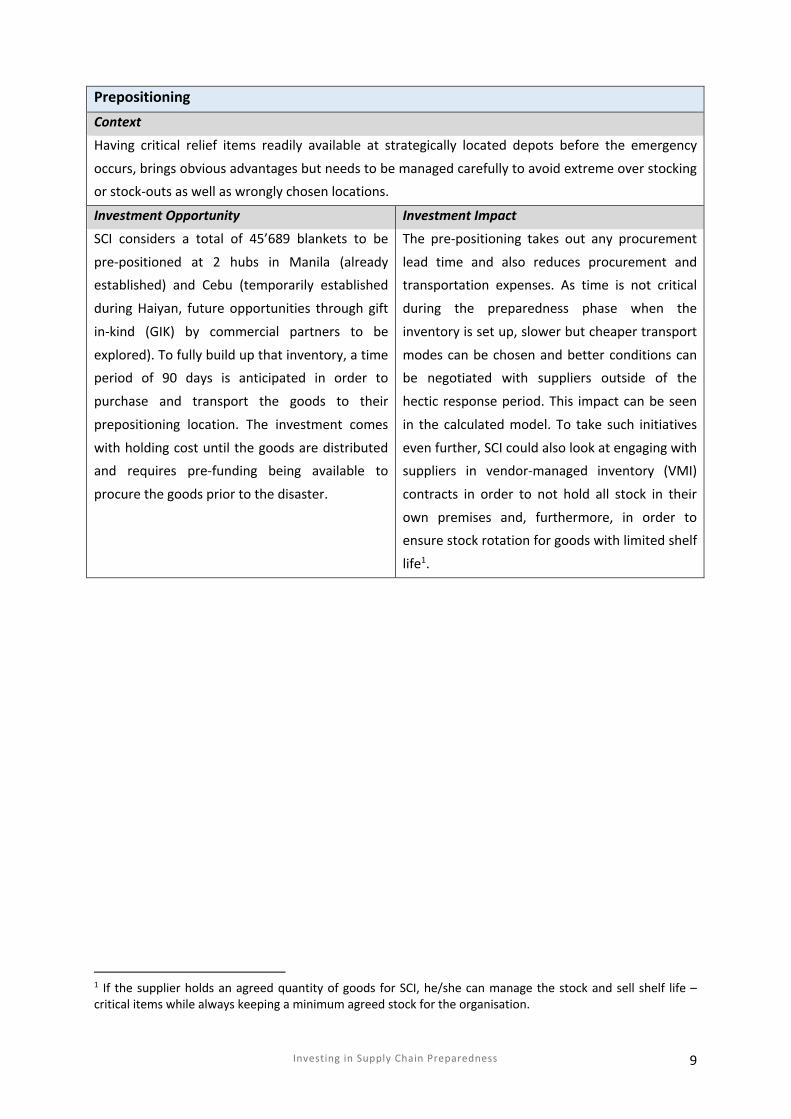
Prepositioning Context
Having critical relief items readily available at strategically located depots before the emergency
occurs, brings obvious advantages but needs to be managed carefully to avoid extreme over stocking or stock-outs as well as wrongly chosen locations.
Investment Opportunity Investment Impact
SCI considers a total of 45’689 blankets to be
pre-positioned at 2 hubs in Manila (already established) and Cebu (temporarily established
during Haiyan, future opportunities through gift
in-kind (GIK) by commercial partners to be
explored). To fully build up that inventory, a time period of 90 days is anticipated in order to
purchase and transport the goods to their
prepositioning location. The investment comes
with holding cost until the goods are distributed and requires pre-funding being available to
procure the goods prior to the disaster.
The pre-positioning takes out any procurement
lead time and also reduces procurement and transportation expenses. As time is not critical
during the preparedness phase when the
inventory is set up, slower but cheaper transport
modes can be chosen and better conditions can be negotiated with suppliers outside of the
hectic response period. This impact can be seen
in the calculated model. To take such initiatives
even further, SCI could also look at engaging with suppliers in vendor-managed inventory (VMI)
contracts in order to not hold all stock in their
own premises and, furthermore, in order to ensure stock rotation for goods with limited shelf
life1.
1 If the supplier holds an agreed quantity of goods for SCI, he/she can manage the stock and sell shelf life – critical items while always keeping a minimum agreed stock for the organisation.

Investing in Supply Chain Preparedness 10
Supplier Management
Context Assessing local markets to identify and evaluate available suppliers and commodities, building relationships with selected suppliers and establishing framework agreements are the essence of
professional procurement practices. Note that even if the model does not consider cash
programmes, it should be mentioned that the market assessments carried out as part of this investment element can also serve as a foundation for the implementation of those.
Investment Opportunity Investment Impact
SCI acknowledges that these tasks require staff
with the necessary competencies to conduct analyses and engage with the suppliers as well as
transportation service providers. To reach that
competency level, SCI would invest the time of
one local employee and train the national team to carry out these activities.
In-depth market knowledge on available goods
and guaranteed quantities and prices through framework agreements result in savings of
procurement cost and time in the model. SCI
assumes that it takes 3 months to complete the
assessments and establish the agreements.

Investing in Supply Chain Preparedness 11
Local Actors/Communities Context
Two types of local actors are considered in this investment element. National governments play a
critical role by coordinating the overall response and controlling in-flow of international organisations and commodities. Another important actor is the non-affected neighbours and
communities as well as local NGOs in the disaster region that are typically the first responders and
provider of assistance. Furthermore, they have great potential to support the following larger
response phase through knowledge of local context as well as assets such as temporary storage in sports halls or community centres.
Investment Opportunity Investment Impact
SCI expects that building good and trustful
relationships with government entities of the country as well as with local actors and NGOs at municipality
level will come with a number of advantages to SCI’s
large scale relief operations. Similar to the supplier
management investment element, the relationship management will be done through the investment of
local staff capacity and training of the national office
team. A preparedness time of 3 months is anticipated until the return of the investment can be expected.
The improved collaboration with national
government and municipalities will speed up the needs assessment (support from
municipality) and the custom process
(national government) and increase the
distribution capacity (support from municipality).

Investing in Supply Chain Preparedness 12
3.3 Phase 3 Calculate the Return on Investment Based on the pre-defined baseline scenario and the inputs provided on potential investments and their impact, the model calculates the maximum possible “RoI ratio” in terms of time and cost
savings over time (i.e. number of days between investment decision and disaster to hit). Figure 9
shows the development of investments in relation to the generated savings whilst Figure 10
represents the trend of the actual cost RoI.
Figure 9: Investments and cost savings over time
Figure 10: Trend of cost RoI

Investing in Supply Chain Preparedness 13
At day 90 (equal to 90 preparedness days), the optimal cost RoI ratio of 1:7 is reached. The investments made at that point in time across all elements (Figure 11) add up to USD 145’000
resulting in cost savings of USD 1’164’000 and reduction of 5 days in lead time (Figure 12 and 13).
Investments
Total Investments $145'463
HR / Personnel Trainings, capacity building officer (for the roster and the
talent programme), travel costs for MSU construction training
$17'138
IT & Processes Equipment, system improvement $58'198
Supplier
Management
Partner engagement officer (for Cebu market (services and
suppliers) and general CSR engagement (e.g. PAL)), travel costs Cebu
$8'638
Prepositioning MSUs $50'126
Local Actors Subgranting NGOs/governments for final distribution $11'364
Figure 11: Investments made
Results
Type the day when the catastrophe is happening (between 1 to 911 days) 90
Investments
Return on Investment ratio (RoI) 1:7
Country readiness level 45%
Investment made $145'463
Costs
Total expenditure without investment $2'811'131
Total expenditure with investment $1'647'268
Costs savings $1'163'863
Costs savings percentage 71%
Time
Total lead time without investment 21 Days
Total lead time with investment 16 Days
Lead time savings 5 Days
Lead time savings percentage 24%
Figure 12: Overall results at day 90

Investing in Supply Chain Preparedness 14
Figure 13: Reductions in cost and time at day 90
When taking a closer look at the investment status at day 90, it becomes obvious that, despite the
maximum cost RoI ratio reached, not all investments have fully materialised yet at that point in time (e.g. readiness level only at 45%). While the cost RoI stabilises at around 1:4 after those 90 days, the
model presents further lead time saving potential. At day 106, the overall lead time to reach the
affected population can be reduced from 21 to 5 days (i.e. 16 days saving and with a total investment of USD 146’000).

Investing in Supply Chain Preparedness 15
4. CONCLUSION
This study was conducted to investigate whether the paradigm of 1 USD being invested in
preparedness measures prior to the emergency could save SCI up to 7 USD during the response. The results of the study provided indeed a clear picture that this hypothesis can hold true in the chosen
context.
It was found that, in the scenario of SCI’s blanket supply chain in the Philippines Haiyan response, the
ratio 1:7 can be reached and the lead time reduced by 16 days by investing in the 5 identified
elements (i.e. Personnel, IT/Processes, Pre-positioning, Supplier Engagement and Local Actors) over a
preparedness period of 3-4 months.
Interestingly, the model demonstrates that even if the cost RoI ratio declines after the maximum of
1:7 has been reached, it then stabilises at around 1:4 for a long period of time. The reason being the
strong investment focus on local supply chain capacity building which reduces the need for costly international deployments and international air shipments and benefit the organisation over a long
term basis. The combination of investment elements which complement each other reveals
synergies and further optimisation could be expected over time. The model does not take into
consideration the use of pre-positioned commodities or local staff in responses outside of the Philippines (which is partially already done by SCI and was subsequently utilised in the Nepal
Earthquake response). This additional aspect would increase the RoI ratio even more. The
investment in supply chain preparedness in the analysed context can therefore be considered as entirely beneficial with no risk of becoming disadvantageous to a situation when funding is only
provided in the aftermath of a disaster.
The findings of the study have been presented to a number of institutional donors at the Humanitarian Liaison Working Group meeting in Geneva on 17 September 2018. The presentation, in
particular the fact-based methodology, was very well received. The reaction showed the openness of
donors to change their view on traditional funding streams and channel more funding towards
supply chain preparedness.
Based on the lessons learnt from the 3 RoI studies (conducted with ACF France, IFRC and SCI), HELP
Logistics and KLU suggest the next steps could be focused on 3 possibilities.
Firstly, despite the success of the studies and the attention gained, more advocacy on the donor side
and also within humanitarian agencies is needed. The common understanding of the relevance and
potential of supply chain and in particular in preparedness is not widely accepted yet and requires further efforts. This study proves the RoI can be quantified in supply chains in humanitarian context.

Investing in Supply Chain Preparedness 16
Secondly, the implementation of the identified investment shall be given utmost priority. As the model shows, investments take time to fully unfold their potential and the next disasters will not
wait to happen. When implementing the investments, a comprehensive monitoring and evaluation
approach is needed to go along to measure the impact and supports the advocacy efforts further.
Thirdly, whilst the current model is based on an established framework, requests have been received
to expand the model. For example, it was suggested to add elements that represent the growing
relevance of cash programmes, allowing resources to be deployed outside of the analysed country
and looking into other return aspects beyond time and cost savings; such as environmental and social impact of supply chain preparedness investments.

Investing in Supply Chain Preparedness 17
ACKNOWLEDGEMENTS
This report was written by Lea Stegemann and Jonas Stumpf (HELP Logistics – A Programme of the
Kuehne Foundation). The authors would like to express their appreciation for the many inputs given by the SCI teams in the UK (particularly Susan Hodgson) as well as Singapore and the Philippines
(particularly Allan Tuazon, Michel Rooijackers, Abohair Candado, Karen Rachel Simon, Bobby F.
Fugnit and Rino Sudibyo). Furthermore, we would like to express our gratitude for the support from
Kuehne Foundation and Kuehne Logistics University that was provided throughout the process (Seán Rafter and Professor Maria Besiou).
REFERENCES
Guerrero-Garcia, S., Lamarche, J.-B., Vince, R., Cahill, S., & Besiou, M. (2016). Delivering in a Moving
World
UNDP (2012). Putting resilience at the heart of development – Investing in prevention and resilient
recovery
Van Wassenhove, L. (2006). Humanitarian aid logistics: supply chain management in high gear.
Journal of the Operational Research Society, Vol. 57/5, 475-489.

Investing in Supply Chain Preparedness 18


HELP Logistics AG
Dorfstrasse 50
CH–8834 Schindellegi
Tel. +41 44 786 96 70 [email protected]
www.kuehne-stiftung.org