Embed Size (px)
Citation preview
Investing in China
Frederick Jiang, CFA
Ways to Play China
ADRs
Local Shares in Hong Kong
Index ETF
Mutual Funds (Asia, China, Emerging Market)
Multi-National Companies with Big China Exposure
Not for Faint Heart
Volatility Can be Very High in Down Turn
Less Transparency and Different Accouting
Stick to Mid to Large Cap Names
Be Patient
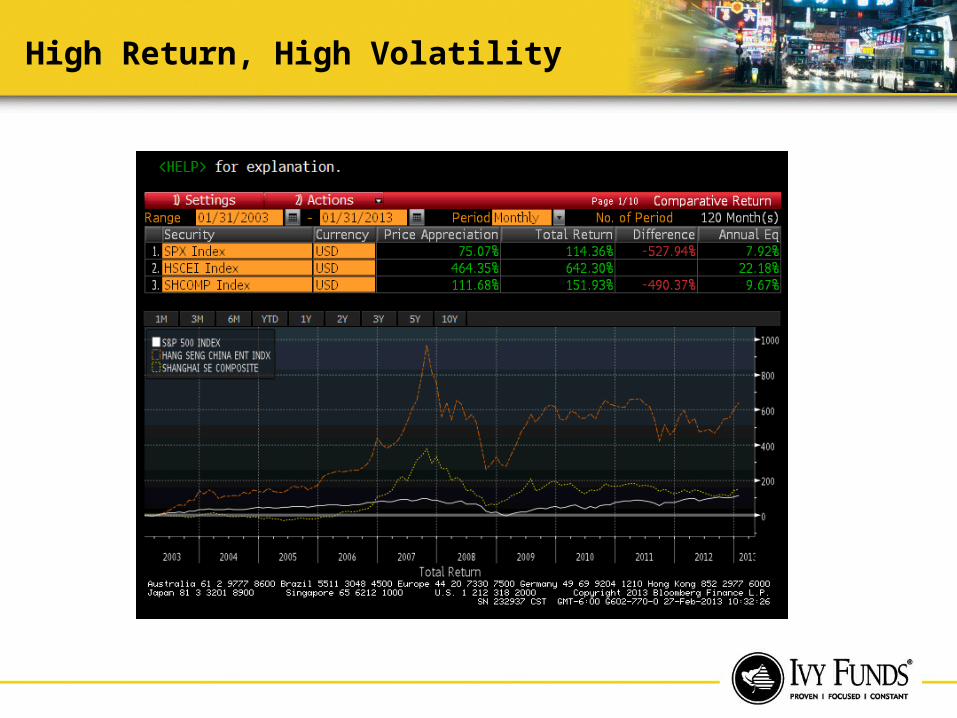
High Return, High Volatility

Consistent Earnings Growth
Hang Seng China Enterprises Index - EPS
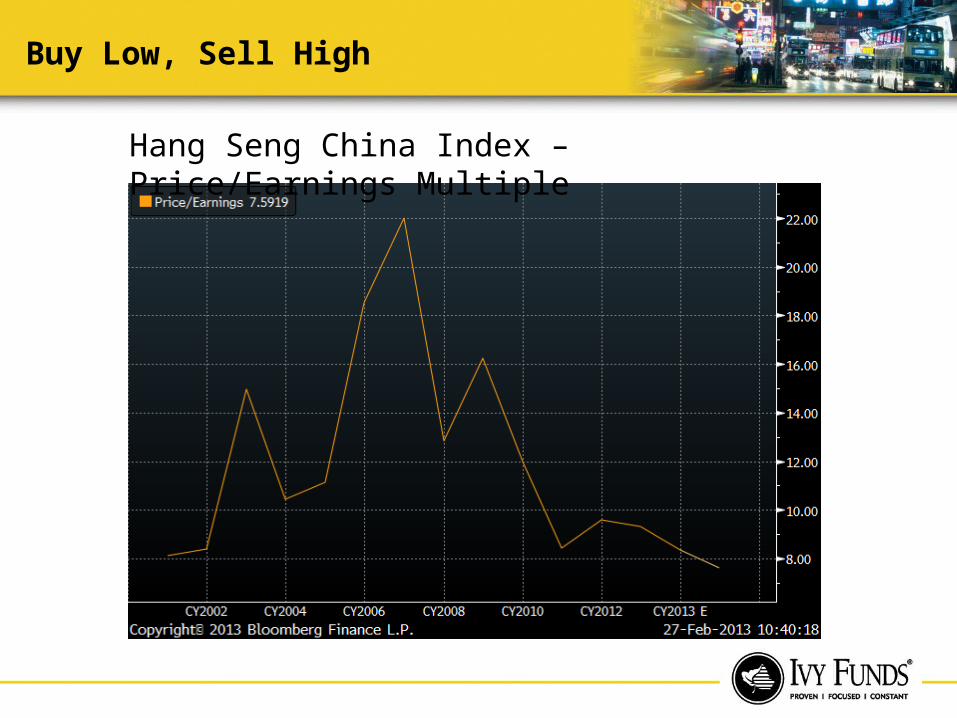
Buy Low, Sell High
Hang Seng China Index – Price/Earnings Multiple

Opinions Diverged
China will overtake the U.S. to become the world’s largest economy. ---- Jim O’Neil, Goldman Sachs
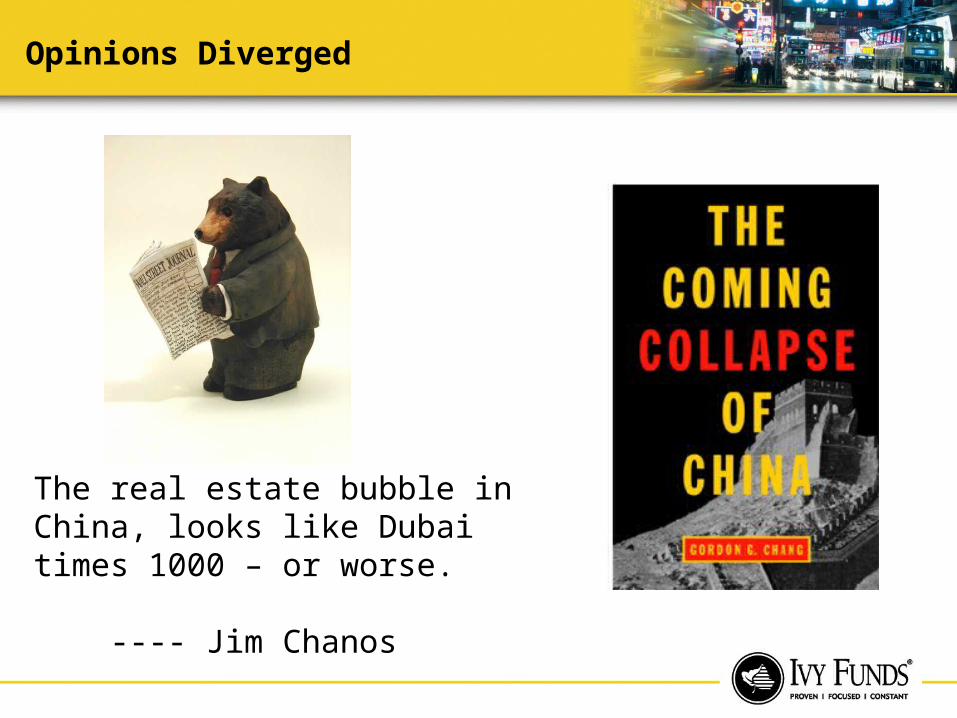
Opinions Diverged
The real estate bubble in China, looks like Dubai times 1000 – or worse.
---- Jim Chanos

Looking Back – GDP in US$
CAGR 10.2%
CAGR 2.9%
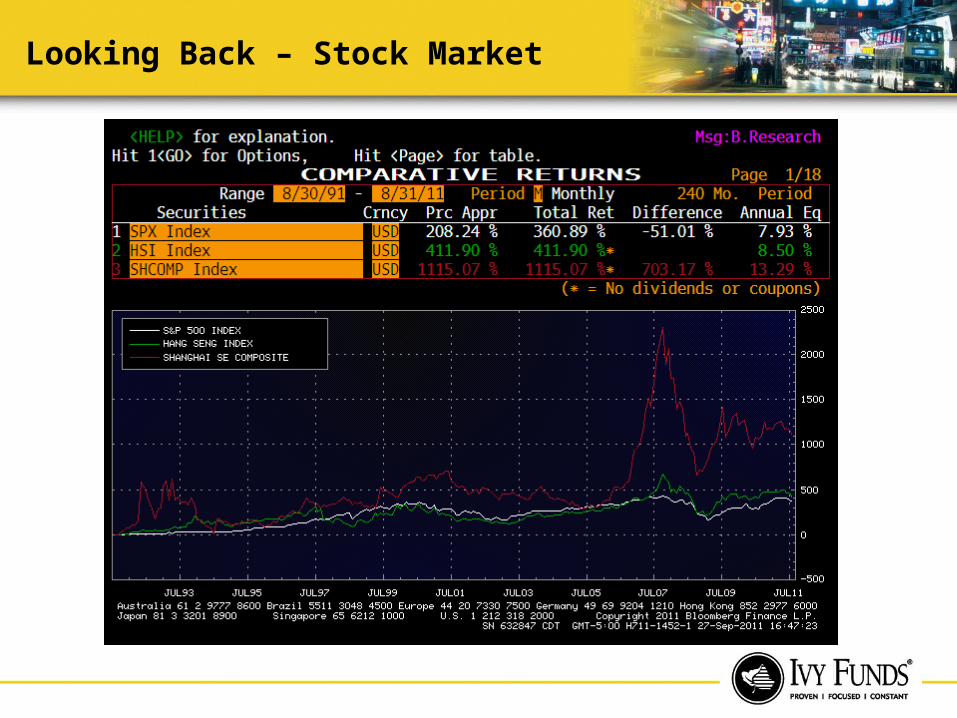
Looking Back – Stock Market
What drives China’s Growth?
• Reform and Restructuring• Urbanization and Industrialization• Demography Dividend and Education• Savings and Capital Formation• Globalization

Reform and Restructuring
From Communist to Socialist with Chinese CharacteristicsFrom Central Planning to Market Driven EconomyFrom Closed-Door policy to Open-Door PolicyFrom Dictatorship to “Centralized Democratic” Decision MakingPrivatization

What Drives China’s Growth?
• Reform and Restructuring• Urbanization and Industrialization• Demography Dividend and Education• Savings and Capital Formation• Globalization
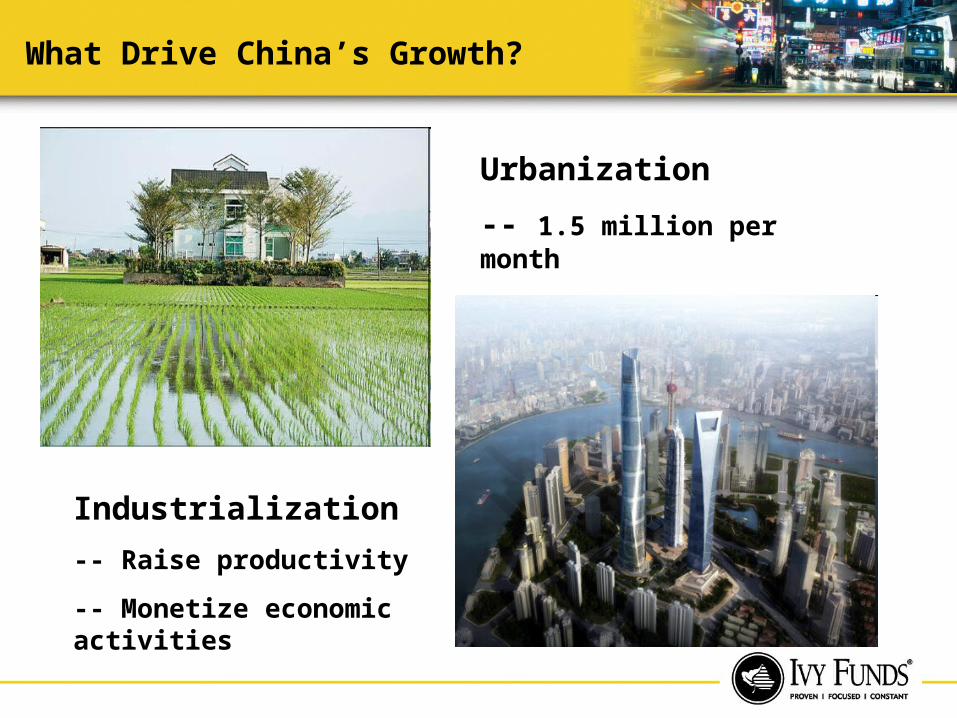
What Drive China’s Growth?
Urbanization
-- 1.5 million per month
Industrialization
-- Raise productivity
-- Monetize economic activities

Urban / Total Population
(%) 2000 2005 2010 2015 2020 2025 2030
Australia 87.2 88.2 89.1 89.9 90.6 91.3 91.9
China 35.8 40.4 44.9 49.2 53.2 56.9 60.3
Hong Kong 100 100 100 100 100 100 100
India 27.7 28.7 30.1 31.9 34.3 37.2 40.6
Indonesia 42.0 48.1 53.7 58.5 62.6 65.9 68.9
Japan 65.2 66.0 66.8 68.0 69.4 71.1 73
Korea 79.6 80.8 81.9 83.1 84.2 85.2 86.3
Malaysia 62.0 67.6 72.2 75.7 78.5 80.5 82.2
Pakistan 33.2 34.9 37.0 39.7 42.8 46.3 49.8
Philippines 58.5 62.7 66.4 69.6 72.3 74.6 76.7
Singapore 100 100 100 100 100 100 100
Thailand 31.1 32.3 34.0 36.2 38.9 42.2 45.8
Vietnam 24.3 26.4 28.8 31.6 34.7 38.1 41.8
Asia 37.1 39.7 42.5 45.3 48.1 51.1 54.1
US 79.1 80.8 82.3 83.7 84.9 86.0 87.0
Latin America 75.3 77.5 79.4 80.9 82.3 83.5 84.6
Western Europe 75.3 76.1 77.0 78.0 79.1 80.4 81.7
Source: United Nations, CLSA Asia-Pacific Markets

What Drives China’s Growth?
• Reform and Restructuring• Urbanization and Industrialization• Demography Dividend and Education• Savings and Capital Formation• Globalization

Demography and Education
Demography Dividend
China’s Baby-boomer Generation
Young and Educated
With money, Will spend
0.0
1.0
2.0
3.0
4.0
5.0
6.0
7.0
1977
1980
1983
1986
1989
1992
1995
1998
2001
2004
2007
2010
New ly enrolled Fresh graduates
mnCollege Enrollment
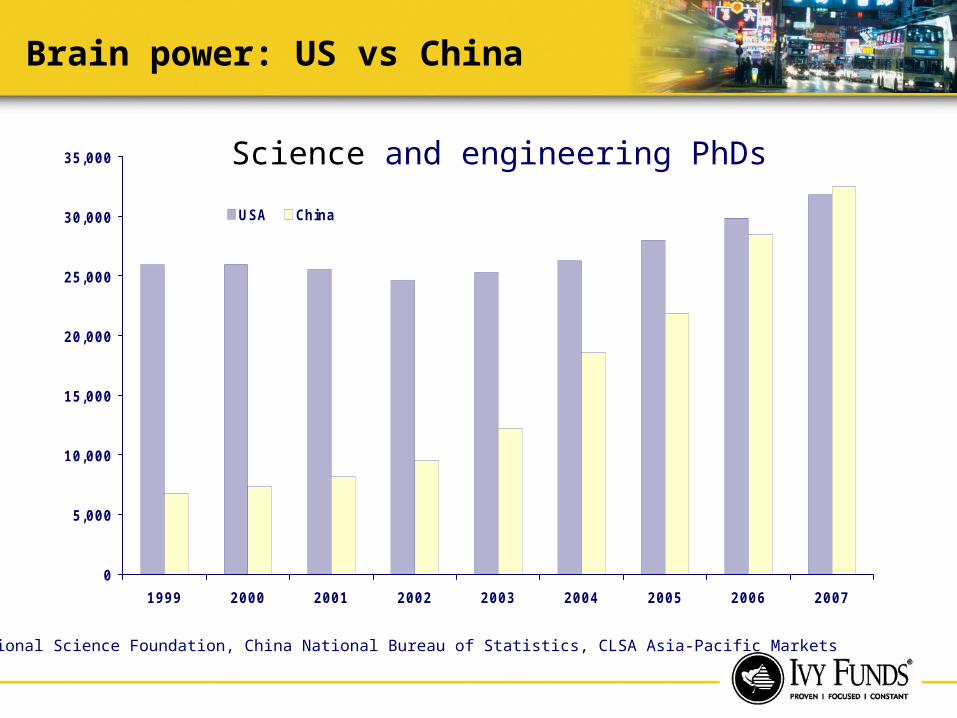
Brain power: US vs China
0
5,000
10,000
15,000
20,000
25,000
30,000
35,000
1999 2000 2001 2002 2003 2004 2005 2006 2007
USA China
(No.) Science and engineering PhDs
Source: National Science Foundation, China National Bureau of Statistics, CLSA Asia-Pacific Markets
What Drives China’s Growth?
• Reform and Restructuring• Urbanization and Industrialization• Demography Dividend and Education• Savings and Capital Formation• Globalization
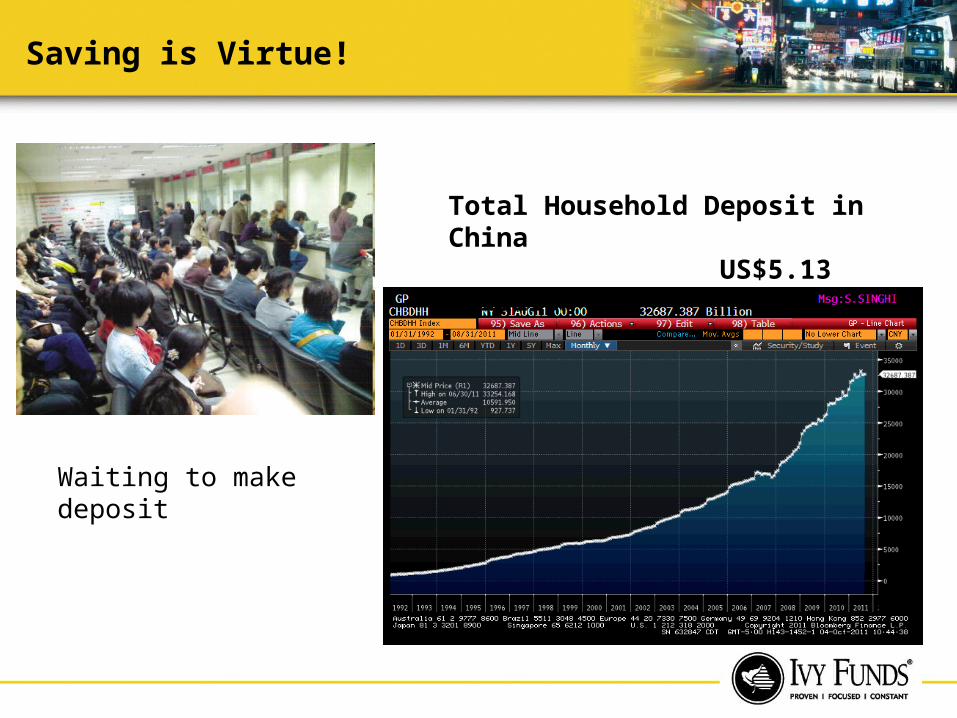
Saving is Virtue!
Waiting to make deposit
Total Deposit
Total Household Deposit in China US$5.13 Trillion

Household Savings / Disposable Income
0 10 20 30 40
USA
Philippines
J apan
Taiwan
Australia
Thailand
Indonesia
South Korea
Malaysia
India
Hong Kong
Singapore
China
(% )
Source: Euromonitor, CLSA Asia-Pacific Markets
Higher Savings Ratio,
Higher Capital Formation,
Higher Growth Rate

What Drives China’s Growth?
• Reform and Restructuring• Urbanization and Industrialization• Demography Dividend and Education• Savings and Capital Formation• Globalization
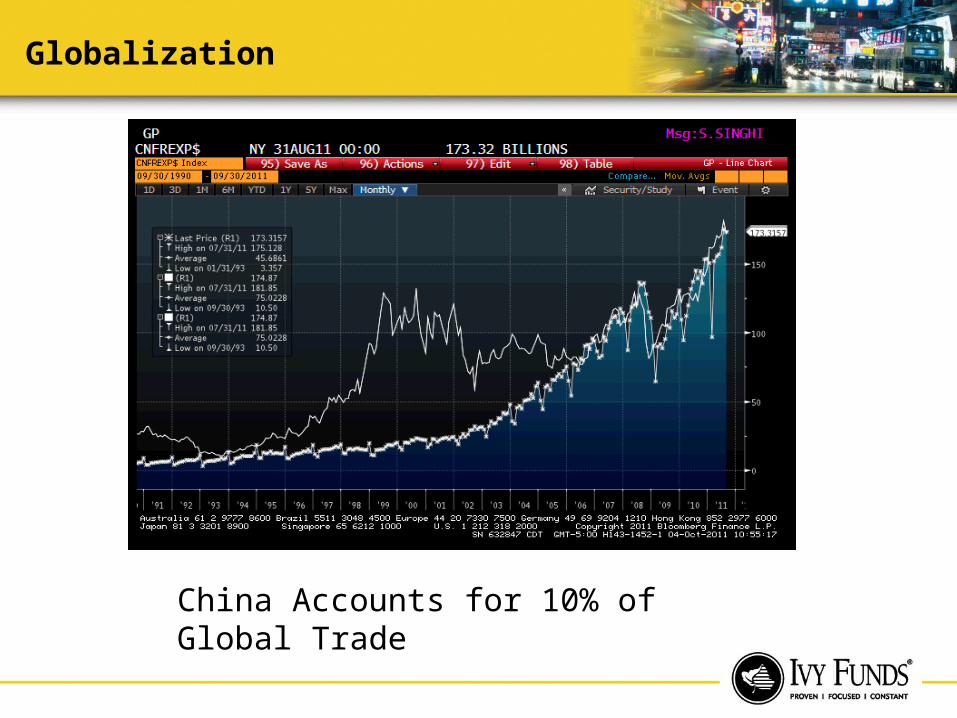
Globalization
China Accounts for 10% of Global Trade
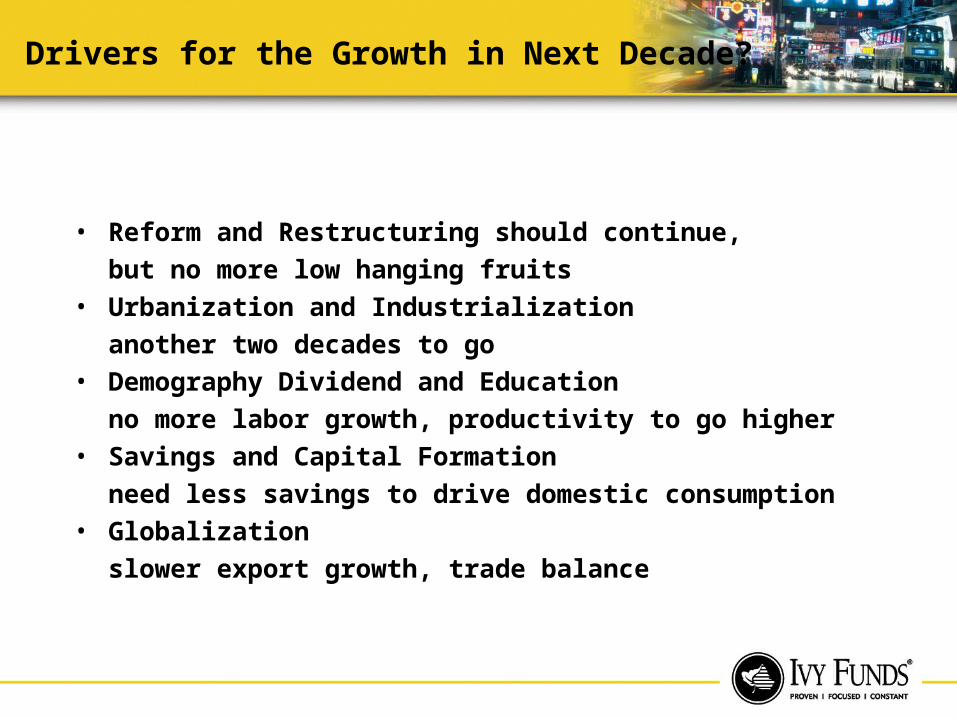
Drivers for the Growth in Next Decade?
• Reform and Restructuring should continue,
but no more low hanging fruits• Urbanization and Industrialization
another two decades to go• Demography Dividend and Education
no more labor growth, productivity to go higher• Savings and Capital Formation
need less savings to drive domestic consumption• Globalization
slower export growth, trade balance

No More Double Digit Growth
0
2
4
6
8
10
12
14
16
1980
1982
1984
1986
1988
1990
1992
1994
1996
1998
2000
2002
2004
2006
2008
2010
2012
2014
2016
2018
2020
2022
2024
2026
GDP grow th
%

Power of Compounding
0
5000
10000
15000
20000
25000
30000
US
$ B
illi
on
Year
GDP Comparison
China
US
India
Key Assumption China India U.S.
Real GDP 7% 6% 2%
Inflation 3% 4% 2%
Currency Appreciation 2% 1%
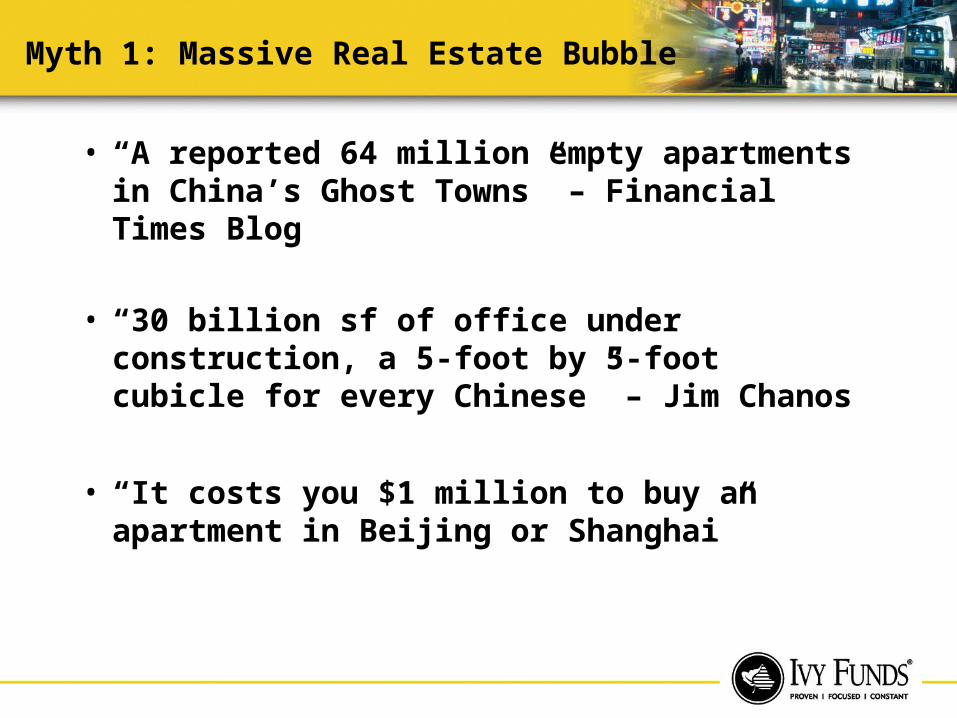
Myth 1: Massive Real Estate Bubble
• “A reported 64 million empty apartments in China’s Ghost Towns” – Financial Times Blog
• “30 billion sf of office under construction, a 5-foot by 5-foot cubicle for every Chinese” – Jim Chanos
• “It costs you $1 million to buy an apartment in Beijing or Shanghai”
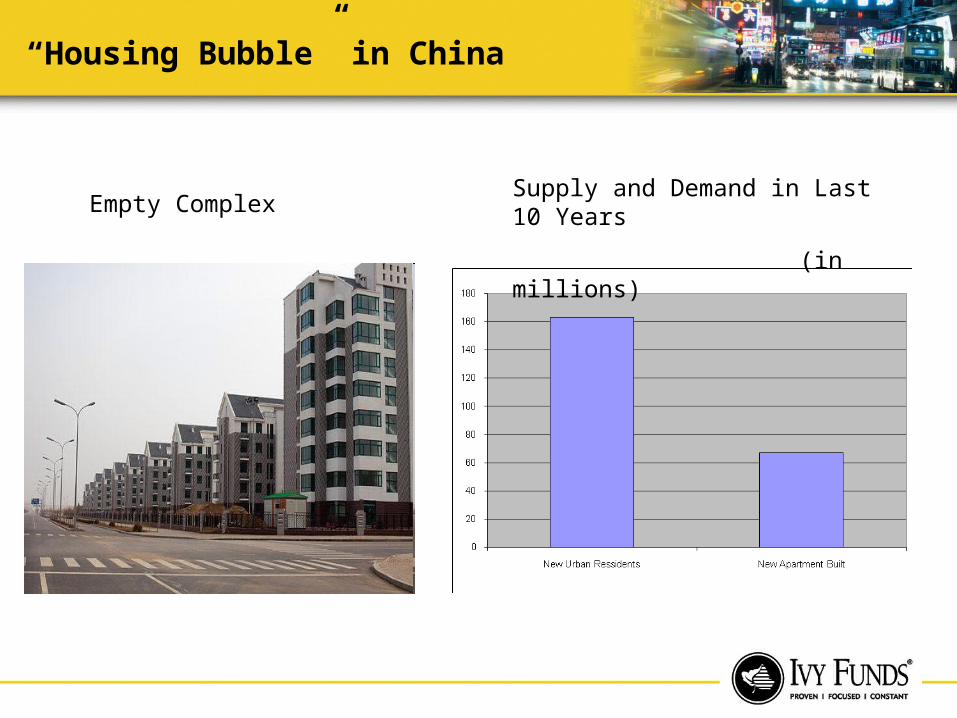
“Housing Bubble” in China
Supply and Demand in Last 10 Years
(in millions)Empty Complex

“Housing Bubble” in China
0
100
200
300
400
500
600
70019
95
1996
1997
1998
1999
2000
2001
2002
2003
2004
2005
2006
2007
2008
2009
0
5
10
15
20
25
30
35
40
45
New homes (floor space, LHS) New homes/new urban population (RHS)
sqm, mn sqm per person
Source: National Statistic Bureau
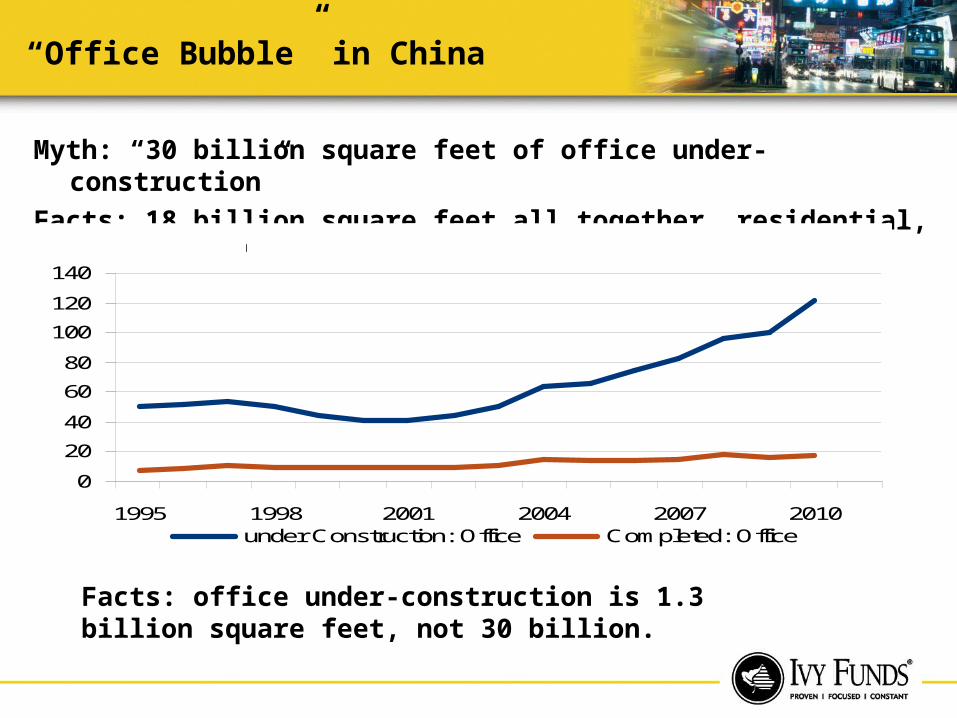
“Office Bubble” in China
Myth: “30 billion square feet of office under-construction”
Facts: 18 billion square feet all together, residential, office, commercial.
0
20
40
60
80
100
120
140
1995 1998 2001 2004 2007 2010under Construction: Office Completed: Office
square meter, mn
Facts: office under-construction is 1.3 billion square feet, not 30 billion.

“Housing Price Bubble” in China
0
5
10
15
20
25
30
19
95
19
96
19
97
19
98
19
99
20
00
20
01
20
02
20
03
20
04
20
05
20
06
20
07
20
08
20
09
20
10
NationalBeijingShanghai
thousand RMB per sqm
Source: Merrill Lynch Economic Research
Myth: $1 million apartment in Shanghai and BeijingFact: Average price is 300K-400K in BJ and SH, and nation wide average price is less than $80,000 in urban area.

Chinese Cities are Quite “Small”
0.0
5.0
10.0
15.0
20.0
25.0
Beijing Shanghai New
York
City
Tokyo Mexico
City
Moscow Bangkok London Seoul
% of city population to national population
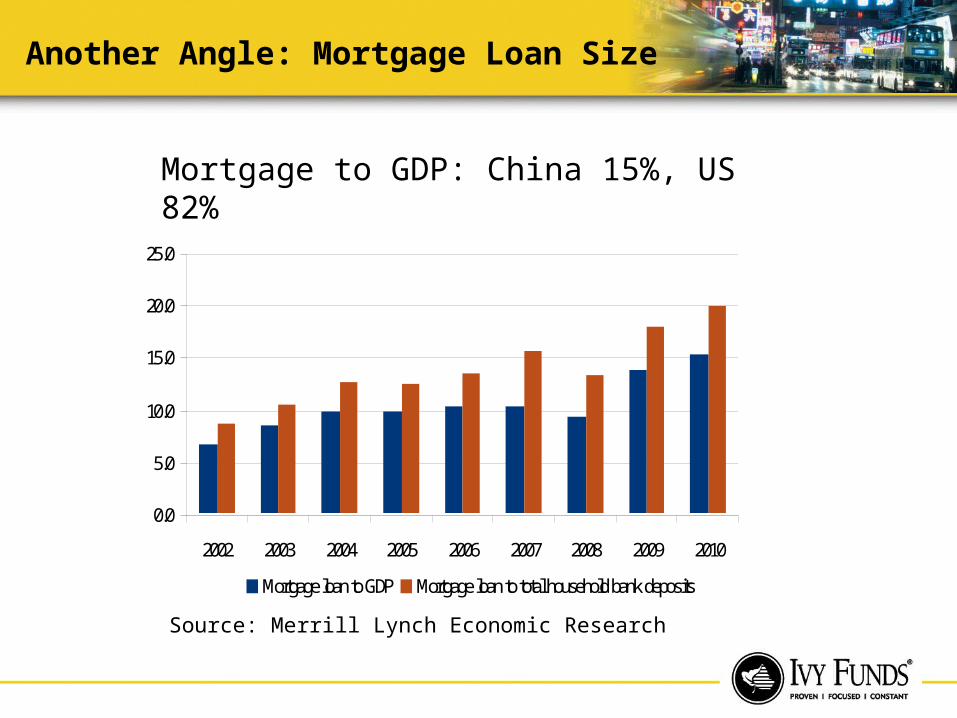
Another Angle: Mortgage Loan Size
0.0
5.0
10.0
15.0
20.0
25.0
2002 2003 2004 2005 2006 2007 2008 2009 2010
Mortgage loan to GDP Mortgage loan to total household bank deposits
%
Mortgage to GDP: China 15%, US 82%
Source: Merrill Lynch Economic Research

Myth 2: China is Export Driven
0
10
20
30
4019
80
1982
1984
1986
1988
1990
1992
1994
1996
1998
2000
2002
2004
2006
2008
2010
Ratio of ex ports to GDP
%

Gross Export vs. Net Value-Added
Average Selling Price $400
Ex-Factory Cost: $200
(reported in China’s export)
Value added in China: $6
(reported in GDP)

True Export Share
Source: UBS Economic Research and Waddell & Reed Estimate

GDP Composition
Source: Waddell & Reed Estimate
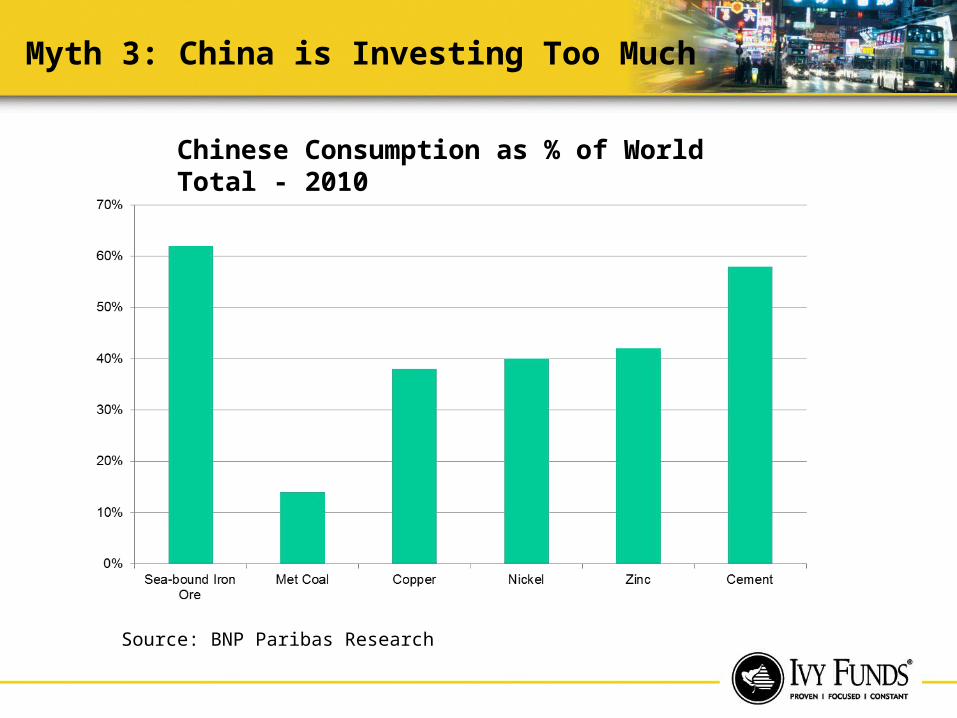
Myth 3: China is Investing Too Much
Chinese Consumption as % of World Total - 2010
Source: BNP Paribas Research
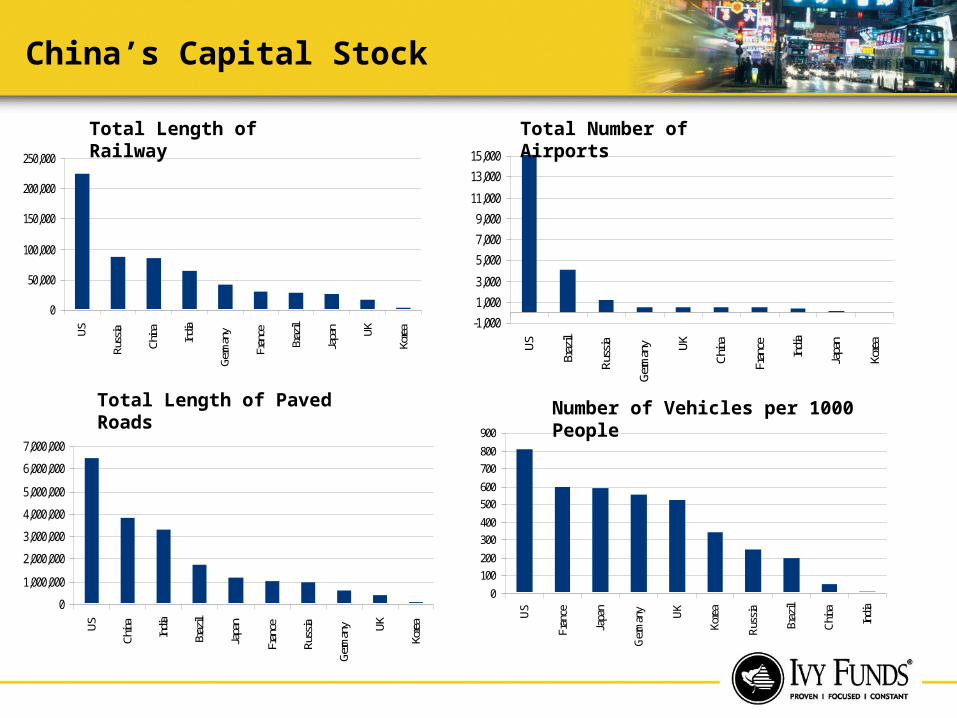
China’s Capital Stock
0
50,000
100,000
150,000
200,000
250,000
US
Russ
ia
China Ind
ia
Germ
any
Fran
ce
Braz
il
Japa
n UK
Kore
a
KM
-1,000
1,000
3,000
5,000
7,000
9,000
11,000
13,000
15,000
US
Braz
il
Russ
ia
Germ
any UK
China
Fran
ce India
Japa
n
Kore
a
0
1,000,000
2,000,000
3,000,000
4,000,000
5,000,000
6,000,000
7,000,000
US
China India
Braz
il
Japa
n
Fran
ce
Russ
ia
Germ
any UK
Kore
aKM
0
100200
300400
500600
700800
900
US
Fran
ce
Japa
n
Germ
any UK
Kore
a
Russ
ia
Braz
il
China India
Total Length of Railway Total Number of Airports
Total Length of Paved Roads Number of Vehicles per 1000 People

Per Capita Steel Production
0.00
0.20
0.40
0.60
0.80
1.00
1.20
1969
1971
1973
1975
1977
1979
1981
1983
1985
1987
1989
1991
1993
1995
1997
1999
2001
2003
2005
2007
2009
China Japan Korea US
Ton
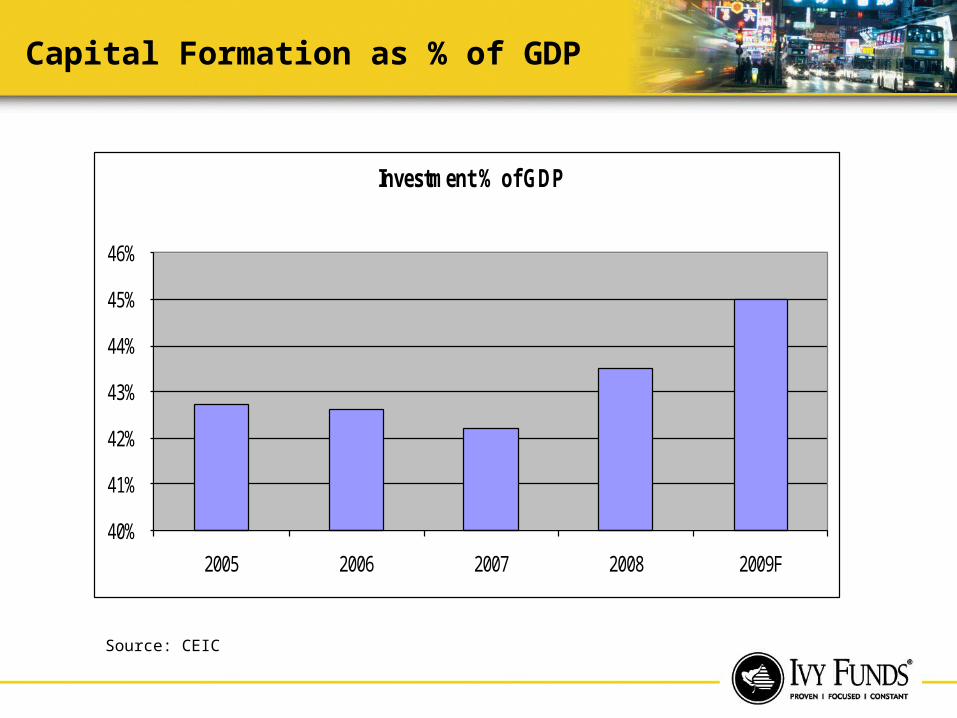
Capital Formation as % of GDP
40%
41%
42%
43%
44%
45%
46%
2005 2006 2007 2008 2009F
Investment % of GDP
Source: CEIC
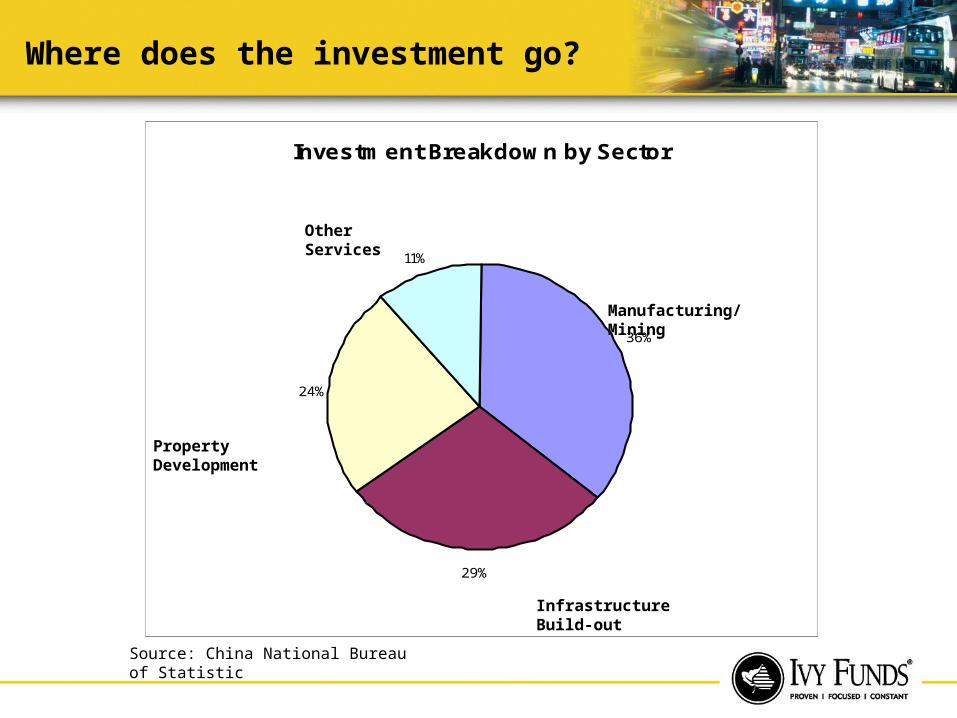
Where does the investment go?
Investment Breakdown by Sector
36%
29%
24%
11%
Manufacturing/Mining
Infrastructure Build-out
Property Development
Other Services
Source: China National Bureau of Statistic

What support investment growth?
Gross Saving Ratio
30.00%
40.00%
50.00%
60.00%
70.00%
80.00%
2005 2006 2007 2008 2009F
Source: CEIC
Myth 4: China’s Debt Bomb
“As the world watches the Greek credit crisis unfold, a Sino-debt disaster is brewing halfway around the world.”
Fortune Magazine, June 2011
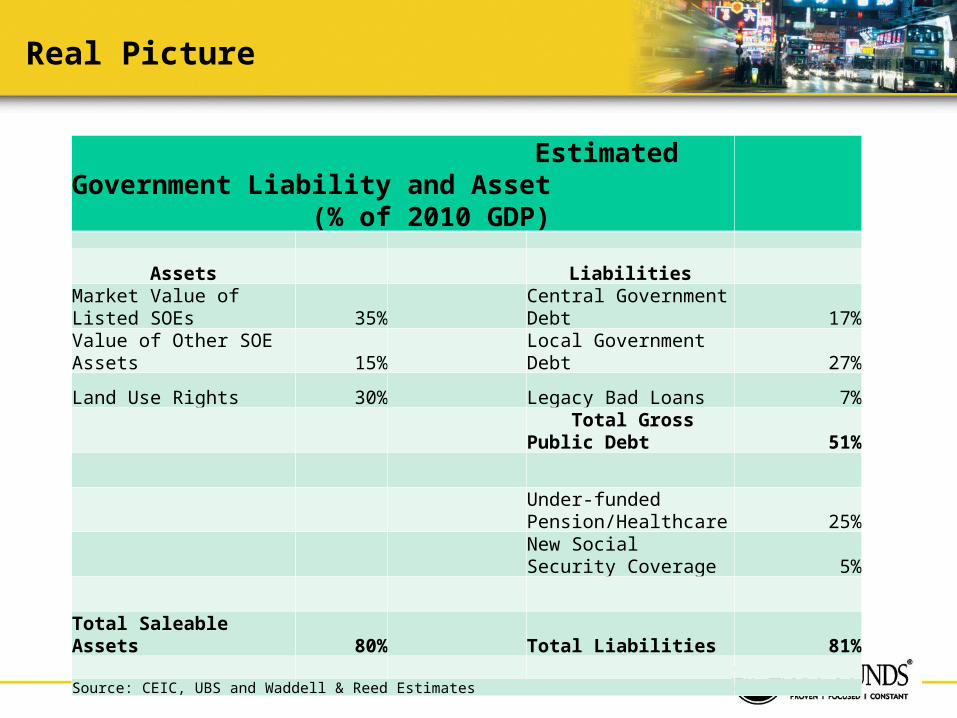
Real Picture
Estimated Government Liability and Asset (% of 2010 GDP)
Assets Liabilities
Market Value of Listed SOEs 35% Central Government Debt 17%
Value of Other SOE Assets 15% Local Government Debt 27%
Land Use Rights 30% Legacy Bad Loans 7%
Total Gross Public Debt 51%
Under-funded Pension/Healthcare 25%
New Social Security Coverage 5%
Total Saleable Assets 80% Total Liabilities 81%
Source: CEIC, UBS and Waddell & Reed Estimates
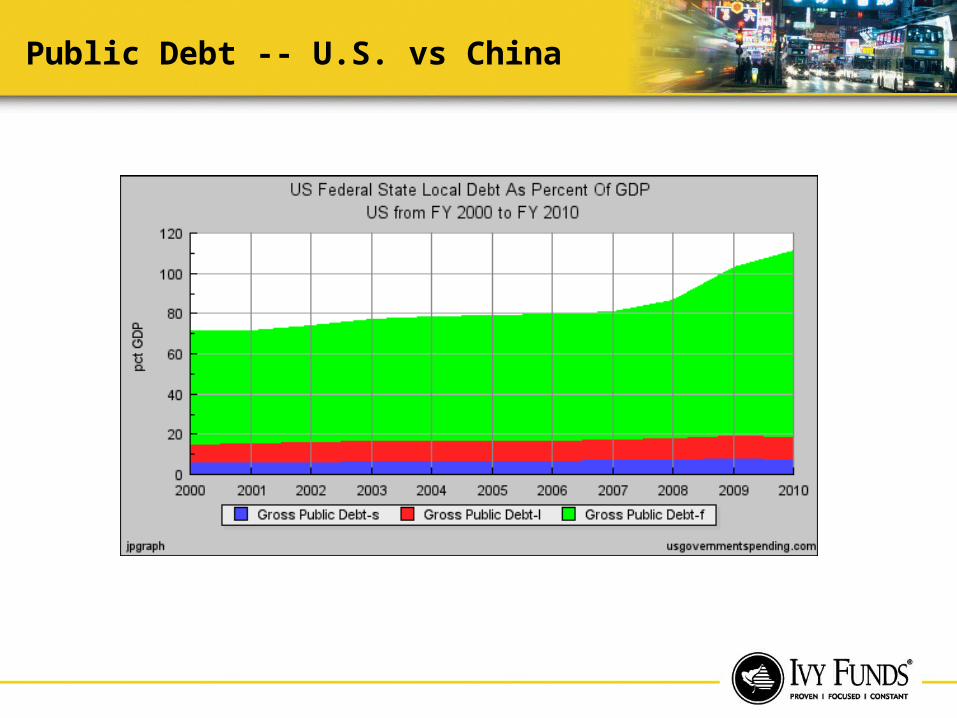
Public Debt -- U.S. vs China
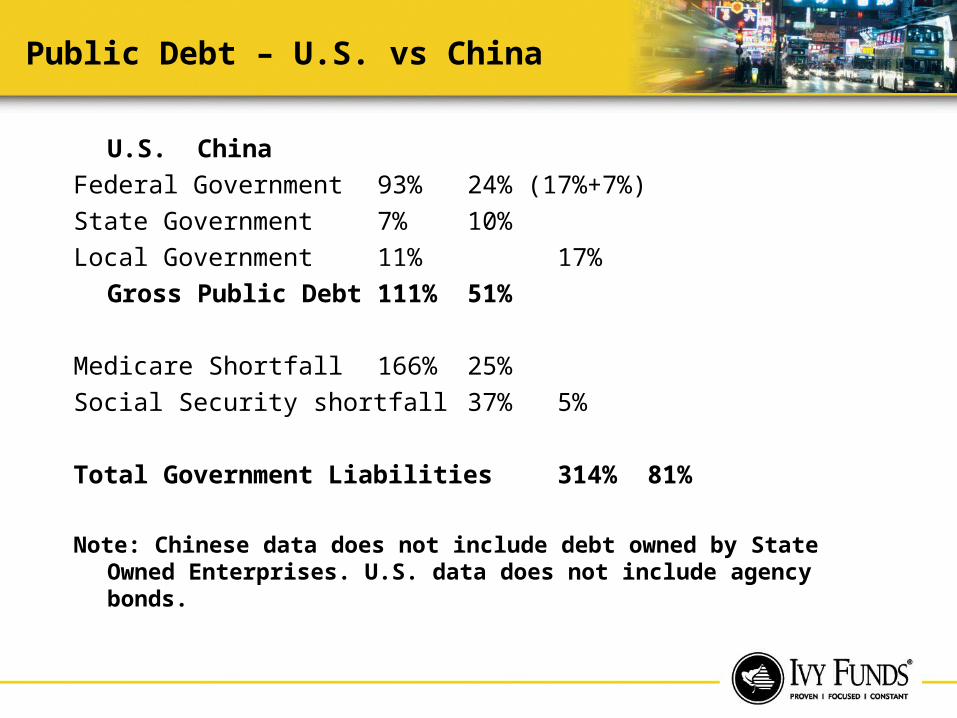
Public Debt – U.S. vs China
U.S. China
Federal Government 93% 24% (17%+7%)
State Government 7% 10%
Local Government 11% 17%
Gross Public Debt 111% 51%
Medicare Shortfall 166% 25%
Social Security shortfall 37% 5%
Total Government Liabilities 314% 81%
Note: Chinese data does not include debt owned by State Owned Enterprises. U.S. data does not include agency bonds.

Private Debt – China vs U.S.
Mortgage to GDP: China 15%, US 82%
Household Debt % of GDP
0%
20%
40%
60%
80%
100%
120%
China India Taiwan Korea US UK
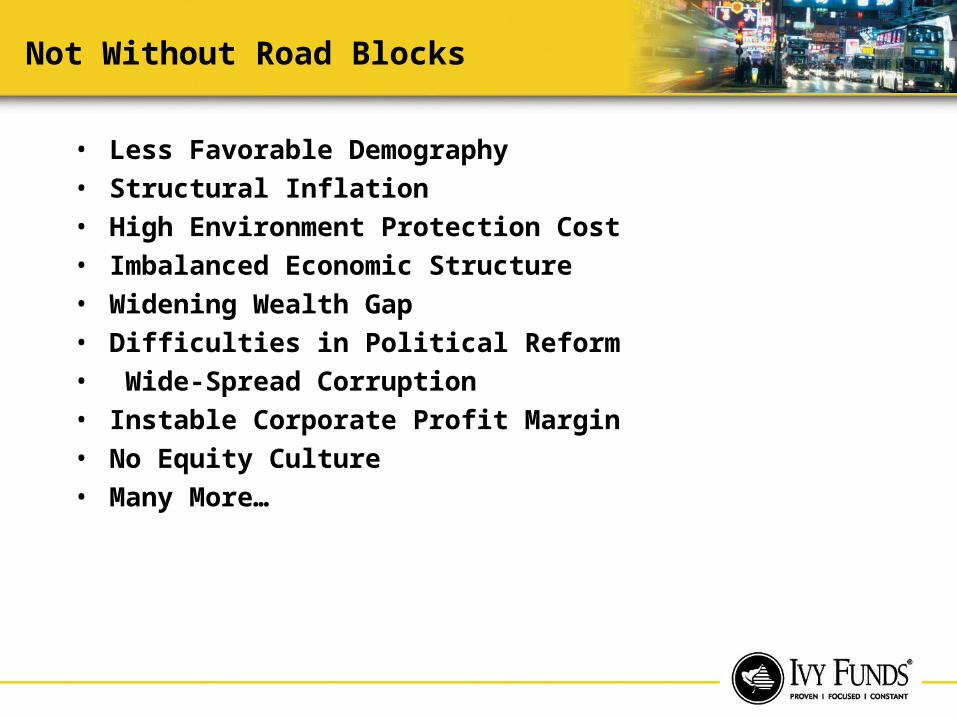
Not Without Road Blocks
• Less Favorable Demography• Structural Inflation• High Environment Protection Cost• Imbalanced Economic Structure• Widening Wealth Gap• Difficulties in Political Reform• Wide-Spread Corruption• Instable Corporate Profit Margin • No Equity Culture• Many More…
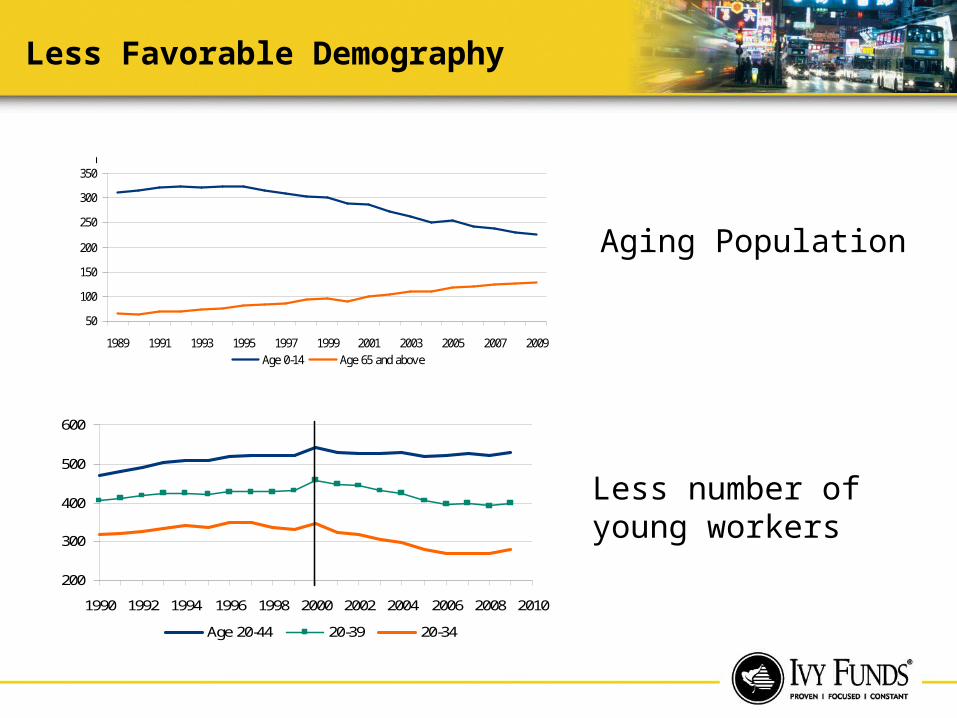
Less Favorable Demography
50
100
150
200
250
300
350
1989 1991 1993 1995 1997 1999 2001 2003 2005 2007 2009Age 0-14 Age 65 and abov e
mn
200
300
400
500
600
1990 1992 1994 1996 1998 2000 2002 2004 2006 2008 2010
Age 20-44 20-39 20-34
million person
Aging Population
Less number of young workers
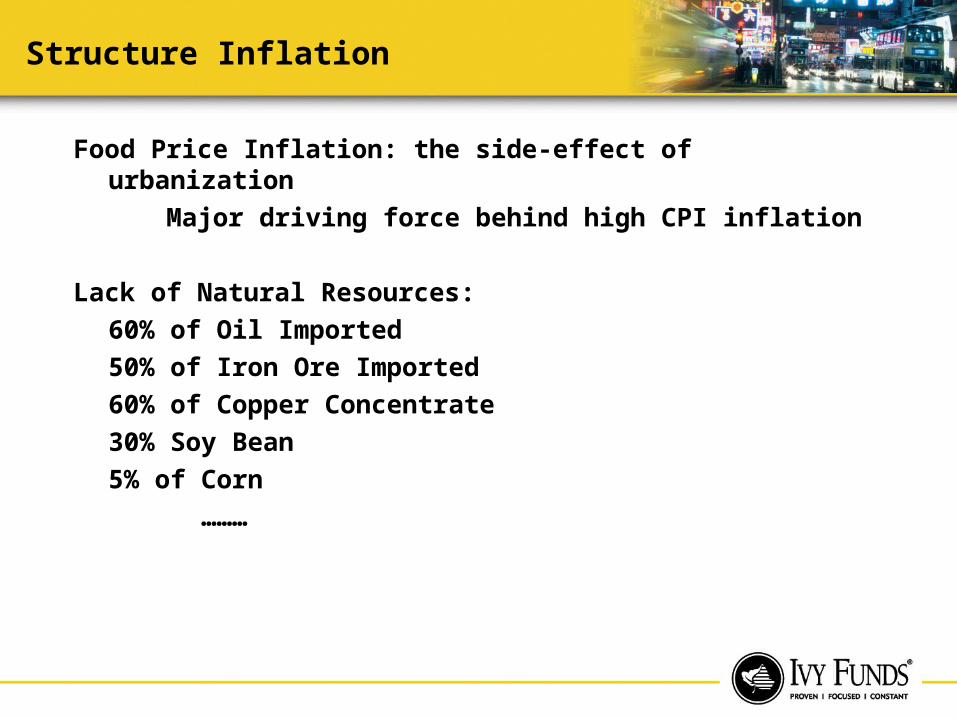
Structure Inflation
Food Price Inflation: the side-effect of urbanization
Major driving force behind high CPI inflation
Lack of Natural Resources:
60% of Oil Imported
50% of Iron Ore Imported
60% of Copper Concentrate
30% Soy Bean
5% of Corn
………

High Environmental Cost
Pollutions Cost China as Much as 2-3% of GDP
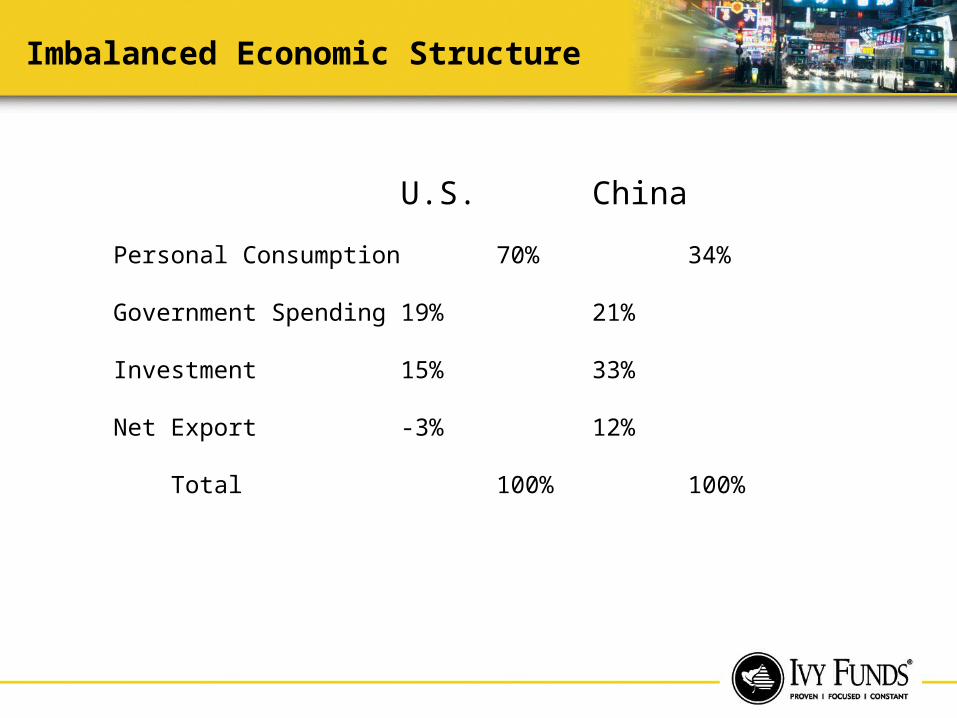
Imbalanced Economic Structure
U.S. China
Personal Consumption 70% 34%
Government Spending 19% 21%
Investment 15% 33%
Net Export -3% 12%
Total 100% 100%

Investment Implication
China Offers Long Term Growth Opportunities
Different Ways to Play China
Not for Faint Heart

Investment Implication
0
5000
10000
15000
20000
25000
30000
US
$ B
illi
on
Year
GDP Comparison
China
US
India
Key Assumption China India U.S.
Real GDP 7% 6% 2%
Inflation 3% 4% 2%
Currency Appreciation 2% 1%

$10,000 Growth at Different Rate
Assuming: 1. Chinese EPS grows at nominal GDP rate, US grows at 1.5X of GDP rate; 2. PE multiple and profit margin Stay the Same Over 10 Years.

Q & A