Embed Size (px)
Citation preview

Investing for ImpactFY20
Page 2
Investing for Impact
Contents
IFC Overview
3
Funding Program
24
Core Business Portfolio
20
Contacts
48
Annex
42
Financial Strength
13

Page 3
Investing for Impact
IFC Overview

Page 4
• A member of the World Bank Group with a mission to promotedevelopment through investment in private sector
• Owned by 185 member countries
• Providing debt (loans, bonds and other fixed income instruments)and equity investments to the private sector in emerging markets forover 60 years
• Global presence in almost 100 countries and working with over2,000 private sector clients
IFC Overview
Who we are

Page 5
IFC Overview
Uniquely Positioned Issuer
• Consistently rated AAA/Aaa
• 0% risk weighting under Basel framework
• A supranational institution with fully paid in capital
• Well capitalized: net worth exceeds a quarter of $99 billion balance sheet
• Consistently recorded operating profits every year since its founding
• Annual funding program of $17 billion for FY20
• Diverse business portfolio with geographic exposure to 125 countries
AaaLong-term rating (December 2018)
Outlook: Stable
AAALong-term rating (February 2019)
Outlook: Stable

Page 6
IFC Overview
Five Institutions, One World Bank Group
The World Bank Group has adopted two ambitious goals:
• Ending extreme poverty: the percentage of people living with less than $1.90a day to fall to no more than 3% globally by 2030
• Promoting shared prosperity: foster income growth for the bottom 40% ofpopulation in developing countries
Loans and grants to governments of developing countries
Loans to governments of middle-income countries
Guarantees of foreign direct investment’s non-commercial risks
Conciliation and arbitration of investment disputes
Debt and equity investments and advisory services to private sector in developing countries
International Development Association
International Bank for Reconstruction and Development
MultilateralInvestment
Guarantee Agency
International Centre for Settlement of
Investment Disputes
International Finance
Corporation
Issues Bonds under: IDA
Issues Bonds under: World Bank
Issues Bonds under: IFC

Page 7
IFC Overview
Strong Shareholder Support
• IFC is a legally distinct entity of the World Bank Group with its own articles of agreement, balance sheet and staff
• Owned by 185 shareholders: governments of member countries
• More than 50% of capital is held by AAA/AA sovereigns
• IFC does not pay dividends or taxes; profits are channeled back into investments in developing member countries
21% United States
1% Mexico1% Indonesia
1% Spain2% Argentina
2% Switzerland
6% Japan
5% Germany
4% France
4% United Kingdom
4% India
27% 164 other countries
2% Australia2% Belgium
2% Saudi Arabia2% Brazil
2% Netherlands2% China
4% Russia3% Canada
3% Italy
The stable outlook reflects our view that IFC will maintain an extremely strong financial risk profile and robust management policies while remaining a relevant institution for its member countries and for the World Bank Group’s general strategy.
Standard & Poor’s 13 February 2019
The credit profile of IFC is underpinned by very high intrinsic financial strength, driven by strong capital adequacy and liquidity, and the high creditworthiness of major shareholders, combined with their commitment to support the organization.
Moody’s 11 December 2018

Page 8
IFC Overview
What We Do
Figures as of 30 June 2019
Investment
• Debt (loans, bonds and otherfixed income instruments)
• Equity
• Trade and commodity finance
• Derivative and structuredfinance
• Blended finance
Advice
• Companies
• Financial Institutionsand Funds
• Governments
Mobilization
• Mobilization of third partyinvestment in debt and equityformat
• Syndications
• IFC Asset ManagementCompany (AMC)
$19.1 billion committed in FY19
$58.3 billion committed portfolio
Around $300 million in advisory services income annually
$26 billion syndicated in 5 years12 funds with $10.1 billion under AMC’s management
Page 9
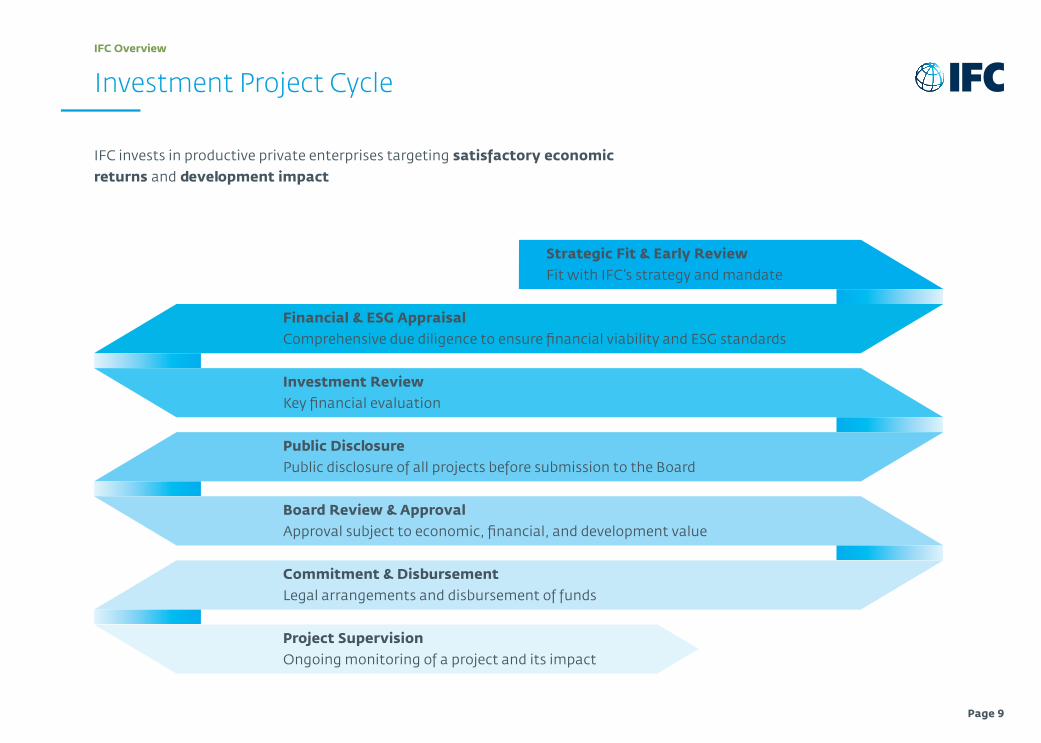
IFC invests in productive private enterprises targeting satisfactory economic returns and development impact
IFC Overview
Investment Project Cycle
Financial & ESG AppraisalComprehensive due diligence to ensure financial viability and ESG standards
Strategic Fit & Early ReviewFit with IFC’s strategy and mandate
Investment ReviewKey financial evaluation
Public DisclosurePublic disclosure of all projects before submission to the Board
Board Review & ApprovalApproval subject to economic, financial, and development value
Commitment & DisbursementLegal arrangements and disbursement of funds
Project SupervisionOngoing monitoring of a project and its impact

Page 10
IFC Overview
Sustainability: Alignment with United Nations’ SDGs
The above is not an exhaustive mapping but represents an overview of IFC’s approach to support the achievement of the SDGs. Given that cross-sectoral impact is delivered through investments and advisory operations in the strategic sectors, some overlaps exist in this mapping.
Across sectors and regions, IFC seeks to promote:
> Employment creation and economic growth
> Gender equality in business and life
> Environmental and social sustainability
> Climate change adaptation and mitigation
> Partnership with private investors to mobilize new sources of finance
IFC has two overarching goals:
Ending extreme poverty by 2030 and boosting shared prosperity
Promote Investment Services and Advisory Services for strategic sectors including:
> Infrastructure
> Agriculture
> Financial inclusion
> Health and education
World Bank GroupTwin Goals
IFC Cross-Sector Impacts
IFC Sector Impacts
Page 11
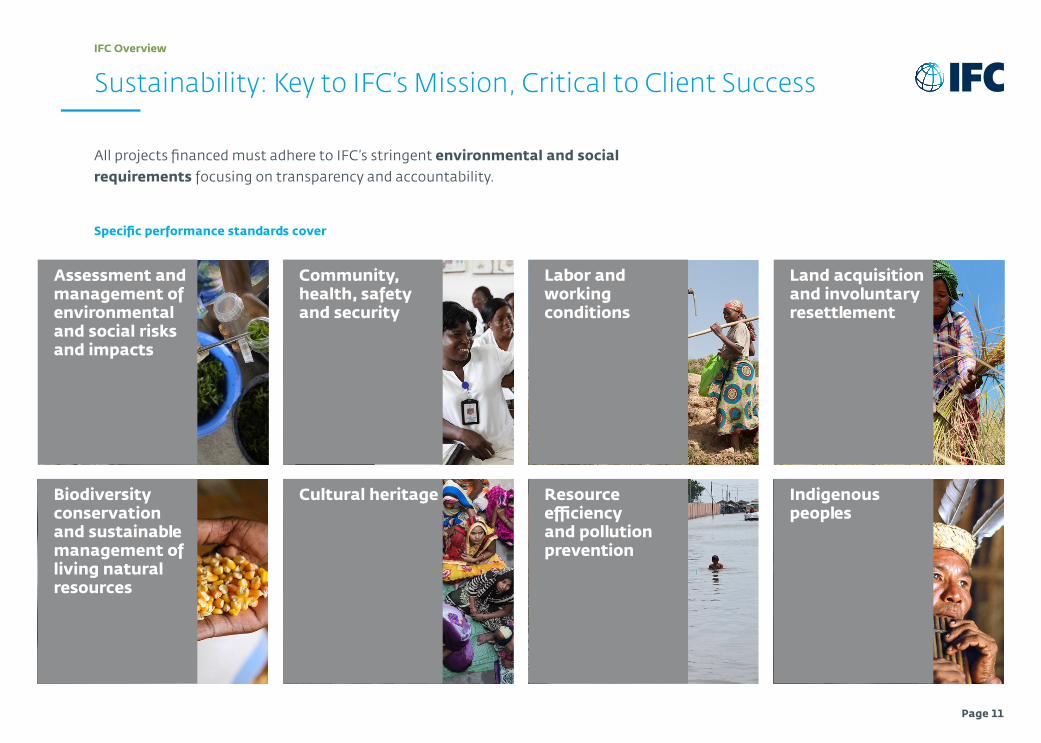
All projects financed must adhere to IFC’s stringent environmental and social requirements focusing on transparency and accountability.
IFC Overview
Sustainability: Key to IFC’s Mission, Critical to Client Success
Specific performance standards cover
Assessment and management of environmental and social risks and impacts
Biodiversity conservation and sustainable management of living natural resources
Community, health, safety and security
Cultural heritage
Labor and working conditions
Resource efficiency and pollution prevention
Land acquisition and involuntary resettlement
Indigenous peoples

Page 12
Development Impact indicators are measured on an annual basis. In 2018, IFC’s 2,000 private sector clients provided overall:
IFC Overview
IFC’s Development Impact
2.1 million jobs
37 million customers
49.9 million patients
4.7 million students
Power, waterand gas distribution to more than
Health services to
Education to

Page 13
Investing for Impact
Financial Strength

Page 14
Financial Strength
Conservative Balance Sheet
In USD billions as of 30 June 2019
Assets
Liquid Assets (net)
Debt and Equity Investments(net of $1.2 in reserves)
Net Loans
Equity Investments
Debt Securities
Other Assets
Liabilities and Capital
Borrowings
Other Liabilities
Net Worth
Paid-in Capital
Retained Earnings and Other
39.7
43.5
24.0
13.1
6.3
16.1
54.1
17.5
27.6
2.6
25.0
Total Assets Total Liabilities and Capital99.3 99.3

Page 15
Financial Strength
IFC AAA-rated Peer Group Comparison
Figures for AfDB (in UA) were translated into US dollars using year-end exchange rate of 1UA= $1.39 and average exchange rate of 1UA=$1.42
Figures for EBRD and EIB (reported in EUR) were translated into US dollars using year-end exchange rate of €1 = $1.15 and average exchange rate of €1 = $1.18.
Audited financial statements of each institution as of 31 December 2018, except for IFC and IBRD, where audited financial statements as of 30 June 2019 were used.
Source: Crédit Agricole CIB
$93
100%
$28
72%
40%
$99
Lends and invests equity in private
enterprises in developing countries
IFC International
Finance Corporation
$843
6%
$42
85%
28%
$283
Provides loans to public sector
in developing countries
IBRD International
Bank for Reconstruction
and Development
$842
7%
$33
75%
25%
$129
Development bank for Latin American
and Caribbean economies
IADB Inter-American Development
Bank
$750
5%
$51
73%
19%
$192
Fosters economic development and
cooperation in the Asia Pacific region
ADB Asian
Development Bank
$177
7%
$10
79%
37%
$47
Invests and lends to development projects in Africa
AfDB African
Development Bank
$402
21%
$19
74%
47%
$71
Development bank which lends to
Eastern and Central European economies
EBRD European Bank for
Reconstruction and Development
$2,762
9%
$82
87%
15%
$637
Help finance balanced economic
development in EU states
EIB European
Investment Bank
Net income before transfers
(USD millions)
Paid-in capital as % of total capital
Total Shareholders Equity
Leverage Total Liabilities / Total Liabilities
+ Shareholders’ Equity (excluding callable capital)
LiquidityLiquid Assets /
Total Assets
Total Assets(USD billions)
185 member countries
189 member countries
48 member countries, consisting of Latin America and
OECD countries
67 member countries, of which
23 are OECDcountries
54 African member countries and
26 non-African member countries
67 members – 65 countries,
the EU and the EIB
28 member states of the EUOwnership
Business

Page 16
IFC exercises prudent financial discipline:
• IFC has one of the highest liquidity ratios of any supranational
• Equity investments are funded by IFC’s net worth, not its borrowings
Financial Strength
Strong Fundamentals
Actual level figures as of 30 June 2019Minimum and maximum thresholds based on triple-A rating methodology guidelines as agreed with rating agencies
The stand-alone credit profile for IFC is ‘aaa’, reflecting our assessment of its very strong enterprise risk profile and extremely strong financial risk profile.
Standard & Poor’s 13 February 2019
Liquidity ratio Risk-adjusted capitalLeverage
100% –
75% –
50% –
25% –
0% –(Percentage of estimated net cash requirements for the next 3 years)
actual104%
min45%
4 –
3 –
2 –
1 –
0 –Debt to net worth, times
actual2.2X
max4.0x
$30 –
$25 –
$20 –
$15 –
$10 –
$5 –
$0 –In USD billions
actual$27.8
min$21.8

Page 17
IFC’s growth is financed predominantly by retained earnings.
Financial Strength
Consistent Asset Growth
IFC’s fiscal year-end is 30 June
IFC’s total disbursed debt, equity, and net liquid assets at fiscal year-end
Loans and Other DebtEquity Investments Net Liquid Assets
45 –
40 –
35 –
30 –
25 –
20 –
15 –
10 –
5 –
0 –
USD
bil
lio
ns
|FY 05
|FY 06
|FY 07
|FY 08
|FY 09
|FY 10
|FY 11
|FY 12
|FY 13
|FY 14
|FY 15
|FY 16
|FY 17
|FY 18
|FY 19

Page 18
Financial Strength
High Liquidity
Our funding and liquidity ratios – which support IFC’s extremely strong financial risk profile – indicate that it would be able to fulfill its mandate as planned for at least one year, even under stressed market conditions, without access to the capital markets.
Standard & Poor’s 13 February 2019
$39.7 billion of net liquid assets
equivalent to 40% of total assets
Proactive investment approach
focused on capital preservation
High quality liquid assets
issued by, or unconditionally guaranteed by, governments, government instrumentalities, supranationals, and high quality corporate issuers. Includes instruments like ABS/MBS and deposits
Market risk is hedged
mainly through the use of derivatives, principally currency and interest rate swaps and financial futures
Diversification
across multiple markets ensures a favorable risk return profile

Page 19
IFC has recorded operating profit in every year since its founding in 1956.
Financial Strength
Track Record of Profitability
IFC’s fiscal year-end is 30 June
Assian,Russsian
Crisis3 –
2.5 –
2 –
1.5 –
1 –
0.5 –
0 –
Op
era
tin
g p
rofi
t in
USD
bil
lio
ns
|FY99
|FY00
|FY01
|FY02
|FY03
|FY04
|FY05
|FY06
|FY07
|FY08
|FY09
|FY10
|FY11
|FY12
|FY13
|FY14
|FY15
|FY16
|FY17
|FY18
|FY19
Argentina,TurkeyCrisis
BrazilCrisis
EM growth Global FinancialCrisis
EM growth Quantitative easing

Page 20
Investing for Impact
Core Business Portfolio

Page 21
• Risk-based loan pricing
• Loans match-funded to manage currency, interest rate and maturity risks
• Strict debt and equity portfolio diversification guidelines to reduce concentration risks
Core Business Portfolio
Portfolio Risk Management
One of IFC’s major credit strengths stems from its highly diversified portfolio. High portfolio diversification translates into lower concentration risk than for either smaller private sector-focused MDBs or MDBs that lend to the public sector.
Moody’s11 December 2018
By company
Risk-based limits for clients and groups of connected clients set based on individual credit rating
By sector
Limits on aggregated finance & insurance exposure, which restrict economic capital to the sector to 50% of a country limit
By country
Economic capital-based limits on country exposure as a percentage of total resources available
Page 22
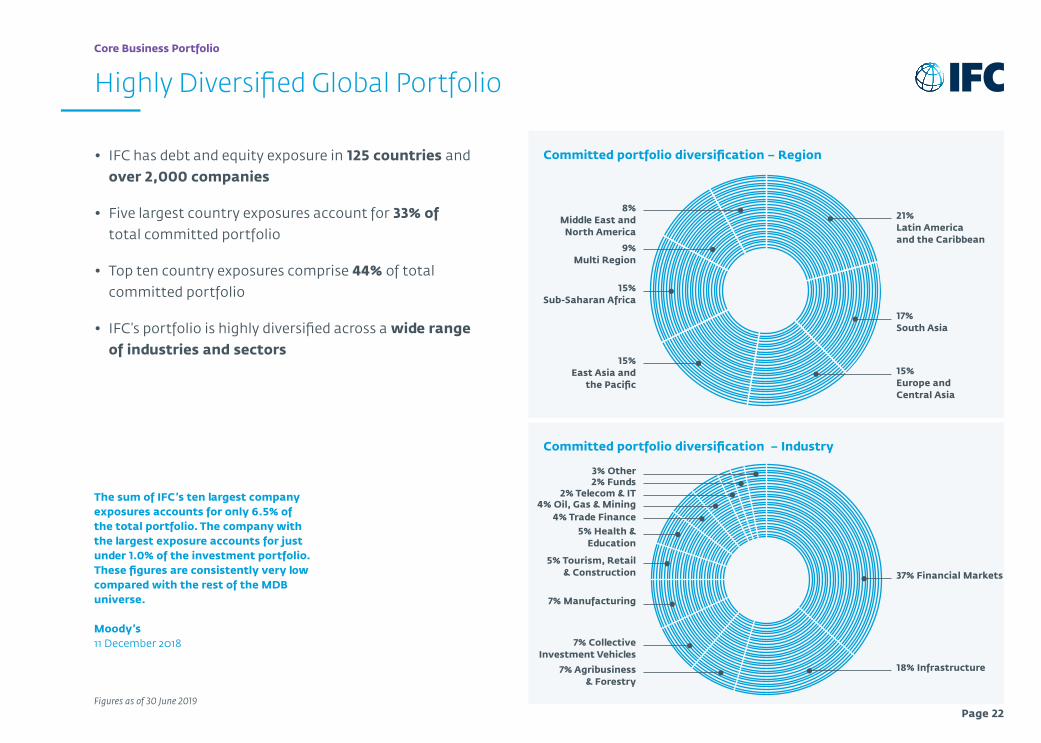
Committed portfolio diversification – Region• IFC has debt and equity exposure in 125 countries andover 2,000 companies
• Five largest country exposures account for 33% oftotal committed portfolio
• Top ten country exposures comprise 44% of totalcommitted portfolio
• IFC’s portfolio is highly diversified across a wide rangeof industries and sectors
Core Business Portfolio
Highly Diversified Global Portfolio
15% Europe and Central Asia
15% Sub-Saharan Africa
9% Multi Region
21% Latin America and the Caribbean
17% South Asia
15% East Asia and
the Pacific
8% Middle East and
North America
Figures as of 30 June 2019
The sum of IFC’s ten largest company exposures accounts for only 6.5% of the total portfolio. The company with the largest exposure accounts for just under 1.0% of the investment portfolio. These figures are consistently very low compared with the rest of the MDB universe.
Moody’s 11 December 2018
Committed portfolio diversification – Industry
18% Infrastructure
3% Other
37% Financial Markets
2% Funds2% Telecom & IT
7% Manufacturing
7% Collective Investment Vehicles
7% Agribusiness & Forestry
5% Health & Education
5% Tourism, Retail & Construction
4% Oil, Gas & Mining4% Trade Finance

Page 23
Core Business Portfolio
Quality Loan Portfolio
• Low NPLs – Loans 60 days past due classified as non-accruing
• Entire portfolio reviewed on a quarterly basis
• Total reserves against losses equaled 4.7% ($1.19 billion) of the total disbursedloan portfolio as of 30 June 2019
IFC’s fiscal year-end is 30 June
IFC has been exempted from exchange controls, whereas some commercial debtors have not.
Standard & Poor’s 13 February 2019
As % of disbursed loan portfolio
NPLReserves
25% –
20% –
15% –
10% –
5% –
0% – |FY00
|FY01
|FY02
|FY03
|FY04
|FY05
|FY06
|FY07
|FY08
|FY09
|FY 0
|FY11
|FY 2
|FY13
|FY14
|FY15
|FY16
|FY17
|FY18
|FY19

Page 24
Investing for Impact
Funding Program

Page 25
The expansion of IFC’s balance sheet in recent years has led to growth in its funding program.
Funding Program
Growth of IFC’s Funding Program
Figures in USD billions unless otherwise noted
IFC’s annual funding volume
$20 –
$15 –
$10 –
$5 –
$0 – |06
|07
|08
|09
|10
|11
|06
|06
|14
|15
|16
|17
|18
|19
|20
Current funding programs of IFC and peers
$60 –
$50 –
$40 –
$30 –
$20 –
$10 –
$0 – |EIB
|IBRD
|ADB
|IADB
|IFC
|EBRD
* Targeted volume for FY20
1.72.8
6.0
10.011.0
11.3
12.813.7
14.9
17.3
15.8
16.2 16.3
13.4
17.0*
|AFDB
$55
$44
$25$22
$17
$10$8

Page 26
Funding Program
Funding in Various Markets and Currencies
• IFC has issued global US dollar benchmarks each year since 2000
• IFC complements its public issuance by accessing a variety of different markets such as green bonds, Uridashi, private placements and discount notes
• First non-domestic issuer in China, India, Dominican Republic, Nigeria, Peru, Zambia, Rwanda, Namibia and many others
• As a US dollar-based institution, most borrowings are swapped into US dollars variable-rate
Borrowings by currency in FY19
Borrowings by market in FY19
17% GBP
2% NOK
11% AUD
9% Other
30% USA
2% RUB3% CAD
3% BRL
5% EUR
6% TRY
47% Core Public
4% NZD
4% SEK
4% JPY
1% NSV0.5% Retail
3% Local Currency
6% Other Public
9% FRN
10% Uridashi
23% MTN
Includes on-shore local currency transactions
Page 27
Funding Program
USD Global Benchmark Market
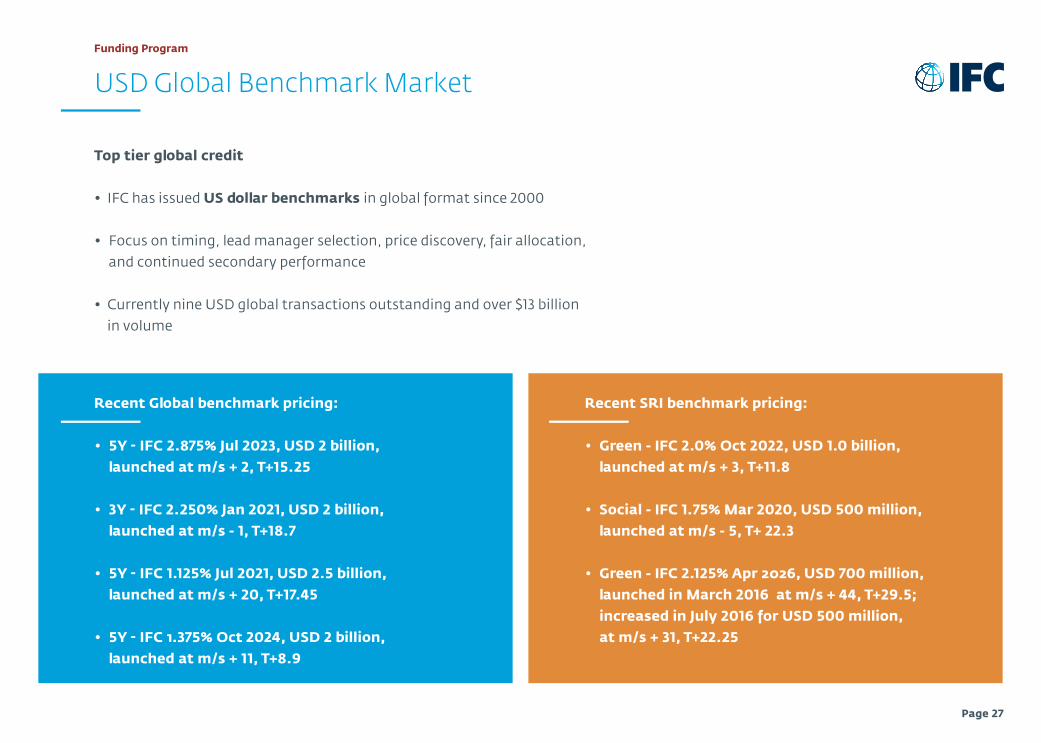
Top tier global credit
• IFC has issued US dollar benchmarks in global format since 2000
• Focus on timing, lead manager selection, price discovery, fair allocation,and continued secondary performance
• Currently nine USD global transactions outstanding and over $13 billionin volume
Recent Global benchmark pricing:
• 5Y - IFC 2.875% Jul 2023, USD 2 billion,launched at m/s + 2, T+15.25
• 3Y - IFC 2.250% Jan 2021, USD 2 billion,launched at m/s - 1, T+18.7
• 5Y - IFC 1.125% Jul 2021, USD 2.5 billion,launched at m/s + 20, T+17.45
• 5Y - IFC 1.375% Oct 2024, USD 2 billion,launched at m/s + 11, T+8.9
Recent SRI benchmark pricing:
• Green - IFC 2.0% Oct 2022, USD 1.0 billion,launched at m/s + 3, T+11.8
• Social - IFC 1.75% Mar 2020, USD 500 million,launched at m/s - 5, T+ 22.3
• Green - IFC 2.125% Apr 2026, USD 700 million,launched in March 2016 at m/s + 44, T+29.5;increased in July 2016 for USD 500 million,at m/s + 31, T+22.25

Page 28
Funding Program
USD Global Benchmark Distribution
USD2.5 billion July 2021(issued July 2016)
27% Americas
USD2.0 billion July 2023(issued July 2018)
USD2.0 billion January 2021(issued January 2018)
51% Asia
22% EMEA
63% Americas
11% Asia
26% EMEA
38% Americas
39% Asia
23% EMEA
58% Central banks/ Official
institutions
31% Banks
11% Fund
managers
52% Central banks/ Official
institutions
22% Banks
26% Fund
managers
61% Central banks/ Official
institutions
33% Banks
7% Fund
managers

Page 29
Spreads of IFC and peers’ 5-year benchmark issues vs. US Treasuries
Funding Program
USD Global Benchmark: Performance vs. Treasuries
IFCIBRD IADB EIB US Agency
|Jul 2009
|Jul 2010
|Jul 2011
|Jul 2012
|Jul 2013
|Jul 2014
|Jul 2015
|Jul 2016
|Jul 2017
|Jul 2018
|Jul 2019
200 –
150 –
100 –
50 –
0 –
-50 –
Bas
is P
oin
ts
|Jul 2008

Page 30
Funding Program
USD Global Benchmark: Performance vs. Swaps
Spreads of IFC and peers’ 5-year benchmark issues vs. mid-swaps
IFCIBRD IADB EIB US Agency
|Jul 2015
|Jul 2016
|Jul 2017
|Jul 2018
|Jul 2019
Bas
is P
oin
ts
|Jul 2014
10 –
40 –
30 –
20 –
-20 –
0 –
-10 –
50 –

Page 31
Funding Program
Issuance in domestic AUD market (Kangaroo)
• AUD is a key market for IFC• Attractive term funding to a growing international
investor base
• IFC’s commitment to AUD market reflected in:• Establishment of a stand-alone AUD Domestic Debt
Issuance Programin 2007
• Kangaroo bonds outstanding: Close to AUD 10.3 billion asof September 2019
• IFC bonds offer an attractive yield pickup vs. Australian
government bonds
• IFC’s AUD domestic issues are repo-eligible with RBA
Updated as of September 2019
Outstanding IFC Kangaroo issuance
Orange bar denote recently launched line
1.6 –
1.4 –
1.2 –
1.0 –
0.8 –
0.6 –
0.4 –
0.2 –
0.0 –
AU
D b
illi
on
s
July
20
20
Feb
rua
ry 2
021
Au
gu
st 2
022
Ma
rch
20
23
Au
gu
st 2
023
July
20
24
Ap
ril 2
025
July
20
26
Oct
ob
er 2
026
Jun
e 20
29
Au
gu
st 2
033
Maturities

Page 32
Funding Program
Kangaroo Distribution
AUD700 million March 2023 (Social Bond)(issued March 2018)
48% Australia
AUD900 million June 2029(issued July 2018)
AUD750 million July 2024 (issued July 2019)
49% Asia
2% EMEA
36% Australia
54% Asia
10% EMEA
93% Asia
45% Central banks/ Official
institutions
33% Banks
22% Fund
managers/Insurers
52% Central banks/ Official
institutions
29% Banks
19% Fund
managers/Insurers
27% Central banks/ Official
institutions
49% Banks
24% Fund
managers/Insurers
2% America 5% EMEA 2% Australia

Page 33
Funding Program
Sustainable Bond Programs
IFC is a sustainable bonds issuer with two focused thematic bond programs fully aligned with the Green and Social Bond Principles:
Green Bonds
Program established: 2010
Use of Proceeds: Climate friendly projects including renewable energy, energy efficiency, green banking etc.
Market Engagement: IFC is a founding member of the Green Bond Principles and sits on its Executive Committee
Social Bonds
Program Established: 2017
Use of Proceeds: projects that aim to address access to essential services and income generation tounderserved target populations in developing countries
Market Engagement: IFC chairs the Social Bond Working Group under the Social Bond Principles
To learn more about our Green Bonds and to access our impact report www.ifc.org/greenbonds
To learn more about our Social Bonds and to access our impact report www.ifc.org/socialbonds
Social Bond Impact ReportFINANCIAL YEAR 2018
Green Bond Impact ReportFINANCIAL YEAR 2019

Page 34
Funding Program
Green Bonds
• IFC’s Green Bond program has raised over $9.2 billion asof FY19 end through 148 bonds including:• the market’s first benchmark-sized green bonds issued
in February and November 2013• the first US focused retail green bond program• tenors up to 30 years
Total green bond issuance by currency
1% NZD1% PHP
66% USD
1% IDR2% AUD2% ZAR
7% GBP
8% SEK
3% EUR3% TRY
3% BRL
1% CNY1% MXNOther:
INRJPYPENHKDCOP
Total green bond issuance by volume and number
2,000 –
1,800 –
1,600 –
1,400 –
1,200 –
1,000 –
800 –
600 –
400 –
200 –
0 –
Vo
lum
e (U
S$ m
illi
on
s)
FY10 FY11 FY12 FY13 FY14 FY15 FY16 FY17 FY18 FY19
Nu
mb
er o
f g
reen
bo
nds
issu
ed– 40
– 35
– 30
– 25
– 20
– 15
– 10
– 5
– 0
1 6 3 5 3 18 24 19 32 37
FY19 Highlights
37 Green Bonds totalling
$1.6 billionin 11 currencies
24 new projects committed across 6 sectors
Expected to reduce greenhouse gas emissions by 2.6 million metric tons of CO2-equivalent per year
Energy Efficiency
Biomass
Green Banking
Green Buildings
Solar Energy
Wind Energy

Page 35
Total social bond issuance by currency
Funding Program
Social Bonds
• IFC’s Social Bond program has raised $1.4 billion throughissues in 9 currencies as end of FY19 including:• In March 2017, IFC issued a $500 million transaction – the
first ever USD labelled Social Bond benchmark, meetingthe demand of institutional investors with interest in ESG
• In March 2018, IFC issued the inaugural 5-year AUD300million Social Bond in the Australian bond market
• Social Impact Notes launched to offer US retail investorsaccess to Social Bonds
35.8% AUD
0.7% TRY
52.6% USD
3.9% BRL 0.6% JPY
5.6% MXN
0.6% RUB0.1% ZAR
FY18 Highlights
13 Social Bonds totalling
$407 millionin 6 currencies
38 new projects committed across 8 sectors
Agribusiness
Education
Foods
Health
ICT
Gender Finance
Housing Finance
Microfinance
IFC cumulative Social Bond Issuance
$1.46 billionin volume
28Social Bondsissued
As of 30 June 2019

Page 36
Funding Program
MTNs and Structured Notes
• IFC aims to maintain its position as an active and flexibleissuer of plain vanilla and structured notes
• IFC currently allows:• Interest rate linked, FX linked, equity index linked, FRNs,
Bermudan and European callables, hybrids• Minimum size $3 million equivalent with maturities
ranging from 1 to 30 years
• Total MTN volume in FY19 was $3.3 billion across 21 currencies
• IFC has an active buyback program, serving as a liquidityback-stop for IFC’s issuances
FY19 structures
FY19 currencies
1% FRN
5% Zero callable
7% Fixed rate callable
9% Zero bullet
13% Dual currency
65% Vanilla
14% EUR
19% USD
8% NOK
7% RUB
2% KZT2% HKD
2% RON
2% UAH3% MXN
9% BRL
IFC’s fiscal year-end is 30 June
0% FX digital
14% SEK
2% ZAR2% Other
1% JPY1% CNY
12% TRY
Page 37
Funding Program
Uridashi
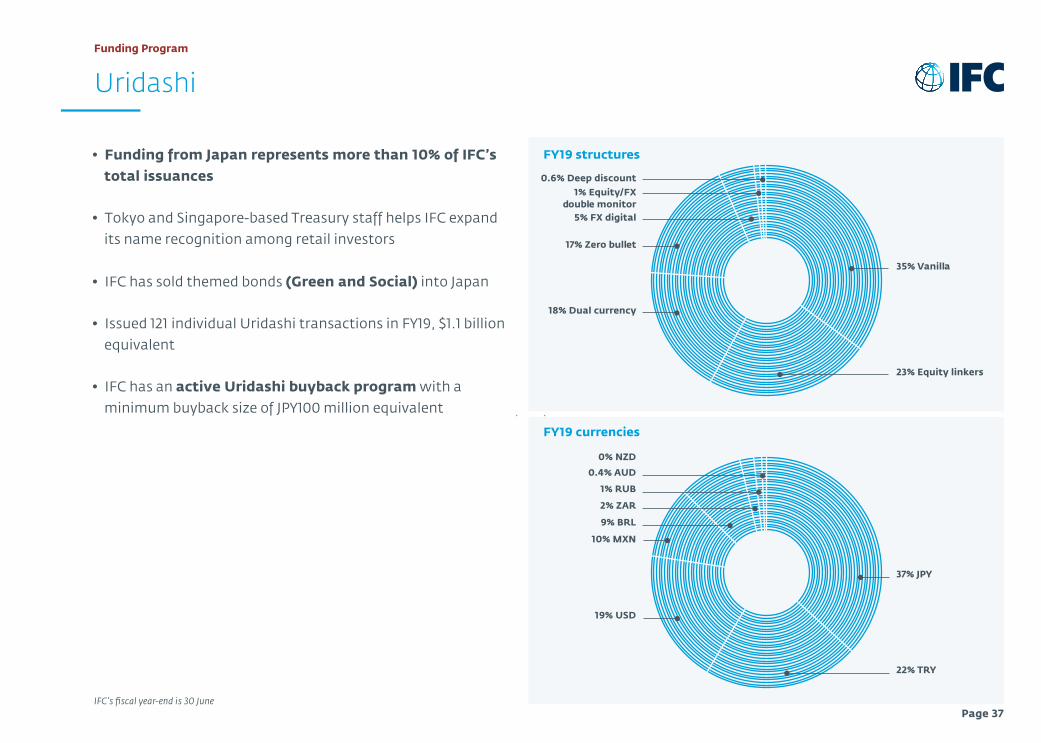
• Funding from Japan represents more than 10% of IFC’s total issuances
• Tokyo and Singapore-based Treasury staff helps IFC expand its name recognition among retail investors
• IFC has sold themed bonds (Green and Social) into Japan
• Issued 121 individual Uridashi transactions in FY19, $1.1 billion equivalent
• IFC has an active Uridashi buyback program with a minimum buyback size of JPY100 million equivalent
FY19 structures
FY19 currencies
22% TRY
37% JPY
19% USD
10% MXN
0% NZD
0.4% AUD
1% RUB
2% ZAR
9% BRL
IFC’s fiscal year-end is 30 June
0.6% Deep discount1% Equity/FX
double monitor5% FX digital
17% Zero bullet
18% Dual currency
35% Vanilla
23% Equity linkers

Page 38
Funding Program
US Retail Market Bond Programs
Impact Notes Program
• In March 2014, IFC launched the Impact Notesprogram, offering notes to the US retail market
• To meet investor interest, the program offers notes inGreen and Social Impact format through InCapital’sLegacy Platform
• IFC’s Impact Notes are an alternative to GSEs, whileoffering more attractive yields than US Treasuries
Accelerated Return Notes Program
• In October 2016, IFC launched the Accelerated ReturnNotes program, offering equity index-linked notes tothe US retail market
• Monthly issues linked to major US equity indices:3-to-1 upside exposure, 1-to-1 downside exposure tothe index with 14 months maturity

Page 39
Funding Program
Discount Note Program
• Launched in June 2009 to complement IFC’s Global MTN Program and to expand the availability of short term local currency finance
• Offers a high quality short-term investment opportunity in USD, CNH or TRY
• During FY19, IFC issued a total of $14.2 billion under global discount note programs
• $5 billion authorized outstanding limit for FY19
• Denominated in USD, CNH or TRY
• Maturities range from overnight to 360 days
• Minimum order of $100,000
• Uncertified book-entry form
• IFC’s Fiscal Agent: Federal Reserve Bank of New York
• Settlement via Fedwire
• Bloomberg Ticker: IFC<go>2 and ADN<go>8
• Offered through 10 dealers: Barclays Capital CastleOak Goldman Sachs HSBC Jefferies JP Morgan Securities Merrill Lynch Nomura UBS Wells Fargo

Page 40
Funding Program
Issuing in Local Markets
IFC Local Bond Issuance significantly higher than 10 years ago.
Brazil – Amazonian Bond 2007 – BRL 200 million due 2011Brazil 2013 – BRL 439 million due 2016 (Green)*Colombia – El Dorado Bond2017 – COP 33.7 billion due 2022Costa Rica – Irazu Bond2014 – CRC 5 million due 20192018 – CRC 5.7 billion due 2023Dominican Republic – Taino Bond2016 – DOP 180 million due 20232012 – DOP 390 million due 2017Mexico2018 – MXN 233 million due 2021 (Social)*2016 – MXN 500 million due 2021 (Green)*Peru – Inca Bond2004 – PEN 50 million due 2007Peru – Green Bond2014 – PEN 118 million due 2034 (Green)*
Central CFA Franc – Moabi Bond2009 – XAF 20 billion due 2014West CFA Franc – Kola Bond2006 – XOF 22 billion due 2011Morocco – Atlas Bond2005 – MAD 1 billion due 2012Namibia – Namib Bond2016 – NAD 180 million due 2021Nigeria – Naija Bond2013 – NGN 12 billion due 2018Rwanda – Twigire Bond2015 – RWF 3.5 billion due 2018Rwanda – Umuganda Bond2014 – RWF 15 billion due 2019South Africa – ZAR Green Bond2015 - ZAR 1 billion due 2024Zambia – Zambezi Bond2013 – ZMW 150 million due 2017Botswana – Kgalagadi Bond2018 – BWP 260 million due 2024
Armenia – Sevan Bond2013 – AMD 2 billion due 2016Georgia – Iveria Bond2015 – GEL 30 million due 20172017 – GEL 108 million due 2020Romania2018 – RON 70 million due 2019 2017 – RON 70 million due 2018Russia – Volga Bond 2012 – RUB 13 billion due 2017Turkey2018 – TRY 100 million due 20222017 – TRY 100 million due 20222017 – TRY 150 million due 20222009 – USD 100 million due 20142011 – TRY 202 million due 2015 (Green)*Kazakhstan Bond2017 – KZT 1.3 billion due 20182017 – KZT 6.8 billion due 20202018 – KZT 2 billion due 20222018 – KZT 8.6 billion due 2026Serbia2017 – RSD 507 million due 2020Uzbekistan – Samarkand Bond2018 – UZS 240 billion due 20202018 – UZS 123 billion due 20202018 – UZS 113 billion due 2020
Gulf Cooperation Council – Hilal Sukuk 2009 – USD 100 million due 2014Sukuk al Wakala2015 – USD 100 million due 2020
Cambodia 2019 – KHR 48.6 billion due 2021Indonesia – Komodo Green Bond2018 – IDR 2 trillion due 2023Malaysia Wawasan-Islamic Bond2004 – MYR 500 million due 2007Philippines - Mabuhay Bond2018 – PHP 4.8 billion due 2033Myanmar2018 – MMK 7.5 billion due 20232018 – MMK 7.5 billion due 20232019 – MMK 7.5 billion due 20232019 – MMK 7.5 billion due 2023Bangladesh - BDT Bond2020 – BDT 800 Million due 2022
Masala Green Bond 2015 – INR 3 billion due 2020Masala Bond2018 – INR 7.349 billion due 20212018 – INR 8.7 billion due 20242017 – INR 53.5 billion due 2022, 20242016 – INR 8.6 billion due 2024, 2031 2015 – INR 33 billion due 2018, 20192013, 2014 – INR 72 billion due 2016,
2019, 2021, 20242016 – INR 300 million due 2019Masala Uridashi Bond2016 – INR 300 million due 2019
Panda Bonds2006 – CNY 870 million due 2013Dim Sum Bonds2014 – CNH 1 billion due 20192014 – CNH 500 million due 2017 (Green)2014-2015 – CNH 4.7 billion due 20172012 – CNH 500 million due 20142011 – CNH 150 million due 2016
* Themed Funding issuance
Latin America
Middle East
Africa
India
Southeast Asia
Europe and Central Asia
China

Page 41
Funding Program
Recognized Funding Program
2019 2019 2019 2019 2019
APAC Editor’s Award: GPIF and WBG’s ESG
Contribution
Deal of the Year: USD 12m 7.5% Synthetic Notes due 2021
Linked to KHR
Impact Report of the Year Best Supranational Dollar Deal of the Year
Green Bond Development Bank of the Year
2018 2018 2017 2017 2017
Power Performer: Uridashi Most Innovative SSA MTN Issuer
Investor Solutions:Triple-A Accelerated
Return Notes
MTN Issuer of the Year
Most Innovative Issuer
2017 2017 2016 2016 2016
Best SRI Bond:IFC $700MM 2.125% April 2026
green bond
Asia Structured MTN Issuer of the Year
Best Supranational Borrower Best Local Currency Green Bond:
IFC ZAR Green Bond
Best Supranational Sukuk
2016 2016 2016 2016 2016
Best Green Bond Facility
Green Bond Awards: First $1 billion Benchmark
Issuance
Market Initiative of the Year:
Impact Reporting
Special Award for Innovation:
IFC/Yes Bank
Best Niche Currency Issuer

Page 42
Investing for Impact
Annex

Page 43
An employee of Habesha Breweries works in the packaging area of the brewery in Debre Berhan, Ethiopia. © Dominic Chavez/IFC
Annex
Agribusiness and Forestry – Sub-Saharan Africa
Habesha Breweries, one of the largest brewers in Ethiopia, offers women and rural communities access to financial services. Located in a plateau with reserves of groundwater, the brewery’s technology aims for energy and resource efficiency.
The team of over 300 people works closely with local farmers in professionalizing their business and growing better quality barley. Habesha also engages with the local community through open meetings where they have implemented new irrigation systems, installations of clean drinking tap water, and an extension of the brewery’s electrical network to power local houses.
To continue this dedication to sustainable agriculture and community, IFC provided a loan of $70 million, comprised of a senior secured loan of up to $30 million and syndicated loans of up to $45 million.
Habesha will increase productivity, access to markets, and food security for 15,000 barley farmers. With the support of IFC Advisory Services, Habesha hopes to reach 14,000 additional farmers and to create 500 direct, full-time jobs. The investment will also help accelerate the adoption of high-yield seed among malt barley farmers in Ethiopia, strengthening integration in the supply chain.
Employees of Habesha Breweries deliver crates to a local market in Ethiopia. © Mees van den Ekart

Page 44
Annex
Health and Education – Middle East & North Africa
To gain a sense of a country’s healthcare availability, the physician-density tool gauges access to a medical professional. In Morocco, it is 0.73 physicians/1,000 population, in Senegal it is 0.07 physicians/1,000 population, while in the US, it stands at 2.59 physicians/1,000 population. The number of doctors in Morocco and Senegal must increase to tackle the severe shortages of doctors.
As one of Morocco’s leading private universities, the Université Privée de Marrakech is tapping into the region’s medical potential. The university provides undergraduate, graduate, and doctoral degree programs. It has its main campus site in Marrakech and acquired the UPM Senegal campus in 2015.
IFC is providing a $15.71 million loan to finance the university’s construction of its first medical facility in Marrakech as well as develop the satellite university it acquired in Dakar. UPM Senegal will see a new medical school along with a 250-bed student dormitory.
This development is expected to increase the number of much-needed physicians and health professionals in Morocco and Senegal. IFC anticipates that this project strengthens human capital development in Senegal and Morocco and will encourage regional competitiveness towards further developing the education and health sector.
A student at the UPM Marrakech campus © UPM International

Page 45
Employees working in a tree sapling nursery in Colombia © Refosinu
Annex
Forestry – Latin America
Deforestation has degraded Colombia’s soil quality, threatened endangered primates, and left local communities vulnerable to intensified natural disasters. Development of the rural and forestry sector in Colombia is fundamental for the future and wellbeing of the country
To combat these issues, Reforestadora de Sinu (Sinu) eucalyptus-planting project aims to recover ground coverage spanning 5,700 hectares in northwestern Colombia, along the Sinu River. Sinu planted its first tree saplings in 2013 and within its first five years established 4,800 hectares of plantations. By implementing energy-efficiency, management of agrochemicals, and the conservation of natural ecosystem services, the company hopes to responsibly attain 10,500 hectares by 2021.
IFC is supporting this goal with a $15 million loan to Sinu to develop and maintain the eucalyptus plantation. It is expected that the project will generate positive impacts on the environment, such as reducing GHG emissions by ~155,000 tons of CO2 per year and strengthening climate resilience. The project will encourage sustainable land management with new local job opportunities in employment outside of cattle ranching or subsistence agriculture.
Employees working in a tree sapling nursery in Colombia © ICA Colombia

Page 46
SMURD emergency rescue service in Cluj-Janpoca ©Rarpart
Annex
Commercial Banking – Europe & Central Asia
Severe weather events such as droughts, earthquakes, and floods disrupt socioeconomic activity and devastate communities. Since Romania is one of the most natural disaster-prone countries in Europe, its government is determined to exceed the EU’s renewable energy directive in response to its environmental vulnerability.
Estimates of the impact of natural disasters indicate that expected annual damage to infrastructure alone would double by 2020 and could be six times higher by 2080. With floods, droughts, and earthquakes expected to be more frequent, Garanti Bank Romania is eager to invest in green projects for economic and environmental advancement.
The bank’s portfolio already includes local hydro, wind, and solar projects as well as a WWF partnership. Now, with a EUR55 million loan from IFC, Garanti Bank will provide more loans to small and medium enterprises in Romania, out of which, half will fund sustainable energy finance projects.
Beyond mitigating carbon emissions, IFC will be supporting banks to promote climate-smart products for the first time and increase access to finance for SMEs, an underserved segment of the market.

Page 47
Annex
Infrastructure – Asia
Vietnam, with a population nearing 100 million, continues to see strong economic prospects, delivering 7 percent growth in 2018. As this expansion continues, the country will experience a rise in demand for power. This stresses existing infrastructure, with power shortages expected as early as 2021. According to forecasts, power generation capacity in Vietnam must more than double over the next decade.
Vietnam is meeting growing energy demand while also delivering on its climate ambitions with cleaner domestic renewable wind and solar energy. With increasingly competitive cost, renewables have the potential to become the lowest cost option for Vietnam to meet its energy needs.
Responding to this opportunity, IFC has committed an anchor investment of $75 million in the $300 million green bond issued by AC Energy Finance International Limited. This is the first infrastructure-focused green bond to be publicly listed in Southeast Asia. IFC’s investment in the five-year green bond will fund 360 megawatts of solar and wind farms.
This is only the beginning. Vietnam also has large potential for rooftop solar projects for commercial and industrial businesses. To tap into this potential, IFC is providing advisory services and has already identified 60 megawatts of rooftop solar opportunities in several factories in Vietnam’s manufacturing sector.
© Dominic Chavez/IFC

Page 48
Investing for Impact
Contacts

Page 49
Contacts
IFC Treasury
London Singapore TokyoWashington Washington
Flora ChaoGlobal Head of Funding+44 207 592 [email protected]
Elena PanomarenkoSenior Financial Officer+44 207 592 [email protected]
Yuri KurokiAssociate Financial Officer+65 6501 [email protected]
Hiroyasu HiranoAssociate Financial Officer+65 6501 [email protected]
Maki YasuiSenior Financial Officer+81 3 3597 [email protected]
Marcin BillSenior Financial Officer+1 202 473 [email protected] Zauresh KezhenevaAssociate Financial Officer+1 202 473 [email protected]
Esohe Denise OdaroHead, Investor Relations +1 202 473 [email protected]
Sophie PeetersInvestor Relations Analyst+1 202 473 [email protected]
Management
John GandolfoVice President and Treasurer+1 202 458 [email protected]
Tom CeustersDirector, Treasury Market Operations+1 202 473 [email protected]
Communications
Emma-Kate SymonsSenior Communications Officer+1 202 813 [email protected]
Funding Investor Relations
IFC ∙ 2121 Pennsylvania Avenue NW ∙ Washington DC 20433 USA ∙ +1 202 473 8392website: ifc.org/investors ∙ email: [email protected] ∙ Bloomberg: IFC<GO> ∙ twitter: @ifc_investors
Page 50
Investing for Impact
Disclaimer
This document has been prepared for informational purposes only, and the information herein may be condensed or incomplete. IFC specifically does not make any warranties or representations as to the accuracy or completeness of these materials. IFC is under no obligation to update these materials.
This document is not a prospectus and is not intended to provide the basis for the evaluation of any securities issued by IFC. This information does not constitute an invitation or offer to subscribe for or purchase any of the products or services mentioned. Under no circumstances shall IFC or its affiliates be liable for any loss, damage, liability or expense incurred or suffered which is claimed to have resulted from use of these materials, including without limitation any direct, indirect, special or consequential damages, even if IFC has been advised of the possibility of such damages.
For additional information concerning IFC, please refer to IFC’s current “Information Statement”, financial statements and other relevant information available at www.ifc.org/investors.