Embed Size (px)
Citation preview

Investing forGrowth and Recovery
The World Bank Brief forThe Consultative Group on Indonesia
June 14, 2006
Grow

Report No. 35423-IND
CGI BRIEF Investing for Growth and Recovery
CURRENCY EQUIVALENTS (As of June 8, 2006)
Currency Unit = Rupiah (Rp.) US$1 = Rupiah 9,430
FISCAL YEAR: January 1–December 31
Regional Vice President: Mr. Jeffrey Gutman Country Director: Mr. Andrew Steer Chief Economist: Mr. Homi Kharas Sector Director: Mr. Homi Kharas Task Team Leaders: Mr. William E. Wallace
Mr. Yoichiro Ishihara
JUNE 2006
Acknowledgements This report was prepared by a core team consisting of William E. Wallace (TTL), Yoichiro Ishihara (TTL), Wolfgang Fengler, Peter Rosner, Hongjoo Hahm, Jehan Arulpragasam, Menno Pradhan, Soren Davidsen, Joel Hellman, Louise Scura, and Magda Adriani and undertaken under the direction of Andrew Steer (Country Director) and Homi Kharas (Chief Economist and Sector Director). Contributions were received from Vivi Alatas, Meltem Aran, F. Javier Arze, Rodrigo Barfield, Kelly Bird, Prabha Chandran, Jennifer Donohoe, John Factora, Fitria Fitrani, Oleksiy Ivaschenko, Lloyd Kenward, Blane Lewis, Chris Manning, Neil McCulloch, Kurnya Roesad, Sjamsu Rahardja, James Sheppard, Djauhari Sitorus, P.S. Srinivas, and Soekarno Wirokartono. Peer reviewers were Bert Hofman (Lead economist, World Bank Office Beijing) and Anton Gunawan (Citibank Indonesia). This report was discussed with the Government in June 2006. Nina Herawati and Indra Irnawan provided logistical and document processing assistance.

ABBREVIATIONS AND ACRONYMS
ACAP Anti Corruption Action Plans KPK Anti-Corruption Commission ACC Anti-Corruption Commission LAN National Institute of Administration ADB Asian Development Bank LKPM Investment Activity Reports AGO Attorney General’s Office LP3ES Village Infrastructure AMDAL Environmental Permits LPEM-FEUI Institute for Economic and Social APBN State Budget Research – Faculty of Economics ASEAN Association of Southeast Asian Nations University of Indonesia BAPPENAS National Planning Development Agency MDGs Millenium Development Goals BKM Scholarship Program for Secondary MenPAN State Ministry for State Apparatus School Students Reforms BKN National Civil Service Agency MoF Ministry of Finance BKPM Investment Coordinating Board MoPW Ministry of Public Works BKPMD Provincial Investment Board MTEF Medium-term Expenditure Framework BOS Operational Fund for Schools NGOs Non Governmental Offices BPJT Toll Road Regulatory Authority NPWP Taxpayer I.D. number BPR Bank Perkreditan Rakyat OECD Organization for Economic Co- BPK Supreme Audit Board operation and Development BPKP Financial & Development Supervisory OP Operasi Pasar BPS Indonesian Central Statistics Office O&M Operations & Maintenance BRR Reconstruction & Rehabilitation Agency PDAM Local Water Enterprise CEIC CEIC Data Company Ltd. PEPI National Exports & Investment Team CGI Consultative Group on Indonesia PER Public Expenditure Review CIIF Consolidated Indonesia Infrastructure Perda Regional Regulation Forum PERPU A Government Regulation in Substitute CoW Contract of Work of a Law DAU General Allocation Fund PJM Medium-term Plan DIPA Spending Authority PLN State Electricity Company DPOD Regional Autonomy Advisory Board POLRI Indonesia National Police DPR House of Representative PPATK Indonesian Financial Transaction and DSP Danamon Simpan Pinjam Analysis Center FAO Food Agricultural Office PPP Public Private Participation FDI Foreign Direct Investment Puskesmas Community Health Centers FTCs Fixed-term Contracts RAN-PK The National Action Plan for the FY Fiscal Year Eradication of Corruption GAM Aceh Independence Movement RMU Risk Management Unit GDP Gross Domestic Product Sarkers Project Managers GFS Government Financial Statistic SARS Severe Acute Respiratory Syndrome GOI Government of Indonesia SBY President Susilo Bambang Yudhoyono HPAI Highly Pathogenic Avian Influenza SIUP The Trade Business License IBRA Indonesian Bank Restructuring Agency SMEs Small and Medium Enterprises IEA International Energy Agency SMERU Social Monitoring and Early Response IFRC International Federation of Red Cross Unit and Red Crescent Societies TIMSS Int’l Mathematics & Science Study IMF International Monetary Fund Timtastipikor A new special team to ensure greater INPRES Presidential Instructions cooperation between prosecutors and IUT Permanent Business Licenses TSA Treasury Single Account JICA Japan International Cooperation Agency police on corruption cases JPY Japan Yen UCT Unconditional Case Transfers KADIN Indonesia’s Chamber of Commerce UN United Nations Kanwil Provincial MOJ offices VA Volt Ampere KHL Adequate Living Needs VAT Value Added Tax KKPPI National Committee on Infrastructure WHO World Health Organization Acceleration

Table of Contents Executive Summary iChapter 1 Investment for Recovery and Growth 1Chapter 2 Fiscal Space, Public Investment and Decentralization 13Chapter 3 Investment Climate and Infrastructure 23Chapter 4 Indonesia’s Governance Agenda 45Chapter 5 Progress in Poverty Reduction and Public Service Delivery 55Chapter 6 A. Aceh and Nias after the Tsunami: Reconstruction, Finance and
Development Outlook 65
B. Update on Avian Influenza 71Statistical Annex Tables in Text Table 1-1 Growth by Sector and Category 2Table 1-2 Growth Accounting Exercise 7Table 1-3 Labor Market Development in 2001-2006 9Table 1-4 Gap between Wage and Productivity Growth in Manufacturing 9Table 1-5 Growth and Employment 10Table 1-6 Medium-Term Macroeconomic and Fiscal Framework 11Table 2-1 Spending Shift between 2005 and 2006 14Table 2-2 Domestic Fuel Prices vs. International Prices 15Table 2-3 Factors Affecting Central Government Debt to GDP Ratio 17Table 3-1 Comparison with Regional Neighbors 33Table 3-2 Severance Pay Rates under Current and Proposed Revised Law 33Table 3-3 Energy Sector Investment Needs 39Table 3-4 GHG Emissions 40Table 3-5 Regional Electrification Rates 40Table 3-6 Water Tariff in Indonesia and Other ASEAN countries 42Table 5-1 Economic Benefits from Community Managed Basic Infrastructure 63 Figures Figure 1-1 Growth and Investment 2Figure 1-2 Market Confidence Strengthens 3Figure 1-3 Widening Gap 3Figure 1-4 Oil and Gas Balance 3Figure 1-5 Inflation 4Figure 1-6 Reducing Debt Burdens 5Figure 1-7 Accumulating Deposits by Regions 6Figure 1-8 Low Investment 6Figure 1-9 Anatomy of Low Investment 7Figure 1-10 Potential Demand for Investment 8Figure 1-11 Binding Constraints Decision Tree 9Figure 1-12 Less Employment Generation 10Figure 2-1 Increased Fiscal Space 14Figure 2-2 Fuel Subsidy 14Figure 2-3 Easing Debt Burden (1) 16Figure 2-4 Easing Debt Burden (2) 17Figure 2-5 Regions Share Increased 18Figure 2-6 Development Expenditures Recover to the Pre-Crisis Level 18Figure 2-7 Illustration of Roles of Different Levels of Government: Before and
After Decentralization 19

Figure 2-8 Accumulating Deposits by Regions 19Figure 2-9 Comparison between Projected and Actual Public Investment 21Figure 2-10 Monthly Disbursement Pattern of Development Expenditures 21Figure 3-1 Foreign Direct Investment 25Figure 3-2 Constraint to Investment 28Figure 3-3 Severance Rates for Employee with 4 Years Service Dismissed for
Economic Reasons 32
Figure 3-4 Total Mining Investment 1996-2004 34Figure 3-5 Infrastructure Investment 38Figure 3-6 Urban Access to Improved Water 41Figure 3-7 Water Coverage by Utilities 42Figure 3-8 Urban Access to Improved Sanitation 43Figure 4-1 KPK Investigations and Prosecutions 46Figure 4-2 Major Obstacles Faced by Businesses 46Figure 4-3 Governor Races Planned in 2006 47Figure 4-4 Key Areas Covered by the INPRES 05 47Figure 4-5 The Judicial Commission: Safeguarding Accountability in the Justice
System 51
Figure 5-1 Poverty Trends 56Figure 5-2 Public Spending on Health, Education and Fuel Subsidy in 2004 56Figure 5-3 Recent Trends in Rice Prices 58Figure 5-4 Share of Public Private Sector in Education and Health 60Figure 5-5 Test Scores before and after Decentralization 60Figure 5-6 Trends in Malnutrition and Vaccination Coverage 60Figure 5-7 Public and Private Health and Education Spending 61Figure 6-1 Allocation of Funds Compared to “Core Minimum Needs” 66Figure 6-2 Reconstruction Needs and Commitments 67Figure 6-3 Aceh Has Consistently Underperformed 67

Executive Summary Over the last year Indonesia experienced dramatic economic ups and downs, a busy year for local elections, solid progress attacking corruption and an increase in reform momentum. Economic growth in 2005 was the highest in eight years, but slowed late in the year and in the first half of 2006, as the economy adjusted to higher fuel prices and interest rates. Despite the slowdown, financial markets reacted well to the clear direction on macro policy: the rupiah strengthened and the stock market hit historic highs. The number of people living in poverty continued to fall by about 1 million per year. Direct elections for the first time at the district level were peaceful with incumbents often falling to challengers implying increased accountability. The President has been acknowledged for sustaining progress on corruption eradication, with the Anti-Corruption Committee and the Supreme Audit Board especially active. The waning months of 2005 brought a cabinet reshuffle and a pick up in reform momentum. Policy packages on infrastructure and investment have been issued and a third package on the financial sector will be out soon. Finally, the pace of reconstruction in Aceh gained momentum. Large numbers of houses are now being built, larger infrastructure is getting underway, children are back in school, and medical care is generally available. The finest achievement of the year was the peace agreement between the government and GAM which has already brought huge gains in the quality of life to the people of Aceh. Sadly, once again the Consultative Group meets in the shadow of real and potential tragedies. On Saturday morning May 27, the historic college city of Yogyakarta and its suburbs Bantul and Klaten were struck by an earthquake registering 6.2 on the Richter scale. At the time of this writing, the quake is estimated to have left around 5,800 dead, and up to half a million homeless. While the destruction to infrastructure is not close to the scale of the Aceh tragedy, the number of houses destroyed or severely damaged, at more than 150,000, may be higher. Meanwhile another potential tragedy may be unfolding as Avian Influenza continues to claim victims. In the past year more people have died in Indonesia from the virus than in any other country in the world. Dealing with natural disasters and potential epidemics is clearly a priority including through better communication, coordination and preparedness. In 2005 growth reached 5.6 percent the highest level since the crisis. However, by year end the economy was softening rapidly and in the first quarter in 2006 the GDP was growing at 4.6 percent. The current slowdown was triggered by policy adjustments including a weighted average increase of 114 percent in fuel prices in October 2005 and a 400 basis point increase in administered interest rates (between August and December 2005). These policy adjustments were needed to restore economic incentives and fiscal balance by bringing fuel prices closer to market levels and to control inflationary expectations. Nevertheless the magnitude, especially of the fuel price increase, translated into a shift of US$8-10 billion from consumer’s disposable income to the government, and a significant short-run shock to the economy. Government plans to accelerate spending (recycle the fuel subsidies) have yet to be effective, although the program of cash support to more than 16 million poor families should more than mitigate the impact on spending for the poorest 28 percent of the population and put approximately US$2 billion back into the economy. Government spending is now accelerating and should be substantially larger by the end of the year when it should combine with falling interest rates to trigger a recovery as the
i

adjustment to higher energy prices plays itself out. By the end year the economy should be growing in the 6 percent range with annual growth in 2006 around 5.5 percent or approximately the same as 2005. Most economic indicators improve. With continued growth and sound policy direction most economic indicators improved, some dramatically. Financial markets rallied at the end of 2005 and into the first five months of 2006 to bring the rupiah to its strongest level in 2 years, and the stock market to an extended string of highs, before the recent retreat in emerging markets generally. Citing improved policy Moody’s International raised Indonesian bond ratings (foreign and domestic) from B1 to B2 (still 4 levels from investment grade). The government budget ended the year with a deficit of 0.5 percent of GDP and the debt to GDP ratio continued to fall to 47 percent of GDP, down from 55 percent at the end of 2004 and almost 100 percent in 1999. Inflation rose to over 18 percent as fuel price increases were passed through into other prices. Sound monetary policy has mitigated this impact, and inflation is now on track to meet Bank Indonesia’s inflation target of 7-9 percent by the end of 2006.
Reduced debt burden (government debt to GDP ratio, percent)
0%
10%
20%
30%
40%
50%
60%
70%
80%
90%
100%
1996 1997 1998 1999 2000 2001 2002 2003 2004 2005
Domestic
External
Source: MOF, World Bank
Market confidence strengthens (Rupiah exchange rate against US$)
8000
8500
9000
9500
10000
10500
11000
Jan-04
Apr-04
Jul-04
Oct-04
Jan-05
Apr-05
Jul-05
Oct-05
Jan-06
Apr-06
600
700
800
900
1000
1100
1200
1300
1400
1500
1600
Exchange rate (Rp/US$)(LHS)
JSX Stock Index (RHS)
Source: CEIC, World Bank staff
Sustained growth is estimated to have reduced the number of people living in poverty by 1 million people to 35 million (16.0 percent of the population). However, these estimates may need to be adjusted up or down as negative impacts of increased rice and fuel prices and positive impacts of new Government poverty programs, such as cash transfers and reduced fees for health care and schools, become clear. Growth is not being translated into jobs. The open unemployment rate has reached 10.4 percent in 2006, and may still be rising. Each percentage point of economic growth unfortunately now generates fewer jobs in the formal sector than it did in the 1990s, probably due to labor market rigidities and higher real wages, illustrating the importance of adjustments to labor market policies.
ii

Reaching and sustaining higher growth will require more investment. Despite two years of relatively high investment growth (14.6 percent in 2004 and 9.9 percent in 2005) investment in 2005 was only 22 percent of GDP, in comparison with nearly 30 percent pre-crisis, and 32 percent in Vietnam and over 40 percent in China today. Resources are available to allow public investment to rise sharply this year to pre-crisis levels of nearly 7 percent of GDP. But private investment still remains much too low (see chart), and thus the government’s focus on the investment climate reforms is appropriate.
Anatomy of Low Investment (Gross % of GDP)
5.0%2.5% 3.4% 2.2% 3.4%
2.0%
1.4%3.1%
2.2%3.4%
22.6%
16.0%12.8% 17.5%
16.8%
0%
5%
10%
15%
20%
25%
30%
1996 2000 2003 2005 (*) 2006 (**)
Highest inv. before crisis
Low from public sec.
Lowest inv. after crisis
Private
Region
Center
Note- (*) preliminary data; (**) estimates Source: BPS, World Bank staff
Medium Term prospects appear good -- subject to policy implementation. Economic growth will accelerate later in 2006 as public spending picks up and interest rates fall, with a strong momentum entering 2007. If planned reforms are implemented on schedule, growth of 6 percent in 2007 and 7 percent in the medium term is quite likely. Failure to deliver on policy promises, on the other hand, will result in a growing cynicism among investors, reduced growth prospects and poor employment and poverty outcomes. The Government’s fiscal space widens – the focus needs to shift to spending well. High international oil prices and increased revenues are providing Indonesia an opportunity to increase public investment. Sound debt management has also helped. The share of the public budget allocated to pay interest and amortization on public debt (domestic and foreign), at 25 percent of the budget, is now lower than in the pre-crisis 1990s – providing room for an acceleration in high priority government spending. If development spending accelerates as planned this year, public investment (on the part of the consolidated central and regional government) will be at pre-crisis levels as a share of GDP.1 The budget for the central government’s health and education will increase by more than 20 percent each in real terms. Furthermore, a
Easing Budget Debt Burdens (debt service to total expenditure, percent)
0%
5%
10%
15%
20%
25%
30%
35%
40%
45%
50%
FY94 FY95 FY96 FY97 FY98 FY99 FY00(9m)
FY01 FY02 FY03 FY04 FY05 FY06Budget
Principal
Interest
Source: World Bank
1 Measured as share of GDP. With the new classification of Government accounts there is no longer a category called development spending. For the purpose of comparison, spending on capital and social transfers are combined to approximate the concept of development spending.
iii

gradual reduction in the remaining subsidies (fuel and electricity) would free up substantially more fiscal space for public investment and poverty reduction, as budgeted subsidies are still 79 trillion, or 2.6 percent of GDP. The key challenge for the Government has shifted from how to reduce the debt burden to how to spend public resources well. The challenge is made more difficult by the fact that local governments now account for more than half of public investment, over which the central government has limited influence, and there remain many ambiguities concerning division of labor between central and local governments. Business optimism rose sharply with the new Government, but some investors are now waiting for policy delivery on the ground. Surveys showed a marked improvement in business sentiment in 2005 (see chart), as real obstacles were perceived to be addressed (with the important exception of transport.)2 However, 2005 was marked by relatively more clarity in intent than concrete implementation. In particular, tax and customs laws languished in Parliament with a lack of support from the business community. This year started on a brighter note; there have been clear-cut policy announcements on the investment climate and infrastructure, and a package in the financial sector is due shortly. These packages contain excellent reform measures but, as always, implementation remains a challenge. Highlights of the investment package include a long awaited investment law (with associated clear, simple and transparent negative list), a revitalized national export and investment team, a reduction in the time to start a business from 150 to 30 days, and a reduced share of imports to go through the customs “red lane”. The Investment Law has now been submitted to Parliament, and there is increasing clarity on revisions to the Tax Law, including a number of revisions that redress the balance between tax-payers and tax-officials. The Customs and Tax Departments have long been regarded as among the serious barriers to efficient business operations and new leadership, and planned restructuring, reflect a willingness to address private sector concerns. A preliminary version of the revised labor law designed to increase flexibility ran into significant opposition from labor groups and is being revisited. Generally there is still some tendency to focus on decrees rather than meaningful reforms, and the government is to be commended on its plan to increase external monitoring on the impact of reforms rather than decrees. In addition, major administrative simplification – including the elimination of unnecessary procedures and face-to-face meetings – should be a focus as the most effective near term focus to address problems of endemic corruption.
Constraints to Investment (% of firms reporting constraint to be moderate, severe or very
severe) 0% 10% 20% 30% 40% 50% 60% 70% 80%
Macroeconomic InstabilityEconomic Policy Uncertainty
Local CorruptionNational Corruption
Legal System & Conflict ResolutionTransport
Tax AdministrationLabor Skill and Education
Cost of FinanceTax Rate
Labor Regulation-RegionalCustoms&Trade Regulation-RegionalCustoms&Trade Regulation-National
Licensing and Permits-RegionalElectricity
Labor Regulation-NationalLicensing and Permits-National
ADB 2003
LPEM 2005(December)
Source: ADB, LPEM-FEUI, World Bank
2 This represents the results of a study by LPEM-FEUI in late 2005 financed by the Netherlands Government.
iv

Progress on infrastructure has, to date, been mixed. Concrete results – i.e. projects up and running -- remain few, but progress has accelerated on improving government project coordination and on the critically important creation of unit responsible for risk sharing. The coordinating role of the National Committee on Infrastructure Acceleration (KKPPI) continues to be strengthened, with a Public Private Partnership (PPP) unit being established to facilitate high quality projects. A Risk Management Unit is established at the Ministry of Finance with the aim of assessing government support for projects approved by the KKPPI. There is movement on the financing side as well, with progress on infrastructure financing (including guarantee funds). However, progress on sub-sectoral reforms has not been strong: project preparation remains inadequate, retail tariffs remain below costs in most sectors and decentralization has not led to improved performance on infrastructure by regional governments. The Government has generated impressive momentum in the fight against corruption and governance indicators are already starting to show modest improvements. In addition to pursuing investigations and successful prosecutions against several high-profile individuals, the Government has strengthened the institutional framework to pursue corruption cases through such bodies as the Anti-Corruption Commission (KPK), Anti-Corruption Court, the Interagency Task Force (TimTasTipikor), the Hunting Team (Tim Pemburuan), the Judicial Commission, the Police Commission, and the Prosecutorial Commission. But the achievements on prosecutions have not been matched by success in the implementation of a strategy of reforms to prevent corruption and make sustainable improvements in governance. One of the critical bottlenecks preventing a real breakthrough on governance remains civil service and administrative reform. The Government is starting some promising openings in this area, beginning with high-level officials that could extend to the rest of the civil service. Another major bottleneck remains the slow progress in legal and judicial reform. Implementing the comprehensive reform blueprints, prepared by a broad coalition of court officials and civil society, represents the best opportunity for achieving results. The implementation of direct elections at all levels of the political system has created a new accountability framework that could have a major impact on improving governance outcomes. This has been coupled with the opening of the media and surge of new collective organizations within civil society which are giving rise to powerful demands for good governance. However, “money politics” continues to weaken the link between more robust political competition and good governance. The governance agenda should be expanded to address illicit financial flows through electoral and political party financing, legislative corruption, and quasi-state foundations (yayasans). This will require more active engagement with the national and local legislatures and dialogue with the political parties.
v

There was good progress on poverty reduction in 2005 but the outcome in the first half of 2006 is less certain due to large rice price increases. The poverty head count fell to 16 percent in February 2005 below the 17.6 percent level achieved pre-crisis. More than 13 million people are estimated to have been lifted back out of poverty since the level peaked after the crisis at 23.4 percent in 1999. Savings from reduced fuel subsidies were used for a series of programs for the poor including operational funds for schools, scholarships, village infrastructure and basic health service. The largest program, an unconditional cash transfer (UCT) at more than 17 trillion in 2006, more than compensated the poorest for the losses suffered due to higher prices. In addition, initial evaluations of the program by SMERU and the World Bank indicate that despite the lack of preparation time the UCT performed well. Unfortunately, these excellent pro-poor measures have been undermined by restrictive rice import policies, which have allowed rice prices to rise by 30 percent (March over year earlier), with a serious impact on the poor.
Poverty Trends
34.2
48.0
38.4 37.3 36.1 35.1
16.016.7
17.4
18.2
23.4
17.6
0.0
10.0
20.0
30.0
40.0
50.0
60.0
1996 1999 2002 2003 2004 2005
Milllion poorPercent poor
Source: BPS, World Bank
Public services, especially for the poor continue to improve although slowly and a new service delivery model is needed. Surveys, designed to assess the impact of decentralization and to measure school performance, suggest that service delivery is continuing to improve in Indonesian regions, albeit slowly. However, given the very large increases in spending on education and health (40 and 47 percent in real terms between 2001 and 2003) this result is not particularly satisfactory. The challenge now is to raise service quality and reduce inequalities in access. A new report suggests how this can be done by increasing the accountability and incentives of providers, and strengthening the voice of clients.3 This would also involve increasing the ability of governments and clients to monitor provider delivery and quality. Service agreements are one way to do this and they were used in the recent Aid for Schools program (BOS). Under BOS schools received a block grant in return for abolishing the fees of poor students. The schools were free to use these funds as they like. This type of arrangement could be considered for wider adoption. Another way to improve services is the use of vouchers or conditional cash transfers which are potentially powerful instruments for dealing with income-related inequalities. Reconstruction in Aceh is now progressing well, but the sense of urgency must be maintained. Houses are being built in large numbers, the school year has started normally, and health services are available in most parts of the affected areas. Over US$1.5 billion has already been disbursed, and expenditures are now running at over US$150 million per month. Nevertheless, many challenges remain, particularly in building capacity of local governments, and providing infrastructure to inaccessible regions (on the West Coast), conflict-affected areas, and Nias. There are still cases of poor performance on the part of some central Government departments, and still room for improved coordination. But these are difficulties amid a successful overall story. Most successful of all has been the peace 3 World Bank “Making Services Work for the Poor”, forthcoming.
vi

agreement between the Indonesian Government and GAM, which has been implemented without major disruption, and is providing fundamental optimism for the future of the province. The response to Avian Flu has not yet been well coordinated or effective. So far in 2006, nearly half of human deaths attributed to HPAI worldwide have been in Indonesia. Potential negative impacts extend well beyond the poultry sector and immediate health risks, to significant long-term health risks and economic disruption. Moreover, perceived inaction in Indonesia, as compared to other affected countries such as Thailand and Vietnam, is threatening Indonesia’s image among investors and tourists. The “National Strategic Plan” is sound, but technical details and organizational arrangement for implementation and coordination have not yet been fully developed. Currently a significant financing gap impedes implementation, particularly of animal health aspects. A realistic financing plan is urgently needed.
****
vii

Chapter 1: Investment for Recovery and Growth
Key Messages • The current slow-down is a cyclical response to fiscal and monetary
adjustments. The economy was slowing at year end and growth in 2006 fell to 4.6 percent in Q1 as consumers and producers adjusted to increased fuel prices and higher interest rates. This slowdown reflects the difficult economic adjustment needed to bring Indonesian energy prices closer to market prices and keep inflation under control so Indonesia moves to a higher longer-term growth path.
• Sustained higher growth will require higher levels of private investment and
better use of public investment. Despite strong investment growth in 2004-05, investment as a share of GDP is now only 22 percent, close to 8 percent below its pre-crisis high. A high capacity utilization rate (current slowdown excepted) will create constraints to higher growth unless investment picks up. Eliminating these constraints to private investment (see Chapter 3) and improving the efficiency of public investment (see Chapter 2) are economic priorities.
• Creating jobs is a special problem. Steady economic growth has not generated the
numbers of jobs achieved in the past and open unemployment has risen by 2 percent in 5 years, a period where growth averaged 4.7 percent annually. Poor labor absorption is an outcome of lower growth, but is also a function of poor labor policies and a constraint to investment and therefore itself a cause of low growth.
• With a cyclical recovery and improvements to the investment climate,
Indonesia’s growth rate should rise from approximately 5.5 percent in 2006, to over 6 percent in 2007 and 7 percent in the medium term. The current upswing in public investment will support higher investment later in 2006 and beyond while private investment should provide more momentum beginning in 2007. Effective and sustained investment reforms should push investment to more than 25 percent of GDP by 2010. With the higher growth and high oil prices ‘fiscal space’ is increased and public investment can increase without jeopardizing fiscal sustainability.
1.1 A cyclical down turn in the economy Growth deceleration: GDP growth in 2005 was 5.6 percent, the highest since the crisis in mid-1997. However, the quarterly profile has been slowing, largely due to weaker investment, and especially towards the end of 2005. There have now been 5 quarters of slowing growth (Figure 1-1). The current steep decline was triggered by a series of fuel price increases (143 percent in 2005 for the year, 114 percent in October alone), higher interest rates (a 400 basis point increase between August and December) as well as delays on
1

investment climate reforms. 1 With these policy adjustments the decline in Q1 2006 growth was very much in line with market expectations.2
Slowing consumption and investment were partially offset by net exports and government consumption. Consumption growth in the first quarter was only 3.2 percent (yoy) the lowest since 2001, and investment growth was only 2.9 percent (yoy). The main contributor to the 4.6 percent growth was a substantial pick up in net exports (exports minus imports) with exports growing 10.8 percent and imports 5 percent (on a national accounts basis), in part due to lower oil and fuel imports. Government consumption grew by 14.2 percent (over a low base in 2005) but remains a relatively small share. The softening economy hit the manufacturing sector hard. Echoing the claims of the business community, manufacturing was very weak and a number of service sectors were down as well. However, perhaps reflecting the sky line in Jakarta, construction picked up and mining grew dramatically. The pick up in mining is surprising given the weak investment but is echoed in the trade data with real mining exports up 25 percent yoy in the first quarter. The worrisome decline in oil and gas output continues but the rate slowed (Table 1-1). Confidence returns to Financial Markets. In August 2005, the Rupiah suffered a mini-crisis, fuelled by a loss of confidence in monetary policy and concerns over the impact of high oil prices on the budget. The central bank’s decision to tighten monetary policy through increases in interest rates (400 basis points between August and December) and the government’s decision to slash fuel subsidies restored market confidence in the Rupiah and
Figure 1-1: Growth and Investment (year-on-year growth rate, percent)
-5%
0%
5%
10%
15%
20%
Q1 Q2 Q3 Q4 Q1 Q2 Q3 Q4 Q1 Q2 Q3 Q4 Q1
2003 2004* 2005** 2006***
2%
3%
4%
5%
6%
7%
8%
GDP (RHS)
Investment (LHS)
Source: BPS, World Bank
Table 1-1: Growth by Sector and Category (Year on year, percent)
2004 2005 Q4 05 Q1 06 Agriculture 3.3% 2.5% 5.5% 3.9%Mining -4.5% 1.6% 1.9% 7.0%Manufacturing 6.4% 4.6% 2.9% 2.0%Construction 7.5% 7.3% 6.9% 7.2%Finance 7.7% 7.1% 5.2% 5.1%Transport & Commu. 13.4% 13.0% 10.8% 11.0%Utility 5.2% 6.5% 6.1% 5.2%Trade, Hotel & Restaurant 5.7% 8.6% 6.0% 4.2%Services 4.8% 5.2% 6.0% 5.4%
Non-oil and gas 6.0% 6.5% 5.7% 5.2%Oil and gas -3.5% -3.3% -3.3% -2.2%Total 5.1% 5.6% 4.9% 4.6%Source. BPS, World Bank
1 For example real interest rates (SBI 1 month over core inflation) which had been below 2 percent since the end of 2003 doubled to 4 percent by year end and has remained there. Real interest rates relative to inflation expectations of 7 or 8 percent (and lower than core inflation which is above 9 percent) would be even higher. It is too early for a detailed assessment of how wages and incomes have been impacted, (much less on their expected recovery) but average industrial wages were down 10 percent in real terms by the end of the fourth quarter of 2005. Workers in agriculture and construction (areas where data is more up to date) seem to be recovering and by March real wages were only down 2 percent. Other urban wages, household servants for example, were still down around 8 percent. 2 Consensus forecast of 15 economists in Q1 growth was 4.5 percent.
2

drove the Jakarta Stock Market to new highs. This shift presumably reflected a mix of investor optimism about the projected recovery, as well as perceptions about the spread between Indonesian and international interest rates. The Rupiah began the year at Rp.9,800 to the dollar and appreciated to Rp.9,220 by the end of May 2006 (an appreciation of 6 percent, after rising close to 10 percent earlier). The JSX began the year at 1,172 and reached 1,330 by the end of May (a gain of 15 percent. (Figure 1-2) But shifts in emerging market risk reducing the gains. The rupiah strengthened to its high point of Rp.8,740 and the market peaked at 1,553 on May 11, before pulling back sharply. This reflected a pull back in emerging markets generally but in Indonesia the impact was large as earlier gains had been large as well. Thus other countries Turkey, Brazil, and India have been hit hard as well. Despite the volatility Moody’s International raised Indonesia’s Government bond ratings from B1 to B2 (4 levels below investment grade) citing improved finances and fiscal management practices that warranted an upgrade.
Figure 1-2: Market Confidence Strengthens (Rupiah exchange rate against US$)
8000
8500
9000
9500
10000
10500
11000
Jan-04
Apr-04
Jul-04
Oct-04
Jan-05
Apr-05
Jul-05
Oct-05
Jan-06
Apr-06
600
700
800
900
1000
1100
1200
1300
1400
1500
1600
Exchange rate (Rp/US$)(LHS)
JSX Stock Index (RHS)
Source: CEIC, World Bank staff
Figure 1-3: Widening Gap
Non-oil exports have sustained growth. In 2005, the growth in both non-oil exports and imports was high (18.6 percent and 15.4 percent, respectively for the year) but monthly data into 2006, indicate that the gap between exports and imports has been widening as the economy has softened (Figure 1-3). Non-oil exports are sharply higher thanks to commodity prices for mining exports 3 and apparent shifts from domestic markets to exports following weakening domestic demand. This trend continued in the first four months of 2006 with non-oil exports up by 11.6 percent and non-oil imports down by 3.1 percent. Reflecting a reduction in fuel imports and the weakness in
(non-oil exports and imports, year-on-year growth, percent )
-20%
-10%
0%
10%
20%
30%
40%
50%
60%
70%
Jan
Feb
Mar
Apr
May Jun
Jul
Aug Sep
Oct
Nov Dec Jan
Feb
Mar
Apr
May Jun
Jul
Aug Sep
Oct
Nov Dec Jan
Feb
Mar
Apr
2004 2005 2006
non-oil exports
non-oil imports
Source: BPS, World Bank staff
Figure 1-4: Oil and Gas Balance (US$ million)
-500
0
500
1,000
1,500
2,000
2,500
Jan
Feb
Mar
Apr
May Jun
Jul
Aug Sep
Oct
Nov Dec Jan
Feb
Mar
Apr
May Jun
Jul
Aug Sep
Oct
Nov Dec Jan
Feb
Mar
Apr
2004 2005 2006
exports
imports balance
Source: CEIC, World Bank staff
3 In January-October 2005, mining products like copper and coal contributed about 40 percent of the increase in total non-oil and gas exports relative to the previous year.
3

manufacturing intermediate imports decelerated sharply (-8.4 percent) while consumption remained very strong and capital goods strong (at 17.8 and 11.9 percent respectively). Oil and gas trade balance turns positive: In Q3 2005 Indonesia posted a deficit on oil and gas trade for the first time in 20 years as a result of rising demand for fuel and a concurrent decline in domestic oil production. The deficit shifted back to surplus in Q4, and the surplus grew in 2006 as the October increase in domestic fuel prices continued to play out (Figure 1-4). Fuel price increases push inflation sharply higher but the Central Bank is on track to reach inflation target by year end. Inflation was stable in the 6-7 percent range in 2003-2004. It began to rise in 2005 and a 114 percent increase in fuel prices in October pushed it to over 17 percent by the end of the year (Figure 1-5). In 2006 inflation has decelerated rapidly, in part due to a 6 percent appreciation so far this year. From January through May cumulative inflation has been 2.4 percent, well below the rate in 2005 at 3.8 percent and even in 2004 at 2.8 percent. This is on track to reach or exceed the inflation target of 7-9 percent as 2004 ended the year with inflation of 6.4 percent.
Figure 1-5: Inflation (year on year growth rates, percent)
0%
2%
4%
6%
8%
10%
12%
14%
16%
18%
20%
Jan-04 May-04 Sep-04 Jan-05 May-05 Sep-05 Jan-06 May-06
overall CPI
core CPI
Source: CEIC, World Bank
Financial sector reforms continue as the blanket deposit guarantee is phased out and replaced by limited coverage through a deposit insurance scheme. As of March 22, 2006, coverage was reduced to Rp.5 billion. It is to be reduced further to Rp. 100 million by March 2007 with an intermediate step of Rp.1 billion in October. Bank Indonesia has also made progress on banking architecture, including efforts to consolidate the sector and enforce regulations aimed to strengthen the operations and governance of banks. The Government is formulating a financial sector policy package – intended to be announced in June. The package appears set to address key issues in banking and financial markets while sharpening priorities and improving coordination amongst supervisors of financial institutions. The overall banking sector continues to be basically sound. In 2005 credit growth was 24 percent although this had declined to 18 percent by March 2006; and the capital adequacy ratio for the sector was a robust 22 percent. Despite this overall positive picture there are areas of concern. Gross non performing loans (NPLs) of the banking sector increased since Q2 2005 and stand at 8.2 percent as of March 2006 compared to 4.4 percent in March 2005.4 Most of this is due to the increases in state-owned banks with Bank Mandiri and BNI recording gross NPLs of 26 percent (18 percent) and 16 percent (5.5 percent) in March 2006 versus March 2005. Efforts to address these are underway but the key challenge remains one of improving governance and market discipline at these banks. The fact that there is a 4 Bank Indonesia “Indonesian Banking Statistics”
4

substantial and growing gap between the performance of private banks and the two state banks - Mandiri and BNI - points to the need for greater private sector participation, with the ultimate objective of full privatization. Risk management skills need to be enhanced at state banks and indeed industry-wide. Despite consistent efforts by Bank Indonesia to spur lending to SMEs and rural markets, access to bank finance for these segments needs to be improved. The merger of Bapepam and DGFI is complete and there is now one regulator for Non Bank Financial Institutions (NBFIs) and capital markets. Senior officials have been appointed and organizational changes and capacity building is underway. The Government is focusing on the development of non bank financial institutions. In the capital market, a medium term blue print has been prepared and preparations for implementation are underway. Programs to ensure adequate technical capacity at pension funds and insurance companies are in place. Operating licenses of some insolvent insurance companies have been revoked to clean up and consolidate the industry. The World Bank has prepared an assessment of NBFIs to survey the sector, highlight issues and identify reform options.5
Fiscal consolidation continues. At year end, the budget deficit (relative to GDP) was 0.5 percent, about half the deficit foreseen in the revised budget. The smaller budget deficit (together with a sizable increase in nominal GDP) contributed to a sharp drop in the government debt to GDP ratio to 47 percent (end 2005) from 55 percent in 2004 and 100 percent in 1999 (Figure 1-6). Outstanding Government debt stood at US$139 billion in 2004 and US$132 billion in 2006 with the decline in dues repayments and a yen depreciation. The Indonesian debt to GDP ratio is now quite close to the level in Malaysia (45.7 percent) while Thailand (26.1 percent) and the Philippines (72.3 percent) are respectively lower and higher.
Figure 1-6: Reducing Debt Burdens (government debt to GDP ratio, percent)
0%
10%
20%
30%
40%
50%
60%
70%
80%
90%
100%
1996 1997 1998 1999 2000 2001 2002 2003 2004 2005
Domestic
External
Source: MOF, World Bank
Fiscal consolidation in 2005 also stemmed from low expenditures due to the change in Government and new budget procedures. Government budget execution documents were only available in April (they should be available in January) as the incoming government (and Parliament) created a new budget from scratch. In addition, there was a major reorganization at the Ministry of Finance accompanied by the introduction of a new fiscal management system. This contributed to significant delays in disbursements especially for capital items and especially in the first half of the year. This low spending contributed to the slowing economy in 2005. In the second half of the year, the situation improved despite the fact that capital spending was only 62 percent of the targeted level. Note, however, that
5 “Indonesia’s Non-Bank Financial Institutions: Unlocking Indonesia’s Domestic Financial Resources for Development” forthcoming.
5

higher spending late in the year (more than half of total capital expenditures of the year were disbursed in the last 2 months), contributed to growth in the fourth quarter. The Central Government’s budget execution in first quarter 2006 was better than 2005 but lower than expected and regional government spending remains a concern. Spending in the first 4 months, measured as the share of the annual budget, has been higher this year as it includes the carry-over of some spending from 2005. The disbursement of capital and social expenditures was 10 and 20 percent of the budget, this year (through April), far higher than the last year (0.5 and 3 percent). However, this remains very back-loaded and creates a drag on the economy. The share of transfers to the region has risen from 5.5 percent of GDP in 2005 to 7.2 percent in 2006 with the average district receiving 50 percent more this year. The size of this increase has raised concerns about both regional government budget execution - including the possibility of regional government surpluses - and budget allocation choices (Chapter 2). For example, deposits outstanding by regional governments–a proxy for a build up in surpluses - has been increasing since 2005 and reached Rp.70 trillion (about 2.3 percent of GDP or US$7.6 billion) by March 2006. (Figure 1-7) This would imply that regions have yet to fully utilize their additional financial resources for development.
Figure 1-7: Accumulating Deposits by Regions(deposit outstanding by regions, trillion)
0
10
20
30
40
50
60
70
80
Jan
Feb
Mar
A
pr
May
Ju
n Ju
l A
ug
Sep
Oct
N
ov
Dec
Ja
n Fe
b M
ar
Apr
M
ay
Jun
Jul
Aug
Se
p O
ct
Nov
D
ec
Jan
Feb
Mar
A
pr
May
Ju
n Ju
l A
ug
Sep
Oct
N
ov
Dec
Ja
nFe
bM
ar
2003 2003 2004 2005 2006
Kabupaten/Kota
Province
Source: CEIC, World Bank
1.2 The Post-Crisis economic growth has occurred without a significant recovery in investment Investment has risen but remains only 22 percent of GDP. Despite strong growth in 2004 (14.6 percent) and 2005 (9.9 percent), investment as a share of GDP remains at 22 percent, about 8 percent below its pre-crisis peak in 1996 (Figure 1-8). This fall in investment can be decomposed into a decline in domestic savings and a turn around in the amount of foreign savings being supplied (the current account deficit) as investment has to equal savings. For example, the 7.6 percent reduction in investment between 1996 and 2005 is due to a decline in domestic savings of 3.2 percent and a turn around in foreign savings of 4.4 percent.
Figure 1-8: Low Investment (Gross fixed capital formation as % of GDP)
18%
20%
22%
24%
26%
28%
30%
1994 1995 1996 1997 1998 1999 2000 2001 2002 2003 2004 2005
1993 base 2000 base
Source: BPS, World Bank staff
6

All categories of investment have declined but private investment declined most before beginning to recover in 2004-05. 6 In 1996 when investment reached its all-time high of 29.6 percent of GDP, private investment was 22.6 percent and public investment (sum of regions and center) was 7.2 percent. In 2000, public investment fell to 3.9 percent –about half of pre-crisis period- and private investment was 16 percent. Between 2000 and 2003, public investment recovered to near pre-crisis levels and private investment fell further to 12.8 percent. In 2005, higher private investment pushed overall investment to 22 percent despite slow spending by the government (see above and Chapter 2). In 2006, public investment should be 6.8 percent of GDP and the key concern has shifted to the level of private investment (Figure 1-9). 7
Figure 1-9: Anatomy of Low Investment (Gross % of GDP)
5.0%2.5% 3.4% 2.2% 3.4%
2.0%
1.4%3.1%
2.2%3.4%
22.6%
16.0%12.8% 17.5%
16.8%
0%
5%
10%
15%
20%
25%
30%
1996 2000 2003 2005 (*) 2006 (**)
Highest inv. before crisis
Low from public sec.
Lowest inv. after crisis
Private
Region
Center
Note- (*) preliminary data; (**) estimates Source: BPS, World Bank staff
Low investment is the proximate cause of the low economic growth. A growth accounting exercise suggests 8 that low capital stock and a slow down in labor quality gains are the main cause of the slow down post crisis (Table 1-2). Pre-crisis (1990-97) growth in the capital stock contributed 3.0 percent to growth while it contributed merely 0.1 percent post-crisis (2000-05) while labor quality fell from 1.8 percent to 1.1 percent. Conversely TFP, a measure of productivity, rose substantially from 0.9 percent to 1.9 percent. In fact, Indonesia’s capital stock at the end-2005 was almost identical to the level at the end of 1997. In other words, new investment has only kept up with depreciation since the crisis.9
Table 1-2: Growth Accounting Exercise(Annual average, percent)
1990-97 2000-05 Gap GDP growth 7.4 4.7 -2.7 Capital stock 3.0 0.1 -2.9 Labor quantity 1.8 1.6 -0.2 Labor quality 1.8 1.1 -0.7 TFP 0.9 1.9 1.0 Source: World Bank staff
6 Central government and regional governments’ investment are taken from development expenditures, while private investment is calculated as residual. Private investment includes investment by SOEs. 7 In Figure 1-9 regional government investment in 2005 and 2006 is estimated to grow by same amount as central government investment. It is difficult to assess the validity of this assumption, on the one hand regional governments budgets are growing faster and they have more discretion over additional spending (no interest and subsidy payments for example) but they may also accumulate surpluses. 8 The growth accounting exercise is based on estimation of Cobb-Douglas production function. The contributing factors to output growth are (i) capital stock (from investment), (ii) quantity of labor, (iii) quality of labor (years of schooling) and (iv) TFP (total factor productivity). TFP is calculated as a residual. 9 This is somewhat surprising given that GDP is 16 percent higher in real terms in 2005 than 1997. It most likely reflects higher capacity utilization (see below), higher quality capital and poor pre-crisis investment choices.
7

The economy is now operating close to full capacity implying very high productivity for the existing capital stock and a pent-up demand for investment. Low investment and economic growth have pushed the economy to high capacity utilization (measured by the gap between the actual and trend output capital ratio) (Figure 1-10). 10 This implies two things. First, if investment does not grow excess demand pressure will spill over into imports and increase inflationary pressures. Second, an improvement in the investment climate could quickly translate into higher actual investment. Or conversely, the gap between potential and actual investment demand reflects the weakness of Indonesia’s investment climate.
Figure 1-10: Potential Demand for Investment(gap between actual output-capital ratio and trend
ratio, percent)
-15%
-10%
-5%
0%
5%
10%
1980 1985 1990 1995 2000 2005
strong potentail investment demands
weak potential investment demands
Gap from trend output-capital ratio
Source: World Bank staff
Different approaches are needed for private and public investment. For the first time since the crisis, the Indonesian budget has increased ‘fiscal space’ for public investment and the focus should now be on improving budget execution, allocation and financial management (Chapter 2). However, private investment has yet to return to optimal levels and requires identifying and removing binding constraints (Chapter 3). Determining the critical constraints to investment is a prerequisite for effective policy formulation and implementation.11 Hausmann and Rodrik and Velasco (Figure 1-11) propose the use of a decision tree to assess binding constraints. To do this one first decides whether the constraint is in the form of a low return on economic activities or the cost of/or access to financing. Next, assuming that it is a low return on economic activities, the decision is decomposed into low social returns (poor human capital or infrastructure) or low appropriability (government and market failures). Financing difficulties arise from problems due to poor domestic intermediation or lack of access to international financial markets. Using this framework in Indonesia the binding constraints appear to be government failures, and bad infrastructure. While financing could be a problem, Indonesian companies appear able to issue USD and rupiah denominated bonds and, as noted, credit growth is high. Rather, micro-risks in areas such as taxes and corruption, contract enforcement, poor skills (i.e. education) and infrastructure show up as binding constraints (shaded boxes in Figure 1-11). For example, Doing Business 2006 indicates that it takes 570 days to enforce a contract in Indonesia, while it takes 300 in Malaysia and 390 in Thailand. 12 Further, the World Bank rated Indonesia’s infrastructure performance as one of the lowest
10 See methodology in “Capacity utilization in Indonesia: Time to Invest” in Economics and Finance in Indonesia Vol.53 (3), Page 279-292 March 2006 by Yoichiro Ishihara and Daan Marks. 11 This framework is developed by R. Hausmann, D. Rodrik and A. Velasco (March 2005) “Growth Diagnostics”. Please see the article for further elaboration. 12 World Bank and IFC (2006) “Doing Business in 2006: Creating Jobs”
8

in the region.13 These are areas addressed by recent infrastructure and investment packages. (Chapter 3)
Figure 1-11: Binding Constraints Decision Tree
Problem: Low levels of private investment and entrepreneurship
Low return on economic activities High cost of financing
Low social returns
Low appropriability
Bad international finance
Bad local finance
Poor geograph
Low human capital
Bad infrastructure
Government failures
Market failures
Micro risks: contract
enforcement, corruption,
Macro risks: financial, monetary,
fiscal instability
Information externalities:
“self discovery”
Coordination externalities
Low domestic saving
Poor intermediation
1.3 Job Creation is a key concern Despite a government priority on jobs open unemployment increased by 2 percent between 2001 and 2006 (to 10.4 percent). This is a period when economic growth averaged 4.7 percent. (Table 1-3). There are a number of employment related issues (Chapter 3) but rising unit labor costs appear to be the main cause of lower employment in manufacturing as real wages outpaced productivity by 27.4 percent per annum from 2000-2003 (Table 1-4). 14 The most immediate cause for this was the very rapid
Table 1-3: Labor Market Development in 2001-2006(Million people, percent)
2001 2006 Growth (annual average)
1. Labor force 98.8 106.3 1.9% - Labor participation rate 68.6 66.7 - 2. Employed 90.8 95.2 1.1% 3. Unemployed */ 8.0 11.1 7.9% 4. Unemployment rate (3/1) 8.1% 10.4% - */ including job seekers Source: BPS, World Bank staff
Table 1-4: Gap between Wage and Productivity Growth in Manufacturing (Annual average, percent)
1985-90 1990-96 1997-99 2000-03 -3.4 -3.7 0.6 27.4
Source: BPS, World Bank staff calculation
13 World Bank (2004, p.19) “Indonesia: Averting an Infrastructure Crisis: A Framework for Policy and Action” 14 This figure is based on an analysis of Indonesia’s Medium and Large Manufacturer census with 2003 currently the latest available information.
9

run up in minimum wages, with the average minimum wage (quite close to the average industrial wage) rising by 49, 24 and 38 percent in 2000, 2001 and 2002 respectively. With labor costs outstripping labor productivity by such a wide margin, labor intensive industries, including garments and textiles, were naturally hit hard. Starting 2003 minimum wages have tracked inflation reasonably closely but the growth in formal employment has yet to pick up appreciably. Not surprisingly, the relationship between growth and employment has changed. Historically annual economic growth of 4-5 percent was thought sufficient to absorb new entrants (Figure 1-12). 15 To be sure other factors such as the sectoral composition of growth; the cost of labor relative to capital; labor market flexibility and minimum wages are key determinants of employment growth. 16 (Chapter 3) However, looking at the issue as one of productivity, between 1998 and 2000 every Rp.1 billion of GDP (2000 constant) generated 41 jobs; whereas between 2001 and 2004 every Rp.1 billion of GDP generated only 13 jobs. In other words, recent economic growth is reflected in increased labor productivity, not higher employment (Table 1-5). If this relationship continues to hold, the economy would need to grow by 7 percent between 2005 and 2010 to absorb 2 million workers annually (new entrants and existing unemployed).
Table 1-5: Growth and Employment (Annual average, percent)
GDP growth
Job growth Labor productivity
1998-00 2.8 1.8 1.1 2001-04 4.8 1.1 3.7 Source: BPS, World Bank staff calculation
Figure 1-12: Less Employment Generation(constant GDP and employment)
87
88
89
90
91
92
93
94
95
1,300 1,350 1,400 1,450 1,500 1,550 1,600 1,650 1,700
1998-2000
2001-2004
Constant GDP (Rp. Billion)
Employment (million)
Source. BPS, World Bank staff
1.4 Medium-Term Growth Prospects (Table 1-6) Growth is expected to be around 5.5 percent in 2006. The current slowdown should bottom out in the first half. In the second half, government spending will pick up accelerating the recovery in real incomes while private investment and consumer durable purchases will recover as nominal (and real) interest rates fall. Good progress on infrastructure, investment and financial reforms would reinforce this trend and crowd in private investment, creating an earlier recovery and stronger growth. Assuming good progress on the reform agenda and a favorable global environment, growth should accelerate to above 6 percent in 2007.
15 For example, Islam and Nazara (2000) concluded that growth of between 3.5 and 4.7 percent would absorb new entrants to the labor market (about 2 million) based on 1996/97 data. 16 A SMERU study in July 2005 (The Measurement and Trends of Unemployment in Indonesia: The Issue of Discouraged Workers) provides an overview of the concepts used to measure unemployment in Indonesia. The study indicates that changes in definition have affected measured unemployment trends.
10

Indonesia can sustain economic growth in the 7 percent range by 2009. However, a pre-condition is a higher level and quality of investment including public investment. With the recovery of both private and public investment, investment as a share of GDP could reach 25 percent in 2010. The Government’s fiscal space will be greater and the debt to GDP will continue to decline. With the increase in ‘fiscal space’, government’s (central and regions) public investment should be sustainable at 7 percent of GDP, levels that match pre-crisis highs. The increase in public investment will enable the government to allocate more resources to sectors such as education, health and infrastructure without hurting fiscal sustainability as long as international oil prices remain at projected levels (above US$60 a barrel). With this the government debt to GDP ratio is projected to fall below 30 percent of GDP in 2010.
Table 1-6: Medium-Term Macroeconomic and Fiscal Framework 1996 2004 2005 2006 2007 2008 2009 2010Act. Act. Act.
I. Macroeconomic FrameworkNominal GDP (Rp. Trillion) 533 2,273 2,730 3,316 3,802 4,248 4,726 5,213
Real GDP growth (%) 7.6% 4.9% 5.6% 5.5% 6.2% 6.5% 7.0% 7.0o/w investment growth rate (%) 14.5% 14.1% 9.9% 10.7% 11.7% 7.4% 9.5% 10.5%
- Private - - - 3.0% 8.0% 8.0% 8.5% 9.0%- Governments (center and regions) - - - 40.8% 22.1% 5.9% 12.0% 14.1%
Investment to GDP ratio 29.6% 21.7% 22.0% 23.1% 24.0% 24.2% 24.8% 25.6%Inflation rates (CPI, %, average) 8.0% 6.1% 10.5% 13.6% 6.2% 4.9% 4.0% 3.1%Current Account Balance (US$ billion) -7.6 3.1 3.0 4.9 6.4 4.2 0.7 -2.6Current Account Balance (% GDP) -3.4% 1.2% 1.1% 1.4% 1.6% 1.0% 0.1% -0.5%Oil Prices (ICP, US$/bbl) 20 37 52 66 69 68 67 65Real exchange rate (2005=100) - 102 100 87 85 87 87 88
II. Fiscal Framework1. Central Government(1) Revenue 15.1% 17.6% 18.2% 19.4% 19.0% 18.9% 18.6% 18.6%
o/w Non-Oil and Gas 11.7% 12.8% 13.0% 13.4% 13.6% 13.8% 14.1% 14.3%o/w Oil and Gas 3.4% 4.8% 5.1% 5.9% 5.4% 5.1% 4.5% 4.2o/w Grants 0.0% 0.0% 0.0% 0.1% 0.0% 0.0% 0.0% 0.0%
(2) Expenditure 13.4% 18.7% 18.7% 20.9% 19.9% 19.4% 19.0% 18.8%o/w Capital Expenditure - - 1.4% 1.9% 2.2% 2.3% 2.4% 2.6%o/w Social Assistance - - 0.9% 0.9% 1.5% 1.7% 1.9% 2.1%o/w Fuel subsidy 0.2% 3.0% 3.5% 2.6% 2.1% 1.4% 0.5% -0.2
(3) Primary Balance 3.4% 1.7% 1.6% 1.1% 1.5% 1.7% 1.7% 1.7%(4) Budgetary Balance 1.7% -1.0% -0.5% -1.5% -0.9% -0.5% -0.5% -0.3%(5) Financing -0.2% 0.9% 0.7% 1.0% 1.1% 1.1% 0.7% 0.4%Gross financing needs (US$ billion) 3.3 10.7 7.9 14.2 13.7 12.6 12.1 9.7Government debt to GDP ratio (%) 25% 55% 47% 37% 34% 33% 30% 29%Debt service to expenditure ratio (%) 29% 32% 24% 25% 25% 24% 22% 19%
2. Consolidated Government(1) Revenue 16.2% 19.7% 20.7% 22.0% 21.5% 21.3% 21.0% 21.0%(2) Expenditure 15.1% 19.7% 20.6% 22.5% 21.3% 21.6% 21.0% 20.8%
o/w Investment - - 4.8% 6.3% 7.1% 7.1% 7.4% 7.9%(3) Budget Balance 1.0% 0.0% 0.1% -0.4% 0.1% -0.2% 0.0% 0.2%
<-------------World Bank Projection ------------>
%
%
%
Source: World Bank staff
****
11

12

Chapter 2: Fiscal Space, Public Investment and Decentralization
Key Messages • There is increased ‘fiscal space’ for public investment. For the first time since
the crisis, the Indonesian budget has enough ’fiscal space’ to increase spending on education, health and infrastructure without jeopardizing fiscal sustainability targets. This increase is due to declining debt burdens, a significant reduction in fuel subsidies and increased non-oil tax revenues. However, Indonesia has yet to fully translate this fiscal space into public investment due to a lack of absorption capacity realizations are consistently below budgeted amounts.
• Indonesia’s debt burden has fallen dramatically. Debt service payments (the
sum of interest and principal payments) are now lower than pre-crisis levels. • Public investment is returning to pre-crisis levels with the regions emerging
as the key driver. Development expenditures at the central and regional level, a proxy for public investment, averaged 6 percent of GDP in 2003 and 2004 and are potentially 6.8 percent in 2006. These levels of investment are now close to pre-crisis levels. Nevertheless, to make up for low public investment post-crisis and to improve public service and stimulate growth, Indonesia will need to take advantage of the potential for high public investment.
• Accelerating decentralization reforms is a prerequisite for public investment
as the role of regional governments has significantly increased. Six years after decentralization, regions now account for more than half of total public investment. In 2006, central government transfers to regions are likely to grow by a sizable 2 percent of GDP. The reform agenda remains incomplete, especially around expenditure assignments.
• Developing an efficient public financial management mechanism will help streamline public investment. Indonesia has undertaken major public financial management reforms which will reduce leakage and promote investment. However, these new mechanisms sometimes appear to be constrain public investment rather than promote it. The new public financial management mechanisms should be accompanied by efficient implementation.
2.1 Increasing but Unutilized Fiscal Space For the first time since the crisis, Indonesia has the financial resources to begin to address development needs. In recent years the central government’s financial resources for public investment and other development priorities have increased significantly. One way to assess this is to look at the potential spending available for government after adjusting for salary and interest payments. These have increased from 12.3 percent in 2002 to 16.2 percent of GDP in 2006 (Figure 2-1). The sharpest increases are in 2005-2006 budgets in conjunction with higher international oil prices. However, the central government has not
13

been able to keep up with the growth in fiscal space as indicated by the gap between budgeted spending and realizations. Figure 2-1
Figure 2-1: Increased Fiscal Space (share in GDP, percent)
10%
11%
12%
13%
14%
15%
16%
17%
18%
FY01 FY02 FY03 FY04 FY05 FY06
Latest estimates in revised budget
Realization
2.2 Key Expenditure Issues Major shifts in the central government spending are likely in 2006 (Table 2-1). The combined increase in revenues and reduced spending on fuel subsidies has potentially freed up resources equivalent to 4.4 percent of GDP in 2006. The central government budgets a transfer of additional resources to the regions (+1.7 percent), capital expenses (+0.7 percent), social assistance (+0.3 percent) among others. A sharp increase in transfers to the regions makes them an increasingly important actor on fiscal policy (see more discussion in Section 3). Other key expenditure items are (i) subsidies (ii) debt service and (iii) public investment.
Note: Fiscal space defined here as total expenditures minus salary and interest Source: World Bank
Subsidies A series of fuel price adjustments saved US$5 billion in 2005 and will save US$10 billion in 2006. In 2005, fuel subsidies reached US$9 billion (3.5 percent of GDP), more than twice as large as capital spending. However, a series of fuel price adjustments (30 percent price increase in March, introduction of market prices for industry in July/August and 114 percent price increase in October) saved US$5 billion in 2005 and will save US$10 billion in 2006 (Figure 2-2). Despite the bold hikes, Indonesia’s retail prices for gasoline and kerosene still remain at 70 percent and 30 percent of international prices (Table 2-2). 1 Given these remaining subsidies (still 2.6 percent of GDP) adjustments to domestic fuel prices
Table 2-1: Spending Shift between 2005 and 2006(% of GDP)
Sources Usage Subsidy cut
1.8% Transfers to regions
1.7%
Spending increase
2.6% Capital 0.7%
Material 0.6% Personnel 0.6% Interest 0.4% Social
Assistance 0.3%
Others 0.1%Total 4.4% Total 4.4%
Note: 2005- preliminary actual, 2006- budget Source: World Bank
Figure 2-2: Fuel Subsidy (US$ billion)
0
2
4
6
8
10
12
14
16
18
FY01 FY02 FY03 FY04 FY05 FY06(Budget)
US$ billion
Saving from Mar 05 price increase
Saving from Oct 05 price increase
Saving from application of market price for industry
Note: Saving for 2006 is estimated based on the approved budget Source: World Bank
1 The impacts of recent spikes in international oil prices are offset by the appreciation of the rupiah exchange rates.
14

and especially linkages to market prices are needed, with due consideration for growth outcomes and the impact on the poor. It should also be noted that Indonesia is an oil and gas producer thus as international prices rise (with many domestic prices fixed) subsidies rise but there are off-setting revenues. Thus simulations indicate that higher international oil prices are neutral with respect to their impact on the budget deficit. The government faces a critical choice on electricity subsidies.2 The increases in fuel prices have increased the subsidies required by PLN (State-owned Electricity Company) as they pass into production costs. In the 2006 budget, the central government set aside Rp.17 trillion (US$1. 8 billion) for electricity subsidy assuming an increase of 20-30 percent in tariffs. The subsequent decision to not increase electricity tariffs in 2006 will result in an additional subsidy of Rp.20 trillion (about US$2 billion). As for was the case for fuel, subsidies to electricity distort consumer and producer incentives and constrain higher value spending. Most of the electricity subsidy is absorbed through a regressive subsidy to consumers (66 percent) followed by industry (29 percent) and business (5 percent) in 2006 (see Box 2-1)
Table 2-2: Domestic Fuel Prices vs. International Prices A. Domestic Fuel Prices (Rp/liter) Before
Oct fuel hike
(Sep 05)
After Oct fuel hike (Oct 05)
Latest (May 06)
Gasoline 2,400 4,500 4,500Kerosene (household) 700 2,000 2,000Diesel 2,100 4,300 4,300B. International Prices (Rp/liter) 1/ Gasoline 6,570 5,876 6,238Kerosene (household) 6,493 6,218 6,307Diesel 6,470 6,225 6,460C. Domestic Prices as % of International Prices (A/B) Gasoline 37% 77% 72%Kerosene (household) 11% 32% 32%Diesel 32% 69% 67%D. Economic Variables Crude oil price (ICP, US$/bbl) 62 58 70Exchange rate (Rp/us$) 10,310 10,090 9,2201/ MOPs plus 15% adjusted by exchange rates and tax Source: World Bank staff
2 More discussion on electricity subsidy is in “Electricity for All: Options for Increasing Access in Indonesia” (World Bank, 2006)
15

Box 2-1: Who is benefiting from electricity subsidy? The electricity subsidy is regressive although less so than fuel subsidies before the price increases. In 2005, the Rp.11 trillion household subsidy for electricity is distributed as follows: The poorest 10 percent of Indonesians received an estimated Rupiah 900 billion in 2005, while the richest 10 percent received 1.3 trillion, 40 percent more. Other population groups range between Rp. 980 billion and Rp.1.3 trillion (see chart below). Indonesia has five types of electricity subsidies that are distributed very differently. The most important is for 450VA, a voltage capacity that only allows for low-intensity electricity use (e.g. for light bulbs). The poorest households fall predominantly in the 450VA capacity group, and this subsidy which covers more than half of all electricity subsidies to residents, is progressive. Within the 450VA category, the poorest 10 percent of Indonesians receive Rp. 850 billion, almost three times as much as the richest decile (Rp. 300 billion). It is the other electricity subsidies (900VA up to 6600 VA) that make the overall subsidy regressive.
-
0.20
0.40
0.60
0.80
1.00
1.20
1.40
1 Poorest 2 3 4 5 6 7 8 9 10 Richest
Trill
ion
Rp.
6600VA
2200VA
1300VA
900VA
450VA
Debt The burden of debt service on expenditures is now below pre-crisis levels. Debt service – the sum of interest and principal payments- as a percentage of total expenditures is now below the pre-crisis level (Figure 2-3). During 2003-2005, debt service was 27 percent, while it was 38 percent pre-crisis (1994-1996).3 Post crisis principal and interest rescheduling under the Paris Club agreements lowered financing costs. Despite the loss of Aceh based rescheduling debt service as a percentage of
Figure 2-3: Easing Debt Burden (1)(debt service to total expenditure ratio, percent)
0%
5%
10%
15%
20%
25%
30%
35%
40%
45%
50%
FY94 FY95 FY96 FY97 FY98 FY99 FY00(9m)
FY01 FY02 FY03 FY04 FY05 FY06Budget
Principal
Interest
Source: World Bank
3 In 1994-95, prepayment of government debt increased debt service substantially but current levels are below the level in 1996 when there was no prepayment.
16

total expenditures will remain low at 25.5 percent in the 2006 as revenues and expenditures are higher as noted earlier. Since 2000, Indonesia’s debt burden has been reduced substantially. The government debt to GDP ratio improved from 97 percent in 1999 to 47 percent in 2005 and foreign debt is now approximately pre-crisis levels (Figure 2-4). This decline has been much faster than Bank and other observers projected in 2000.4 Fiscal consolidation and non-debt financing (e.g. IBRA asset sales) contributed to keeping total debt outstanding stable but most of the story is that Indonesia has been growing out of its debt. (Table 2-3)
Figure 2-4: Easing Debt Burden (2) (government debt to GDP ratio, percent)
0%
20%
40%
60%
80%
100%
120%
1996 1997 1998 1999 2000 2001 2002 2003 2004 2005
externaldomestic
Source: World Bank
Table 2-3: Factors Affecting Central Government Debt to GDP ratio 2000 2005 Change Contribution Government debt outstanding
I. Total Debt Outstanding (US$ billion) 132.0 131.6 -0.5 0.5% 1. External Debt (US$ billion) 63.9 65.7 1.8 -1.9%
(1) US dollar denominated (US$ billion)1/ 38.9 40.9 2.1 -2.2% (2) JPY denominated (US$ billion) 25.0 24.7 -0.3 0.3%
a. JPY denominated (JPY billion) 2,877 2,918 42 -0.4% b. JPY exchange rate (Yen/US$) 114.9 118.0 3.1 0.7%
2. Domestic Debt (US$ billion) 68.1 65.9 -2.2 2.4% (1) Domestic Debt (Rp. Trillion) 653.8 647.7 -6.1 0.7% (2) Rp. Exchange rates (Rp/$, eop) 9,595 9,830 235 1.7%
Gross domestic product II. Nominal GDP (US$ billion) 165.0 281.3 116.2 99.5%
1. Nominal GDP (Rp. trillion) 1,389 2,729,708 1,339,938 118.2% (1) Real GDP (Rp. trillion) 1,389 1,749,547 359,777 40.6% (2) GDP deflator (2000=100) 100 156 56 77.5%
2. Rp. Exchange rate (Rp/$, average) 8,422 9,705 1,283 -18.7% Government Debt to GDP ratio 80.0% 46.8% -33.2% 100.0% 1/ Non-JPY portion Source: World Bank Staff Estimates
Public Investment Development expenditures, which have often been used as a rough proxy for public investment, have been recovering. Indonesia faced a “crisis of investment” from 1999-2002 the immediate post-crisis period. Only strong consumption kept the economy growing (see Chapter 1). Investment levels dropped to below 20 percent of GDP, and private and public investment levels dropped in tandem and reached record lows in 2000. The central
4 For example, The Bank projected the ratio to decline to approximately 45 percent only by 2010 in “Indonesia: Managing Government Debt and Its Risks” (May 2000)
17

government’s development expenditure fell to 2.0 percent of GDP in 2002 before recovering to 2.7 percent in 2005.5
However, regions are now contributing half the aggregate public investment in Indonesia. Since 2002, regions contributed 50 percent or more to aggregate development spending (Figure 2-5). Regions have been the main driver of increased development spending in recent years. Total development expenditures as a share of GDP reached 6.5 percent in 2003 before slipping to 5.4 percent in 2004, almost the levels in 1995-1996 (Figure 2-6). However, as public investment has been low for years, it will need to grow for some time to make up shortfalls.
Figure 2-5: Regions Share Increased(% of total development expenditures)
Figure 2-6: Development Expenditures Recover to the Pre-Crisis Level
(% of GDP)
0%
10%
20%
30%
40%
50%
60%
70%
80%
90%
1994 1995 1996 1997 1998 1999 2000 2001 2002 2003 2004 2005(E)
2006(P)
central government
regional governments
0%
1%
2%
3%
4%
5%
6%
7%
8%
1994 1995 1996 1997 1998 1999 2000 2001 2002 2003 2004 2005(E)
2006(P)
Central Government
Province Kabupaten/Kota
Note: 2005-Estimates, 2006-Projection Source: MOF, World Bank staff
Note: 2005-Estimates, 2006-Projection Source: MOF, World Bank staff
2.3 Accelerating Decentralization Reforms Regions have become key players in service delivery and their role in economic development is increasing. Much of the increased spending from higher oil prices and the fuel subsidy reduction will be spent by regions through transfers (Table 2-1). In 2004, the latest year for which we have regional fiscal data the regions commanded about 35 percent of total expenditures (Figure 2-7). Given the sharp increase in regional transfers in 2006, regional share in total public investment is likely to rise above 50 percent in 2006.
5 Indonesia has historically been classifying the budget in routine and development spending. Development spending has been used as a proxy for public investment but has also included spending categories that are considered current spending (e.g. travel, allowances, etc.). In 2005, the government changed its budget classification and moved to the international standard GFS-classification. A comparison of development spending (old definition) and capital spending public (new definition) for 2004 shows that up to 40 percent of development spending is not capital investment but various types of current expenditure. As it is not possible to calculate the historic public investment rates, this analysis continue to use proxies of development spending for consistency and comparability reasons. Starting in 2005 the sum of capital expenditures and social assistance is considered as development expenditures.
18

Figure 2-7: Illustration of Roles of Different Levels of Governments: before and after Decentralization(US$ billion)
2000 (before decentralization) 2004 (after decentralization)
0
5
10
15
20
25
30
35
40
45
50
Revenues Expenditures
Center
Province
Kabupaten
0
5
10
15
20
25
30
35
40
45
50
Revenues Expenditures
Center
Province
Kabupaten
Source: MOF, World Bank staff
In 2006, the single most important fiscal concern is the capacity of regions to spend their resources. Total funds available to regions will increase by about 50 percent in 2006 through transfers from the centre. However, since decentralization, the regions appear to have been building up sizeable savings that have reached Rp.70 trillion by March 2006 due to the large increase in revenue sharing (natural resource-based transfers) in 2005 and the general allocation fund (DAU) in 2006 (Figure 2-8). The accumulation of deposits by regions implies that regions have not yet figured out how to spend their resources, much less spend them well.
Figure 2-8: Accumulating Deposits by Regions(deposit outstanding by regions, trillion)
0
10
20
30
40
50
60
70
80
Jan
Feb
Mar
A
pr
May
Ju
n Ju
l A
ug
Sep
Oct
N
ov
Dec
Ja
n Fe
b M
ar
Apr
M
ay
Jun
Jul
Aug
Se
p O
ct
Nov
D
ec
Jan
Feb
Mar
A
pr
May
Ju
n Ju
l A
ug
Sep
Oct
N
ov
Dec
Ja
nFe
bM
ar
2003 2003 2004 2005 2006
Kabupaten/Kota
Province
Source: CEIC, World Bank
Under-spending by regions is likely to have negative consequence for economic growth. If the total surplus of regional governments indeed rises to Rp.70 trillion, regions will be holding reserves equivalent to about 10 percent of government spending. One of the constraints on regional expenditures is the slow pace of decentralization reforms. The slow pace of decentralization reforms is a rising concern. With large resources to spend and most service delivery functions at the local level, Indonesia cannot afford to leave its decentralization structure in limbo. The longer fundamental reforms remain unaddressed the more difficult it will be to scale back vested interests. The most important pending decentralization reforms include the following: • Removing ambiguities and improving expenditure assignments: Despite an
attempt to address the legal ambiguities around expenditure assignments in law 32/2004, it is still not clear who is in charge of key public services, and central government departments continue to spend more than 50 percent of their development budgets in the regions on infrastructure services that are the responsibility of provinces and
19

kabupaten/kota. Moreover a clause in the draft regulation on expenditure assignment turns over further responsibility for detailing service responsibilities to central departments themselves. This raises concerns about more centralized control of local public service delivery. At the least duplicated efforts, wasted resources, and confusion will likely continue to prevail at local levels.
• Transferring authority for property taxes to the regions: Unlike most decentralized
countries, Indonesia has not transferred significant tax power to local governments. The pending amendment to Law 34/2000 on Regional Taxation is again unlikely to provide additional authority over typically local tax bases (e.g. property taxes) to sub-national governments. As such, the one-sided nature of decentralization is set to continue.
• Reforming on-lending and on-granting regulations and transitioning to market-
oriented system of sub-national credit: Local and provincial governments have a key role in public investment particularly in the infrastructure sector. However, borrowing for infrastructure and other projects is underutilized. By 2004, provincial, kabupaten/kota and local water enterprise (PDAM) outstanding debt was just 0.18 percent of GDP. The Government needs to finalize draft revisions to on-lending and on-granting decrees to facilitate immediate support for local infrastructure finance and service delivery. After that the Government should begin to establish a regulatory framework for the development of more market-based system of sub-national credit including the issuance of regional bonds (based on Law 33/2004).
• Improving sub-national fiscal and financial reporting: Despite the increased
responsibility of sub-national governments, Indonesia does not yet have a sound system of sub-national fiscal and financial reporting to facilitate the systematic monitoring and evaluation of local government performance. In most middle-income and high-income countries the financial performance of local governments is measured by rating agencies and performance measurement mechanisms create competitive and political pressures. An improved system of reporting that reliably captures the performance of all 440 local governments and 33 provinces would represent a first step in the development of a comprehensive system to monitor local fiscal and financial outcomes, with a view to eventually establishing a firm basis to allocate resources according to performance.
2.4 Efficient Public Financial Management Indonesia has made major advances in establishing a sound legal framework to manage its public finances and improve transparency. The enactment of the State Finance Law (No. 17/2003), the Treasury Law (No.1/2004) and the State Audit Law (No. 15/2004) were significant steps in bringing Indonesia in line with good international practice. The Ministry of Finance has undergone a major reorganization to better execute its function. Several of these laws are now seeing implementation, most notably in making the national budget compatible with the international standard GFS-classification and by establishing a Treasury Single Account (TSA) (in pilot). These reforms can make an important contribution to increasing transparency, improving public procurement and reducing corruption in Indonesia’s public financial management.
20

However, key indicators of government budget performance have not improved, most importantly the pattern of disbursement. Public investment from the central government (i.e. development expenditures) was consistently lower than its latest estimates (Figure 2-9). In addition, Indonesia still spends 50 percent of its capital expenditures in the last quarter of the year. For the last five years, spending always starts very slowly and then accelerates (Figure 2-10). This unhealthy pattern raises concern. Economic activity is disrupted by an unnatural cycle, project implementation starts late or, as in the case of multi-year projects, is interrupted at the beginning of each year. In 2005, the back-loading of government capital spending was even more pronounced and progress in 2006 while better is disappointing. As of end-October 2005, the government only spent 68 percent of capital and 72 percent of material budgeted expenditures. As in previous years, the last two months saw a rapid acceleration in spending. The back-loading of capital spending was even more extreme: 54 percent of total 2005 capital spending was carried out in December alone. Spending in the first 4 months of 2006 has seen an improvement but remains disappointing. Only 10 percent of the capital expenditures have been spent, compared to 9 percent in previous years.
Figure 2-9: Comparison between Projected and Actual Public Investment
(development expenditures, % GDP)
1.5%
2.0%
2.5%
3.0%
3.5%
4.0%
FY01 FY02 FY03 FY04 FY05 FY06
Realization
Revised budget
Source: MOF, World Bank
Figure 2-10: Monthly Disbursement Pattern of Development Expenditures
(% of annual total)
0
10
20
30
40
50
60
Jan Feb Mar Apr May Jun Jul Aug Sep Oct Nov Dec
2005
2001-04 average
% of total disbursement
Source: MOF, World Bank
Several extraordinary circumstances contributed to the slow implementation of the budget and even more pronounced back-loading of spending in 2005. Foremost amongst these has been the transition to new budget preparation and execution procedures, a reorganization of the MoF, a change in Government and the Aceh-Nias natural disaster. In particular the change in Government and Parliament led to delays. Spending authority (DIPA) that should have been available in January was only available in April. In addition the designation of signature authority for project managers (Satkers) and their staff managing the finances was also severely delayed. While familiarity should improve execution the underlying structural factors of slow budget execution and back-loading of government expenditures are yet to be addressed. Many of the recent reforms were well-intended and go in the right direction but the new system still constrains the speedy implementation of the budget.
21

• Simplifying budget documents. Indonesia’s budget provides excessive detail for each
spending unit and activity and demands multiple checks and balances before implementation. If the budget implementation document needs to be changed, a lengthy revision process will follow, even if the revisions are minor. These ex-post revisions are particularly problematic in rapidly changing post-disaster environments and contributed to the slow government disbursements to the Aceh and Nias reconstruction.
• Towards multi-year budgeting system. Each government project stops at the end of
each year and does not start up until all the sign-offs have been received again. A multi-year budgeting system would greatly improve this stop-and-go budget implementation. To address this, the government plans to implement by 2008 a Medium-Term Expenditure Framework (MTEF). An important first step would be an automatic carry-over between budget years of signing authorities for the existing project managers (satker).
• Balancing ex-ante and ex-post controls. The Indonesian budget system is still heavily
reliant on ex-ante controls and does not yet use ex-post control systematically. Given that Indonesia’s audit institutions have become more proactive this should be revisited. The effectiveness of ex-post controls is hampered by the lack of clarity in the responsibilities of BPK and BPKP.
****
22

Chapter 3: Investment Climate and Infrastructure
Key Messages:
• Reform momentum picked up in early 2006 with two major investment packages, one for infrastructure and one for investment policies. The packages contain many excellent initiatives, with highlights including a business friendly investment law, faster customs clearance procedures, risk guarantees for infrastructure projects, and anxiously awaited revisions to the tax laws. The likely challenge remains implementation and the Government is to be commended for establishing a strong external monitoring effort to assess implementation.
• Business perceptions about the Investment Climate improved significantly between 2003 and 2005. However, corruption – including in tax, customs and business licensing - continues to be a major impediment, with firms ranking corruption as the third most serious obstacle after macroeconomic instability and policy uncertainty.
• Despite a boom in commodity prices, investment in mining is stagnant calling for a new look at incentives in the sector. Reversing the collapse of mining investment will require a secure working environment for private mining companies, settlement of outstanding disputes, and a comprehensive policy approach coordinated at the cabinet level.
• The investment climate constraints facing micro and small enterprises are different from those facing larger firms. Improving investment for micro and small enterprises will require a focus on investments in rural infrastructure, improved access to commercial small business finance, simplified business licensing, and the removal of interregional trade barriers.
• Significant progress has been made toward the creation of a new framework for private investment in public infrastructure, including the recent announcement of risk guarantees for infrastructure projects. However, retail tariffs remain below costs and procedures for financial transfers from the center to local governments are inadequate, inhibiting further private investment in, and public expenditure on, infrastructure.
3.1 Introduction During early 2006 the government initiated a series of investment climate reforms aimed at improving the business environment, removing impediments to private participation in infrastructure investment, and accelerating economic growth. Among the most important of these were an investment climate policy package and an infrastructure policy package. The investment climate package covered five broad issues: investment procedures, taxation, customs, labor and SME finance. The infrastructure package was aimed at making further progress on public private partnerships for infrastructure investment, including a risk sharing framework (allowing contingent liabilities on the
23

budget), improved coordination mechanisms and progress on sectoral issues in anticipation of a second Infrastructure Summit. The packages were generally well received and contributed to increased business confidence in the new economic team. Improved perceptions of the government’s commitment to investment climate and infrastructure policy reform will reinforce the improving macroeconomic situation, contributing to a resumption of strong investment growth in the second half of 2006. However, implementation is the key to sustaining positive perceptions, particularly since there have been gaps between announcements and implementation in the past. 3.2 Recent Trends Investment grew rapidly in the first half of 2005, with investment rising by 15 percent from a year earlier and outpacing consumption as the main contributor to economic growth. However, during the second half of 2005 -- following a series of macroeconomic shocks that included a sharp currency depreciation, rising interest rates, higher inflation, and the doubling of domestic fuel prices -- investment growth dropped to just 6 percent. By the first quarter of 2006 investment growth had further slumped to 3 percent. Fortunately, by mid-2006 the macroeconomic situation was stabilizing, with falling inflation, declining interest rates, and a recovery of the exchange rate, suggesting better prospects for investment in 2006. Capital goods imports have remained strong supporting an optimistic assessment of investment trends. Following negative growth of capital goods imports from 2001 to 2003, imports of capital goods increased 46 percent in 2004 (from a very low base) and by an additional 23 percent in 2005. By 2005 Indonesia’s capital goods imports had almost recovered to the pre-crisis level. During the first four months of 2006 capital goods imports continued to rise, growing a strong 12 percent relative to the same period in the previous year. Foreign direct investment (FDI) also grew strongly in 2005, with balance of payments data showing an increase in FDI inflows from US$3,860 million in 2004 to US$6,922 million in 2005, an increase of 79 percent.1 Data from the Investment Board (BKPM) show similar strong growth, with realized foreign investment rising from US$4,601 million in 2004 to US$8,915 million in 2005. However, the level of realized foreign investment reported by BKPM is much higher than FDI inflows reported by Bank Indonesia, suggesting some weaknesses in the available statistical series (see Box 3.1 below). Despite strong growth of foreign and domestic investment, at least during the first half of 2005, there was little indication that some of the weaknesses in Indonesia’s micro investment climate were being resolved. Businesses continued to face high costs due to corruption, a weak legal system, deteriorating infrastructure, poor tax and customs administration, rigid labor regulations, complex licensing and approval procedures, and a mushrooming of local “nuisance” taxes. While there was a good deal of planning and preparation for investment climate reform, few major changes were implemented in 2005. 1 FDI inflows are calculated from Bank Indonesia’s balance of payments statistics (old format) by excluding “debt repayments” which are included in the net FDI number.
24

Box 3.1. Reconciling different data sources for foreign direct investment (FDI) There are two main sources of FDI data in Indonesia: balance of payments data from Bank Indonesia and realized foreign investment data from the Investment Board (BKPM). These two sources sometimes show very different levels and contradictory trends, as can be seen in Figure 3.1. Between 2004 and 2005 both sources show a large increase in FDI, amounting to 79 percent in the BI data and 94 percent in the BKPM data. However, the BI data show total FDI inflows of US$6.9 billion in 2005,2 whereas BKPM data show realized foreign investment of US$8.9 billion during the same period. The fact that the FDI level reported by BKPM is larger than that reported by BI is puzzling, because BI data are more comprehensive, covering all types of FDI, whereas BKPM data exclude investment in mining, oil and gas, financial services, and investment through the capital market. The last factor was particularly important in 2005 due to the purchase of local cigarette company Sampoerna by Philip Morris – a transaction included in BI data but not in BKPM data. This purchase accounts for roughly US$2 billion of the total US$6.9 billion FDI inflow in the BI data for 2005. Differences in the way BI and BKPM compile investment statistics may explain this anomaly. BI collects data on FDI from multiple sources whereas BKPM uses a single source: the issuance of permanent business licenses (IUT) by BKPM. All investors approved by BKPM are required to obtain IUT licenses after they are in commercial operation. The IUT is normally issued only after a field check by regional staff to determine whether the investment has been carried out in accordance with the information on the original approval form. Because the field visit can be quite costly, many businesses in the past delayed applying for the IUT. In 2005 BKPM extended a holiday on field visits on the condition that investors submitted their backlog of investment activity reports (LKPM) and other information required for the IUT. An increase in IUT licenses in 2005 in response to this incentive may have boosted the BKPM investment realization data and could partially explain the large difference between BI and BKPM data on FDI.
Figure 3-1: Foreign Direct Investment(US$ million)
0
1,000
2,000
3,000
4,000
5,000
6,000
7,000
8,000
9,000
10,000
2000 2001 2002 2003 2004 2005
Bank Indonesia FDI inflows
BKPM realized foreign investment from permanent business licenses
Source: Bank Indonesia, BKPM
3.3 Investment Climate Policy Initiative in 2005 The weaknesses in the investment climate were clearly identified at the outset of Indonesia’s new government. In his inauguration speech President Yudhoyono stressed the importance of improving the investment climate, and the new government’s medium term plan (PJM) detailed the major constraints and proposed solutions. The Indonesian Chamber of Commerce provided a roadmap for improving the business environment, and the CGI working group on investment climate outlined five high priority policy areas, including: (i) taxation, (ii) customs clearance and tariff system, (iii) labor regulation, (iv)
2 See footnote 1 regarding the measurement of FDI inflows from balance of payments data.
25
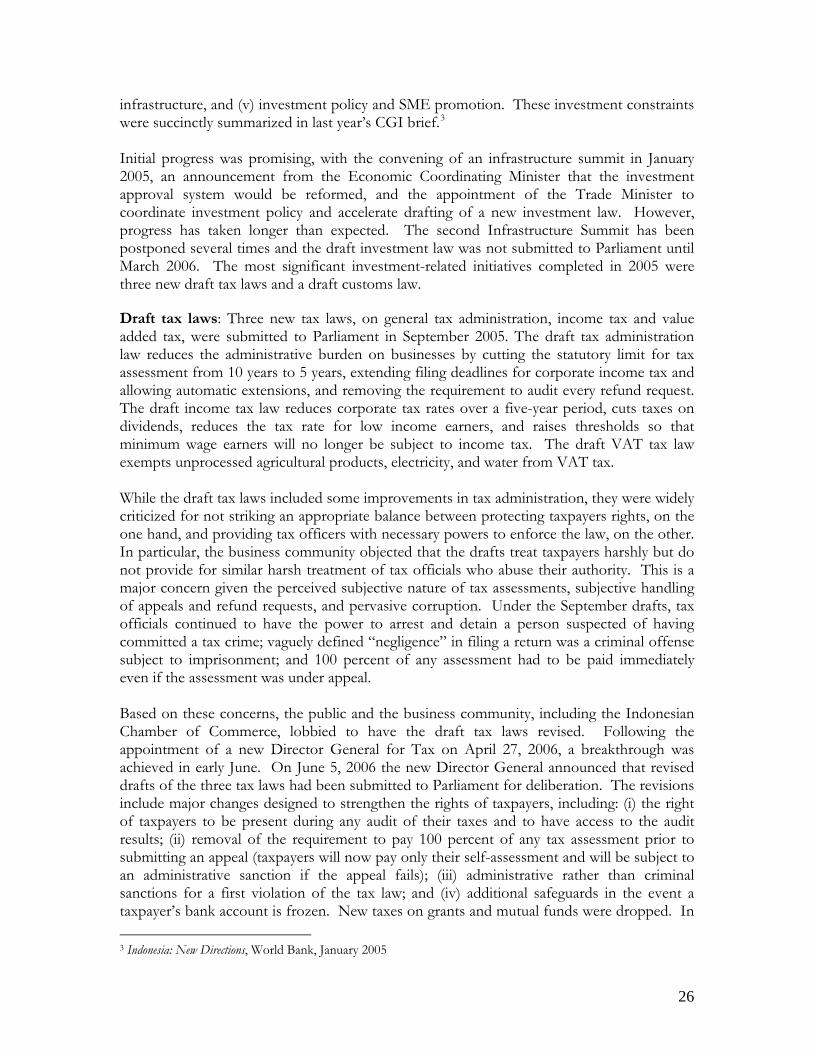
infrastructure, and (v) investment policy and SME promotion. These investment constraints were succinctly summarized in last year’s CGI brief.3
Initial progress was promising, with the convening of an infrastructure summit in January 2005, an announcement from the Economic Coordinating Minister that the investment approval system would be reformed, and the appointment of the Trade Minister to coordinate investment policy and accelerate drafting of a new investment law. However, progress has taken longer than expected. The second Infrastructure Summit has been postponed several times and the draft investment law was not submitted to Parliament until March 2006. The most significant investment-related initiatives completed in 2005 were three new draft tax laws and a draft customs law. Draft tax laws: Three new tax laws, on general tax administration, income tax and value added tax, were submitted to Parliament in September 2005. The draft tax administration law reduces the administrative burden on businesses by cutting the statutory limit for tax assessment from 10 years to 5 years, extending filing deadlines for corporate income tax and allowing automatic extensions, and removing the requirement to audit every refund request. The draft income tax law reduces corporate tax rates over a five-year period, cuts taxes on dividends, reduces the tax rate for low income earners, and raises thresholds so that minimum wage earners will no longer be subject to income tax. The draft VAT tax law exempts unprocessed agricultural products, electricity, and water from VAT tax. While the draft tax laws included some improvements in tax administration, they were widely criticized for not striking an appropriate balance between protecting taxpayers rights, on the one hand, and providing tax officers with necessary powers to enforce the law, on the other. In particular, the business community objected that the drafts treat taxpayers harshly but do not provide for similar harsh treatment of tax officials who abuse their authority. This is a major concern given the perceived subjective nature of tax assessments, subjective handling of appeals and refund requests, and pervasive corruption. Under the September drafts, tax officials continued to have the power to arrest and detain a person suspected of having committed a tax crime; vaguely defined “negligence” in filing a return was a criminal offense subject to imprisonment; and 100 percent of any assessment had to be paid immediately even if the assessment was under appeal. Based on these concerns, the public and the business community, including the Indonesian Chamber of Commerce, lobbied to have the draft tax laws revised. Following the appointment of a new Director General for Tax on April 27, 2006, a breakthrough was achieved in early June. On June 5, 2006 the new Director General announced that revised drafts of the three tax laws had been submitted to Parliament for deliberation. The revisions include major changes designed to strengthen the rights of taxpayers, including: (i) the right of taxpayers to be present during any audit of their taxes and to have access to the audit results; (ii) removal of the requirement to pay 100 percent of any tax assessment prior to submitting an appeal (taxpayers will now pay only their self-assessment and will be subject to an administrative sanction if the appeal fails); (iii) administrative rather than criminal sanctions for a first violation of the tax law; and (iv) additional safeguards in the event a taxpayer’s bank account is frozen. New taxes on grants and mutual funds were dropped. In 3 Indonesia: New Directions, World Bank, January 2005
26

addition, the revised drafts lower the income tax on companies from 30 percent to 28 percent with a further gradual reduction to 25 percent by 2010. Draft customs law. A new draft customs law was also submitted to Parliament in September 2005. The main objective of the new law is to combat smuggling, underinvoicing and customs fraud by creating harsh new penalties and fines, clarifying definitions, and increasing the powers of customs officials. However, the law does little to improve customs service for legitimate traders. More importantly, the draft customs law suffers from the same shortcoming as the draft tax laws (before the recent revision) – it fails to create an appropriate balance between the rights and obligations of importers and exporters and the powers of customs officials. Given the harsh new fines, penalties and prison sentences specified in the law, legitimate traders might be concerned about potential misuse of these provisions. These concerns could be partly allayed by specifying, with greater clarity and transparency, the process of making an objection; by creating narrower ranges between minimum and maximum fines; by stipulating that evidence is required in an audit and that the burden of proof of customs fraud is upon the DG Customs; and by reducing the record keeping obligation from 10 years to 7 years. Draft investment law. After a number of delays, a draft investment law was signed by the President and sent to Parliament on March 21, 2006. The draft (i) creates a unified national law covering both foreign and domestic investment; (ii) states the principle of equal treatment of all investors regardless of national origin; (iii) stipulates creation of a negative list that is clear, detailed and based on standard industrial classifications; (iv) reaffirms free repatriation of capital; (v) confirms the principle of no expropriation without compensation; (vi) removes the limited duration of investments; and (vii) abolishes the system of forced divestments. The law is general, providing increased flexibility and leaving important issues to implementing decrees. These implementing decrees, which will be issued as Presidential Regulations, are currently being drafted, but political commitment will be needed to overcome resistance to changes, such as the streamlining and simplification of investment procedures. In particular, the President’s promise to replace the current investment approval system with a simpler registration system will need strong implementing decrees to succeed.4
3.4 Business Perceptions of the Investment Climate Surveys of businesses conducted in 2003 and December 2005 reveal that perceptions of Indonesia’s investment climate improved over this 2½ year period. However, businesses faced the same set of problems in both periods, with little change in the ranking of constraints.5 4 The President mentioned moving from an investment approval system to a simpler registration system in two speeches to international investors, first in Jakarta on 30 August 2005 and again in New York on 15 September 2005. This reform was first raised by the Coordinating Minister for Economy in January 2005. 5 In 2003 the Asian Development Bank and World Bank surveyed 713 manufacturing firms in 11 regions of Indonesia, of which 330 employed 100 or more workers. In December 2005 the University of Indonesia (LPEM-FEUI) surveyed 500 manufacturing firms with 100+ workers in five greater metropolitan areas -- Medan, Jabotabek, Semarang, Surabaya and Makassar. Both surveys asked identical questions about business constraints. Although the regional coverage of the ADB/WB survey was broader than the LPEM survey, one-half of manufacturing firms with 100+ workers in Indonesia are located in the five greater metropolitan areas.
27

• Major obstacles to doing business. Firms were asked to rank the severity of 22 business obstacles. The perceived severity of all obstacles except infrastructure declined between 2003 and end-2005, indicating an improvement in Indonesia’s investment climate (Figure 3.2). However, the ranking of obstacles changed very little. Macroeconomic instability, policy uncertainty, and corruption were ranked as the biggest obstacles in both periods. The next biggest obstacles (in December 2005) were weaknesses in the legal system, transportation, labor skills, tax administration, cost of financing, and labor regulation. Only a few obstacles experienced any significant change in ranking, including tax rates which dropped from 3rd place in 2003 to 11th place in 2005, weaknesses in the legal system which rose from 10th to 5th place, and transportation which rose from 20th to 6th place.6
Figure 3-2: Constraints to Investment (% of firms reporting constraint to be moderate, severe or
very severe) 0% 10% 20% 30% 40% 50% 60% 70% 80%
Macroeconomic InstabilityEconomic Policy Uncertainty
Local CorruptionNational Corruption
Legal System and Conflict ResolutionTransport
Tax AdministrationLabor Skill and Education
Cost of FinancingTax Rate
Labor Regulation-RegionalCustoms&Trade Regulation-RegionalCustoms&Trade Regulation-National
Licensing and Permits-RegionalElectricity
Labor Regulation-NationalLicensing and Permits-National
Monopoly PracticesCrime
Access to FinancingTelecommunication
Access to Land
2005
2003
• Corruption and harassment. Eighty-nine percent of respondents (Dec 2005) report that it is necessary for businesses to make unofficial payments to government officials to get things done. The cost of such payments averaged 1.9 percent of production costs. Firms reported that they were visited 15 times on average by local and national authorities during the six months prior to the survey, with the police and military being the most frequent visitors, and with most official visitors expecting a gift. Reducing the opportunities for corruption through a major program of administrative simplification – including the elimination of unnecessary business regulations and licenses, and the replacement of face-to-face meetings with electronic online application and approval systems – might be the most effective way to reduce this burden on business activity.
• Tax administration: Of firms who requested VAT refunds, 57 percent reported that it is necessary to make unofficial payments to tax officials to obtain refunds and the amount refunded averaged only 84 percent of the claim (December 2005 survey). The average time to process a VAT refund increased from 5.2 months in the April 2005 survey to 6.1 months in the December 2005 survey. Businesses report that they must file 7 different tax returns every month and they devote on average 41 man-days per month to tax filing. A separate survey conducted by the World Bank found that Indonesian firms make 52 separate tax payments per year; only the Philippines requires more frequent payments among regional economies.7 The prevalence of corruption and inefficiency in tax administration partly explains the strong opposition of the business
6 The increase in the perceived severity of transportation as an obstacle might reflect the doubling of fuel prices immediately prior to the survey, or growing road congestion and lack of investment in transportation in recent years. 7 World Bank, Doing Business in 2006.
28

community to articles in the draft tax laws that enhanced the powers of tax officials without a corresponding enhancement of the rights of taxpayers.
• Customs administration. Of firms who had dealings with Customs, 84 percent reported that it is necessary to make unofficial payments to clear import shipments, with payments reported to average one percent of import value, one-half of which went to customs officials and the remainder to other authorities involved in the import clearance process (port authority, port administration, quarantine, etc). Importers report that it took 7.5 days on average to clear import shipments through the Red Lane, counting from the time the boat docked to the time the goods exited the port, and 6.2 days to clear shipments through the Green Lane. A study conducted by JICA in mid-2004 found that average import clearance time was 7.9 days in the Red Lane and 6.5 days in the Green Lane, indicating little improvement over the past two years. Import clearance time in Japan is 3 days and in Singapore 1 day.
• Labor regulations. Forty percent of firms reported that labor regulations are a moderate to severe obstacle and 31 percent reported that labor regulations reduce the competitiveness of their products on domestic or international markets.8 The two biggest constraints were considered to be severance pay regulations and lay-off procedures, cited by 21-23 percent of respondents as severe or very severe obstacles. Requirements to hire workers from the surrounding community and minimum wages were also cited as severe or very severe obstacles by around 12 percent of respondents.
• Licensing and permits. Between 36 percent and 39 percent of firms found licensing and permits to be moderate to severe obstacles for their business. Given that the survey covered only established businesses rather than new or potential investors, it is not surprising that licensing and permits ranked lower than some other obstacles. For potential investors, the time and cost to obtain approval from the Investment Board, legalize a company and obtain business licenses from central ministries and local governments, is a major barrier to new investment (see Box 3.2 in p.31).
In sum, it seems clear that macroeconomic instability and policy uncertainty still weigh heavily on business perceptions of the investment climate. However, corruption, weaknesses in the legal system, tax and customs administration, deteriorating infrastructure, complex and costly investment approval and business licensing systems, and labor regulation, also pose significant obstacles for business activity. 3.5 The Investment Climate Policy Package The Government announced a major new policy package to improve the investment climate in early March 2006 (Inpres 3/2006).9 The package has time bound targets and assigns a minister to be responsible for each target. It is divided into five categories: (i) general investment policies, (ii) customs, (iii) tax, (iv) labor policy, and (v) SME policy.
8 Only 24 percent of survey respondents stated that labor regulations are not a problem; 36 percent stated that labor regulations are a minor problem. 9 The investment climate policy package is dated February 27, 2006 but was announced on March 2, 2006.
29

These categories are roughly similar to the key policy areas outlined in the CGI working group brief on investment in October 2004.10
Some of the highlights of the package include: Submit the draft investment law to Parliament, and reach a decision on the status of the
draft tax laws submitted last year, by the end of March 2006. Stipulate a new investment negative list based on clear, simple and transparent criteria. Issue a Keppres to revitalize the national export and investment team (PEPI) by the end
of March 2006. Cut the time to start a business from 150 days to 30 days and simplify 9 business
licenses. Activate a team at the Ministry of Finance to accelerate the review process for thousands
of non-business friendly local regulations (Perda). Issue a decree by November on environmental permits (Amdal) making it clear what type
of business requires an Amdal. Reduce the percentage of import shipments sent through the Red Lane (physical
inspection) to 20 percent by June, 15 percent by September and 10 percent by end-December 2006.
Increase the number of priority lane companies from 71 to 130 by the end of the year. Submit revisions to the Labor Protection Law (Law 13/2003) by April 2006. Cut the number of visas and work permits required of foreign workers from 6 to 2.
Most of the reform items in the package are not new, having existed in one form or another in previous policy statements. Many of the items are also quite general, stating only what the government hopes to accomplish but not how it will be accomplished. For example, “shortening the time for cargo handling” and “designing an investment credit scheme for SMEs” are both praiseworthy outputs but there is little indication of how these outputs will be achieved. However, some of the reforms are specific, such as cutting the red lane to 10 percent and compiling a transparent negative list, and most targets include deadlines to ensure rapid implementation and specify the responsible minister. Meeting these targets will be challenging and will require high level coordination. For example, cutting business start up time from 150 days to 30 days will require changes in numerous licensing and approval procedures involving different ministries, agencies and local governments (Box 3.2). Issuing the necessary implementing regulations for the new investment law will require making tough decisions about the role of the Investment Board, procedures for FDI, and business sectors that will remain closed or restricted to foreign investors (the “negative list”). Determining revisions to the labor law will involve complex negotiations between the Government, labor unions and business representatives. Finalizing the draft tax, customs and investment laws will involve consultations with Parliament, the business community and other stakeholders. Because of the broad nature of the required reforms, no single ministry, or even a single coordinating ministry, can resolve investment climate problems. Coordination will have to be at a level above the coordinating ministries.
10 Creating Jobs Through Investment, CGI Working Group on Investment, October 2004.
30

Box 3.2 Reducing Business Start Up Time From 150 to 30 Days
Phase 2:CompanyFormation
(Legalization andRegistration)
through notaries,Ministry of Law &Ministry of Trade
11 weeks
Phase 3:Business Licenses(from line ministriesand local
governments)6 – 27 weeks
or more
Phase 1:Initial Approval
from theInvestment
Board(BKPM)
“approval in principle”7 weeks
Three Phases to Start a Business
The March 2006 investment climate policy package calls for reducing the time to start a business from 150 to 30 days. This will be a challenging task. Establishing a company in Indonesia currently requires investors to go through three distinct sets of procedures, each involving numerous sub-steps. These include: (i) obtaining initial approval from the Investment Board; (ii) creating a limited liability company through the Department of Justice which requires at least ten different procedures involving notaries, banks, the tax department, local government offices, and the Minister of Justice; and (iii) obtaining numerous licenses and registrations from line ministries and local governments. Ordinary manufacturing firms, for example, require at least eight standard licenses issued by different local government offices, plus numerous specialty permits. As of mid-2005, the first phase took about 7 weeks, the second phase 11 weeks and the third phase 6-27 weeks (or more) depending on the location and type of business.11 Cutting total start-up time to 30 days will require major changes in each phase. The first phase could be eliminated by moving from an approval to a registration system. The second phase could be streamlined by setting a shorter deadline for legalization of a company’s deed of establishment, eliminating unnecessary requirements such as the letter of domicile, creating an on-line public access corporate registry in place of the State Gazette publication requirement, and bringing Indonesia in line with practice in most other countries by eliminating minimum capital requirements. Streamlining licensing (Phase 3) might be the most difficult change because most business licenses are now issued by local governments that follow their own rules, create their own standards and criteria, and have wide autonomy under decentralization. (It is anticipated that the licensing powers of local governments will be somewhat restricted under the proposed revisions to Law 34/2000).
Recognizing the importance of implementation, the government established an internal monitoring team to provide monthly progress reports for Inpres 3/2006. In its May 8, 2006 press report, the team noted that out of twenty-six items scheduled for completion by the end of April, twenty-three had been completed and three were in the process of finalization. Among important measures completed in March and April were: submission of the draft investment law to Parliament (March 21, 2006); revitalization of the national export and investment team (March 16, 2006); simplification of eight business licenses under the Ministry of Trade including the important Trade Business License or SIUP (March 29, 2006); delegation of the authority to legalize limited liability companies to provincial offices of the Ministry of Justice (March 24, 2006); establishment of a team to review non-business friendly local regulations (March 29, 2006); and simplification of procedures for granting visas and residence permits to foreign investors and expatriate employees (March 29, 2006). This demonstration of the government’s commitment to implement the new investment package has had a significant positive impact on Indonesia’s investment climate. However, closer scrutiny of certain reforms, such as the delegation of authority for legalizing limited liability companies to provincial offices of the Ministry of
11 See Institute for Economic and Social Research (LPEM-FEUI), Monitoring the Investment Climate in Indonesia: A Report from the Mid-2005 Survey, August 2005.
31

Justice, may lead to disappointment as some changes are quite marginal.12 Moreover, there is a tendency for the bureaucracy to measure implementation in terms of the number of official decrees issued rather than in terms of meaningful change at the interface between officials and businesses. For example, only one minor measure has been enacted to meet the goal of cutting business start up time from 150 to 30 days and there is no overall plan to reach this target. A strong external monitoring effort that is willing to ask tough questions, both about implementation and about the significance of individual measures in relation to the stated broader objectives of the package, may be the only way to ensure that the bureaucracy does not sidetrack the government’s serious commitment to investment climate reform. Revisions to Labor Law No. 13/2003 were an important component of Inpres 3/2006 and were targeted for submission in April 2006. However, following a strong negative reaction from organized labor to the proposed changes, the April target in the investment package could not be met. The uncertain outlook for revision of the labor law is unfortunate as this is an issue of longstanding concern to investors. Several regulations introduced in the 2003 law significantly raised hiring costs. For example, severance pay rates are now far higher than in other regional economies (Figure 3-3). This has discouraged employers from hiring new workers on a permanent basis. The changes would address this bias against employment (especially among youths) and bring employment regulations into line with neighboring countries such as Thailand and Malaysia (Table 3-1). The revisions include the following:
Figure 3-3: Severance Rates for Employee with 4 Years Service Dismissed for Economic Reasons
(No. of monthly wages)
0
1
2
3
4
5
6
7
8
9
10
India Japan Korea Malaysia China Bangldsh Philippns Thailand Indonesia
Source: UNPAD/GIAT (2004), p.18
• Fixed-term contracts (FTCs) are currently limited to certain temporary (e.g., seasonal) jobs, and workers can be employed up to three years on FTCs before entering a permanent contract. The proposed revisions would allow employers to use FTCs for all work activities. In addition, firms can hire workers on a FTC basis for up to five years, before being obliged to transfer workers to a permanent status.
• Outsourcing can be applied to all types of work and production under the revised draft law and this is not limited to 'core-production' activities anymore as is the case under the current law. The outsourcing activity has to be specified under a written agreement between the enterprise and the contracted enterprise/labor supplier. Workers employed in the outsourcing activity have a working contract with the labor supplier. Thus any
12 The delegation of authority for legalizing limited liability companies to the 33 provincial offices of the Ministry of Justice (kanwil) has not yet been implemented, as Ministerial Decree No. M.837-KP.04.11 states that the procedures for implementation will be forthcoming in a separate Ministerial Decree. Moreover, this change is likely to delay the process of starting a business because the local offices do not have the capacity to administer the online registration system (SISMINBAKUM) and are likely to have weaker internal control systems to prevent face-to-face contact and corruption.
32

obligations concerning working conditions and dismissal procedures are transferred to the labor supplier.
Table 3-1: Comparison with Regional NeighborsCountry Restrictions on fixed term
contracts of direct hires Restrictions on indirect hires through manpower agencies
Indonesia Limited to temporary Limits on duration (max 3 years) Limits on extensions and renewals
Limited to non-core activities Limits on duration Limits on renewals
Japan No restrictions Limited to certain sectors Limits on duration (3 years) Limits on renewals)
Korea No restrictions Limited to certain sectors Limits on duration (2 years) Limits on renewals
Malaysia No restrictions No restrictions Philippines Limited to certain uses
Limits on duration No renewals
Must be direct hires
Thailand No restrictions Source:: Indonesian Labor Protection Law (2003); For Japan and Korea, OECD Employment Outlook Report (2004); for Thailand, Labor Protection Law (1998)
• Minimum wage regulations now state that the minimum wage should be set as a social safety net and no longer based on KHL (adequate living needs) criteria.
• Severance pay rates are the most contentious issue. These have been reduced to a maximum of 7 months (9 months under the current law). Long term service pay has also been reduced to a maximum of 6 months (10 months under the current law). If a worker is dismissed for economic reasons (e.g., bankruptcy of firm or – for reasons of efficiency as defined in the amended Law) - then the maximum total severance pay (severance plus long service pay) is set at 13 months (28 months under the current law in Table 3-2).
Table 3-2: Severance Pay rates under Current and Proposed Revised Law
Maximum* severance pay rate (in months of
pay)
Current law Proposed revision
Severance pay 9 7 Long service pay 10 6
Total 19 13 Dismissed due to economic
reasons (bankruptcy, efficiency, force majeur)
2 x severance pay plus long service pay
1 x severance pay plus long service pay
Total 28 13 */ Maximum severance pay rates means severance pay handed out to workers with more than 24 years of services Source: World Bank Staff
The proposed revisions would provide stronger incentives for employers to hire more workers, including on a permanent basis, as dismissal costs would be reduced. However, workers - primarily in the formal sector - are understandably concerned about the cut in severance pay, particularly as they cannot fall back on any system of unemployment insurance. A potential way for stakeholders to strike a balance between flexible labor regulations and social protection would be to increase social security contributions. But this
33

would require significant reforms to make social security institutions like Jamsostek more efficient and transparent in order to increase the compliance rates. 3.6 Investment Climate for Mining13
Despite a boom in commodity prices, investment in mining in Indonesia is stagnant and far below historical levels. Indonesia is one of the most natural-resource-rich countries in the world and has among the best potential of any country for further development of mining activity. In a 2004/2005 survey of 259 mining and exploration companies worldwide, Indonesia received a score of 97 (out of a maximum of 100) for mining potential and ranked 6th out of 64 regions; only certain provinces of Canada and Australia ranked higher.14 Yet despite this enormous potential, exploration investment in Indonesia’s mining sector has been almost non-existent in recent years. Greenfields exploration spending dropped to just US$7 million in 2004 from US$54 million pre-crisis, and total investment dropped by two-thirds (Figure 3.4). Although Indonesia ranked 6th in terms of global mining potential, it received less than 1.5 percent of worldwide mining exploration spending in 2004.
Figure 3-4: Total Mining Investment 1996-2004(US$ million)
0
500
1,000
1,500
2,000
1995 1996 1997 1998 1999 2000 2001 2002 2003 2004
Exploration
Total Investment
Source: Complied from various sources by PWC, Review of Trends in the Indonesian Mining Industry, December 2005
The decline in mining investment reflects the weakness of the investment climate. This is partly a result of political instability and security problems in the aftermath of the 1997/98 Asian economic crisis, but mainly reflects an unfavorable policy environment. The policy problems include: (i) a tug-of-war between local governments and the center over who controls mining activity, (ii) unclear and changing environmental rules which are interpreted differently by different ministries, (iii) a mining fiscal regime that is no longer competitive,15 (iv) a draft mining law that abolishes the Contract of Work (CoW) system for new projects, (v) an unclear legal environment that causes uncertainty in the administration, interpretation and enforcement of existing regulations, and (vi) arbitrary application of rules for divestment and mine closure.
13 The section draws on the World Bank policy brief Attracting New Mining Investment in Indonesia, January 2005, and on two recent reports from PricewaterhouseCoopers: Review of Trends in the Indonesian Mining Industry (December 2005), and Oil and Gas Investment in Indonesia (September 2005). 14 PricewaterhouseCoopers: Review of Trends in the Indonesian Mining Industry (December 2005) 15 The fiscal regime has deteriorated for three main reasons. First, the level of production contribution (also called “royalty”) now averages about 4 percent which is about double the level under the 7th CoW. Second, coal, gold and silver are no longer zero-rated for VAT, which raises production costs. Third, district and provincial taxes, levies and fees have increased. See World Bank, Attracting New Mining Investment, January 2005.
34
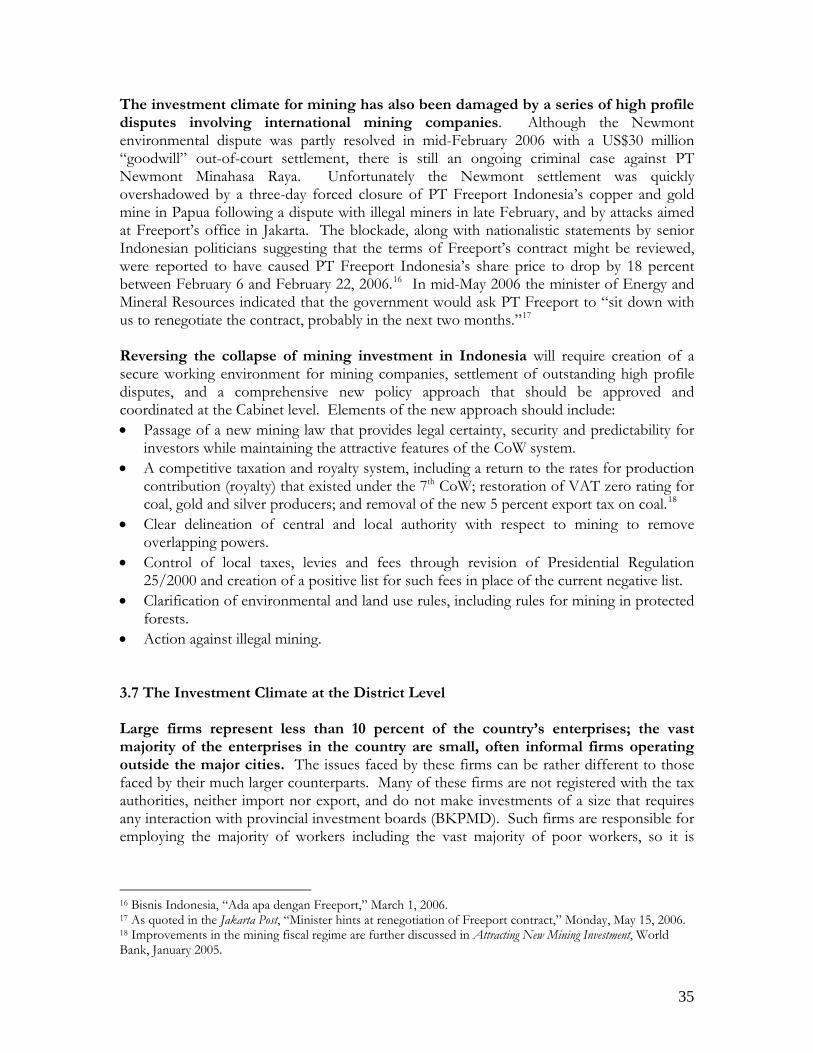
The investment climate for mining has also been damaged by a series of high profile disputes involving international mining companies. Although the Newmont environmental dispute was partly resolved in mid-February 2006 with a US$30 million “goodwill” out-of-court settlement, there is still an ongoing criminal case against PT Newmont Minahasa Raya. Unfortunately the Newmont settlement was quickly overshadowed by a three-day forced closure of PT Freeport Indonesia’s copper and gold mine in Papua following a dispute with illegal miners in late February, and by attacks aimed at Freeport’s office in Jakarta. The blockade, along with nationalistic statements by senior Indonesian politicians suggesting that the terms of Freeport’s contract might be reviewed, were reported to have caused PT Freeport Indonesia’s share price to drop by 18 percent between February 6 and February 22, 2006.16 In mid-May 2006 the minister of Energy and Mineral Resources indicated that the government would ask PT Freeport to “sit down with us to renegotiate the contract, probably in the next two months.”17
Reversing the collapse of mining investment in Indonesia will require creation of a secure working environment for mining companies, settlement of outstanding high profile disputes, and a comprehensive new policy approach that should be approved and coordinated at the Cabinet level. Elements of the new approach should include: • Passage of a new mining law that provides legal certainty, security and predictability for
investors while maintaining the attractive features of the CoW system. • A competitive taxation and royalty system, including a return to the rates for production
contribution (royalty) that existed under the 7th CoW; restoration of VAT zero rating for coal, gold and silver producers; and removal of the new 5 percent export tax on coal.18
• Clear delineation of central and local authority with respect to mining to remove overlapping powers.
• Control of local taxes, levies and fees through revision of Presidential Regulation 25/2000 and creation of a positive list for such fees in place of the current negative list.
• Clarification of environmental and land use rules, including rules for mining in protected forests.
• Action against illegal mining. 3.7 The Investment Climate at the District Level Large firms represent less than 10 percent of the country’s enterprises; the vast majority of the enterprises in the country are small, often informal firms operating outside the major cities. The issues faced by these firms can be rather different to those faced by their much larger counterparts. Many of these firms are not registered with the tax authorities, neither import nor export, and do not make investments of a size that requires any interaction with provincial investment boards (BKPMD). Such firms are responsible for employing the majority of workers including the vast majority of poor workers, so it is
16 Bisnis Indonesia, “Ada apa dengan Freeport,” March 1, 2006. 17 As quoted in the Jakarta Post, “Minister hints at renegotiation of Freeport contract,” Monday, May 15, 2006. 18 Improvements in the mining fiscal regime are further discussed in Attracting New Mining Investment, World Bank, January 2005.
35

important that policy also considers how best to improve the investment climate for smaller firms at the district level. A forthcoming study on the Kabupaten Investment Climate points to five areas in which action is needed (World Bank, forthcoming)19:
Kabupaten roads are in terrible condition – much worse than provincial or national level roads. In 2002 only 50 percent of the Kabupaten road network was rated as being in a sound, maintainable condition, and only 19 percent was rated as being in good condition. While central funding has been adequate for keeping the national/arterial network in satisfactory and sustainable condition, there is a large backlog of preservation and upgrading needs on the provincial road network and a very large backlog on the kabupaten network. But lack of money is not the reason for the poor quality of local roads, as local governments are in fact running substantial surpluses. Stronger community input on spending priorities, better road planning tools, and improved institutional incentives for higher maintenance expenditures, will be needed to overcome these problems.
There remains a large untapped market for credit to small businesses – the growth of innovative new small business credit providers such as Danamon Simpan Pinjam (DSP) shows that there is a large untapped market for small business credit. DSP’s own research claimed that of the 19.5 million micro and small businesses in Indonesia, 94 percent needed loans, but only 36 percent had borrowed from commercial banks, and 5 percent had borrowed from a BPR. The Rural Investment Climate Assessment (World Bank, forthcoming) also suggests that there is enormous potential from profitably expanding credit to micro and small enterprises. But information constraints (such as high upfront costs of identifying potential borrowers), the lack of suitable rural savings instruments, and the BPD quasi-monopoly on lending to civil servants, tend to constrain lending to small businesses. Developing a P4K20-style outreach program to finance the household enterprises of rural low-income households could help to connect new micro-borrowers to the financial system.
District level formal and informal labor regulations are harming local employment growth. Several districts are now using their decentralized powers to issue Perda relating to local labor regulations. For example in Kabupaten Serang in Banten Perda No.13/2003 theoretically obliges enterprises to provide after-work accident insurance for workers and workplace facilities, such as canteens, praying and sports facilities. If strictly applied such laws can be a significant burden on local businesses. Similarly, firms face a range of informal labor practices including pressure from local communities to hire local workers regardless of whether they are appropriately qualified. Data from the Rural Investment Climate Survey suggest that micro and small firms regard this as a big problem. Firms also report having to make payments to both local officials and preman to “solve” such problems, whilst workers
19 World Bank (forthcoming), “Revitalizing the Rural Economy: an assessment of the Rural Investment Climate in Indonesia”, World Bank Office Jakarta. 20 Pembinaan Peningkatan Pendapatan Petani Nelayan – a successful credit program run by Ministry of Agriculture and BRI.
36

sometimes have to make large payments to local “labor agents” to obtain employment in local factories.
The local administration of business licensing is a major hassle for many businesses – but some Kabupatens have shown that it can be dramatically improved. The costs, delay and inconvenience of business licensing is one of the most commonly mentioned criticisms of the local investment climate. But the 10,000 or so new or revised taxes and charges since decentralization generate less than 7 percent of local government revenue and in 10 percent of local governments the cost of administering these taxes is greater than the revenue collected. But some local governments have shown the way forward. For example, Kabupaten Solok’s Satu Pintu Plus has dramatically reduced both the time and cost required for issuing 25 different types of business licenses and civil certifications. The reason for its success appears not to be merely setting up a One Stop Shop – there are numerous examples of inefficient and corrupt One Stop Shops – but rather strong government leadership demanding transparency and continuous improvement in service quality.
The movement of goods within Indonesia is still not free. Although illegal, restrictions in the movement of goods across Kabupaten and Provincial borders still exist and impose additional costs and delay to the distribution of goods. For example, one study found that a truck transporting 8 tons of oranges from Karo to Jakarta had to pay Rp.159,500 in legal levies at 28 different collection and a further Rp.31,000 in illegal levies at a further 17 collection points (Siringoringo et al, 2004). Many of the newly introduced taxes and retribusi restrict or tax trade within or between kabupaten and provinces as these charges are easy to implement. These taxes and restrictions interfere in domestic trade and undermine internal market efficiency.
3.8 Infrastructure The government has made infrastructure a major economic priority. Soon after taking office in November 2004, one of the first acts of the new President was to attend the Infrastructure Summit in January 2005. The Coordinating Ministry for Economic Affairs has recently (Feb 2006) announced an Infrastructure Policy Package outlining more than 150 policy reform items that will be addressed by end-2006. The Ministry of Finance has aggressively supported the infrastructure agenda, with the establishment of a risk management unit and the framework for the creation of a guarantee fund to provide public support for private investment in infrastructure.
37
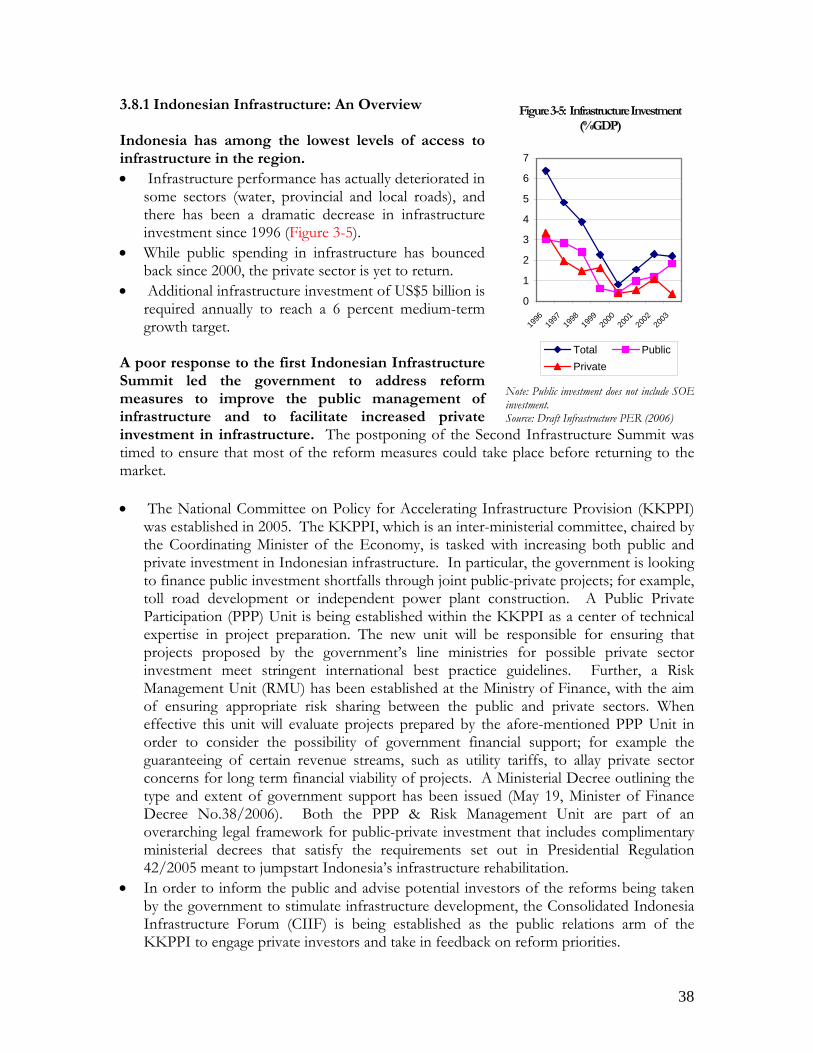
3.8.1 Indonesian Infrastructure: An Overview Figure 3-5: Infrastructure Investment (%GDP)
Indonesia has among the lowest levels of access to infrastructure in the region. • Infrastructure performance has actually deteriorated in
some sectors (water, provincial and local roads), and there has been a dramatic decrease in infrastructure investment since 1996 (Figure 3-5).
• While public spending in infrastructure has bounced back since 2000, the private sector is yet to return.
• Additional infrastructure investment of US$5 billion is required annually to reach a 6 percent medium-term growth target.
A poor response to the first Indonesian Infrastructure Summit led the government to address reform measures to improve the public management of infrastructure and to facilitate increased private investment in infrastructure. The postponing of the Second Infrastructure Summit was timed to ensure that most of the reform measures could take place before returning to the market.
0
1
2
3
4
5
6
7
1996
1997
1998
1999
2000
2001
2002
2003
Total PublicPrivate
Note: Public investment does not include SOE investment. Source: Draft Infrastructure PER (2006)
• The National Committee on Policy for Accelerating Infrastructure Provision (KKPPI)
was established in 2005. The KKPPI, which is an inter-ministerial committee, chaired by the Coordinating Minister of the Economy, is tasked with increasing both public and private investment in Indonesian infrastructure. In particular, the government is looking to finance public investment shortfalls through joint public-private projects; for example, toll road development or independent power plant construction. A Public Private Participation (PPP) Unit is being established within the KKPPI as a center of technical expertise in project preparation. The new unit will be responsible for ensuring that projects proposed by the government’s line ministries for possible private sector investment meet stringent international best practice guidelines. Further, a Risk Management Unit (RMU) has been established at the Ministry of Finance, with the aim of ensuring appropriate risk sharing between the public and private sectors. When effective this unit will evaluate projects prepared by the afore-mentioned PPP Unit in order to consider the possibility of government financial support; for example the guaranteeing of certain revenue streams, such as utility tariffs, to allay private sector concerns for long term financial viability of projects. A Ministerial Decree outlining the type and extent of government support has been issued (May 19, Minister of Finance Decree No.38/2006). Both the PPP & Risk Management Unit are part of an overarching legal framework for public-private investment that includes complimentary ministerial decrees that satisfy the requirements set out in Presidential Regulation 42/2005 meant to jumpstart Indonesia’s infrastructure rehabilitation.
• In order to inform the public and advise potential investors of the reforms being taken by the government to stimulate infrastructure development, the Consolidated Indonesia Infrastructure Forum (CIIF) is being established as the public relations arm of the KKPPI to engage private investors and take in feedback on reform priorities.
38
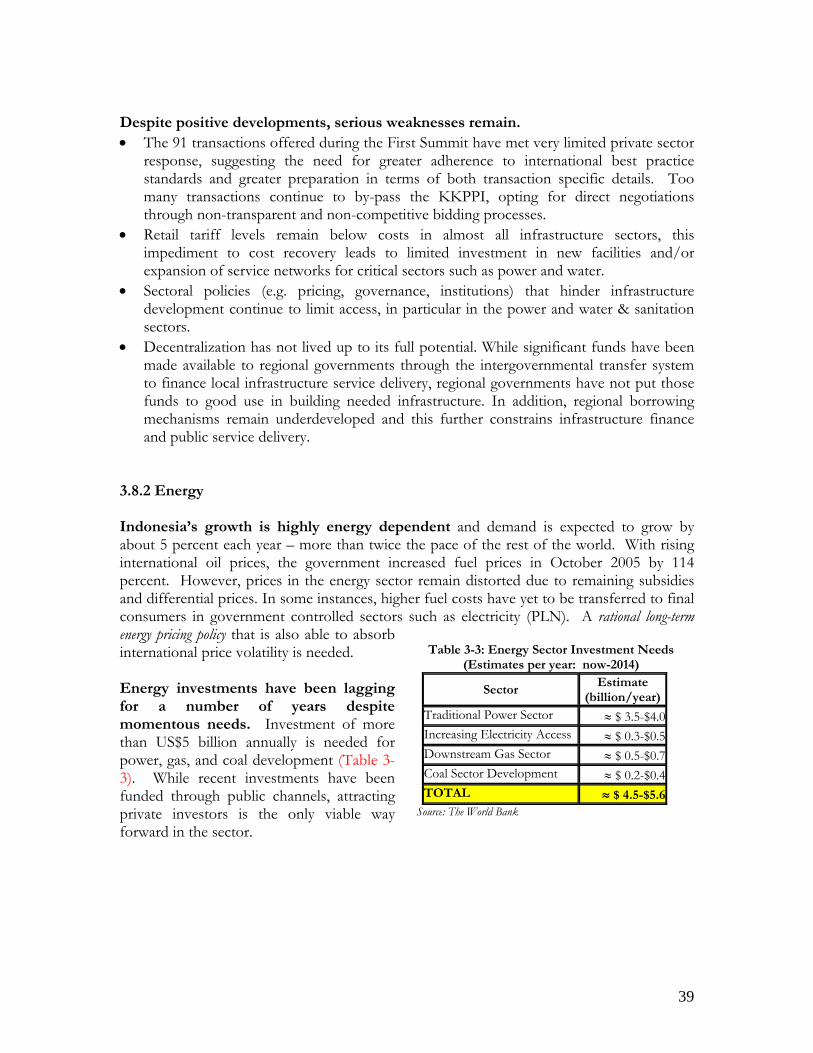
Despite positive developments, serious weaknesses remain. • The 91 transactions offered during the First Summit have met very limited private sector
response, suggesting the need for greater adherence to international best practice standards and greater preparation in terms of both transaction specific details. Too many transactions continue to by-pass the KKPPI, opting for direct negotiations through non-transparent and non-competitive bidding processes.
• Retail tariff levels remain below costs in almost all infrastructure sectors, this impediment to cost recovery leads to limited investment in new facilities and/or expansion of service networks for critical sectors such as power and water.
• Sectoral policies (e.g. pricing, governance, institutions) that hinder infrastructure development continue to limit access, in particular in the power and water & sanitation sectors.
• Decentralization has not lived up to its full potential. While significant funds have been made available to regional governments through the intergovernmental transfer system to finance local infrastructure service delivery, regional governments have not put those funds to good use in building needed infrastructure. In addition, regional borrowing mechanisms remain underdeveloped and this further constrains infrastructure finance and public service delivery.
3.8.2 Energy
Table 3-3: Energy Sector Investment Needs(Estimates per year: now-2014)
Sector Estimate
(billion/year)Traditional Power Sector ≈ $ 3.5-$4.0Increasing Electricity Access ≈ $ 0.3-$0.5Downstream Gas Sector ≈ $ 0.5-$0.7Coal Sector Development ≈ $ 0.2-$0.4TOTAL ≈ $ 4.5-$5.6
Source: The World Bank
Indonesia’s growth is highly energy dependent and demand is expected to grow by about 5 percent each year – more than twice the pace of the rest of the world. With rising international oil prices, the government increased fuel prices in October 2005 by 114 percent. However, prices in the energy sector remain distorted due to remaining subsidies and differential prices. In some instances, higher fuel costs have yet to be transferred to final consumers in government controlled sectors such as electricity (PLN). A rational long-term energy pricing policy that is also able to absorb international price volatility is needed.
Energy investments have been lagging for a number of years despite momentous needs. Investment of more than US$5 billion annually is needed for power, gas, and coal development (Table 3-3). While recent investments have been funded through public channels, attracting private investors is the only viable way forward in the sector.
39

Environmental concerns are high and growing (Table 3-4). Indonesia relies heavily on oil and is increasing its coal consumption (from 14 to 33 percent). With rapid addition of vehicles, environmental degradation is a growing issue in Indonesia. The Government’s plan to also diversify towards the use of natural gas (expected to increase to 31 percent) is more environmentally friendly, but key infrastructure investments in developing gas fields and pipelines are needed to ensure supply reliability. Policies to catalyze greater renewable energy production (planned from 5 to 10 percent), utilization of cleaner fossil fuels, and enhanced energy efficiency will also be vital to mitigate adverse environmental impacts. Access to electricity will remain illusive for the rural poor under present circumstances. Indonesia made significant strides in expanding electricity access - from less than 6 percent of the population to over 67 percent during the past three decades (Table 3-5). Despite these developments, Indonesia lags behind many of its neighbors. A staggering 70 million people do not have access to electricity, and this is regressive as over 80% live in rural areas where 3 out of 4 poor live. Since expanding in more remote areas is costly, PLN has little ability to recover these expenses; hence, new and innovative electrification schemes are needed. It is important to develop and mainstream a sound strategy for increasing electricity access, especially to poor rural areas. This strategy should include electrification options that take advantage of the recent decentralized governance structure in Indonesia, and address issues of cost-recovery and financing with properly prices services and well targeted public support to assist the poor.
Table 3-5: Regional Electrification RatesCountry 1994 2003 Singapore 100 100 Philippines 87 82 Vietnam 15 84 Indonesia 39 67
China 92 96 Thailand 87 95
Table 3-4: GHG Emissions
1971 (Mt CO2)
2003 (Mt
CO2)
Change since 1990
The World 13,958 23,579 18% Developing Countries 1,995 8,226 56% OECD Countries 9,378 12,446 13% China 809 3,307 45% India 199 1,016 71% Indonesia 25 303 119%SOURCE: IEA World Energy Outlook, 2004
3.8.3 Road Transport
Roads are the primary means of transportation in Indonesia. • Road quality. The national roads network (about 34,000 km) is in relatively good
condition (95 percent paved and 88 percent in good or fair condition in 2003); the provincial road network is also predominantly in good/fair condition (although 20 percent of its length is unsealed); the district and urban road networks are of much poorer quality and generally in poor/bad condition. The situation is worst in Eastern Indonesia.
• Road congestion. While conditions are good on the main heavily trafficked roads, 43 percent of the network on Java, and more in Jakarta, is currently congested with related high travel times and costs. Congestion is expected to increase to 55 percent of the network by 2010.
40

Financing of the road sector falls short of what is needed by about Rp.19 trillion a year. • Recent spending patterns reflect dependence on and vulnerability to public
budget. After substantial investments in upgrading/expanding through the 1980s-90s, expenditures have fallen since the 1997 crisis and are now almost exclusive dependent on public funds.
• Financing of a suitable network cannot be met by the public sector alone and requires a blend of users paying a larger share of road service costs and public-private financing of projects. The Ministry of Public Works (MoPW) is committed to private sector participation and wants to develop a freeway system (1,500km in new express roads). However, their track record is not promising. MoPW has a number of “abandoned” projects (with signed 1997 concession agreements), which are being revived with the ‘original’ consortia. These were not bid using transparent, competitive selection procedures, and it may be better to cancel and restart the process with new concession arrangements; this decision ultimately lies with the Ministry of Public Works and BPJT. To try to restore the interest and confidence of the private sector and attract serious international private sector bidders, MoPW has developed and a new “Draft Toll Road Model Concession Agreement” (November 2005). One of the key issues for the failure of the PPP project has been funding of land acquisition. Establishment of a “land fund” with clear governance structure is under development.
Corruption Road sector projects have had ongoing problems of corruption despite anti-corruption action plans (ACAP). The ACAP in the road sector in Indonesia are ahead of what the Bank has in other countries. Still, corruption remains a serious constraint. Corruption in the road sector is predominantly in the public procurement process. Despite the new law on procurement, there are still a number of implementation problems in MoPW, in spite of MoPW’s new willingness and commitment to address these issues.
3.8.4 Water Supply and Sanitation
Inadequate sector policies and allocation of responsibilities. Local governments have historically had significant responsibility over water and sanitation services. A particular problem since decentralization has been sector financing, especially for water. Many PDAMs are in arrears on past loans from the central government and are now prohibited from borrowing again for infrastructure development. Plans for restructuring, rescheduling, and/or writing off PDAM debt, which would allow renewed borrowing for infrastructure development, have been slow to evolve. In any case, the inadequacy of services and low coverage is of particular concern to national policy makers, who have pledged to reach the Millennium Development Goals (MDGs) of halving
Figure 3-6: Urban Access to Improved Water(2002, percent)
92
89
90
95
93 93
86
87
88
89
90
91
92
93
94
95
96
China Indonesia Philippines Thailand Vietnam EAPAverage
Source: World Development Indicators
41

the proportion of people without sustainable access to safe water and basic sanitation by the year 2015. Only 17 percent of Indonesians have access to piped water. Access to water supply in Indonesia is among the lowest in the region, and financing is insufficient. Investments in the water sector have sharply declined since the financial crisis, from an average of US$400 million in 1990s to under US$45 million in 2005. Government spending for the sector is about ten times lower than needed to achieve 2015 MDG targets. • The average water tariff for low-income households in Indonesia is less than 50 percent
of the lowest tariff in Vietnam, and far below those of other ASEAN countries.
Table 3-6: Water Tariffs in Indonesia and other ASEAN Countries, USD (2005) Country Lowest urban water tariff Breakeven tariff
Philippines 0.20 0.35 Malaysia /a 0.15 0.30 China 0.12 0.50 Cambodia 0.12 0.25 Vietnam 0.10 0.50 Indonesia 0.03 0.25
Source: World Bank (2005)
• There are over 315 public water utilities (PDAMs) operating in Indonesia - many are too small, with limited customers, low tariffs, weak management, and lack of access to finance for investments. The result has been unpaid debts, arrears accumulation, deferred maintenance, and deteriorating services. About 65 percent of PDAMs loans with the MOF are in arrears or in default, accounting for US$500 million in debt
• Currently, PDAMs are owned by local governments. Tariffs are set well below cost recovery levels by local governments and their parliaments; and often fees generated are not even enough to cover O&M costs.
• A key sector priority is tariff reform and debt restructuring of water utilities.
• A more market-based system of financing PDAM infrastructure, perhaps using non-public financial intermediaries and/or various forms of credit enhancements, needs to be developed.
• Impact of inadequate access is particularly adverse on the poor who suffer from a high incidence of water-borne diseases. Performance based subsidies (Output Based Aid) should be developed to target the poor and to increase efficient service provision.
Figure 3-7: Water Coverage by Utilities
49 5158
63
84 84
100 100
0
10
20
30
40
50
60
70
80
90
100
UlaanbaatarJakarta Manila Vientiane Ho ChiMinh City
PhnomPenh
Shanghai KualaLumpur
% of populaiton
Source: ADB (2004), Water in Asian Cities
42

Sanitation challenge. While access to improved sanitation (including on-site facilities) is estimated at 71 percent, actual sewerage coverage (estimated at 1.3 percent) is among the lowest is Asia. • Public awareness for sanitation and
environment, as well as public health and hygiene training should be launched with a strong focus on the responsibility of local governments to improve sanitation services, treatment and disposal, and to facilitate the development of sustainable service delivery.
• A range of new models exploring sanitation marketing, hygiene and communal solutions to meet the requirements of urban and peri-urban areas should be developed.
Figure 3-8: Urban Access to Improved Sanitation
69 71
81
97
84 85
0
20
40
60
80
100
120
China Indonesia Philippines Thailand Vietnam EAPAverage
Source: World Development Indicators
• Community-based sanitation system, piloted over recent years, provides an Indonesian model for urban sanitation that is feasible and affordable and can be developed alongside more conventional approaches and on-site sanitation.
****
43

44
Chapter 4: Indonesia’s Governance Agenda
Key Messages • The SBY administration has sparked genuine momentum in the fight against
corruption and governance indicators are starting to improve. A new institutional framework to investigate and prosecute corruption cases is fully up and running and already showing results
• There has been less progress in implementing a strategy of institutional and policy
reforms to prevent corruption and make sustainable improvements in governance • The critical bottleneck preventing a real breakthrough on governance remains civil
service and administrative reform. The Government is launching some promising openings in this area
• Legal and judicial reform is still progressing slowly. Implementing the Blueprints
represents the best opportunity for achieving results • “Money politics” weakens the link between greater political competition and good
governance. The governance agenda should be expanded to address illicit financial flows through electoral and political party financing, legislative corruption, and quasi-state foundations (yayasans)
4.1 Indonesia’s Governance Context Indonesia’s governance challenges exist in a framework of tremendous political and institutional changes that have marked its transition to a more open, competitive society. Constitutional reforms securing direct elections have created a new accountability framework at all levels of the political system. Decentralization is bringing control over resources closer to the clients, providing new opportunities for participation and monitoring of service delivery. The opening of the media and surge of new collective organizations within civil society are giving rise to powerful demands for good governance. The results of these remarkable changes are evident in a new level of competition in public life. Yet these gains in participation, competition and transparency are not yet leading to demonstrable improvements in the overall quality of governance.
Since its election in October 2004, the Yudhoyono administration has sparked genuine momentum in the fight against corruption. To gain credibility, the Government focused initially on a high-profile anti-corruption campaign. Rather than targeting individuals, the Government strengthened the institutional framework for anti-corruption. New institutions such as the Anti-Corruption Commission (KPK), Anti-Corruption Court, the Interagency Task Force (TimTasTipikor), the Hunting Team (Tim Pemburuan), the Judicial Commission, the Police Commission, and the Prosecutorial Commission have been given considerable autonomy and authority; most have begun to deliver tangible results. Existing institutions like the Supreme Audit Commission, the Financial Transaction and Analysis Centre (PPTAK), and the Attorney General’s Office
45
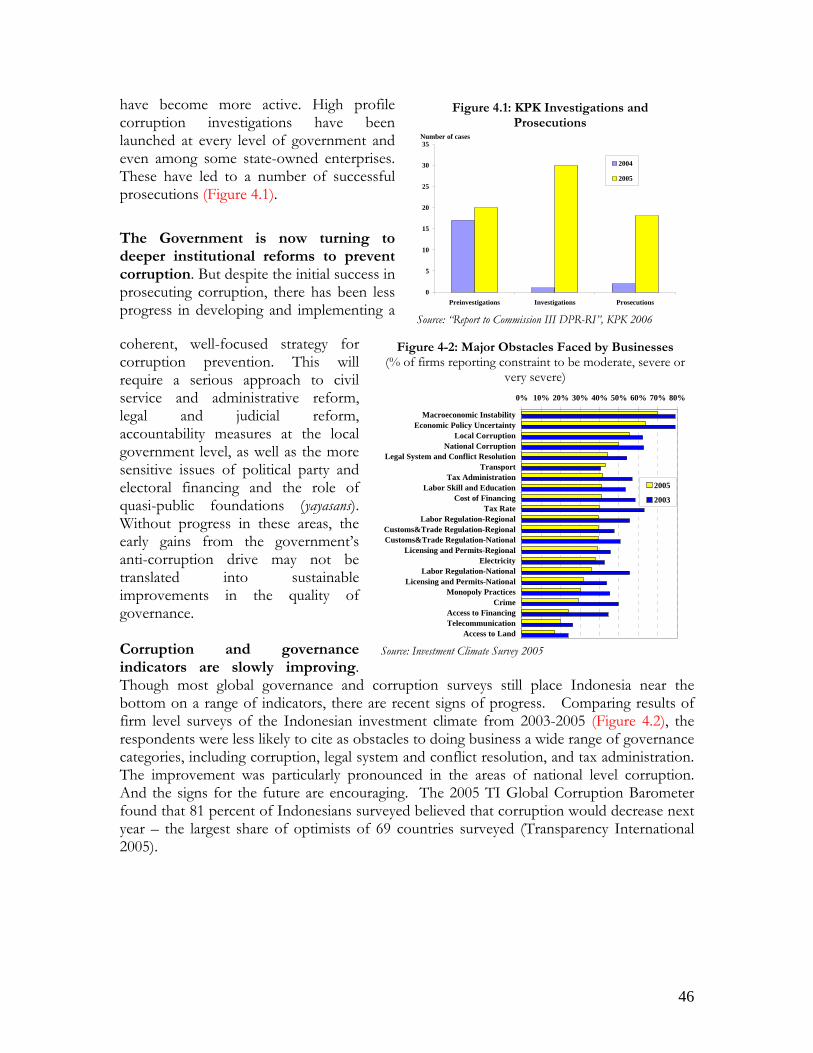
have become more active. High profile corruption investigations have been launched at every level of government and even among some state-owned enterprises. These have led to a number of successful prosecutions (Figure 4.1).
The Government is now turning to deeper institutional reforms to prevent corruption. But despite the initial success in prosecuting corruption, there has been less progress in developing and implementing a
coherent, well-focused strategy for corruption prevention. This will require a serious approach to civil service and administrative reform, legal and judicial reform, accountability measures at the local government level, as well as the more sensitive issues of political party and electoral financing and the role of quasi-public foundations (yayasans). Without progress in these areas, the early gains from the government’s anti-corruption drive may not be translated into sustainable improvements in the quality of governance.
Figure 4.1: KPK Investigations and Prosecutions
0
5
10
15
20
25
30
35
Preinvestigations Investigations Prosecutions
2004
2005
Number of cases
Source: “Report to Commission III DPR-RI”, KPK 2006
Corruption and governance indicators are slowly improving. Though most global governance and corruption surveys still place Indonesia near the bottom on a range of indicators, there are recent signs of progress. Comparing results of firm level surveys of the Indonesian investment climate from 2003-2005 (Figure 4.2), the respondents were less likely to cite as obstacles to doing business a wide range of governance categories, including corruption, legal system and conflict resolution, and tax administration. The improvement was particularly pronounced in the areas of national level corruption. And the signs for the future are encouraging. The 2005 TI Global Corruption Barometer found that 81 percent of Indonesians surveyed believed that corruption would decrease next year – the largest share of optimists of 69 countries surveyed (Transparency International 2005).
Figure 4-2: Major Obstacles Faced by Businesses (% of firms reporting constraint to be moderate, severe or
very severe) 0% 10% 20% 30% 40% 50% 60% 70% 80%
Macroeconomic InstabilityEconomic Policy Uncertainty
Local CorruptionNational Corruption
Legal System and Conflict ResolutionTransport
Tax AdministrationLabor Skill and Education
Cost of FinancingTax Rate
Labor Regulation-RegionalCustoms&Trade Regulation-RegionalCustoms&Trade Regulation-National
Licensing and Permits-RegionalElectricity
Labor Regulation-NationalLicensing and Permits-National
Monopoly PracticesCrime
Access to FinancingTelecommunication
Access to Land
2005
2003
Source: Investment Climate Survey 2005
46

4.2 Political and electoral accountability is improving with the local elections Successful national and sub-national parliamentary elections and the first direct presidential election in 2004 were landmarks for accountability. Direct elections have been introduced on a rolling basis for governors, bupatis and walikotas in 33 provinces and over 420 districts. In 2005, elections were held in 5 provinces and 221 kabupaten and kota. In 2006, an additional 7 provincial elections and 74 district level elections are in process (Figure 4-3). Initial results show a strong backlash against incumbents, implying that the electorate is holding their leaders accountable for past performance. The local elections are proceeding smoothly with only isolated irregularities. Direct elections for local leaders will reduce the non-transparent bargaining across political parties that characterized previous procedures for selecting local executives. Importantly, it also provides the local electorates with a direct ability to change non-performing incumbents. However, the local electoral process also presents a number of challenges. The relatively weak party system and malleable party coalitions at the local level reduce the available mechanisms for the national administration to push for the implementation of centrally initiated reforms in the regions. In addition, money flows both to political parties to secure places on electoral lists and to voters to secure their votes remain a serious problem at the local level. 4.3 Indonesia’s anti-corruption prevention efforts The Government has laid out an anti-corruption strategy in two documents -- INPRES 5/December 2004 and the National Action Plan for the Eradication of Corruption (RAN-PK) from February 2005 (Figure 4-4). INPRES 5 is SBY’s anti-corruption instruction to the executive. It instructs all executive branch institutions of the government to expedite efforts to eradicate corruption. The National Action Plan collects detailed policy and reform measures from each institution to implement the presidential instruction. Both documents are comprehensive in scope, covering prosecutions, prevention and education. However, neither document specifies any deadlines
Figure 4-3: Governor Races Planned in 2006 Central Sulawesi (held in January) Gorontalo West Sulawesi Nanggroe Aceh Darussalam West Irian Jaya (held in March) Papua (held in March) Banten
Figure 4-4: Key areas covered by the INPRES 05 • All high-ranking officials must file wealth reports • Attorney General’s Office (AGO) and police must
optimize investigations and prosecutions • Reforming the civil service and improving service delivery • Introducing reforms to reduce corruption and leakage in
tax and customs collection • Formulation of a National Action Plan for the Eradication
of Corruption.
Source: INPRES 05. Presidential Instruction of the Republic of Indonesia, Number 05 2004 to “expedite Corruption Eradication Efforts”.
47

or sanctions. And MenPAN, the ministry tasked with coordinating, monitoring and evaluating implementation, has only limited authority. To date, implementation of these anti-corruption strategy documents has been weak. There are several important corruption-prone arenas of governance that are not by these documents, including: 1) the judicial sector; 2) supervision of the financial sector; 3) political parties and parliaments; and 4) military procurement and military-owned businesses. Addressing corruption in all four of these areas is critical to the overall fight against corruption. The KPK is becoming a catalyst for institutional reforms to attack the roots of corruption. It is using prosecutions as the cutting edge for implementing broader institutional reforms in key sectors, such as the judiciary (especially the Supreme Court) and the civil service. But though the KPK can spur the momentum for reforms, it does not have the authority and capacity to engage in the design and implementation of complex institutional reforms of other institutions. The KPK also has a critically important responsibility in the area of corruption prevention – management and implementation of the wealth reports of public officials. Yet performance has been lagging. By end of 2005, only 54 percent of senior government officials had submitted their declarations and only a small share of these have been properly audited. The impact of these declarations is limited by the fact that they are not fully available to the public, as in most countries. This represents some backtracking from the previous policy of the once independent KPKPN. In addition, it is necessary to amend relevant legislation to establish a criminal offence for intentional illicit enrichment The legal framework for preventing corruption should be considerably improved with the passage of laws on freedom of information and witness protection. Both laws have been with the DPR for some time. There are risks that the freedom of information law could be passed with a limited scope (e.g. not including state-owned enterprises) and long implementation period (up to 5 years) that could reduce its impact. Moreover, there are potential contradictions between the law and the draft law on state secrets, also under consideration, which need to be addressed. Of course, the passage of laws is just the beginning and a strong framework to implement the freedom of information law will be critical to ensure genuine access. 4.4 Civil service reform is coming on to the national agenda While new Government has passed a number of very encouraging policy packages in a wide range of areas, confidence in the effective implementation of these packages remains weak. The main reason is the lack of administrative capacity and distorted incentive structure in the government bureaucracy. Civil service reform and administrative reform are the essential next steps for the Indonesian government to move forward decisively on the Government’s ambitious governance and anti-corruption agenda. Though this challenge has been widely recognized for many years, progress to date has been slow. But recently, there
48
are very encouraging signs that the Government is ready to seriously consider a more comprehensive reform program in this area. The challenges in reforming the civil service are well known and encompass several areas: • Organizational structure: A large number of agencies with overlapping authority share
responsibility for management and oversight of various aspects of the civil service: National Civil Service Agency (BKN), State Ministry for State Apparatus Reforms (MENPAN), Ministry of Home Affairs, National Institute of Administration (LAN), Ministry of Finance, sectoral ministries, and local governments. Yet no single agency is proactively managing the structure and shape of the civil service. And no agency has the recognized authority to undertake comprehensive civil service reform.
• Staff allocations and right-sizing: Indonesia’s “big bang” decentralization of 2001
transferred over three million civil servants from central to local authority, but did not give the local governments adequate powers to determine the size and allocation of civil servants within their jurisdictions. The result has been that, since decentralization, there is a misallocation of civil servants across levels of government. A comprehensive process of job classifications and right-sizing is urgently required.
• Recruitment and promotion: Though demand for civil service positions is high, there
is a flawed recruitment system with informal payments to enter the system and to get promoted. Performance criteria for promotion are weak, and there few credible sanctions for low performance and corruption.
• Compensation: Though civil service base salaries are low relative to private sector and
international benchmarks, the overall compensation package is characterized by a wide range of allowances and honoraria many of which are non-transparent, discretionary and highly prone to abuse. Once the total compensation package is considered, studies show that many segments of Indonesia’s civil service have not been systematically underpaid compared to workers in the private sector.1 The problem in motivating high performance, therefore, may not be the level of pay, but the opaque and discretionary system for determining overall compensation and its weak link to either personal or group performance.
Recently, the Government has begun to undertake a series of initiatives that suggest one of the most promising openings for civil service reform in years. A key first step has been the effort to design a new remuneration policy for high-ranking state officials, so-called “pejabat negara” (e.g. ministers, legislators, judges and heads of special commissions and agencies). The Minister of Finance has set up a task force to examine the entire compensation package with the goal of creating a more transparent, systematic and coherent framework of pay and allowances linked to a comprehensive review of job classifications and categories. This is intended to lead to an independent remuneration commission to
1 Nunberg, Barbara et al, “Priorities for Civil Service Reform in Indonesia”, The World Bank, EASPR, 2000, and Stedman, David & Kenward, Lloyd, “Civil Service Reforms at the Regional Level - Opportunities and Constraints”, The World Bank Indonesia, 2005.
49

recommend both the level and structure of the compensation package to Indonesia’s highest ranking political officials. Such an approach would be followed by a similar comprehensive review of pay issues for the larger civil service. Individual ministries are considering important initiatives which could serve as a model for a more comprehensive civil service reform. A new proposed Teacher’s Law would offer increase a dramatic increase of the total take-home for teachers on the basis of merit and qualifications through special “professional allowances” for those passing through a certification process. The Ministry of Finance is considering a comprehensive reform of its own civil service integrated with a restructuring of the Ministry’s core serves in treasury execution, taxes, and customs. Finally, the legal framework for the civil service is being reviewed and revised, including the basic Civil Service Law of 1999, the Law on Government Organization and the Law on Pensions. Included in this review are a range of government regulations encompassing decentralization of the civil service, performance appraisal, separations, and civil service discipline. There are also strong civil service reform initiatives in several regional governments, including in such areas as performance budgeting, one-stop public services, productivity improvement measures and transparent recruitment for key positions. Promising initiatives have been launched in Yogyakarta, Jembrana on Bali and Solok in West Sumatera.2 Yet there is a real need to clarify functions between the different tiers of government. 4.5 The judicial and legal sectors continue to face significant challenges Indonesia’s legal system continues to be identified as one of the most serious obstacles to investment. For many years the system has been weakened by inadequate funding, ineffective procedures, and inconsistent decision making. There has been a systematic demoralization and “deprofessionalization” of judges, police officers, prosecutors, and other key players in the legal system, which, in turn, further hampers efforts to reform and improve these institutions. As a result, there was considerable enthusiasm for the Supreme Court Blueprints, which provided a comprehensive assessment and strategy for reform developed by a broad alliance of actors across the judiciary, the government, civil society partners and donors. These Blueprints, prepared in 2001 and 2002, still constitute the backbone of the reform process. To date, nine Blueprints have been produced. These include the Supreme Court itself, judicial personnel management, court financial management, permanent education and capacity building, the Judicial Commission, the Commercial Court, the Anti Corruption Court and the Human Rights Court. The ninth Blueprint again starts with the commercial court as a pilot; it lays out the basic budgetary and personnel mechanism for civil service reform of the Judiciary, and is known as the Needs Assessment.
2 “Making Service Work for the Poor – 9 case studies”, The World Bank, Indonesia, 2006 (forthcoming).
50
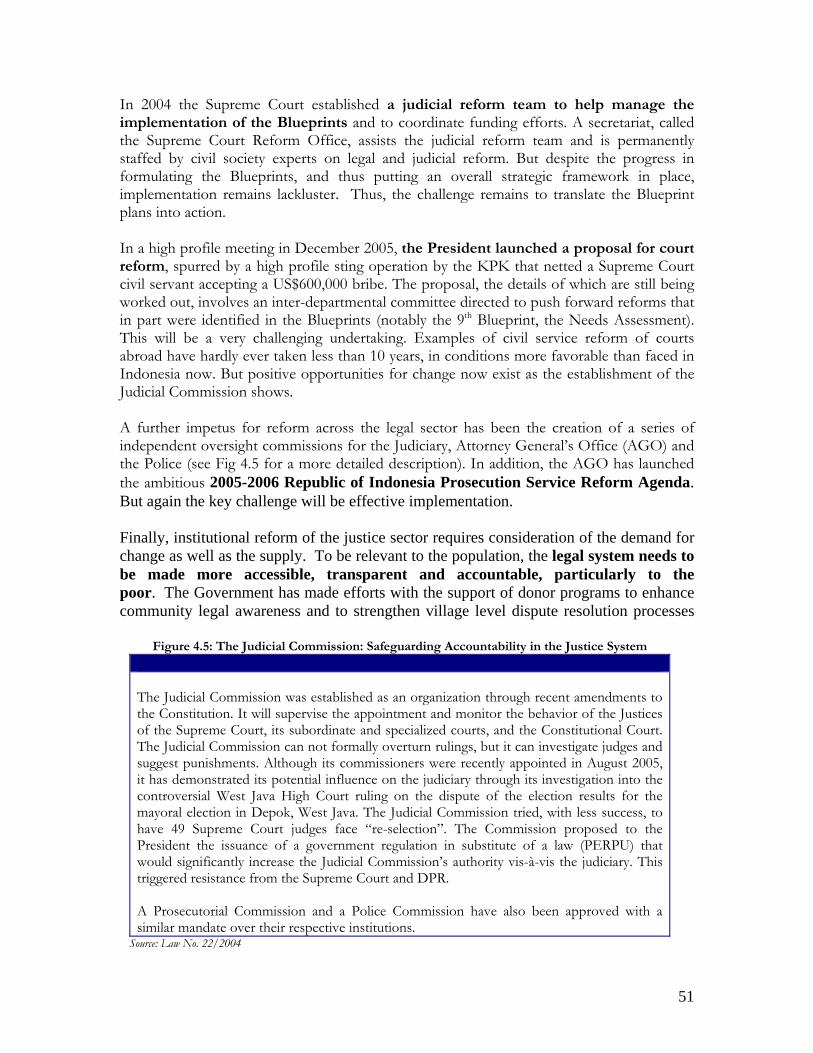
In 2004 the Supreme Court established a judicial reform team to help manage the implementation of the Blueprints and to coordinate funding efforts. A secretariat, called the Supreme Court Reform Office, assists the judicial reform team and is permanently staffed by civil society experts on legal and judicial reform. But despite the progress in formulating the Blueprints, and thus putting an overall strategic framework in place, implementation remains lackluster. Thus, the challenge remains to translate the Blueprint plans into action. In a high profile meeting in December 2005, the President launched a proposal for court reform, spurred by a high profile sting operation by the KPK that netted a Supreme Court civil servant accepting a US$600,000 bribe. The proposal, the details of which are still being worked out, involves an inter-departmental committee directed to push forward reforms that in part were identified in the Blueprints (notably the 9th Blueprint, the Needs Assessment). This will be a very challenging undertaking. Examples of civil service reform of courts abroad have hardly ever taken less than 10 years, in conditions more favorable than faced in Indonesia now. But positive opportunities for change now exist as the establishment of the Judicial Commission shows. A further impetus for reform across the legal sector has been the creation of a series of independent oversight commissions for the Judiciary, Attorney General’s Office (AGO) and the Police (see Fig 4.5 for a more detailed description). In addition, the AGO has launched the ambitious 2005-2006 Republic of Indonesia Prosecution Service Reform Agenda. But again the key challenge will be effective implementation. Finally, institutional reform of the justice sector requires consideration of the demand for change as well as the supply. To be relevant to the population, the legal system needs to be made more accessible, transparent and accountable, particularly to the poor. The Government has made efforts with the support of donor programs to enhance community legal awareness and to strengthen village level dispute resolution processes
Figure 4.5: The Judicial Commission: Safeguarding Accountability in the Justice System The Judicial Commission was established as an organization through recent amendments to the Constitution. It will supervise the appointment and monitor the behavior of the Justices of the Supreme Court, its subordinate and specialized courts, and the Constitutional Court. The Judicial Commission can not formally overturn rulings, but it can investigate judges and suggest punishments. Although its commissioners were recently appointed in August 2005, it has demonstrated its potential influence on the judiciary through its investigation into the controversial West Java High Court ruling on the dispute of the election results for the mayoral election in Depok, West Java. The Judicial Commission tried, with less success, to have 49 Supreme Court judges face “re-selection”. The Commission proposed to the President the issuance of a government regulation in substitute of a law (PERPU) that would significantly increase the Judicial Commission’s authority vis-à-vis the judiciary. This triggered resistance from the Supreme Court and DPR. A Prosecutorial Commission and a Police Commission have also been approved with a similar mandate over their respective institutions.
Source: Law No. 22/2004
51

and out of court mediation services. These build upon recent civil society efforts to promote legislative recognition of the right to Legal Aid, a key priority to improve access to justice, especially for the poor. 4.6 The problem of “money politics” The main driver of the increased momentum on anti-corruption and governance reform is the continued transformation of Indonesia’s political system. With direct elections for executive positions at all levels of government, competing candidates are jockeying to demonstrate to voters their commitment to good governance and the fight against corruption – issues that remain very high on the agenda of the Indonesian electorate. This is leading many politicians to search for innovative approaches that could make demonstrable progress on these difficult issues. But the link between political competition and incentives for governance reform is most threatened by corruption in the very process of political competition itself – what is commonly referred to as “money politics” in Indonesia. By weakening the channels of accountability between competing politicians and the voters, money politics undermines the very drivers of the broader governance and anti-corruption agenda and distorts the entire process of policy-making in Indonesia. But the key areas of reform that could have an impact on reducing money politics are not yet a major component of the governance reform agenda. To combat money politics, further reforms in three main areas will be required: • Electoral and political party financing: With the advent of direct elections, the
financing of election campaigns has taken on critical importance. Anecdotal reports suggest that payments by potential candidates to political parties to be included on party lists are still a widespread practice. And small incentive payments to voters from competing candidates are also common. International experience suggests that a strong regulatory framework to ensure the transparency of election financing and political party finances is essential including published and audited accounts of political parties and political contributions. The recent high profile corruption case against commissioners of the Central Elections Commission (KPU) presents an opportunity for pushing broader reforms in these areas.
• Legislative corruption: The issue of money and influence in the legislative process is a
problem that even the most advanced democracies continue to grapple with. Recent revelations of payments by a government ministry to the national legislature highlight that such practices are still quite common in Indonesia. The problem has been compounded, though, with the rising importance of local legislatures – DPRDs – in the decision-making on budgets and service delivery across Indonesia. Local legislatures generally face less public and media scrutiny than the national legislature and, therefore, may be more prone to such practices. Currently, there is no strategy to address the problem of legislative corruption in Indonesia, though it is critical to the overall governance agenda.
52

• Foundations (yayasans): The network of yayasans or quasi-state foundations closely
linked to existing state institutions provides a key off-budget channel for funds flows from the government back into electoral and legislative processes. Tighter regulation of these foundations to promote greater disclosure and regular audit of their activities would place stronger controls on this key pillar of money politics.
By placing reforms in these key areas on the agenda, the Government would begin to address some of the basic roots of corruption in Indonesia, providing a stronger foundation for building good governance practices. The challenge now is to build on the momentum already generated by the Government through its enhanced anti-corruption efforts by deepening and accelerating the institutional and policy reforms that will contribute to preventing corruption over time.
****
53

54

Chapter 5: Progress in Poverty Reduction and Public Service Delivery
Key Messages • Reallocation of the fuel subsidy in 2005 has increased the pro-poor focus of
expenditures while also working to mitigate the impact on the poor. The fuel price increase in 2005 resulted in a reallocation of some US$10 billion on an annualized basis from a regressive commodity subsidy to more pro-poor programs. These included 4 major programs in health, education, village infrastructure, and social protection (an unconditional cash transfer program).
• The unconditional cash transfer program (UCT), the largest such program
in the world, compensated poor and near poor households for losses incurred due to the fuel price increase. The UCT initially covered 15.5 million households (or 28 percent of the population). The cash transfer would more than compensate the losses from the fuel price increase among poor households that receive the transfer. The Government is correctly undertaking detailed assessments of the major poverty programs financed by the reallocated fuel subsidy funds for design and implementation of future programs.
• The sharp increase in rice prices in early 2006, due in part to restrictions on
imports, may have moved over 5 million people temporarily below the poverty line. The nominal price of rice increased by 30 percent between March 2005 and March 2006, higher than overall price increase by 15 percent (headline CPI). Moreover, domestic prices in March 2006 were also 30 percent higher than international prices. With rice accounting for almost a quarter of the expenditure of households near the poverty line, policy induced increases in the price of rice increase poverty.
• Indonesia now faces the challenge of improving public services and
reducing inequalities in accessing them. Despite increased public spending in health and education post decentralization, progress in service delivery is mixed. Rather than focusing solely on increasing public spending, there is merit to a three pronged approach that (i) increases the accountability and incentives of government agencies and providers (ii) strengthens the role of clients in service delivery and (iii) makes inter-governmental relations work.
5.1 Recent Developments
To mitigate the impact of fuel price increase and to increase and improve spending on the poor, the Government redirected savings from reduced fuel subsidies to four major programs in the areas of health, education, village infrastructure, and social protection. These developments, and an assessment of public service delivery, are the focus of this chapter. It draws on material from two related forthcoming World Bank reports, one on Making Services Work for the Poor in Indonesia and a World Bank Poverty Assessment report.
55
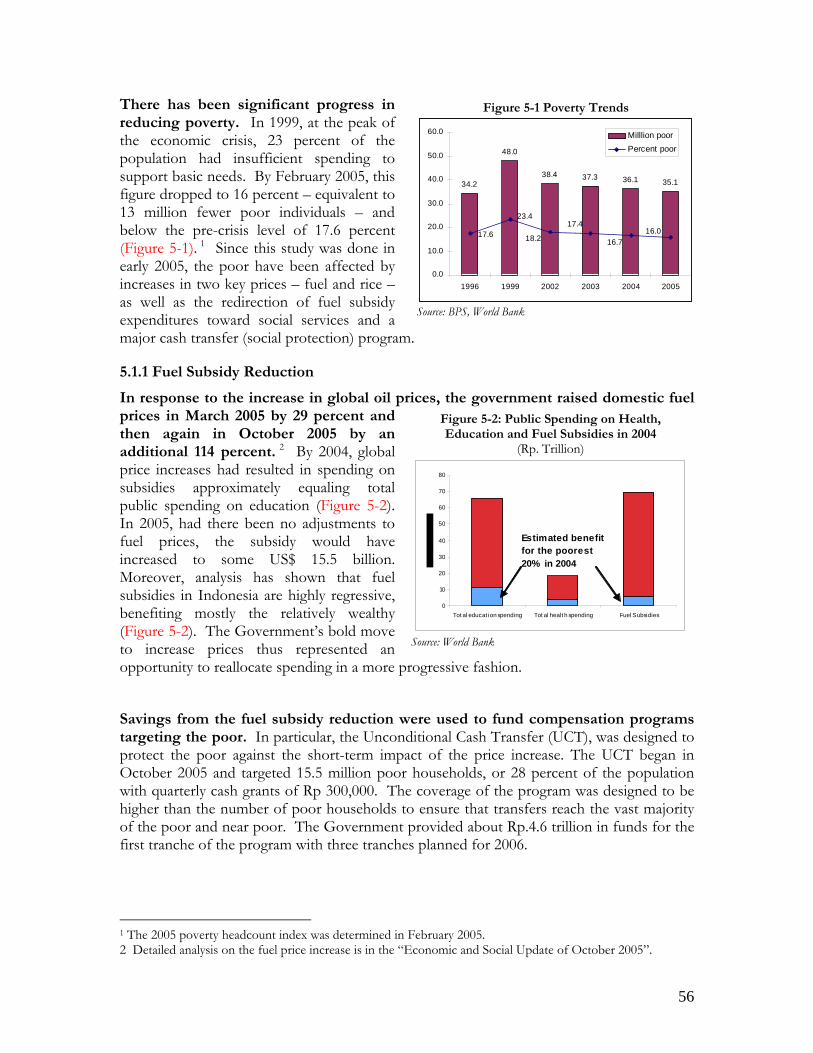
There has been significant progress in reducing poverty. In 1999, at the peak of the economic crisis, 23 percent of the population had insufficient spending to support basic needs. By February 2005, this figure dropped to 16 percent – equivalent to 13 million fewer poor individuals – and below the pre-crisis level of 17.6 percent (Figure 5-1). 1 Since this study was done in early 2005, the poor have been affected by increases in two key prices – fuel and rice – as well as the redirection of fuel subsidy expenditures toward social services and a major cash transfer (social protection) program.
Figure 5-1 Poverty Trends
34.2
48.0
38.4 37.3 36.1 35.1
16.016.7
17.4
18.2
23.4
17.6
0.0
10.0
20.0
30.0
40.0
50.0
60.0
1996 1999 2002 2003 2004 2005
Milllion poorPercent poor
Source: BPS, World Bank
5.1.1 Fuel Subsidy Reduction
In response to the increase in global oil prices, the government raised domestic fuel prices in March 2005 by 29 percent and then again in October 2005 by an additional 114 percent. 2 By 2004, global price increases had resulted in spending on subsidies approximately equaling total public spending on education (Figure 5-2). In 2005, had there been no adjustments to fuel prices, the subsidy would have increased to some US$ 15.5 billion. Moreover, analysis has shown that fuel subsidies in Indonesia are highly regressive, benefiting mostly the relatively wealthy (Figure 5-2). The Government’s bold move to increase prices thus represented an opportunity to reallocate spending in a more progressive fashion.
Figure 5-2: Public Spending on Health, Education and Fuel Subsidies in 2004
(Rp. Trillion)
0
10
20
30
40
50
60
70
80
Tot al educat ion spending Tot al healt h spending Fuel Subsidies
Estimated benefit for the poorest 20% in 2004
Source: World Bank
Savings from the fuel subsidy reduction were used to fund compensation programs targeting the poor. In particular, the Unconditional Cash Transfer (UCT), was designed to protect the poor against the short-term impact of the price increase. The UCT began in October 2005 and targeted 15.5 million poor households, or 28 percent of the population with quarterly cash grants of Rp 300,000. The coverage of the program was designed to be higher than the number of poor households to ensure that transfers reach the vast majority of the poor and near poor. The Government provided about Rp.4.6 trillion in funds for the first tranche of the program with three tranches planned for 2006.
The 2005 poverty headcount index was determined in February 2005. 1
2 Detailed analysis on the fuel price increase is in the “Economic and Social Update of October 2005”.
56

For poor recipients, the cash transfer should more than compensate for the losses incurred due to the fuel price increase. Given the size of the transfers (Rp.300,000 per quarter per family) poor households that receive the UCT would end up with enough additional income to overcome the short-term negative impact of the price hike and induced inflation. Ex-ante simulations indicate that recipients in the poorest decile would benefit from an 18 percent net increase in their consumption level while those from the second decile would get a 13 percent net increase in consumption. In the absence of the these transfers, the impact on the consumption of these poorest deciles would have been a reduction in spending of 6 percent3 and the poverty head count ratio would have increased by 6 percentage points to 22 percent. Simulations also show that perfect targeting of the UCT would reduce poverty by 4 percentage points, other things being constant.4 These calculations also focus on short-term impact, not taking into account the recovery of nominal and hence real wages over the medium-term.5 Considering that the program was prepared in a few months, the UCT performed remarkably well. Early assessments by SMERU6 7 and LP3ES indicate that in the first round the regional targeting and transfer of funds to beneficiaries was reasonably successful. In particular, recipients generally received funds on time. Given the scale of the UCT and the timeline to create it, this is a remarkable achievement. Beneficiaries expressed high satisfaction with the program and the fact that the sharp increase in fuel prices passed without major public protest is further evidence that the program largely achieved its objectives. On the other hand, the assessments note many problems in local targeting. In particular, there was insufficient communication of rules and complaint mechanisms to recipients. The government has now responded with public hearings (of program beneficiaries) to improve the logistics at distribution centers (post offices), as well as socialization and complaint resolution. Households that consider themselves poor, but were not included in the beneficiaries list during the first tranche were given the opportunity to apply for benefits. As a result, approximately 4.3 million additional households were added as beneficiaries for the second tranche.8
The Government also allocated Rp.12.5 trillion per year of the fuel subsidy savings to programs in education, health and village infrastructure. Two programs were developed for the education sector: the BOS (Operational Fund for Schools), which offered schools additional income if they eliminated or reduced school fees for poor students; and, the BKM (Scholarship Program for Secondary School Students). The village infrastructure
3 World Bank (2006) “Poverty and Social Impact Analysis for Fuel Subsidy Reduction in Indonesia”. The simulation also takes account of the impact of the fuel price rise on transportation and general inflation. 4 Assumes everything else constant does not take into account the concurrent increase in the price of rice, which is expected to have an negative impact on poverty. 5 As discussed in Chapter 1, real agricultural wages were down only 2 percent by March while some urban wages were down by 8 percent. SMERU (2005) “Rapid Appraisal, Implementation of the Direct Cash Transfer Program in Indonesia” 6
LP3ES (2005) “Unconditional Cash Transfer Rapid Assessment” 7
8 With approximately 0.6 million cards annulled following verification processes, the total number of UCT beneficiaries currently stands at approximately 19.2 million households as of the second tranche. As of end May approximately 70 percent of the second tranche had been disbursed (due to disbursement problems in specific regions, including the decision to wait until newly enrolled households were issued cards) while disbursement of the third tranche has commenced.
57

program was designed to improve village infrastructure and to provide employment through a participatory decision-making process. At present there are 12,800 beneficiary villages, each receiving Rp.250 million. The health program supports basic health care through grants to puskesmas (community health centers) and health insurance for the poor to receive free treatment in both puskesmas and hospitals.
Government identified the need to assess these sectoral programs with a view to improving their effectiveness. These programs use innovative features that warrant consideration in future programs: they directly channel money to the providers (thereby reducing the scope for leakage of funds) and are explicit in what providers have to provide in return (e.g. free services to the poor). At the same time, Government recognized the need to undertake assessments with a view to improving their design. Rapid appraisals were carried out by SMERU (Education), LP3ES (Village Infrastructure) and PusKa UI (Health). These assessments will be available in July 2006. Preliminary results point to the need for improvements with regard to socialization, targeting, complaints resolution, and transparency in funds utilization. For example there appears to have been very little program information made available to beneficiaries or the community in general.
Figure 5-3: Recent Trends in Rice Prices
As of December 2005, domestic price of rice has exceeded comparable international rice prices plus the tariff rate.
2,000
2,500
3,000
3,500
4,000
Jan
05
Feb
05
Mar
05
Apr
05
May
05
Jun
05
Jul 0
5
Aug
05
Sep
05
Oct
05
Nov
05
Dec
05
Jan
06
Feb
06
Mar
06
Apr
06
Rup
iah/
kg.
Domestic Rice Price: Jakarta Wholesale Price IR 64 III PIBCInternational Rice Price: wholesale equiv = (border*1.025)+150International Rice Price: wholesale equivalent plus tariff Rp 430/kg
While other food prices in Indonesia have not increased at the same rate in the same period.
85
95
105
115
125
135
145
Jan
05
Feb
05
Mar
05
Apr
05
May
05
Jun
05
Jul 0
5
Aug
05
Sep
05
Oct
05
Nov
05
Dec
05
Jan
06
Feb
06
Mar
06
Apr
06
Inde
x (J
anua
ry 0
5 pr
ices
=100
)
Domestic Rice Price IndexDomestic Food price index (excluding rice)
Data Sources: FAO, Border prices wholesale equivalent for Vietnam rice 25%, Jakarta wholesale price IR 64 III PIBC - Conversion Factors: $20/ton shipping and handling, $5/ton importer profit, 2.5% PPh, Rp 150/kg cif-wholesale margin
5.1.2 Rice Price Increase
Between March 2005 and March 2006, the price of rice increased by about 30 percent. Such increases are extremely difficult for the poor since rice accounts for 24 percent of their total consumption. Based on simulations, the rice price increase in excess of the overall inflation rate (about 14 percent) may have moved over 5 million people temporarily below the poverty line.
An inadequate supply of rice rather than the fuel price increase is the main factor for the rice price increase. Otherwise, we would expect to see a similar price hike for other foodstuffs during the same period as the rise in fuel prices. After the October 2005 fuel price increase, food prices (excluding rice) increased, but much less than rice prices (Figure 5-3). Current data on rice production and consumption do not provide a clear picture
58

regarding the supply of rice, but the dramatic rise in the price suggests that supply was increasingly inadequate towards the end of 2005 and early 2006. At the same time, quantitative restrictions on rice imports prevented automatic price stabilization. Rice prices on the international markets fell during the period that Indonesia’s domestic price for rice increased. In March 2006 the domestic price of rice was about 30 percent higher than the international price of rice. Reducing restrictions on rice imports would have helped offset the supply-driven price rise. The quantity of rice imported in 2005 was small, at around 0.45 million tons, while Indonesia’s imports prior to the ban averaged 1.9 million tons per year. The Government’s alternative approach would have been to release rice from its stockpile in locations when rice prices were rising too quickly (operasi pasar, OP). However, OP currently suffers from two drawbacks: first, it offers little relief from high prices since the quantities dispersed are too small. Second, and more seriously, the formula used to determine whether an OP is necessary is flawed.9 If the government wishes to use the OP to stabilize rice prices a more appropriate formula would be to set a domestic rice price ceiling some percentage points above the world rice price. Then allow imports for a set period when the price of rice exceeds this ceiling. However, it would be easier and more efficient for the government to impose a tariff and allow general imports of rice. This would maintain some degree of protection whilst ensuring that local prices do not rise significantly above the world price as occurred in late 2005 and early 2006.
5.2 Achieving structural progress in service delivery and poverty reduction
The above section has dealt with two major price-related policy issues that arose in 2005 and how Government dealt with them. It does not address some of the structural problems of low income and lack of access to quality services. That is the focus of this section of the chapter, based on two forthcoming World Bank reports.10
5.2.1 Making services work for the poor in Indonesia
Indonesia has made great progress in service delivery over the past decades. Historically, Indonesia’s progress in service delivery and its impact on human development have been remarkable. In 1960 under-five mortality was more than 200 per 1,000—more than double the rate in the Philippines or Thailand. By 2005 the figure had fallen to less than 50 per 1,000, representing one of the largest declines in the region. A child born in 1940 had about a 60 percent chance of attending any school, a 40 percent chance of completing primary school, and a 15 percent chance of completing lower secondary school. In contrast, more than 90 percent of children born in 1980 have completed primary school and close to 60 percent have completed lower secondary school.
9 The formula recommends OP when rice prices rise by more than 15 percent above the average price of the last three months. This in theory could allow rice prices to rise by 213 percent in the course of one year without triggering OP. 10 Making Services Work for the Poor in Indonesia and the Indonesia Poverty Assessment.
59

Contrary to popular belief, decentralization did not lead to widespread deterioration in service delivery. The evidence suggests that since the 2001 decentralization, some aspects of service delivery and human development outcomes have improved. After decentralization, the share of the public sector in primary, junior secondary and senior secondary school, as well as outpatient health care utilization all started to increase, reversing a downward trend of the public sector share (Figure 5-4). Achievement in some outcomes, such as test scores, has improved marginally (Figure 5-5). Perception surveys indicate a slight positive improvement of public services.
Figure 5-4: Share of Public Private Sector in Education and Health
Figure 5-5: Test Scores before and after Decentralization
0
10
20
30
40
50
60
Below low Low Intermediate High Advanced
Per
cent
1999 2003
0.0
10.0
20.0
30.0
40.0
50.0
60.0
70.0
1993 1995 1997 2000 2001 2002 2003 2004
Perc
ent
Outpatient
Primary school
Junior secondary
Senior secondary
Source: World Bank, Susenas surveys Source: Test score data from Mullis, Martin, Gonzalez,
Chrostowski (2004) “TIMSS 2003 International Mathematics Report. TIMSS & PIRLS International Study Center, Lynch School of Education, Boston College”.
However, some less visible trends show a marked slowdown in progress since decentralization (Figure 5-6). Malnutrition, as measured by weight for age in the Susenas household survey, after years of continued decline, started to increase slightly since 2001. Access to vaccinations, as measured by the percentage of children that received at least one shot, stayed about the same compared to pre-decentralization. However follow-through on vaccinations has started to fall behind. These more recent mixed achievements took place during a period when public spending in health and education increased rapidly. One would expect
Figure 5-6: Trends in Malnutrition and Vaccination Coverage
0
5
1015
20
25
30
3540
45
50
1998 1999 2000 2001 2002 2003
Rural National Susenas Urban
Hellen - Urban slumsKeller - Selected rural
Percentage children below 5 yrs malnourished
0
10
20
30
40
50
60
70
80
90
100
BCG1 DPT1 Polio1Measles1DPT3 Polio3
Before decentralization After decentralization
Percent children 12-24mnths that received at least 1 / 3 shot(s)
60

major improvements given such a sharp rise in spending. (Figure 5-7). Between 2001 and 2003, consolidated education expenditures rose by 40 percent while public health spending increased by 47 percent in real terms. Most of the increase was a result of increased development expenditures– 59 percent for education and 85 percent in health. In both sectors, central and local governments raised their spending at similar rates. In the education sector, schools also received more resources from parents. In the health sector the opposite occurred: the increased use of public sector facilities appears to be reducing private spending. Indonesia now faces the challenge of improving service quality and reducing remaining inequalities in access. These have to be addressed in a democratic and decentralized Indonesia rather than through the more centralized approaches of the past. Three approaches are suggested by the Making Services Work for the Poor in Indonesia report: • Increasing the accountability and incentives of government agencies and providers. • Strengthening the role of clients in service delivery. • Making inter-governmental relations work for improved service delivery. Service providers and government agencies need to become more client and output oriented. This can be achieved by adopting and promoting the use of service agreements (see Box 5.1 for an example) whenever it is practical to do so and where it is possible to institute complementary measures to ensure adoption of good practices. Specific actions for doing so would include the following: • Developing schemes that make transparent deliverables and put resources at providers’
disposal to achieve them—that is, clarifying what providers can be held accountable for. • Establishing practical schemes by which users and governments can monitor providers’
delivery of outputs and their compliance with agreed upon standards. • Letting providers assume greater responsibility for operational planning over time, as
accountability relationships and capacity improve. Granting greater provider autonomy through clear service agreements and tight monitoring of outputs would allow providers
Figure 5-7: Public (left) and Private (right) Health and Education Spending (indexed, 1994=100)
0
50
100
150
200
250
1994 1995 1996 1997 1998 1999 2000 2001 2002 2003 2004
Public educationspending
public healthspending
0
20
40
60
80
100
120
140
160
180
1994 1995 1996 1997 1998 1999 2000 2001 2002 2003 2004
Inde
x (1
994=
100)
Education Health Food Total
Source: World Bank
61

to better tailor services to local needs and bring decision making closer to users. Local governments need to facilitate improvements in the quality of services provided by the private sector and in the ability of private providers to deliver basic services to poor communities that are unserved or underserved. The private sector already delivers many services to the poor, but these services are often of low quality. Governments, especially local governments, need to work with private providers as partners in delivering services to the poor. Collaboration could focus on the following activities: • Increasing access to training opportunities (on quality assurance, for example) for
qualified private providers. • Educating and informing users to enable them to demand that private providers comply
with good practice guidelines. • Making private providers eligible for demand-side subsidies. • On a selective basis, piloting the contracting out of services to private providers, in
particular for services and communities that inadequately served by the public sector. • Increasing the transparency of public providers’ deliverables, actual outputs, and the cost
of producing them in order to make them more accountable and help level the playing field between public and private providers.
Involving users more in service delivery is critical. Clients are the ones who benefit most from service improvement and should therefore care most about it. Governments can support users to improve services by:
Box 5.1 Service agreements in Indonesia. Service agreements have been used in Indonesia. For example, the operational Aid for Schools Program (BOS), the agreement between the Ministry of Education and schools states that in return for a block grant, schools must abolish all fees for poor students. As the program’s manual indicates, the program “aims at providing aid to schools in the frame of relieving pupil’s contribution, but allowing the school to maintain the quality of educational services to the community…. All public and private schools have the right to receive BOS…. the school must relieve all poor pupils in said school from the school fee…. The BOS Fund is then channeled to the BOS recipient school through the assigned Post Office/Government…. In general the aim of the monitoring and supervision is to make sure that … funds are received by the rightful beneficiaries in the correct amount, time, method and utilization…. Sanctions in respect of abuse of competencies that may be damaging to the State and/or the school and/or the students will be imposed by the competent apparatus/officials” The BOS agreement represents a break from the past in that it does not specify how the school has to achieve this objective. It does not, for instance, specify that all the money has to be used to reduce school fees for poor students or to provide scholarships. In this sense it provides unusual autonomy to the schools to achieve their objectives in the most cost-effective manner. This idea has yet to be applied to the bulk of the money allocated to education. Early assessments also indicate that this service agreement was weak in terms of socialization, hindering effective monitoring of the agreement. Source: (Ministry of National Education and Ministry of Religion 2005), “Kajian Cepat PKPS-BBM Bidang Pendidikan Bantuan Operasional Sekolah (BOS) 2005” Lembaga Penelitian SMERU, Draft Awal, 3 Mei 2006.
62

• Appropriately assigning service delivery responsibilities and resources to communities or to partnerships between providers and communities.
• Involving communities directly in frontline service provision. • Using vouchers or conditional cash transfers to stimulate demand for services by the
poor. Indonesia has wide experience with community-driven programs, from which it can draw valuable lessons. Communities are well equipped to build and maintain village infrastructure and increasingly could take on responsibility for other aspects of service delivery. Community driven approaches yield cheaper local infrastructure. Table 5-1 summarizes the evidence on realized cost savings from four large community development projects. The table measures community versus contractor-built infrastructure holding constant designs and quality standards. It shows considerable cost savings through community managed basic infrastructure.11 Lessons learned from local experience point to the need to match responsibilities to communities’ comparative advantage, work with existing local institutions, invest in facilitation and transparent and informed decision-making, transfer funds directly to local beneficiary accounts, and monitor performance.
Table 5-1: Economic Benefits from Community Managed Basic Infrastructure Project names Total value
(US$ million) % community
contributed % cheaper
than contractor-
executed construction
Water Supply for Low Income Communities 2 106.7 23% 23% Kecamatan Development Projects 2 310 21% 55% Urban Poverty Projects 100.0 35% 66%
Source: Findings of Post-Construction Economic Impact Analysis, Bappenas, Jakarta, 2005. TF-05382IND. (is this on a website?)
Vouchers and conditional cash transfer programs are powerful and appropriate instruments for dealing with income-related inequalities in access to services. If Indonesia decides to adopt these types of programs, they should be designed so that they promote choice, increase the power of clients, and consider supply-side constraints in areas where provision of services is falling behind. These programs have been successfully implemented in many countries, where they have had remarkable success reducing income poverty and improving human development outcomes.
****
11 The cost saving were calculated by estimating how much infrastructure would have costed if it were constructed by contractors.
63

64

Chapter 6A: Aceh and Nias after the Tsunami:
Reconstruction, Finance and Development Outlook1
Key messages• Aceh and Nias are clearly on the path to recovery, though many challenges still remain • Though there are enough funds available for reconstruction, allocation across sectors
and regions is inconsistent and may not meet the minimum needs in each area. There are clear gaps in mid-level infrastructure, in particular roads
• Local governments are not yet full participants in their own reconstruction and should
play a more important role • Now that large flows of money are being disbursed, an effective monitoring and
evaluation mechanism to prevent and detect corruption and to measure results is absolutely critical
• The peace process is progressing smoothly but a number of events in 2006 will test its
robustness.
Nearly a year and half after the tsunami, Aceh and Nias are clearly on the path to recovery. Houses are being built in large numbers, farmers and fisher folk are returning to their livelihoods, the school year has started normally, and health services are available across the affected areas. Nearly US$1.5 billion has already been disbursed for rehabilitation and reconstruction by the Indonesian Government and a wide array of donors and NGOs. And the peace agreement between the Indonesian Government and GAM – Aceh’s greatest hope for a sustainable recovery -- is being implemented without major disruptions. Of course, many challenges still remain. The pace of infrastructure repairs is lagging behind the housing program. Land titling is facing administrative bottlenecks. The coordination of housing reconstruction is proving more difficult than planned. Inflation and unemployment are stubbornly high. Local governments are still not fully engaged in their own reconstruction programs. And there are serious recovery imbalances across sectors and among regions, with Nias lagging particularly behind. With so many activities ongoing, yet so many gaps remaining, 2006 will be a crucial test for the leadership of the BRR and the local governments of Aceh and Nias to coordinate what is one of the most complex and extensive rebuilding programs in the world. 6 A.1 Progress to date
After a slow start, the pace of reconstruction has picked up markedly since September 2005. Faster than expected progress has been achieved in getting children back to school, restoring the health care network, replacing fishing boats, and restoring farmland 1 This section represents an updated summary of the report: “Aceh and Nias one year after the Tsunami: The Recovery Effort and Way Forward” (BRR and international partners), December 2005.
65

and fishing ponds. Progress is also visible in the crucial housing sector. About 41,700 houses are reported to have been completed by end-April. Each month, about 3,500 – 5,000 houses are now being built. BRR has set an extremely ambitious target of 78,000 new houses in 2006, a target that is achievable only if the pace of construction accelerates further. However, critical gaps are still apparent. Transitional shelter, in particular, remains a severe problem. Though the population in transitional shelter has roughly halved in the last six months, about 15,000 to 20,000 families still remain in tents and another 25,000 to 30,000 families in barracks. IFRC plans to build up to 20,000 additional transitional houses starting in early-May following lengthy delays due to a shortage of legal timber. Many infrastructure sectors, particularly transport, still remain under-funded and the fulfillment of housing pledges by donors remains particularly vulnerable due to inflation (Figure 6-1). Though the construction sector is booming, livelihoods remain a serious problem, particularly for women who face a 21 percent unemployment rate (50 percent higher than the national average for women). The unemployment rate for men is much lower but still significant at 7 percent (although lower than national average of 8.3 percent). There is a serious risk that once the construction boom subsides, unemployment rates could spike considerably higher. As yet there is no clear sustainable economic development strategy for Aceh and Nias beyond the reconstruction period. Working with local governments to restore infrastructure while building their capacity to maintain that infrastructure over time is now the highest priority. There remains a “missing middle” of infrastructure at the district level that is not keeping pace with housing construction, including local and feeder roads, drainage, water and sanitation, waste management, power connectivity, and sea defense. While sufficient overall funding has been pledged to rebuild Aceh and Nias, there is an increasingly serious imbalance of funds across sectors, so that some critical sectors, such as transport, remain severely under-funded simply to build back to the pre-tsunami standards. This is becoming even more serious as the costs of construction materials and labor continue to rise (Figure 6-1).
Figure 6-1: Allocation of Funds Compared to “Core Minimum Needs” (end-April 2006, US$ million)
-5 0 0-4 0 0-3 0 0-2 0 0-1 0 0
01 0 02 0 03 0 04 0 05 0 0
Hea
lth
Com
mun
ity, c
ultu
re a
nd re
ligio
n
G
2 0 % in fla t io n4 0 % in fla t io n
over
nanc
e &
Adm
inis
tratio
n (in
cl.
Land
)
Ente
rpris
e
Educ
atio
n
Wat
er &
San
itatio
n
Hou
sing
Agric
ultu
re &
Liv
esto
ck
Fish
erie
s
Oth
er In
frast
ruct
ure
Com
mun
icat
ions
Ener
gy
Envi
ronm
ent
Floo
d co
ntro
l, irr
igat
ion
wor
ks
Tran
spor
t
USD
Mill
ion
s u rp lu s
d e fic i t
Source: BRR/World Bank staff
66

6A.2 Financing the Reconstruction Program There are sufficient resources to maintain the overall pace of reconstruction. By end-February 2006, US$4.7 billion has been allocated to specific projects: US$1.1 by the Government, US$1.8 by NGOs, and US$1.9 by official donors (Figure 6-2). Out of the total allocated, US$1.5 billion was spent by end-February 2006. The rate of disbursements has increased substantially since September 2005 to an estimated US$ 200 million per month. If momentum continues to the end of the year, more than US$6 billion would be allocated to specific projects and about half of this amount would actually be spent.
Figure 6-2: Reconstruction Needs and Commitments (US$ billion, end-April 2006)
0
1
2
3
4
5
6
7
8
9
10
Needs Program
USD
Bill
ion
allocated to
GOI (1.2)
NGOs (1.8)
DONORS (1.7) Already
specific projects (4.7)
allocated to
GOI (1.2)
NGOs (1.8)
DONORS (1.7)
GOI (1.2)
NGOs (1.8)
DONORS (1.7) Already
specific projects (4.7)
Rebuilding (6.1)Damage and
Loss Assessment (4.5)
NIAS (0.4)
Inflation (1.2)
Rebuilding (6.1)Damage and
Loss Assessment (4.5)
NIAS (0.4)
Inflation (1.2)
Damage and Loss Assessment
(4.5)
NIAS (0.4)
Inflation (1.2)
-Upgrading facilities in Tsunami- and earthquake-
affected areas.-Post-conflict reintegration
and development programs.
Building back better (2.4)
-Upgrading facilities in Tsunami- and earthquake-
affected areas.-Post-conflict reintegration
and development programs.
Building back better (2.4)Building back better (2.4)
GOI ( 1.5)
NGOs (0.8)Committedbut not allocated (3.8)
Potential soft loans (1.0)
Grants (0.5)DONORS
GOI ( 1.5)
NGOs (0.8)Committedbut not allocated (3.8)
Potential soft loans (1.0)
Grants (0.5)DONORS
GOI ( 1.5)
NGOs (0.8)Committedbut not allocated (3.8)
Potential soft loans (1.0)
Grants (0.5)DONORS
GOI ( 1.5)
NGOs (0.8)Committedbut not allocated (3.8)
Potential soft loans (1.0)
Grants (0.5)DONORS
Source: BRR/World Bank staff Figure 6-3: Aceh has Consistently Underperformed
(GDP growth, Aceh vs. national average)
- 4
- 2
0
2
46
8
1 0
1 2
1 4
1 9 7 1 - 7 5 1 9 7 6 - 8 0 1 9 8 1 - 8 5 1 9 8 6 - 9 0 1 9 9 1 - 9 5 1 9 9 6 - 0 0 2 0 0 1 - 0 3
%
N A D N a t io n a l
Source: BPS, World Bank
67
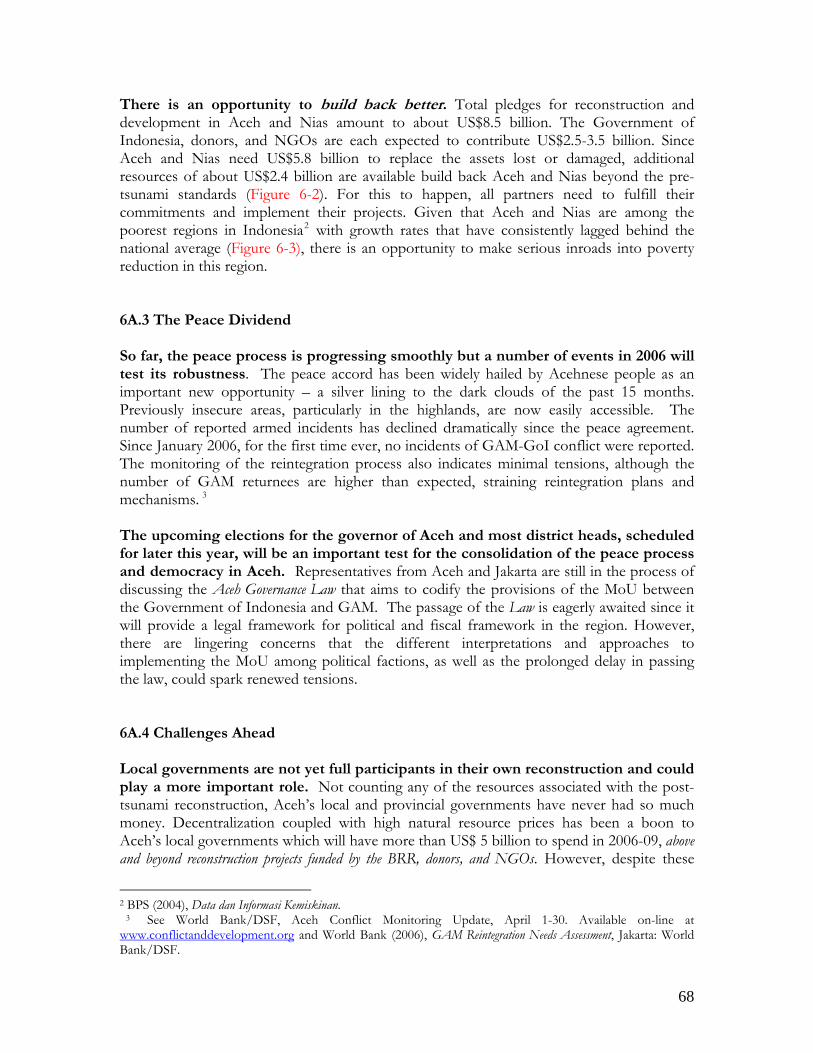
There is an opportunity to build back better. Total pledges for reconstruction and development in Aceh and Nias amount to about US$8.5 billion. The Government of Indonesia, donors, and NGOs are each expected to contribute US$2.5-3.5 billion. Since Aceh and Nias need US$5.8 billion to replace the assets lost or damaged, additional resources of about US$2.4 billion are available build back Aceh and Nias beyond the pre-tsunami standards (Figure 6-2). For this to happen, all partners need to fulfill their commitments and implement their projects. Given that Aceh and Nias are among the poorest regions in Indonesia2 with growth rates that have consistently lagged behind the national average (Figure 6-3), there is an opportunity to make serious inroads into poverty reduction in this region. 6A.3 The Peace Dividend So far, the peace process is progressing smoothly but a number of events in 2006 will test its robustness. The peace accord has been widely hailed by Acehnese people as an important new opportunity – a silver lining to the dark clouds of the past 15 months. Previously insecure areas, particularly in the highlands, are now easily accessible. The number of reported armed incidents has declined dramatically since the peace agreement. Since January 2006, for the first time ever, no incidents of GAM-GoI conflict were reported. The monitoring of the reintegration process also indicates minimal tensions, although the number of GAM returnees are higher than expected, straining reintegration plans and mechanisms. 3 The upcoming elections for the governor of Aceh and most district heads, scheduled for later this year, will be an important test for the consolidation of the peace process and democracy in Aceh. Representatives from Aceh and Jakarta are still in the process of discussing the Aceh Governance Law that aims to codify the provisions of the MoU between the Government of Indonesia and GAM. The passage of the Law is eagerly awaited since it will provide a legal framework for political and fiscal framework in the region. However, there are lingering concerns that the different interpretations and approaches to implementing the MoU among political factions, as well as the prolonged delay in passing the law, could spark renewed tensions. 6A.4 Challenges Ahead Local governments are not yet full participants in their own reconstruction and could play a more important role. Not counting any of the resources associated with the post-tsunami reconstruction, Aceh’s local and provincial governments have never had so much money. Decentralization coupled with high natural resource prices has been a boon to Aceh’s local governments which will have more than US$ 5 billion to spend in 2006-09, above and beyond reconstruction projects funded by the BRR, donors, and NGOs. However, despite these
2 BPS (2004), Data dan Informasi Kemiskinan.
3 See World Bank/DSF, Aceh Conflict Monitoring Update, April 1-30. Available on-line at www.conflictanddevelopment.org and World Bank (2006), GAM Reintegration Needs Assessment, Jakarta: World Bank/DSF.
68
windfall transfers, local governments have actually been cutting the share of their capital expenditures in response to the tsunami (from about 50 percent before the tsunami to 42-45 percent after the tsunami), anticipating assuming that the BRR and donors will cover the costs of reconstruction. Instead, local governments have been spending a larger share and absolute volume of their own resources on their local government apparatus at the expense of development spending. This is worrisome, as it suggests that local governments are disengaged from the reconstruction process, which poses major risks to the sustainability of this process and the maintenance of the rebuilt infrastructure after the BRR exits in 2009. Another critical issue is a widely perceived lack of capacity on part of local governments to effectively utilize the growing public resources. It will be critical to increase local governments’ contribution to the reconstruction process. The most effective approach to engaging local governments is to use incentives to link up their own resources with those of the BRR and other donors to co-finance coherent, locally-driven reconstruction programs. A matching funds scheme is under development by the BRR and Multi-Donor Fund to match counterpart contributions by local governments to the reconstruction of critical kabupaten level infrastructure projects. Just as important is a systematic approach to building local capacity to plan, build and maintain local infrastructure through a “learning-by-doing” approach. The 2007 budget process will provide an important signal of the province’s and local governments’ readiness to play a stronger role in the reconstruction process. Monitoring and evaluating local government spending will be important for ensuring that public funds are properly spent. Now that large flows of money are being disbursed, an effective monitoring and evaluation mechanism to prevent and detect corruption is absolutely critical. The first year of the reconstruction effort was devoted to getting projects up and running. With reconstruction in full swing and disbursements reaching $200 million a month, the challenge now is to ensure that this money is spent well, i.e. that it is reaching the intended beneficiaries and meeting quality and safety standards. Implementing an eventual portfolio of over US$ 2 billion in investments of GoI funds, the BRR risks being overwhelmed by the sheer magnitude of monitoring such an extensive range of its own projects. This will leave all the other actors in the Aceh reconstruction to apply their own M&E frameworks to their projects. With so many actors engaged in reconstruction projects – many of whom have little experience working in Indonesia – the risks of corruption are very high. And isolated cases are already coming to light. Fortunately, there is an active media and civil society presence in Aceh closely monitoring many aspects of the reconstruction. But a comprehensive M&E framework for the reconstruction led by the BRR and GoI is warranted that encompasses all donor projects to ensure common standards and the highest anti-corruption safeguards. Large scale corruption in the reconstruction process will not only harm the already suffering victims of this terrible tragedy, but could have a negative impact on the ability to raise funds for future disasters in other parts of the world.
69

Annex: Progress indicators (as of April 2006)
Source: BRR
Category Damages/Needs Recovery Progress (as of April 2006) Housing 120,000 units 42,000 units Schools 2,006 units 524 units Teachers 2,500 died 2,400 new teachers/replacements Health Facilities 127 units 113 units Roads 3,000 km. 490 km. Bridges 120 41 Sea ports 14 2 (complete), 3 (under construction) Airports 11 airports/air strips 5 airports/air strips Fishing boats 7,000 units 6,160 units Fish ponds 20,000 hectares 9,258 hectares (rehabilitated) Rice fields and plantations
60,000 hectares 37,926 hectares
****
70

Chapter 6B: Update on Avian Influenza
Key Messages • Indonesia’s strategy to respond to the challenge of Avian Flu is sound, but the
implementation arrangements are still not fully developed. These need to be given high priority.
• The current strategy is estimated to cost US$900 million over three years, but the
financing gap remains significant. A more realistic financing plan should be developed taking into account reasonable budget projects and donor financing.
Among affected countries, Indonesia has among the highest HPAI (Highly Pathogenic Avian Influenza) risks and lowest capacity to respond.1 The H5N1 virus is now considered endemic in poultry in most provinces in the country, but surveillance coverage is limited and generally unreliable to detect outbreaks. Control measures, including vaccination and culling of infected stocks, are seriously underfinanced and fraught with implementation problems. The related human health risks are high. In the first half of 2006, over a third of human cases (31 of 80) and nearly half of human deaths (25 of 51) attributed to HPAI worldwide have been in Indonesia.2 The recent cluster of cases in Medan, for which the source of infection remains unknown and human-to-human transmission cannot be ruled-out, has highlighted the weaknesses in human surveillance, case management and follow-up. While tests indicate that so far there has been no significant change to the virus, the probability of moving from the current phase of primarily poultry-centered outbreaks with isolated human infections, to a more efficient human-to-human transmission is considered to be significant in Indonesia. The potential negative impacts extend well beyond the poultry sector and immediate health risks, to significant long-term health risks and economic disruption. Moreover, perceived inaction by the Government, as compared to other affected countries such as Thailand and Vietnam, is seriously threatening Indonesia’s image among investors and tourists. 6B.1 BACKGROUND
HPAI is caused by the H5N1 virus that occurs mainly in domestic poultry. While typically confined to birds, there have been a total of 224 WHO-confirmed cases of human infection worldwide with the H5N1 virus since the 2003 outbreak, resulting in 127 WHO-confirmed deaths (a mortality rate of about 57 percent). Asia alone accounts for 187 cases and 110 deaths. While the number of human deaths worldwide has so far been limited, the greatest risk to humans is the virus changing to a form which is more easily transmitted from
1 This ranking was given separately in two major assessments by Citigroup and Hill and Associates 2 WHO-confirmed cases and deaths as of 29 May 2006.
71

human-to-human and spreads rapidly. This represents what is typically referred to as a “pandemic scenario”, the most foreboding of possible scenarios suggested by experts. 6B.2 AVIAN INFLUENZA IN INDONESIA
Poultry deaths are tapering off in the commercial sector, but concern over under-reporting remains regarding “backyard” poultry: Since the first recognized outbreak among poultry in Indonesia in August 2003, the H5N1 virus has continued to spread progressively in poultry throughout the country. Key facts include: • The virus is now considered endemic in most provinces in the country. • Infection has resulted in more than 10.5 million reported poultry deaths, among a total
poultry stock of 1.3 billion, and has triggered relatively minor culling of less than 100,000 exposed birds.
• Reported outbreaks in poultry peaked between August 2003 and March 2004, with 9.4 million chicken deaths, mostly from large-scale commercial producers. Reported outbreaks have since been less severe and more sporadic, and confined to small-scale commercial and backyard production.
Official data is qualified by a likely under-reporting of poultry mortality, particularly in the backyard production sector, and the likelihood that some poorly vaccinated poultry may carry and spread H5N1. Human deaths are rising: The first documented cases of HPAI in humans in Indonesia were in July 2005, almost two years after the first outbreak in poultry. Key facts include: • There have been 48 confirmed cases, 36 of which resulted in death.3 This represents a
mortality rate of 78 percent, well above the worldwide average. • In the first five months of 2006, 25 of the 31 WHO-confirmed cases have resulted in
deaths, representing the highest rate of new infections in the world. 6B.3 GOVERNMENT RESPONSE
Strategic plan: The “National Strategic Plan for Avian Influenza Control and Pandemic Influenza Preparedness 2006-2008” was presented at the Beijing Conference in January 2006. It draws on and attempts to integrate a plan developed by the Ministry of Health with assistance from WHO, and one by the Ministry of Agriculture with assistance from FAO. However, there are three key challenges: • The strategy is fairly general and lacks a fully developed technical and
operational implementation plan, particularly on animal health. A multi-donor mission in April 2006 including FAO, WHO, and World Bank, made recommendations on the operational details of the plan.
• The institutional arrangements for coordination are unclear. The National Committee for Avian Influenza Control and Pandemic Influenza Preparedness was created by a Presidential decree and charged to clarify roles and responsibilities among ministries. Institutional arrangements to provide an effective chain of command and
3 As of 23 May 2006
72

coordination from the national level to the village level need to be established as soon as possible.
• The key going forward will be full funding to allow systematic implementation. Currently there is a significant financing gap, as well as a mismatch between the priorities in the National Plan and the allocations of funding. The 2006 national budget includes Rp.555 billion for AI, of which one-third goes to animal health and two-thirds goes to human health. Surveillance and control in animals, which should be the top priorities, are under-funded. The current allocation of donor funds, about US$55 million, does not correct this imbalance. It is unclear how GOI intends to finance the shortfall, as the allocated national budget is insufficient, available grant funds are limited and unlikely to increase significantly, and so far GOI is reluctant to borrow for AI.
Surveillance and control in animals: To prevent and control outbreaks, the Government needs to develop an adequate surveillance system of poultry stocks to monitor circulation of the virus. Without such as system, it is difficult to properly target and undertake control measures such as culling and vaccination. Key requirements include: • Improve scanning surveillance for detection of suspected outbreaks (observably
sick or dead poultry) through a public awareness campaign targeted at the nearly 30 million households holding poultry, and an active community-based surveillance structure.
• Improve outbreak investigation and response, by establishing in every kabupaten a trained and adequately equipped outbreak investigation team capable of initiating an investigation within 24 hours of receiving a report.
• Expand and strengthen the diagnostic capabilities of the multi-tiered national network of laboratories for diagnosis of animal diseases.
• Expand the culling of infected poultry – in line with most other affected countries – in areas with outbreaks identified on the basis of improved surveillance.
• Improve the incentive for farmer cooperation by setting compensation for culled birds near farmers’ market price and paying this compensation in a timely manner.
• Modify the current vaccination program by: conducting challenge tests of vaccines for efficacy in reducing shedding of virus from birds exposed and infected after vaccination; using only quality assured vaccines; improving post-vaccination monitoring to ensure desired level of immunity; culling, instead of vaccinating, already infected flocks; and funding fully vaccination implementation.
• Restructure poultry production and marketing systems that have contributed to the virus becoming endemic here and that pose the potential for mutation. Measures include restricting and regulating high-risk farming practices, extensive holding of poultry in densely populated metropolitan areas, extensive movement of live birds between farms and markets, and location of production facilities in populated residential areas.
6B.4 ECONOMIC CONSEQUENCES
Possible economic effects depend on the future direction of avian influenza. Two scenarios depict stark differences. One entails a situation in which the flu remains transmissible only from birds to humans or becomes more benign, while another depicts the
73

virus remaining lethal and becoming easily transmissible between people. A recent analysis4 finds that even a mild pandemic would have significant consequences for global economic output. This scenario is estimated to lead to up to 1.4 million deaths and close to 0.8 percent of GDP (approximately US$330 billion) in lost economic output. As the scale of the pandemic increases, so do the economic costs. In the worst case scenario, over 140 million people could be killed causing a massive global economic slowdown and losses of up to US$4.4 trillion. The impact would trigger a significant shift of global capital from the affected economies, predominantly in the South, to the less affected safe haven economies of North America and Europe. The potential impact in Indonesia should be assessed according to two case scenarios: 5 The base case scenario is “bad for poultry farmers, but marginal effects elsewhere.” If bird flu continues to spread but the means of transmission to human remain relatively rare, then the direct impact to the Indonesian economy would center on the loss to poultry farmers of their livestock and the follow through to exporters, domestic traders, and consumers. It is estimated that the livestock industry accounts for 2.1 percent of Indonesia’s GDP. However, not all livestock are chickens and not all provinces are infected. The impact on exports from poultry bans and culling is likely limited since poultry exports represent a relatively small share of total exports.6 Beyond agriculture, lost trading revenue from declining chicken sales is likely to be marginal at the macroeconomic level. The base case entails a potential 0.5 percent loss of GDP in Indonesia
In a worst case scenario of significant human-to-human transmission, Indonesia would be the hardest hit among affected Asian countries. Like SARS, an avian influenza pandemic would have large demand effects, hampering services like tourism, hotels, restaurants and other activities that entail face to face meetings. The rise in uncertainty and fall in sentiment would also crimp investment, thus lowering growth. Higher medical and fiscal spending would only partially offset this. Unlike SARS, people-to-people transmission would almost certainly disrupt supply through the loss of workers. For Indonesia, such a scenario could result in a projected 2.8 percent decrease in GDP, a 3.1 percent decrease in industrial output, and a 2 percent increase in inflation, though these costs are still speculative.
****
4 Global Macroeconomic Consequences of Pandemic Influenza, Lowy Institute for International Policy, February 2006. 5 Avian Flu Update, Equity Research: Asia Pacific, Citigroup Global Markets, February 2005. 6 Thailand has the largest share of chicken exports, accounting for a mere 0.5 percent of total exports.
74

Statistical Annex
STATISTICAL ANNEX a List of Tables Social Indicators 1 Selected Social Indicators, 1999-2005 2 Key Social Indicators 3 Poverty Line and Number of People Below the Poverty Line 4 Population and Population Growth Rates by Province, 1980-2005 5 Labor Force Participation Rate by Province (%), 1997-2005 6 Employment by Main Industry, 1998-2005 7 Regional Minimum Wage by Province 1997-2006 National Income Accounts 8 Gross Domestic Product by Industrial Origin at Current Market Prices, 2000-2006 9 Gross Domestic Product by Industrial Origin at Current Market Prices, Share of GDP, 2000-2006 10 Gross Domestic Product by Industrial Origin at Constant 2000 Prices, 2000-2006 11 Gross Domestic Product by Industrial Origin at Constant 2000 Prices, Growth Rates, 2001-2006 12 Gross Domestic Product by Expenditure Category at Current Market Prices, 2000-2006 13 Gross Domestic Product by Expenditure Category at Current Market Prices, Share of GDP,
2000-2006 14 Gross Domestic Product by Expenditure Category at Constant 2000 Prices, 2000-2006 15 Gross Domestic Product by Expenditure Category at Constant 2000 Prices, Growth Rates,
2001-2006 16 Term of Trade, 2000-2006 International Trade & Balance of Payments 17 Balance of Payments, 1998-2005 18 Selected Exports Commodities, 1998-2005 19 Selected Import Commodities, 1998-2005 20 Value of Exports by Principal Country of Destination, 1998-2005 21 Value of Imports by Principal Country of Origin, 1998-2005 External And Domestic Debt 22 External Debt Outstanding, 1998- 2005 23 Domestic Debt Outstanding, 1999-2005
a The Statistical Annex is a compilation of official data from Government sources, World Bank, IMF and other International Agencies. In some instances, these data may differ from data in the main text due to different Bank definitions and methodologies in constructing the statistical series.

Statistical Annex
Public Finance 24 Central Government Budget Summary, 2000-2006 25 Central Government Budget Summary, Share of GDP, 2000-2006 26 Central Government Revenues, 2000-2006 27 Central Government Expenditures, 2000-2006 Monetary and Financial Statistics 28 Financial Vulnerability Indicators, 1998-2005 29 Changes in Money Supply and Sources of Change, 1998-2006 30 Banking Credit Outstanding in Rupiah and Foreign Exchange by Economic Sector,
1998-2006 31 Banking Credit Outstanding in Rupiah and Foreign Exchange by Group of Banks, 1998-2006 32 Commercial Banks’ Outstanding Credits in Rupiah and Foreign Exchange by Type of
Utilization, 1998-2006 33 Commercial Banks’ Outstanding Funds in Rupiah and Foreign Exchange by Group of Banks,
1997-2006 34 Interest Rates, 1997-2006 Agricultural Statistics 35 Principal Agricultural Products by Sub-sectors, 1998-2005 36 Rice-Area Harvested, Production and Yield, 1997-2006 Industrial Statistics 37 Selected Indicators of Real Sector Development, 1998-2005 38 Fuel Production by Company, 1997-2005 39 Domestic Sales of Petroleum Products, 1997-2005 Prices 40 Consumer Price Index, 1997-2006 41 Wholesale Price Index, 1998-2006 42 Domestic Prices of Petroleum Products, 1998-2006 Investment Statistics 43 Approved Foreign Direct Investment by Sector, 1998-2006 44 Approved Domestic Investment by Sector, 1998-2006 45 Investment Climate Indicators, 1998-2006

Table 1. Selected Social Indicators, 1999-2005
1999 2000 2001 2002 2003 2004 2005
Demography /a Population (million) 206.5 205.8 208.6 211.4 214.3 217.1 219.9Population ages 0 - 14 yr old (%) 31.7 30.7 30.2 29.7 29.2 28.8 28.3Population ages 15 - 64 yr old (%) 64.0 64.6 65.1 65.6 66.0 66.4 66.7Population ages 65+ yr old (%) 4.3 4.7 4.7 4.7 4.8 4.9 5.0Population growth rate (%) 1.36 1.34 1.33 1.32 1.30 1.36Population density (per Km2) 107 109 111 112 114 115 115Urban population, % urban to total 39.4 42.2 43.1 45.6 42.1 43.2 46.1Gender ratio, male to 100 females 99.1 100.5 100.5 100.4 100.4 100.4 100.4Dependency ratio (%) 56.1 54.7 53.6 52.5 51.5 50.6 49.8
EducationElementary school net enrollment ratio, % of relevant aged group 92.7 94.9 92.9 92.6 92.6 93.0 ..Junior high school net enrollment ratio, % of relevant aged group 59.2 60.8 60.5 60.9 63.5 65.2 ..Senior high school net enrollment ratio, % of relevant aged group 38.5 39.8 37.1 39.7 40.6 43.0 ..Population > 10 yr old not completed primary school (%) 35.4 34.0 34.4 31.3 30.8 29.4 ..Population > 10 yr old finished primary and Junior high school (%) 47.0 47.7 47.6 49.2 47.1 49.9 ..Population > 10 yr old finished high school and college (%) 17.6 18.3 18.0 19.5 11.5 20.7 ..Adult literacy rate 88.4 89.9 89.3 90.7 90.9 90.5 ..
HealthLife expectancy rate 65.5 68.0 66.2 66.2 66.2 68.6 ..Fertility rate, births per woman 2.6 2.5 2.3 2.3 2.3 2.3 ..Maternal mortality ratio, per 100,000 live births 307 307 307 307 .. .. ..Children < 5 yr old that have good nutrition (%) 69.7 71.1 69.1 71.9 69.6 74.4 ..Children < 5 yr old that had been immunized (%) 89.9 90.1 89.9 90.6 .. 92.1 ..Public cost for health, % of total health cost
Housing and Sanitation Household with access to piped water (%) 18.6 18.6 18.3 19.7 18.9 18.0 ..Household with access to own septic tank (%) 30.4 28.5 38.5 33.5 34.0 36.4 ..Household with electricity (%) 83.7 86.3 86.3 87.6 87.9 89.0 ..
Labor force Employed (%) 62.9 63.6 63.0 61.6 59.5 60.9 61.0Looking for work (%) 4.3 4.1 3.7 4.0 3.7 4.2 ..Labor force participation (%) 67.2 67.8 68.6 67.8 65.7 67.5 68.0Unemployment rate (%) /b 6.4 6.1 8.0 9.1 9.5 9.9 10.3Working children in 10-14 year old group (%) 6.9 4.6 4.6 4.0 2.8 3.2 ..
Poverty and inequalityNumber of people under poverty line (million) /c 48.4 37.3 37.1 38.4 37.3 36.1 ..Population under poverty line (%) /c 23.5 19.0 18.4 18.2 17.4 16.7 ..Expenditure share of the lowest 40%, (%) 21.3 22.2 22.0 20.9 20.6 20.0 ..Expenditure share of the middle 40%, (%) 37.0 37.9 37.5 36.9 37.1 36.9 ..Expenditure share of the highest 20%, (%) 41.6 39.9 40.6 42.2 42.3 43.1 ..Gini Coefficient 0.31 0.33 0.32 0.33 0.32 0.33 ..
/a 1999 population based on actual average growth rate Population census between 1990-2000. 2000 onward based on projetion 2000-2010./b Since 2001 Sakernas follows a "relaxed" ILO concept of open unemployment./c Since 1996 using Susenas 1998 definition of the poverty line (the "new" definition). .. : Data are not available.
Source: Central Bureau of Statistics, Ministry of Health, World Development Indicators.

Table 2. Key Social Indicators
Indicator Latest Period Previous Period Indicator Latest Period Previous Period
Poverty Rate (%) Feb-04 Feb-03 Literacy Rate (%) 2004 2003- National 16.7 17.4 - National 91.5 90.9- Urban 12.1 13.6 - Urban 95.2 95.1- Rural 20.1 20.2 - Rural 88.6 87.8
Inequality (Gini Coefficient) Feb-04 Feb-03 School Dropout (%) 2004 2003- National 0.33 0.32 - Primary school 1.0 1.2- Urban 0.33 0.32 - Junior high school 1.7 2.0- Rural 0.25 0.24 - Senior high school 2.3 2.7
Demografi ratio 2005-2010 2000-2005 Health Facilities 2003 2002- Infant Mortality Rate 28.0 36.0 - Community Health Centers:- Total Fertility Rate 2,177 2,276 * Total number 35,684 35,952
* Per 100,000 population 16.6 17.0Nutritional Status of Children under Five 2004 2003 - Hospitals: - Good (%) 74.4 69.6 * Total number 1,234 1,145- Medium (%) 15.6 19.6 * Number of beds 131,129 130,214- Bad (%) 10.0 8.6 * Beds per 100,000 population 60.2 60.5
- Medical doctor per 100,000 population 10.9 10.7School Enrollment Gross(%) 2004 2003- 7-12 years old: Labor Force Participation (%) 2004 2003 * National 96.8 96.4 - National 67.5 65.7 * Urban 97.7 97.8 - Urban 62.5 60.7 * Rural 96.1 95.6 - Rural 71.5 69.7- 13-15 years old: * National 83.5 81.0 Hourly Real Wages (2002 Rp) 2004 2003 * Urban 89.6 89.3 Agriculture 2,945 2,864 * Rural 79.3 38.9 Manufacturing 3,436 3,614- 16-18 years old: Construction 3,519 3,708 * National 53.5 51.0 Trade 2,785 3,456 * Urban 66.8 66.7 Transportation 4,131 4,160 * Rural 43.0 38.9 Finance 5,814 5,650
Services 4,163 5,927Others 5,901 6,002
.. : Data are not available.
Source: Central Bureau of Statistics, Ministry of Health

Table 3. Poverty Line and Number of People Below the Poverty Line
Year 1976-1996
Number of Percentage ofYear People Below the Poverty Line Population Below the Poverty Line
(million ) (%)Urban Rural Urban Rural Urban+Rural Urban Rural Urban+Rural
1976 4,522 2,849 10.0 44.2 54.2 38.8 40.4 40.11978 4,969 2,981 8.3 38.9 47.2 30.8 33.4 33.31980 6,831 4,449 9.5 32.8 42.3 29.0 28.4 28.61981 9,777 5,877 9.3 31.3 40.6 28.1 26.5 26.91984 13,731 7,746 9.3 25.7 35.0 23.1 21.2 21.61987 17,381 10,294 9.7 20.3 30.0 20.1 16.1 17.41990 20,614 13,295 9.4 17.8 27.2 16.8 14.3 15.11993 27,905 18,244 8.7 17.2 25.9 13.5 13.8 13.71996 38,246 27,413 7.2 15.3 22.5 9.7 12.3 11.3
Year 1996-2004 /a
Number of Percentage ofYear People Below the Poverty Line Population Below the Poverty Line
(in million ) (%)Urban Rural Urban Rural Urban+Rural Urban Rural Urban+Rural
1996 42,032 31,366 9.6 24.9 34.5 13.6 19.9 17.71998 /b 96,959 72,780 17.6 31.9 49.5 21.9 25.7 24.21999 /c 92,409 74,272 15.7 32.7 48.4 19.5 26.1 23.52000/c 91,632 73,648 12.3 26.4 38.7 14.6 22.4 19.12001/c 100,011 80,382 8.6 29.3 37.9 9.8 24.8 18.42002/c 130,499 96,512 13.3 25.1 38.4 14.5 21.1 18.22003/c 138,803 105,888 12.2 25.1 37.3 13.6 20.2 17.42004/c 143,455 108,725 11.4 24.8 36.1 12.1 20.1 16.7
/a Using BPS 1998 definition of the poverty line (the "new" definition)./b Based on Susenas of December 1998./c Based on Regular Susenas.
Source: Central Bureau of Statistics.
Poverty Line(Rp/capita/month)
Poverty Line(Rp/capita/month)
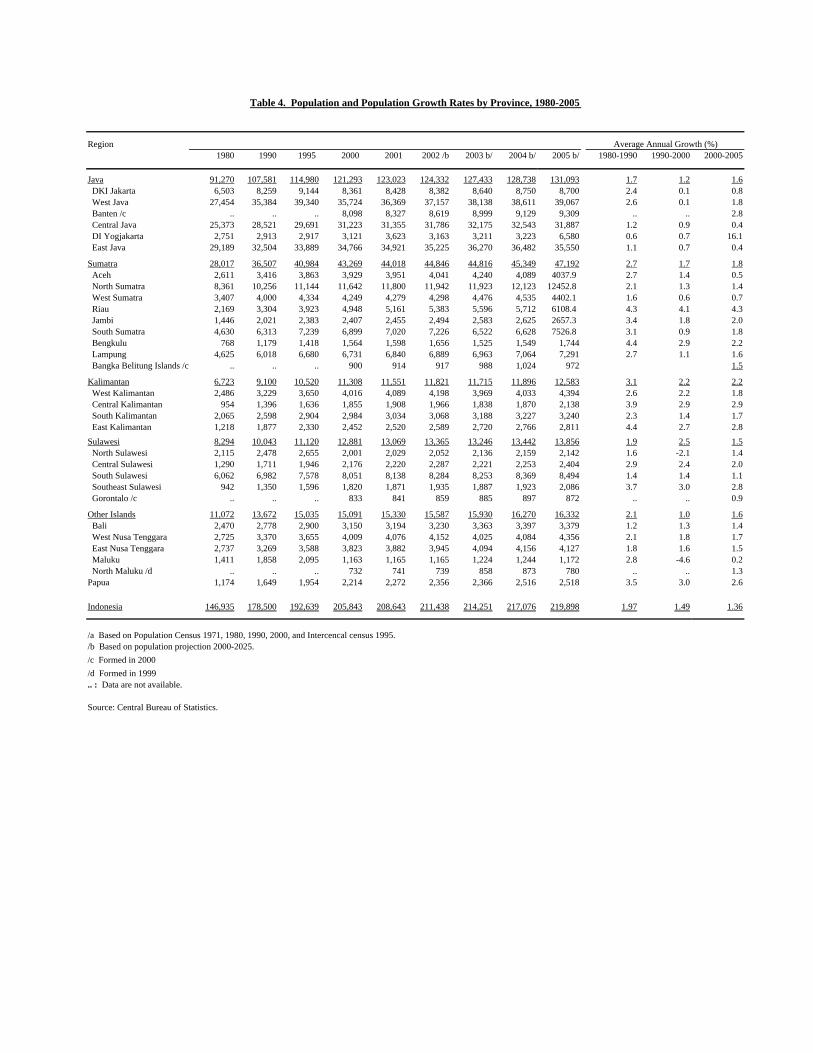
Table 4. Population and Population Growth Rates by Province, 1980-2005
Region Average Annual Growth (%)1980 1990 1995 2000 2001 2002 /b 2003 b/ 2004 b/ 2005 b/ 1980-1990 1990-2000 2000-2005
Java 91,270 107,581 114,980 121,293 123,023 124,332 127,433 128,738 131,093 1.7 1.2 1.6 DKI Jakarta 6,503 8,259 9,144 8,361 8,428 8,382 8,640 8,750 8,700 2.4 0.1 0.8 West Java 27,454 35,384 39,340 35,724 36,369 37,157 38,138 38,611 39,067 2.6 0.1 1.8 Banten /c .. .. .. 8,098 8,327 8,619 8,999 9,129 9,309 .. .. 2.8 Central Java 25,373 28,521 29,691 31,223 31,355 31,786 32,175 32,543 31,887 1.2 0.9 0.4 DI Yogjakarta 2,751 2,913 2,917 3,121 3,623 3,163 3,211 3,223 6,580 0.6 0.7 16.1 East Java 29,189 32,504 33,889 34,766 34,921 35,225 36,270 36,482 35,550 1.1 0.7 0.4
Sumatra 28,017 36,507 40,984 43,269 44,018 44,846 44,816 45,349 47,192 2.7 1.7 1.8 Aceh 2,611 3,416 3,863 3,929 3,951 4,041 4,240 4,089 4037.9 2.7 1.4 0.5 North Sumatra 8,361 10,256 11,144 11,642 11,800 11,942 11,923 12,123 12452.8 2.1 1.3 1.4 West Sumatra 3,407 4,000 4,334 4,249 4,279 4,298 4,476 4,535 4402.1 1.6 0.6 0.7 Riau 2,169 3,304 3,923 4,948 5,161 5,383 5,596 5,712 6108.4 4.3 4.1 4.3 Jambi 1,446 2,021 2,383 2,407 2,455 2,494 2,583 2,625 2657.3 3.4 1.8 2.0 South Sumatra 4,630 6,313 7,239 6,899 7,020 7,226 6,522 6,628 7526.8 3.1 0.9 1.8 Bengkulu 768 1,179 1,418 1,564 1,598 1,656 1,525 1,549 1,744 4.4 2.9 2.2 Lampung 4,625 6,018 6,680 6,731 6,840 6,889 6,963 7,064 7,291 2.7 1.1 1.6 Bangka Belitung Islands /c .. .. .. 900 914 917 988 1,024 972 1.5
Kalimantan 6,723 9,100 10,520 11,308 11,551 11,821 11,715 11,896 12,583 3.1 2.2 2.2 West Kalimantan 2,486 3,229 3,650 4,016 4,089 4,198 3,969 4,033 4,394 2.6 2.2 1.8 Central Kalimantan 954 1,396 1,636 1,855 1,908 1,966 1,838 1,870 2,138 3.9 2.9 2.9 South Kalimantan 2,065 2,598 2,904 2,984 3,034 3,068 3,188 3,227 3,240 2.3 1.4 1.7 East Kalimantan 1,218 1,877 2,330 2,452 2,520 2,589 2,720 2,766 2,811 4.4 2.7 2.8Sulawesi 8,294 10,043 11,120 12,881 13,069 13,365 13,246 13,442 13,856 1.9 2.5 1.5 North Sulawesi 2,115 2,478 2,655 2,001 2,029 2,052 2,136 2,159 2,142 1.6 -2.1 1.4 Central Sulawesi 1,290 1,711 1,946 2,176 2,220 2,287 2,221 2,253 2,404 2.9 2.4 2.0 South Sulawesi 6,062 6,982 7,578 8,051 8,138 8,284 8,253 8,369 8,494 1.4 1.4 1.1 Southeast Sulawesi 942 1,350 1,596 1,820 1,871 1,935 1,887 1,923 2,086 3.7 3.0 2.8 Gorontalo /c .. .. .. 833 841 859 885 897 872 .. .. 0.9
Other Islands 11,072 13,672 15,035 15,091 15,330 15,587 15,930 16,270 16,332 2.1 1.0 1.6 Bali 2,470 2,778 2,900 3,150 3,194 3,230 3,363 3,397 3,379 1.2 1.3 1.4 West Nusa Tenggara 2,725 3,370 3,655 4,009 4,076 4,152 4,025 4,084 4,356 2.1 1.8 1.7 East Nusa Tenggara 2,737 3,269 3,588 3,823 3,882 3,945 4,094 4,156 4,127 1.8 1.6 1.5 Maluku 1,411 1,858 2,095 1,163 1,165 1,165 1,224 1,244 1,172 2.8 -4.6 0.2 North Maluku /d .. .. .. 732 741 739 858 873 780 .. .. 1.3Papua 1,174 1,649 1,954 2,214 2,272 2,356 2,366 2,516 2,518 3.5 3.0 2.6
Indonesia 146,935 178,500 192,639 205,843 208,643 211,438 214,251 217,076 219,898 1.97 1.49 1.36
/a Based on Population Census 1971, 1980, 1990, 2000, and Intercencal census 1995./b Based on population projection 2000-2025./c Formed in 2000/d Formed in 1999.. : Data are not available.
Source: Central Bureau of Statistics.

Table 5. Labor Force Participation Rate by Province (%), 1998-2005
Region 1998 1999 2000 2001 2002 2003 2004 2005
Java 65.5 66.7 67.0 67.8 67.1 66.1 66.4 67.0 DKI Jakarta 58.2 60.2 61.6 63.7 60.8 60.5 61.9 63.8 West Java 60.4 61.9 61.9 64.6 63.3 61.4 62.5 62.9 Banten .. .. .. .. .. 63.3 62.6 63.0 Central Java 71.2 72.2 72.7 71.9 71.2 70.3 71.0 71.2 DI Yogjakarta 67.7 69.6 72.6 70.2 70.2 72.0 71.7 72.0 East Java 69.8 69.8 68.9 69.2 68.9 68.9 68.6 69.5
Sumatra 68.4 66.9 68.5 69.0 67.4 69.3 67.2 68.0 Lampung 71.6 68.5 71.0 72.1 70.3 70.4 70.2 68.9 Bengkulu 74.9 74.1 74.9 74.7 70.9 80.1 73.5 75.5 South Sumatra 68.4 69.8 69.4 70.9 70.5 74.2 72.2 71.2 Bangka Belitung .. .. .. .. .. 66.2 63.8 65.0 Riau 63.7 61.5 63.4 65.2 62.7 63.1 62.2 62.8 Jambi 66.8 65.9 65.6 67.7 68.0 67.9 67.3 66.0 West Sumatra 66.4 64.8 66.0 67.3 65.4 65.2 64.8 62.5 North Sumatra 68.4 69.0 70.1 70.5 70.0 69.7 68.6 71.9 Aceh 66.7 61.7 66.4 64.2 61.8 66.5 62.3 68.4
Kalimantan 69.5 69.4 70.9 69.9 69.8 73.5 69.4 70.1 West Kalimantan 69.0 69.6 72.3 70.3 71.9 77.6 72.6 73.9 Central Kalimantan 69.4 70.2 70.8 70.1 69.5 76.4 69.9 73.2 South Kalimantan 72.9 73.0 72.6 72.5 74.2 73.2 74.0 71.2 East Kalimantan 66.8 64.9 66.8 66.2 63.7 66.9 61.0 62.3
Sulawesi 65.2 65.1 62.8 65.8 64.1 67.5 67.6 65.9 Central Sulawesi 60.1 61.0 71.6 71.5 71.7 77.0 74.7 66.9 North Sulawesi 70.4 70.4 58.8 61.4 60.9 57.2 61.3 62.3 South Sulawesi 61.5 60.2 60.3 63.9 62.3 68.6 68.5 63.3 Southeast Sulawesi 68.9 68.9 69.6 74.2 69.3 67.1 66.0 71.1
Other Islands Bali 76.8 76.4 78.0 79.5 76.9 77.6 76.5 79.1 West Nusa Tenggara 70.8 72.1 72.5 74.5 72.4 75.9 72.2 70.6 East Nusa Tenggara 74.1 73.4 75.8 76.9 78.5 76.3 77.4 79.5 Maluku 64.8 67.3 .. 65.5 65.6 66.6 63.7 59.2 Maluku Utara .. .. .. .. .. 74.0 70.0 69.8 Irian Jaya 75.5 76.8 78.0 78.1 76.7 73.6 77.0 78.3
Indonesia 66.9 67.2 67.8 68.6 67.8 69.9 68.5 68.0
.. : Data are not available.
Source: Central Bureau of Statistics.

Table 6. Employment by Main Industry , 1998-2005 /a
1998 1999 2000 2001 2002 2003 2004 2005Main Industry million % million % million % million % million % million % million % million %
Agriculture, forestry, hunting & fishery 39.4 45.0 38.4 43.2 40.5 45.1 39.7 43.8 40.6 44.3 42.0 46.2 40.6 43.3 41.8 44.6Mining and quarrying 0.7 0.8 0.7 0.8 0.5 0.5 n/a n/a 0.6 0.7 0.7 0.8 1.0 1.1 0.8 0.9Manufacturing 9.9 11.3 11.5 13.0 11.7 13.0 12.1 13.3 12.1 13.2 10.9 12.0 11.1 11.8 11.7 12.4Electricity, gas & water 0.1 0.2 0.2 0.2 0.1 0.1 n/a n/a 0.2 0.2 0.2 0.2 0.2 0.2 0.2 0.2Construction 3.5 4.0 3.4 3.8 3.5 3.9 3.8 4.2 4.3 4.7 4.1 4.5 4.5 4.8 4.4 4.7Wholesale and retail trade & restaurants 16.8 19.2 17.5 19.7 18.5 20.6 17.5 19.2 17.8 19.4 16.8 18.5 19.1 20.4 18.9 20.2Transportation, storage & communications 4.2 4.7 4.2 4.7 4.6 5.1 4.4 4.9 4.7 5.1 5.0 5.5 5.5 5.8 5.6 5.9Finance, insurance, real estate & business serv. 0.6 0.7 0.6 0.7 0.9 1.0 1.1 1.2 1.0 1.1 1.3 1.4 1.1 1.2 1.0 1.1Public services 12.4 14.1 12.2 13.8 9.6 10.7 11.0 12.1 10.4 11.3 9.7 10.7 10.5 11.2 10.6 11.3Others 0.0 0.0 0.0 0.0 0.0 0.0 1.1 1.2 0.8 0.9 0.1 0.1 0.0 0.0 0.0 0.0
Total 87.7 100.0 88.8 100.0 89.8 100.0 90.8 100.0 91.6 100.0 90.9 100.0 93.7 100.0 94.9 100.0
/a 1990-1998 data refer to population of 10 years of age and above who worked during the week prior to the census. Starting 1999 data refer to population 15 years of age and above.
Source: Central Bureau of Statistics.

Table 7. Regional Minimum Wage by province 1997-2006(Rupiah thousand/Month)
Region 1997 1998 1999 2000 2001 2002 2003 2004 2005 2006
Java DKI Jakarta 173 199 231 344 426 591 632 671 712 819 West Java 173 199 230 230 245 281 320 366 408 448 Banten .. .. .. .. .. .. 475 515 585 .. Central Java 113 130 153 185 245 315 340 365 390 450 DI Yogjakarta 107 123 130 194 238 322 360 365 400 460 East Java 133 153 182 202 220 245 282 310 340 390
Sumatra Bangka Belitung Islands 330 363 430 .. Lampung 126 145 160 n/a 240 310 350 377 405 505 Bengkulu 128 147 150 173 240 295 330 363 430 516 South Sumatra 128 147 170 196 255 332 404 460 504 604 Riau 152 174 218 425 329 394 438 476 552 760 Jambi 120 138 150 173 285 304 390 425 485 563 West Sumatra 119 137 160 200 250 385 435 480 552 650 North Sumatra 151 174 210 250 341 464 505 537 600 738 Aceh 128 147 171 265 300 330 425 550 620 820
Kalimantan West Kalimantan 127 146 175 228 305 380 400 400 445 512 Central Kalimantan 138 159 195 n/a 362 362 425 482 524 634 South Kalimantan 125 144 166 200 295 378 425 482 536 629 East Kalimantan 153 176 194 233 300 500 540 572 600 684
Sulawesi Central Sulawesi 107 123 150 203 245 350 410 .. 490 575 North Sulawesi 118 136 155 186 372 438 495 545 600 573 South Sulawesi 113 130 148 200 300 375 415 455 498 612 Southeast Sulawesi 121 139 160 210 275 325 390 470 498 612 Gorontalo .. .. .. .. .. .. 410 430 .. ..
Other Islands Bali 142 163 187 190 310 341 341 425 448 510 West Nusa Tenggara 108 124 145 180 240 320 375 .. 475 550 East Nusa Tenggara 107 123 143 184 275 330 350 412 450 550 Maluku 136 156 180 180 230 499 370 450 500 575 North Maluku .. .. .. .. .. .. 322 400 .. .. Papua 170 196 225 315 400 530 600 650 700 823
/a Pending for approval.. : Data are not available.
Source: Ministry of Manpower

Table 8. Gross Domestic Product by Industrial Origin at Current Market Prices, 2000-2006 /a(Rp. Billion)
2000 2001 2002 2003 2004* 2005** 2006**/b
1. Agriculture, Forestry & Fishery 216,831 263,328 297,317 305,784 331,553 365,560 102,237
a. Farm Food Crops 111,324 137,752 156,010 157,649 165,558 183,581 61,719b. Non-Food Crops 31,720 36,759 41,414 46,754 51,591 57,773 9,330c. Livestock & Its Products 25,627 34,285 39,416 37,354 40,635 43,124 11,358d. Forestry 17,215 17,594 18,751 18,415 19,678 21,450 4,928e. Fishery 30,945 36,938 41,726 45,612 54,091 59,632 14,902
2. Mining and Quarrying 167,692 182,008 173,624 167,572 196,112 285,087 80,517a. Oil and Gas Mining 117,156 115,335 107,410 95,152 112,217 168,132 45,452b. Non-Oil-Gas Mining 38,990 52,560 49,609 53,313 62,251 90,392 27,260c. Quarrying 11,546 14,112 16,605 19,107 21,644 26,562 7,805
3. Manufacturing 385,598 506,320 582,136 568,920 639,655 765,967 220,082 a. Oil and Gas Industry 54,280 63,345 68,800 77,668 88,873 133,984 43,145
(1) Oil and Gas Refinery 22,603 34,959 42,588 50,016 54,362 85,907 29,637 (2) Liquefied Natural Gas (LNG) 31,677 28,385 26,212 27,651 34,511 48,077 13,509
b. Non Oil and Gas Industry 331,318 442,975 513,336 491,253 550,782 631,983 176,937 (1) Food, Beverages & Tabacco 112,063 129,036 145,658 154,155 163,508 178,049 48,567 (2) Textile, Leather Products & Footwear 45,422 57,059 61,298 67,575 71,552 76,542 21,090 (3) Wood Products & Other Wood Products 20,275 31,380 32,696 29,898 31,203 34,674 9,596 (4) Paper & Printing 19,998 19,420 21,500 27,792 31,011 33,966 9,219 (5) Fertilizers, Chemicals & Rubber Products 42,919 70,876 78,945 56,761 63,879 76,820 22,083 (6) Cement & Non Metallic Mineral Products 10,112 16,781 20,333 19,216 21,826 24,764 6,553 (7) Iron & Basic Steels 9,143 12,159 12,813 13,421 16,935 20,141 5,592 (8) Transport Equipment, Machinery & Apparatus 68,617 102,063 135,470 118,172 145,807 181,054 52,490 (9) Other Manufacturing Products 2,769 4,201 4,621 4,263 5,062 5,973 1,747
4. Electricity, gas, and water 8,394 10,855 14,714 19,144 22,067 24,993 6,664 a. Electricity 5,933 7,641 10,822 13,986 15,529 17,097 4,511 b. Gas 1,072 1,615 2,002 2,298 3,063 3,750 1,021 c. Water Supply 1,389 1,599 1,889 2,860 3,475 4,146 1,133
5. Construction 76,573 89,299 99,366 125,337 143,052 173,441 49,265
6. Trade, hotel, and restaurant 224,452 267,656 314,647 335,100 369,361 429,944 114,713 a. Wholesale & Retail Trade 184,970 223,967 245,564 260,578 288,113 336,424 88,555 b. Hotel 8,979 9,935 10,456 11,329 12,685 14,831 3,982 c. Restaurant 30,503 33,754 58,627 63,193 68,563 78,689 22,176
7. Transportation & Communication 65,012 77,188 97,970 118,916 142,292 180,969 114,713 a. Transport 46,752 56,467 66,118 79,536 88,310 110,271 88,555
(1) Rail Road Transport 744 814 1,003 1,159 1,219 1,238 3,982 (2) Road Transport 21,769 28,080 32,645 39,357 43,162 58,216 22,176 (3) Sea Transport 6,914 7,564 9,597 11,998 12,328 13,974 53,942 (4) River, Lake Transport and Ferry 1,928 2,385 2,624 2,933 3,233 3,897 34,112 (5) Air Transport 4,430 5,046 5,712 7,483 9,728 11,979 320 (6) Transport Services 10,968 12,578 14,537 16,606 18,640 20,967 19,862
b. Communication 18,260 20,720 31,853 39,381 53,982 70,698 3,753
8. Financial, Rentals and Business Services 115,463 135,370 153,858 174,075 194,429 228,108 63,699 a. Bank 55,063 64,409 68,307 74,499 78,534 88,287 23,146 b. Non Bank Financial Institutions 8,395 10,342 12,015 14,199 16,649 21,304 6,447 c. Financial Supporting Services 856 919 1,001 1,097 1,280 1,492 444 d. Building Rent 31,872 38,228 47,873 56,576 65,936 78,219 22,344 e. Business Services 19,277 21,472 24,663 27,703 32,031 38,806 11,318
9. Services 129,754 152,258 164,167 198,826 234,620 275,641 74,950 a. General Government 69,460 81,851 83,293 101,606 121,129 135,133 35,015
(1) Government Administration and Defense n.a n.a n.a 63,194 75,272 83,796 21,707 (2) Other Government Services n.a n.a n.a 38,411 45,858 51,337 13,308
b. Private 60,294 70,407 80,874 97,220 113,491 140,508 39,935 (1) Social Community Services 15,832 20,158 24,643 31,387 38,922 51,008 14,418 (2) Recreational and Entertainment Services 4,794 5,412 6,086 6,820 7,600 8,681 2,356 (3) Personal and Household Services 39,668 44,837 50,145 59,013 66,969 80,818 23,161
10. Total GDP 1,389,770 1,684,280 1,897,800 2,013,675 2,273,142 2,729,708 766,069
/a GDP base year 2000/b First quarter of 2006* : Preliminary figures, ** : Very preliminary figures.
Source: Central Bureau of Statistics.

Table 9. Gross Domestic Product by Industrial Origin at Current Market Prices, Share of GDP, 2000-2006 /a(Percent of total)
2000 2001 2002 2003 2004* 2005** 2006**/b
1. Agriculture, Forestry & Fishery 15.6 15.6 15.7 15.2 14.6 13.4 13.3
a. Farm Food Crops 8.0 8.2 8.2 7.8 7.3 6.7 8.1b. Non-Food Crops 2.3 2.2 2.2 2.3 2.3 2.1 1.2c. Livestock & Its Products 1.8 2.0 2.1 1.9 1.8 1.6 1.5d. Forestry 1.2 1.0 1.0 0.9 0.9 0.8 0.6e. Fishery 2.2 2.2 2.2 2.3 2.4 2.2 1.9
2. Mining and Quarrying 12.1 10.8 9.1 8.3 8.6 10.4 10.5a. Oil and Gas Mining 8.4 6.8 5.7 4.7 4.9 6.2 5.9b. Non-Oil-Gas Mining 2.8 3.1 2.6 2.6 2.7 3.3 3.6c. Quarrying 0.8 0.8 0.9 0.9 1.0 1.0 1.0
3. Manufacturing 27.7 30.1 30.7 28.3 28.1 28.1 28.7a. Oil and Gas Industry 3.9 3.8 3.6 3.9 3.9 4.9 5.6
(1) Oil and Gas Refinery 1.6 2.1 2.2 2.5 2.4 3.1 3.9(2) Liquefied Natural Gas (LNG) 2.3 1.7 1.4 1.4 1.5 1.8 1.8
b. Non Oil and Gas Industry 23.8 26.3 27.0 24.4 24.2 23.2 23.1(1) Food, Beverages & Tabacco 8.1 7.7 7.7 7.7 7.2 6.5 6.3(2) Textile, Leather Products & Footwear 3.3 3.4 3.2 3.4 3.1 2.8 2.8(3) Wood Products & Other Wood Products 1.5 1.9 1.7 1.5 1.4 1.3 1.3(4) Paper & Printing 1.4 1.2 1.1 1.4 1.4 1.2 1.2(5) Fertilizers, Chemicals & Rubber Products 3.1 4.2 4.2 2.8 2.8 2.8 2.9(6) Cement & Non Metallic Mineral Products 0.7 1.0 1.1 1.0 1.0 0.9 0.9(7) Iron & Basic Steels 0.7 0.7 0.7 0.7 0.7 0.7 0.7(8) Transport Equipment, Machinery & Apparatus 4.9 6.1 7.1 5.9 6.4 6.6 6.9(9) Other Manufacturing Products 0.2 0.2 0.2 0.2 0.2 0.2 0.2
4. Electricity, gas, and water 0.6 0.6 0.8 1.0 1.0 0.9 0.9a. Electricity 0.4 0.5 0.6 0.7 0.7 0.6 0.6b. Gas 0.1 0.1 0.1 0.1 0.1 0.1 0.1c. Water Supply 0.1 0.1 0.1 0.1 0.2 0.2 0.1
5. Construction 5.5 5.3 5.2 6.2 6.3 6.4 6.4
6. Trade, hotel, and restaurant 16.2 15.9 16.6 16.6 16.2 15.8 15.0a. Wholesale & Retail Trade 13.3 13.3 12.9 12.9 12.7 12.3 11.6b. Hotel 0.6 0.6 0.6 0.6 0.6 0.5 0.5c. Restaurant 2.2 2.0 3.1 3.1 3.0 2.9 2.9
7. Transportation & Communication 4.7 4.6 5.2 5.9 6.3 6.6 15.0a. Transport 3.4 3.4 3.5 3.9 3.9 4.0 11.6
(1) Rail Road Transport 0.1 0.0 0.1 0.1 0.1 0.0 0.5(2) Road Transport 1.6 1.7 1.7 2.0 1.9 2.1 2.9(3) Sea Transport 0.5 0.4 0.5 0.6 0.5 0.5 7.0(4) River, Lake Transport and Ferry 0.1 0.1 0.1 0.1 0.1 0.1 4.5(5) Air Transport 0.3 0.3 0.3 0.4 0.4 0.4 0.0(6) Transport Services 0.8 0.7 0.8 0.8 0.8 0.8 2.6
b. Communication 1.3 1.2 1.7 2.0 2.4 2.6 0.5
8. Financial, Rentals and Business Services 8.3 8.0 8.1 8.6 8.6 8.4 8.3a. Bank 4.0 3.8 3.6 3.7 3.5 3.2 3.0b. Non Bank Financial Institutions 0.6 0.6 0.6 0.7 0.7 0.8 0.8c. Financial Supporting Services 0.1 0.1 0.1 0.1 0.1 0.1 0.1d. Building Rent 2.3 2.3 2.5 2.8 2.9 2.9 2.9e. Business Services 1.4 1.3 1.3 1.4 1.4 1.4 1.5
9. Services 9.3 9.0 8.7 9.9 10.3 10.1 9.8a. General Government 5.0 4.9 4.4 5.0 5.3 5.0 4.6
(1) Government Administration and Defense n.a. n.a. n.a. 3.1 3.3 3.1 2.8(2) Other Government Services n.a. n.a. n.a. 1.9 2.0 1.9 1.7
b. Private 4.3 4.2 4.3 4.8 5.0 5.1 5.2(1) Social Community Services 1.1 1.2 1.3 1.6 1.7 1.9 1.9(2) Recreational and Entertainment Services 0.3 0.3 0.3 0.3 0.3 0.3 0.3(3) Personal and Household Services 2.9 2.7 2.6 2.9 2.9 3.0 3.0
10. Total GDP 100.0 100.0 100.0 100.0 100.0 100.0 100.0
/a GDP base year 2000/b First quarter of 2006* : Preliminary figures, ** : Very preliminary figures.
Source: Central Bureau of Statistics.

Table 10. Gross Domestic Product by Industrial Origin at Constant 2000 Prices, 2000-2006 /a(Rp. Billion)
2000 2001 2002 2003 2004* 2005** 2006**/b
1. Agriculture, Forestry & Fishery 216,831 225,686 231,614 240,387 248,223 254,391 66,282
a. Farm Food Crops 111,324 113,020 114,982 119,165 122,612 125,758 38,696 b. Non-Food Crops 31,720 34,845 37,073 38,694 39,548 40,430 6,326 c. Livestock & Its Products 25,627 27,770 29,431 30,647 31,673 32,581 8,469 d. Forestry 17,215 17,610 17,125 17,214 17,334 16,982 3,613 e. Fishery 30,945 32,441 33,003 34,668 37,057 38,641 9,178
2. Mining and Quarrying 167,692 168,244 169,932 167,604 160,100 162,642 42,073 a. Oil and Gas Mining 117,156 111,451 108,131 103,087 98,636 96,473 23,963 b. Non-Oil-Gas Mining 38,990 44,720 49,067 51,007 46,947 50,589 14,080 c. Quarrying 11,546 12,073 12,735 13,509 14,517 15,580 4,030
3. Manufacturing 385,598 398,324 419,388 441,755 469,952 491,700 123,372 a. Oil and Gas Industry 54,280 50,895 52,180 52,609 51,584 48,849 11,904
(1) Oil and Gas Refinery 22,603 22,670 21,820 22,374 22,322 21,172 5,032 (2) Liquefied Natural Gas (LNG) 31,677 28,225 30,360 30,235 29,262 27,677 6,872
b. Non Oil and Gas Industry 331,318 347,429 367,208 389,146 418,369 442,850 111,468 (1) Food, Beverages & Tabacco 112,063 113,257 113,475 116,529 118,149 121,378 30,568 (2) Textile, Leather Products & Footwear 45,422 46,966 48,485 51,484 53,576 54,263 13,508 (3) Wood Products & Other Wood Products 20,275 20,384 20,510 20,754 20,326 20,053 4,739 (4) Paper & Printing 19,998 19,043 20,045 21,731 23,384 23,958 5,805 (5) Fertilizers, Chemicals & Rubber Products 42,919 43,133 45,171 50,009 54,514 59,365 14,944 (6) Cement & Non Metallic Mineral Products 10,112 12,041 12,831 13,736 15,045 15,620 3,618 (7) Iron & Basic Steels 9,143 9,051 8,936 8,223 8,008 7,707 1,952 (8) Transport Equipment, Machinery & Apparatus 68,617 80,435 94,982 103,415 121,683 136,726 35,393 (9) Other Manufacturing Products 2,769 3,120 2,774 3,266 3,683 3,780 943
4. Electricity, gas, and water 8,394 9,058 9,868 10,349 10,890 11,597 2,949 a. Electricity 5,933 6,386 6,769 7,104 7,469 7,988 2,014 b. Gas 1,072 1,190 1,358 1,499 1,640 1,746 456 c. Water Supply 1,389 1,482 1,741 1,747 1,782 1,863 479
5. Construction 76,573 80,080 84,470 89,622 96,334 103,404 26,747
6. Trade, hotel, and restaurant 224,453 234,273 243,267 256,517 271,105 294,396 74,367 a. Wholesale & Retail Trade 184,970 192,541 199,506 210,653 222,247 242,572 61,176 b. Hotel 8,979 9,642 10,108 10,739 11,591 12,366 3,040 c. Restaurant 30,504 32,090 33,652 35,125 37,268 39,458 10,151
7. Transportation & Communication 65,012 70,276 76,173 85,458 96,897 109,467 28,959 a. Transport 46,752 49,723 52,387 57,463 62,496 66,446 16,892
(1) Rail Road Transport 744 722 675 609 603 585 148 (2) Road Transport 21,769 22,959 24,150 25,772 27,057 28,389 7,290 (3) Sea Transport 6,914 7,297 7,417 7,858 8,143 8,856 2,216 (4) River, Lake Transport and Ferry 1,928 2,015 2,083 2,165 2,254 2,351 599 (5) Air Transport 4,430 4,939 5,521 7,215 9,384 10,362 2,641 (6) Transport Services 10,968 11,791 12,540 13,845 15,055 15,903 4,000
b. Communication 18,260 20,553 23,787 27,995 34,401 43,021 12,067
8. Financial, Rentals and Business Services 115,463 123,085 131,523 140,374 151,188 161,960 41,371 a. Bank 55,063 58,852 61,277 64,418 68,321 71,576 17,581 b. Non Bank Financial Institutions 8,395 9,069 10,128 11,047 12,070 13,068 3,416 c. Financial Supporting Services 856 889 917 969 1,052 1,087 278 d. Building Rent 31,872 34,142 37,321 40,512 43,998 47,944 12,618 e. Business Services 19,277 20,133 21,880 23,429 25,747 28,284 7,478
9. Services 129,754 133,957 138,982 145,105 152,137 159,991 41,261 a. General Government 69,460 70,200 70,482 71,148 72,324 73,700 18,549
(1) Government Administration and Defense 44,499 44,866 45,033 45,394 46,055 46,890 11,798 (2) Other Government Services 24,961 25,334 25,450 25,754 26,269 26,811 6,751
b. Private 60,294 63,757 68,500 73,957 79,814 86,291 22,712 (1) Social Community Services 15,832 16,849 18,088 19,561 21,118 22,738 5,947 (2) Recreational and Entertainment Services 4,794 5,039 5,481 5,817 6,298 6,669 1,712 (3) Personal and Household Services 39,668 41,869 44,931 48,579 52,398 56,884 15,053
10. Total GDP 1,389,770 1,442,985 1,505,216 1,577,171 1,656,826 1,749,547 447,380
/a GDP base year 2000/b First quarter of 2006* : Preliminary figures, ** : Very preliminary figures.
Source: Central Bureau of Statistics.

Table 11. Gross Domestic Product by Industrial Origin at Constant 2000 Prices, Growth Rates, 2001-2006 /a(Year-on-Year Growth Rate, Percent)
2001 2002 2003 2004* 2005** 2006**/b
1. Agriculture, Forestry & Fishery 4.1 2.6 3.8 3.3 2.5 3.9
a. Farm Food Crops 1.5 1.7 3.6 2.9 2.6 3.0b. Non-Food Crops 9.9 6.4 4.4 2.2 2.2 9.9c. Livestock & Its Products 8.4 6.0 4.1 3.3 2.9 5.3d. Forestry 2.3 -2.8 0.5 0.7 -2.0 -0.1e. Fishery 4.8 1.7 5.0 6.9 4.3 4.4
2. Mining and Quarrying 0.3 1.0 -1.4 -4.5 1.6 7.0a. Oil and Gas Mining -4.9 -3.0 -4.7 -4.3 -2.2 -0.7b. Non-Oil-Gas Mining 14.7 9.7 4.0 -8.0 7.8 23.2c. Quarrying 4.6 5.5 6.1 7.5 7.3 7.2
3. Manufacturing 3.3 5.3 5.3 6.4 4.6 2.0a. Oil and Gas Industry -6.2 2.5 0.8 -1.9 -5.3 -5.1
(1) Oil and Gas Refinery 0.3 -3.7 2.5 -0.2 -5.2 -5.7(2) Liquefied Natural Gas (LNG) -10.9 7.6 -0.4 -3.2 -5.4 -4.7
b. Non Oil and Gas Industry 4.9 5.7 6.0 7.5 5.9 2.8(1) Food, Beverages & Tabacco 1.1 0.2 2.7 1.4 2.7 1.3(2) Textile, Leather Products & Footwear 3.4 3.2 6.2 4.1 1.3 -0.3(3) Wood Products & Other Wood Products 0.5 0.6 1.2 -2.1 -1.3 -5.8(4) Paper & Printing -4.8 5.3 8.4 7.6 2.5 -4.3(5) Fertilizers, Chemicals & Rubber Products 0.5 4.7 10.7 9.0 8.9 1.9(6) Cement & Non Metallic Mineral Products 19.1 6.6 7.1 9.5 3.8 -6.2(7) Iron & Basic Steels -1.0 -1.3 -8.0 -2.6 -3.8 2.9(8) Transport Equipment, Machinery & Apparatus 17.2 18.1 8.9 17.7 12.4 9.8(9) Other Manufacturing Products 12.6 -11.1 17.7 12.8 2.6 0.8
4. Electricity, gas, and water 7.9 8.9 4.9 5.2 6.5 5.2a. Electricity 7.6 6.0 4.9 5.1 7.0 4.9b. Gas 11.0 14.2 10.3 9.4 6.5 7.3c. Water Supply 6.8 17.4 0.3 2.0 4.5 4.6
5. Construction 4.6 5.5 6.1 7.5 7.3 7.2
6. Trade, hotel, and restaurant 4.4 3.8 5.4 5.7 8.6 4.2a. Wholesale & Retail Trade 4.1 3.6 5.6 5.5 9.1 4.3b. Hotel 7.4 4.8 6.2 7.9 6.7 -1.2c. Restaurant 5.2 4.9 4.4 6.1 5.9 5.5
7. Transportation & Communication 8.1 8.4 12.2 13.4 13.0 11.0a. Transport 6.4 5.4 9.7 8.8 6.3 3.8
(1) Rail Road Transport -2.9 -6.5 -9.8 -0.9 -3.0 6.8(2) Road Transport 5.5 5.2 6.7 5.0 4.9 4.1(3) Sea Transport 5.5 1.6 5.9 3.6 8.8 2.9(4) River, Lake Transport and Ferry 4.5 3.4 3.9 4.1 4.3 4.0(5) Air Transport 11.5 11.8 30.7 30.1 10.4 5.6(6) Transport Services 7.5 6.4 10.4 8.7 5.6 2.5
b. Communication 12.6 15.7 17.7 22.9 25.1 22.9
8. Financial, Rentals and Business Services 6.6 6.9 6.7 7.7 7.1 5.1a. Bank 6.9 4.1 5.1 6.1 4.8 1.0b. Non Bank Financial Institutions 8.0 11.7 9.1 9.3 8.3 7.4c. Financial Supporting Services 3.8 3.2 5.6 8.6 3.3 0.5d. Building Rent 7.1 9.3 8.6 8.6 9.0 8.4e. Business Services 4.4 8.7 7.1 9.9 9.9 9.2
9. Services 3.2 3.8 4.4 4.8 5.2 5.4a. General Government 1.1 0.4 0.9 1.7 1.9 2.0
(1) Government Administration and Defense 0.8 0.4 0.8 1.5 1.8 1.9(2) Other Government Services 1.5 0.5 1.2 2.0 2.1 2.0
b. Private 5.7 7.4 8.0 7.9 8.1 8.5(1) Social Community Services 6.4 7.4 8.1 8.0 7.7 6.7(2) Recreational and Entertainment Services 5.1 8.8 6.1 8.3 5.9 4.7(3) Personal and Household Services 5.5 7.3 8.1 7.9 8.6 9.6
10. Total GDP 3.8 4.3 4.8 5.1 5.6 4.6
/a GDP base year 2000/b 2000-2005 annual growth rates, 2006 quarterly year-on-year growth rates* : Preliminary figures, ** : Very preliminary figures.
Source: Central Bureau of Statistics.

Table 12. Gross Domestic Product by Expenditure Category at Current Market Prices, 2000-2006 /a(Rp. Billion)
2000 2001 2002 2003 2004* 2005* 2006**Q1 Q2 Q3 Q4 Q1
1. Private consumption 856,798 1,039,655 1,231,965 1,372,078 1,532,888 418,419 429,652 447,742 489,784 497,907
2. Government consumption 90,780 113,416 132,219 163,701 191,056 42,692 46,594 58,017 77,678 54,122
3. Gross fixed investment 275,881 323,875 353,967 392,789 492,850 137,728 146,923 154,601 160,543 164,624
4. Changes in stock 33,283 47,194 35,980 122,682 34,515 -3,492 8,343 6,225 -3,904 6,144
5. Statistical discrepency -13,145 -13,986 -46,995 -185,355 -83,963 11,121 9,883 11,157 -38,331 3,993
6. Exports of goods and nonfactor services 569,490 642,595 595,514 613,721 729,321 203,264 219,771 242,546 250,028 228,849
7. Less: Imports of goods and nonfactor services 423,318 506,426 480,815 465,941 623,525 181,548 199,889 216,812 199,027 189,571
Gross Domestic Product 1,389,770 1,646,322 1,821,833 2,013,675 2,273,142 628,184 661,278 703,476 736,771 766,069
Table 13 . Gross Domestic Product by Expenditure Category at Current Prices, Share of GDP, 2000-2006(Percent of total)
2000 2001 2002 2003 2004* 2005* 2006**Q1 Q2 Q3 Q4 Q1
1. Private consumption 61.7 63.2 67.6 68.1 67.4 66.6 65.0 63.6 66.5 65.0
2. Government consumption 6.5 6.9 7.3 8.1 8.4 6.8 7.0 8.2 10.5 7.1
3. Gross fixed investment 19.9 19.7 19.4 19.5 21.7 21.9 22.2 22.0 21.8 21.5
4. Changes in stock 2.4 2.9 2.0 6.1 1.5 -0.6 1.3 0.9 -0.5 0.8
5. Statistical discrepency -0.9 -0.8 -2.6 -9.2 -3.7 1.8 1.5 1.6 -5.2 0.5
6. Exports of goods and nonfactor services 41.0 39.0 32.7 30.5 32.1 32.4 33.2 34.5 33.9 29.9
7. Less: Imports of goods and nonfactor services 30.5 30.8 26.4 23.1 27.4 28.9 30.2 30.8 27.0 24.7
Gross Domestic Product 100.0 100.0 100.0 100.0 100.0 100.0 100.0 100.0 100.0 100.0
/a GDP base year 2000* : Preliminary figures, ** : Very preliminary figures. Source: Central Bureau of Statistics.

Table 14 . Gross Domestic Product by Expenditure Category at Constant 2000 Prices, 2000-2006(Rp. Billion)
2000 2001 2002 2003 2004* 2005** 2006** Q1
1. Private consumption 856,798 886,736 920,749 956,593 1,004,110 1,043,805 263,708
2. Government consumption 90,780 97,646 110,334 121,404 126,249 136,425 30,630
3. Gross fixed investment 275,881 293,793 307,585 309,431 354,561 389,757 96,420
4. Changes in stock 33,283 41,847 13,085 45,997 23,502 4,324 3,881
5. Statistical discrepency -13,145 -11,767 9,547 -26,896 12,902 48,483 16,775
6. Exports of goods and non factor services 569,490 573,164 566,188 599,516 680,466 739,007 191,499 7. Less: Imports of goods and non factor services 423,318 441,012 422,271 428,875 544,963 612,254 155,533
Gross Domestic Product 1,389,769 1,440,406 1,505,216 1,577,171 1,656,827 1,749,547 447,380
/a GDP base year 2000 * : Preliminary figures, ** : Very preliminary figures.
Table 15 . Gross Domestic Product by Expenditure Category at Constant 2000 Prices, Growth Rates, 2001-2006 /a(Year-on-Year Growth Rate, Percent)
2001 2002 2003 2004* 2005* 2006**/a
Q1
1. Private consumption 3.5 3.8 3.9 5.0 4.0 3.2
2. Government consumption 7.6 13.0 10.0 4.0 8.1 14.2
3. Gross fixed investment 6.5 4.7 0.6 14.6 9.9 2.9
4. Exports of goods and non factor services 0.6 -1.2 5.9 13.5 8.6 10.8 5. Less: Imports of goods and non factor services 4.2 -4.2 1.6 27.1 12.3 5.0
Gross Domestic Product 3.6 4.5 4.8 5.1 5.6 4.6
/a 2000-2003 annual growth rates, 2004 quarterly year-on-year growth rates* : Preliminary figures, ** : Very preliminary figures.
Source: Central Bureau of Statistics.

Table 16. Terms of Trade, 2000-2006 /a(Rp. Billion)
2000 2001 2002 2003 2004* 2005* 2005* 2006**Q1 Q2 Q3 Q4 Q1
1. Market PricesExports on Goods & Services 569,490 642,595 595,514 613,721 729,321 915,610 203,264 219,771 242,546 250,028 228,849Imports on Goods & Services 423,318 506,426 480,815 462,941 623,525 797,276 181,548 199,889 216,812 199,027 189,571
2. Constant PricesExports on Goods & Services 569,490 573,164 566,188 599,516 680,466 739,007 172,906 180,997 190,184 194,920 191,499Imports on Goods & Services 423,318 441,012 422,271 428,875 544,963 612,254 148,109 152,895 158,317 152,933 155,533
3. Deflator
Exports on Goods & Services 100.0 112.1 105.2 102.4 107.2 123.9 117.6 121.4 127.5 128.3 119.5Imports on Goods & Services 100.0 114.8 113.9 107.9 114.4 130.2 122.6 130.7 136.9 130.1 121.9
4. Terms of Trade (2000=100) 100.0 97.6 92.4 94.8 93.7 95.1 95.9 92.9 93.1 98.6 98.0
5. Real Import Capacity of Imports 569,490 559,592 523,004 568,559 637,428 703,126 165,825 168,103 177,108 192,123 187,758
6. Terms of Trade Effect 0 -13,572 -43,184 -30,957 -43,037 -35,880 -7,081 -12,894 -13,076 -2,797 -3,741
7. GDP at constant prices 1,389,770 1,442,985 1,506,124 1,577,171 1,656,826 1,749,547 427,760 434,999 448,288 438,500 447,380
8. Gross Domestic Income 1,389,770 1,429,413 1,462,940 1,546,214 1,613,788 1,713,666 420,680 422,105 435,211 435,703 443,639
a/ GDP base year 2000*: Preliminary Figures, **: Very Preliminary Figures.
Source: Central Bureau of Statistics and staff calculation.
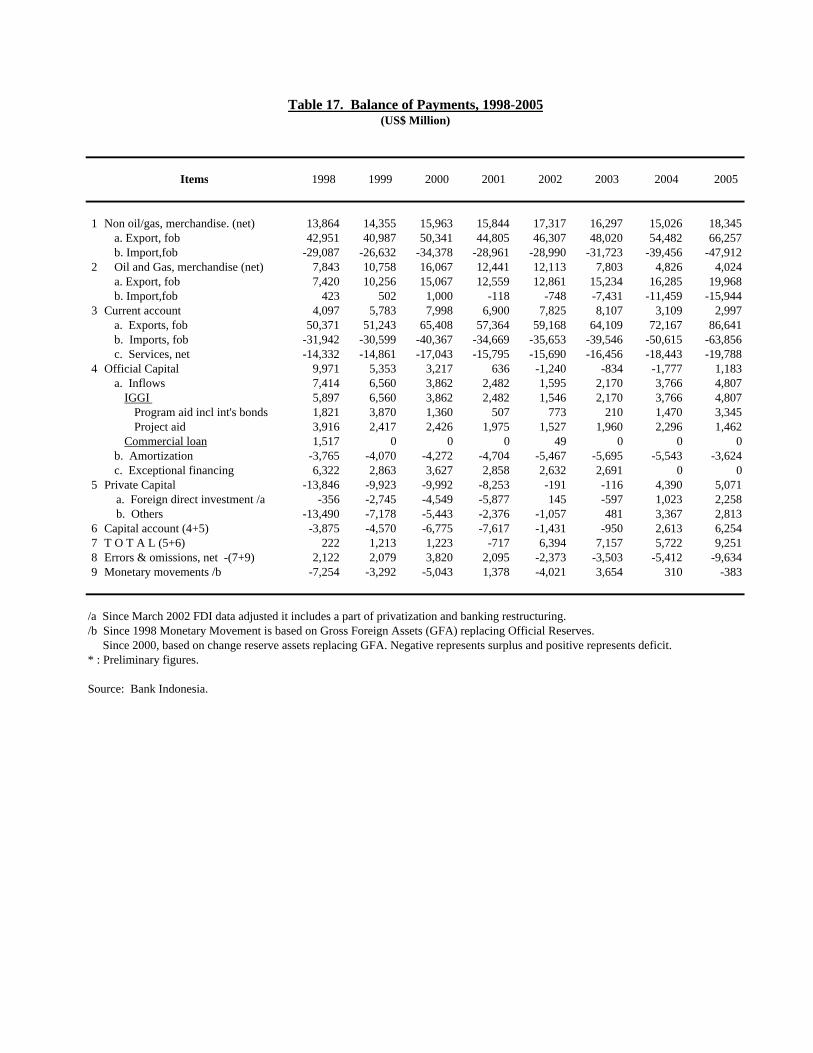
Table 17. Balance of Payments, 1998-2005(US$ Million)
Items 1998 1999 2000 2001 2002 2003 2004 2005
1 Non oil/gas, merchandise. (net) 13,864 14,355 15,963 15,844 17,317 16,297 15,026 18,345a. Export, fob 42,951 40,987 50,341 44,805 46,307 48,020 54,482 66,257
b. Import,fob -29,087 -26,632 -34,378 -28,961 -28,990 -31,723 -39,456 -47,9122 Oil and Gas, merchandise (net) 7,843 10,758 16,067 12,441 12,113 7,803 4,826 4,024
a. Export, fob 7,420 10,256 15,067 12,559 12,861 15,234 16,285 19,968b. Import,fob 423 502 1,000 -118 -748 -7,431 -11,459 -15,944
3 Current account 4,097 5,783 7,998 6,900 7,825 8,107 3,109 2,997a. Exports, fob 50,371 51,243 65,408 57,364 59,168 64,109 72,167 86,641b. Imports, fob -31,942 -30,599 -40,367 -34,669 -35,653 -39,546 -50,615 -63,856c. Services, net -14,332 -14,861 -17,043 -15,795 -15,690 -16,456 -18,443 -19,788
4 Official Capital 9,971 5,353 3,217 636 -1,240 -834 -1,777 1,183a. Inflows 7,414 6,560 3,862 2,482 1,595 2,170 3,766 4,807
IGGI 5,897 6,560 3,862 2,482 1,546 2,170 3,766 4,807 Program aid incl int's bonds 1,821 3,870 1,360 507 773 210 1,470 3,345 Project aid 3,916 2,417 2,426 1,975 1,527 1,960 2,296 1,462
Commercial loan 1,517 0 0 0 49 0 0 0 b. Amortization -3,765 -4,070 -4,272 -4,704 -5,467 -5,695 -5,543 -3,624
c. Exceptional financing 6,322 2,863 3,627 2,858 2,632 2,691 0 05 Private Capital -13,846 -9,923 -9,992 -8,253 -191 -116 4,390 5,071
a. Foreign direct investment /a -356 -2,745 -4,549 -5,877 145 -597 1,023 2,258 b. Others -13,490 -7,178 -5,443 -2,376 -1,057 481 3,367 2,813
6 Capital account (4+5) -3,875 -4,570 -6,775 -7,617 -1,431 -950 2,613 6,2547 T O T A L (5+6) 222 1,213 1,223 -717 6,394 7,157 5,722 9,2518 Errors & omissions, net -(7+9) 2,122 2,079 3,820 2,095 -2,373 -3,503 -5,412 -9,6349 Monetary movements /b -7,254 -3,292 -5,043 1,378 -4,021 3,654 310 -383
/a Since March 2002 FDI data adjusted it includes a part of privatization and banking restructuring./b Since 1998 Monetary Movement is based on Gross Foreign Assets (GFA) replacing Official Reserves. Since 2000, based on change reserve assets replacing GFA. Negative represents surplus and positive represents deficit. * : Preliminary figures.
Source: Bank Indonesia.

Table 18. Selected Export Commodities, 1998-2005 /a(US$ Million)
1998 1999 2000 2001 2002 2003 2004 2005
1 Oil 4,057 5,435 7,742 6,904 6,535 7,175 7,896 10,0782 Gas 3,815 4,357 6,625 5,732 5,578 6,477 7,750 9,1543 Fresh Fish and Shrimp 1,493 1,427 1,476 1,425 1,388 1,433 1,458 1,5194 Rubber 1,110 862 912 808 1,059 1,520 2,213 2,6145 Palm and Kernel Oil 941 1,462 1,326 1,227 2,349 2,719 3,944 4,3446 Copra Oil 206 209 320 112 158 154 265 4147 Coffee 616 489 340 204 240 274 309 5298 Cocoa 489 387 311 364 667 595 531 6549 Food Products 344 594 613 663 647 697 934 1,05910 Fresh Fruit and Vegetables 139 211 166 150 175 180 208 27111 Tea 113 98 112 102 108 99 120 12312 Copper 1,361 1,521 2,008 2,106 2,210 2,494 2,558 4,49413 Coal 1,350 1,306 1,296 1,625 1,771 2,010 2,758 4,35414 Nikel 135 210 308 212 51 250 831 1,06515 Tin 281 246 232 191 223 295 616 91916 Plywood 2,232 2,552 2,326 2,116 2,067 1,945 1,955 1,72417 Pulp and Paper 2,105 2,415 2,975 2,573 2,784 2,762 2,773 3,21218 Textile Fabric 1,470 1,841 2,178 1,958 1,666 1,685 1,671 1,82519 Textile Fiber and Thread 1,036 1,277 1,464 1,369 1,414 1,382 1,682 1,87320 Garments 2,630 3,857 4,734 4,531 3,945 4,105 4,454 5,10621 Footwear 1,206 1,602 1,672 1,506 1,148 1,182 1,320 1,42922 Electronics and Computers 3,190 4,021 9,070 7,701 7,972 7,657 9,001 10,01023 Chemicals 2,206 2,182 2,815 2,573 2,709 3,057 3,854 4,15124 Furniture 355 1,239 1,518 1,424 1,512 1,570 1,669 1,85625 Machinery 760 719 1,116 853 1,124 1,281 1,452 1,91826 Iron and Steel 614 490 511 398 426 530 824 93927 Transport Equipment 542 355 356 380 496 649 832 1,40628 Fertilizer 168 185 209 127 129 182 83 164
Other 13,883 7,116 7,392 6,990 6,608 6,699 7,621 8,455
Total 34,965 41,550 54,732 49,331 50,551 54,359 63,964 77,205
/a Classification is based on WBOJ Export Trade Summary
Source: BPS - Export Statistics.

Table 19. Selected Import Commodities, 1998-2005 /a /b(US$ Million)
1998 1999 2000 2001 2002 2003 2004 2005
Consumer Goods 1,564.2 2,025.7 1,743.9 1,523.6 1,925.4 2,093.3 2,495.6 2,870.7Foods and Beverages 1,179.1 1,626.6 1,022.3 823.8 1,086.0 1,146.3 1,275.9 1,509.1
Sugars 36.5 220.3 109.7 61.2 78.5 130.5 168.4 311.5Rice 850.4 1,027.7 269.2 127.5 313.9 263.9 52.9 50.9Dairy Products 26.3 28.5 80.1 119.6 74.8 112.2 185.7 246.0Fresh Fruits 36.7 56.3 137.0 140.4 212.2 186.5 212.3 213.3Other Foods and Beverages 229.2 293.7 426.5 375.1 406.7 453.1 656.6 687.5
Non-food Goods 385.1 399.1 721.6 699.8 839.4 947.1 1,219.8 1,361.6Durable Goods 61.2 74.8 179.9 153.2 196.6 242.8 317.0 362.2
Television Parts 2.1 11.2 61.4 56.8 51.1 83.8 44.2 61.8Air Conditioner 1.6 1.0 1.8 1.8 7.1 13.3 43.2 71.8Washing Machine 8.6 8.3 19.0 21.5 24.3 34.2 55.2 51.1Other 48.8 54.4 97.7 73.0 114.1 111.4 174.4 177.4
Semi-durable Goods 157.8 152.5 245.8 209.7 262.3 303.5 344.9 383.6Plastic Products 25.8 28.9 48.5 46.9 48.2 52.2 58.6 61.1Toys 6.3 7.6 20.6 28.9 39.6 53.4 44.8 40.6Parts of Footwear 72.6 62.7 83.3 63.7 53.8 50.6 38.0 27.3Other 53.0 53.3 93.4 70.2 120.7 147.3 203.5 254.6
Non-durable Goods 166.1 171.8 295.9 336.9 380.5 400.7 557.8 615.8Human/Veterinary Medicine 34.7 50.1 54.4 51.8 64.2 85.1 116.2 126.9Tobacco 8.3 11.3 47.0 79.9 93.3 59.3 49.9 37.0Sanitary Towel - Paper 10.4 3.2 10.8 16.9 22.2 31.8 58.0 55.8Other 112.8 107.2 183.7 188.3 200.9 224.5 333.7 396.1
Intermediate Goods 11,821.9 12,184.4 16,124.4 14,534.5 13,867.6 13,930.0 19,633.6 21,611.4Chemical Material 1,876.2 2,252.8 2,920.5 2,625.3 2,413.6 2,468.6 3,678.0 3,764.6Iron Ores, Basic Product from Iron & Steel 486.2 406.5 878.6 639.1 767.2 839.8 1,904.3 2,280.7Cotton 715.4 672.6 735.5 1,065.5 707.1 647.4 688.2 580.0Wheat & Flour 637.7 477.4 589.8 452.2 687.7 659.9 923.7 931.8Beans & Material from Soya 259.2 466.7 548.8 602.8 580.5 696.1 954.4 788.0Pulp & Waste Paper 573.8 647.4 1,069.0 713.7 629.3 636.4 824.8 785.1Alumunium 199.3 228.5 337.9 291.9 277.0 309.0 441.7 506.2Raw Material for Plastic 343.0 363.4 533.2 470.5 459.6 464.2 648.9 682.8Manufactured Fertilizer 91.4 225.2 180.6 195.0 241.1 226.3 377.3 454.8Beet and Cane Sugar 313.0 308.3 173.7 176.4 117.5 199.9 97.0 277.6Dairy Products 67.8 82.7 151.1 180.9 140.3 131.9 199.9 223.4Other 6,258.9 6,052.8 8,005.8 7,121.3 6,846.7 6,650.4 8,895.4 10,336.4
Fuels and Lubricants 2,690.9 3,705.4 6,104.4 5,560.9 6,635.7 7,733.3 11,888.2 17,600.3Primary Forms of Fuels & Lubricants 1,061.0 1,596.4 2,531.3 2,890.0 3,218.9 4,033.2 5,847.0 6,810.7Processed Lubricating Oil 198.8 296.5 384.5 162.7 210.9 156.6 690.8 738.9Processed Fuel (petroleum) 1,346.8 1,735.6 3,070.2 2,369.1 3,068.9 3,372.2 5,141.4 9,841.9Other Processed Fuels & Lubricants 84.3 77.0 118.4 139.1 137.0 171.2 209.0 208.7
Transports, Parts and Accessories 1,552.9 1,353.7 3,055.0 2,986.6 2,768.4 3,014.0 4,112.1 5,374.4Passanger Cars 50.2 19.9 192.3 182.4 98.8 282.8 580.3 585.3Other Passanger Vehicles (Golf Car, Motorcycle, Bycicle, etc.) 3.3 6.6 75.6 34.9 30.2 25.9 43.7 44.9Heavy Transport Equipments 324.6 314.3 412.5 618.6 593.5 523.2 832.3 1,525.2Parts and Accessories 1,174.9 1,012.9 2,374.6 2,150.8 2,045.9 2,182.1 2,655.8 3,219.0
Capital Goods 7,929.2 4,666.2 6,608.5 6,333.7 6,057.7 5,718.3 8,328.3 10,228.5Machines 5,040.0 2,772.3 4,333.7 4,119.8 3,795.9 3,547.7 5,416.1 6,422.6Parts and Accessories 2,889.2 1,893.9 2,274.8 2,213.9 2,261.8 2,170.6 2,912.3 3,805.9
Goods not elsewhere specified 111.2 67.8 29.7 22.9 34.1 61.8 66.6 15.6
TOTAL 25,670.4 24,003.3 33,665.9 30,962.1 31,288.9 32,550.7 46,524.5 57,700.9
/a Classification is based on WBOJ Export Trade Summary, BEC-BPS format/b Exclude imports to Batam
Source: BPS - Import Statistics.

Table 20. Value of Exports by Principal Country of Destination, 1998-2005(US$ Million)
1998 1999 2000 2001 2002 2003 2004 2005
ASEAN 7,596 7,402 9,625 8,446 8,439 7,977 .. ..o/w Malaysia 1,358 1,336 1,972 1,779 2,030 2,364 3,016 3,431
Thailand 943 813 1,026 1,064 1,227 1,393 1,976 2,246Philippines 707 695 843 815 778 945 1,238 1,419Singapore 5,718 4,901 6,523 5,364 5,349 5,400 6,001 7,837Brunei 36 28 25 23 32 30 32 39Vietnam 351 332 361 322 393 468 543 678Cambodia 65 69 52 72 69 80 72 94Laos 2 2 1 1 1 0 2 2Myanmar 167 74 65 69 54 46 60 78
China 1,832 2,009 2,768 2,201 2,903 3,803 4,605 6,662Hong Kong 1,865 1,330 1,555 1,290 1,242 1,183 1,387 1,492Japan 9,116 10,397 14,415 13,010 12,045 13,603 15,962 18,049
Africa 904 995 1,114 1,081 1,092 1,195 .. ..
USA 7,031 6,897 8,475 7,749 7,559 7,374 8,767 9,868Canada 412 353 404 390 378 382 437 464
Australia and Oceania 910 1,020 1,040 993 1,318 1,246 .. ..
Europe 8,273 7,369 9,165 8,379 8,403 8,586 .. ..European Union 7,474 6,744 8,451 7,449 7,306 7,437 .. ..o/w United Kingdom 1,143 1,176 1,508 1,383 1,252 1,136 1,295 1,291
Netherlands 1,512 1,543 1,837 1,498 1,618 1,401 1,798 2,234Germany 1,458 1,217 1,367 1,232 1,219 1,392 558 0Belgium & Luxemburg 876 697 857 782 794 911 925 1,004France 547 503 718 663 649 653 660 624Denmark 143 142 135 109 103 96 112 127Ireland 48 42 68 67 55 62 55 93Italy 859 656 718 622 720 844 923 1,007Greece 108 78 99 94 88 95 92 105Portugal 37 40 50 76 52 50 73 89Spain 869 742 932 904 996 1,022 837 1,205
Total Exports 48,848 48,665 62,124 56,321 57,159 61,058 71,584 85,660
Source: Central Bureau of Statistics.

Table 21. Value of Imports by Principal Country of Origin, 1998-2005(US$ Million)
1998 1999 2000 2001 2002 2003 2004 2005
ASEAN 2,646 2,977 3,563 3,213 3,804 4,882 6,286 7,718o/w Malaysia 627 589 1,129 1,005 1,037 1,138 1,682 2,149
Thailand 842 933 1,109 986 1,191 1,702 2,772 3,447Philippines 65 55 115 94 114 183 229 322Singapore 2,543 2,448 3,789 3,147 4,100 4,155 6,083 9,471Brunei 0 38 16 37 34 117 295 1,197Vietnam 421 590 303 171 259 416 418 439Cambodia 2 1 1 0 1 1 1 1Laos 0 0 1 0 0 3 0 0Myanmar 9 19 22 21 31 15 17 14
China 906 1,242 2,043 1,843 2,427 2,957 4,100 5,843Hong Kong 264 227 342 257 241 222 267 291Japan 4,293 2,912 5,397 4,689 4,409 4,228 6,082 6,906Other Asia 3,931 3,068 3,391 2,070 2,783 3,521 4,123 3,439
Africa 399 339 348 369 300 311 431 559
USA 3,517 2,837 3,390 3,208 2,640 2,695 3,226 3,879Canada 504 417 638 357 412 322 547 698
Australia and Oceania 1,785 1,526 1,796 1,631 1,594 1,484 2,233 2,490
Europe 6,520 4,061 4,878 3,967 4,197 3,976 6,481 6,998o/w United Kingdom 920 511 557 641 656 464 703 645
Netherlands #REF! #REF! #REF! #REF! #REF! #REF! #REF! #REF!Germany 2,366 1,398 1,245 1,301 1,224 1,181 1,734 1,781Belgium & Luxemburg 275 178 278 215 191 191 266 347France 568 371 400 397 406 453 544 707Denmark 50 38 44 58 45 41 74 74Ireland 25 31 66 42 42 45 107 81Italy 480 276 345 407 402 324 473 569Greece 19 25 15 18 16 16 22 28Portugal 2 2 2 2 2 2 2 5Spain 160 206 185 178 130 121 183 214
Total 27,337 24,003 33,515 30,962 31,289 32,551 46,525 57,701
Source: Central Bureau of Statistics.

Table 22. External Debt Outstanding, 1998-2005( US$ Million)
1998 1999 2000 2001 2002 2003 2004 2005 March June September December /c
External Debt 150,885 148,130 143,866 134,711 132,812 135,400 137,026 134,362 136,291 136,191 133,482
Government /a 67,315 75,752 74,892 69,403 74,497 80,909 80,734 77,675 76,770 75,709 74,893Bilateral 22,373 26,190 24,645 22,719 26,074 29,883 30,339 29,522 28,862 28,727 27,526Multilateral 26,048 30,294 31,507 29,030 29,112 29,977 28,905 27,970 27,290 26,659 26,452Export Credit Facility 15,645 16,106 15,741 14,888 16,605 18,397 18,022 17,260 16,711 16,364 15,899Leasing 874 775 602 439 369 302 225 207 194 171 140Commercial /b 2,375 2,387 2,397 2,327 2,337 2,350 3,243 2,716 3,713 3,788 4,876
Private 78,282 69,080 66,777 61,696 56,681 51,941 52,930 52,447 55,949 55,608 51,943Financial Institutions 12,835 11,872 8,870 7,713 7,641 7,536 8,212 8,419 10,049 10,538 6,970Banks 10,768 10,837 7,720 6,649 4,869 4,315 3,906 4,036 5,913 6,238 4,833
State owned banks 4,744 4,705 4,150 3,695 2,767 2,874 2,356 2,352 3,886 3,938 2,632 Domestic private banks 1,852 3,547 2,328 2,268 1,537 779 810 783 903 985 587 Joint venture banks 3,640 2,018 944 656 534 630 702 864 194 342 1,221 Foreign banks 532 567 298 30 31 32 38 37 930 973 393
Non-bank 2,067 1,035 1,150 1,064 2,772 3,221 4,306 4,383 4,136 4,300 2,137Non-Financial Institutions 65,447 57,208 57,907 53,983 49,040 44,405 44,718 44,028 45,900 45,070 44,973
Domestic Securities Owned by non-residents 5,288 3,298 2,197 3,612 1,634 2,550 3,362 4,240 3,572 4,874 6,646
Government 13 142 26 1,974 164 756 1,991 2,566 1,911 3,217 4,666Banks 42 12 2 0 0 1 4 4 5 9 15Non-bank Financial Institutions 5,233 3,144 2,169 1,638 1,470 1,793 1,367 1,670 1,656 1,648 1,965
/a Includes debt owed to IMF./b Since March 2004 include International bonds minus bonds holded by residence./c Preliminary
Source: Bank Indonesia.

Table 23. Domestic Debt Outstanding 1999-2005(Rupiah Trillion)
1999 2000 2001 2002 2003 2004 2005 March June September December
1 Guarantee Program/Other non-tradable bonds /a 218.3 218.3 218.3 218.3 218.3 218.3 218.3 218.3 218.3 218.3
2 Recapitalization Program 268.3 425.5 430.7 422.4 404.8 402.0 410.1 424.3 435.0 426.9Variable Rate 197.0 219.5 219.5 239.6 231.4 220.6 222.0 220.5 210.7 219.3Fixed Rate 51.3 179.4 175.5 154.7 159.0 178.7 186.7 184.5 189.2 187.1Hedge Bond 20.0 26.6 35.8 28.1 14.3 2.7 1.4 19.3 35.1 20.5
3 Credit Program /c 10.0 10.0 10.0 10.0 0.9 0.9 1.6 2.1 2.6 2.6
4 Total Outstanding - nominal 496.6 653.9 659.0 650.7 624.0 621.2 630.0 644.7 655.8 647.7Total Outstanding - Indexed Amount /b .. 660.9 681.9 696.5 697.0 652.5 668.0 .. .. ..
/a Government issued new bonds to replace old bonds after BLBI agreement, effective in August 2003./b Total outstanding (indexed amount) is calculated based on SIBOR rate for hedge bond, and based on CPI and SBI rate for other non-tradable bonds./c Before June 2003 Credit Program outstanding was stated as its upper utilization limit. .. : Data are not available.
Source: Ministry of Finance.

Table 24. Central Government Budget Summary, 2000-2006 /a (Rp. Billion)
<---------------------------------------- Actual ----------------------------------------> Budget
2000 2001 2002 2003 2004 2005 /d 20069 months
1. Domestic revenues /b 205,335 299,661 298,528 341,396 400,590 495,446 625,2382. Current expenditures 178,587 218,923 180,106 186,944 232,817 322,049 327,7163. Government saving (1-2) 26,747 80,738 118,422 154,452 167,773 173,398 297,5224. Development expenditures 38,611 41,585 37,325 69,247 60,979 36,854 99,8835. Regional Expenditure /c 0 81,054 98,204 120,314 130,045 150,516 220,069
6. Total Expenditure (2+4+5) 217,199 341,563 315,634 376,505 423,841 509,419 647,668
7. Primary Balance 38,204 45,241 64,015 30,241 39,099 43,679 54,1998. Overall Balance (3-4-5) -11,864 -41,902 -17,107 -35,109 -23,251 -13,972 -22,4309. Financing (9+10) 29,096 41,902 25,247 32,662 20,363 18,989 22,43110. Domestic 18,900 31,445 25,164 32,115 48,853 30,266 50,913 11 Foreign, net 10,196 10,457 83 548 -28,490 -11,277 -28,482
Program loan 849 6,416 7,170 1,792 5,059 12,265 9,900 Project loan 16,970 19,926 11,717 18,568 12,942 13,552 25,212
Amortization -7,623 -15,885 -18,804 -19,812 -46,491 -37,094 -63,595
Table 25. Central Government Budget Summary, Share of GDP, 2000-2006 /a (Percent of total)
<---------------------------------------- Actual ----------------------------------------> Budget
2000 2001 2002 2003 2004 2005 /d 20069 months
1. Domestic revenues /b 22.6 20.7 18.5 19.1 20.1 18.2 20.62. Current expenditures 19.6 15.1 11.2 10.5 11.7 11.8 10.83. Government saving (1-2) 2.9 5.6 7.4 8.6 8.4 6.4 9.84. Development expenditures 4.2 2.9 2.3 3.9 3.1 1.4 3.35. Regional Expenditure /c 0.0 5.6 6.1 6.7 6.5 5.5 7.2
6. Total Expenditure (2+4+5) 24 24 20 21 21 19 217. Primary Balance 4.2 3.1 4.0 1.7 2.0 1.6 1.88. Overall Balance (3-4-5) -1.3 -2.9 -1.1 -2.0 -1.2 -0.5 -0.79. Financing (9 + 10) 3.2 2.9 1.6 1.8 1.0 0.7 0.710. Domestic 2.1 2.2 1.6 1.8 2.5 1.1 1.7 11 Foreign, net 1.1 0.7 0.0 0.0 -1.4 -0.4 -0.9 Program loan 0.1 0.4 0.4 0.1 0.3 0.4 0.3 Project loan 1.9 1.4 0.7 1.0 0.7 0.5 0.8
Amortization -0.8 -1.1 -1.2 -1.1 -2.3 -1.4 -2.1
/a Starting in 2005, Government expenditure applied Unified budgeting where expenditure based on economic clasiffication./b Including grants./c Including Fund for Special Autonomy./d Starting from 2005 Budget, Development expenditure is capital expenditure + socialsn.a. = Not applicable
Source: Ministry of Finance.

Table 26. Central Government Revenues, 2000-2006 /a(Rp. Billion)
<------------------------------------------------ Actual ----------------------------------------------> Budget
2000 2001 2002 2003 2004 2005 2006 9 months
State Revenues and Grants 205,335 299,661 298,528 341,396 400,590 495,446 625,238
I. Domestic Revenues 205,335 299,183 298,528 340,928 400,334 494,150 621,6061. Tax Revenues 115,913 184,124 210,088 242,048 275,758 346,834 416,314
a. Domestic Taxes 108,884 174,557 199,512 230,934 263,016 331,595 399,322i. Income Taxes 57,073 94,576 101,873 115,016 118,923 175,380 210,714- Non-Oil & Gas 38,422 71,474 84,404 96,053 95,700 140,394 173,198- Oil & Gas 18,652 23,102 17,469 18,963 23,224 34,986 37,517ii. Sales tax (VAT) 35,232 55,957 65,153 77,081 98,683 101,295 128,308iii. Property taxes 4,456 5,246 7,828 10,905 14,652 19,614 21,008iv. Excises 11,287 17,394 23,189 26,277 29,172 33,256 36,520v. Other taxes 837 1,384 1,469 1,654 1,585 2,050 2,773
b. International Trade Taxes 7,028 9,567 10,575 11,114 12,742 15,239 16,992i. Import duties 6,697 9,026 10,344 10,885 12,444 14,921 16,573ii. Export taxes 331 541 231 230 298 318 419
2. Non Tax Receipts 89,422 115,059 88,440 98,880 124,576 147,317 205,292 a. Natural Resources Revenues 76,290 85,672 64,755 67,510 91,007 110,391 151,642
i. Oil 50,953 58,950 47,686 42,969 63,060 72,805 110,138ii. Gas 15,708 22,091 12,325 18,533 22,199 30,933 36,097iii. Public Mining 857 2,320 1,457 1,982 2,013 3,149 2,993iv. Forestry 8,719 2,243 3,130 3,715 3,412 3,239 2,000v. Fishery 53 68 157 312 324 265 414
b. Profits of Public Enterprises 4,018 8,837 9,760 12,617 9,818 12,779 23,278 c. Other Non-tax revenues (PNBP) 9,114 20,550 13,925 18,754 23,751 24,147 30,373
II. Grants 0 478 0 468 256 1,296 3,632
/a Government new format since 1999/2000 and applied to 1995/96 - 1998/99.
Source: Ministry of Finance.

Table 27. Central Government Expenditures, 2000-2006 /a(Rp. Billion)
Old budget format Unified budget format
<--------------------------------- Actual ---------------------------------> Budget Budget <------- Budget ------->2000 2001 2002 2003 2004 2005 /b 2006 2005 2006
9 months Approved Approved
Total Expenditures 217,199 340,862 315,634 376,505 423,841 509,419 647,668 Total Expenditures 397,769 647,668 I. Current Expenditures 178,587 218,923 180,106 186,944 232,817 322,049 327,716 I. Central Government Expenditure 266,220 427,598
1. Personnel expenditures 29,613 38,713 38,358 47,662 49,270 55,589 79,896 1. Personnel 60,744 79,896
2. Material expenditures 9,605 9,931 13,899 14,992 15,977 33,059 55,181 2. Material expenditure 34,039 55,181
3. Transfers to regions 16,010 0 0 0 0 0 0 3. Capital Expenditure 43,079 62,952
4. Interest Payments 50,068 87,142 81,122 65,351 62,351 57,651 76,629 4. Interest Payment 64,137 76,629 Domestic 31,238 58,197 62,261 46,356 39,554 43,496 48,611 Domestic 38,995 48,611 External 18,830 28,945 18,861 18,995 22,797 14,155 28,018 External 25,142 28,018
5. Subsidies 62,745 77,443 43,628 43,899 91,617 120,708 79,510 5. Subsidy 31,295 79,510 Petroleum subsidies 53,810 68,381 31,162 30,038 69,025 95,661 54,276 Oil Subsidy 19,000 54,276 Non-petroleum subsidies 8,936 9,063 12,466 13,861 22,592 25,047 25,234 Non-oil Subsidy 12,295 25,234
6. Other Current Expenditures 10,546 5,694 3,099 15,042 13,603 55,042 36,499 6. Grants expenditure - - 7. Social expenditure 17,107 36,931
II Development Expenditures 38,611 41,585 37,325 69,247 60,979 36,854 99,883 8. Other expenditures 15,820 36,499 1. Rupiah Financing 21,642 21,371 25,608 50,345 47,987 0 0 a. Capital transfer to region 12,796 0 0 0 0 0 0 II. Regional Expenditure 131,549 220,070 b. Central government budget 8,845 21,371 25,608 50,345 47,987 0 0 1. Balancing Funds 124,307 216,592 2. Project financing with foreign loan 16,970 20,214 11,717 18,902 12,992 0 0 a. Revenue sharing 31,218 59,358
b. General Allocation funds 88,766 145,664 IIIRegional Expenditure 0 80,354 94,657 111,070 123,190 143,301 216,592 c. Special allocation funds 4,323 11,570
1. Revenue sharing funds 0 20,008 24,884 31,370 36,985 49,829 59,358 2. Fund for Special Authonomy 7,243 3,477 2. General allocation funds 0 60,346 69,159 76,978 82,115 88,742 145,664 a. Special Authonomy Fund 1,775 2,913 3. Special allocation funds 0 0 613 2,723 4,089 4,730 11,570 b. Adjustment Fund 5,467 564
IVFund for Special Autonomy 0 0 3,548 9,244 6,855 7,215 3,477
/a Starting from 2005, Government expenditure applied Unified budgeting where expenditure based on economic clasiffication./b Starting from 2005 development expenditure is capital expenditure + grants + socials
Source: Ministry of Finance.

Table 28. Financial Vulnerability Indicators 1998-2005
1998 1999 2000 2001 2002 2003 2004 2005
A. Market Indicators Annual percent change in average exchange rate (-=appreciation) 244.2 -21.6 7.2 21.8 -9.3 -7.5 4.8 8.5Annual change in stock market index (%) -30.2 29.7 -9.0 -17.9 12.4 13.5 55.8 35.1B. Risk RatingsICRG composite (1-100, bad to good) /a 41.0 51.8 54.8 56.3 58.3 60.8 63.8 65.5ICRG Political Risk (1-100, bad to good) /a 42.0 47.0 43.0 45.5 48.5 51.5 52.5 59.5S&P Sovereign Long Term Foreign Debt Rating CCC+ CCC+ B- CCC CCC+ B B+ B+C. FinancialAnnual growth in real domestic credit (%) 20.2 15.1 14.7 -6.4 -5.3 0.0 12.8 1.8Foreign currency to total deposits (%) 25.0 21.2 22.9 20.5 18.4 15.4 15.0 16.7Non-perfm. loans of commercial banks (% of total) 23.0 32.8 18.8 12.1 8.1 8.2 5.8 8.3D. Reserve Cover Indicators Reserve cover of imports (months of imports) 6.9 8.7 7.0 7.0 7.7 7.8 5.9 4.9Reserves/M2 (%) 14.2 40.8 29.6 33.1 34.1 33.7 31.2 26.9E. PricesAnnual change in terms of trade (%) 5.4 -8.1 -1.4 -2.4 11.9 -13.7 -0.6 4.4Annual appreciation of REER (%) -51.1 43.6 -2.8 -5.5 21.4 6.0 -4.8 -1.3F. External Current account balance (% of GDP) 4.3 4.1 5.3 4.7 4.0 3.0 1.2 1.1External Debt (% of GDP) 158.1 105.8 85.9 81.1 64.4 55.7 53.8 47.4G. Fiscal sustainability indicators Total net public debt (% of GDP) /b 77.1 102.5 87.7 80.9 72.2 63.6 54.6 46.8Overall public sector balance (% of GDP) /c -2.0 -2.3 -1.3 -2.9 -1.1 -2.1 -1.0 -0.5Primary balance (Overall bal.-interest; % of GDP) 1.1 1.4 4.2 3.1 4.0 1.7 1.7 1.6
/a ICRG = International Country Risk Guide/b Including IMF loan .. : Data are not available.
Sources: World Development Indicator, International Financial Statistics, Bank Indonesia and Central Bureau of Statistics.

Table 29. Changes in Money Supply and Sources of Change, 1997-2006(Rp. Billion)
Public sector Money Supply Claims M2 /b
Net claims on official M1 QuasiNet on entities Claims on Net Total Currency Demand Money
End of foreign Central & public businesses & other Depositsperiod assets Government enterprises individuals items
1997 17,344 -16,486 5,031 132,031 -70,909 67,011 14,254 5,937 8,317 52,757
1998 73,692 17,513 6,389 93,032 31,112 221,738 22,854 12,970 9,884 198,884
1999 -12,581 425,287 /a -8,139 -291,550 -44,193 68,824 23,436 16,959 6,477 45,388
2000 81,637 123,060 -4,505 46,852 -146,221 100,823 37,553 14,018 23,535 63,270
2001 23,242 9,389 3,980 30,250 30,164 97,025 15,545 3,971 11,574 81,480
2002 16,721 -19,355 4,552 55,591 -17,654 39,855 14,208 4,344 9,864 25,647
2003 21,124 -31,338 1,198 76,301 4,499 71,784 31,860 13,856 18,004 39,924
2004 -8,173 19,006 .. 146,144 -81,974 77,836 30,019 14,723 15,296 47,817
2005 49,435 882 .. 121,898 -3,667 169,687 28,087 15,051 13,036 141,600
2006 /c 83,488 13,774 .. 92,858 -9,046 174,374 26,801 14,041 12,760 147,573
/a Includes effects of bank recapitalization./b M2 equals to M1 plus Quasi Money./c The change of March 2006 compared to March 2005.
Source: Bank Indonesia.

Table 30. Banking Credit Outstanding in Rupiah and Foreign Exchange by Economic Sector, 1998-2006 /a(Rp. Billion)
1998 1999 2000 2001 2002 2003 2004 2005 2006 /f
Agriculture 39,308 23,777 19,503 20,863 22,332 24,307 32,376 36,678 36,480 In rupiah 29,430 21,139 15,028 16,851 19,121 20,760 26,604 29,438 29,159 In foreign exchange 9,878 2,638 4,475 4,012 3,211 3,547 5,772 7,240 7,321
Mining /b 5,909 3,697 6,680 7,440 6,095 5,061 7,730 7,873 7,547 In rupiah 2,729 879 2,879 3,676 2,441 1,546 1,468 2,246 2,423 In foreign exchange 3,180 2,818 3,801 3,764 3,654 3,515 6,262 5,627 5,124
Manufacturing industry /c 171,668 84,259 106,782 116,525 121,035 123,125 143,603 169,678 163,090 In rupiah 85,594 35,561 35,697 50,434 64,986 67,323 77,299 98,096 97,762 In foreign exchange 86,074 48,698 71,085 66,091 56,049 55,802 66,304 71,582 65,328
Trade 96,364 43,288 44,099 48,450 65,978 84,257 111,035 134,108 136,483 In rupiah 59,830 29,687 30,601 38,491 56,854 74,787 97,988 121,216 123,235 In foreign exchange 36,534 13,601 13,498 9,959 9,124 9,470 13,047 12,892
Service rendering industry /d 139,124 43,161 44,316 49,061 60,983 89,129 107,858 134,943 132,263 In rupiah 101,129 26,332 23,784 30,696 44,581 68,007 86,046 110,100 110,596 In foreign exchange 37,995 16,829 20,532 18,365 16,402 21,122 21,812 24,843 21,667
Others 35,053 26,951 47,620 65,255 88,987 112,063 150,946 206,389 206,250 In rupiah 34,406 26,929 44,493 62,470 83,868 109,603 149,475 205,348 204,456 In foreign exchange 647 22 3,127 2,785 5,119 2,460 1,471 1,041 1,794
Total 487,426 225,133 269,000 307,594 365,410 437,942 553,548 689,669 682,113 In rupiah 313,118 140,527 152,482 202,618 271,851 342,026 438,880 566,444 568,631 In foreign exchange 174,308 84,606 116,518 104,976 93,559 95,916 114,668 123,225 113,482
/a Credit outstanding at the end of period. Includes investment credits, KIK and KMKP. Excludes interbank credits, credits to central government and to nonresidents, bridging finance credit, foreign exchange component of project aid, local cost of investment fund accounts, and credit extended to bank branches abroad./b Includes credits to Pertamina for repayment of foreign borrowing. /c Processing of agricultural products is classified under manufacturing industry according to ISIC 1968/d Credits for electricity, gas and water supply are included in service rendering industry sector./f Data in March 2006.
Source: Bank Indonesia.

Table 31. Banking Credit Outstanding in Rupiah and Foreign Exchange by Group of Banks, 1998-2006(Rp. Billion)
1998 1999 2000 2001 2002 2003 2004 2005 2006 /c
State banks 220,747 112,288 102,061 117,104 145,984 173,504 217,066 250,319 247,331 In rupiah 160,113 84,038 68,489 83,122 109,134 134,216 171,306 204,580 205,129 In foreign exchange 60,634 28,250 33,572 33,982 36,850 39,288 45,760 45,739 42,202
Private national banks /b 199,931 62,805 92,531 117,291 158,499 204,280 261,806 339,922 339,052 In rupiah 139,155 46,047 66,281 96,937 139,694 182,229 229,499 311,290 312,605 In foreign exchange 60,776 16,758 26,250 20,354 18,805 22,051 32,307 28,632 26,447
Foreign banks 66,748 50,040 74,408 73,199 60,927 60,508 74,676 99,428 95,730 In rupiah 13,850 10,442 17,712 22,559 23,023 25,581 33,075 50,574 50,897 In foreign exchange 52,898 39,598 56,696 50,640 37,904 34,927 41,601 48,854 44,833
Total 487,426 225,133 269,000 307,594 365,410 438,292 553,548 689,669 682,113 In rupiah 313,118 140,527 152,482 202,618 271,851 342,026 433,880 566,444 568,631 In foreign exchange 174,308 84,606 116,518 104,976 93,559 96,266 119,668 123,225 113,482
/a Credit outstanding at end of period. Includes investment credits. Excludes interbank credits, credits to Central Government and to non- residents, bridging finance credit, foreign exchange components of project aid, local cost of investment fund accounts and credits extended to bank branches abroad./b Includes regional government banks./c Data in March 2006.
Source: Bank Indonesia

Table 32. Commercial Banks' Outstanding Credits in Rupiah and Foreign Exchange by Type of Utilization, 1998-2006(Rp. Billion)
1998 1999 2000 2001 2002 2003 2004 2005 2006 /a
Investment 141,464 57,692 65,276 73,466 82,924 94,316 116,864 132,463 131,581 In rupiah 74,873 31,180 28,897 38,056 49,954 59,820 75,209 91,702 94,050 In foreign exchange 66,591 26,512 36,379 35,410 32,970 34,496 41,655 40,761 37,531
Working Capital 314,208 143,355 163,631 175,692 202,680 231,564 285,737 350,818 344,280 In rupiah 206,777 85,283 84,775 107,113 142,934 172,604 214,196 269,395 269,126 In foreign exchange 107,431 58,072 78,856 68,579 59,746 58,960 71,541 81,423 75,154
Consumption 31,754 24,086 40,093 58,436 79,805 112,063 150,946 206,389 206,250 In rupiah 31,468 24,064 38,809 57,449 78,962 109,603 140,715 206,389 206,250 In foreign exchange 286 22 1,283 987 843 2,460 10,231 0 0
Total 487,426 225,133 269,000 307,594 365,409 437,943 553,547 689,670 682,111
/a Data in March 2006.
Source: Bank Indonesia

Table 33. Commercial Banks' Outstanding Funds in Rupiah and Foreign Exchange by Group of Banks, 1997-2006 /a(Rp. Billion)
1997 1998 1999 2000 2001 2002 2003 2004 2005 2006 /b
DepositsState Banks 133,042 271,554 286,427 328,457 369,328 376,845 375,914 374,091 429,650 425,255Private Banks 177,193 235,605 252,880 279,037 305,455 338,590 382,610 423,281 485,474 477,045Regional Development Banks 8,796 10,932 14,017 19,896 37,088 45,937 53,291 59,834 85,578 96,675Foreign Banks 38,582 55,433 72,294 92,989 97,255 83,643 90,510 107,873 133,384 130,470Total 357,613 573,524 625,618 720,379 809,126 845,015 902,325 965,079 1,134,086 1,129,445
Share in Total DepositsState Banks 37 47 46 46 46 45 42 39 38 38Private Banks 50 41 40 39 38 40 42 44 43 42Regional Development Banks 2 2 2 3 5 5 6 6 8 9Foreign Banks 11 10 12 13 12 10 10 11 12 12Total 100 100 100 100 100 100 100 100 100 100
Annual Growth Rate in DepositsState Banks 47.1 104.1 5.5 14.7 12.4 2.0 -0.2 -3.0 14.9 16.6Private Banks 7.4 33.0 7.3 10.3 9.5 10.8 13.0 11.5 14.7 15.2Regional Development Banks 3.2 24.3 28.2 41.9 86.4 23.9 16.0 -4.6 43.0 50.5Foreign Banks 117.0 43.7 30.4 28.6 4.6 -14.0 8.2 22.9 23.6 10.4Total 26.9 60.4 9.1 15.1 12.3 4.4 6.8 5.4 17.5 17.5
/a Demand, time and savings deposits including non resident and central government accounts./b Data in March 2006.
Source : Bank Indonesia.

Table 34. Interest Rates, 1997-2006 (Percent)
Time Deposits Year Interbank State bank Private national bank
call money SBI 1 3 6 12 24 1 3 6 12 24/a /b month months months months months month months months months months
1997 27.8 14.5 17.7 17.9 15.3 15.5 15.4 22.0 21.0 17.4 17.2 16.9
1998 62.8 49.3 47.4 38.5 25.6 22.3 15.9 49.7 40.3 26.9 21.4 19.0
1999 23.6 23.1 23.3 25.8 25.2 27.8 17.2 23.7 25.9 24.6 25.4 21.8
2000 10.3 12.5 11.4 12.7 12.9 15.5 13.8 11.1 12.2 12.5 12.7 14.3
2001 15.0 16.6 14.9 15.6 15.3 14.3 16.9 14.5 15.3 14.8 12.9 16.4
2002 16.0 14.9 15.4 16.7 16.3 16.4 18.2 15.7 16.9 15.9 15.6 18.0
2003 7.5 9.9 9.6 10.4 11.4 12.9 17.0 9.7 10.9 11.9 12.7 16.4
2004 5.1 7.4 6.0 6.3 6.7 7.9 10.9 6.3 6.6 7.1 8.1 11.3
2005 7.6 9.2 8.0 8.0 7.8 8.1 8.8 8.3 8.2 7.9 7.9 9.7
2006 /c 13.6 12.7 11.7 11.9 11.6 12.1 12.6 12.1 12.3 11.8 11.4 12.1
/a Average rate of overnight interest rate on Interbank Call Money transactions recorded at the Jakarta Clearing House./b Average rate of Thirty days Bank Indonesia Certificate transactions. /c Average January-April 2006.
Source: Bank Indonesia.

Table 35. Principal Agricultural Products by Sub-sectors, 1998-2005(thousand tons)
1998 1999 2000 2001 2002 2003 2004 2005*
Food crops Paddy /a 49,200 50,855 51,899 50,461 51,490 52,138 54,088 54,056 Corn 10,169 9,204 9,677 9,347 9,654 10,886 11,225 12,014 Cassava 14,696 16,459 16,089 17,055 16,913 18,524 19,264 19,425 Sweet potato 1,935 1,666 1,828 1,749 1,772 1,991 1,902 1,840 Soya beans (shelled) 1,306 1,383 1,018 827 673 672 723 797 Peanuts (shelled) 692 660 737 710 718 786 837 838
Fishery Saltwater fish 4,012 4,010 4,126 4,276 4,377 4,692 4,651 .. Freshwater fish 930 1,046 1,081 1,125 1,172 1,224 1,469 ..
Cash crops Rubber 1,662 1,625 1,501 1,607 1,630 1,792 2,066 .. Coffee 515 532 624 570 682 664 635 .. Tea 157 132 163 167 165 170 165 .. Cane Sugar 2,065 1,908 1,896 1,726 1,755 1,634 2,172 .. Tobacco 104 135 143 199 192 201 167 .. Palm oil 5,640 5,999 6,553 8,396 9,622 10,440 11,807 .. Palm kernel 778 915 931 1,675 1,831 1,978 .. ..
Forestry /b Log 19027 20,620 13,798 10,051 8,660 11,424 13,549 .. Sawn Timber 2707 2,060 2,790 675 623 763 433 .. Plywood 7155 4,612 4,443 2,101 1,694 6,111 4,514 ..
/a Dry husk paddy grain ready for milling. /b In thousand cubic meters, and in GOI FY -April to March until the year 1999, and April to December in FY 2000.* Preliminary figures.. : Data are not available
Source: Central Bureau of Statistics, Ministy of Marine affairs and Fisheries, Ministry of Agriculture, and Ministry of Forestry.

Table 36. Rice-Area Harvested, Production and Yield, 1997-2006
Area Average Paddy Rice Year harvested yield output output /a Growth
(thousand ha) (tons/ha) (thousand tons) (thousand tons) (%)
1997 11,141 4.4 49,377 32,095 -3.4
1998 11,716 4.2 49,237 32,004 -0.3
1999 11,963 4.3 50,866 33,063 3.3
2000 11,793 4.4 51,899 33,734 2.0
2001 11,499 4.4 50,460 32,799 -2.8
2002 11,521 4.5 51,490 33,468 2.0
2003 11,488 4.5 52,138 33,889 3.3
2004 11,923 4.5 54,088 35,158 5.0
2005/b 11,819 4.6 54,056 35,137 -0.1
2006/c 11,831 4.6 54,255 35,266 0.4
/a Estimated on the basis of a conversion factor of 0.65 from paddy into rice./b Preliminary/c First forecast
Source: Central Bureau of Statistics.

Table 37. Selected Indicators of Real Sector Development, 1998-2006
1998 1999 2000 2001 2002 2003 2004 2005 2006
Electricity Consumption (Million KWH) 59,614 65,045 72,546 77,428 87,089 89,780 99,111 105,987 26,878 Jan-March 2006Social 1,323 1,360 1,520 1,662 1,843 2,021 2,224 2,413 612 Household 22,751 24,535 27,857 30,288 33,994 35,541 38,322 40,904 10,456 Business 7,938 8,514 9,345 9,976 11,845 12,584 14,129 15,608 3,992 Industry 25,472 28,522 31,388 33,073 36,831 36,361 40,057 42,166 10,606 Public 2,131 1,224 1,905 2,193 2,715 2,920 3,627 3,874 1,012
Cement Sales (Thousand ton) 19,307 19,294 11,017 11,215 11,872 11,974 13,403 14,277 4,508 Jan-April 2006Cement Consumption (Thousand ton) 19,243 18,770 22,384 25,388 27,192 27,540 30,045 31,471 9,332
Car Sales (Units) 430,948 487,356 864,146 1,575,788 2,287,464 2,770,184 3,887,675 5,076,943 1,144,900 Jan-April 2006
Motorcycle Sales (Units) 58,011 94,003 298,391 299,629 317,794 354,333 483,295 533,910 102,245 Jan-April 2006
Tourist arrival (Persons) /a 3,509,298 3,672,741 3,898,458 3,908,882 4,091,289 3,690,852 4,541,165 4,074,355 1,201,344 Jan-April 2006
Cargo Loaded and Unloaded (Million ton)Loaded International 21.9 12.5 8.2 12.0 9.8 10 12 14 3 Jan-Feb 2006Loaded Domestic 9.0 9.0 7.3 11.5 14.6 17 19 21 3 Jan-Feb 2006Unloaded International 20.8 17.7 15.9 18.8 19.7 19 20 20 3 Jan-Feb 2006Unloaded Domestic 27.7 27.8 29.1 35.7 41.1 43 42 41 6 Jan-Feb 2006
/a based on the thirteen main gates of arrival.
Source: Central Bureau of Statistics, State Electricity Corporation, Cement Associations.

Table 38. Fuel Production by Company, 1997-2005 (thousand bbls)
Crude Oil Condensate Natural gas (000 MSCF)Pertamina Production sharing Pertamina Production sharing Pertamina Production sharing
Contract Contract Contract
1997 31,423 454,159 95 59,034 340,451 2,825,291
1998 43,090 438,565 518 55,327 338,012 2,641,448
1999 41,161 400,184 209 53,972 327,584 2,740,238
2000 45,683 419,700 720 51,401 347,662 2,559,665
2001 46,119 395,766 317 47,944 342,594 2,460,639
2002 44,600 365,811 100 48,003 332,868 2,698,162
2003 41,510 328,247 94 48,743 342,869 2,799,737
2004 41,043 312,435 86 46,998 383,872 2,646,151
2005\a 13,681 99,351 28 15,268 129,309 843,492
\a January - April
Source: Ministry of Mines and Energy.
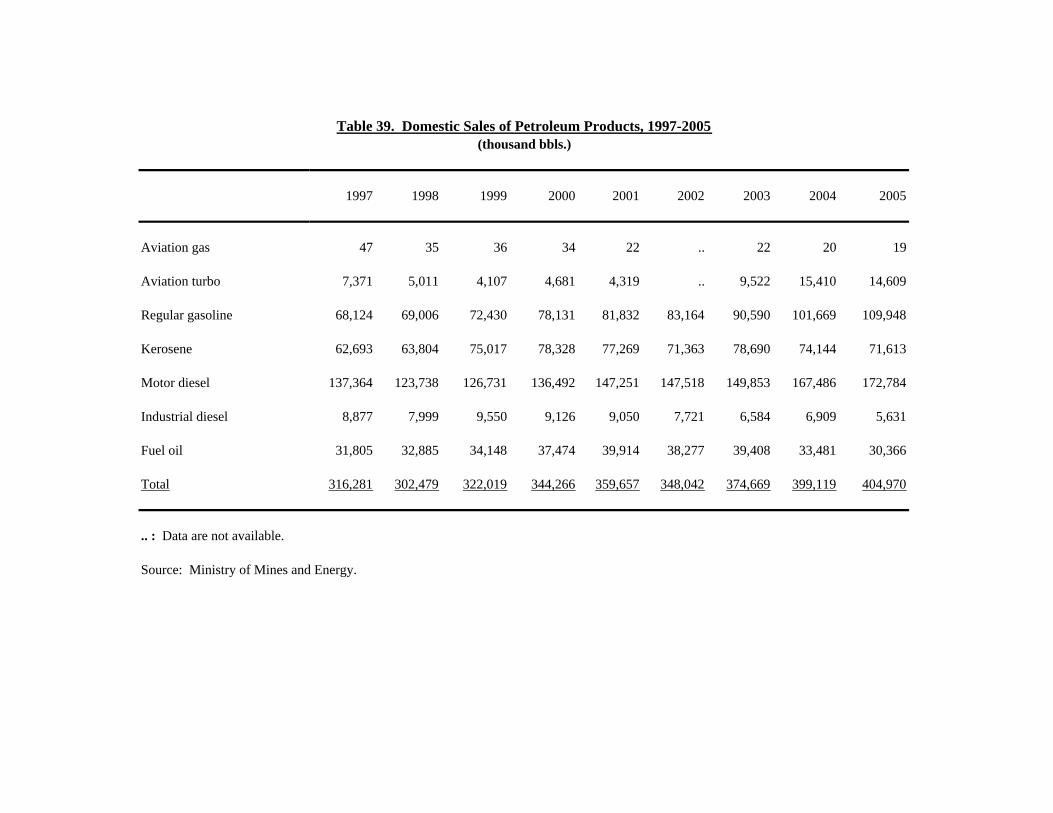
Table 39. Domestic Sales of Petroleum Products, 1997-2005(thousand bbls.)
1997 1998 1999 2000 2001 2002 2003 2004 2005
Aviation gas 47 35 36 34 22 .. 22 20 19
Aviation turbo 7,371 5,011 4,107 4,681 4,319 .. 9,522 15,410 14,609
Regular gasoline 68,124 69,006 72,430 78,131 81,832 83,164 90,590 101,669 109,948
Kerosene 62,693 63,804 75,017 78,328 77,269 71,363 78,690 74,144 71,613
Motor diesel 137,364 123,738 126,731 136,492 147,251 147,518 149,853 167,486 172,784
Industrial diesel 8,877 7,999 9,550 9,126 9,050 7,721 6,584 6,909 5,631
Fuel oil 31,805 32,885 34,148 37,474 39,914 38,277 39,408 33,481 30,366
Total 316,281 302,479 322,019 344,266 359,657 348,042 374,669 399,119 404,970
.. : Data are not available.
Source: Ministry of Mines and Energy.

Table 40. Consumer Price Index, 1997-2006 /a(2002 = 100) /b
1997 1998 1999 2000 2001 2002 2003 2003 2004 2005 2006 /c
Percentage change of CPI (%) 6.1 58.5 20.5 3.7 11.5 11.9 6.7 6.8 6.1 10.5 14.0
Index
General CPI 106.1 168.2 202.8 210.3 234.5 262.3 279.6 106.8 113.2 125.1 139.4Foodstuff 108.7 209.2 261.5 249.0 270.0 299.3 301.7 100.8 106.8 117.4 132.3Prepared food and beverages 105.2 173.9 215.9 229.5 261.5 292.9 317.5 108.6 113.0 122.8 134.0Housing 105.5 141.7 164.8 175.2 196.2 224.8 249.3 111.8 120.5 131.4 143.5Clothing 104.2 191.7 230.7 245.3 267.8 280.3 292.4 104.4 110.2 116.4 123.1Health 108.5 179.5 218.1 229.9 255.5 272.4 287.9 106.1 111.0 116.2 122.0Education 109.1 147.0 165.3 183.9 211.4 235.6 260.6 108.5 119.1 130.4 136.7Transport. & Communications 103.7 145.1 169.4 182.8 208.1 245.2 262.5 106.7 111.8 134.6 165.6
Food 107.2 193.9 241.7 240.5 266.3 296.5 308.6 104.1 109.4 119.7 133.0 o/w Rice 112.2 233.4 292.8 260.2 273.3 330.9 332.1 .. .. .. ..Non-Food 105.7 152.0 177.7 190.5 213.8 240.7 261.7 108.9 116.3 129.3 144.5
/a Consumer price index average of the year./b CPI 1997-2003 applying CPI index based on 1996=100/c CPI Average January - May 2006
Source: Central Bureau of Statistics.

Table 41. Wholesale Price Index, 1998-2006 /a(1993 = 100)
Sectors /b 1998 1999 2000 2001 2002 2003 2004 2005 2006 /c
Agriculture (40) 299 410 459 567 614 614 634 680 753
Mining & quarrying (8) 173 214 236 275 307 328 345 395 461
Manufacturing (1183) 217 268 278 309 339 355 369 422 494
Imports (50) 286 289 316 356 345 346 380 434 460
Exports (46) 417 366 461 521 497 505 591 742 783 Excluding petroleum & gas (43) 444 370 393 462 450 442 477 526 546 Petroleum and gas (3) 348 355 634 669 615 666 881 1,287 1,382
General index (327) 288 314 353 403 414 423 459 534 588 General index excluding exports of petroleum (324) 284 311 333 384 400 406 429 481 533
/a Figures show the average for the year./b Figures within brackets ( ) under sector column indicate number of items represented in that sectors./c Index of average January - March 2006
Source: Central Bureau of Statistics.

Table 42. Domestic Prices of Petroleum Products, 1998-2006(Rp./liter)
May-1998 Oct-2000 Jun-2001 Mar-02 Jun-02 Sep-02 Dec-02 Mar-03 Jun-03 Sep-03 Dec-03 Mar-04 Jun-04 Sep-04 Dec-04 Mar-05 Jun-05 Sep-05 Dec-05 Mar-06 Jun-06Sep-2000 Jun-2001 Jan-2002
Regular gasoline 1,000 1,150 1,450 1,550 1,750 1,690 1,750 1,810 1,810 1,810 1,810 1,810 1,810 1,810 1,810 2,400 2,400 2,400 4,500 4,500 4,500
Kerosene Retail Market Price .. .. 1,640 1,690 1,900 1,840 2,030 2,200 1,800 1,980 2,030 1,800 1,800 1,800 1,800 2,200 2,200 5,600 6,480 5,748 6,182 Industrial consumption 280 350 820 1,270 1,410 1,390 1,530 1,800 1,800 1,800 1,800 2,100 2,100 2,100 2,100 2,730 4,940 5,600 6,480 5,748 6,182 Household consumption 280 350 400 600 600 600 600 700 700 700 700 700 700 700 700 700 700 700 2,000 2,000 2,000
Automotive Diesel Oil Industrial consumptions 550 600 1,510 1,580 1,900 1,810 2,060 2,100 1,820 1,910 2,050 2,100 2,100 2,100 2,100 2,700 2,700 4,740 5,350 5,273 6,288 Transportation consumptions 550 600 900 1,150 1,400 1,360 1,550 1,650 1,650 1,650 1,650 1,650 1,650 1,650 1,650 2,100 2,100 2,100 4,300 4,300 4,300 Industrial diesel Oil Retail Market Price 350 400 600 1,500 1,870 1,780 2,000 2,050 1,790 1,880 1,990 2,050 2,050 2,050 2,050 2,660 4,560 5,130 5,940 4,900 5,789 Small scale industries 350 400 600 1,120 1,390 1,340 1,510 1,650 1,650 1,650 1,650 1,650 1,650 1,650 1,650 2,300 2,300 2,300 2,300 4,300 4,300
Fuel oil (MFO) Market Price 350 350 400 1,280 1,550 1,540 1,490 1,600 1,560 1,600 1,560 1,600 1,600 1,600 1,600 2,300 2,900 3,150 3,870 3,603 3,745 Small scale industries 350 350 400 1,030 1,110 1,150 1,120 1,600 1,560 1,560 1,560 1,560 1,560 1,560 1,560 2,160 2,360 2,600 2,600 2,600 2,600
Source: Ministry of Mines and Energy and Pertamina

Table 43. Approved Foreign Direct Investment by Sector, 1998-2006 /a(US$ million)
Sector 1998 1999 2000 2001 2002 2003 2004 2005 2006 /b
Agriculture 965 413 390 367 446 125 197 462 151
Forestry 0 9 5 20 9 95 0 129 0
Fishery 33 70 50 6 4 27 133 16 48
Mining & quarrying 0 14 1 118 49 18 66 776 97
Manufacturing 8,388 6,335 9,597 5,145 3,206 6,464 6,332 6,028 1,514 Food 342 681 701 289 268 409 719 643 395 Textiles & leather 217 240 401 330 90 127 408 140 35 Wood & wood products 71 113 157 21 14 34 20 87 24 Paper & paper products 41 1,412 88 742 10 1,300 67 228 5 Chemicals & Pharmaceutica 6,179 3,267 7,375 2,310 1,872 3,035 3,414 2,879 305 Nonmetallic minerals 237 110 10 108 33 711 38 368 123 Basic metals 394 501 831 652 347 326 1,014 695 443 Others 17 10 35 693 573 523 653 989 184
Electricity, Gas and Water 37 85 363 276 23 93
Construction 198 153 161 48 288 858 954 1,777 789
Hotels and Restaurant 451 229 257 6,892 255 492 587 259 37
Transport & communications 79 103 1,217 374 3,713 4,333 587 3,107 58
Real estate 1,271 171 302 178 7 10 340 125 4
Others 2,171 3,396 3,305 1,861 1,683 837 804 878 353
Total 13,557 10,892 15,284 15,043 9,744 13,621 10,275 13,579 3,144
/a Figures refer to intended capital investments, and represent original approvals plus approved expansion minus cancellations./b Investment January-April 2006
Source: Investment Coordinating Board.

Table 44. Approved Domestic Investment by Sector, 1998-2006 /a(Rp billion)
Sector 1998 1999 2000 2001 2002 2003 2004 2005 2006 /b
Agriculture, fishery and livestock 4,821 1,586 1,543 991 1,454 1,752 1,908 4,354 2,602
Forestry 543 749 52 446 0 177 0 140 0
Mining 116 30 36 1,140 787 753 662 982 10
Manufacturing 44,903 94,335 81,994 43,966 15,853 40,464 20,982 26,808 6,078 Food Industry 6,712 12,676 8,548 11,109 4,968 4,247 10,211 8,073 3,906 Textile Industry 1,138 2,524 2,386 2,223 440 2,133 1,477 710 106 Wood Industry 1,967 818 169 553 24 9 2 28 4 Paper Industry 12,754 22,838 8,192 553 409 560 121 665 151 Chemical Industry 15,459 2,431 56,436 22,337 165 147 1,741 6,479 249 Non Metallic Mineral 3,535 61 3,523 596 217 932 314 3,904 646 Metal, Maschinery, Electronics 961 1,050 2,466 375 7,179 1,003 1,160 1,339 456 Other Industry 3,339 52,987 2,740 6,596 9,631 32,436 7,117 6,949 560
Electricity, Gas and Water .. .. .. 0 5 466 8,420 6,276 4,594
Construction 1,998 395 843 2,007 1,500 1,774 1,483 1,538 118
Hotels 1,109 1,713 154 2,459 683 930 552 4,050 344
Real estate 900 996 293 4,501 255 1 0 0 0
Transportation and Communication 3,260 146 1,588 1,489 3,118 2,022 1,885 2,375 31
Others 3,098 1,210 1,639 1,675 1,517 1,088 854 4,054 19,725
Total 60,748 101,160 88,143 58,673 25,172 49,427 36,748 50,577 33,502
/a Figures refer to intended capital investments, and represent original approvals plus approved expansion minus cancellations./b Investment January-April 2006.. : Data are not available.
Source: Investment Coordinating Board.

Table 45. Investment Climate Indicators, 1998-2006
1998 1999 2000 2001 2002 2003 2004 2005 2006
Private Investment EnvironmentPrivate Investment/Gross Domestic Fixed Investment (%) /a 67.5 68.8 72.1 71.4 69.0 65.4 75.7 79.4 ..Credit to Private Sector (stock, % GDP) /b 39.1 13.4 12.2 11.7 11.7 12.0 12.8 13.0 12.0 March 2006Real lending Rate /c -25.9 6.9 14.7 8.5 5.4 8.3 8.6 3.8 2.0 March 2006Highest Marginal Corporate Tax Rate (%) 30.0 30.0 30.0 30.0 30.0 30.0 30.0 30.0 30.0ICRG Composite Risk Rating /e 41.0 51.8 54.8 56.3 58.3 60.8 6.4 65.5 67.0 April 2006
Governance /dICRG Corruption Rating (1-6, bad to good) /e 1.0 2.0 1.0 1.0 1.0 1.0 1.0 1.0 2.5 April 2006ICRG Bureaucratic Quality Rating (1 - 6) /e 2.0 3.0 3.0 2.0 2.0 2.0 2.0 2.0 2.0 April 2006ICRG Law and Order (1 - 6) /e 2.0 2.0 2.0 2.0 2.0 2.0 3.0 3.0 3.0 April 2006Corruption Perception Index (0-10, bad to good) 2.0 1.7 1.7 1.9 1.9 1.9 2.0 2.2 ..
OpennessTrade (imports+exports)/GDP (%) 96.2 62.9 71.4 68.2 57.8 52.9 59.5 62.7 54.6 Q1 2006FDI inflows (net, % GDP) -0.4 -2.0 -3.0 -2.3 0.1 -0.3 0.4 0.8 ..WTO Member? yes yes yes yes yes yes yes yes yesWeighted Mean Tariff (%) /f 8.3 8.1 7.6 6.7 6.9 6.8 8.6 8.7 8.5Heritage Trade Policy Index (1-5, bad to good) 2.0 2.0 3.5 3.5 3.0 3.0 3.0 2.5 ..
InfrastructurePaved Roads, % of total 47.3 57.1 57.1 58.9 57.6 58.3 .. .. ..Motor vehicles (per 1000 persons) 87.8 89.5 92.0 100.1 108.5 118.7 133.2 158.2 ..Telephone lines and cellular subscribes per 100 inhabitants 3.3 4.0 5.0 6.6 9.2 12.7 18.0 22.6 ..Internet Users (per 10,000 people) 32.2 61.7 97.0 191.4 212.4 376.4 666.8 846.0 ..Electricity consumption (kwh per capita) 325.4 352.4 383.8 370.4 408.4 418.2 455.5 499.9 ..
Wages and ProductivityMinimum Wage (US$ per year) 180 266 314 341 485 581 617 624 749 Value Added Per Worker in Manufacturing (US$ per year) 2,402 3,160 3,933 4,083 4,911 6,000 6,436 6,773 ..Labor Force with Secondary Education (% of total) 18.4 23.7 24.1 35.2 41.4 45.4 45.9 46.2 ..
/a Private investment includes state enterprises./b Since 2000 GDP based on National accounts 2000 Base./c Average Annual /d Governance indicators produced by Transparency International, Heritage Foundation, and also from Kaufmann et al (2001)./e ICRG= International Country Risk Guide. /f Weighted by total tariff line.. : Data are not available.
Source: World Development Indicators, United Nations, Central Bureau of Statistics, and Staff Calculations