Embed Size (px)
Citation preview
Journal of Mechatronics and Intelligent Manufacturing ISSN: 1949-4904 Volume 2, Issue 1/2 © 2011 Nova Science Publishers, Inc.
INVESTIGATIONS ON MATERIAL REMOVAL RATE IN WIRE ELECTRICAL DISCHARGE TURNING (WEDT)
USING PULSE TRAIN DATA ANALYSIS
V. Janardhan and G. L. Samuel∗ Indian Institute of Technology Madras, Adyar,
Chennai, Tamil Nadu – 600036, India
ABSTRACT
In the present work, an experimental setup for Wire Electrical Discharge Turning (WEDT) process is developed. The setup consists of a spindle which is designed to meet the accuracy requirements of the process. The pulse train data is analyzed to investigate the influence of various process parameters like pulse off time, rotational speed and flushing pressure on Material Removal Rate (MRR). A data acquisition system for acquiring the pulse train data during WEDT process is developed. A computer based pulse discrimination algorithm is proposed in the present work for offline analysis of the WEDT characteristics. Using the algorithm the pulses are classified into open, normal (spark), arc and short circuit pulses. Based on the pulse classification results, the MRR for WEDT and 2D profile cutting with Wire Electrical Discharge Machining (WEDM) has been compared by varying different parameters. It is observed that the pulse off time is the most significant parameter influencing MRR. From the pulse classification results, it is observed that the arc pulses increased during WEDT compared to WEDM process.
Keywords: Wire Electrical Discharge Turning (WEDT), Pulse Train Data Analysis, Material Removal Rate (MRR).
1. INTRODUCTION Electrical discharge machining (EDM) is a nontraditional machining process widely used
to produce dies and moulds. Wire Electrical Discharge Machining (WEDM) is a special form of the EDM process in which the tool is a continuously moving conductive wire electrode. Material is eroded from the workpiece by a series of discrete electrical sparks between the workpiece and the wire electrode (tool) in the precense of a thin film of dielectric fluid which ∗ Corresponding author: Phone: 91-44-2257-4699, Fax: 44-2257-4652; E-mail: [email protected]
V. Janardhan and G. L. Samuel 18
is continuously fed to the machining zone to flush away the eroded particles. Due to its wide capabilities, it has applications in various fields such as automobile, aerospace, medical and virtually all areas of conductive materials machining (Spedding and Wang, 1997). Turning with WEDM is one of the emerging areas, developed to generate cylindrical form on hard and difficult to machine materials.
A rotary axis is added to the WEDM for generating cylindrical and axisymmetric forms. The idea of using WEDM to machine cylindrical parts has been reported by Masuzawa and Tonshoff (1997), to manufacture small-diameter pins and shafts of diameter 5μm. Machining of automobile components like diesel injector plunger with WEDM has been carried out (Qu. et al., 2002). The application of WEDM for Truing of metal bond diamond wheels used for ceramic grinding is reported by Rhoney et al., (2002). Takayuki et al (2004), machined axisymmetric and arbitrary shapes on insulating ceramics.
Qu et al., (2002) compared the Material Removal Rate (MRR) in case of WEDM and cylindrical WEDM (called as WEDT in the present work) and derived a mathematical model for material removal rate for cylindrical WEDM. Mohammadi et al., (2008) studied effect of machining parameters like power, time off, open circuit voltage, servo, wire tension, wire speed and rotational speed on MRR in WEDT and the influence of machining parameters on MRR is mathematically modeled using regression analysis method. Haddad and Tehrani (2008) developed a mathematical relation between the MRR and machining parameters using response surface methodology.
Qu et al., (2002) reported that the maximum MRR in cylindrical WEDM is greater than WEDM and mentioned that the possible cause for increase in MRR is due to better flushing conditions. Mohammadi et al., (2008) reported that MRR is inversely proportional to the rotational speed and the same is also confirmed by Haddad and Tehrani (2008). It is observed from the literature that the flushing condition and spindle rotational speed affect the MRR. The material removal process of WEDM involves complex and time-varying characteristics. Accurate analysis of the material removal mechanism is difficult. MRR depends mainly on the discharges occurring at the spark gap which are influenced by the machining parameters.
The electric spark discharges are random in nature and depends on the debris condition at the spark gap (Kunieda et al., 2005). A clear understanding of the discharges occurring at the spark gap can be possible with pulse train analysis. Pulse train analysis includes classification of discharges occurring at the spark gap. This analysis is generally used in adaptive control of EDM and WEDM to improve the efficiency. To meet this objective various researchers have followed different strategies. The monitoring of EDM and WEDM has been carried out using different sensing parameters like ignition delay time, gap impedance during pulse interval, average feed rate, frequency of occurrence of arcs and occurrence of various pulse types (Snoeys et al., 1980). Dauw et al., (1983) classified the discharge pulses into fifteen types with the help of voltage and time reference levels. A general layout of the pulse analyzing system is mentioned by Jennes et al., (1984). Watanabe et al., (1990) classified the discharge pulses into three categories; normal, deion and arc according to the discharge profile. This method is used for off-line process optimization. Yan and Liao (1996) discriminated the pulses into normal and arc pulses based on ignition delay as a sensing parameter; Liao and Woo (1997) developed a pulse discriminating system to analyze the relationship between the machining settings and pulse trains in WEDM. Tarng et al (1997) classified the pulses in EDM based on the features of the measured gap voltage and gap current by using a fuzzy set
Investigations on Material Removal Rate in WEDT… 19
theory. Yan and Chien (2007) developed a computer-aided pulse discriminating and control system based on the characteristics of the gap voltage wave form.
Classification of different pulse types requires a pulse discriminating system. Pulse discriminating systems are usually designed to improve the efficiency of the WEDM process and to prevent wire breakage by varying the parameters online. Discriminating the pulses based on the voltage waveform data alone requires complicated logic. Pulse discrimination with the help of a computer based algorithm for offline analysis of the process using voltage and current wave form data has not been mentioned in the literature.
In the present work a spindle is fabricated to meet the requirements of the Wire Electrical Discharge Turning (WEDT) process. The pulse train data is collected with the help of a pulse train data acquisition system developed. A pulse discrimination algorithm has been proposed based on the voltage, current and time data obtained from data acquisition system. With the pulse discrimination algorithm the pulses are classified into four types; open, normal (spark), arc and short circuit pulses for off line analysis of the WEDT characteristics with various process parameters. In the present work the variation in MRR with pulse of time, flushing pressure and rotational speed for WEDT is investigated using the pulse classification results and compared with the MRR of WEDM.
2. SPINDLE FOR WEDT PROCESS Precision spindle is the key subsystem for WEDT process as it has to provide accurate
rotary motion to the workpiece. The components of the subsystem need to have good corrosion resistance as they come in contact with dielectric fluid. It should have good electrical connectivity for the flow of high electrical current from the rotating workpiece to the ground to enable spark to occur. The spindle should have high rotational accuracy, runout less than 10 μm (Qu et al. 2002), to maintain the gap between the workpiece and wire consistently. The spindle should also be capable of holding workpieces of different diameters and should rotate it at different speeds.
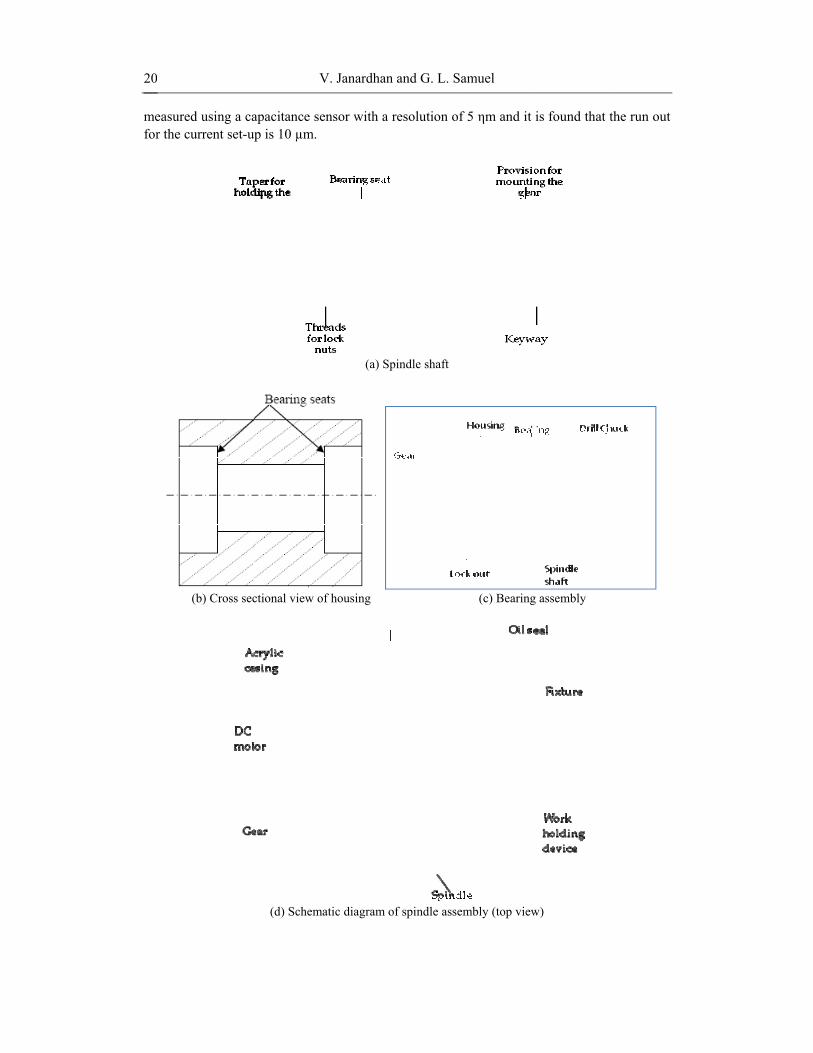
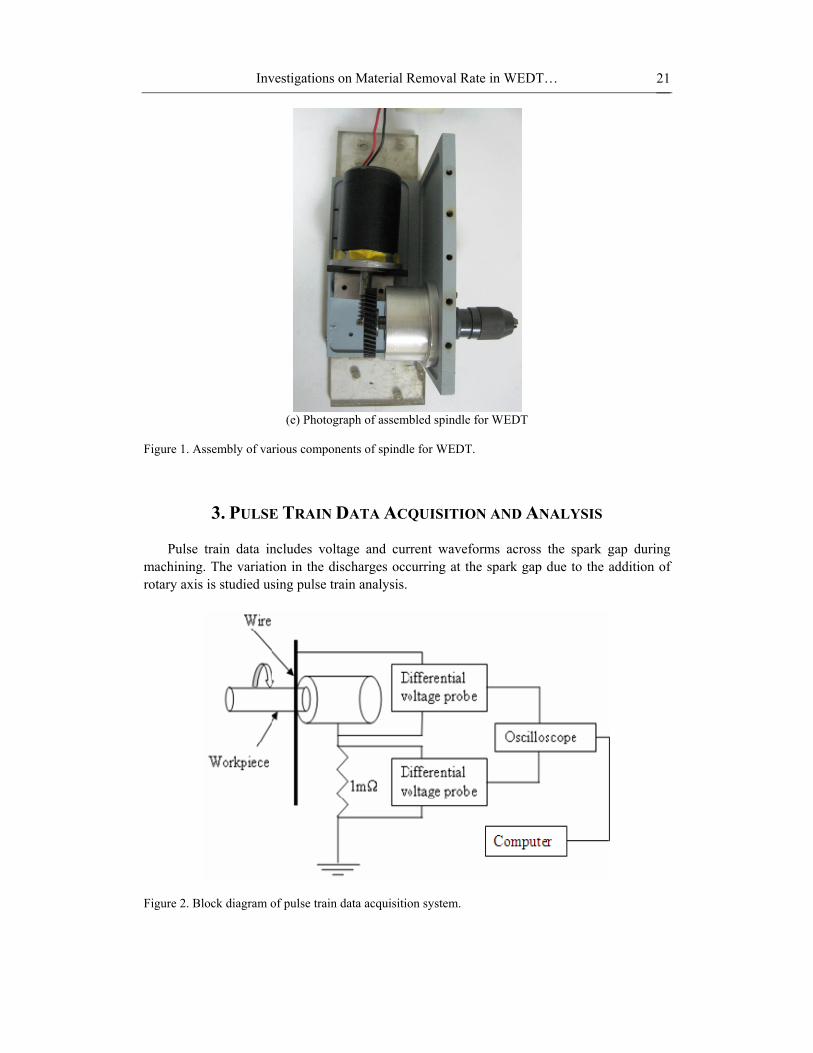
The spindle consists of components such as DC motor, spindle shaft, bearings, keyless drill chuck, housing and an L-section that acts as a fixture. The speed of the DC motor is controlled with a regulated DC power supply. A double start helical thread is provided on the motor shaft and is mated with a gear. The gear is made up of plastic to provide insulation to the motor. With this gear arrangement, the speed of the workpiece can be varied from 4 to100 rpm. The spindle shaft is machined from SAE 316 steel and it is shown in Figure 1(a). It has provision for attaching drill chuck, gear, locknut and mounting the bearings as shown in Figure 1(a). Two angular contact ball bearings are used for holding the spindle as they are generally preferred for precision machine tool spindles. Housing is made of aluminum and its cross sectional view is shown in Figure 1(b). Spindle shaft and bearings are assembled into the housing and locknuts are used for preventing the motion of the bearings as shown in Figure 1(c). The bearing assembly and motor are fixed to the L-section. An acrylic cover with an oil seal is used for protecting the components of the spindle assembly during dielectric flushing. A schematic diagram and the actual photograph of assembled spindle with various components are shown in Figures 1(d) and 1(e). After the assembly the spindle run out is
20
mfo
0
measured usingor the current s
(b) Cro
g a capacitancset-up is 10 µm
ss sectional vie
(d) Sch
V. Janardh
e sensor with m.
(a)
ew of housing
hematic diagram
an and G. L. S
a resolution o
Spindle shaft
m of spindle ass
Samuel
of 5 ηm and it
(c) Bearing
sembly (top view
is found that
g assembly
w)
the run out
Investigations on Material Removal Rate in WEDT… 21
(e) Photograph of assembled spindle for WEDT
Figure 1. Assembly of various components of spindle for WEDT.
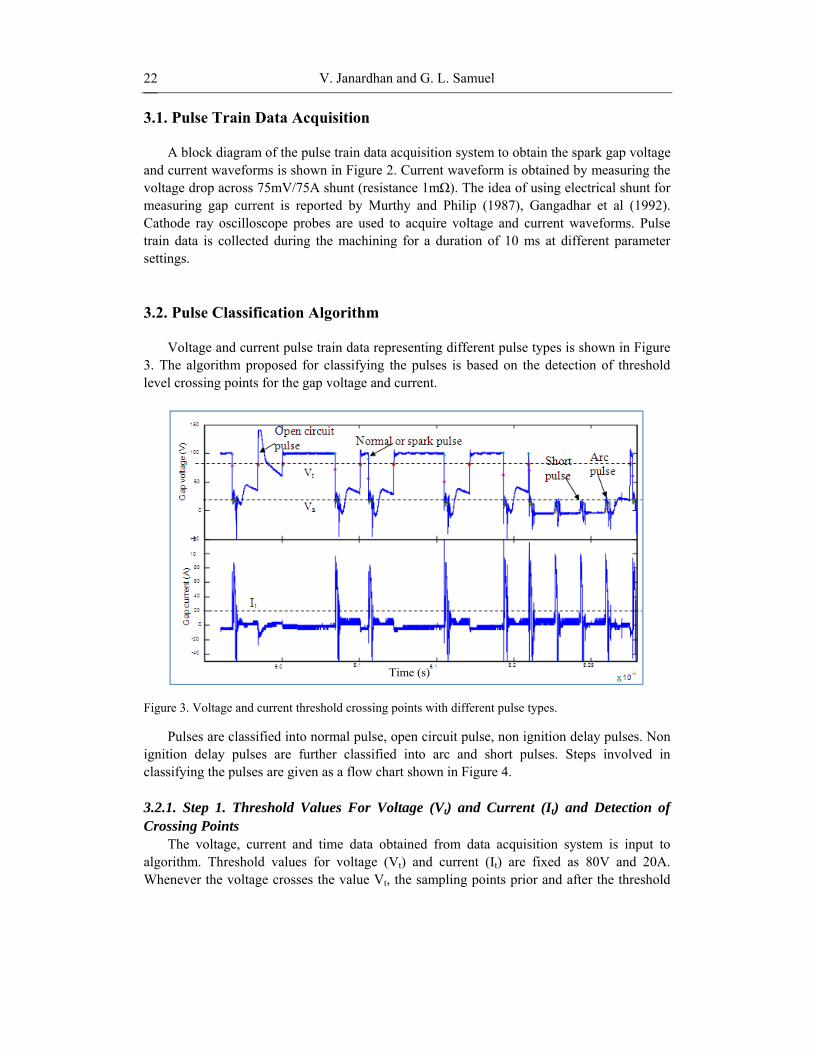
3. PULSE TRAIN DATA ACQUISITION AND ANALYSIS Pulse train data includes voltage and current waveforms across the spark gap during
machining. The variation in the discharges occurring at the spark gap due to the addition of rotary axis is studied using pulse train analysis.
Figure 2. Block diagram of pulse train data acquisition system.
V. Janardhan and G. L. Samuel 22
3.1. Pulse Train Data Acquisition A block diagram of the pulse train data acquisition system to obtain the spark gap voltage
and current waveforms is shown in Figure 2. Current waveform is obtained by measuring the voltage drop across 75mV/75A shunt (resistance 1mΩ). The idea of using electrical shunt for measuring gap current is reported by Murthy and Philip (1987), Gangadhar et al (1992). Cathode ray oscilloscope probes are used to acquire voltage and current waveforms. Pulse train data is collected during the machining for a duration of 10 ms at different parameter settings.
3.2. Pulse Classification Algorithm Voltage and current pulse train data representing different pulse types is shown in Figure
3. The algorithm proposed for classifying the pulses is based on the detection of threshold level crossing points for the gap voltage and current.
Figure 3. Voltage and current threshold crossing points with different pulse types.
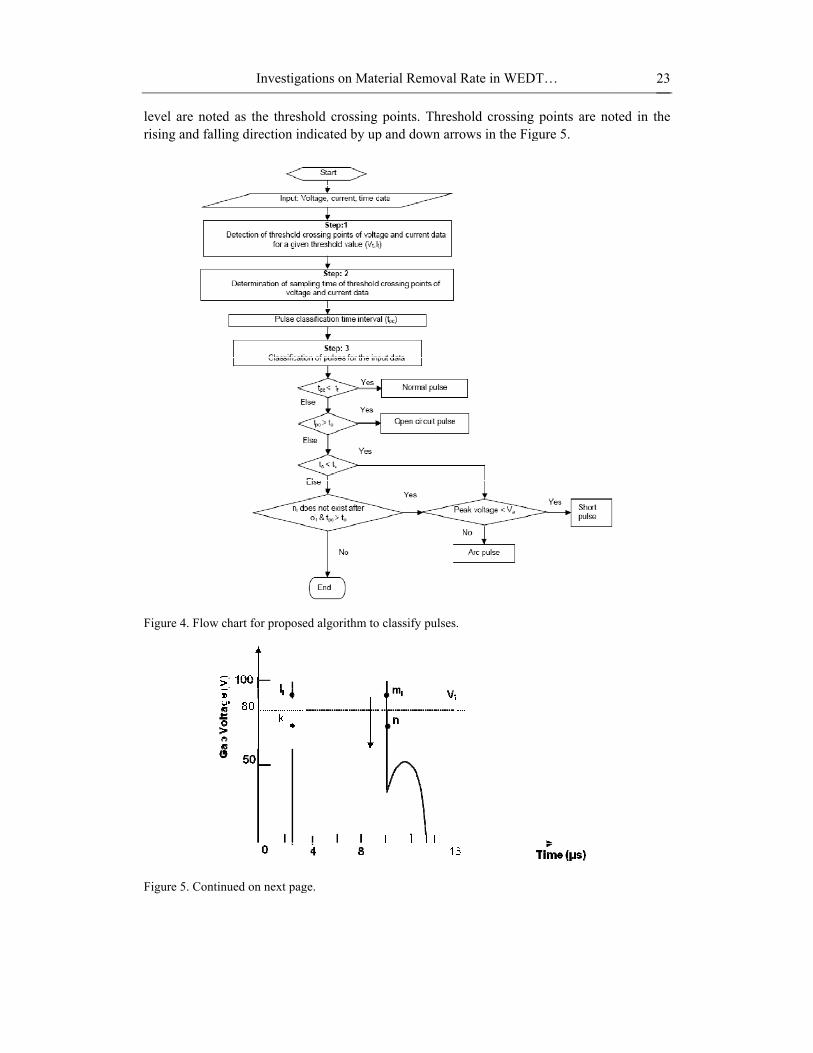
Pulses are classified into normal pulse, open circuit pulse, non ignition delay pulses. Non ignition delay pulses are further classified into arc and short pulses. Steps involved in classifying the pulses are given as a flow chart shown in Figure 4.
3.2.1. Step 1. Threshold Values For Voltage (Vt) and Current (It) and Detection of Crossing Points
The voltage, current and time data obtained from data acquisition system is input to algorithm. Threshold values for voltage (Vt) and current (It) are fixed as 80V and 20A. Whenever the voltage crosses the value Vt, the sampling points prior and after the threshold
Time (s)
leri
Fi
Fi
evel are notedsing and fallin
igure 4. Flow ch
igure 5. Continu
Investiga
d as the threshng direction in
hart for propose
ued on next pag
ations on Mate
hold crossing ndicated by up
ed algorithm to
ge.
erial Removal
points. Thresp and down arr
classify pulses
l Rate in WED
shold crossingrows in the Fig
.
DT…
g points are nogure 5.
23
oted in the
24
Fi
thasTan
Fi
3.
an
4
igure 5. Thresho
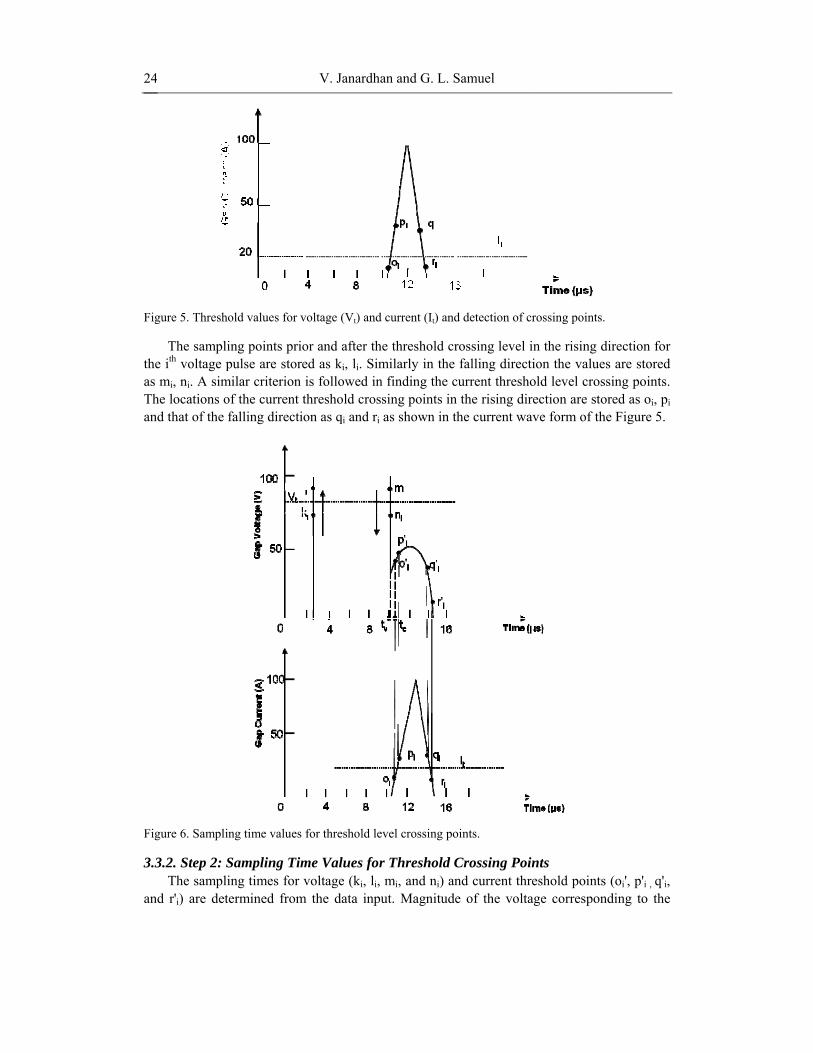
The samplihe ith voltage ps mi, ni. A simhe locations ond that of the f
igure 6. Sampli
.3.2. Step 2: SThe sampli
nd r'i) are det
old values for v
ing points priopulse are store
milar criterion of the current tfalling directio
ng time values
Sampling Timing times for vtermined from
V. Janardh
voltage (Vt) and
or and after thed as ki, li. Simis followed inthreshold croson as qi and ri
for threshold le
me Values forvoltage (ki, li,
m the data inp
an and G. L. S
d current (It) and
he threshold crmilarly in the n finding the cssing points in
as shown in t
evel crossing po
r Threshold C mi, and ni) anut. Magnitude
Samuel
d detection of cr
rossing level ifalling directi
current threshon the rising dirthe current wa
oints.
Crossing Poinnd current three of the volta
rossing points.
in the rising diion the valuesold level crossrection are storave form of the
nts eshold points
age correspond
irection for s are stored sing points. red as oi, pi e Figure 5.
(oi', p'i , q'i, ding to the
cuissacltoinas
3.(tp
tv
st
dethth
Fi
ththpoth
pothnothpu
urrent threshos represented aampling time lassifying the o oi and o'i annterval betwees tv and corresp
.2.3. Step 3: tpc)
The pulse cv. Pulse classitep.2.
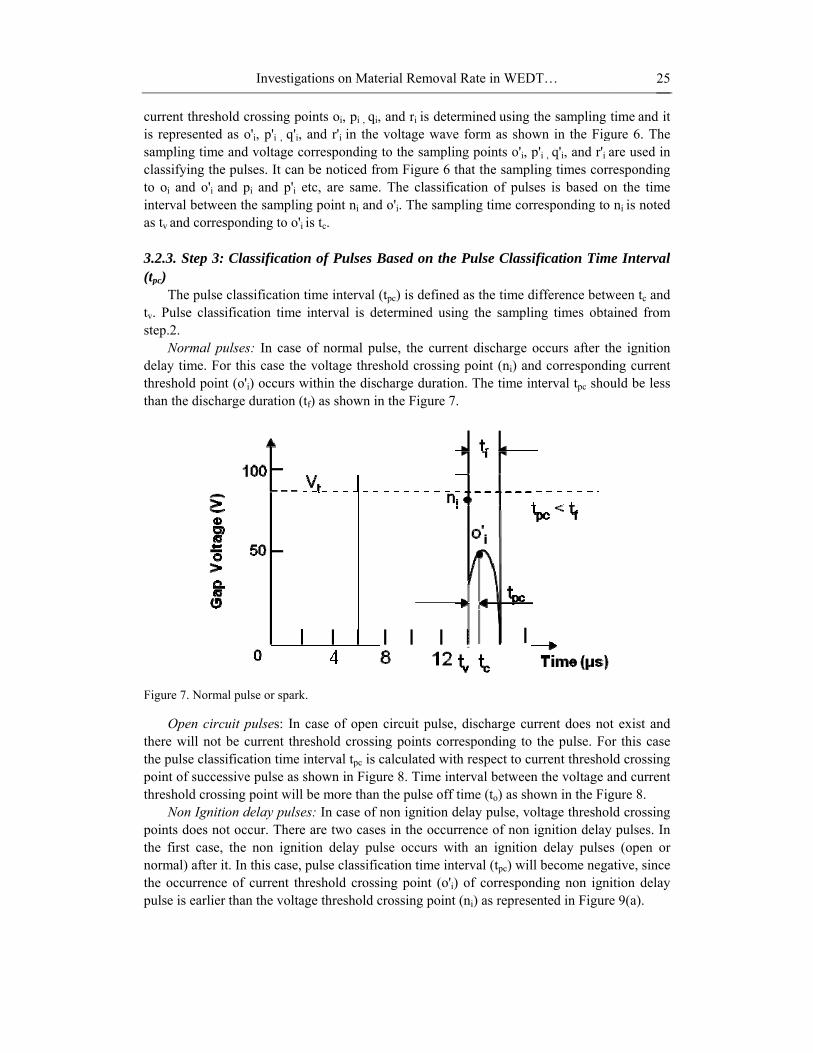
Normal puelay time. Forhreshold pointhan the dischar
igure 7. Normal
Open circuhere will not bhe pulse classioint of succeshreshold cross
Non Ignitiooints does nothe first case, ormal) after ithe occurrence ulse is earlier
Investiga
ld crossing poas o'i, p'i , q'i, and voltage cpulses. It can
nd pi and p'i een the samplinponding to o'i
Classification
classification tfication time
ulses: In case r this case thet (o'i) occurs wrge duration (t
l pulse or spark
uit pulses: In be current thrfication time isive pulse as sing point will on delay pulset occur. Therethe non ignit
t. In this case, of current th
than the volta
ations on Mate
oints oi, pi , qi,and r'i in the orresponding be noticed fretc, are same.ng point ni andis tc.
n of Pulses B
time interval (interval is de
of normal pue voltage threswithin the disctf) as shown in
k.
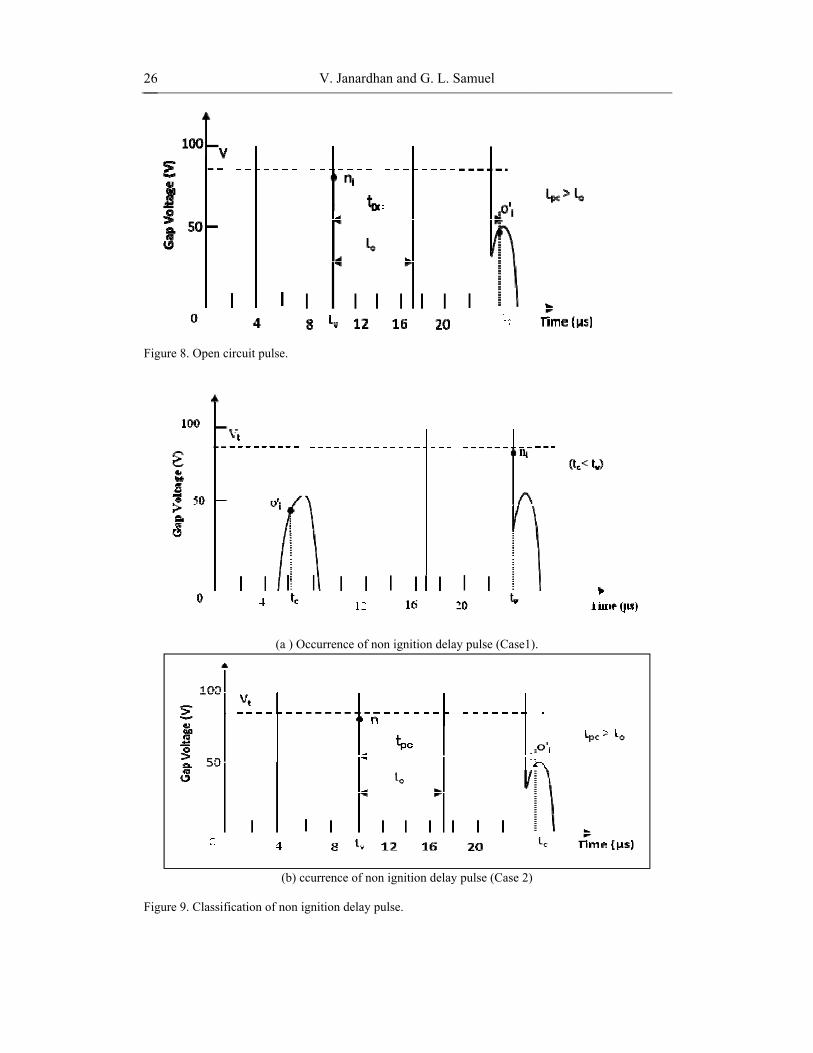
case of open reshold crossininterval tpc is cshown in Figube more than
es: In case of ne are two casetion delay pulpulse classific
hreshold crossiage threshold c
erial Removal
, and ri is detevoltage waveto the samplin
rom Figure 6 t. The classificd o'i. The samp
Based on the
(tpc) is definedetermined usin
ulse, the curreshold crossingcharge duration the Figure 7
circuit pulse,ng points corrcalculated witure 8. Time int
the pulse off non ignition ds in the occurlse occurs wication time inting point (o'i)crossing point
l Rate in WED
rmined using e form as showng points o'i, pthat the samplcation of pulspling time cor
e Pulse Classi
d as the time dng the sampli
ent discharge g point (ni) anon. The time in.
discharge curesponding to th respect to cuterval betweentime (to) as sh
delay pulse, vorrence of non ith an ignitionterval (tpc) wil) of correspon(ni) as represe
DT…
the sampling wn in the Figp'i , q'i, and r'i ling times corrses is based orresponding to
ification Tim
difference betwing times obta
occurs after tnd correspondnterval tpc sho
urrent does nothe pulse. Fo
urrent threshon the voltage a
hown in the Figoltage threshoignition delayn delay pulsell become neganding non ignented in Figur
25
time and it gure 6. The are used in responding
on the time o ni is noted
me Interval
ween tc and ained from
the ignition ing current
ould be less
ot exist and or this case old crossing and current gure 8.
old crossing y pulses. In es (open or ative, since
nition delay re 9(a).
26
Fi
Fi
6
igure 8. Open c
igure 9. Classifi
ircuit pulse.
(a ) O
(b) c
fication of non i
V. Janardh
Occurrence of no
ccurrence of non
gnition delay pu
an and G. L. S
on ignition dela
n ignition delay
ulse.
Samuel
ay pulse (Case1)
y pulse (Case 2)
).
Investigations on Material Removal Rate in WEDT… 27
In the second case, there is no ignition delay pulse after the corresponding non ignition delay pulse. In this case the voltage threshold value of the ignition delay pulse prior to the non ignition delay pulse under consideration, is considered for calculating tpc. The time interval will be more than the pulse off time (to) as shown in Figure 9 (b). Non ignition delay pulses identified using the above criteria are further classified in to short and arc pulses based peak voltage during the non ignition delay pulses. The threshold voltagefor classifying the different non ignition delay pulses (Va) is chosen as 20V. If peak voltage is more than Va, it is arc and if it is less then the pulse is considered as short.
4. EXPERIMENTS FOR ANALYSIS OF MATERIAL REMOVAL RATE IN WEDT PROCESS
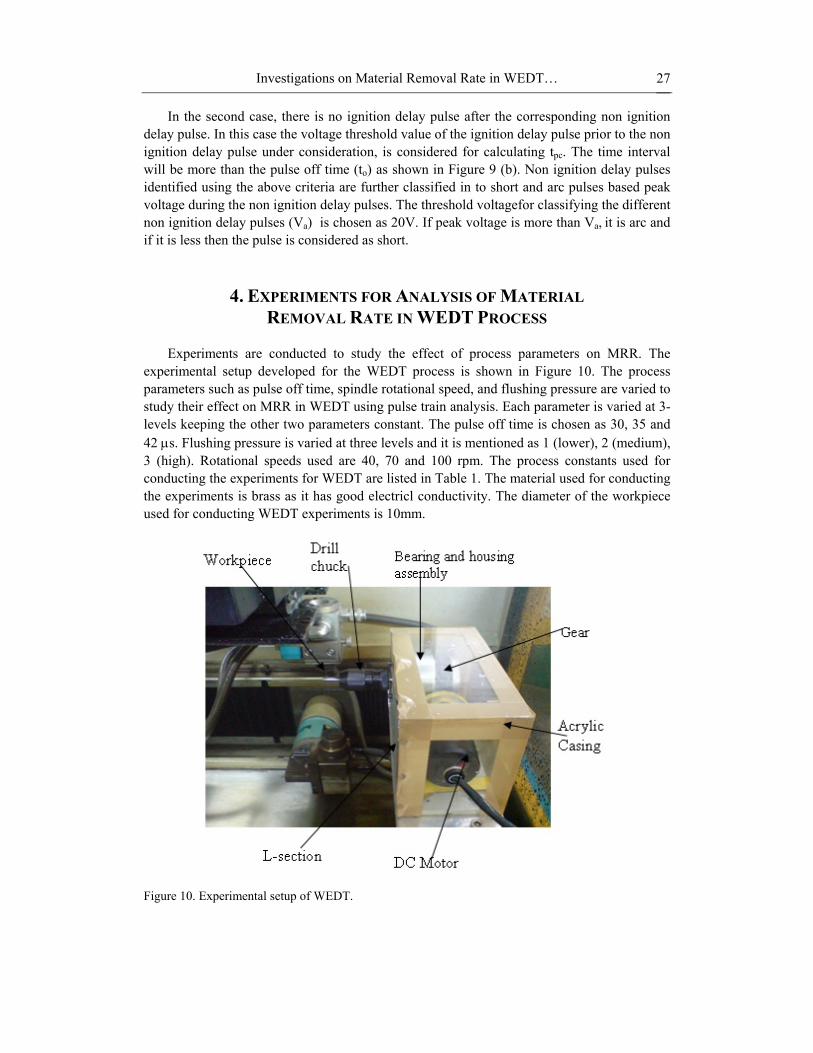
Experiments are conducted to study the effect of process parameters on MRR. The
experimental setup developed for the WEDT process is shown in Figure 10. The process parameters such as pulse off time, spindle rotational speed, and flushing pressure are varied to study their effect on MRR in WEDT using pulse train analysis. Each parameter is varied at 3-levels keeping the other two parameters constant. The pulse off time is chosen as 30, 35 and 42 μs. Flushing pressure is varied at three levels and it is mentioned as 1 (lower), 2 (medium), 3 (high). Rotational speeds used are 40, 70 and 100 rpm. The process constants used for conducting the experiments for WEDT are listed in Table 1. The material used for conducting the experiments is brass as it has good electricl conductivity. The diameter of the workpiece used for conducting WEDT experiments is 10mm.
Figure 10. Experimental setup of WEDT.
V. Janardhan and G. L. Samuel 28
Table 1. Process constants used during WEDT Parameter Specification
Work piece Material Brass
Wire material Brass
Depth of cut 0.3 mm
Diameter of the specimen 10 mm
Wire speed 4 m/min
Wire diameter 0.25 mm
Open gap voltage 100 V
Qu et al (2002) reported that MRR in WEDT is more compared to that of WEDM.
Though the tool material, pulse parameters and mechanism of material removal is same for both the configurations a variation in MRR occurred in both the configurations. The variation in MRR can be better understood by pulse train analysis. To study this effect MRR for both the configurations is compared and the results are analyzed with pulse train analysis. 2D profile cutting experiments were conducted on a brass plate of 12 mm thickness. The parameter settings used for conducting the experiments in case of WEDT and WEDM are same. Since the workpiece is fixed to the table in case of WEDM, the experiments conducted considering the variation in rotational speed in WEDT cannot be compared with WEDM for MRR analysis. Considering this, the effect of pulse off time and flushing pressure are studied keeping the rotational speed constant at 40 rpm.
5. RESULTS AND DISCUSSIONS
5.1. Effect of Pulse Off Time on WEDT Performance Pulse train data is collected at different pulse off times 30, 35 and 42 μs for WEDT and
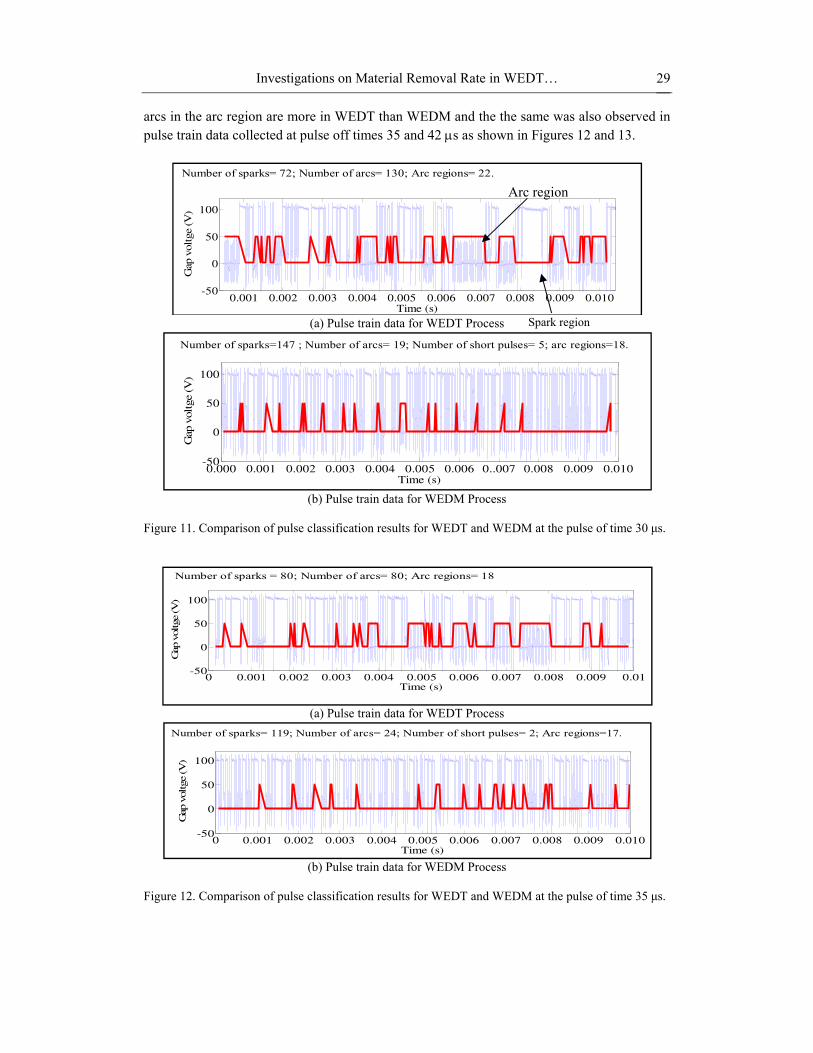
WEDM. While varying pulse off time the rotational speed is set at 40 rpm and flushing pressure is set at medium level (level2). The proposed pulse classification algorithm is applied for classifying the pulses. Figure 11 shows the pulse classification results for WEDT and WEDM at 30 μs pulse off time. Arc and spark regions in the pulse train data is represented by a rectangular wave form as shown in Figure 11 (a). The peak portion of the rectangular wave form represents the arc region and valley portion represent the spark region. It was observed that the number of arc pulses in an arc region are more in case WEDT than WEDM as shown in Figures 11 (a) and (b).
The possible cause for this is rotation of the workpiece. When discharge occurs, the material is removed from the rotating workpiece and the wire is fed forward during which the unmachined portion of the workpiece faces the wire and the spark gap reduces. This phenomenon increases the formation of arcs. Because of this at a constant pulse off time the
Investigations on Material Removal Rate in WEDT… 29
arcs in the arc region are more in WEDT than WEDM and the the same was also observed in pulse train data collected at pulse off times 35 and 42 μs as shown in Figures 12 and 13.
(a) Pulse train data for WEDT Process
(b) Pulse train data for WEDM Process
Figure 11. Comparison of pulse classification results for WEDT and WEDM at the pulse of time 30 μs.
(a) Pulse train data for WEDT Process
(b) Pulse train data for WEDM Process
Figure 12. Comparison of pulse classification results for WEDT and WEDM at the pulse of time 35 μs.
0.001 0.002 0.003 0.004 0.005 0.006 0.007 0.008 0.009 0.010-50
0
50
100
Time (s)
Gap
vol
tge
(V)
Number of sparks= 72; Number of arcs= 130; Arc regions= 22.
0.000 0.001 0.002 0.003 0.004 0.005 0.006 0..007 0.008 0.009 0.010-50
0
50
100
Time (s)
Gap
vol
tge
(V)
Number of sparks=147 ; Number of arcs= 19; Number of short pulses= 5; arc regions=18.
0 0.001 0.002 0.003 0.004 0.005 0.006 0.007 0.008 0.009 0.01-50
0
50
100
Time (s)
Gap
vol
tge
(V)
Number of sparks = 80; Number of arcs= 80; Arc regions= 18
0 0.001 0.002 0.003 0.004 0.005 0.006 0.007 0.008 0.009 0.010-50
0
50
100
Time (s)
Gap
vol
tge
(V)
Number of sparks= 119; Number of arcs= 24; Number of short pulses= 2; Arc regions=17.
Arc region
Spark region
V. Janardhan and G. L. Samuel 30
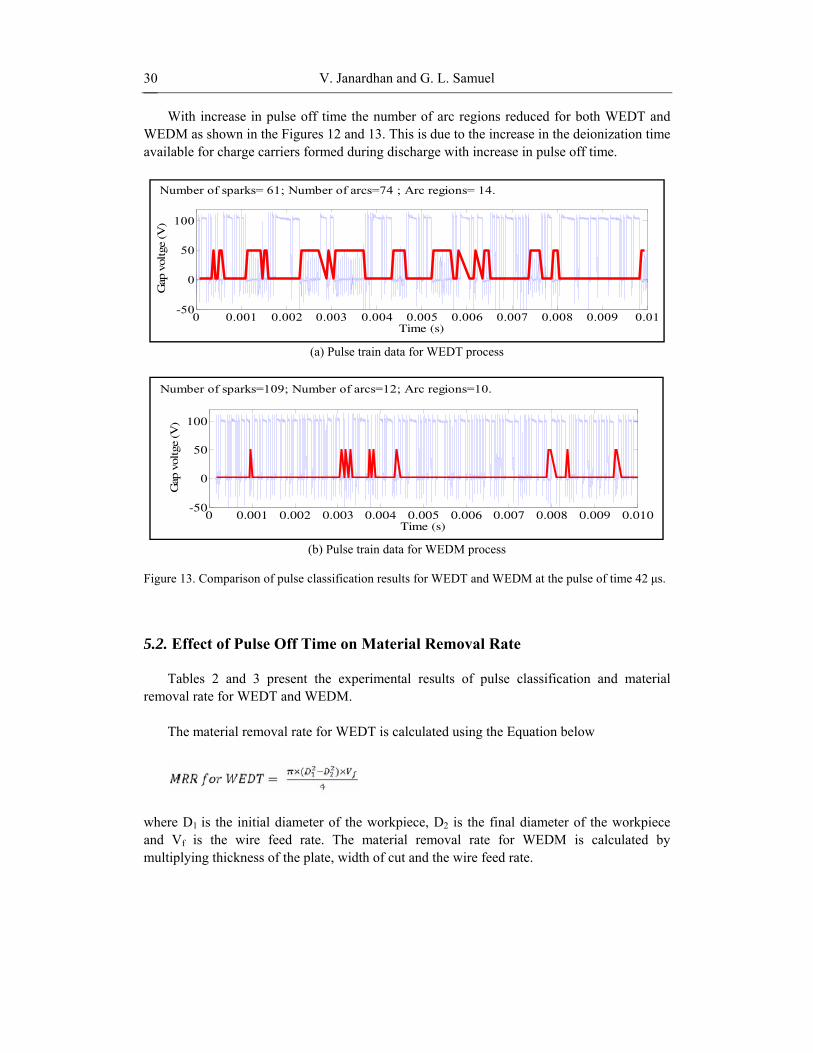
With increase in pulse off time the number of arc regions reduced for both WEDT and WEDM as shown in the Figures 12 and 13. This is due to the increase in the deionization time available for charge carriers formed during discharge with increase in pulse off time.
(a) Pulse train data for WEDT process
(b) Pulse train data for WEDM process
Figure 13. Comparison of pulse classification results for WEDT and WEDM at the pulse of time 42 μs.
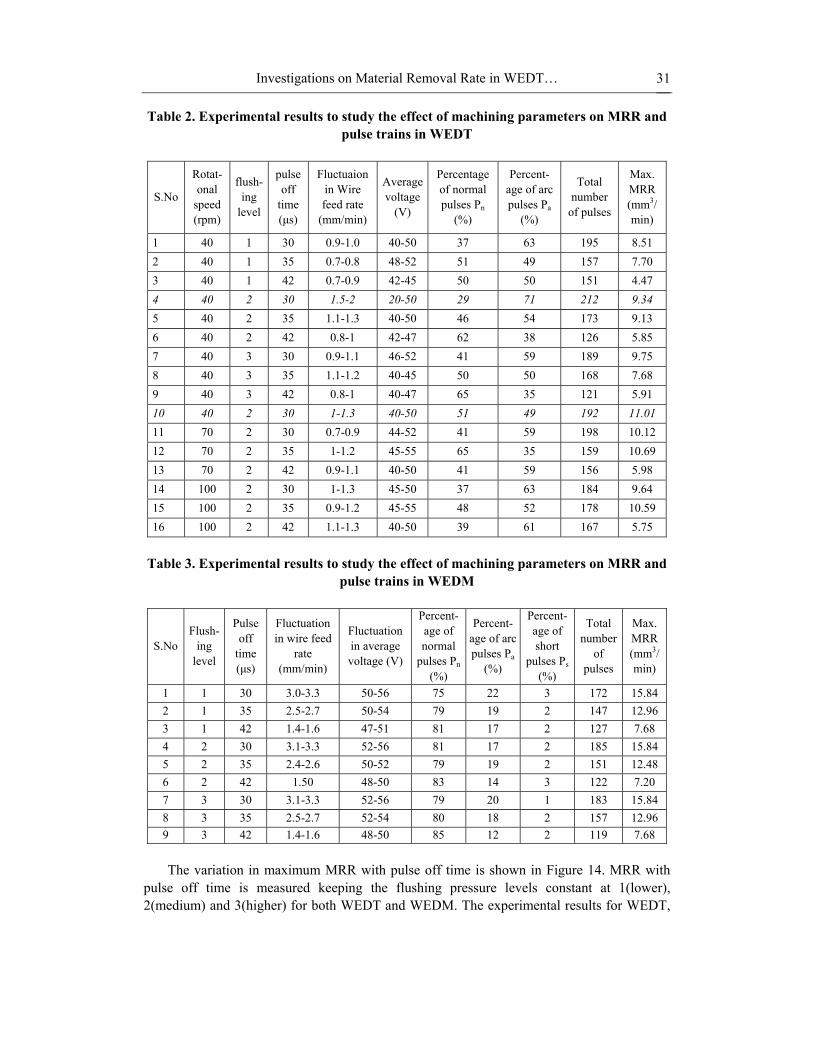
5.2. Effect of Pulse Off Time on Material Removal Rate Tables 2 and 3 present the experimental results of pulse classification and material
removal rate for WEDT and WEDM. The material removal rate for WEDT is calculated using the Equation below
where D1 is the initial diameter of the workpiece, D2 is the final diameter of the workpiece and Vf is the wire feed rate. The material removal rate for WEDM is calculated by multiplying thickness of the plate, width of cut and the wire feed rate.
0 0.001 0.002 0.003 0.004 0.005 0.006 0.007 0.008 0.009 0.01-50
0
50
100
Time (s)
Gap
vol
tge
(V)
Number of sparks= 61; Number of arcs=74 ; Arc regions= 14.
0 0.001 0.002 0.003 0.004 0.005 0.006 0.007 0.008 0.009 0.010-50
0
50
100
Time (s)
Gap
vol
tge
(V)
Number of sparks=109; Number of arcs=12; Arc regions=10.
Investigations on Material Removal Rate in WEDT… 31
Table 2. Experimental results to study the effect of machining parameters on MRR and pulse trains in WEDT
S.No
Rotat-onal
speed (rpm)
flush-ing
level
pulse off
time (μs)
Fluctuaion in Wire feed rate
(mm/min)
Average voltage
(V)
Percentage of normal pulses Pn
(%)
Percent-age of arc pulses Pa
(%)
Total number
of pulses
Max. MRR (mm3/min)
1 40 1 30 0.9-1.0 40-50 37 63 195 8.51 2 40 1 35 0.7-0.8 48-52 51 49 157 7.70 3 40 1 42 0.7-0.9 42-45 50 50 151 4.47 4 40 2 30 1.5-2 20-50 29 71 212 9.34 5 40 2 35 1.1-1.3 40-50 46 54 173 9.13 6 40 2 42 0.8-1 42-47 62 38 126 5.85 7 40 3 30 0.9-1.1 46-52 41 59 189 9.75 8 40 3 35 1.1-1.2 40-45 50 50 168 7.68 9 40 3 42 0.8-1 40-47 65 35 121 5.91 10 40 2 30 1-1.3 40-50 51 49 192 11.01 11 70 2 30 0.7-0.9 44-52 41 59 198 10.12 12 70 2 35 1-1.2 45-55 65 35 159 10.69 13 70 2 42 0.9-1.1 40-50 41 59 156 5.98 14 100 2 30 1-1.3 45-50 37 63 184 9.64 15 100 2 35 0.9-1.2 45-55 48 52 178 10.59 16 100 2 42 1.1-1.3 40-50 39 61 167 5.75
Table 3. Experimental results to study the effect of machining parameters on MRR and
pulse trains in WEDM
S.No Flush-
ing level
Pulse off
time (μs)
Fluctuation in wire feed
rate (mm/min)
Fluctuation in average voltage (V)
Percent-age of normal
pulses Pn
(%)
Percent-age of arc pulses Pa
(%)
Percent-age of short
pulses Ps
(%)
Total number
of pulses
Max. MRR (mm3/min)
1 1 30 3.0-3.3 50-56 75 22 3 172 15.84 2 1 35 2.5-2.7 50-54 79 19 2 147 12.96 3 1 42 1.4-1.6 47-51 81 17 2 127 7.68 4 2 30 3.1-3.3 52-56 81 17 2 185 15.84 5 2 35 2.4-2.6 50-52 79 19 2 151 12.48 6 2 42 1.50 48-50 83 14 3 122 7.20 7 3 30 3.1-3.3 52-56 79 20 1 183 15.84 8 3 35 2.5-2.7 52-54 80 18 2 157 12.96 9 3 42 1.4-1.6 48-50 85 12 2 119 7.68 The variation in maximum MRR with pulse off time is shown in Figure 14. MRR with
pulse off time is measured keeping the flushing pressure levels constant at 1(lower), 2(medium) and 3(higher) for both WEDT and WEDM. The experimental results for WEDT,
32
shinpr
Fi
whemduobcopuFi
2
hown in Figuncreased with ressure in WE
igure 14. Effect
It can be obwith pulse off t
ence is represmaximum MRR
ue to the decbserved from ompared to thulses and increigures 15(b) a
ure 14, were decrease in th
EDT as shown
t of pulse off tim
bserved from time at differesented by a dR decreased wcrease in the the Figure 14
hat of WEDMease in the per
and (c).
100
120
140
160
180
200
220
Tot
al n
umbe
r of
pul
ses
V. Janardh
conducted kehe pulse off tiin Figure 14.
me on MRR in c
the Table 3 thent flushing levdotted line in with increase itotal number
4 that, for the M. This can be
rcentage of ar
(a) Tota
30
Pul
an and G. L. S
eeping rotationime, however
case of WEDT
hat, the variativels did not chFigure 14. It in pulse off timof pulses as
same pulse of attributed to c pulses in cas
al number of pul
35
lse off time (μs
Samuel
nal speed conr it increases w
and WEDM.
ion in maximuhange consideis observed
me for both Windicated in
ff time MRR the decrease
se of WEDT t
lses
42
s)
1
2
3
1
2
3
nstant at 40 rwith increase
um material reerably in case from Figure
WEDT and WFigure 15(a)
in case of WEin percentage
than WEDM a
1‐WEDT
2‐WEDT
3‐WEDT
1‐WEDM
2‐WEDM
3‐WEDM
rpm. MRR in flushing
emoval rate of WEDM
14 that the WEDM. It is
. It is also EDT is less e of normal as shown in
Investigations on Material Removal Rate in WEDT… 33
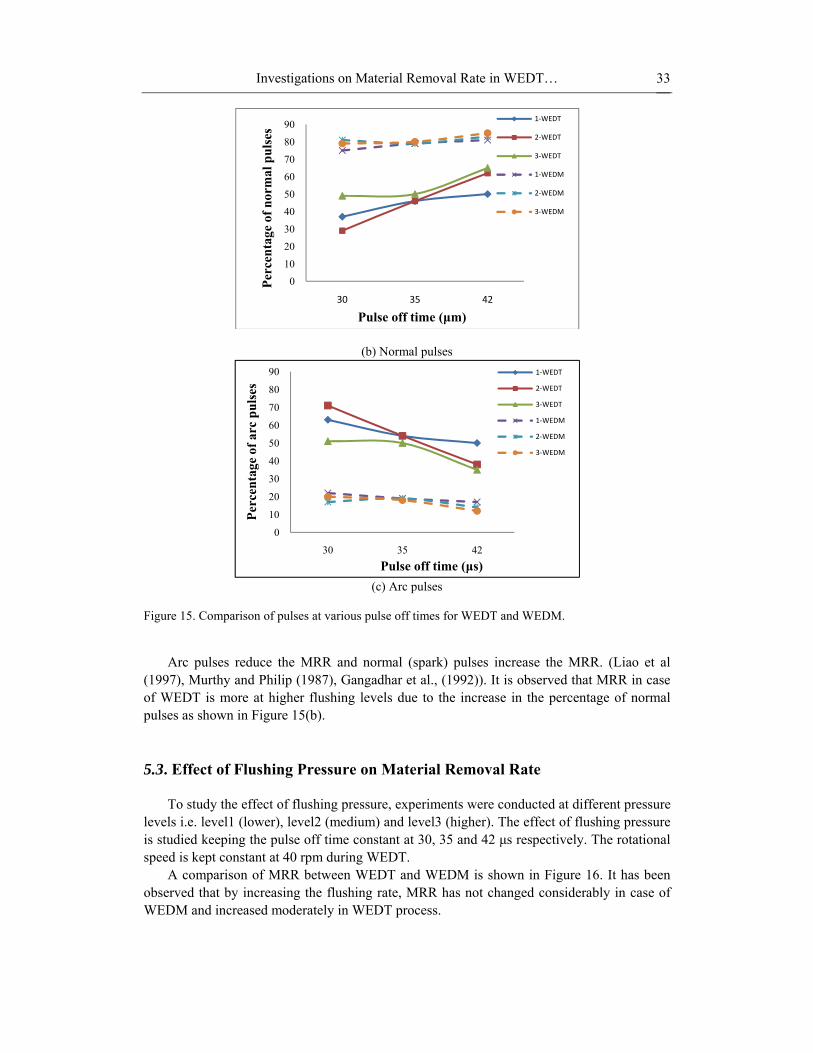
(b) Normal pulses
(c) Arc pulses
Figure 15. Comparison of pulses at various pulse off times for WEDT and WEDM.
Arc pulses reduce the MRR and normal (spark) pulses increase the MRR. (Liao et al
(1997), Murthy and Philip (1987), Gangadhar et al., (1992)). It is observed that MRR in case of WEDT is more at higher flushing levels due to the increase in the percentage of normal pulses as shown in Figure 15(b).
5.3. Effect of Flushing Pressure on Material Removal Rate To study the effect of flushing pressure, experiments were conducted at different pressure
levels i.e. level1 (lower), level2 (medium) and level3 (higher). The effect of flushing pressure is studied keeping the pulse off time constant at 30, 35 and 42 μs respectively. The rotational speed is kept constant at 40 rpm during WEDT.
A comparison of MRR between WEDT and WEDM is shown in Figure 16. It has been observed that by increasing the flushing rate, MRR has not changed considerably in case of WEDM and increased moderately in WEDT process.
010
2030
4050
607080
90
30 35 42
Perc
enta
ge o
f nor
mal
pul
ses
Pulse off time (μm)
1‐WEDT
2‐WEDT
3‐WEDT
1‐WEDM
2‐WEDM
3‐WEDM
0
10
20
30
40
50
60
70
80
90
30 35 42
Perc
enta
ge o
f arc
pul
ses
Pulse off time (μs)
1‐WEDT
2‐WEDT
3‐WEDT
1‐WEDM
2‐WEDM
3‐WEDM
34
Fi
to17anshbepuinsp50vare
4
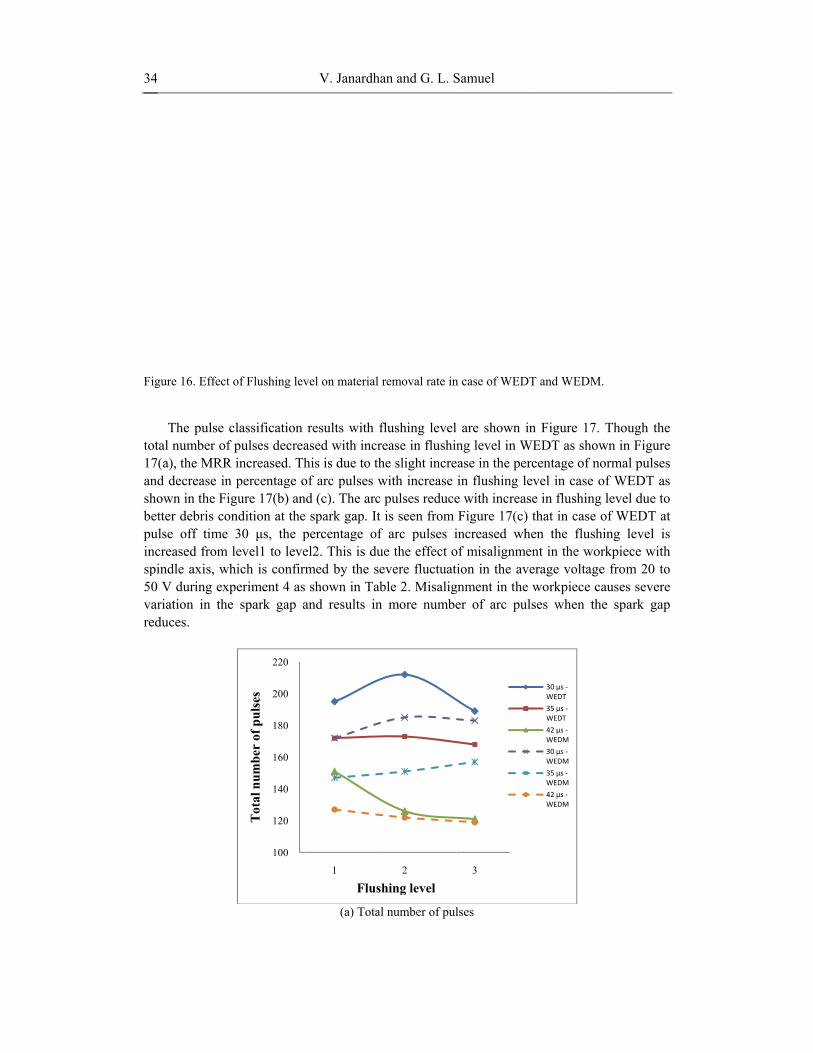
igure 16. Effect
The pulse
otal number of7(a), the MRRnd decrease inhown in the Fietter debris coulse off time ncreased from pindle axis, w0 V during exariation in theeduces.
t of Flushing lev
classification f pulses decreaR increased. Thn percentage oigure 17(b) anondition at the
30 μs, the plevel1 to leve
which is confirxperiment 4 ase spark gap a
100
120
140
160
180
200
220
Tot
al n
umbe
r of
pul
ses
V. Janardh
vel on material
results with fased with incrhis is due to thof arc pulses wnd (c). The arce spark gap. Itpercentage ofel2. This is durmed by the ses shown in Taband results in
(a) Tota
1
Flus
an and G. L. S
removal rate in
flushing levelrease in flushinhe slight increwith increase c pulses reducet is seen from f arc pulses iue the effect oevere fluctuatble 2. Misalig
n more numbe
al number of pul
2
shing level
Samuel
n case of WEDT
l are shown inng level in W
ease in the percin flushing lee with increaseFigure 17(c) t
increased wheof misalignmention in the avegnment in the wer of arc puls
lses
3
T and WEDM.
n Figure 17. TWEDT as show
centage of norvel in case ofe in flushing lthat in case ofen the flushinnt in the workerage voltage workpiece causes when the
30 μs ‐WEDT
35 μs ‐WEDT
42 μs ‐WEDM
30 μs ‐WEDM
35 μs ‐WEDM
42 μs ‐WEDM
Though the n in Figure rmal pulses f WEDT as level due to f WEDT at ng level is kpiece with from 20 to uses severe
spark gap
Investigations on Material Removal Rate in WEDT… 35
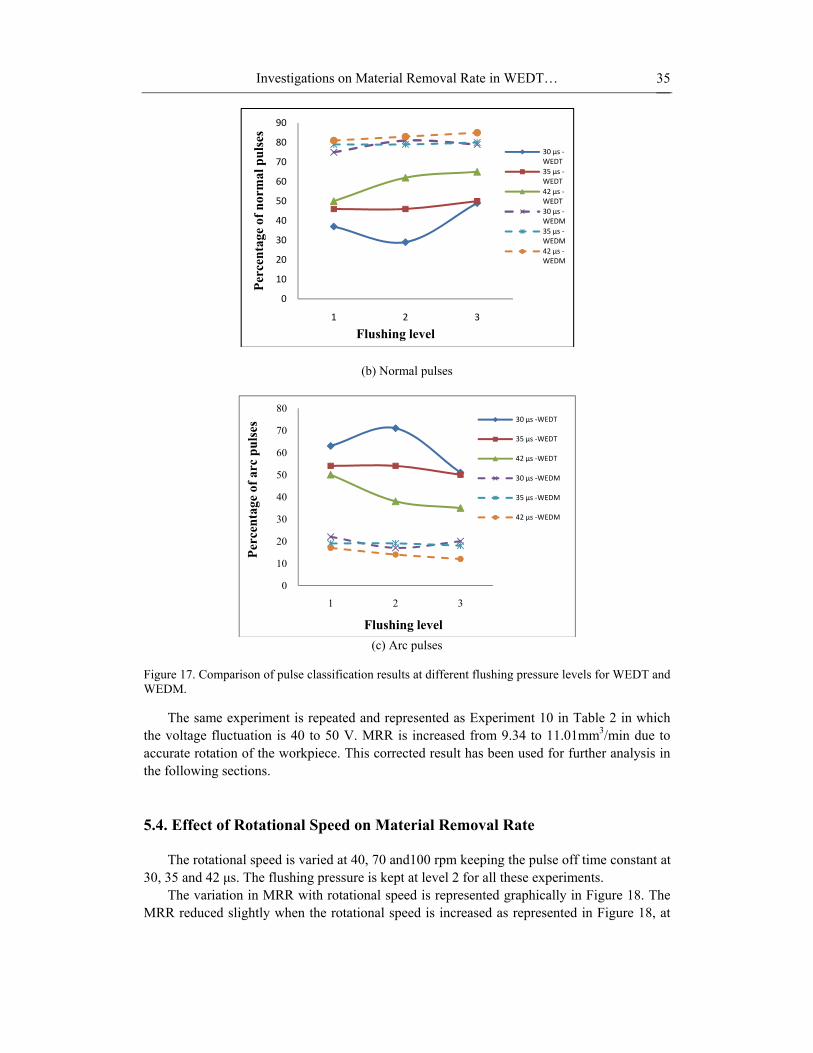
(b) Normal pulses
(c) Arc pulses
Figure 17. Comparison of pulse classification results at different flushing pressure levels for WEDT and WEDM.
The same experiment is repeated and represented as Experiment 10 in Table 2 in which the voltage fluctuation is 40 to 50 V. MRR is increased from 9.34 to 11.01mm3/min due to accurate rotation of the workpiece. This corrected result has been used for further analysis in the following sections.
5.4. Effect of Rotational Speed on Material Removal Rate The rotational speed is varied at 40, 70 and100 rpm keeping the pulse off time constant at
30, 35 and 42 μs. The flushing pressure is kept at level 2 for all these experiments. The variation in MRR with rotational speed is represented graphically in Figure 18. The
MRR reduced slightly when the rotational speed is increased as represented in Figure 18, at
0
10
20
30
40
50
60
70
80
90
1 2 3
Perc
enta
ge o
f nor
mal
pul
ses
Flushing level
30 μs ‐WEDT35 μs ‐WEDT42 μs ‐WEDT30 μs ‐WEDM35 μs ‐WEDM42 μs ‐WEDM
0
10
20
30
40
50
60
70
80
1 2 3
Perc
enta
ge o
f arc
pul
ses
Flushing level
30 μs ‐WEDT
35 μs ‐WEDT
42 μs ‐WEDT
30 μs ‐WEDM
35 μs ‐WEDM
42 μs ‐WEDM
V. Janardhan and G. L. Samuel 36
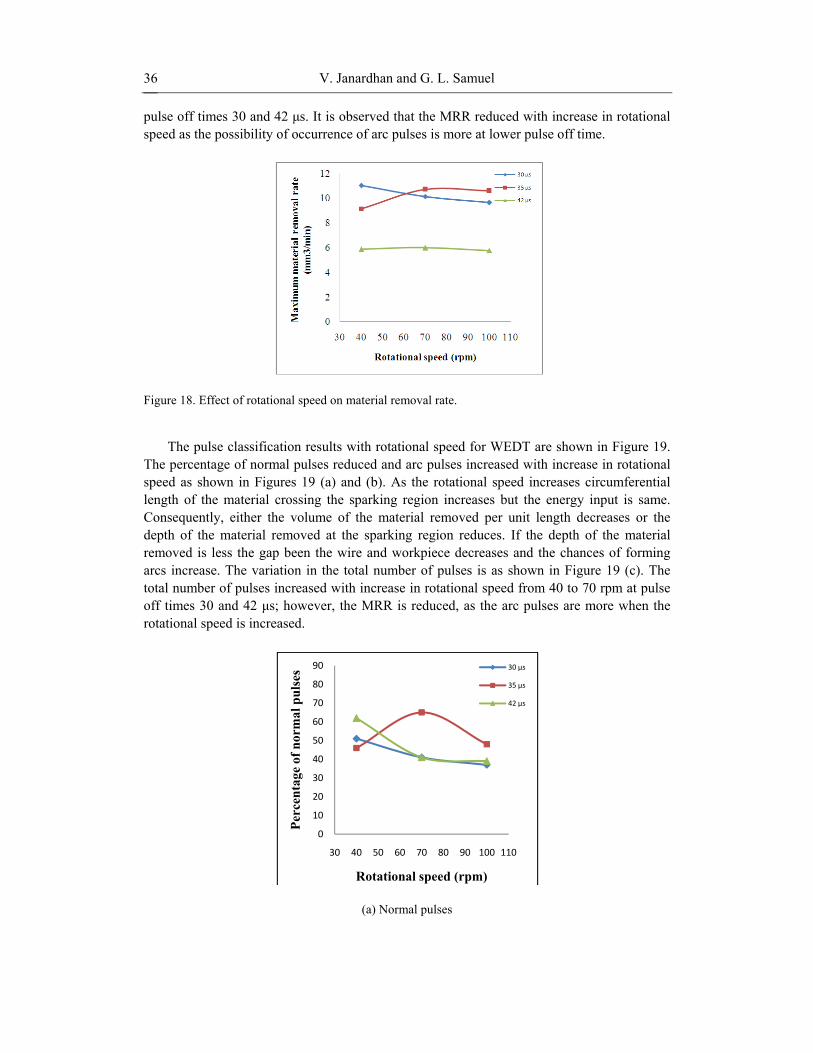
pulse off times 30 and 42 μs. It is observed that the MRR reduced with increase in rotational speed as the possibility of occurrence of arc pulses is more at lower pulse off time.
Figure 18. Effect of rotational speed on material removal rate.
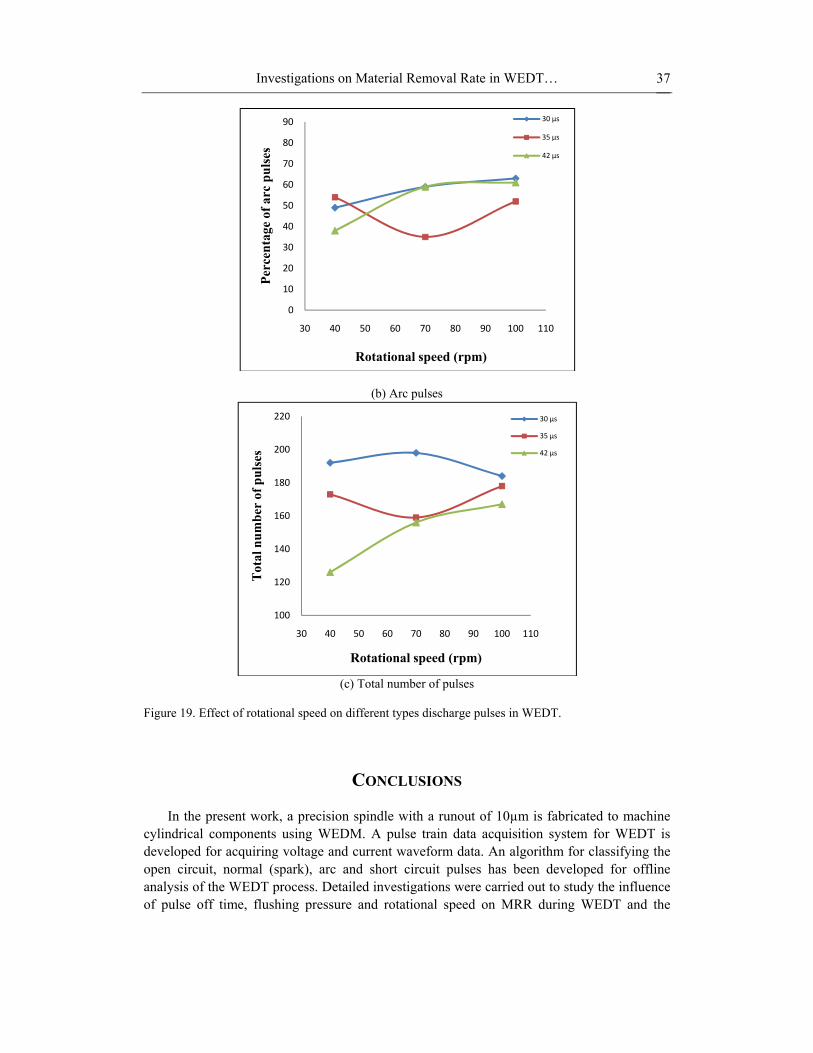
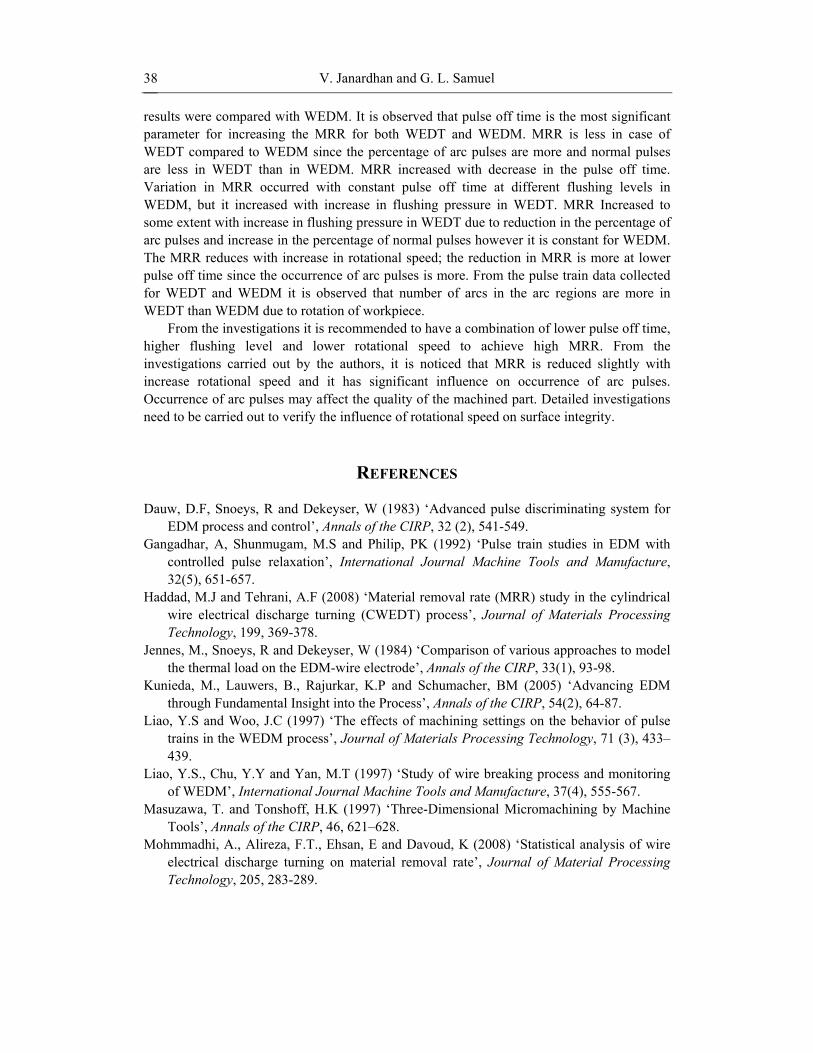
The pulse classification results with rotational speed for WEDT are shown in Figure 19.
The percentage of normal pulses reduced and arc pulses increased with increase in rotational speed as shown in Figures 19 (a) and (b). As the rotational speed increases circumferential length of the material crossing the sparking region increases but the energy input is same. Consequently, either the volume of the material removed per unit length decreases or the depth of the material removed at the sparking region reduces. If the depth of the material removed is less the gap been the wire and workpiece decreases and the chances of forming arcs increase. The variation in the total number of pulses is as shown in Figure 19 (c). The total number of pulses increased with increase in rotational speed from 40 to 70 rpm at pulse off times 30 and 42 μs; however, the MRR is reduced, as the arc pulses are more when the rotational speed is increased.
(a) Normal pulses
0
10
20
30
40
50
60
70
80
90
30 40 50 60 70 80 90 100 110
Perc
enta
ge o
f nor
mal
pul
ses
Rotational speed (rpm)
30 μs
35 μs
42 μs
Investigations on Material Removal Rate in WEDT… 37
(b) Arc pulses
(c) Total number of pulses
Figure 19. Effect of rotational speed on different types discharge pulses in WEDT.
CONCLUSIONS In the present work, a precision spindle with a runout of 10µm is fabricated to machine
cylindrical components using WEDM. A pulse train data acquisition system for WEDT is developed for acquiring voltage and current waveform data. An algorithm for classifying the open circuit, normal (spark), arc and short circuit pulses has been developed for offline analysis of the WEDT process. Detailed investigations were carried out to study the influence of pulse off time, flushing pressure and rotational speed on MRR during WEDT and the
0
10
20
30
40
50
60
70
80
90
30 40 50 60 70 80 90 100 110
Perc
enta
ge o
f arc
pul
ses
Rotational speed (rpm)
30 μs
35 μs
42 μs
100
120
140
160
180
200
220
30 40 50 60 70 80 90 100 110
Tot
al n
umbe
r of
pul
ses
Rotational speed (rpm)
30 μs
35 μs
42 μs
V. Janardhan and G. L. Samuel 38
results were compared with WEDM. It is observed that pulse off time is the most significant parameter for increasing the MRR for both WEDT and WEDM. MRR is less in case of WEDT compared to WEDM since the percentage of arc pulses are more and normal pulses are less in WEDT than in WEDM. MRR increased with decrease in the pulse off time. Variation in MRR occurred with constant pulse off time at different flushing levels in WEDM, but it increased with increase in flushing pressure in WEDT. MRR Increased to some extent with increase in flushing pressure in WEDT due to reduction in the percentage of arc pulses and increase in the percentage of normal pulses however it is constant for WEDM. The MRR reduces with increase in rotational speed; the reduction in MRR is more at lower pulse off time since the occurrence of arc pulses is more. From the pulse train data collected for WEDT and WEDM it is observed that number of arcs in the arc regions are more in WEDT than WEDM due to rotation of workpiece.
From the investigations it is recommended to have a combination of lower pulse off time, higher flushing level and lower rotational speed to achieve high MRR. From the investigations carried out by the authors, it is noticed that MRR is reduced slightly with increase rotational speed and it has significant influence on occurrence of arc pulses. Occurrence of arc pulses may affect the quality of the machined part. Detailed investigations need to be carried out to verify the influence of rotational speed on surface integrity.
REFERENCES
Dauw, D.F, Snoeys, R and Dekeyser, W (1983) ‘Advanced pulse discriminating system for EDM process and control’, Annals of the CIRP, 32 (2), 541-549.
Gangadhar, A, Shunmugam, M.S and Philip, PK (1992) ‘Pulse train studies in EDM with controlled pulse relaxation’, International Journal Machine Tools and Manufacture, 32(5), 651-657.
Haddad, M.J and Tehrani, A.F (2008) ‘Material removal rate (MRR) study in the cylindrical wire electrical discharge turning (CWEDT) process’, Journal of Materials Processing Technology, 199, 369-378.
Jennes, M., Snoeys, R and Dekeyser, W (1984) ‘Comparison of various approaches to model the thermal load on the EDM-wire electrode’, Annals of the CIRP, 33(1), 93-98.
Kunieda, M., Lauwers, B., Rajurkar, K.P and Schumacher, BM (2005) ‘Advancing EDM through Fundamental Insight into the Process’, Annals of the CIRP, 54(2), 64-87.
Liao, Y.S and Woo, J.C (1997) ‘The effects of machining settings on the behavior of pulse trains in the WEDM process’, Journal of Materials Processing Technology, 71 (3), 433–439.
Liao, Y.S., Chu, Y.Y and Yan, M.T (1997) ‘Study of wire breaking process and monitoring of WEDM’, International Journal Machine Tools and Manufacture, 37(4), 555-567.
Masuzawa, T. and Tonshoff, H.K (1997) ‘Three-Dimensional Micromachining by Machine Tools’, Annals of the CIRP, 46, 621–628.
Mohmmadhi, A., Alireza, F.T., Ehsan, E and Davoud, K (2008) ‘Statistical analysis of wire electrical discharge turning on material removal rate’, Journal of Material Processing Technology, 205, 283-289.
Investigations on Material Removal Rate in WEDT… 39
Murthy, V.S.R and Philip P.K (1987) ‘Pulse Train analysis in ultrasonic assisted EDM’, International Journal of Machine Tools and Manufacture, 27(4), 469-477.
Qu, J., Shih, A.J and Scattergood, R.O (2002) ‘Development of the cylindrical wire electrical discharge machining process: Part1: Concept, design, and material removal rate’, Journal of Manufacturing Science and Engineering, 124 (3), 702–707.
Rhoney, B.K., Shih, A., Scattergood, R., Akemon, J., Gust, D and Grant, M (2002) ‘Wire electrical discharge machining of metal bond diamond wheels for ceramic grinding’, International Journal of Machine Tools and Manufacture, 42, 1355–1362.
Snoeys, R., Dauw, D and Kruth, J.P ( 1980) ‘Improved adaptive control system for EDM processes’, Annals of the CIRP, 29(1), 97-101.
Spedding, T.A and Wang, Z.Q (1997) ‘Study on modelling of wire EDM process’, Journal of Materials Processing Technology, 69, 18-28.
Takayuki, T., Yasushi, F., Naotake, M., Nagao, S and Masaaki, O (2004) ‘Machining phenomena in WEDM of insulating ceramics’, Journal of Materials Processing Technology, 149, 124–128.
Tarng, Y.S., Tseng, C.M and Chunng, L.K (1997) ‘A fuzzy pulse discriminating system for electrical discharge machining’, International journal of machine tools and manufacture’, 37(4), 511-522.
Watanabe, H., Wang, T and Suzuki, I (1990) ‘WEDM monitoring with a statistical pulse classification method’, Annals of the CIRP, 39 (1), 175–178.
Yan, M.T and Chien, H.T (2007) ‘Monitoring and control of micro Wire-EDM process’, International journal of machine tools and manufacture, 47, 148-157.
Yan, M.T and Liao, Y.S (1996) ‘Monitoring and self-learning fuzzy control for wire rupture prevention in wire electrical discharge machining’, International Journal of Machine Tools and Manufacture, 36(3), 339-353.

Reproduced with permission of the copyright owner. Further reproduction prohibited withoutpermission.


![INDEX [skc.ezplanit.com] Orleans.Pelicans.Suite... · INDEX. Game Day Menu Look for this Game Day icon for items available through the end of half-time. ... SUN MON TUE WEDT HU FRIS](https://img.pdfslide.us/doc/110x75/5c76f40d09d3f2c43b8b679e/index-skc-orleanspelicanssuite-index-game-day-menu-look-for-this-game.jpg)