Embed Size (px)
Citation preview

July 25th 2012
Investigations of Pink Berry
Cross-Feeding
Steffen Larsen MBL Microbial Diversity Course
Summer 2012
Abstract
Pink berries are macroscopic bacterial aggregates that grow on the sediment surface of the small
tidal ponds in Great and Little Sippewissett salt marsh. The phylogeny of the Pink Berry organisms
has been well described in the resent years with the easy access to high throughput sequencing. The
key organisms are purple sulfur bacteria (PSB); sulfate reducing bacteria (SRB) and heterotrophic
bacteria of the Cytophaga. The cooperation between these organisms has also been studied for
decades, but unlike the phylogeny little is still known. In this study the cross-feeding between Pink
Berry organisms was investigated. Stable isotope probing was attempted to unveil possible transfer
of organic molecules from the PSB to other Pink Berry organisms. Hydrogen has been speculated as
a possible electron transfer molecule. In this study it was shown that this is unlikely, though acetate
and glycolate should instead be considered as possible transfer molecules. The oxygen penetration
of the Pink Berry was investigated using micro sensors. These measurements showed that the
majority of the Berry is oxic.

2
Introduction
Syntrophy between microorganisms is being considered more often these days when describing
microbial ecology, though many of these microbe-microbe interactions are difficult to investigate
and therefore often unresolved. The “Pink Berry” microbial consortium is no exception. It has been
investigated by students of the Microbial Diversity Course for decades and yet most physiological
questions still remains unanswered.
The Pink Berries are found in tidal ponds of Great and Little Sippewissett salt marsh. The two salt
marshes are characterized by a large tidal exchange of sea water two times a day and by organic and
sulfide rich sediment. The Berries lie on the sediment surface of the ponds, but tend to be most
abundant in deepest areas of the ponds as well as in small depressions in the sediment. This is due
to the density of the berries, which is only few per mill above that of seawater (Seitz, Nielsen et al.
1993). Thereby the Berries remain on the sediment surface where light and oxygen is plenty, but
avoid being flushed to sea by the daily tidal fluctuations.
In 2010 a large group of student of the Microbial Diversity course dedicated their project work to
reveal secrets of the Pink Berry (Wilbanks 2010). They reported in line with earlier student project
that the consortium consists mainly of three key organisms. The most abundant organism in the
consortia is purple sulfur bacteria (PSB) of the family Chromatiacaea. Sulfate reducing bacteria
(SRB) close related to Desulfofustis glycolicus (Friedrich, Springer et al. 1996) and long slim
rodshaped Cytophaga are also abundant. The students saw that the PSB were located in large
compartment while the Cytophaga and the SRB were found in the extracellular matrix of the
Berries. This observation was confirmed in a student project the following year (Salman 2011). The
same group of students showed that the Berries have an internal sulfur cycle where sulfate is
reduced by the SRB and directly taken up by the PSB. In a short term experiment, they also proved
that CO2 uptake by the Berries is independent unaffected by sulfide concentrations below 0.5 mM,
but inhibited by higher concentrations.
Although comprehensive work has been done on the Pink Berry consortia and some of the
fundamental physiological questions have been answered, most still remains a puzzle. One of the
major questions is the interaction between the SRB and the PSB. The SRB provide sulfide for the
PSB, but it is unclear whether the PSB provide anything in return and thereby feed the SRB to
increase the sulfide production. Another key question is the role of the Cytophaga in the Pink Berry,
which so far remains a mystery. It was proposed that they feed on the extracellular matrix of the
berries and that they provide an oxygen barrier for the PSB and SRB.
The aim of this project was to investigate unresolved cross feedings taking place inside the Pink
Berries. The role of Cytophaga in the consortia was investigated by looking at their uptake of PSB
products. Furthermore hydrogen was investigated as possible transfer molecule between the PSB
and the SRB within the Consortia.

3
Material and methods Sampling
The Pink Berries used in all experiment were freshly sampled from a pond at Little Sippewissett
(Supplementary figure S1). The berries were sorted from the sediment by washing the samples
through a 1 mm sieve. This way of sampling gives an unintentional selection of berries above 1 mm
in size. After sampling the berries were kept at 4 °C until use. Prior to any incubation study the
berries were washed twice in 0.2 µm sterile filtered Little Sippewissett pond water to remove all
non associated particles.
Enrichment of Pink Berry Cytophaga
Berries were sliced in half and placed with the cut surface on either a high (SP2) or a low nutrient
(SP6) agar plate based on peptide medium:
SP2: SP6:
1 g/L Casitone 0.3 g/L Casitone
0.2 g/L Yeast extract 0.1 g/L Yeast extract
0.02 g/L Acetate 6.4 g/L MgSO4·7H2O
6.4 g/L MgSO4·7H2O 15 g/L Agar
15 g/L Agar
PH adjusted to 7.2 using NaOH.
After autoclaving 0.2 g/L of sterile filtered NaHCO3 was added.
Replicates of the enrichment were incubated both oxic and anoxic at room temperature. After two
days of incubation the periphery of the colony was sampled and streaked onto new agar plate. This
was based on the fact that Cytophaga is known to exhibit gliding motility. From each plate the
organisms were transferred three times to enrich for a pure culture. The enrichments were followed
by microscopy and all end point enrichments were evaluated using PCR with specific 16S rRNA
Cytophaga primer CF316 (5’- CTGGTACTGAGACACGGA -3’) (Kirchman, Yu et al. 2003) in
combination with general bacterial 16S rRNA primer 1492R. Amplification of 16S rRNA genes
was done with 5 minutes of initial denaturation at 95 °C followed by 30 cycles of 30 sec.
denaturation at 95 °C; 1 min. of annealing at 55 °C and 1.5 min. of elongation at 72 °C and a final
elongation of 10 min. at 72 °C.
Stable Isotope Probing
To investigate the cross feeding of Cytophaga on metabolites or EPS produced by the PSB, heavy
labelled 13
CO2 was used for incubation. One gram of berries was incubated in each of two 150 ml
glass vials each containing 30 ml sterile filtered Little Sippewissett pond water. To each of the two
vials 292 µmol of NaH13
CO3 was added to the normal atmospheric gas phase resulting in a CO2
concentration of 5 %. H2S to a final concentration of 20 µM was added each vial to get the CO2
fixation by the PSB started, relying on the internal berry cycle to provide additional H2S. As control
a similar microcosms was setup using unlabelled 12
CO2.
4
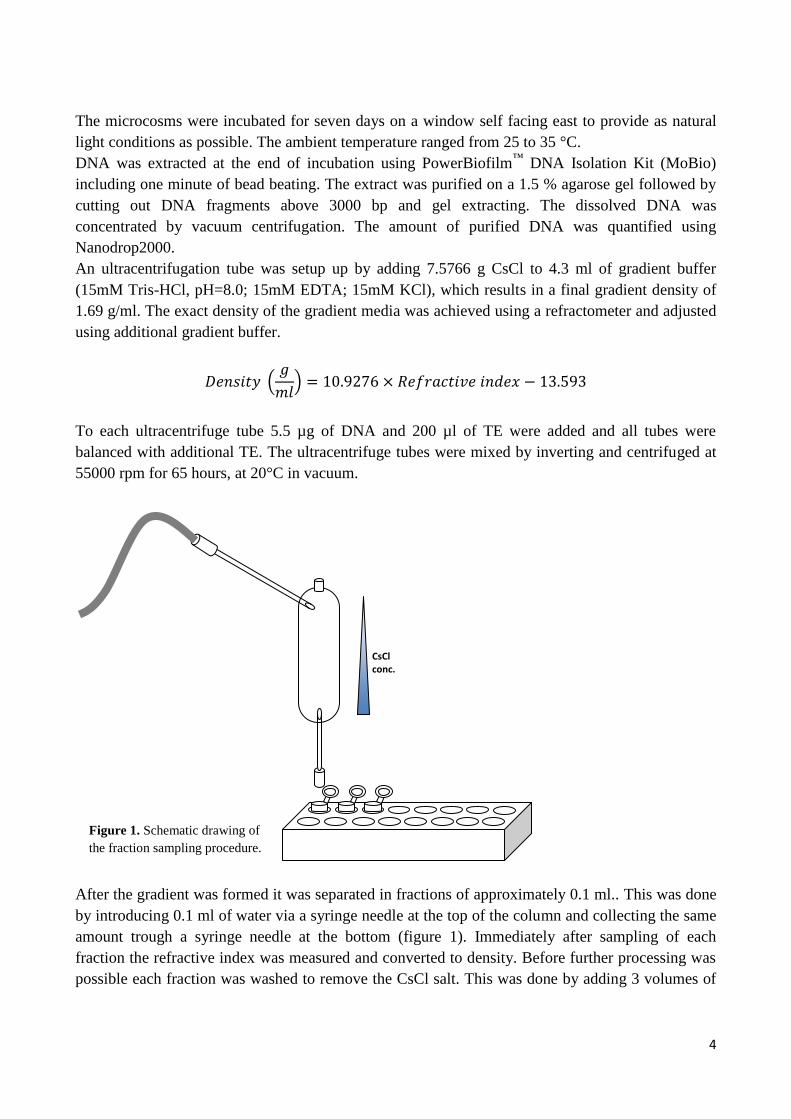
The microcosms were incubated for seven days on a window self facing east to provide as natural
light conditions as possible. The ambient temperature ranged from 25 to 35 °C.
DNA was extracted at the end of incubation using PowerBiofilm™
DNA Isolation Kit (MoBio)
including one minute of bead beating. The extract was purified on a 1.5 % agarose gel followed by
cutting out DNA fragments above 3000 bp and gel extracting. The dissolved DNA was
concentrated by vacuum centrifugation. The amount of purified DNA was quantified using
Nanodrop2000.
An ultracentrifugation tube was setup up by adding 7.5766 g CsCl to 4.3 ml of gradient buffer
(15mM Tris-HCl, pH=8.0; 15mM EDTA; 15mM KCl), which results in a final gradient density of
1.69 g/ml. The exact density of the gradient media was achieved using a refractometer and adjusted
using additional gradient buffer.
To each ultracentrifuge tube 5.5 µg of DNA and 200 µl of TE were added and all tubes were
balanced with additional TE. The ultracentrifuge tubes were mixed by inverting and centrifuged at
55000 rpm for 65 hours, at 20°C in vacuum.
After the gradient was formed it was separated in fractions of approximately 0.1 ml.. This was done
by introducing 0.1 ml of water via a syringe needle at the top of the column and collecting the same
amount trough a syringe needle at the bottom (figure 1). Immediately after sampling of each
fraction the refractive index was measured and converted to density. Before further processing was
possible each fraction was washed to remove the CsCl salt. This was done by adding 3 volumes of
CsCl conc.
Figure 1. Schematic drawing of
the fraction sampling procedure.

5
DNA free water and 2.4 volumes of isopropanol followed by mixing and 30 min. of centrifugation
at 15,000 rpm. After centrifugation the supernatant was poured of and the pellet was washed two
times by adding 1 ml ethanol, vortexing and centrifugating at 15,000 rpm for 15 min. The ethanol
supernatant was poured off and the pellet was air dried upside down on paper towel until no liquid
was visible. The dried pellet was resuspended in 50 µl DNA free water.
Quantitative PCR
The fractionation of the Stable isotope probing DNA was evaluated using qPCR. One ml of each
cleaned fraction was transfer to an 96 well optical plate containing QuantiFast SYBR Green and
general bacterial primers 515F and 907R. The amplification was done by a two-step cycle with an
initial denaturation at 95 °C for 5 min. follow by 35 cycles of denaturation at 95 °C for 5 sec. and
annealing and elongation at 60 °C for 30 sec.. A plasmid solution diluted in salmon sperm DNA
was used as standard.
Hydrogen production and consumption
Internal hydrogen production by the Berries were investigated by adding 0.5 g of Berries to a 38 ml
air tight glass vial containing 5 ml sterile filtered Pink Berry pond water. Sodium molybdate was
added to the glass vial to inhibit SRB and the vial was flushed with nitrogen gas for 1 minute to
remove all oxygen. Two replicates were made with H2S added to a concentration of 500 µM and 50
µM, respectively. The vials were placed in front of a day light lamb at 37 °C and the hydrogen
concentration was followed the next five days.
The Berry hydrogen consumption was investigated by a setup similar to the hydrogen production
experiment. However, instead of adding molybdate and H2S 1 % hydrogen of the total gas phase
was added to the glass vials. Six of these microcosms were fabricated. Two were incubated in front
of a day light lamp at 37 °C, of which one contained intact berries and one completely grinded
Berries. Two were incubated in the dark at 30 °C and two in front of a 850 nm LED lamp all at 30
°C. All vials were followed for three days.
Hydrogen measurements were done on a Gas Chromatograph.
Oxygen profiling of berries
Pink berries washed twice in sterile filtered pond water were embedded in 1 % low melting point
agarose (Promega) using sterile filtered pond water. The pond water agarose was made either with
no addition of organic compound or with addition of acetate or glycolate. The pH of the media was
adjusted to 7.2 and autoclaved. When the media had cooled to 37 °C it was poured into a Petri dish
and the cleaned berries were distributed in the agarose. When solidified each single berry was cut
out in a cube of agarose and placed upside-down onto a clean agarose surface and incubated at
room temperature for 2 hours.
The oxygen profile of the berries was measured using oxygen micro sensors (unisense.com) with a
tip diameter of 25 µm. The oxygen profile of the berries was measured all the way through the
centre of the consortia. Oxygen flux to the berries was calculated using the linear regression of the
diffusive layer of each profile. The oxygen diffusion flux was calculated (J) by Fick’s 1. Law:
6
Where D is the diffusion coefficient in the given medium and dC/dx is the slope of the change in
concentration with depth in the diffusive layer.
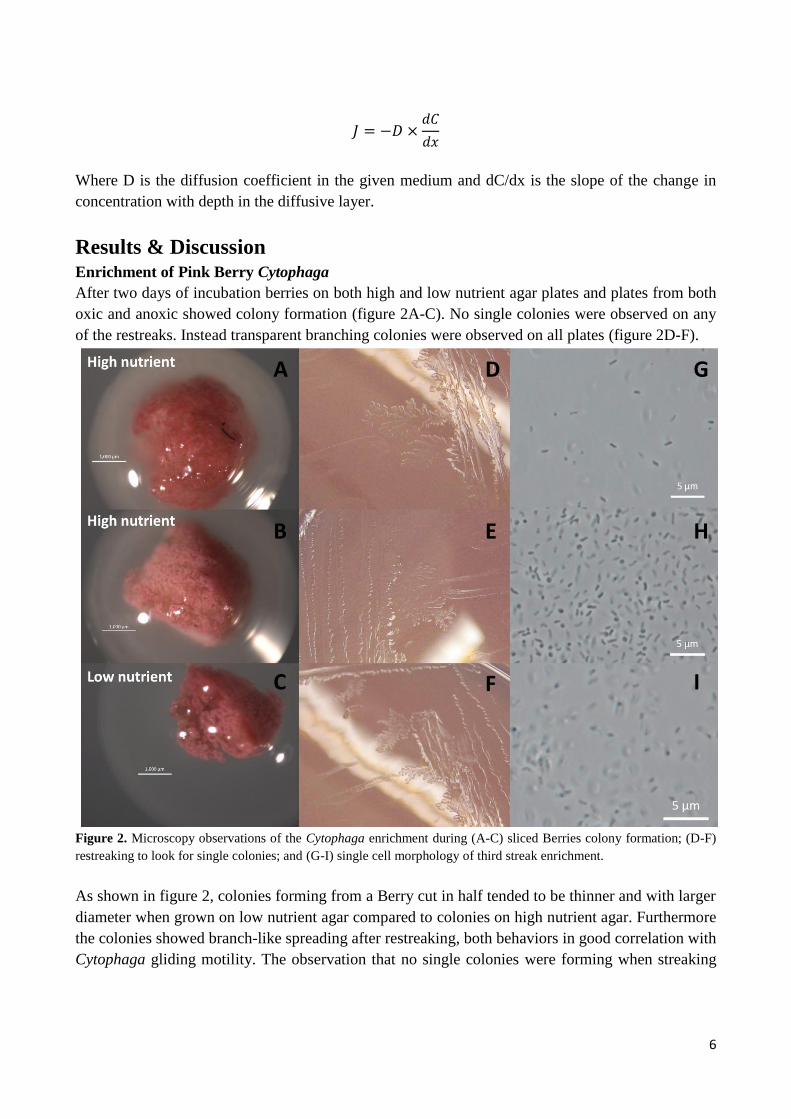
Results & Discussion Enrichment of Pink Berry Cytophaga
After two days of incubation berries on both high and low nutrient agar plates and plates from both
oxic and anoxic showed colony formation (figure 2A-C). No single colonies were observed on any
of the restreaks. Instead transparent branching colonies were observed on all plates (figure 2D-F).
Figure 2. Microscopy observations of the Cytophaga enrichment during (A-C) sliced Berries colony formation; (D-F)
restreaking to look for single colonies; and (G-I) single cell morphology of third streak enrichment.
As shown in figure 2, colonies forming from a Berry cut in half tended to be thinner and with larger
diameter when grown on low nutrient agar compared to colonies on high nutrient agar. Furthermore
the colonies showed branch-like spreading after restreaking, both behaviors in good correlation with
Cytophaga gliding motility. The observation that no single colonies were forming when streaking
A
B
C I
E H
D G
F

7
for isolation was an expected possibility, based on the fact that these organisms live as a consortium
and therefore might be dependent on mutual growth.
All third generation plates were investigated for presence of Cytophaga using specific Cytophaga
primers and using the whole Berry extract as positive control. None of the enrichments amplified
and were therefore not containing any Cytophaga. Observations of the third generation enrichment
showed presence of 1 µm long rod-shaped cells (figure 2G-I). Cytophaga were expected to be long
slim rod shaped (Madigan 2012).
All enrichments were checked for SRBs using sodium molybdate as SRB-inhibitor. No inhibition of
the enrichments was observed compared to the sodium sulfate control (Figure 3).
Figure 3. Test for presence of sulfate reducing bacteria with molybdate (A) added to inhibit the sulfate reducers and
sulfate (B) is added as control.
Stable Isotope Probing
qPCR of each fraction from both labelled and unlabeled samples were plotted with copy number as
a function of fraction density (figure 4; S4). The graph shows that the unlabelled sample contains
DNA in fractions that are both lighter and heavier than those of the labelled sample. This means that
no or very little DNA was labelled in the sample where 13
CO2 was added. If there had been a high
incorporation of 13
CO2 there would have been a shift towards higher density in the qPCR curve of
the heavy labelled sample compared to the unlabelled. The lack of heavy label incorporation is
likely due to insufficient growth of the Pink Berry. When the incubated cells do not divide DNA is
not amplified and therefore the label in not incorporated.
A B

8
Figure 4. Quantitative PCR of density fractionations from
13CO2 labelled berries and of control berries. Arrows indicate
fractions tested for presence of Cytophaga using specific primers.
1000
10000
100000
1000000
10000000
100000000
1,6 1,65 1,7 1,75 1,8 1,85
Co
py#
/ml
CsCl density (g/ml)
Heavy labelled Non labelled
PCR Cytophaga test
Figure 5. PCR to test for presence of Cytophaga in (A) heavy labelled SIP fractions with
densities of 1,667-1,727 g/ml and in (B) control fractions with densities of 1,671-1,727 g/ml.
1,667-1,727 g/ml
1,671-1,727 g/ml
A
B

9
To test if there were an incorporation of 13
CO2 in the Cytophaga that was not detected by qPCR a
simple PCR test was done. Fractions within the expected density span were tested using specific
Cytophaga primer (figure 5). In correlation with the result of qPCR the Cytophaga PCR test showed
that the unlabelled control had Cytophaga 16S rRNA genes in higher density fractions than those of
the heavy labelled sample.
From the qPCR graph (figure 4) it is also clear that the total amount of DNA quantified is greater in
the unlabelled sampled compared to the labelled sample, even though equal amounts of DNA were
added to the ultracentrifuge tube prior to centrifugation. This could be due to a high loss of DNA
during the isopropanol washing and explain the misleading result of the qPCR and the PCR test.
Hydrogen experiments
The hydrogen production experiment was followed for 5 days and no production of hydrogen was
observed during that time. This can either mean that hydrogen is not used as transfer molecule
between PSB and SRB or that that the given conditions were not sufficient for hydrogen production.
At the end of the experiment it was observed that the Berries turned brown and that liquid turned
blue. This indicates that the growth conditions were unfavorable likely due to the addition of
molybdate or the absence of oxygen.
The hydrogen consumption experiment was monitored for 76 hours and during that period only half
of the added hydrogen was consumed in all of the different treatments. If organisms within the
Berries were capable of taking up hydrogen it would have been consumed much faster, therefore the
slow uptake must be caused by a contaminating organism. This confirms the rejection of hydrogen
as possible transfer molecule.
Figure 6. Relative hydrogen consumption as function of time in all six microcosms. All values have been corrected for
volume removed at each sampling point.
0
0,2
0,4
0,6
0,8
1
1,2
0 10 20 30 40 50 60 70 80
Rel
ativ
e h
ydro
gen
co
nce
ntr
atio
n
Incubation time (h)
850 nm (A)
850 nm (B)
Dark (C)
Dark (D)
Full light (whole berries)
Full light (mashed berries)
10
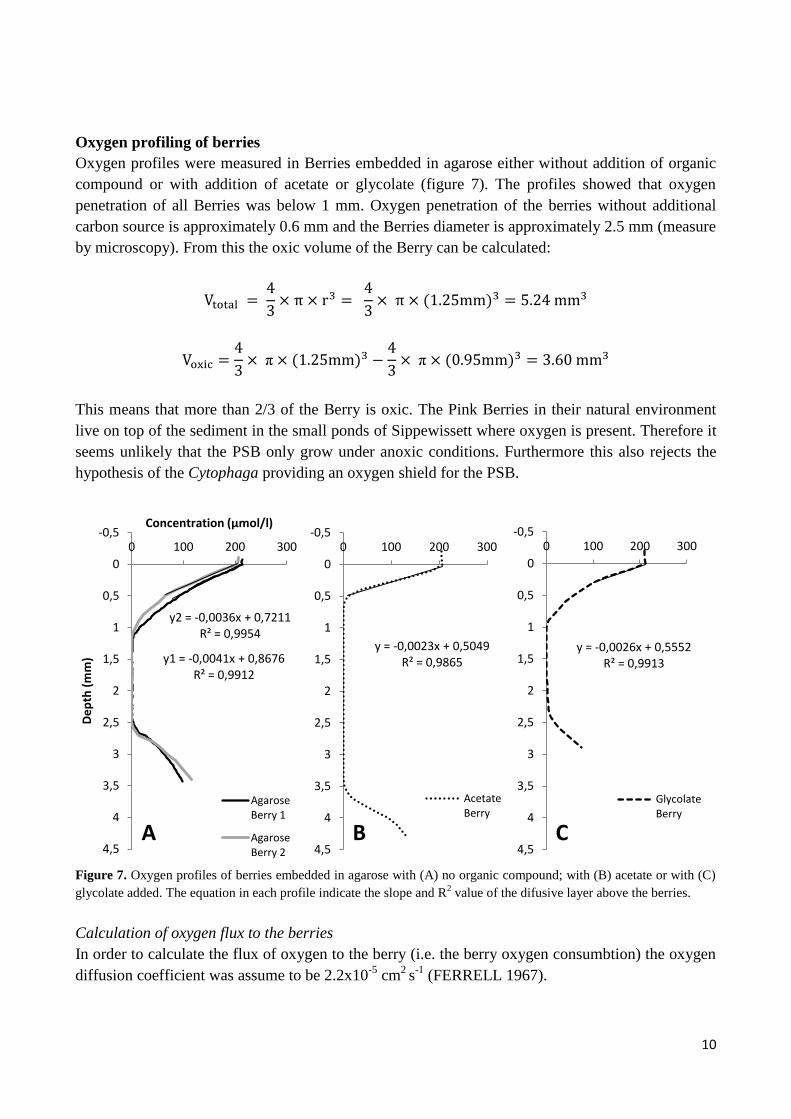
Oxygen profiling of berries
Oxygen profiles were measured in Berries embedded in agarose either without addition of organic
compound or with addition of acetate or glycolate (figure 7). The profiles showed that oxygen
penetration of all Berries was below 1 mm. Oxygen penetration of the berries without additional
carbon source is approximately 0.6 mm and the Berries diameter is approximately 2.5 mm (measure
by microscopy). From this the oxic volume of the Berry can be calculated:
This means that more than 2/3 of the Berry is oxic. The Pink Berries in their natural environment
live on top of the sediment in the small ponds of Sippewissett where oxygen is present. Therefore it
seems unlikely that the PSB only grow under anoxic conditions. Furthermore this also rejects the
hypothesis of the Cytophaga providing an oxygen shield for the PSB.
Figure 7. Oxygen profiles of berries embedded in agarose with (A) no organic compound; with (B) acetate or with (C)
glycolate added. The equation in each profile indicate the slope and R2 value of the difusive layer above the berries.
Calculation of oxygen flux to the berries
In order to calculate the flux of oxygen to the berry (i.e. the berry oxygen consumbtion) the oxygen
diffusion coefficient was assume to be 2.2x10⁻⁵
cm2
s-1
(FERRELL 1967).
y1 = -0,0041x + 0,8676 R² = 0,9912
y2 = -0,0036x + 0,7211 R² = 0,9954
-0,5
0
0,5
1
1,5
2
2,5
3
3,5
4
4,5
0 100 200 300
De
pth
(m
m)
Concentration (µmol/l)
Agarose Berry 1
Agarose Berry 2
y = -0,0023x + 0,5049 R² = 0,9865
-0,5
0
0,5
1
1,5
2
2,5
3
3,5
4
4,5
0 100 200 300
Acetate Berry
y = -0,0026x + 0,5552 R² = 0,9913
-0,5
0
0,5
1
1,5
2
2,5
3
3,5
4
4,5
0 100 200 300
Glycolate Berry
A B C

11
Conversion of slope:
;
;
Diffusionflux without addition of organic compound:
Diffusionflux with addition of acetate:
Diffusionflux with addition of glycolate:
These flux calculations show that the oxygen consumption of Pink Berry incubated with glycolate is
48 % higher than the average consumption by berries without addition of organic compound, while
berry incubated with acetate is 67 % higher. Profiling of a secondary set of berries with acetate and
glycolate show the same tendency as described above (data not shown). This strongly indicates that
organisms in the Berry are capable of using these two compounds for aerobic respiration. The result
could also indicate that SRBs use the organic compounds for reduction of sulfate and release sulfide
which is then oxidized by the PSB using O2 terminal electron acceptor, as described in an earlier
study (Seitz, Nielsen et al. 1993). If the latter is true acetate and glycolate should be considered as
possible transfer molecules between the PSB and the SRB.
Based on this study it is unlikely that hydrogen function as an electron transfer molecule in the Pink
Berry consortia. Therefore future investigations of the transfer mechanism should target different
organic molecule as possible carrier. Oxygen profiles with berries incubated with acetate and
glycolate point towards these two organic compounds as target for a new investigation. The oxygen
profiles also indicate that the Pink Berries should be considered as a mainly aerobic consortia.
The enrichment for Cytophaga in this study was not successful. Nonetheless based on observations
during the enrichment it should be possible with the right techniques and trouble shooting.
12
Similar unsuccessful was the stable isotope probing. The experiment is an obvious approach to
investigate the cross-feeding within the Berry and therefore highly recommended for future
experiments along with MAR-FISH and nanoSIMS, though optimization of Pink Berry growth will
be necessary before such an experiment should be conducted.
Acknowledgement The summer at MBL Microbial Diversity has been both really hard and really exiting and it would
not have been the same without all the fantastic people. I would like to like to thank the course
directors Dan Buckley and Steve Zinder for being so friendly and helpful. I would also like to thank
all the TAs and Susanna for being so enthusiastic and hard working for our sake. And thanks to all
my fellow students for making hard work and long hours in the lab so cheerful.
I would also like to thank MBL Associates Endowed Scholarship Fund and The Gordon & Betty
Moore Foundation for financial support of my stay.

13
References FERRELL, R. T., HIMMELBLAU, D. M. (1967). "Diffusion Coeffkients of Nitrogen and
Oxygen in Water." J. Chem. Eng. Data. Friedrich, M., N. Springer, et al. (1996). "Phylogenetic positions of Desulfofustis glycolicus gen nov, sp nov,
and Syntrophobotulus glycolicus gen nov, sp nov, two new strict anaerobes growing with glycolic acid." International Journal of Systematic Bacteriology 46(4): 1065-1069.
Kirchman, D. L., L. Y. Yu, et al. (2003). "Diversity and abundance of uncultured Cytophaga-like bacteria in the Delaware Estuary." Applied and Environmental Microbiology 69(11): 6587-6596.
Madigan, M. T., Martinko, J. M., Stahl, D.A., Clark, D. P. (2012). "Brock - Biology of Microorganisms." 13th Edition.
Salman, V. (2011). "Study of phylogenetic consistancy, structure and origin of the pink berries in Great and Little Sippewissett salt marsh." MBL microbial Diversity Student report.
Seitz, A. P., T. H. Nielsen, et al. (1993). "PHYSIOLOGY OF PURPLE SULFUR BACTERIA FORMING MACROSCOPIC AGGREGATES IN GREAT SIPPEWISSETT SALT-MARSH, MASSACHUSETTS." FEMS Microbiology Ecology 12(4): 225-236.
Wilbanks, E. G., Humphrey, P. T., Jaekel, U., Moraru, C., Ward, R., Orphan, V. J. (2010). "Eco-physiology of macroscopic pink and green bacterial consortia of
the mighty Little Sippewissett salt marsh." MBL microbial Diversity Student report.

14
Supplementary information
Figure S1. Sampling location of Little Sippewissett salt marsh.

15
Figure S2. Hydrogen experimental microcosms at the end of incubation.
A B
C D
16
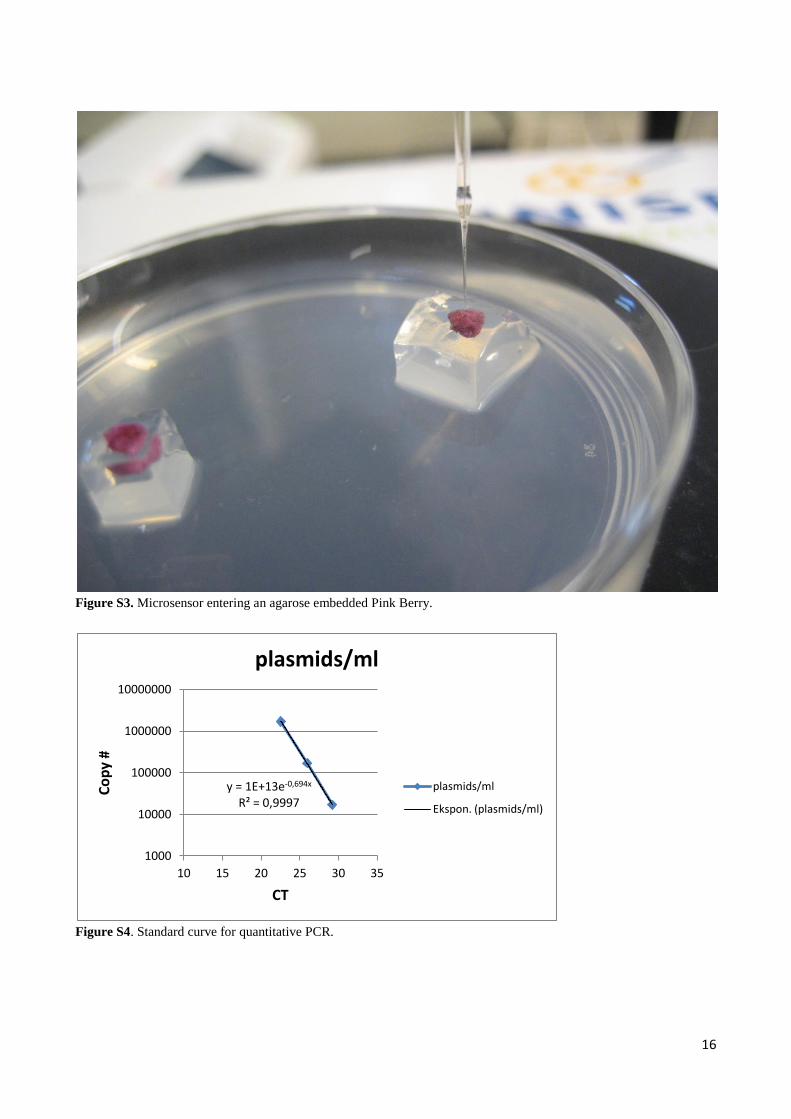
Figure S3. Microsensor entering an agarose embedded Pink Berry.
Figure S4. Standard curve for quantitative PCR.
y = 1E+13e-0,694x R² = 0,9997
1000
10000
100000
1000000
10000000
10 15 20 25 30 35
Co
py
#
CT
plasmids/ml
plasmids/ml
Ekspon. (plasmids/ml)