Embed Size (px)
Citation preview
Heriot-Watt University Research Gateway
Investigations into the nature of spontelectrics: nitrous oxidediluted in xenon
Citation for published version:Cassidy, A, Plekan, O, Dunger, J, Balog, R, Jones, N, Lasne, J, Rosu-Finsen, A, McCoustra, MRS & Field,D 2014, 'Investigations into the nature of spontelectrics: nitrous oxide diluted in xenon', Physical ChemistryChemical Physics, vol. 16, no. 43, pp. 23843-23853. https://doi.org/10.1039/C4CP03659J
Digital Object Identifier (DOI):10.1039/C4CP03659J
Link:Link to publication record in Heriot-Watt Research Portal
Document Version:Publisher's PDF, also known as Version of record
Published In:Physical Chemistry Chemical Physics
Publisher Rights Statement:CC-BY - Gold for Gold voucher
General rightsCopyright for the publications made accessible via Heriot-Watt Research Portal is retained by the author(s) and /or other copyright owners and it is a condition of accessing these publications that users recognise and abide bythe legal requirements associated with these rights.
Take down policyHeriot-Watt University has made every reasonable effort to ensure that the content in Heriot-Watt ResearchPortal complies with UK legislation. If you believe that the public display of this file breaches copyright pleasecontact [email protected] providing details, and we will remove access to the work immediately andinvestigate your claim.
Download date: 22. Jan. 2022

This is an Accepted Manuscript, which has been through the Royal Society of Chemistry peer review process and has been accepted for publication.
Accepted Manuscripts are published online shortly after acceptance, before technical editing, formatting and proof reading. Using this free service, authors can make their results available to the community, in citable form, before we publish the edited article. We will replace this Accepted Manuscript with the edited and formatted Advance Article as soon as it is available.
You can find more information about Accepted Manuscripts in the Information for Authors.
Please note that technical editing may introduce minor changes to the text and/or graphics, which may alter content. The journal’s standard Terms & Conditions and the Ethical guidelines still apply. In no event shall the Royal Society of Chemistry be held responsible for any errors or omissions in this Accepted Manuscript or any consequences arising from the use of any information it contains.
Accepted Manuscript
www.rsc.org/pccp
PCCP
View Article OnlineView Journal
This article can be cited before page numbers have been issued, to do this please use: A. Cassidy, O.
Plekan, J. Dunger, R. Balog, N. C. Jones, J. Lasne, A. Rosu-Finsen, M. R. S. McCoustra and D. Field, Phys.
Chem. Chem. Phys., 2014, DOI: 10.1039/C4CP03659J.
Journal Name ►
ARTICLE TYPE
a Department of Physics and Astronomy, Aarhus University, DK-8000 Aarhus C, Denmark. E-mail: [email protected]
b ISA,Department of Physics and Astronomy, Aarhus University, DK-8000 Aarhus C, Denmark c Institute of Chemical Sciences, Heriot-Watt University, Riccarton, EH14 4AS Edinburgh, United Kingdom d Present address: Sincrotrone Trieste, S.C.p.A. di Interesse Nazionale , 34149 Basovizza , Trieste , Italy
Investigations into the nature of spontelectrics: nitrous oxide diluted in
xenon
Andrew Cassidya, Oksana Plekan
a,d, Jack Dunger
a, Richard Balog
a, Nykola C. Jones
b, Jérôme Lasne
c,
Alexander Rosu-Finsenc, Martin R.S. McCoustra
c and David Field*
a
5
The recent discovery of a new class of solids displaying bulk spontaneous electric fields as high as 108 V/m, so-called ‘spontelectrics’,
poses fundamental and unresolved problems in solid state physics. The purpose of the present work is to delve more deeply into the
nature of the interactions which give rise to the spontelectric effect in films of nitrous oxide (N2O), by observing the variation of the
spontaneous field as the N2O molecules are physically removed from one another by dilution in Xe. Data, obtained using the ASTRID
storage ring, are presented for films diluted by factors = Xe/N2O of 0.9 to 67, at deposition temperatures of 38K, 44K and 48K, where 10
films are laid down by deposition from a gas mixture. Results show that the spontelectric field decreases as increases and that at = 67
for 44K deposition, the spontelectric effect is absent. Reflection-absorption Infrared spectroscopy (RAIRS) data are also reported,
providing insight into the structure of Xe/N2O films and specifically showing that N2O remains dispersed in the Xe/N2O films prepared
here. A simplified theoretical model is developed which illustrates that electric fields can be understood in terms of dilution-dependent
dipole orientation. This model is used to reproduce experimental data up to an average molecular separation, s, of 1.25 nm apart, ~4 15
times that associated with pure solid N2O. The disappearance of the spontelectric effect at larger average distances of separation, between
s = 1.25 nm and s = 1.75 nm, is a phenomenon which cannot be described by any existing model but which shows that dipole-dipole
interactions are an essential ingredient for the creation of the spontelectric state.
1. Introduction 20
Spontelectrics form a new group of solid state materials,1–6 whose
salient characteristic is that they exhibit a spontaneous electric field
within the bulk of the solid. The spontelectric state is unique in the
physics of solids and shows characteristics quite distinct from any
other known solids, such as the ferroelectric state of matter.1 The 25
fundamental interactions which govern the nature of the
spontelectric state and the processes whereby the spontelectric state
is created remain however elusive. It is the purpose of this paper to
shed additional light on the nature of the spontelectric state.
Experimental results reported here for the spontelectric material 30
N2O diluted in Xe, further characterize the spontelectric state and
place additional constraints on any future ab initio models of the
structure or dynamical models of the creation of this state.
For the present, it is evident that the properties of spontelectrics 35
arise through collective effects resulting in the orientation of
permanent dipole moments of the constituent species. However it
remains unclear whether dipole-dipole interactions between the
active species are an essential ingredient of the physics which leads
to this orientation. From hereon, dipole orientation refers to the 40
tendency of dipoles to align in energetically unfavourable
configurations in which + lies on average closer to another + and
correspondingly – to –, where + and – refer to opposite dipolar
ends of the species.
45
Here we address the following questions: (i) how does the degree
of dipole orientation change as the spontelectric species are
removed physically from one another by dilution in a solid matrix
of an inert gas? (ii) Is there some average physical separation
between species at which the spontelectric effect can no longer be 50
observed? The latter is the major qualitative aim of the present
work and essentially tests the hypothesis that dipole-dipole
interactions are necessary to the spontelectric effect - and it is
found that they are necessary.
55
Questions (i) and (ii) are addressed by studying films of N2O
diluted in Xe in which, with increasing dilution, the N2O molecules
are increasingly further apart and are thus more weakly interacting.
N2O is known to exhibit the spontelectric effect and it has been
investigated in considerable detail in earlier work.1,2,4 Indeed it was 60
the first species which was shown to exhibit this effect.2
A parameterized model is developed which adequately addresses
question (i) posed above. This model quantitatively reproduces
observations of a reduction in the spontaneous electric field in 65
films of N2O with increasing dilution in Xe. The answer to
question (ii), as we have indicated, is that when the dilution and the
corresponding average separation of dipolar species is sufficient,
Page 1 of 12 Physical Chemistry Chemical Physics
Phy
sica
lChe
mis
try
Che
mic
alP
hysi
csA
ccep
ted
Man
uscr
ipt
Ope
n A
cces
s A
rtic
le. P
ublis
hed
on 2
4 Se
ptem
ber
2014
. Dow
nloa
ded
on 2
6/09
/201
4 13
:27:
48.
Thi
s ar
ticle
is li
cens
ed u
nder
a C
reat
ive
Com
mon
s A
ttrib
utio
n 3.
0 U
npor
ted
Lic
ence
.View Article Online
DOI: 10.1039/C4CP03659J
there is no evidence of a spontaneous field within the film. This
occurs for a factor of dilution of between 26 and 67 for N2O in Xe
deposited at 44K. We estimate the critical separation of N2O
species for the loss of the spontelectric effect to lie between 1.25
and 1.75 nm. 5
The characteristics of spontelectrics in pure films have recently
been reviewed in [1]. In brief, the spontelectric effect is
experimentally characterized by the following properties:
10
On forming a film by gas phase deposition under ultra-
high vacuum (UHV) of a spontelectric material, a
polarization potential, typically of several volts, appears
spontaneously on the surface of the film.
This potential, linearly proportional to the thickness of 15
the film, may be either positive or negative and gives rise
to a corresponding spontelectric field in the film.
The spontelectric field depends on both the nature of the
material which is deposited and on the temperature at
which the film is deposited. The field for any substance 20
is in general less for higher temperatures (save for methyl
formate deposited at 80K).
At greater than a certain temperature of deposition, no
spontelectric effect can be observed.
Warming of a spontelectric film causes at first little 25
change in the spontaneous potential on the surface of the
film, but a critical temperature is reached at which the
spontelectric effect decays abruptly.
The nature of the substrate surface, upon which
spontelectric films are deposited, has essentially no 30
bearing on the value of the spontelectric field within the
film.
Materials which show the spontelectric effect are very diverse1 and
include species such as nitrous oxide, propane, toluene or 35
chlorotrifluoromethane. Films of material may contain electric
fields which can exceed 108 V/m, noting that breakdown fields of
solids lie between 108 to 109 V/m. These fields are spontaneous,
created without any external stimulus, such as an applied electric
field; hence the term ‘spontelectric’. 40
Spontelectric films constitute a form of the solid state in which
both non-linear effects and non-local, collective effects operate.
The spontelectric effect is non-linear in the sense that in the steady
state the degree of dipole orientation and the spontelectric field are 45
related in a manner such that one depends upon the other: that is,
the degree of dipole orientation depends upon an expansion in
powers of the local field at any dipole and the local field itself
depends on the degree of dipole orientation (see for example
reference 1 and Eqs. 1 and 2 in section 3.1). 50
The spontelectric effect is non-local since it is a bulk phenomenon
which cannot be described in terms of local interactions alone.
Rather, the spontelectric field permeates the entire thickness of the
film and assumes a value which is due to a combination of 55
interactions which extend both over the entire film as well as
through pair-wise or few-body local intermolecular interactions. In
this connection, we observe experimentally that in general a certain
thickness of the sample is required before the spontelectric effect
develops. It is found for example that isoprene deposited at 70K 60
requires >50 monolayers (ML) or toluene at 75K requires >100
ML to develop a substantial electric field (figures 4 and 5 of [1]).
In this respect the spontelectric effect is unique in solid state
physics since the steady-state structures with which it is associated
depend upon effects of long range feedback. This feedback results 65
in such counter-intuitive behaviour as the increase in dipole
orientation, seen in methyl formate, with increasing temperatures
of deposition above 80K.5
Our current qualitative understanding of the spontelectric 70
phenomenon is as follows. On deposition of a dipolar gas to form a
film, species adjust such that dipoles should tend to be configured
on average in head to tail configurations, that is, + to -. However
thermal fluctuations may give rise to temporary configurations in
which are found local average excess of + close to + rather than 75
– and correspondingly an excess of – close to –, that is, net
dipole orientation. Here, fluctuations play the role of the externally
applied field in the standard description of dielectric polarization.
Such dipole aligned configurations are evidently accompanied by a 80
local energy deficit due to repulsions between molecules. These
configurations will create a fleeting and spatially localised electric
field which tends to oppose the orientation. There are now two
possibilities. In the first place, the effect may remain a local
fluctuation which continually forms, dies away and is resurrected, 85
with dipole orientation averaging to zero over time and space. In
the second, given a large enough local fluctuation, there may be a
macroscopic switch to a dipole orientation opposing that set up
through thermal fluctuation. This opposing dipole orientation then
propagates throughout the system via the corresponding opposing 90
electric field. This is posited to occur since, outside the immediate
region of the fluctuation, there is instantaneously no, or less, net
dipole orientation. In this model, the opposing field, in a region
exterior to the fluctuation, sets up dipole orientation in the opposite
sense to the fluctuation itself. It is dipole orientation in this 95
opposite sense which gives rise to the observed spontelectric field.
Note that the film is not itself an isolated system but is fed by an
external cooling system. Moreover the spontelectric state would
not appear to be a minimum energy state, but rather a metastable
state into which the system becomes lodged in its exploration of 100
the phase space on its journey towards the lowest energy
configuration. Having entered the spontelectric state, there are
substantial local barriers to the equilibrium state, much as there are
in, say, amorphous water ice whose minimum energy
configuration, unattainable on any practical timescale at low 105
temperature, is hexagonal ice.
With regard to this qualitative model of the generation of
spontelectrics, an electric field must of course be described by two
regions of established potential and, within the above model, these 110
locations may instantaneously be within a region of a fluctuation
and outside of it. As an important, perhaps crucial, special case,
Page 2 of 12Physical Chemistry Chemical Physics
Phy
sica
lChe
mis
try
Che
mic
alP
hysi
csA
ccep
ted
Man
uscr
ipt
Ope
n A
cces
s A
rtic
le. P
ublis
hed
on 2
4 Se
ptem
ber
2014
. Dow
nloa
ded
on 2
6/09
/201
4 13
:27:
48.
Thi
s ar
ticle
is li
cens
ed u
nder
a C
reat
ive
Com
mon
s A
ttrib
utio
n 3.
0 U
npor
ted
Lic
ence
.View Article Online
DOI: 10.1039/C4CP03659J
one of these regions may be the surface-vacuum interface, the
nature of which may determine the sign of the spontelectric field.
Thus N2O at the surface is configured with the terminal N atom,
which is +, pointing into the vacuum whereas, for example,
CF3Cl is configured with the Cl atom pointing outwards, giving a 5
spontelectric field of the opposite sign.6
In addition, the dynamical model put forward above implies that
the presence of thermal fluctuations alone may be sufficient in
causing the spontelectric phenomenon. However the dynamics of 10
the constituent species will be modulated by local dipole-dipole
interactions. Our present work shows that such dipole-dipole
interactions play a fundamental role in creating the spontelectric
effect and that a model based solely upon independent fluctuations
of the active species is insufficient. 15
2 Experimental method and results
2.1 The experimental method 20
Surface potential measurements were performed on the SGM2
beamline at the ASTRID synchrotron storage ring at Aarhus
University (www.isa.au.dk). The experimental chamber operates
under ultra-high vacuum conditions, with a base pressure of ~2 25
10-10 mbar. Films were grown on a polycrystalline Au substrate
which was cooled via a closed cycle He cryostat to a minimum
temperature of 38K. Before film growth the substrate was cleaned
by annealing to 700K using a cartridge heater. Background vapour
deposition was used to grow all films with the substrate fixed at a 30
chosen temperature.
Throughout, film thicknesses are described in monolayers (ML),
where one ML of coverage was calibrated from temperature
programmed desorption (TPD) experiments. A single ML of 35
nitrous oxide (or xenon) refers to the number of species required to
saturate adsorption sites on the polycrystalline Au surface. The
residual gas pressure in the chamber during dosing was measured
using a quadrupole mass spectrometer, so that a given background
pressure could be correlated to a dosing rate. The residual gas 40
pressure method was used to fine-tune actual final dosing rates
while dosing gas mixtures for the creation of diluted films. Dilution
ratio is defined here as the effective number of ML of Xe divided
by the number of ML of nitrous oxide.
45
Gas mixtures were prepared in an adjacent gas-line, also under
UHV, before admission to the experimental chamber. Nitrous
oxide (≥99.998%) and Xenon (99.99%) were used as received from
Sigma Aldrich. Nitrous oxide was loaded into an initially isolated
gas-line, using a continuous flow of gas, until the pressure required 50
to maintain the dosing flux for a required dose rate (ML min-1),
known from our calibration experiments, was achieved. Xenon gas
was then mixed into the continuous flow of nitrous oxide until the
required dilution, again estimated from initial calibration
experiments, was achieved. Thus the gases were pre-mixed in a 55
known ratio in a flowing system. This flow was then exposed to the
cold substrate in the experimental chamber for an appropriate time
to create a mixed film corresponding to any selected dilution. Films
were built up by the sequential deposition of layers of the xenon-
nitrous oxide matrix. The rate of deposition was typically 5 to 10 60
ML/min. In earlier work we have tested the hypothesis that values
of surface potential may be dependent on deposition rate, by
varying the rate through a factor of ten. No effects were found and
no further checks of this sort were carried out here.
65
As far as was practically possible, the nitrous oxide fluence, in
terms of number of ML, was kept constant for all experiments at
both different temperatures and dilutions. Thus for any deposition
step, a fluence of ~50 ML of nitrous oxide was deposited, with the
xenon fluence adjusted to give the desired degree of dilution. This 70
technique ensured that for separate experiments performed, say,
with increasing dilution, the layer of material contained always the
same total number of N2O molecules, but separated from one
another by an increasing distance by intervening Xe atoms. Thus
the column density of N2O remains approximately constant in all 75
experiments whereas the column length, that is the film thickness,
becomes increasingly greater with greater dilution. For the present
we view N2O as remaining mixed with Xe, rather than separated
from Xe in the deposited film. We return to this point in detail
below. The quoted absolute film thicknesses are accurate to within 80
20-30%, but relative thicknesses for any experiment for a specific
dilution and deposition temperature are accurate to within a few
per cent.
Details of the experimental method for measurement of film 85
surface potentials have been described elsewhere.1 In brief, using
synchrotron radiation from ASTRID, low energy electrons were
produced by photoionization of Ar gas at ~5 meV above threshold
(78.56 nm) in a source chamber and with an energy spread given
by that of the photoionizing radiation, set here to be ~1.5 meV. 90
These low energy electrons were extracted, via a series of lenses,
and formed into a beam. The potentials on the film surfaces are
estimated using the principle that an electron beam formed at the
potential of the centre of the photoionization chamber can just
reach another point, for example the surface of a film or of clean 95
gold, at the same potential, potential barriers apart. Thus if
electrons are formed at a known potential, the potential of their
destination can be measured by the bias that must be applied, either
to their point of formation or their destination, such that a current
just begins to flow. 100
The spontaneous potential appearing on the surface of spontelectric
films is measured by applying such a bias potential to the system
and effectively adjusting this bias in order to null the current. Since
electrons are formed at nominally zero volts with an energy of ~5 105
meV, the beam should therefore just be able to reach a clean Au
target when the target is itself at this same nominal zero (less 5
mV). If the target were covered with a film of spontelectric
material and its surface were not at zero but rather, say, at +5 volts,
due to the spontaneous formation of an electric field within the 110
film, then in order to ensure that the electrons only just reach the
target, it would be necessary to bias the target, or the point of
formation of the electrons, by 5 volts. Measurement of the bias
Page 3 of 12 Physical Chemistry Chemical Physics
Phy
sica
lChe
mis
try
Che
mic
alP
hysi
csA
ccep
ted
Man
uscr
ipt
Ope
n A
cces
s A
rtic
le. P
ublis
hed
on 2
4 Se
ptem
ber
2014
. Dow
nloa
ded
on 2
6/09
/201
4 13
:27:
48.
Thi
s ar
ticle
is li
cens
ed u
nder
a C
reat
ive
Com
mon
s A
ttrib
utio
n 3.
0 U
npor
ted
Lic
ence
.View Article Online
DOI: 10.1039/C4CP03659J
required to locate the onset of a measureable current (~2 fA)
therefore gives the potential on the surface of the film. A small
correction is made to establish a true zero difference between the
clean gold substrate and the potential of formation of the electrons.
This arises from the difference between the work function of the 5
gold substrate and the graphite-covered walls of the
photoionization chamber in which electrons are formed. This
difference is measured for each series of experiments; a typical
value of ~0.25 V is found, in agreement with standard figures. As
emphasized in earlier work, we interrogate the material while 10
perturbing it to a minimum. This was ensured by using very small
currents, typically of 100-200 fA, in order not to reduce
significantly the spontaneous polarization of the film surface or
introduce negative charging. These low currents were detected
using a Keithley 6340 femtoammeter. 15
2.2 Results
Experimental data are shown in Fig. 1 and 2 for deposition of
diluted films at temperatures of 44K and 48K respectively. Fig. 3
shows data at 38K, 44K and 48K with dilutions of 2.1, 2.2 and 2.8 20
respectively. Corresponding voltages per ML of N2O added are
shown in Tables 1, 2 and 3.
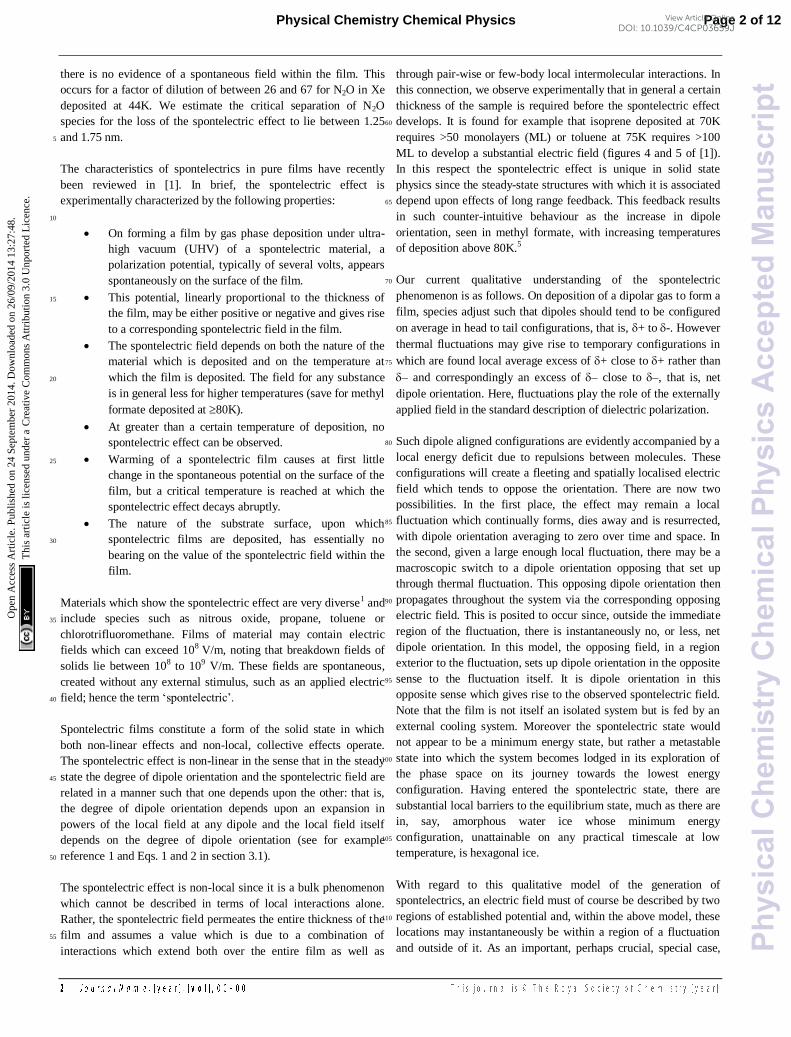
Figure 1. Surface potentials measured for mixtures of N2O and Xe
deposited at 44K for the dilutions shown. The thickness of the layer is 25
expressed as the equivalent number of ML of N2O deposited, excluding Xe.
Note the absence of a spontelectric effect at a dilution, , of 67.
Deposition
Temperature (K)
Dilution : Xe/N2O mV/equivalent ML of
N2O
44 0 25
44 1.0 15
44 26 9
44 67 0
30
Table 1: Values of mV of potential added per equivalent ML of N2O laid
down at 44K, for dilutions, = Xe/N2O, as shown.
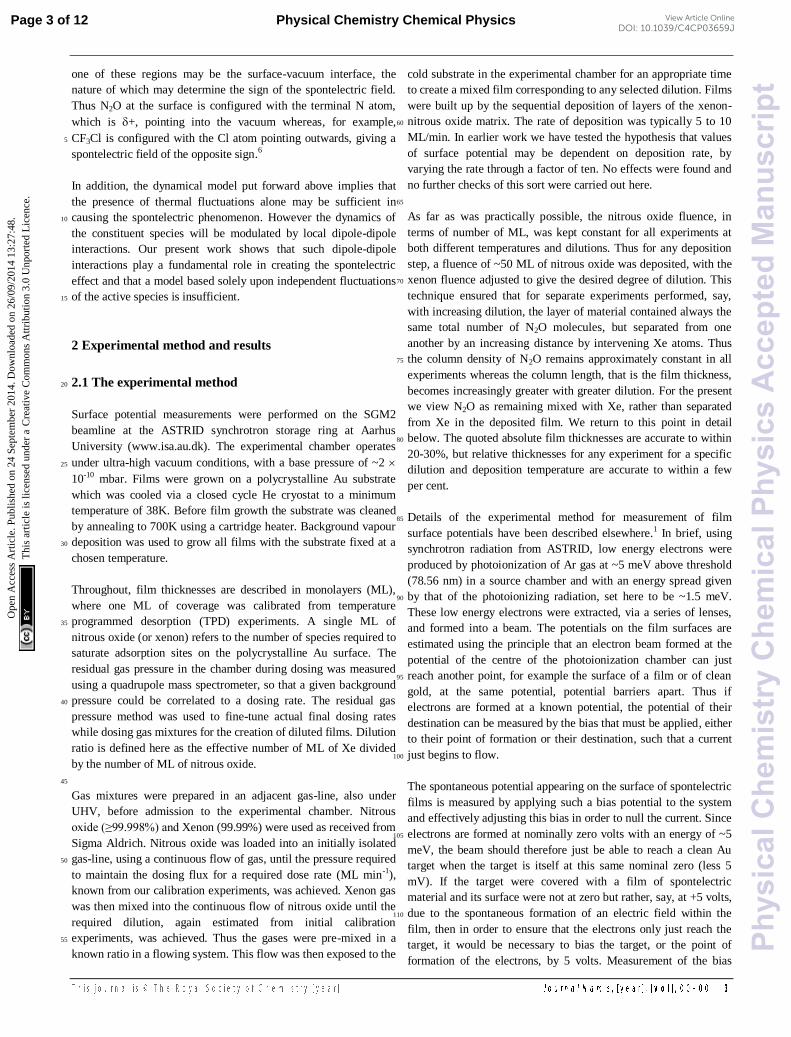
Figure 2. Surface potentials measured for mixtures of N2O and Xe
deposited at 48K for the dilutions shown. The thickness of the layer is 35
expressed as the equivalent number of ML of N2O deposited, excluding Xe.
40
Deposition
Temperature (K)
Dilution : Xe/N2O mV/equivalent ML of
N2O
48 0 21
48 0.9 16
48 2.8 12
48 23 7
Table 2: Values of mV of potential added per equivalent ML of N2O laid 45
down at 48K, for dilutions, = Xe/N2O, as shown.
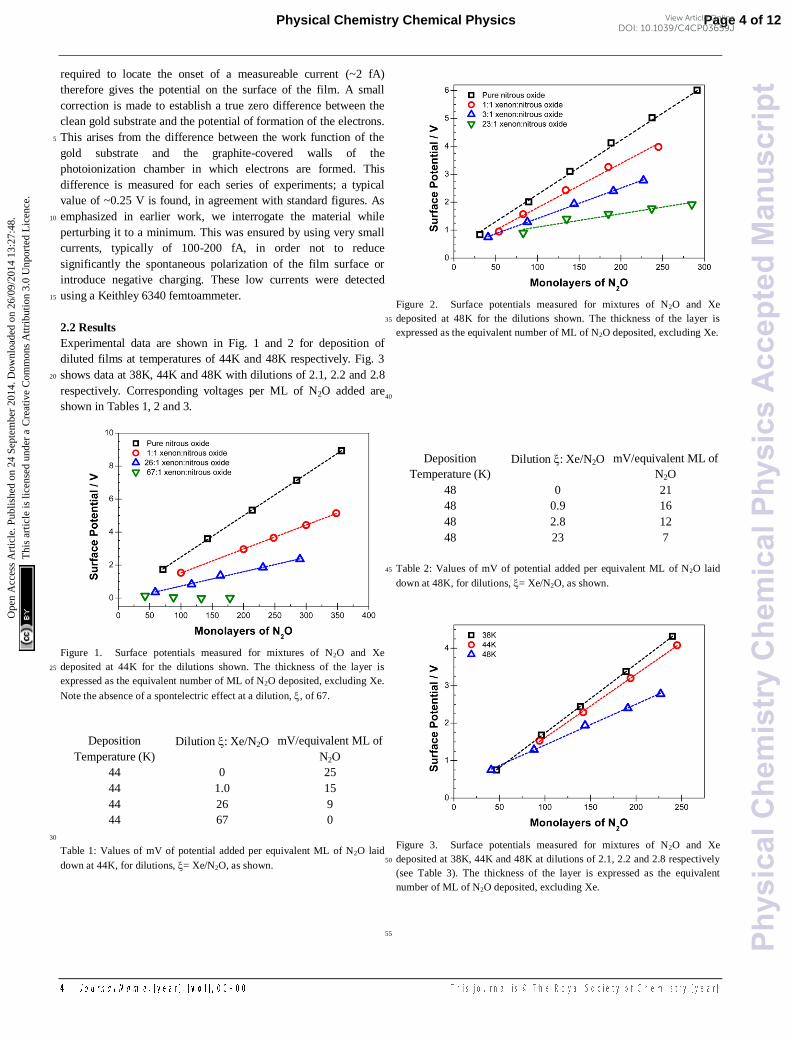
Figure 3. Surface potentials measured for mixtures of N2O and Xe
deposited at 38K, 44K and 48K at dilutions of 2.1, 2.2 and 2.8 respectively 50
(see Table 3). The thickness of the layer is expressed as the equivalent
number of ML of N2O deposited, excluding Xe.
55
Page 4 of 12Physical Chemistry Chemical Physics
Phy
sica
lChe
mis
try
Che
mic
alP
hysi
csA
ccep
ted
Man
uscr
ipt
Ope
n A
cces
s A
rtic
le. P
ublis
hed
on 2
4 Se
ptem
ber
2014
. Dow
nloa
ded
on 2
6/09
/201
4 13
:27:
48.
Thi
s ar
ticle
is li
cens
ed u
nder
a C
reat
ive
Com
mon
s A
ttrib
utio
n 3.
0 U
npor
ted
Lic
ence
.View Article Online
DOI: 10.1039/C4CP03659J
Deposition
Temperature (K)
Dilution : Xe/N2O mV/equivalent ML of
N2O
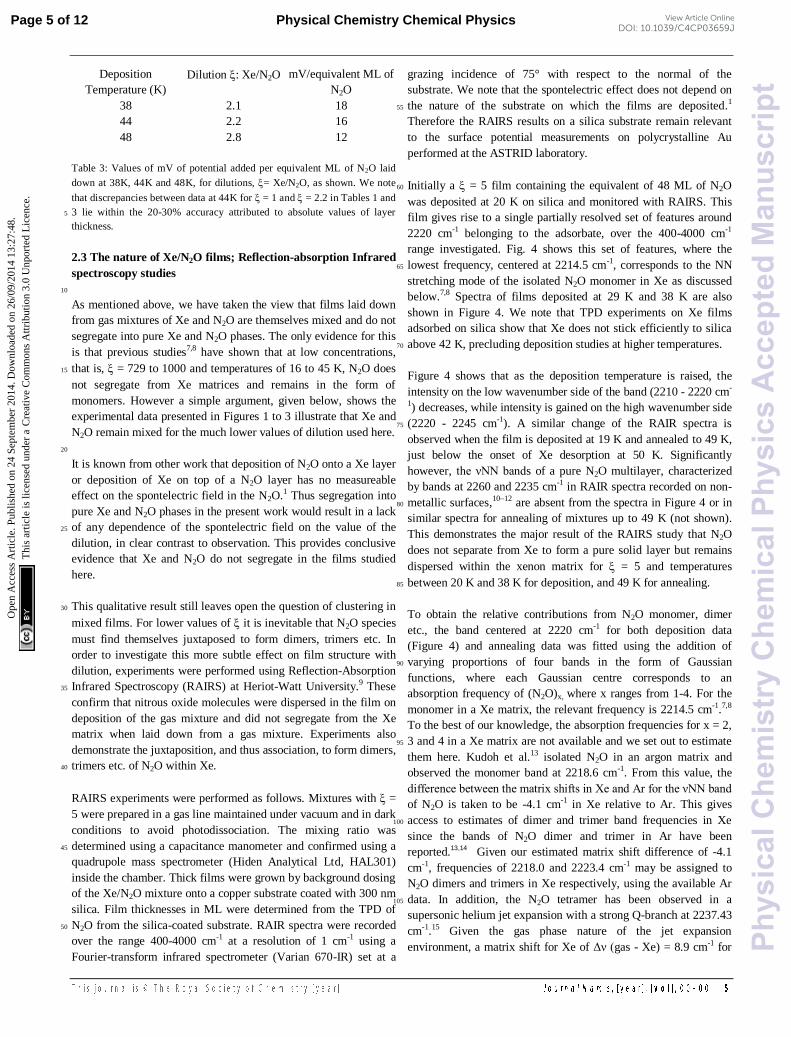
38 2.1 18
44 2.2 16
48 2.8 12
Table 3: Values of mV of potential added per equivalent ML of N2O laid
down at 38K, 44K and 48K, for dilutions, = Xe/N2O, as shown. We note
that discrepancies between data at 44K for = 1 and = 2.2 in Tables 1 and
3 lie within the 20-30% accuracy attributed to absolute values of layer 5
thickness.
2.3 The nature of Xe/N2O films; Reflection-absorption Infrared
spectroscopy studies
10
As mentioned above, we have taken the view that films laid down
from gas mixtures of Xe and N2O are themselves mixed and do not
segregate into pure Xe and N2O phases. The only evidence for this
is that previous studies7,8 have shown that at low concentrations,
that is, = 729 to 1000 and temperatures of 16 to 45 K, N2O does 15
not segregate from Xe matrices and remains in the form of
monomers. However a simple argument, given below, shows the
experimental data presented in Figures 1 to 3 illustrate that Xe and
N2O remain mixed for the much lower values of dilution used here.
20
It is known from other work that deposition of N2O onto a Xe layer
or deposition of Xe on top of a N2O layer has no measureable
effect on the spontelectric field in the N2O.1 Thus segregation into
pure Xe and N2O phases in the present work would result in a lack
of any dependence of the spontelectric field on the value of the 25
dilution, in clear contrast to observation. This provides conclusive
evidence that Xe and N2O do not segregate in the films studied
here.
This qualitative result still leaves open the question of clustering in 30
mixed films. For lower values of it is inevitable that N2O species
must find themselves juxtaposed to form dimers, trimers etc. In
order to investigate this more subtle effect on film structure with
dilution, experiments were performed using Reflection-Absorption
Infrared Spectroscopy (RAIRS) at Heriot-Watt University.9 These 35
confirm that nitrous oxide molecules were dispersed in the film on
deposition of the gas mixture and did not segregate from the Xe
matrix when laid down from a gas mixture. Experiments also
demonstrate the juxtaposition, and thus association, to form dimers,
trimers etc. of N2O within Xe. 40
RAIRS experiments were performed as follows. Mixtures with =
5 were prepared in a gas line maintained under vacuum and in dark
conditions to avoid photodissociation. The mixing ratio was
determined using a capacitance manometer and confirmed using a 45
quadrupole mass spectrometer (Hiden Analytical Ltd, HAL301)
inside the chamber. Thick films were grown by background dosing
of the Xe/N2O mixture onto a copper substrate coated with 300 nm
silica. Film thicknesses in ML were determined from the TPD of
N2O from the silica-coated substrate. RAIR spectra were recorded 50
over the range 400-4000 cm-1 at a resolution of 1 cm-1 using a
Fourier-transform infrared spectrometer (Varian 670-IR) set at a
grazing incidence of 75° with respect to the normal of the
substrate. We note that the spontelectric effect does not depend on
the nature of the substrate on which the films are deposited.1 55
Therefore the RAIRS results on a silica substrate remain relevant
to the surface potential measurements on polycrystalline Au
performed at the ASTRID laboratory.
Initially a = 5 film containing the equivalent of 48 ML of N2O 60
was deposited at 20 K on silica and monitored with RAIRS. This
film gives rise to a single partially resolved set of features around
2220 cm-1 belonging to the adsorbate, over the 400-4000 cm-1
range investigated. Fig. 4 shows this set of features, where the
lowest frequency, centered at 2214.5 cm-1, corresponds to the NN 65
stretching mode of the isolated N2O monomer in Xe as discussed
below.7,8 Spectra of films deposited at 29 K and 38 K are also
shown in Figure 4. We note that TPD experiments on Xe films
adsorbed on silica show that Xe does not stick efficiently to silica
above 42 K, precluding deposition studies at higher temperatures. 70
Figure 4 shows that as the deposition temperature is raised, the
intensity on the low wavenumber side of the band (2210 - 2220 cm-
1) decreases, while intensity is gained on the high wavenumber side
(2220 - 2245 cm-1). A similar change of the RAIR spectra is 75
observed when the film is deposited at 19 K and annealed to 49 K,
just below the onset of Xe desorption at 50 K. Significantly
however, the νNN bands of a pure N2O multilayer, characterized
by bands at 2260 and 2235 cm-1 in RAIR spectra recorded on non-
metallic surfaces,10–12 are absent from the spectra in Figure 4 or in 80
similar spectra for annealing of mixtures up to 49 K (not shown).
This demonstrates the major result of the RAIRS study that N2O
does not separate from Xe to form a pure solid layer but remains
dispersed within the xenon matrix for = 5 and temperatures
between 20 K and 38 K for deposition, and 49 K for annealing. 85
To obtain the relative contributions from N2O monomer, dimer
etc., the band centered at 2220 cm-1 for both deposition data
(Figure 4) and annealing data was fitted using the addition of
varying proportions of four bands in the form of Gaussian 90
functions, where each Gaussian centre corresponds to an
absorption frequency of (N2O)x, where x ranges from 1-4. For the
monomer in a Xe matrix, the relevant frequency is 2214.5 cm-1.7,8
To the best of our knowledge, the absorption frequencies for x = 2,
3 and 4 in a Xe matrix are not available and we set out to estimate 95
them here. Kudoh et al.13 isolated N2O in an argon matrix and
observed the monomer band at 2218.6 cm-1. From this value, the
difference between the matrix shifts in Xe and Ar for the νNN band
of N2O is taken to be -4.1 cm-1 in Xe relative to Ar. This gives
access to estimates of dimer and trimer band frequencies in Xe 100
since the bands of N2O dimer and trimer in Ar have been
reported.13,14 Given our estimated matrix shift difference of -4.1
cm-1, frequencies of 2218.0 and 2223.4 cm-1 may be assigned to
N2O dimers and trimers in Xe respectively, using the available Ar
data. In addition, the N2O tetramer has been observed in a 105
supersonic helium jet expansion with a strong Q-branch at 2237.43
cm-1.15 Given the gas phase nature of the jet expansion
environment, a matrix shift for Xe of Δν (gas - Xe) = 8.9 cm-1 for
Page 5 of 12 Physical Chemistry Chemical Physics
Phy
sica
lChe
mis
try
Che
mic
alP
hysi
csA
ccep
ted
Man
uscr
ipt
Ope
n A
cces
s A
rtic
le. P
ublis
hed
on 2
4 Se
ptem
ber
2014
. Dow
nloa
ded
on 2
6/09
/201
4 13
:27:
48.
Thi
s ar
ticle
is li
cens
ed u
nder
a C
reat
ive
Com
mon
s A
ttrib
utio
n 3.
0 U
npor
ted
Lic
ence
.View Article Online
DOI: 10.1039/C4CP03659J
the νNN band of N2O8 may be applied and gives an expected band
at 2228.5 cm-1 for (N2O)4 in Xe, the value therefore assigned to this
tetramer.
Adopting the above values for vibrational frequencies of (N2O)x, 5
respectively 2214.5 cm-1, 2218 cm-1, 2223.4 cm-1 and 2228.5 cm-1,
and FWHMs of 9.4 cm-1 for all bands except the monomer band
(FWHM = 3.5 cm-1), a fit is shown in the inset of Figure 4 for data
obtained for deposition at 19 K, noting that this case involves
negligible tetramer contribution. We note the appearance of a 10
shoulder at 2216.5 cm-1. This does not relate to any known N2O-
N2O interaction and may be due to an impurity. This shoulder is
not found in spectra taken for higher temperature films.
15
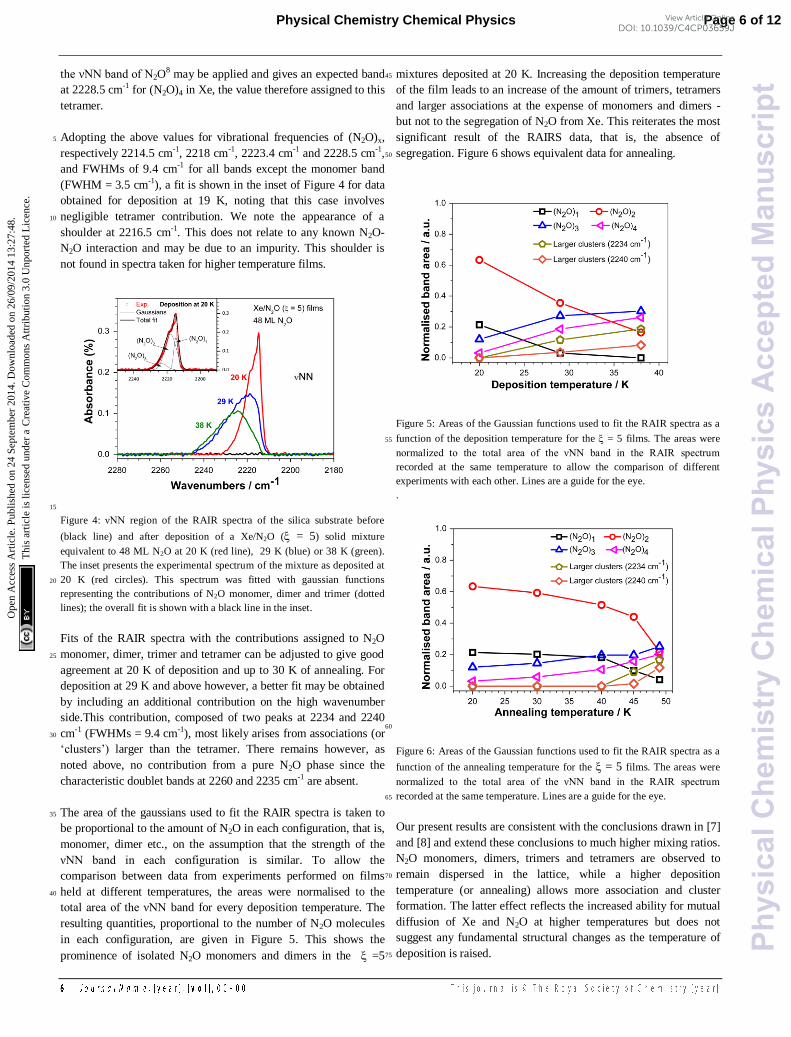
Figure 4: νNN region of the RAIR spectra of the silica substrate before
(black line) and after deposition of a Xe/N2O ( = 5) solid mixture
equivalent to 48 ML N2O at 20 K (red line), 29 K (blue) or 38 K (green).
The inset presents the experimental spectrum of the mixture as deposited at
20 K (red circles). This spectrum was fitted with gaussian functions 20
representing the contributions of N2O monomer, dimer and trimer (dotted
lines); the overall fit is shown with a black line in the inset.
Fits of the RAIR spectra with the contributions assigned to N2O
monomer, dimer, trimer and tetramer can be adjusted to give good 25
agreement at 20 K of deposition and up to 30 K of annealing. For
deposition at 29 K and above however, a better fit may be obtained
by including an additional contribution on the high wavenumber
side.This contribution, composed of two peaks at 2234 and 2240
cm-1 (FWHMs = 9.4 cm-1), most likely arises from associations (or 30
‘clusters’) larger than the tetramer. There remains however, as
noted above, no contribution from a pure N2O phase since the
characteristic doublet bands at 2260 and 2235 cm-1 are absent.
The area of the gaussians used to fit the RAIR spectra is taken to 35
be proportional to the amount of N2O in each configuration, that is,
monomer, dimer etc., on the assumption that the strength of the
νNN band in each configuration is similar. To allow the
comparison between data from experiments performed on films
held at different temperatures, the areas were normalised to the 40
total area of the νNN band for every deposition temperature. The
resulting quantities, proportional to the number of N2O molecules
in each configuration, are given in Figure 5. This shows the
prominence of isolated N2O monomers and dimers in the =5
mixtures deposited at 20 K. Increasing the deposition temperature 45
of the film leads to an increase of the amount of trimers, tetramers
and larger associations at the expense of monomers and dimers -
but not to the segregation of N2O from Xe. This reiterates the most
significant result of the RAIRS data, that is, the absence of
segregation. Figure 6 shows equivalent data for annealing. 50
Figure 5: Areas of the Gaussian functions used to fit the RAIR spectra as a
function of the deposition temperature for the = 5 films. The areas were 55
normalized to the total area of the νNN band in the RAIR spectrum
recorded at the same temperature to allow the comparison of different
experiments with each other. Lines are a guide for the eye.
.
60
Figure 6: Areas of the Gaussian functions used to fit the RAIR spectra as a
function of the annealing temperature for the = 5 films. The areas were
normalized to the total area of the νNN band in the RAIR spectrum
recorded at the same temperature. Lines are a guide for the eye. 65
Our present results are consistent with the conclusions drawn in [7]
and [8] and extend these conclusions to much higher mixing ratios.
N2O monomers, dimers, trimers and tetramers are observed to
remain dispersed in the lattice, while a higher deposition 70
temperature (or annealing) allows more association and cluster
formation. The latter effect reflects the increased ability for mutual
diffusion of Xe and N2O at higher temperatures but does not
suggest any fundamental structural changes as the temperature of
deposition is raised. 75
Page 6 of 12Physical Chemistry Chemical Physics
Phy
sica
lChe
mis
try
Che
mic
alP
hysi
csA
ccep
ted
Man
uscr
ipt
Ope
n A
cces
s A
rtic
le. P
ublis
hed
on 2
4 Se
ptem
ber
2014
. Dow
nloa
ded
on 2
6/09
/201
4 13
:27:
48.
Thi
s ar
ticle
is li
cens
ed u
nder
a C
reat
ive
Com
mon
s A
ttrib
utio
n 3.
0 U
npor
ted
Lic
ence
.View Article Online
DOI: 10.1039/C4CP03659J
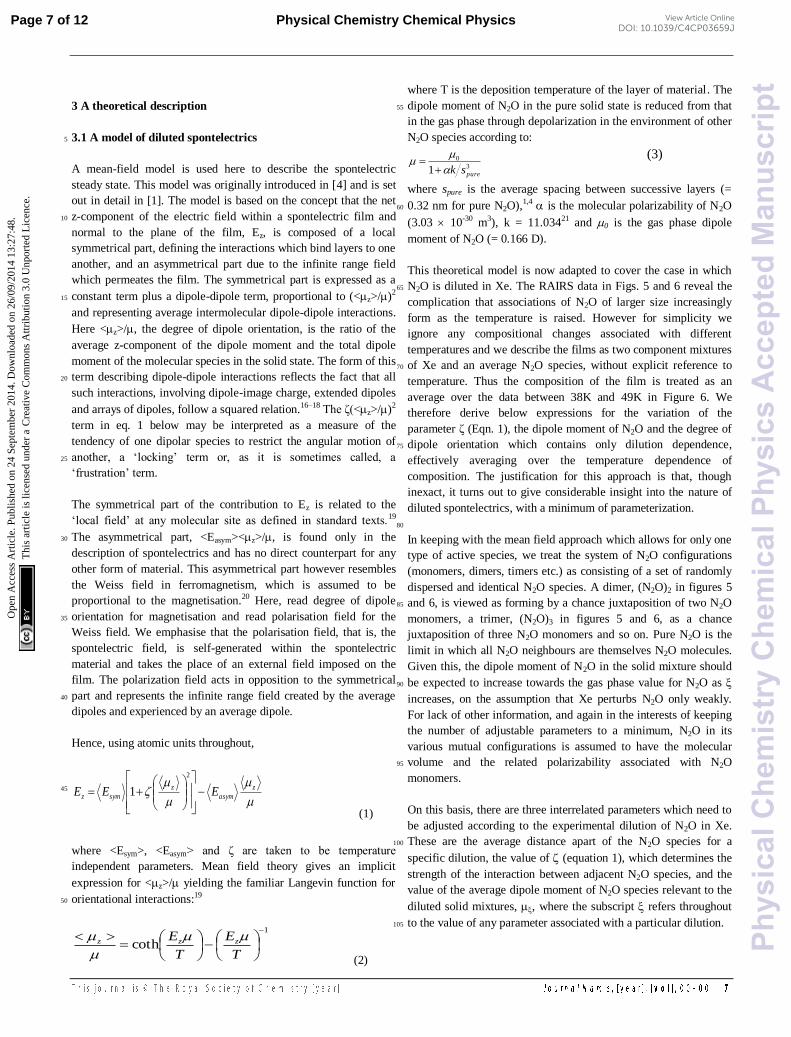
3 A theoretical description
3.1 A model of diluted spontelectrics 5
A mean-field model is used here to describe the spontelectric
steady state. This model was originally introduced in [4] and is set
out in detail in [1]. The model is based on the concept that the net
z-component of the electric field within a spontelectric film and 10
normal to the plane of the film, Ez, is composed of a local
symmetrical part, defining the interactions which bind layers to one
another, and an asymmetrical part due to the infinite range field
which permeates the film. The symmetrical part is expressed as a
constant term plus a dipole-dipole term, proportional to (<z>/)2 15
and representing average intermolecular dipole-dipole interactions.
Here <z>/, the degree of dipole orientation, is the ratio of the
average z-component of the dipole moment and the total dipole
moment of the molecular species in the solid state. The form of this
term describing dipole-dipole interactions reflects the fact that all 20
such interactions, involving dipole-image charge, extended dipoles
and arrays of dipoles, follow a squared relation.16–18 The ζ(<z>/)2
term in eq. 1 below may be interpreted as a measure of the
tendency of one dipolar species to restrict the angular motion of
another, a ‘locking’ term or, as it is sometimes called, a 25
‘frustration’ term.
The symmetrical part of the contribution to Ez is related to the
‘local field’ at any molecular site as defined in standard texts.19
The asymmetrical part, <Easym><z>/, is found only in the 30
description of spontelectrics and has no direct counterpart for any
other form of material. This asymmetrical part however resembles
the Weiss field in ferromagnetism, which is assumed to be
proportional to the magnetisation.20 Here, read degree of dipole
orientation for magnetisation and read polarisation field for the 35
Weiss field. We emphasise that the polarisation field, that is, the
spontelectric field, is self-generated within the spontelectric
material and takes the place of an external field imposed on the
film. The polarization field acts in opposition to the symmetrical
part and represents the infinite range field created by the average 40
dipoles and experienced by an average dipole.
Hence, using atomic units throughout,
z
asym
z
symz EEE
2
1
(1)
45
where <Esym>, <Easym> and ζ are taken to be temperature
independent parameters. Mean field theory gives an implicit
expression for <z>/ yielding the familiar Langevin function for
orientational interactions:19 50
1
coth
T
E
T
E zzz
(2)
where T is the deposition temperature of the layer of material. The
dipole moment of N2O in the pure solid state is reduced from that 55
in the gas phase through depolarization in the environment of other
N2O species according to:
3
0
1 puresk
(3)
where spure is the average spacing between successive layers (=
0.32 nm for pure N2O),1,4 is the molecular polarizability of N2O 60
(3.03 10-30 m3), k = 11.03421 and 0 is the gas phase dipole
moment of N2O (= 0.166 D).
This theoretical model is now adapted to cover the case in which
N2O is diluted in Xe. The RAIRS data in Figs. 5 and 6 reveal the 65
complication that associations of N2O of larger size increasingly
form as the temperature is raised. However for simplicity we
ignore any compositional changes associated with different
temperatures and we describe the films as two component mixtures
of Xe and an average N2O species, without explicit reference to 70
temperature. Thus the composition of the film is treated as an
average over the data between 38K and 49K in Figure 6. We
therefore derive below expressions for the variation of the
parameter ζ (Eqn. 1), the dipole moment of N2O and the degree of
dipole orientation which contains only dilution dependence, 75
effectively averaging over the temperature dependence of
composition. The justification for this approach is that, though
inexact, it turns out to give considerable insight into the nature of
diluted spontelectrics, with a minimum of parameterization.
80
In keeping with the mean field approach which allows for only one
type of active species, we treat the system of N2O configurations
(monomers, dimers, timers etc.) as consisting of a set of randomly
dispersed and identical N2O species. A dimer, (N2O)2 in figures 5
and 6, is viewed as forming by a chance juxtaposition of two N2O 85
monomers, a trimer, (N2O)3 in figures 5 and 6, as a chance
juxtaposition of three N2O monomers and so on. Pure N2O is the
limit in which all N2O neighbours are themselves N2O molecules.
Given this, the dipole moment of N2O in the solid mixture should
be expected to increase towards the gas phase value for N2O as 90
increases, on the assumption that Xe perturbs N2O only weakly.
For lack of other information, and again in the interests of keeping
the number of adjustable parameters to a minimum, N2O in its
various mutual configurations is assumed to have the molecular
volume and the related polarizability associated with N2O 95
monomers.
On this basis, there are three interrelated parameters which need to
be adjusted according to the experimental dilution of N2O in Xe.
These are the average distance apart of the N2O species for a 100
specific dilution, the value of (equation 1), which determines the
strength of the interaction between adjacent N2O species, and the
value of the average dipole moment of N2O species relevant to the
diluted solid mixtures, , where the subscript refers throughout
to the value of any parameter associated with a particular dilution. 105
Page 7 of 12 Physical Chemistry Chemical Physics
Phy
sica
lChe
mis
try
Che
mic
alP
hysi
csA
ccep
ted
Man
uscr
ipt
Ope
n A
cces
s A
rtic
le. P
ublis
hed
on 2
4 Se
ptem
ber
2014
. Dow
nloa
ded
on 2
6/09
/201
4 13
:27:
48.
Thi
s ar
ticle
is li
cens
ed u
nder
a C
reat
ive
Com
mon
s A
ttrib
utio
n 3.
0 U
npor
ted
Lic
ence
.View Article Online
DOI: 10.1039/C4CP03659J
Recollect here that we define the dilution in the film as the ratio of
the number of atoms of Xe and of molecules of N2O condensed
upon the Au substrate ratio, that is, = nXe/nN2O. The fraction of
the total volume of the film taken up by N2O is then given by
5
nN2ON2O/( nN2ON2O+ nXeXe)
and the total volume of the film taken up by Xe is given by
nXeXe/( nN2ON2O+ nXeXe) 10
where N2O is the volume taken up by an N2O molecule and Xe
by a Xe atom in the solid film. In pure N2O, the volume occupied
by the film is given by nN2O 4/3 (rN2O)3 whereas, if diluted, the
same number of molecules of N2O may be found in a volume 15
nN2O Xe + nN2O N2O. Thus one molecule of N2O may be found
in a volume of the solid film of 4/3 r3 for a film composed of a
mixture of N2O and Xe with a dilution . Hence nN2O 4/3 r3, the
total volume of the film, may be expressed as nN2O Xe + nN2O
N2O which yields 20
r = (rxe3 + rN2O
3)1/3
From this it follows the average distance apart of two N2O
molecules, 2r , previously spure (Eq. 3), but now s, is given by 25
2(rxe3 + rN2O
3)1/3. The lattice constant of pure solid Xe on a FCC
lattice yields rXe = 0.219 nm and, for pure N2O, rN2O has been
estimated to be 0.16 nm,4 giving values of s as a function of .
We turn now to the evaluation of . The potential between two 30
dipoles, at an angle to one another, is given by -2/8r
3(1-3
cos2) where is some permittivity. The latter quantity, at the low
temperatures encountered here, should to a good approximation be
independent of . It then follows that /N2O, that is, the ratio of
the value of in the mixture of monomers, dimers, trimers etc. of 35
N2O and that in the pure state, is given by
/N2O = rN2O3
2/ r3N2O
2 (4)
where N2O is the dipole moment of N2O in the pure solid state and 40
is defined above. The variation with of the term multiplying
<Esym> in Eq. 1 will therefore be given by a product of the varying
values of (<z>/ )2 with the corresponding values of <Esym>.
Since the parameter <Esym> is associated with polarisation,
dispersion and covalent forces, we do not attempt to estimate the 45
variation of this term with . Instead <Esym> remains as a variable
parameter in subsequent fitting of theory to experiment.
Using Eq. 3, which relates the solid state dipole moment to the gas
phase value, with Eq. 4 and inserting s = 2r = 2 (rxe3 + rN2O
3)1/3 50
derived above, we obtain
2333
333
22
22
2 8
)(8
XeONON
XeONON
ON rrkr
rrrk
(5)
where and k are defined above in connection with Eq. 3. Implicit
in Eq. 5 is that the variation of the average effective dipole moment 55
of N2O in Xe is given by inserting s = 2 (rxe3 + rN2O
3)1/3 in Eq. 3
to yield
33
0
281 ONXe rrk
(6)
60
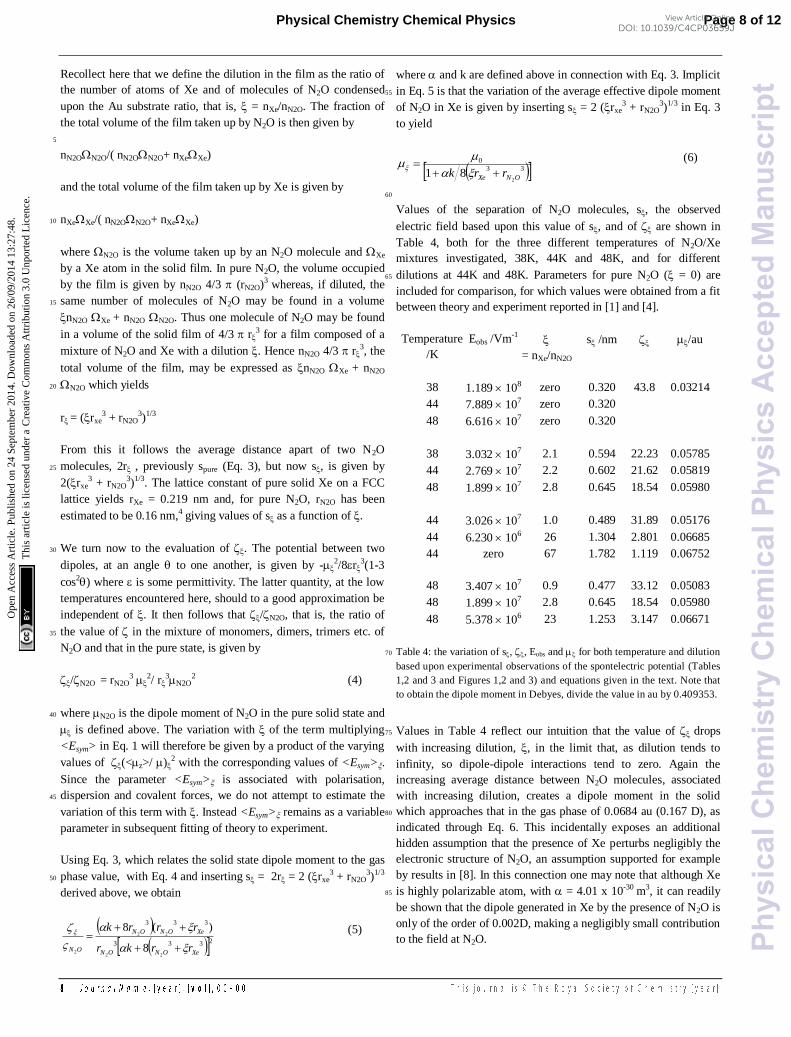
Values of the separation of N2O molecules, s, the observed
electric field based upon this value of s, and of are shown in
Table 4, both for the three different temperatures of N2O/Xe
mixtures investigated, 38K, 44K and 48K, and for different
dilutions at 44K and 48K. Parameters for pure N2O ( = 0) are 65
included for comparison, for which values were obtained from a fit
between theory and experiment reported in [1] and [4].
Temperature
/K
Eobs /Vm-1
= nXe/nN2O
s /nm /au
38 1.189 108 zero 0.320 43.8 0.03214
44 7.889 107 zero 0.320
48 6.616 107 zero 0.320
38 3.032 107 2.1 0.594 22.23 0.05785
44 2.769 107 2.2 0.602 21.62 0.05819
48 1.899 107 2.8 0.645 18.54 0.05980
44 3.026 107 1.0 0.489 31.89 0.05176
44 6.230 106 26 1.304 2.801 0.06685
44 zero 67 1.782 1.119 0.06752
48 3.407 107 0.9 0.477 33.12 0.05083
48 1.899 107 2.8 0.645 18.54 0.05980
48 5.378 106 23 1.253 3.147 0.06671
Table 4: the variation of s, , Eobs and for both temperature and dilution 70
based upon experimental observations of the spontelectric potential (Tables
1,2 and 3 and Figures 1,2 and 3) and equations given in the text. Note that
to obtain the dipole moment in Debyes, divide the value in au by 0.409353.
Values in Table 4 reflect our intuition that the value of drops 75
with increasing dilution, , in the limit that, as dilution tends to
infinity, so dipole-dipole interactions tend to zero. Again the
increasing average distance between N2O molecules, associated
with increasing dilution, creates a dipole moment in the solid
which approaches that in the gas phase of 0.0684 au (0.167 D), as 80
indicated through Eq. 6. This incidentally exposes an additional
hidden assumption that the presence of Xe perturbs negligibly the
electronic structure of N2O, an assumption supported for example
by results in [8]. In this connection one may note that although Xe
is highly polarizable atom, with = 4.01 x 10⁻³⁰ m3, it can readily 85
be shown that the dipole generated in Xe by the presence of N2O is
only of the order of 0.002D, making a negligibly small contribution
to the field at N2O.
Page 8 of 12Physical Chemistry Chemical Physics
Phy
sica
lChe
mis
try
Che
mic
alP
hysi
csA
ccep
ted
Man
uscr
ipt
Ope
n A
cces
s A
rtic
le. P
ublis
hed
on 2
4 Se
ptem
ber
2014
. Dow
nloa
ded
on 2
6/09
/201
4 13
:27:
48.
Thi
s ar
ticle
is li
cens
ed u
nder
a C
reat
ive
Com
mon
s A
ttrib
utio
n 3.
0 U
npor
ted
Lic
ence
.View Article Online
DOI: 10.1039/C4CP03659J
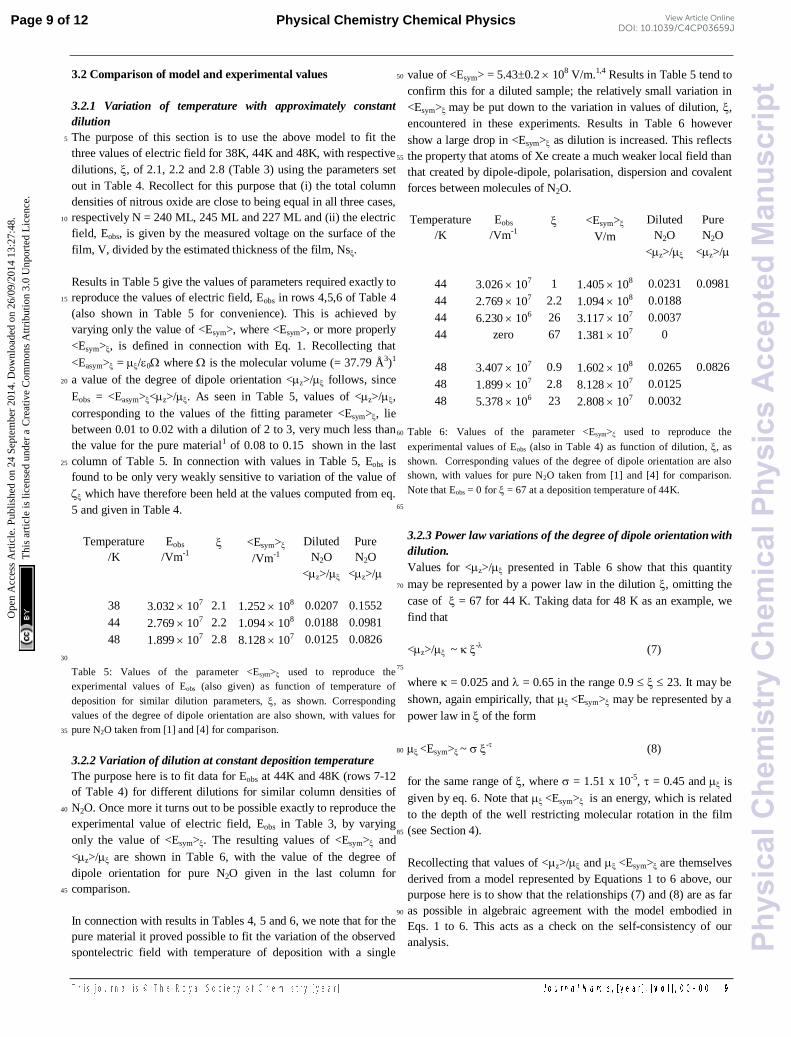
3.2 Comparison of model and experimental values
3.2.1 Variation of temperature with approximately constant
dilution
The purpose of this section is to use the above model to fit the 5
three values of electric field for 38K, 44K and 48K, with respective
dilutions, , of 2.1, 2.2 and 2.8 (Table 3) using the parameters set
out in Table 4. Recollect for this purpose that (i) the total column
densities of nitrous oxide are close to being equal in all three cases,
respectively N = 240 ML, 245 ML and 227 ML and (ii) the electric 10
field, Eobs, is given by the measured voltage on the surface of the
film, V, divided by the estimated thickness of the film, Ns.
Results in Table 5 give the values of parameters required exactly to
reproduce the values of electric field, Eobs in rows 4,5,6 of Table 4 15
(also shown in Table 5 for convenience). This is achieved by
varying only the value of <Esym>, where <Esym>, or more properly
<Esym>, is defined in connection with Eq. 1. Recollecting that
<Easym> = /0 where is the molecular volume (= 37.79 Å3)1
a value of the degree of dipole orientation <z>/ follows, since 20
Eobs = <Easym><z>/. As seen in Table 5, values of <z>/,
corresponding to the values of the fitting parameter <Esym>, lie
between 0.01 to 0.02 with a dilution of 2 to 3, very much less than
the value for the pure material1 of 0.08 to 0.15 shown in the last
column of Table 5. In connection with values in Table 5, Eobs is 25
found to be only very weakly sensitive to variation of the value of
which have therefore been held at the values computed from eq.
5 and given in Table 4.
Temperature
/K
Eobs
/Vm-1
<Esym>
/Vm-1
Diluted
N2O
<z>/
Pure
N2O
<z>/
38 3.032 107 2.1 1.252 108 0.0207 0.1552
44 2.769 107 2.2 1.094 108 0.0188 0.0981
48 1.899 107 2.8 8.128 107 0.0125 0.0826
30
Table 5: Values of the parameter <Esym> used to reproduce the
experimental values of Eobs (also given) as function of temperature of
deposition for similar dilution parameters, , as shown. Corresponding
values of the degree of dipole orientation are also shown, with values for
pure N2O taken from [1] and [4] for comparison. 35
3.2.2 Variation of dilution at constant deposition temperature
The purpose here is to fit data for Eobs at 44K and 48K (rows 7-12
of Table 4) for different dilutions for similar column densities of
N2O. Once more it turns out to be possible exactly to reproduce the 40
experimental value of electric field, Eobs in Table 3, by varying
only the value of <Esym>. The resulting values of <Esym> and
<z>/ are shown in Table 6, with the value of the degree of
dipole orientation for pure N2O given in the last column for
comparison. 45
In connection with results in Tables 4, 5 and 6, we note that for the
pure material it proved possible to fit the variation of the observed
spontelectric field with temperature of deposition with a single
value of <Esym> = 5.430.2 108 V/m.1,4 Results in Table 5 tend to 50
confirm this for a diluted sample; the relatively small variation in
<Esym> may be put down to the variation in values of dilution, ,
encountered in these experiments. Results in Table 6 however
show a large drop in <Esym> as dilution is increased. This reflects
the property that atoms of Xe create a much weaker local field than 55
that created by dipole-dipole, polarisation, dispersion and covalent
forces between molecules of N2O.
Temperature
/K
Eobs
/Vm-1
<Esym>
V/m
Diluted
N2O
<z>/
Pure
N2O
<z>/
44 3.026 107 1 1.405 108 0.0231 0.0981
44 2.769 107 2.2 1.094 108 0.0188
44 6.230 106 26 3.117 107 0.0037
44 zero 67 1.381 107 0
48 3.407 107 0.9 1.602 108 0.0265 0.0826
48 1.899 107 2.8 8.128 107 0.0125
48 5.378 106 23 2.808 107 0.0032
Table 6: Values of the parameter <Esym> used to reproduce the 60
experimental values of Eobs (also in Table 4) as function of dilution, , as
shown. Corresponding values of the degree of dipole orientation are also
shown, with values for pure N2O taken from [1] and [4] for comparison.
Note that Eobs = 0 for = 67 at a deposition temperature of 44K.
65
3.2.3 Power law variations of the degree of dipole orientation with
dilution.
Values for <z>/ presented in Table 6 show that this quantity
may be represented by a power law in the dilution , omitting the 70
case of = 67 for 44 K. Taking data for 48 K as an example, we
find that
<z>/ ~ - (7)
75
where = 0.025 and = 0.65 in the range 0.9 23. It may be
shown, again empirically, that <Esym> may be represented by a
power law in of the form
<Esym> ~ - (8) 80
for the same range of , where = 1.51 x 10⁻⁵, = 0.45 and is
given by eq. 6. Note that <Esym> is an energy, which is related
to the depth of the well restricting molecular rotation in the film
(see Section 4). 85
Recollecting that values of <z>/ and <Esym> are themselves
derived from a model represented by Equations 1 to 6 above, our
purpose here is to show that the relationships (7) and (8) are as far
as possible in algebraic agreement with the model embodied in 90
Eqs. 1 to 6. This acts as a check on the self-consistency of our
analysis.
Page 9 of 12 Physical Chemistry Chemical Physics
Phy
sica
lChe
mis
try
Che
mic
alP
hysi
csA
ccep
ted
Man
uscr
ipt
Ope
n A
cces
s A
rtic
le. P
ublis
hed
on 2
4 Se
ptem
ber
2014
. Dow
nloa
ded
on 2
6/09
/201
4 13
:27:
48.
Thi
s ar
ticle
is li
cens
ed u
nder
a C
reat
ive
Com
mon
s A
ttrib
utio
n 3.
0 U
npor
ted
Lic
ence
.View Article Online
DOI: 10.1039/C4CP03659J
We now introduce two approximations both of which may be
justified numerically in the present case. The first is that coth(x) -
1/x = 1/3 x in Eq. 2 and the second derives from an algebraic
analysis, based on the first approximation, which shows that the
degree of dipole orientation <z>/ may be expressed as d3d4/2d2 5
where 33
1 2 XeON rrd
2
1
2
1
2
02 )8(3256 kdTdd
3d 43232
1
22
1
2
22/)8()8( ONON rkrkdd
4d 1
32/[
2dr ON
23)8(
2kr ON ] 10
given that numerically d3/d22 <<1.
We then find that:
15
])8(3
25613[
2
1
2
1
2
0
dkT
dTEsymz
(9)
We need now to show that the rhs of Eq. 9 can be written in the
form - as found by fitting to experimental values (Eq. 7).
However we do not know, save from experiment, how <Esym> 20
varies with , that is essentially how the field in the environment of
an average N2O species depends on the degree of dilution of N2O
in Xe. To proceed, we therefore introduce the observation that
<Esym> can be replaced by -, Eq. 8, noting also that d1 in Eq. 9
contains . We therefore obtain: 25
]
83
25613[
2233
2332
0
2
2
XeON
XeON
z
rrkT
rrT
(10)
This shows that the variation of <z>/ with dilution, , indeed
follows an exponential form, as required by Eq. 7, but modified by 30
the denominator in Eq. 10.
For Eqs. 7 and 8 to be consistent as desired, it should be possible
approximately to represent Eq. 10 by - such that ~ 0.0246 and
~ 0.6533 when ~ 1.51 10-5 and ~ 0.45, as derived 35
empirically. If for example we hold and at the empirical values
and allow and to vary, we find that for = 1.45 10-5 and =
0.59 we obtain <z>/ vs in better than 1% agreement at low
dilution rising to ~6.5% for = 23. Alternatively, consistency of
Eqs. 7 and 8 can for example be achieved within 3% for all values 40
of by varying all four parameters, , , and with = 0.028
and = 0.6 when =1.43 x 10⁻⁵ and = 0.5.
This brief analysis demonstrates that the parameterization
introduced intuitively into the theoretical model, in particular in 45
developing Eqs. 5 and 6 for and , is consistent with the
observed exponentially decreasing behaviour of the degree of
dipole orientation with dilution.
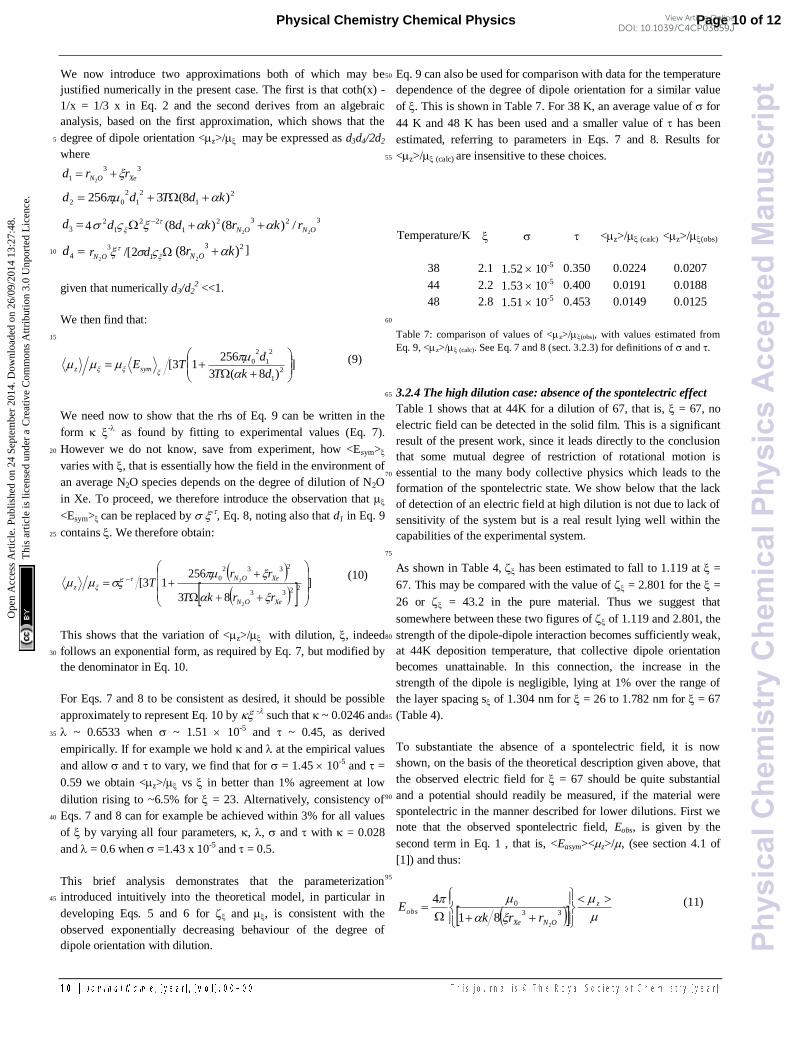
Eq. 9 can also be used for comparison with data for the temperature 50
dependence of the degree of dipole orientation for a similar value
of . This is shown in Table 7. For 38 K, an average value of for
44 K and 48 K has been used and a smaller value of has been
estimated, referring to parameters in Eqs. 7 and 8. Results for
<z>/ (calc) are insensitive to these choices. 55
Temperature/K <z>/ (calc) <z>/(obs)
38 2.1 1.52 10-5 0.350 0.0224 0.0207
44 2.2 1.53 10-5 0.400 0.0191 0.0188
48 2.8 1.51 10-5 0.453 0.0149 0.0125
60
Table 7: comparison of values of <z>/(obs), with values estimated from
Eq. 9, <z>/ (calc). See Eq. 7 and 8 (sect. 3.2.3) for definitions of and .
3.2.4 The high dilution case: absence of the spontelectric effect 65
Table 1 shows that at 44K for a dilution of 67, that is, = 67, no
electric field can be detected in the solid film. This is a significant
result of the present work, since it leads directly to the conclusion
that some mutual degree of restriction of rotational motion is
essential to the many body collective physics which leads to the 70
formation of the spontelectric state. We show below that the lack
of detection of an electric field at high dilution is not due to lack of
sensitivity of the system but is a real result lying well within the
capabilities of the experimental system.
75
As shown in Table 4, has been estimated to fall to 1.119 at =
67. This may be compared with the value of = 2.801 for the =
26 or = 43.2 in the pure material. Thus we suggest that
somewhere between these two figures of of 1.119 and 2.801, the
strength of the dipole-dipole interaction becomes sufficiently weak, 80
at 44K deposition temperature, that collective dipole orientation
becomes unattainable. In this connection, the increase in the
strength of the dipole is negligible, lying at 1% over the range of
the layer spacing s of 1.304 nm for = 26 to 1.782 nm for = 67
(Table 4). 85
To substantiate the absence of a spontelectric field, it is now
shown, on the basis of the theoretical description given above, that
the observed electric field for = 67 should be quite substantial
and a potential should readily be measured, if the material were 90
spontelectric in the manner described for lower dilutions. First we
note that the observed spontelectric field, Eobs, is given by the
second term in Eq. 1 , that is, <Easym><z>/, (see section 4.1 of
[1]) and thus:
95
z
ONXe
obsrrk
E33
0
281
4 (11)
Page 10 of 12Physical Chemistry Chemical Physics
Phy
sica
lChe
mis
try
Che
mic
alP
hysi
csA
ccep
ted
Man
uscr
ipt
Ope
n A
cces
s A
rtic
le. P
ublis
hed
on 2
4 Se
ptem
ber
2014
. Dow
nloa
ded
on 2
6/09
/201
4 13
:27:
48.
Thi
s ar
ticle
is li
cens
ed u
nder
a C
reat
ive
Com
mon
s A
ttrib
utio
n 3.
0 U
npor
ted
Lic
ence
.View Article Online
DOI: 10.1039/C4CP03659J
Using atomic units, 4/and k = 246.466 and
inserting values of 0, rXe (0.219 nm) and rN2O (0.16 nm), we
obtain:
/3127.01003348.0
z
obsE (12) 5
where for simplicity we have used rXe3 >> rN2O
3 introducing an
error of 4% for = 67. Thus for = 67, Eobs should take the value
0.0033 <z>/ or 1.7 x 10⁹ <z>/ V/m. For 44K, experimental
data in Table 4 show that <z>/ = 0.0258 -0.585, yielding a value 10
of dipole orientation of 0.0022 for = 67, a figure which may be
compared with 0.0037 for = 26 at 44K in Table 6. Thus if the
material remained spontelectric at = 67, one should measure an
electric field of 3.74 x 10⁶ V/m.
15
Experiments have for example been performed for a total column
density of 175 ML of N2O equivalent to a total film thickness of
175 x 1.782 = 312 nm (see table 2, 44K, = 67). This would yield
a potential on the surface of ~1.16 V given a field of 3.74 x 10⁶
V/m. We find a measurement of zero within experimental error, 20
whereas if the material remained spontelectric at this dilution, the
above estimate shows that a value in excess of 1 V should be
observed. Hence the lack of detection of a spontelectric effect at
= 67 clearly shows that the spontelectric effect is switched off at
sufficiently high dilution. 25
4 Concluding remarks
At the outset two questions were posed whose answers had as their 30
object the provision of greater insight into the nature of the
spontelectric state. These questions were (i) how does the degree of
dipole orientation change as the spontelectric species are removed
physically from one another? (ii) is there some physical separation
between species or species dilution at which the spontelectric effect 35
can no longer be observed?
With respect to the first question, we find that dipole orientation is
reduced on dilution of N2O in Xe. Thus for the same column
density of material, a smaller spontaneous electric field is 40
generated when the N2O molecules are positioned on average
further apart. With respect to the second, we find that given
sufficient dilution, the spontelectric effect is no longer present.
There are two factors at play here in the context of both the 45
questions posed and the answers given. First, we recollect that the
dipole term in Eq. 1, 2 zsymE may be interpreted as a
measure of the tendency of one dipole to restrict the angular
motion of another. The first term of Eq.1, simply <Esym>, also
effectively attempts to hold the dipole in a vice-like grip, that is, 50
from both sides, restricting any form of motion. The relative
importance of these two terms, <Esym> and 2 zsymE , is
strongly dependent on the degree of dilution. For example at zero
dilution the dipole-dipole interaction is 30% (at 48K) to 45% (at
44K) of the total symmetric field 21 zsymE , whereas at 55
high dilution, = 23 to 26, this reduces to 0.003% to 0.004% (and,
at = 67, to zero at 44K). At the same time the total symmetrical
field falls by a factor of ~25 from between 7.13 - 7.85 x 10⁸ V/m
for pure N2O1 to 2.8 - 3 107 V/m for = 23 to 26, where figures
span the range 48K to 44K. This reflects both the drop in dipole-60
dipole interactions and the weaker interaction between N2O with
Xe, compared with N2O with itself, as dilution is increased. This is
itself accompanied by an increase in effective dipole moment in the
solid by a factor of ~2.1, resulting in a net decrease in <Esym>.
by a factor of ~12 on dilution from pure N2O to = 23 - 26. Thus 65
in diluted mixtures of N2O and Xe, the N2O molecules sit in a well
which restricts rotation whose depth is an order of magnitude
smaller at = 23 to 26 compared with pure N2O or a factor of ~5
between = 0.9 to 1 and 23 to 26.
70
At high dilution, rotational motion is therefore much less restricted
and thermal energy can overpower <Esym>.. For example for =
26 at 44K, <Esym>. is ~3% of kT whereas the figure for = 1 is
~10% and for pure N2O is ~25%. Given that average dipole
orientation in the steady state is in part related to competition 75
between random thermal motion and the restriction of rotational
motion, it is therefore evident why <z>/ falls to small values at
high dilution. For = 67 for 44K, <Esym>. is ~1.3% of kT
indicating that at some point where the <Esym>. electrical
interaction lies between 1 and 3% of kT, the spontelectric effect is 80
altogether inhibited. The conclusion is that a local field of
sufficient strength to restrict rotation is necessary to the
development of the non-local many body collective physics
associated with spontelectrics and that the local field-dipole
interaction must be at least 1 to 3% of kT. This is not reflected in 85
the theoretical description of spontelectrics presented here, which
makes the assumption that a spontelectric state may always be
achieved. However it sets a goal for molecular dynamics
simulations of the spontelectric effect.
90
Second, results may be understood in the context of the model
involving fluctuating motions of dipoles, put forward in the
introduction, to illustrate how the spontelectric state may form
dynamically. Some fluctuation, whose average physical extent
depends on the temperature of deposition and the degree of 95
dilution, leads to local dipole orientation <z>/ , which we note
will be in the opposite sense to that encountered in the spontelectric
state. A fluctuation is therefore able to create a fleeting
polarisation, (<z>/) . (/), and thus a field will briefly arise.
We suggest that the more dilute the material the less the value of 100
dipole orientation which will be formed through fluctuations. This
arises because of the greater freedom of rotational movement
associated with greater dilution, as described above in relation to
the spontelectric state but equally applicable here. The
compensating field, the spontelectric field, will be correspondingly 105
less as dilution is increased.
Page 11 of 12 Physical Chemistry Chemical Physics
Phy
sica
lChe
mis
try
Che
mic
alP
hysi
csA
ccep
ted
Man
uscr
ipt
Ope
n A
cces
s A
rtic
le. P
ublis
hed
on 2
4 Se
ptem
ber
2014
. Dow
nloa
ded
on 2
6/09
/201
4 13
:27:
48.
Thi
s ar
ticle
is li
cens
ed u
nder
a C
reat
ive
Com
mon
s A
ttrib
utio
n 3.
0 U
npor
ted
Lic
ence
.View Article Online
DOI: 10.1039/C4CP03659J
Acknowledgements
We gratefully acknowledge support of the staff of the Aarhus
Synchrotron Radiation Laboratory (ISA), the Danish Research
Council, a Marie Curie Intra-European Fellowship 009786 (RB),
European Community FP7-ITN Marie-Curie Programme (LASSIE 5
project, grant agreement #238258) (AC, JL), the Lundbeck
Foundation (RB) and Heriot-Watt University for a James Watt
scholarship (ARF).
Notes and References 10
*Author to whom correspondence should be addressed
1. D. Field, O. Plekan, A. Cassidy, R. Balog, N. C. Jones, and J.
Dunger, Int. Rev. Phys. Chem., 2013, 32, 345–392.
2. R. Balog, P. Cicman, N. Jones, and D. Field, Phys. Rev. Lett., 15
2009, 102, 2–5.
3. D. Field, O. Plekan, A. Cassidy, R. Balog, and N. Jones,
Europhys. News, 2011, 42, 32–35.
4. O. Plekan, A. Cassidy, R. Balog, N. C. Jones, and D. Field, Phys.
Chem. Chem. Phys., 2011, 13, 21035–44. 20
5. O. Plekan, A. Cassidy, R. Balog, N. C. Jones, and D. Field, Phys.
Chem. Chem. Phys., 2012, 14, 9972–6.
6. A. Cassidy, O. Plekan, R. Balog, N. C. Jones, and D. Field, Phys.
Chem. Chem. Phys., 2012, 15, 108–113.
7. H. Krueger and E. Weitz, J. Chem. Phys., 1992, 96, 2846. 25
8. W. G. Lawrence and V. A. Apkarian, J. Chem. Phys., 1992, 97,
2224.
9. H. J. Fraser, M. P. Collings, and M. R. S. McCoustra, Rev. Sci.
Instrum., 2002, 73, 2161.
10. A. api ski, . panget-Larsen, J. Waluk, and J. G. 30
Radziszewski, J. Chem. Phys., 2001, 115, 1757.
11. D. Fulvio, B. Sivaraman, G. a Baratta, M. E. Palumbo, and N. J.
Mason, Spectrochim. Acta. A. Mol. Biomol. Spectrosc., 2009, 72,
1007–13.
12. The NN band of the pure N2O multilayer is split into 35
longitudinal and transverse modes in RAIR spectra. Both modes
are visible when the spectra are recorded at non-normal incidence
and the film is deposited on a non-metallic substrate,10,11
as is the
case here. The behaviour of these LO and TO bands has been
thoroughly investigated and will be presented in a separate 40
publication (in preparation) on the nature of the spontelectric
effect in pure N2O.
13. S. Kudoh, K. Onoda, M. Takayanagi, and M. Nakata, J. Mol.
Struct., 2000, 524, 61–68.
14. J. Sodeau and R. Withnall, J. Phys. Chem., 1985, 89, 4484–4488. 45
15. J. N. Oliaee, M. Dehghany, N. Moazzen-Ahmadi, and a R. W.
McKellar, J. Chem. Phys., 2011, 134, 074310.
16. E. Cohen de Lara and J. Vincent-Geisse, J. Phys. Chem., 1976,
80, 1922–1927.
17. B. L. Maschhoff and J. P. Cowin, J. Chem. Phys., 1994, 101, 50
8138.
18. D. Fernández-Torre, O. Kupiainen, P. Pyykkö, and L. Halonen,
Chem. Phys. Lett., 2009, 471, 239–243.
19. C. Kittel, Introduction to Solid StatePhysics, Wiley, 3rd edn.,
2005. 55
20. H. Kliem, M. Kuehn, and B. Martin, Ferroelectrics, 2010, 400,
41–51.
21. J. Topping, Proc. R. Soc. London Ser. A., 1927, 114, 67–72.
Page 12 of 12Physical Chemistry Chemical Physics
Phy
sica
lChe
mis
try
Che
mic
alP
hysi
csA
ccep
ted
Man
uscr
ipt
Ope
n A
cces
s A
rtic
le. P
ublis
hed
on 2
4 Se
ptem
ber
2014
. Dow
nloa
ded
on 2
6/09
/201
4 13
:27:
48.
Thi
s ar
ticle
is li
cens
ed u
nder
a C
reat
ive
Com
mon
s A
ttrib
utio
n 3.
0 U
npor
ted
Lic
ence
.View Article Online
DOI: 10.1039/C4CP03659J