Embed Size (px)
Citation preview
Chapter 1
Parent Guide with Extra Practice 1
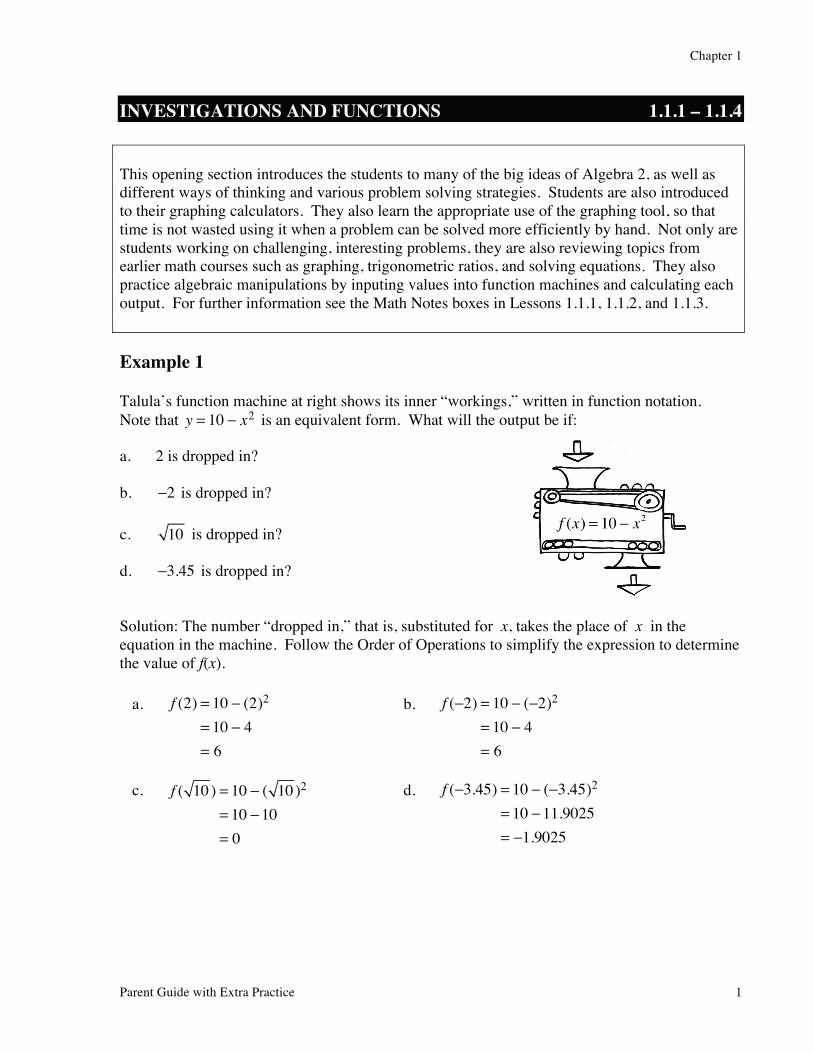
INVESTIGATIONS AND FUNCTIONS 1.1.1 – 1.1.4 This opening section introduces the students to many of the big ideas of Algebra 2, as well as different ways of thinking and various problem solving strategies. Students are also introduced to their graphing calculators. They also learn the appropriate use of the graphing tool, so that time is not wasted using it when a problem can be solved more efficiently by hand. Not only are students working on challenging, interesting problems, they are also reviewing topics from earlier math courses such as graphing, trigonometric ratios, and solving equations. They also practice algebraic manipulations by inputing values into function machines and calculating each output. For further information see the Math Notes boxes in Lessons 1.1.1, 1.1.2, and 1.1.3. Example 1 Talula’s function machine at right shows its inner “workings,” written in function notation. Note that y = 10 − x2 is an equivalent form. What will the output be if: a. 2 is dropped in? b. −2 is dropped in?
c. 10 is dropped in? d. −3.45 is dropped in? Solution: The number “dropped in,” that is, substituted for x, takes the place of x in the equation in the machine. Follow the Order of Operations to simplify the expression to determine the value of f(x).
a. f (2) = 10 − (2)2
= 10 − 4= 6
b. f (−2) = 10 − (−2)2
= 10 − 4= 6
c. f ( 10 ) = 10 − ( 10 )2
= 10 −10= 0
d. f (−3.45) = 10 − (−3.45)2
= 10 −11.9025= −1.9025

2 Core Connections Algebra 2
Example 2
Consider the functions f (x) = x3−x and g(x) = x + 5( )2 .
a. What is f (4) ?
b. What is g(4) ?
c. What is the domain of f (x) ?
d. What is the domain of g(x) ?
e. What is the range of f (x) ? f. What is the range of g(x) ? Solution: Substitute the values of x in the functions for parts (a) and (b):
f (4) = 43−4
= 2−1
= −2
g(4) = 4 + 5( )2
= (9)2
= 81
The domain of f (x) is the set of x-values that are “allowable,” and this function has some restrictions. First, we cannot take the square root of a negative number, so x cannot be less than zero. Additionally, the denominator of a fraction cannot be zero, so x ≠ 3 . Therefore, the domain of f (x) is x ≥ 0, x ≠ 3 . For g(x) , we could substitute any number for x, add five, and then square the result. This function has no restrictions so the domain of g(x) is all real numbers. The range of these functions is the set of all possible values that result when substituting the domain, or x-values. We need to decide if there are any values that the functions could never reach, or are impossible to produce. Consider the range of g(x) first. Since the function g squares the amount in the final step, the output will always be positive. It could equal zero (when x = –5), but it will never be negative. Therefore, the range of g(x) is y ≥ 0 . The range of f (x) is more complicated. Try finding some possibilities first. Can this function ever equal
zero? Yes, when x = 0, then f (x) = 0. Can the function ever equal a very large positive number? Yes, this happens when x < 3, but very close to 3. (For example, let x = 2.9999, then f (x) is approximately equal to 17,320.) Can f (x) become an extremely negative number?
Yes, when x > 3, but very close to 3. (Here, try x = 3.0001, and then f (x) is approximately equal to –17,320.) There does not seem to be any restrictions on the range of f (x) , therefore we can say that the range is all real numbers.
Chapter 1
Parent Guide with Extra Practice 3
Example 3 For each problem below, first decide how you will answer the question: by using a graphing tool, your algebra skills, or a combination of the two. Use the most efficient method. Show your work, including a justification of the method you chose for each problem.
a. What is the y-intercept of the graph of y = 23 x +19 ?
b. Does the graph of y = x3 + 3x2 − 4 cross the x-axis? If so, how many times?
c. Where do the graphs of y = 5x + 20 and y = − 15 x + 46 intersect?
d. What are the domain and range of y = x2 −12x + 46 ? Solutions: Part (a): The y-intercept is the point (0, b). Therefore, the y-intercept can be found by substituting 0 for x. In this case, the y-intercept can be found by calculating y = 2
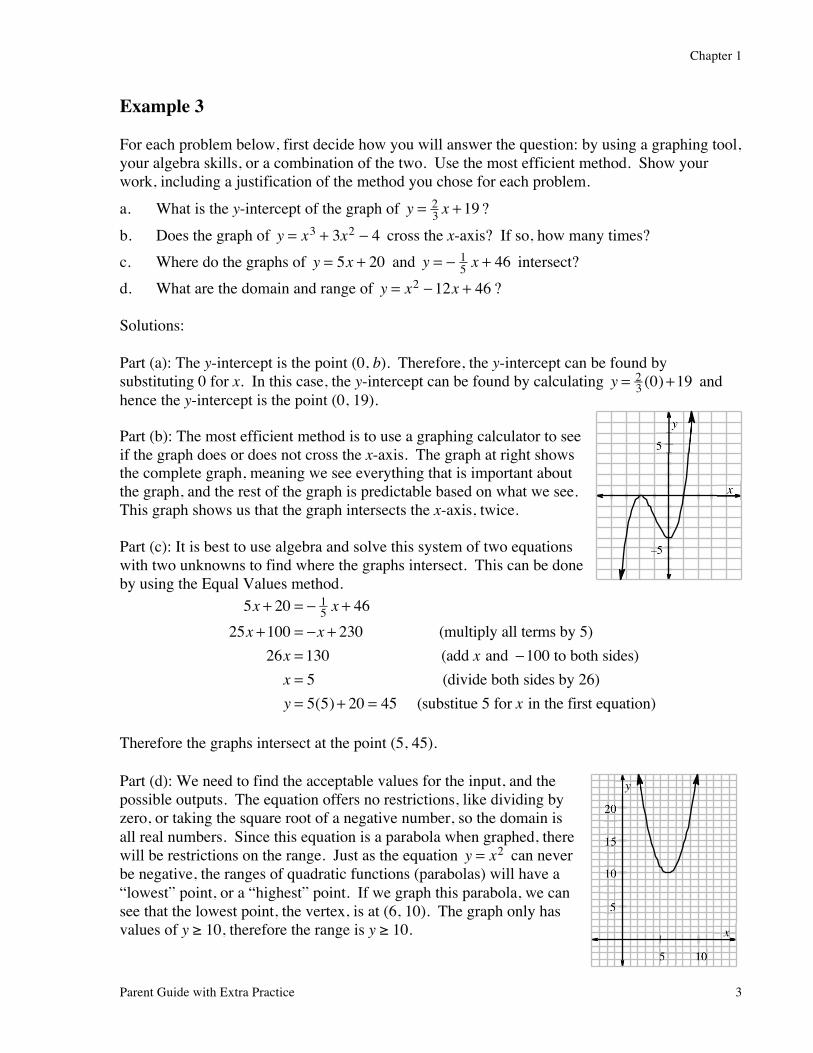
3 (0)+19 and hence the y-intercept is the point (0, 19). Part (b): The most efficient method is to use a graphing calculator to see if the graph does or does not cross the x-axis. The graph at right shows the complete graph, meaning we see everything that is important about the graph, and the rest of the graph is predictable based on what we see. This graph shows us that the graph intersects the x-axis, twice. Part (c): It is best to use algebra and solve this system of two equations with two unknowns to find where the graphs intersect. This can be done by using the Equal Values method.
5x + 20 = − 15 x + 46
25x +100 = −x + 230 (multiply all terms by 5)
26x = 130 (add x and −100 to both sides)
x = 5 (divide both sides by 26)
y = 5(5)+ 20 = 45 (substitue 5 for x in the first equation)
Therefore the graphs intersect at the point (5, 45). Part (d): We need to find the acceptable values for the input, and the possible outputs. The equation offers no restrictions, like dividing by zero, or taking the square root of a negative number, so the domain is all real numbers. Since this equation is a parabola when graphed, there will be restrictions on the range. Just as the equation y = x2 can never be negative, the ranges of quadratic functions (parabolas) will have a “lowest” point, or a “highest” point. If we graph this parabola, we can see that the lowest point, the vertex, is at (6, 10). The graph only has values of y ≥ 10, therefore the range is y ≥ 10.
–5
5
x
y
10 5
5
10
15
20
x
y
4 Core Connections Algebra 2
Most of the early homework assignments review skills developed in Algebra 1 and geometry. The problems below include these types of problems. Problems Solve the following equations for x and/or y.
1. 5(x + 7) = −2x −10 2. 3x + y = 12 y = 3x
3. x2 − 4x = 21 4. b(x − a) = c Find the error and show the correct solution.
5. 5x − 9 = −2(x − 3)5x − 9 = −2x + 5
7x = 14x = 2
6. 8x2 + 4x = 12
2x2 + x = 3
2x(x +1) = 3
2x = 3 or x +1 = 3
x = 32 or x = 2
Sketch a complete graph of each of the following equations. Be sure to label the graph carefully so that all key points are identified. What are the domain and range of each function?
7. y = 2x2 + 6x − 8 8. y = 3x−6
If f (x) = 3x2 − 6x , find:
9. f (1) 10. f (−3) 11. f (2.75)

Chapter 1
Parent Guide with Extra Practice 5
Use the graph at right to complete the following problems. 12. Briefly, what does the graph represent? 13. Based on the graph, give all the information you can
about the Ponda Concord. 14. Based on the graph, give all the information you can
about the Neo Brism. 15. Does it make sense to extend these lines into the
second and fourth quadrants? Explain. Answers
1. x = − 457
2. x = 2, y = 6
3. x = 7, − 3
4. x = c+abb = c
b + a
5. When distributing, (−2)(−3) = 6 . x = 157
6. Must set the equation equal to zero before factoring. x = 1, − 32
7. 8.
9. –3
10. 45
11. 6.1875
12. The graph shows how much gas is in the tank of a Ponda Concord or a Neo Brism as the car is driven.
13. Ponda Concord’s gas tank holds 16 gallons of gas, and the car has a driving range of about 350 miles on one tank of gas. It gets 22 miles per gallon.
14. The Neo Brism’s gas tank holds only 10 gallons of gas, but it has a driving range of 400 miles on a tank of gas. It gets 40 miles per gallon.
15. No, the car doesn’t travel “negative miles,” nor can the gas tank hold “negative gallons.”
Ponda Concord
Neo Brism
Distance traveled (miles)
Gas
in ta
nk (
gall
ons)
x
y
x
y
6 Core Connections Algebra 2
INVESTIGATING A FUNCTION 1.2.1 – 1.2.2
A goal of this course is for students to make connections among mathematical ideas. To reach this goal, we develop the idea of “investigating a function.” We want students to find out everything they can about a function or a situation, by asking questions about it, and drawing conclusions, so that they have a complete picture of the function or situation. In this section we consider the different questions to ask about the functions, and the different components to consider in order for students to understand the function completely. For further information see the Math Notes box in Lesson 1.2.2, as well as the box contained within problem 1-81.
Example 1
Investigate the function f (x) = x+43x .
Solution: We want to find out all we can about this function, and although the graph of f(x)will be helpful in our understanding, graphs can be unclear or incomplete. To investigate this function completely, answer the following questions:
• Is this function linear? If not, can you classify it?
• Does the function have any x-intercepts? Does it have any y-intercepts? If so, what are they?
• What is the domain of the function? What is the range of the function?
• Does the function have any asymptotes? If so, what are they and why do they occur?
• Are there any important points on the graph of this function? (High points, low points, turning points, etc.) What makes these points important?
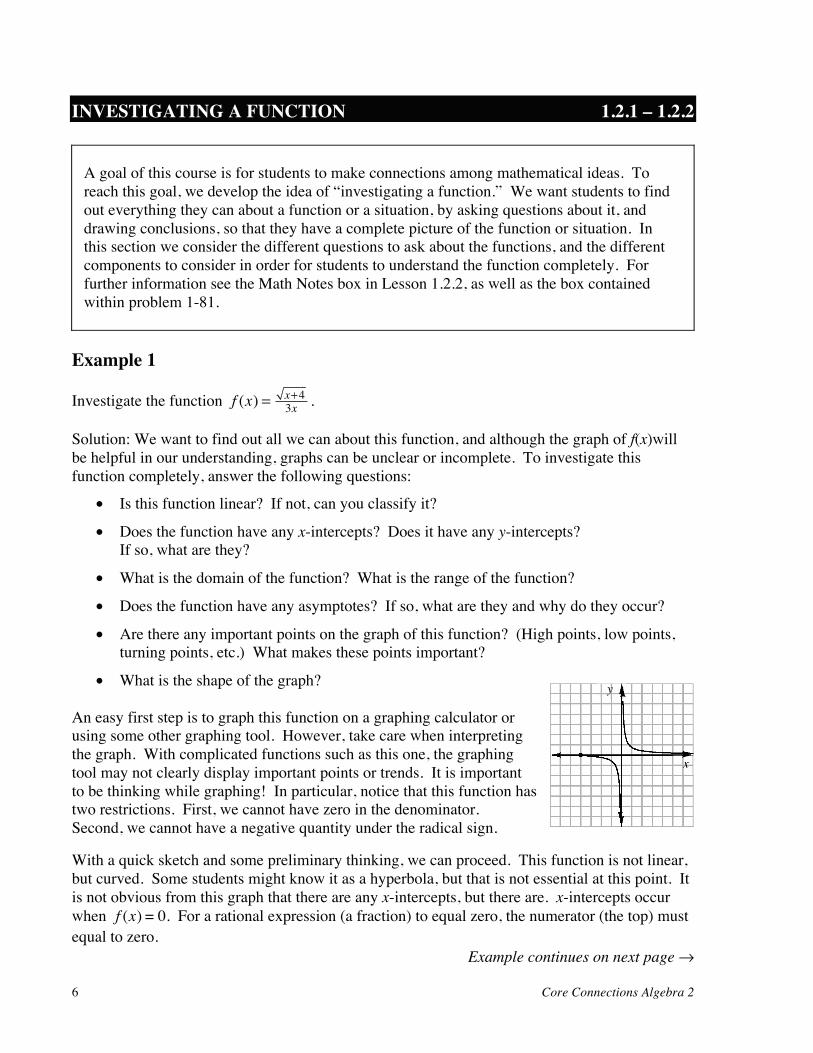
• What is the shape of the graph? An easy first step is to graph this function on a graphing calculator or using some other graphing tool. However, take care when interpreting the graph. With complicated functions such as this one, the graphing tool may not clearly display important points or trends. It is important to be thinking while graphing! In particular, notice that this function has two restrictions. First, we cannot have zero in the denominator. Second, we cannot have a negative quantity under the radical sign.
With a quick sketch and some preliminary thinking, we can proceed. This function is not linear, but curved. Some students might know it as a hyperbola, but that is not essential at this point. It is not obvious from this graph that there are any x-intercepts, but there are. x-intercepts occur when f (x) = 0. For a rational expression (a fraction) to equal zero, the numerator (the top) must equal to zero.
Example continues on next page →
x
y
Chapter 1
Parent Guide with Extra Practice 7
Example continued from previous page.
Therefore, f (x) = 0→ x+43x = 0→ x + 4 = 0 .
x + 4 = 0 when x + 4 = 0, or when x = –4. Therefore, the x-intercept is (–4, 0).
The y-intercept occurs when we substitute x = 0 into the equation. f (0) = 0+43(0)
= 40
This result is undefined because we cannot divide by zero. Therefore, there are no y-intercepts.
The work we just did will help us determine the domain and range. Here, the domain is restricted because x + 4 ≥ 0 and the denominator cannot equal zero. Therefore, the domain is the set of all numbers x ≥ –4, x ≠ 0. The range is all real numbers (that is, f(x) can take on all values). When we have the graph, we can also think of the domain and range as “shadows” of the graphs on the axes. For instance, if we could shine a light from above and below the graph, casting a shadow on the x-axis, the shadow would be the domain. Here the shadow would not appear to the left of x = –4, nor will it appear at zero. Similarly, a light casting a shadow onto the y-axis gives us the range. Here all of the y-axis will be covered in shadow.
Asymptotes occur when the graph approaches a value, but never quite reaches it. Here, as the x-values become larger and larger, the f(x)-values move closer and closer to zero. This happens because the denominator will grow larger more quickly than the numerator, making smaller and smaller fractions. Therefore y = 0 is a horizontal asymptote. Similarly, the line x = 0 is also a vertical asymptote. You can convince yourself that the graph becomes very close to this line as you substitute values for x that are very close to zero.
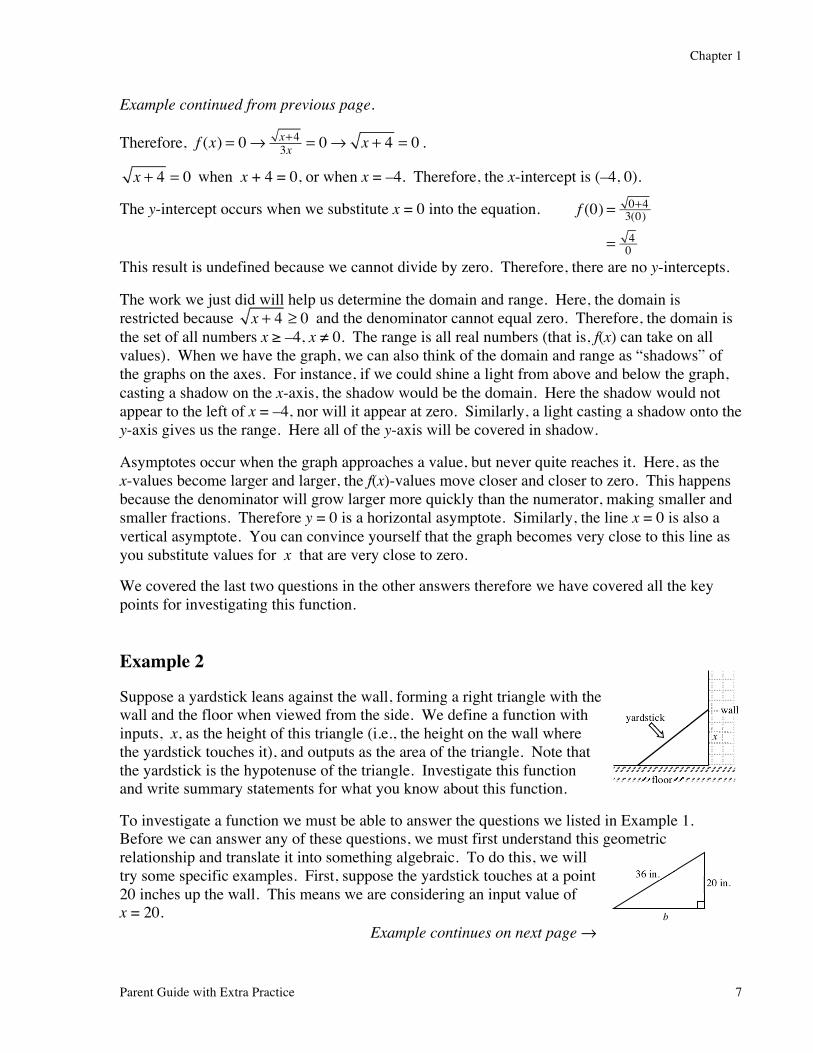
We covered the last two questions in the other answers therefore we have covered all the key points for investigating this function. Example 2 Suppose a yardstick leans against the wall, forming a right triangle with the wall and the floor when viewed from the side. We define a function with inputs, x, as the height of this triangle (i.e., the height on the wall where the yardstick touches it), and outputs as the area of the triangle. Note that the yardstick is the hypotenuse of the triangle. Investigate this function and write summary statements for what you know about this function.
To investigate a function we must be able to answer the questions we listed in Example 1. Before we can answer any of these questions, we must first understand this geometric relationship and translate it into something algebraic. To do this, we will try some specific examples. First, suppose the yardstick touches at a point 20 inches up the wall. This means we are considering an input value of x = 20.
Example continues on next page →
wall
floor
x
yardstick
36 in. 20 in.
b
8 Core Connections Algebra 2
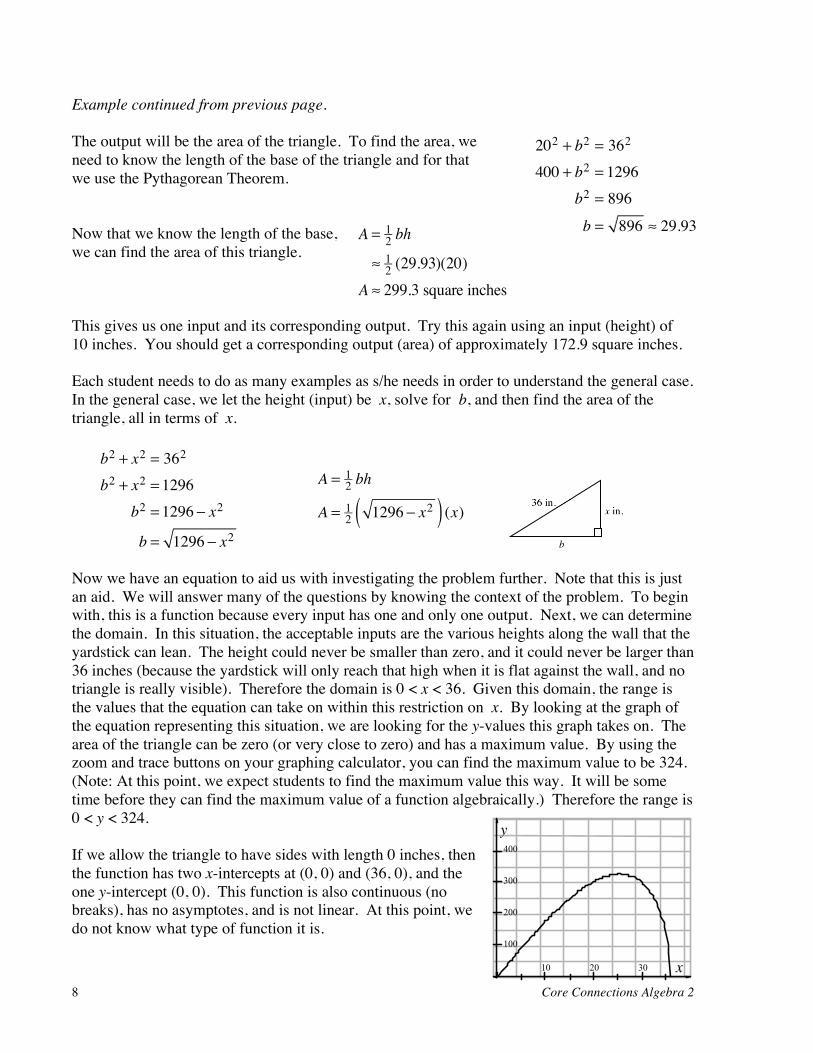
Example continued from previous page. The output will be the area of the triangle. To find the area, we need to know the length of the base of the triangle and for that we use the Pythagorean Theorem. Now that we know the length of the base, we can find the area of this triangle.
This gives us one input and its corresponding output. Try this again using an input (height) of 10 inches. You should get a corresponding output (area) of approximately 172.9 square inches. Each student needs to do as many examples as s/he needs in order to understand the general case. In the general case, we let the height (input) be x, solve for b, and then find the area of the triangle, all in terms of x.
b2 + x2 = 362
b2 + x2 = 1296
b2 = 1296 − x2
b = 1296 − x2
A = 1
2 bh
A = 12 1296 − x2( ) (x)
Now we have an equation to aid us with investigating the problem further. Note that this is just an aid. We will answer many of the questions by knowing the context of the problem. To begin with, this is a function because every input has one and only one output. Next, we can determine the domain. In this situation, the acceptable inputs are the various heights along the wall that the yardstick can lean. The height could never be smaller than zero, and it could never be larger than 36 inches (because the yardstick will only reach that high when it is flat against the wall, and no triangle is really visible). Therefore the domain is 0 < x < 36. Given this domain, the range is the values that the equation can take on within this restriction on x. By looking at the graph of the equation representing this situation, we are looking for the y-values this graph takes on. The area of the triangle can be zero (or very close to zero) and has a maximum value. By using the zoom and trace buttons on your graphing calculator, you can find the maximum value to be 324. (Note: At this point, we expect students to find the maximum value this way. It will be some time before they can find the maximum value of a function algebraically.) Therefore the range is 0 < y < 324. If we allow the triangle to have sides with length 0 inches, then the function has two x-intercepts at (0, 0) and (36, 0), and the one y-intercept (0, 0). This function is also continuous (no breaks), has no asymptotes, and is not linear. At this point, we do not know what type of function it is.
36 in. x in.
b
202 + b2 = 362
400 + b2 = 1296
b2 = 896
b = 896 ≈ 29.93
10 20 30
100
200
300
400
x
y
A = 12 bh
≈ 12 (29.93)(20)
A ≈ 299.3 square inches
Chapter 1
Parent Guide with Extra Practice 9
Problems Solve the following equations for x and/or y. 1. 3.1x − 7 = −0.6x + 4 2. x − 6y = 10
y = 13 x + 2
3. 12x2 − 35x + 8 = 0 4. x2 − 32 = 0 If g(x) = −0.3x + 6.3x2 , find: 5. g(−2) 6. g(0.4) 7. g(18) Sketch a complete graph of each of the following equations. Be sure to label the graph carefully so that all key points are identified. What are the domain and range of each function?
8. y = −0.1x + 30 9. y = x2 + 30x − 445
10. Investigate the function y = x − 6 +1 .
11. Investigate the function y = 1x−6 .
10 Core Connections Algebra 2
Answers 1. x ≈ 2.97
2. x = −22, y = −5.33
3. x = 14 , 83
4. x = ±4 2 ≈ 5.64
5. 25.8
6. 0.888
7. 2035.8
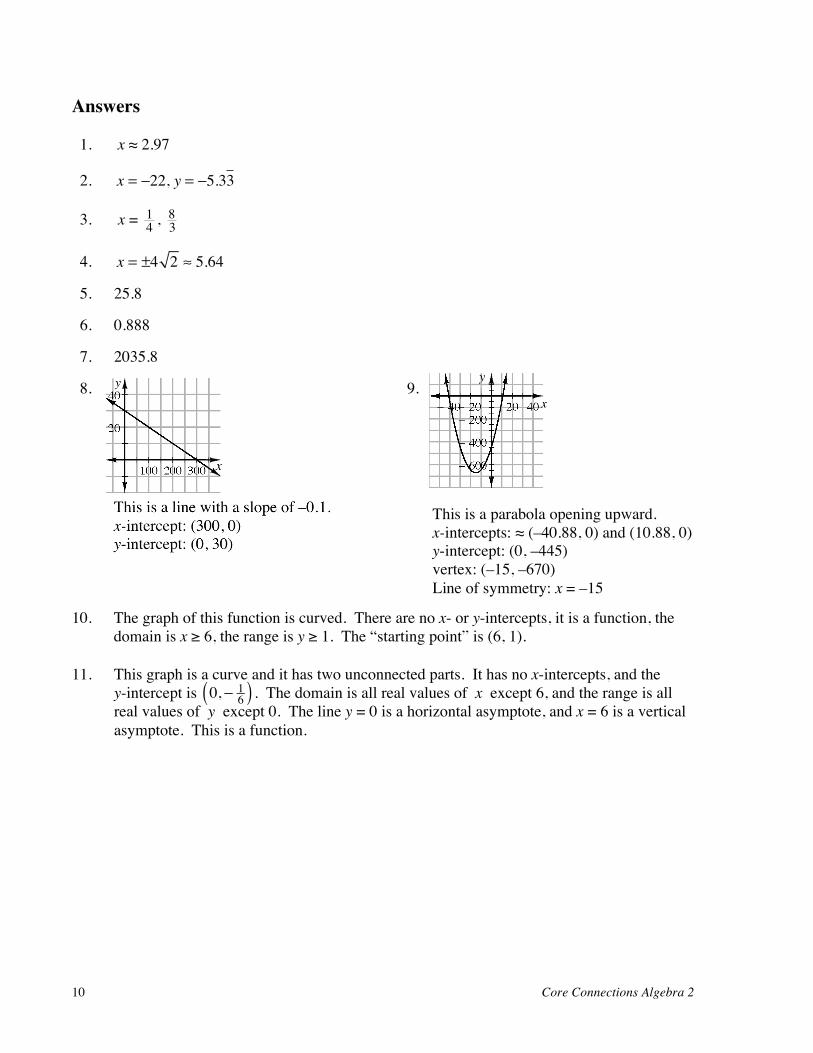
8. 9.
10. The graph of this function is curved. There are no x- or y-intercepts, it is a function, the
domain is x ≥ 6, the range is y ≥ 1. The “starting point” is (6, 1). 11. This graph is a curve and it has two unconnected parts. It has no x-intercepts, and the
y-intercept is 0, − 16( ) . The domain is all real values of x except 6, and the range is all
real values of y except 0. The line y = 0 is a horizontal asymptote, and x = 6 is a vertical asymptote. This is a function.
x
y
This is a line with a slope of –0.1. x-intercept: (300, 0) y-intercept: (0, 30)
x
y
This is a parabola opening upward. x-intercepts: ≈ (–40.88, 0) and (10.88, 0) y-intercept: (0, –445) vertex: (–15, –670) Line of symmetry: x = –15

Chapter 1
Parent Guide with Extra Practice 11
SAT PREP These problems are very similar to actual SAT test questions. Use a calculator whenever you need one. On multiple choice questions, choose the best answer from the ones provided. When a picture has a diagram, assume the diagram is drawn accurately except when a problem says it is not. These questions address more topics than you have done in class so far.
1. If x + 9 is an even integer, then which of the following could be the value of x?
a. 4 b. 2 c. 0 d. –1 e. –2
2. If (m + 5)(11 – 7) = 24, then m = ?
a. 1 b. 4 c. 8 d. 11 e. 17
3. The fractions 3d , 4d , and 5d are in simplest reduced form. Which of the following could be the value of d?
a. 20 b. 21 c. 22 d. 23 e. 24
4. A group of three numbers is called a “j-triple” for some number j, if 34 j, j,
54 j( ) . Which
of the following is a j-triple?
a. (0, 4, 5) b. 5 34 , 6, 614( ) c. (9, 12, 15)
d. (750, 1000, 1250) e. (575, 600, 625)
5. A ball is thrown straight up. The height of the ball can be modeled with the equation h = 38t −16t2 where h is the height in feet and t is the number of second since the ball was thrown. How high is the ball two seconds after it is thrown?
a. 12 b. 16 c. 22 d. 32 e. 40
6. In the figure at right, AC is a line segment with a length of 4 units. What is the value of k?
7. Let the operation § be defined as a § b is the sum of all integers between a and b. For example, 4 § 10 = 5 + 6 + 7 + 8 + 9 = 35. What is the value of (130 § 170) – (131 § 169)?
•A B C• •5k 3k
12 Core Connections Algebra 2
8. An isosceles triangle has a base of length 15. The length of each the other two equal sides is an integer. What is the shortest possible length of these other two sides?
9. Assume that 14 quart of cranberry concentrate is mixed with 1 34 quarts of apple juice to make cranapple juice for four people. How many quarts of cranberry concentrate are needed to make a cranapple drink at the same strength for 15 people?
10. A stack of five cards is labeled with a different integer ranging from 0 to 4. If two cards are selected at random without replacement, what is the probability that the sum will be 2?
Answers 1. D 2. A 3. D 4. D 5. A
6. 12 7. 300 8. 8 9. 1516 10. 110


![1.1.1 evolution[1]](https://img.pdfslide.us/doc/110x75/55aaace71a28ab507a8b460f/111-evolution1.jpg)