Embed Size (px)
Citation preview

July 28, 2014
Mr. George Desch, Director Submitted Electronically as .pdf File
Waste Management and Prevention Division
Vermont Department of Environmental Conservation
1 National Life Drive, Main 2
Montpelier, Vermont 05620‐3522
Re: McGuinness Property, Rotax Road, Monkton VT:
Report of Site Investigation
Spill #2014WMD184
SMS Site #2014‐4506
Dear George:
At your request, Vanasse Hangen Brustlin (“VHB”) has prepared this letter‐report to present the
findings and conclusions of the investigation into the discovery of pentachlorophenol (“PCP”) at the
water supply spring that formerly supplied the McGuinness property at 673 Rotax Road in Monkton,
VT. The spring is located on a separate property currently owned by Vermont Gas Systems, Inc., and
both locations are collectively referred to as “the Site” in this report. The investigation was conducted
on behalf of the Vermont Electric Power Company (“VELCO”) as requested by the Vermont Agency
of Natural Resources (“ANR”) in correspondence regarding VT Department of Environmental
Conservation (“DEC”) Spill #2014WMD184, dated April 29, 2014. The investigation was completed in
accordance with VHB’s written work plan dated May 15, 2014 that was approved by the ANR on May
30, 2014.
In brief, the site investigation included the completion of nine soil borings, and installation of water
table monitoring wells in seven of the borings to evaluate subsurface geologic and hydrologic
conditions, and to enable testing of soil and groundwater for contaminants of concern. The
investigation also included the analysis of potable water from the new bedrock well that now supplies
the residence, water from the existing spring that was formerly used as a source of drinking water, and
surface water from two locations along a drainage swale originating near the spring. The investigation
also involved laboratory analysis of samples of the treated utility pole (structure #190) that was the
alleged source of the PCP. As discussed in detail below, the results of the investigation are that as of
June 2014, concentrations of all tested parameters at the site in soil, groundwater, and the swale met
the applicable environmental and drinking water standards.
1.0 Background Information
The location of the site is shown on page 1 of the Attachment.

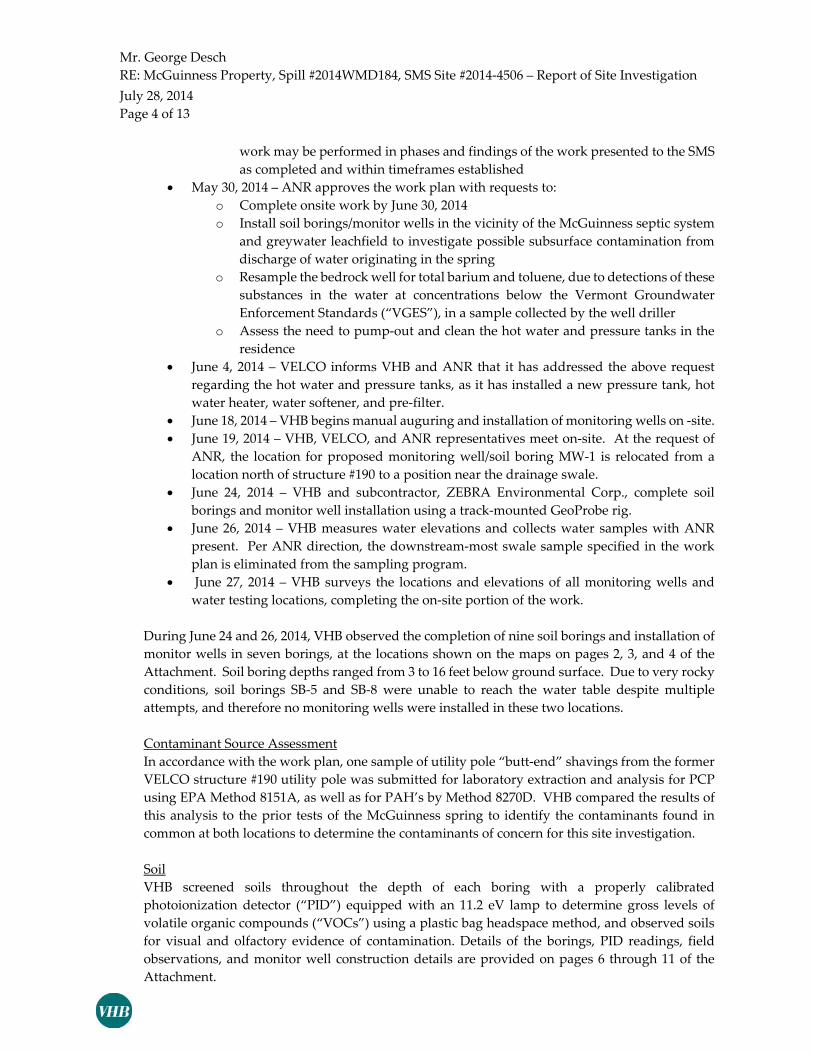
Mr. George Desch
RE: McGuinness Property, Spill #2014WMD184, SMS Site #2014‐4506 – Report of Site Investigation
July 28, 2014
Page 2 of 13
PCP was initially detected in the McGuinness spring in a sample collected by VELCO on April 17,
2014, after the utility pole replacement work had commenced and the residents had stated that
odors and sediments were observed in the water. The source of the PCP contamination was alleged
to be associated with the recent VELCO transmission line work in the vicinity of the Site involving
the replacement of structure #190, a treated wood utility pole structure. ANR requested that
VELCO complete this investigative work in correspondence dated April 29, 2014, as well as in an
email from Ashley Desmond of the VT DEC Sites Management Section (“SMS”), dated April 30,
2014.
Based on the initial detection of PCP in the McGuiness spring, VELCO contracted the construction
of a new bedrock well to replace the existing shallow water supply spring. The new well was
completed on May 8, 2014. The location of the new bedrock well is depicted on the maps on pages
2 through 4 of the Attachment and the well completion report is on page 5.
2.0 Pentachlorophenol Information
PCP is a semi‐volatile organic compound and is an Environmental Protection Agency (“EPA”)
and VT Agency of Agriculture registered pesticide, registered for use as a wood preservative.
PCP has a very low water‐solubility (14 mg/L in water at 20⁰ C) and high partitioning coefficients
(log kow = 5.12, log koc = 3.10 to 4.40) (HSDB, 2014). Due to these properties, PCP typically adsorbs
to soil and organic matter and has low mobility in the environment. Soil colloids may adsorb PCP,
causing stabilization of the colloids and enabling PCP to be transported by colloidal transport (US
EPA, 2008). Colloidal transport may occur in circumstances where soil particles are suspended in
flowing water such as overland runoff.
Normally, the vast majority of wood preservatives remain in the treated wood. If released into
the environment, these chemicals tend to adsorb to soils and biodegrade over time; biodegradation
may require several weeks for acclimation of bacteria. PCP is readily biodegradable in soil, surface
water, and wetlands. Biodegradation products include lower chlorinated phenols (e.g.
tetrachlorophenol, trichlorophenol, and dichlorophenol) as the process of reductive
dehalogenation eventually results in complete dechlorination to phenol which is subsequently
mineralized into carbon dioxide and methane gases (US EPA, 2008; D’Angelo and Reddy, 2000;
HSDB, 2014). Compounds such as dioxins and furans may be present in industrial‐grade PCP as
impurities in low concentrations, although 2,3,7,8‐TCDD in particular is not known to exist as an
impurity in PCP. Dioxins and furans have very low solubilities and high rates of soil sorption,
and tend to absorb to the treated wood and soil with little mobility in the environment (Arsenault,
1976; US EPA, 2008).
Studies of PCP and breakdown product concentrations in soils in the vicinity of in‐service utility
poles have found that concentrations of PCP are highest in the immediate vicinity of the poles and
rapidly decrease by several orders of magnitude within 3 to 12 inches from the poles.
Concentrations of PCP found at distances of 30 to 40 inches away from the poles were reported to
be non‐detectable and typical of environmental background conditions (Arsenault, 1976; Murarka
et al., 1996, US EPA, 2008).

Mr. George Desch
RE: McGuinness Property, Spill #2014WMD184, SMS Site #2014‐4506 – Report of Site Investigation
July 28, 2014
Page 3 of 13
3.0 Site Description
The Site is located in the Champlain Valley of western Vermont at an elevation of approximately
400 feet above mean sea level (“msl”). Topography is hilly and uneven; various rocky hills are
present surrounding the Site. The spring is situated near the base of a westward‐sloping hill and
structure #190 is located approximately 50 feet northeast and upslope from the spring. A wetland
complex is present to the west of the spring, and an intermittent drainage swale originates near the
spring and flows westward toward the wetland.
Surficial soils consist of silt loams and stony loams identified as the Raynham Silt Loam and
Amenia Stony loam in the area of the spring and structure #190, and Vergennes and Panton Clays
are also mapped in the general vicinity, according to the Natural Resources Conservation Service
(“NRCS”). The Surficial Geologic Map of Vermont (2008), identifies the surficial materials as
glaciolacustrine lake bottom sediments consisting of silty clay and/or clay containing ice rafted
boulders. Based on the lithology reported from the new bedrock well drilled at the residence, the
overburden soils are approximately 80 feet deep overlying bedrock. Specifically, the bedrock is
located beneath 79 feet of clay and hardpan soils, which impede the flow of water between the
shallow water table at the site and the deeper bedrock aquifer. This clay and hardpan layer acts as
an aquiclude, providing the bedrock aquifer with a substantial measure of protection against
contamination from surface spills at the Site (see well completion report, page 5 of the Attachment).
Bedrock at the site has been identified as Lower‐Cambrian‐aged Dunham Dolostone, a massive to
poorly bedded dolostone; and Middle‐Cambrian‐aged Monkton Quartzite, described as a pebbly
sandstone, well‐bedded dolostone, and reddish‐brown‐weathering dolomitic quartzite, according
to the Centennial Geologic Map of Vermont.
4.0 Work Completed
The following abbreviated chronology summarizes the key elements of the development of the
approved work plan and VHB’s on‐site investigation:
April 17, 2014 – VELCO collects a water sample from the McGuinness spring for analysis
of pentachlorophenol, PAHs, pesticides, and VOCs.
April 24, 2014 – the Vermont Department of Health collects a water sample from the
McGuinness spring for analysis of pentachlorophenol and herbicides
April 29, 2014 – ANR issues letter requesting five specific actions
May 8, 2014 – Chevalier Drilling Co. completes the installation of the new bedrock well
May 14, 2014 – Chevalier Drilling Co. collects a water sample from the bedrock well for
analysis of pentachlorophenol, VOCs, and other parameters
May 15, 2014 – VHB submits a work plan to the ANR to address three of the requests from
the ANR’s April 29 letter to
o assess impacts to the environment including but not limited to surface soil,
subsurface soil, groundwater, and drinking water;
o develop a work plan with an implementation schedule that details findings and
recommendations for additional work,
o provide updates and summary reports to the SMS as requested. Depending on
what work is determined necessary by the environmental consultant and SMS,
Mr. George Desch
RE: McGuinness Property, Spill #2014WMD184, SMS Site #2014‐4506 – Report of Site Investigation
July 28, 2014
Page 4 of 13
work may be performed in phases and findings of the work presented to the SMS
as completed and within timeframes established
May 30, 2014 – ANR approves the work plan with requests to:
o Complete onsite work by June 30, 2014
o Install soil borings/monitor wells in the vicinity of the McGuinness septic system
and greywater leachfield to investigate possible subsurface contamination from
discharge of water originating in the spring
o Resample the bedrock well for total barium and toluene, due to detections of these
substances in the water at concentrations below the Vermont Groundwater
Enforcement Standards (“VGES”), in a sample collected by the well driller
o Assess the need to pump‐out and clean the hot water and pressure tanks in the
residence
June 4, 2014 – VELCO informs VHB and ANR that it has addressed the above request
regarding the hot water and pressure tanks, as it has installed a new pressure tank, hot
water heater, water softener, and pre‐filter.
June 18, 2014 – VHB begins manual auguring and installation of monitoring wells on ‐site.
June 19, 2014 – VHB, VELCO, and ANR representatives meet on‐site. At the request of
ANR, the location for proposed monitoring well/soil boring MW‐1 is relocated from a
location north of structure #190 to a position near the drainage swale.
June 24, 2014 – VHB and subcontractor, ZEBRA Environmental Corp., complete soil
borings and monitor well installation using a track‐mounted GeoProbe rig.
June 26, 2014 – VHB measures water elevations and collects water samples with ANR
present. Per ANR direction, the downstream‐most swale sample specified in the work
plan is eliminated from the sampling program.
June 27, 2014 – VHB surveys the locations and elevations of all monitoring wells and
water testing locations, completing the on‐site portion of the work.
During June 24 and 26, 2014, VHB observed the completion of nine soil borings and installation of
monitor wells in seven borings, at the locations shown on the maps on pages 2, 3, and 4 of the
Attachment. Soil boring depths ranged from 3 to 16 feet below ground surface. Due to very rocky
conditions, soil borings SB‐5 and SB‐8 were unable to reach the water table despite multiple
attempts, and therefore no monitoring wells were installed in these two locations.
Contaminant Source Assessment
In accordance with the work plan, one sample of utility pole “butt‐end” shavings from the former
VELCO structure #190 utility pole was submitted for laboratory extraction and analysis for PCP
using EPA Method 8151A, as well as for PAH’s by Method 8270D. VHB compared the results of
this analysis to the prior tests of the McGuinness spring to identify the contaminants found in
common at both locations to determine the contaminants of concern for this site investigation.
Soil
VHB screened soils throughout the depth of each boring with a properly calibrated
photoionization detector (“PID”) equipped with an 11.2 eV lamp to determine gross levels of
volatile organic compounds (“VOCs”) using a plastic bag headspace method, and observed soils
for visual and olfactory evidence of contamination. Details of the borings, PID readings, field
observations, and monitor well construction details are provided on pages 6 through 11 of the
Attachment.

Mr. George Desch
RE: McGuinness Property, Spill #2014WMD184, SMS Site #2014‐4506 – Report of Site Investigation
July 28, 2014
Page 5 of 13
The work plan specified that if any visual, olfactory, or PID evidence of contamination is observed
in a soil boring, then samples would be collected from the depth of the strongest signs of
contamination within that boring, and submitted to Endyne, Inc (“Endyne”), a National
Environmental Laboratory Accreditation Conference (“NELAC”)‐accredited laboratory, for
analysis of PCP using EPA Method 515.4, and total petroleum hydrocarbons (“TPH”) using EPA
Method 8015‐DRO. However, most soil borings indicated no evidence of any contamination, as
no odors, staining, or PID readings above 0 ppm were observed with the exception of a PID
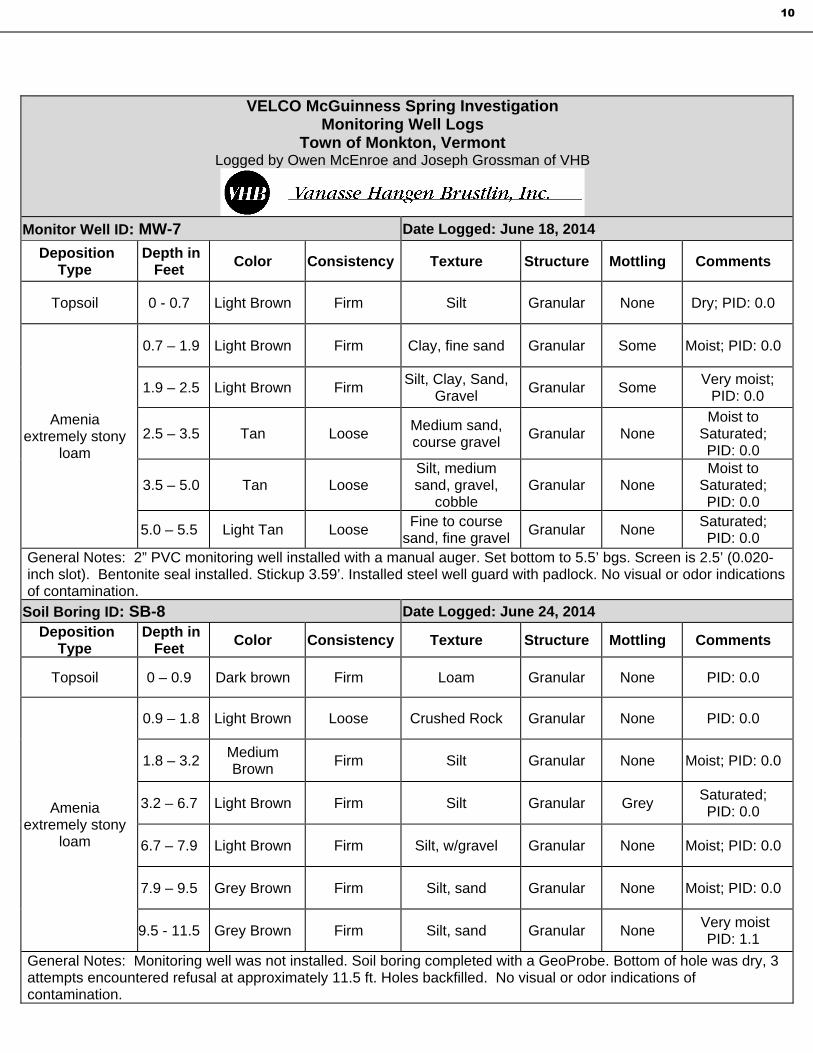
reading of 1.1 ppm at a depth of 9.5 to 11.5 feet below ground surface in SB‐8. In order to provide
sufficient soils analyses to characterize the site, in addition to a soil sample from SB‐8, VHB also
collected samples for laboratory analysis from borings designated SB‐5, MW‐6, and MW‐7, due to
their locations downslope of structure #190 and near the spring where the PCP had previously
been detected. Whereas no signs of contamination were identified in SB‐5, MW‐6, and MW‐7 to
guide the sampling depth, samples were taken from the depth of the soil/groundwater interface
in order to investigate the alleged groundwater contamination issue and to identify potential signs
of groundwater contamination.
Additionally, the work plan specified that VHB would also analyze select soil samples for
polynuclear aromatic hydrocarbons (“PAH’s”) by Method SW 8270C, and that soils to be analyzed
for PAHs will be selected based on the visual, olfactory, and PID observations. Again, whereas
no evidence of contamination was observed and the only PID reading above 0 ppm was the 1.1
ppm reading in SB‐8, in order to characterize the site thoroughly, samples for PAH analysis were
taken from borings designated SB‐5, MW‐6, MW‐7, and SB‐8. Soil samples were preserved on ice
and delivered to Endyne under a chain of custody for analysis within the proper sample holding
time.
Groundwater
On June 26, 2014 VHB measured groundwater levels in the shallow water table at the Site,
including in the spring and all monitor wells, on June 26, allowing the water levels in the newly
installed wells time to equilibrate.
After measuring groundwater levels, VHB acquired one groundwater sample from each
monitoring well and from the spring using low‐flow purge methods. The wells were purged using
a peristaltic pump and dedicated disposable tubing, until field‐measured parameters stabilized
(temperature, dissolved oxygen, specific conductance, pH, and oxidation‐reduction potential) or
the well went dry, indicating fresh groundwater was being pumped from the monitoring well.
Field sampling data are provided on pages 20 to 30 of the Attachment. The pump and tubing were
subsequently used for sample collection. Groundwater samples were preserved on ice and
delivered to Endyne under a chain of custody for analysis within the proper sample holding time.
In accordance with the work plan, groundwater samples from all monitoring points were analyzed
for PCP, a sample from the spring was analyzed for dioxins, and water samples from the spring
and monitoring wells MW‐6, MW‐7, and MW‐9 were also analyzed for PAH’s.
For this investigation, VHB also evaluated the results from samples taken from the spring water
collected by VELCO on April 17, 2014 and by the Vermont Department of Health on April 24, 2014.

Mr. George Desch
RE: McGuinness Property, Spill #2014WMD184, SMS Site #2014‐4506 – Report of Site Investigation
July 28, 2014
Page 6 of 13
Drainage Swale
VHB acquired two standard grab samples on June 26, 2014 from the swale emanating from the
spring at locations approximately seven (7) and thirty (30) feet downstream from the spring
enclosure. The samples were preserved on ice and delivered to Endyne under a chain of custody
for analysis of PCP and PAH’s within the proper sample holding time.
Bedrock Potable Water Supply Well
The new bedrock well was initially sampled by Chevalier Drilling Co. on May 14 2014, and
analyzed at Endyne for various parameters consisting of coliform bacteria, metals (arsenic,
barium, and lead), VOCs (EPA method 524.2), PCP and phenoxy‐acid herbicides (EPA method
515.4), and gross alpha radioactivity (EPA method 900.0).
In accordance with the work plan, VHB acquired additional samples on June 26, 2014 of the
potable water from the new bedrock well in order to analyze for all regulated parameters
applicable to a private well, pursuant to Tables A‐11‐5 and A‐11‐7 of the Vermont Water Supply
Rule (2010), and for toluene (all EPA method 515.4 VOCs) and barium as requested by the ANR.
Samples were obtained at a tap in the basement of the McGuinness residence, upstream of the
softener and pre‐filter in order to provide a representative sample of the well water. Prior to
collecting the sample, VHB purged the well of approximately 125 gallons by running taps in the
residence. The samples were preserved on ice and delivered to Endyne under a chain of custody
for analysis within the proper sample holding time.
5.0 Findings
Contaminant Source Assessment
VHB compared the results of the analysis of the utility pole “butt‐end” shavings from the former
VELCO structure #190 utility pole, to the prior tests of the McGuinness Spring to identify the
substances found in common at both locations, which were found to consist of the following:
Anthracene
Fluorene
1‐Methylnaphthalene
2‐Methylnaphthalene
Pentachlorophenol
Phenanthrene
These semi‐volatile organic compounds have been thus identified as the contaminants of concern
for this site and consist of the pentachlorophenol and constituents of the carrier oil used in the
wood preservative. Relative proportions of these substances are similar between the April 17,
2014 sample of the spring water, and the pole shavings sample. Page 12 of the Attachment
summarizes the lab results for the contaminants of concern from the utility pole sample, and page
13 summarizes the results from the groundwater samples, including the spring. Complete lab
reports are on pages 31 to 97 of the Attachment.
Structure #190 replacement site work commenced on March 26, 2014, with installation of erosion
control measures, soil auguring, and excavation. The McGuinness’ reported observing a fuel‐oil
like smell in the water that night, although VELCO staff were unable to verify the odor the next

Mr. George Desch
RE: McGuinness Property, Spill #2014WMD184, SMS Site #2014‐4506 – Report of Site Investigation
July 28, 2014
Page 7 of 13
day. Bottled water was provided for drinking, and VELCO continued to work with the
McGuinness’ to address the situation, leading to the initial detection of pentachlorophenol in the
water sample collected from the spring on April 17, 2014. During this time period, weather was
typical early spring conditions, with a mix of above‐ and below‐freezing temperatures, melting of
snow on the ground, and both rain and snow falling at times (see pages 98 to 101 of the Attachment
for National Weather Service summaries). These conditions most likely resulted in substantial
amounts of surface runoff as rainfall and snowmelt would have flowed over mostly frozen
ground. Runoff may have transported soil, and adsorbed materials, dislodged from the
excavation at structure #190 downslope towards the McGuinness spring.
Groundwater
Groundwater was encountered from depths of less than one foot below grade in MW‐1 and the
spring, to nearly 13 feet below grade in MW‐2. Groundwater elevations are tabulated on page 19
of the Attachment. A groundwater contour map based on the water elevations measured in the
shallow water table on June 26, 2014 is presented in page 2 of the Attachment. Groundwater in the
water table at the site was determined to be flowing to the northwest, moving generally from the
likely recharge area in the high terrain east of Rotax Road toward groundwater discharge zones in
the wetland complex situated west of the study area. Measured gradients were steepest on the
eastern portion of the study area below the greywater and septic leachfields, and were more
gradual near the base of the slope around the spring and structure #190. From the location of
structure #190, groundwater was flowing northwest at a low gradient of approximately 0.6%,
whereas the spring is located to the southwest of structure #190, and is cross‐gradient from it.
Groundwater quality results for the contaminants of concern are summarized on the Water
Sampling Results Map on page 4 of the Attachment, and are tabulated on page 13 of the
Attachment. Groundwater was observed to be free of odors, sheens, or other signs of
contamination. All concentrations have been compared to the VGES and Preventive Action Levels
(“PAL”). Full laboratory results are included on pages 31 to 97 of the Attachment.
The only groundwater sampling location on the site where PCP or other contaminants had been
detected is the spring itself, and concentrations of these contaminants have decreased since April
2014, to non‐detectable levels. PCP had been detected in the McGuinness Spring in April 2014 at
concentrations up to 7.02 ug/L, which exceeded the VGES of 1 ug/L. However, as of the June 26,
2014 sampling event, no PCP was detectable in the spring (detection limit of 0.5 ppb). Dioxins were
found in the spring in the June 26 2014 sampling event, although no TCDD was detected, and all
tested water quality in the spring from June 2014 complied with the GES and PAL.
No PCP or other PAH contaminants have been detected in groundwater in any of the monitoring
wells. No contaminants were found in soil or groundwater near the septic and greywater
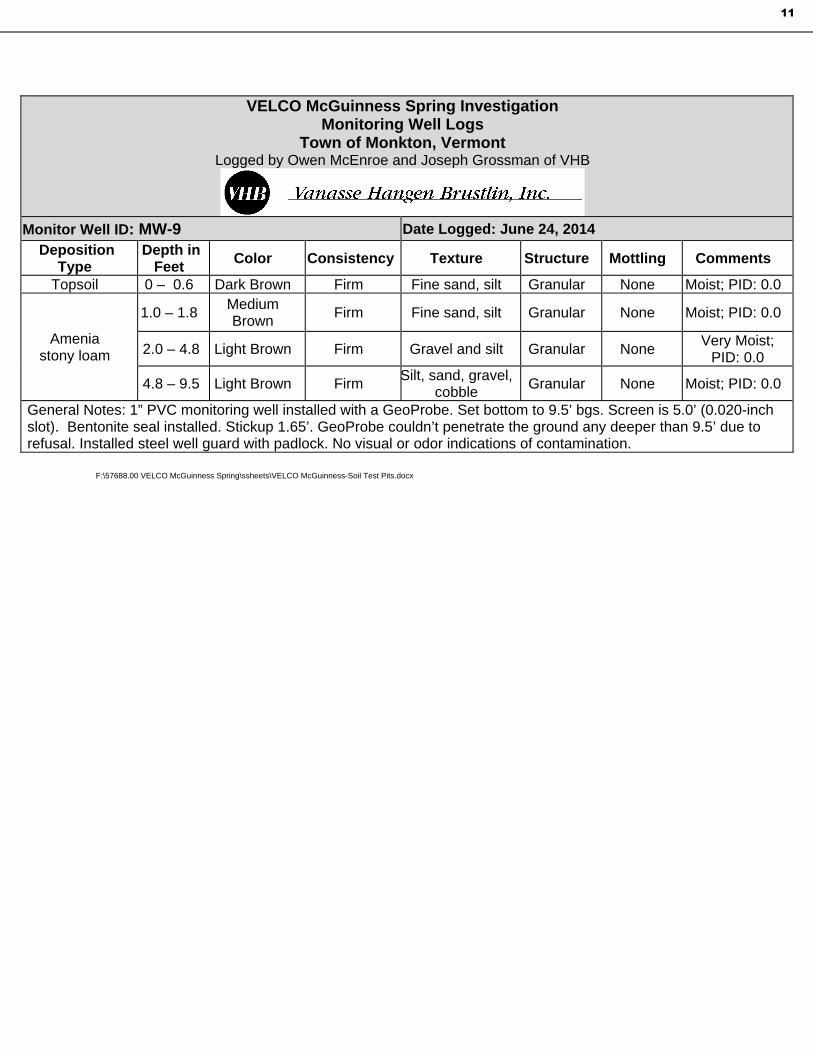
leachfields (MW‐9).
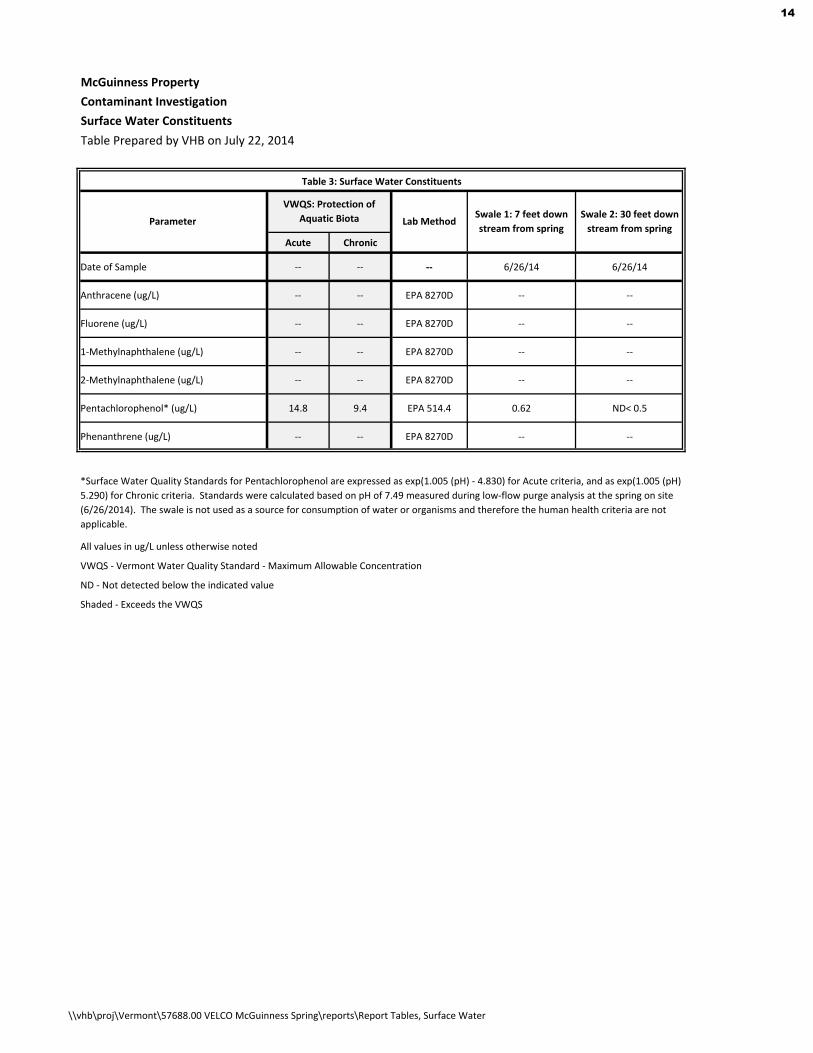
Drainage Swale
Results for the contaminants of concern from the samples from the swale are tabulated on page 14
of the Attachment; complete laboratory reports are included on pages 29‐95.
At the sample location seven feet downgradient from the spring enclosure, a faint petroleum odor
was observed during sampling, and PCP was detected at 0.62 ug/L. No olfactory evidence of

Mr. George Desch
RE: McGuinness Property, Spill #2014WMD184, SMS Site #2014‐4506 – Report of Site Investigation
July 28, 2014
Page 8 of 13
contamination was noted further downstream at the point 30 feet from the spring enclosure, and
no PCP was detected at this location. No other contaminants were detected in the swale. The water
quality test results from the swale meet the Vermont Water Quality Standards (2011).
Bedrock Potable Water Supply Well
Water from the new bedrock well meets all Vermont drinking water standards, and no PCP or
associated contaminants were detected in the well water. Although low levels of toluene (1.4 ug/L)
were found in the well water from the May 2014 sample, no toluene was detected in the June 2014
sample. Levels of the naturally occurring mineral barium are consistent between the two sample
events (0.043 and 0.045 mg/L in May and June, respectively) which is far below the public drinking
water standard of 2.0 mg/L.
All potable water test results are tabulated and compared to Vermont drinking water Maximum
Contaminant Levels (“MCL”), Vermont Health Advisory Levels, and Vermont Action Levels on
pages 15 to 16 of the Attachment. Full laboratory reports are included on pages 31 to 97 of the
Attachment. Table 1 below presents a simplified summary of the potable water results, presenting
all parameters that were detected in the well water, along with all regulated parameters applicable
to a private well, whether or not detected.
Table 1: Drinking Water Summary ‐ All Detected Parameters in Drinking Water, plus all
regulated parameters for a non‐public water source (VT WSR Tables A‐11‐5 and A‐11‐7)
Parameter MCL Lab Method
New Bedrock Well ‐
Sample Collected at
Pressure Tank
Date of Sample ‐‐ ‐‐ 5/14/14* 6/26/14
Microbiology
Total Coliform (MPN/100mls) Absent SM18 9223B (97) ND< 1.0 ‐‐
Primary Inorganic Chemicals
Total Arsenic (mg/L) 0.010 SM20 3113B ND< 0.001 ‐‐
Barium (mg/L) 2.000 EPA 200.7 0.043 0.045
Nitrogen, Nitrite (mg/L) 1.00 EPA 300.0 ‐‐ ND< 0.02
Nitrogen, Nitrate (mg/L) 10.00 EPA 300.0 ‐‐ 0.23
Volatile Organic Chemicals
Toluene (ug/L) 1,000.0 EPA 524.2 1.4 ND< 0.5
Radionuclides
Uranium (ug/L) 20 EPA 200.8 ‐‐ 2.51
Gross Alpha (pCi/L) 15.00 EPA 900.0 2.58+/‐1.15 ‐‐

Mr. George Desch
RE: McGuinness Property, Spill #2014WMD184, SMS Site #2014‐4506 – Report of Site Investigation
July 28, 2014
Page 9 of 13
Table 1: Drinking Water Summary ‐ All Detected Parameters in Drinking Water, plus all
regulated parameters for a non‐public water source (VT WSR Tables A‐11‐5 and A‐11‐7)
Parameter MCL Lab Method
New Bedrock Well ‐
Sample Collected at
Pressure Tank
Secondary Standards ‐
Secondary MCL
Chloride (mg/L) 250 EPA 300.0 ‐‐ ND< 2.5
Total Manganese (mg/L) 0.05 EPA 200.7 ‐‐ ND< 0.02
pH (SU) 6.5‐8.5 SM 4500‐H B. (97) ‐‐ 7.9
Odor (TON) 3 SM20 2150B (97) ‐‐ 1
Total Iron (mg/L) 0.3 EPA 200.7 ‐‐ 0.084
Total Sodium (mg/L) 250.0 EPA 200.7 ‐‐ 5.8
* 5/14/2014 Sample collected by Chevalier Drilling Co.
All values in mg/kg unless otherwise noted
MCL ‐ Maximum Contaminant Level
ND ‐ Not detected below the indicated value
‐‐ indicates not analyzed
Bold ‐ Exceeds the MCL
Soils
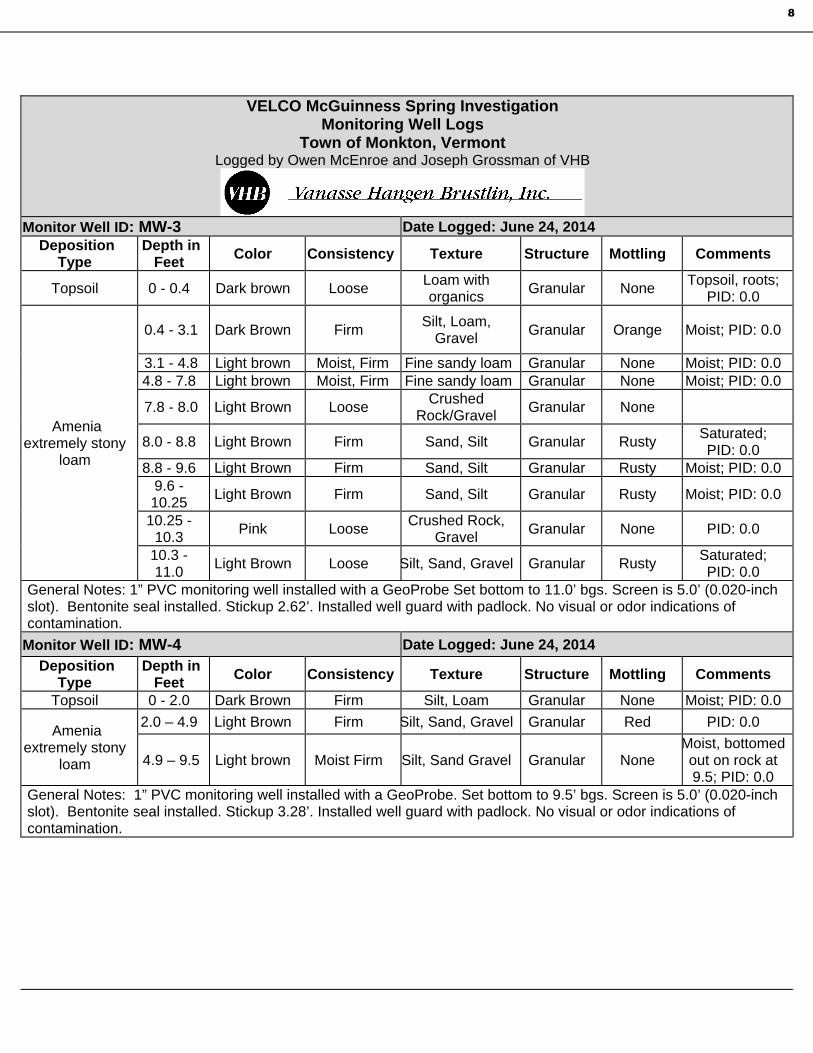
Soil logs are presented on pages 6 to 11 of the Attachment. Soils throughout the Site were generally
a mix of cobbly gravel, sand, and silt, with minor amounts of clay, consistent with the NRCS
mapping and soil descriptions.
Laboratory results for the key contaminants of concern in soils are summarized on the Soil
Sampling Results Map on page 3 of the Attachment and are tabulated on page 18 of the Attachment,
where they are compared to the EPAs Region 9 Regional Screening Level (“RSLs”, EPA 2013) and
the VT DEC Soil Screening Values (“SSVs”) (ANR, 2012) for industrial and residential soil. Full
laboratory results are included on pages 31 to 98 of the Attachment.
No PCP, PAH contaminants, or non‐target Unidentified Peaks have been detected in soil at the
Site. The only contaminant detections in soil consisted of TPH (non‐compound‐specific test) in
MW‐6, which is the nearest monitor well upslope from the spring, located about 6 feet northeast of
the spring enclosure and about 45 feet southwest of structure #190. All soil testing results are in
conformance with the EPA RSLs and the VT DEC SSVs (TPH does not have a RSL or SSV value).
6.0 Discussion and Conclusions
The site investigation has determined that PCP and associated contaminants had been present in
the McGuinness spring and in a segment of the drainage swale originating from near the spring.
Mr. George Desch
RE: McGuinness Property, Spill #2014WMD184, SMS Site #2014‐4506 – Report of Site Investigation
July 28, 2014
Page 10 of 13
As of June 26, 2014, PCP was no longer detectable in the spring, and concentrations of all tested
parameters at the Site met the applicable environmental and potable water standards.
Water in the McGuinness spring likely originates as groundwater discharge from the
shallow water table and underlying bedrock. Regional groundwater is most likely
recharged from rainfall and snowmelt in the higher elevation terrain to the east and
northeast, and flows generally to the west towards a large wetland complex located about
¼ mile southwest of the spring. Based on topographic contours, the spring is located
approximately 50 feet downslope and southwest of the structure #190 utility pole that was
replaced during the spring of 2014. Based on groundwater contours measured in June
2014, groundwater from the structure #190 utility pole flows to the northwest and
therefore, the spring is hydrologically cross‐gradient from the structure #190 utility pole.
Very low levels of dioxins were detected in the spring in June 2014, at concentrations that
met the VGES and PAL. No TCDD was detected in the spring water. These contaminants
may have originated as impurities in the PCP wood preservative.
Concentrations of PCP measured in the spring were 7.02 ug/L on April 17, 2014, 1.6 ug/L
on April 24, 2014, and no PCP was detected above the 0.5 ug/L detection limit on June 26,
2014, indicating declining concentrations. Likewise, other contaminants detected in the
spring in April 2014 (Anthracene, Fluorene, 1‐Methylnaphthalene, 2‐Methylnaphthalene,
and Phenanthrene) also were not detectable in the June 2014 sampling event. The decline
suggests a “one‐time” release that had been discontinued by mid‐April 2014, and that fresh
water flushing the spring resulted in non‐detectable levels of PCP and these associated
PAH contaminants.
The northwest flow direction of groundwater from structure #190, and the absence of PCP
and PAH contaminants in soil and groundwater between structure #190 and the spring,
both indicate that the contaminants found in the spring did not migrate through soil or
groundwater. Due to the high sorption and poor solubility of these contaminants, they
most likely would have been found adsorbed to soil in borings MW‐4, SB‐5, and/or MW‐6
had they been transported through groundwater to the spring.
The most likely explanation for the detections of PCP and associated contaminants in the
McGuinness spring is that during work to remove the former structure #190 pole, while
the ground was frozen, soils immediately adjacent to the pole containing PCP were
disturbed and soil colloids with adsorbed PCP and associated substances were transported
by overland runoff towards the spring, despite the use of erosion controls, due to rainfall
and snowmelt. This water and colloidal particles may have entered the concrete spring
enclosure by infiltrating through the backfilled soil adjacent to the enclosure, and being
drawn into the spring while it was being pumped to supply water to the residence (VELCO
was providing the McGuinness’ with bottled water for drinking at the time work was
performed on structure #190, however spring water was still being used for other
purposes).

Mr. George Desch
RE: McGuinness Property, Spill #2014WMD184, SMS Site #2014‐4506 – Report of Site Investigation
July 28, 2014
Page 11 of 13
The absence of detectable PCP and PAH contaminants in soils at SB‐8 and MW‐9, and in
groundwater at MW‐9, confirms that contaminants of concern were not spread through
the greywater or septic systems.
During June 2014, PCP was only found in one location on‐site, which is the swale sample
collected approximately 7 feet downstream of the spring, where it was identified at a
concentration of 0.62 ug/L. All water quality testing results from the swale were in
conformance with the Vermont Water Quality Standards. Further downstream in the
swale (30 feet downstream of the spring) no PCP was detected, confirming that
contamination was not extending down the swale to the wetlands located further to the
west.
Considering the declining contaminant levels and the short duration when PCP was
detected in the spring, the low levels of remaining PCP in the swale and dioxins in the
spring are expected to continue to dissipate.
Water from the new bedrock well meets all drinking water standards, and no PCP or
associated contaminants were detected in the well water. After an initial detection of a low
concentration of toluene, within the drinking water standards, in the well during May
2014, toluene was not detected in the June 2014 sampling event. Toluene is frequently
detected temporarily in low levels in newly drilled wells, but typically does not persist,
and is likely be related to the well drilling equipment or newly installed plumbing fittings.
The location of the bedrock well is upgradient from the area where contaminants were
found in shallow groundwater, and the layers of clay and hardpan above the bedrock
signify that the bedrock aquifer is hydrogeologically isolated from the shallow water table
where PCP was detected. Therefore the new bedrock well is a suitable replacement water
supply and is not vulnerable to contamination.
Findings of this investigation are consistent with prior studies by utilities of environmental
fate and transport of PCP and its impurities and breakdown products (e.g., Arsenault,
1976, Murarka et al., 1996, US EPA, 2008), in that these contaminants were not found in
soils beyond the immediate vicinity of the utility pole. The temporary presence of PCP
and certain associated PAHs in the spring suggests an anomalous event in which colloidal
transport of soil particles with adsorbed contaminants occurred as a result of soil
disturbance when structure #190 was being replaced. Results of this investigation
corroborate these prior studies in concluding that widespread soil or groundwater
contamination surrounding PCP‐treated utility poles was not observed.
7.0 Recommendations
Based on the Conclusions above, VHB recommends the following:
No further site investigation or mitigation is recommended, because of the following
conclusions:
o the new bedrock well is providing an acceptable source of potable water to the
McGuinness residence;
o the extent and degree of contamination have been delineated, and are very
limited;
Mr. George Desch
RE: McGuinness Property, Spill #2014WMD184, SMS Site #2014‐4506 – Report of Site Investigation
July 28, 2014
Page 12 of 13
o no PCP was detectable at the downstream‐most swale sample, confirming that
contamination was not extending down the swale to the wetlands; and
o as of June 2014, concentrations of all tested parameters at the site in soil,
groundwater, the drainage swale, and potable water met the applicable
environmental and drinking water standards.
The contamination of the McGuinness spring appears to be the result of a “one‐time”
incident from the replacement of Structure #190 and overland flow, rather than an ongoing
release of contaminants to groundwater from the long term presence of the utility poles.
Groundwater and surface water have been thoroughly characterized around the spring
where contamination was located, therefore the installation of additional groundwater
monitoring wells in a location downgradient from the structure (e.g. the originally
proposed MW‐1 site) is not recommended.
The Site meets the requirements of section 7.1.1. of the Vermont ANR Investigation and
Remediation of Contaminated Properties (“IROCP”) Procedure (2012) and therefore is
eligible for a Sites Management Activities Completed (“SMAC”) designation. With the
concurrence of ANR, VELCO will arrange for the abandonment of all site monitoring wells
and of the spring, and would subsequently report the completion of well closure so that a
SMAC designation letter may be issued.
Please do not hesitate to call me if you have any questions.
Sincerely,
VANASSE HANGEN BRUSTLIN, INC.
Meddie J. Perry, CGWP
Senior Hydrogeologist
MJP/pwe
Enclosure
cc Brian Connaughton, VELCO
Tim Follensbee, VELCO
F:\57688.00 VELCO McGuinness Spring\reports\investigation report_Final.docx

Mr. George Desch
RE: McGuinness Property, Spill #2014WMD184, SMS Site #2014‐4506 – Report of Site Investigation
July 28, 2014
Page 13 of 13
References Cited
Arsenault, R.D. 1976. “Pentachlorophenol and Contained Chlorinated Dibenzodioxins in the
Environment: a Study of Environmental Fate, Stability, and Significance When Used in Wood
Preservation.” American Wood‐Preservers Association, Alexandria, VA.
D’Angelo, E.M., and K.R. Reddy, 2000. “Aerobic and Anaerobic Transformations of
Pentachlorophenol in Wetland Soils”. Soil Science Society of America Journal 64:933—943.
HSDB, 2014. Hazardous Substances Data Bank ‐ United States National Institutes of Health, accessed
online at http://toxnet.nlm.nih.gov
Murarka, I. P., R. Malecki, B. Taylor, B. Hensel, and J. Roewer, 1996. “Release, Migration, and
Degradation of Pentachlorophenol Around In‐Service Utility Poles.” American Wood‐Preservers’
Association, Granbury, TX.
US EPA, 2008. Memorandum RE: Environmental Fate and Transport Assessment of Pentachlorophenol
(PCP) for Reregistration Eligibility Decision (RED) Process. U.S. Environmental Protection Agency, Office
of Prevention, Pesticides and Toxic Substances, Washington, DC. February 16, 2008.
US EPA, 2013. EPA Region 9 Regional Screening Level, Master Table, November 2013.
Vermont Agency of Natural Resources: Department of Environmental Conservation, Water Supply
Division (2010), Environmental Protection Rules, Water Supply Rule, Chapter 21.
Vermont Agency of Natural Resources: Department of Environmental Conservation (2005). Chapter 12
of the Environmental Protection Rules: Groundwater Protection Rule and Strategy. February 2005.
Vermont Agency of Natural Resources: Department of Environmental Conservation (2012).
Investigation and Remediation of Contaminated Properties Procedure.” April 2012.
Vermont Natural Resources Board, 2011. “Vermont Water Quality Standards.” Effective December 30,
2011.
ATTACHMENT

XY
XY
XY
XY
XY
XY
XY
XY
XY
XY
XY
XY
XY
XY
XY
XY
XY
XY
XY
XY
XY
XY
XY
XY
XY
XY
XY
XY
XY
XY
XY
XY
XY
XY
XY
XY
XY
XY
XY
XY
XY
XY
XY
XY
XY
XY
XY
XY
XY
XY
XY
XY
XY
XY
XY
XY
XY
XY
XY
XY
XY
XY
XY
XY
XY
XY
XY
XY
XY
XY
XY
XY
XY
XY
XY
XY
XY
XY
XY
XY
XY
XY
XY
XY
XY
XY
XY
XY
XY
XY
XY
XY
XY
XY
XY
XY
XY
XY
XY
XY
XY
XY
XY
XY
XYXY
XY
XY
XY
XY
XY
XY
XY
XY
XY
XY
XY
XY
XY
XY
XY
XY
XY
XY
XY
XY
XY
XY
XY
XY
XY
XY
XY
XY
XY
XY
XY
XY
XY
XY
XY
XY
XY
XY
XY
XY
XY
XY
XY
XY
XY
XY
XY
XY
XY
XY
XY
XY
XY
XY
XY
XY
XY
XY
XY
XY
XY
XY
XY
XY
XY
XY
XY
XY
XY
XY
XY
XY
XY
XY
XY
XY
XY
XY
XY
XY
XY
XY
XY
XY
XY
XY
XY
XY
XY
XY
XY
XY
XY
XY
XY
XY
XY
XY
XY
XY
XY
XY
XY
XY
XY
XY
XY
XY
XY
XY
XY
XY
XY
XY
XY
XY
XY
XY
XY
XY
XY
XY
XY
XY
XY
XY
XY
XY
XY
XY
XY
XY
XY
XY
XY
XY
XY
XY
XY
XY
XY
XY
XY
XY
XY
XY
XY
XY
XY
XY
XY
XY
XY
XY
XY
XY
XY
XY
XY
XY
XY
XY
XY
XY
XY
XY
XY
XY
XY
XYXY
XY
XY
XY
XY
XY
XY
XY
XY
XY
XY
XY
XY
XY
XY
XY
XY
XY
XY
XY
XY
XY
XY
XY
XY
XY
XY
XY
XY
XY
XY
XY
XY
XY
XY
XY
XY
XY
XY
XY
XY
XY
XY
XY
XY
XY
XY
XY
XY
XY
XY
XY
XY
XY
XY
XY
XY
XY
XY
XY
XY
XY
XY
XY
XY
XY
XY
XY
XY
XY
XY
XY
XY
XY
XY
XY
XY
XY
XY
XY
XY
XY
XY
XY
XY
XY
XY
XY
XY
XY
XY
XY
XY
XY
XY
XY
XY
XY
XY
XYXY
XYXY
XYXYXYXY
XYXYXYXY
XYXYXYXY
XYXYXYXY
XYXYXYXY
XYXYXYXY
XYXYXYXY
XYXYXY
XYXYXYXY
XYXYXYXY
XYXYXYXY
XYXYXYXY
XYXYXYXY
XYXYXYXYXY
XYXYXYXY
XYXYXYXY
XYXY
XY
XY
XY
XY
XY
XY
XY
XY
XY
XY
XY
XY
XY
XY
XY
XY
XY
XY
XY
XY
XY
XY
XY
XYXYXYXYXYXYXYXYXYXYXYXYXY
XY
XY
XY
XY
XY
XY
XY
XY
XY
XY
XY
XY
XY
XY
XY
XY
XY
XY
XY
XY
XY
XY
XY
XY
XY
XY
XY
XY
XY
XY
XY
XY
XY
XY
XY
XY
XY
XY
XY
XY
XY
XY
XY
XY
XY
XY
XY
XY
XY
XY
XY
XY
XY
XY
XY
XY
XY
XY
XY
XY
XY
XY
XY
XY
XY
XY
XY
XY
XY
XY
XY
XY
XY
XY
XY
XY
XY
XY
XY
XY
XY
XY
XY
XY
XY
XY
XY
XY
XY
XY
XY
XY
XY
XY
XY
XY
XY
XY
XY
XY
XY
XY
XY
XY
XY
XY
XY
XY
XY
XY
XY
XY
XY
XY
XY
XY
XY
XY
XY
XY
XY
XY
XY
XY
XY
XY
XY
XY
XY
XY
XY
XY
XY
XY
XY
XY
XY
XY
XY
XY
XY
XY
XY
XY
XY
XY
XY
XYXY
XYXY
XYXY
XYXY
XYXY
XYXY
XYXY
XYXY
XYXY
XYXY
XYXY
XYXY
XYXY
XYXY
XYXY
XY
XY
XY
XY
XY
XY
XY
XY
XY
XY
XY
XY
XY
XY
XY
XY
XY
XY
XY
XY
XY
XY
XY
XY
XY
XY
XY
XY
XY
XY
XY
XY
XY
XY
XY
XY
XY
XY
XY
XY
XY
XY
XY
XY
XY
XY
XY
XY
XY
XY
XY
XY
XY
XY
XY
XY
XY
XY
XY
XY
XY
XY
XY
XY
XY
XY
XY
XY
XY
XY
XY
XY
XY
XY
XY
XY
XY
XY
XY
XY
XY
XY
XY
XY
XY
XY
XY
XY
XY
XY
XY
XY
XY
XY
XY
XY
XY
XY
XY
XY
XY
XY
XY
XY
XY
XY
XY
XY
XY
XY
XY
XY
XY
XY
XY
XY
XY
XY
XY
XY
XY
XY
XY
XY
XY
XY
XY
XY
XY
XY
XY
XY
XY
XY
XY
XY
XY
XY
XY
XY
XY
XY
XY
XY
XY
XY
XY
XY
XY
XY
XY
XY
XY
XY
XY
XY
XY
XY
XY
XY
XY
XY
XY
XY
XY
XY
XY
XY
XY
XY
XY
XY
XY
XY
XY
XY
XY
XY
XY
XY
XY
XY
XY
XY
XY
XY
XY
XY
XY
XY
XY
XY
XY
XY
XY
XY
XY
XY
XY
XY
XY
XY
XY
XY
XY
XY
XY
XY
XY
XY
XY
XY
XY
XY
XY
XY
XY
XY
XY
XY
XY
XY
XY
XY
XY
XY
XY
XY
XY
XY
XY
XY
XY
XY
XY
XY
XY
XY
XY
XY
XY
XY
XY
XY
XY
XY
XY
XY
XY
XY
XY
XY
XY
XY
XY
XY
XY
XY
XY
XY
XY
XY
XY
XY
XY
XY
XY
XY
XY
XY
XY
XY
XY
XY
XY
XY
XY
XY
XY
XY
XY
XY
XY
XY
XY
XY
XY
XY
XY
XY
XY
XY
XY
XY
XY
XY
XY
XY
XY
XY
XY
XY
XY
XY
XY
XY
XY
XY
XY
XY
XY
XY
XY
XY
XY
XY
XY
XY
XY
XY
XY
XY
McGuinness Residence673 Rotax Road
STATES PRISON
HOLLOW RD
MO
NK
TON
RD
G
ROSCOE
RD
S TILLSON
LN
SOU
THSH
OR
E
TH 14
WI ND
Y
RID
GE
CEDAR LN
BE
AVE
RLN
CEMETERY RD
BA
LDW
INR
D
PON
D R
D
DAVISRD
ACCESS
RD
BE
NN
ET
TR
D
A-B
-C- D
LN
BR
ISTO
LR
D
TH 1
5W
HITE
LN
MU
RR
AY
RD
OAK
HILLRD
TOAD RD
MONKTON RD
LEWISCREEK RD
BA
LDW
INR
D
HOLLOW RD
TH
22
WE
ISEN
BACH
RD
ROTAX RDSIL
VERST
Copyright:© 2013 National Geographic Society, i-cubed
2,000 0 2,0001,000
Feet\\vtdata\Dept\General\Business Development\2014\Environmental GBD\Energy and Telecommunications\VELCO\NOAV\673_Site_Location_Map.mxd
VT Transco, LLCMcGuinness Spring Investigation
Monkton, VermontSite Location Map
May 13, 2014
Legend
XY XY XY XY XY XY VELCO Transmission Line
Sources: Background from USA Topos (2012); Parcel data from Monkton, VT (2008); Roads from VTrans (2012); Transmission Lines from Velco (2003)
Prepared by OWM/
Site Location
ORLEANSFRANKLINESSEX
WINDSORRUTLAND
ADDISON ORANGE
WINDHAM
CALEDONIA
BENNINGTON
WASHINGTONCHITTENDEN
LAMOILLEGRAND ISLE
1

\\VTNFDATA\projects\57688.00 VELCO McGuinness Spring\GIS\Project\673_Flow_working.mxd
VT Transco, LLCMcGuinness Spring Investigation
Monkton, VermontJune 26th, 2014 Water Levels
Groundwater Contour MapJuly 24, 2014
Sources: Background from Bing (2012); Parcel data from Monkton, VT (2008); Roads from VTrans (2012); Transmission Lines from Velco (2003); Monitor wells, Soil Bore and Spring Location/Elevations surveyed by VHB (2014); Swale Flow Digitized by VHB (2014); Greywater System and Septic tank GPSed by VHB (2014) Utility digitized by VHB (2014); Groundwater Contours VHB(2014); Groundwater flow digitized byVHB (2014).
Prepared by JWG
/
LegendGroundwater Monitoring Well
@? Water Level and Quality
F Spring
§ Swale Samples
Groundwater Contour 6/26/14Contour - 0.25 ft
Contour - 1 ft
Contour - 5 ft
Groundwater Flow
Swale
! Soil Bore Hole
! Leach Field
! Septic
!H Bedrock Well
d Utility Pole
Local Road
XY XY XY XY XY VELCO Transmission Line
0 10050Feet
2

\\vhb\proj\Vermont\57688.00 VELCO McGuinness Spring\GIS\Project\SoilSamplingMap.mxd
VT Transco, LLCMcGuinness Spring Investigation
Monkton, VermontJune 18th and 24th, 2014 Samples
Soil Sampling Results MapJuly 24, 2014
Sources: Background from Bing (2012); Parcel data from Monkton, VT (2008); Roads from VTrans (2012); Transmission Lines and 2 foot Elevation Contours from Velco (2003); Monitor wells, Soil Bore and SpringLocations/Elevations surveyed by VHB (2014); Swale FlowDigitized by VHB (2014); Greywater System and Septic tank GPSed by VHB (2014) Utility digitized by VHB (2014). Soil Sampled by VHB(2014).
Prepared by JWG
/
LegendSoil Bore Sample Locations
!( Soil Bore Samples
F Spring
§ Swale Samples
Swale
Elevation Contours - 2 ft
! Leach Field
! Septic
!H Bedrock Well
d Utility Pole
Local Road
XY XY XY XY XY XY XY XY VELCO Transmission Line
0 10050Feet
3

\\VTNFDATA\projects\57688.00 VELCO McGuinness Spring\GIS\Project\673_Sampling_working.mxd
VT Transco, LLCMcGuinness Spring Investigation
Monkton, VermontJune 26th, 2014 Water Samples
Water Sampling Results MapJuly 24, 2014
Sources: Background from Bing (2012); Parcel data from Monkton, VT (2008); Roads from VTrans (2012); Transmission Lines (2003); 2 ft Elevation Contours from Velco (2014); Monitor wells and Soil Bore and Spring Location/Elevations surveyed by VHB (2014); Swale Flow Digitized by VHB (2014); Greywater System and Septic tank GPSed by VHB (2014) Utility digitized by VHB (2014). Water Sample Data by VHB (2014).
Prepared by JWG
/LegendSampling Locations 06/26/14
@? Monitor Well / Soil Boring
F Spring
§ Swale Samples
Swale
! Soil Boring
! Leach Field
! Septic
!H Bedrock Well
d Utility Pole
Local Road
XY XY XY XY XY VELCO Transmission Line
Elevation Contours - 2 ft
0 10050Feet
4

5

VELCO McGuinness Spring Investigation Monitoring Well Logs
Town of Monkton, Vermont Logged by Owen McEnroe and Joseph Grossman of VHB
Monitor Well ID: MW-1 Date Logged: June 24, 2014
Deposition Type
Depth in Feet
Color Consistency Texture Structure Mottling Comments
Topsoil 0 – .1 Dark brown Loose organics Granular None Roots and
topsoil; PID: 0.0
Amenia extremely stony
loam
0.1 – 1.8 Light Brown,
Rusty Moist Firm
Coarse sand, silt, gravel
Granular None Moist; PID: 0.0
1.8 – 4.8 Light Brown,
Rusty Moist Firm
Coarse sand, silt, gravel
Granular None Moist; PID: 0.0
4.8 – 8 Light Brown
Rusty Loose
Fine sand, gravel, cobble
Granular None Saturated; PID: 0.0
General Notes: 1” PVC monitoring well installed with a GeoProbe. Set bottom to 8’ bgs. Screen is 7’ (0.020-inch slot). Bentonite seal installed. Stickup is 3.27’. Water was at 1.5’ bgs before well installation. No visual or odor indications of contamination.
6

VELCO McGuinness Spring Investigation Monitoring Well Logs
Town of Monkton, Vermont Logged by Owen McEnroe and Joseph Grossman of VHB
Monitor Well ID: MW-2 Date Logged: June 24, 2014
Deposition Type
Depth in Feet
Color Consistency Texture Structure Mottling Comments
Topsoil 0 – 1.3 Dark brown Friable Silt Granular None Dry; PID: 0.0
Amenia stony loam
1.3 – 2.3 Grey/Light
Brown Firm Silt/Clay Granular None Moist; PID: 0.0
2.3 – 2.8 Light Brown Fluffy Sand, silt, loam Granular None Saturated; PID: 0.0
2.8 – 4.6 Medium Brown
Firm Sand, silt,
gravel, loam Granular None Moist; PID: 0.0
4.6 – 5.7 Gray Moist, firm Sand, clay Granular None Moist but no
water to depth; PID: 0.0
5.7 – 7.3 Gray Moist, firm Sand, clay Granular None Moist but no
water to depth; PID: 0.0
7.3 – 9.1 Light Brown Moist Loose Gravel, Cobble Granular None Moist; PID: 0.0
9.1 – 10.8 Light Brown Hard Pulverized
Cobble Granular None PID: 0.0
10.8 – 11.0 Light Brown Moist Loose Gravel, Cobble Granular None Moist; PID: 0.0
11.0 – 13.75
Light Brown/Rusty
Loose Silt, Sand, Gravel Granular None Moist; PID: 0.0
13.75 – 14.8
Med Brown Firm Silt Granular None Moist; PID: 0.0
14.8 – 15.75
Light Brown/Rusty
Loose List, sand, gravel Granular None Saturated; PID: 0.0
General Notes: 1” PVC monitoring well installed with a GeoProbe. Set bottom to 15.75’ bgs. Screen is 5.0’ (0.020-inch slot). Bentonite seal installed. Stickup 2.97’. Installed well guard with padlock. No visual or odor indications of contamination.
7
VELCO McGuinness Spring Investigation Monitoring Well Logs
Town of Monkton, Vermont Logged by Owen McEnroe and Joseph Grossman of VHB
Monitor Well ID: MW-3 Date Logged: June 24, 2014
Deposition Type
Depth in Feet
Color Consistency Texture Structure Mottling Comments
Topsoil 0 - 0.4 Dark brown Loose Loam with organics
Granular None Topsoil, roots;
PID: 0.0
Amenia extremely stony
loam
0.4 - 3.1 Dark Brown Firm Silt, Loam,
Gravel Granular Orange Moist; PID: 0.0
3.1 - 4.8 Light brown Moist, Firm Fine sandy loam Granular None Moist; PID: 0.0 4.8 - 7.8 Light brown Moist, Firm Fine sandy loam Granular None Moist; PID: 0.0
7.8 - 8.0 Light Brown Loose Crushed
Rock/Gravel Granular None
8.0 - 8.8 Light Brown Firm Sand, Silt Granular Rusty Saturated; PID: 0.0
8.8 - 9.6 Light Brown Firm Sand, Silt Granular Rusty Moist; PID: 0.0 9.6 - 10.25
Light Brown Firm Sand, Silt Granular Rusty Moist; PID: 0.0
10.25 - 10.3
Pink Loose Crushed Rock,
Gravel Granular None PID: 0.0
10.3 - 11.0
Light Brown Loose Silt, Sand, Gravel Granular Rusty Saturated; PID: 0.0
General Notes: 1” PVC monitoring well installed with a GeoProbe Set bottom to 11.0’ bgs. Screen is 5.0’ (0.020-inch slot). Bentonite seal installed. Stickup 2.62’. Installed well guard with padlock. No visual or odor indications of contamination.
Monitor Well ID: MW-4 Date Logged: June 24, 2014
Deposition Type
Depth in Feet
Color Consistency Texture Structure Mottling Comments
Topsoil 0 - 2.0 Dark Brown Firm Silt, Loam Granular None Moist; PID: 0.0
Amenia extremely stony
loam
2.0 – 4.9 Light Brown Firm Silt, Sand, Gravel Granular Red PID: 0.0
4.9 – 9.5 Light brown Moist Firm Silt, Sand Gravel Granular None Moist, bottomed out on rock at 9.5; PID: 0.0
General Notes: 1” PVC monitoring well installed with a GeoProbe. Set bottom to 9.5’ bgs. Screen is 5.0’ (0.020-inch slot). Bentonite seal installed. Stickup 3.28’. Installed well guard with padlock. No visual or odor indications of contamination.
8

VELCO McGuinness Spring Investigation Monitoring Well Logs
Town of Monkton, Vermont Logged by Owen McEnroe and Joseph Grossman of VHB
Soil Boring ID: SB-5 Date Logged: June 18, 2014 & June 24, 2014
Deposition Type
Depth in Feet
Color Consistency Texture Structure Mottling Comments
Topsoil 0 – 1.6 Light Brown Loose Silt, Loam Granular Red PID: 0.0
Amenia extremely stony
loam
1.6 - 2.9 Light Brown Loose Silt, Loam, W/Cobble
Granular Orange Moist; PID: 0.0
2.9 – 3.9 Light Brown Loose Silt, Medium
Gravel, Cobble Granular Orange Moist; PID: 0.0
3.9 – 5.1 Light Brown Loose Silt, W/medium gravel, cobble
Granular None Moist; PID: 0.0
5.1 – 7.4 Light Brown Loose Silt, W/medium gravel, cobble
Granular None Moist; PID: 0.0
General Notes: No well installed. Soil boring completed with manual auger and GeoProbe, refusal on rock at 7.4. Still dry after 30 minutes. Hole backfilled. No visual or odor indications of contamination.
Monitor Well ID: MW-6 Date Logged: June 18, 2014
Deposition Type
Depth in Feet
Color Consistency Texture Structure Mottling Comments
Topsoil 0 – 1.2 Light Brown Firm
Silt, loam, some fine to medium
Gravel Granular None Moist; PID: 0.0
Amenia extremely stony
loam
1.2 – 2.1 Light Brown Firm Silt loam, w/fine to medium gravel
Granular None Moist, water at 2.1; PID: 0.0
2.1 – 2.6 Light Brown Loose Silt, w/medium
gravel Granular None
Saturated; PID: 0.0
2.6 – 2.9 Light Brown Loose Saturated fan silt,
w/medium to Granular None
Saturated; PID: 0.0
General Notes: 2” PVC monitoring well installed with a manual auger. Set bottom to 2.9’ bgs. Screen is 1.8’ (0.020-inch slot). Bentonite seal installed. Stickup 1.58’. Installed steel/PVC well guard with padlock. No visual or odor indications of contamination.
9
VELCO McGuinness Spring Investigation Monitoring Well Logs
Town of Monkton, Vermont Logged by Owen McEnroe and Joseph Grossman of VHB
Monitor Well ID: MW-7 Date Logged: June 18, 2014
Deposition Type
Depth in Feet
Color Consistency Texture Structure Mottling Comments
Topsoil 0 - 0.7 Light Brown Firm Silt Granular None Dry; PID: 0.0
Amenia extremely stony
loam
0.7 – 1.9 Light Brown Firm Clay, fine sand Granular Some Moist; PID: 0.0
1.9 – 2.5 Light Brown Firm Silt, Clay, Sand,
Gravel Granular Some
Very moist; PID: 0.0
2.5 – 3.5 Tan Loose Medium sand, course gravel
Granular None Moist to
Saturated; PID: 0.0
3.5 – 5.0 Tan Loose Silt, medium sand, gravel,
cobble Granular None
Moist to Saturated; PID: 0.0
5.0 – 5.5 Light Tan Loose Fine to course
sand, fine gravel Granular None
Saturated; PID: 0.0
General Notes: 2” PVC monitoring well installed with a manual auger. Set bottom to 5.5’ bgs. Screen is 2.5’ (0.020-inch slot). Bentonite seal installed. Stickup 3.59’. Installed steel well guard with padlock. No visual or odor indications of contamination.
Soil Boring ID: SB-8 Date Logged: June 24, 2014 Deposition
Type Depth in
Feet Color Consistency Texture Structure Mottling Comments
Topsoil 0 – 0.9 Dark brown Firm Loam Granular None PID: 0.0
Amenia extremely stony
loam
0.9 – 1.8 Light Brown Loose Crushed Rock Granular None PID: 0.0
1.8 – 3.2 Medium Brown
Firm Silt Granular None Moist; PID: 0.0
3.2 – 6.7 Light Brown Firm Silt Granular Grey Saturated; PID: 0.0
6.7 – 7.9 Light Brown Firm Silt, w/gravel Granular None Moist; PID: 0.0
7.9 – 9.5 Grey Brown Firm Silt, sand Granular None Moist; PID: 0.0
9.5 - 11.5 Grey Brown Firm Silt, sand Granular None Very moist
PID: 1.1
General Notes: Monitoring well was not installed. Soil boring completed with a GeoProbe. Bottom of hole was dry, 3 attempts encountered refusal at approximately 11.5 ft. Holes backfilled. No visual or odor indications of contamination.
10
VELCO McGuinness Spring Investigation Monitoring Well Logs
Town of Monkton, Vermont Logged by Owen McEnroe and Joseph Grossman of VHB
Monitor Well ID: MW-9 Date Logged: June 24, 2014
Deposition Type
Depth in Feet
Color Consistency Texture Structure Mottling Comments
Topsoil 0 – 0.6 Dark Brown Firm Fine sand, silt Granular None Moist; PID: 0.0
Amenia stony loam
1.0 – 1.8 Medium Brown
Firm Fine sand, silt Granular None Moist; PID: 0.0
2.0 – 4.8 Light Brown Firm Gravel and silt Granular None Very Moist;
PID: 0.0
4.8 – 9.5 Light Brown Firm Silt, sand, gravel,
cobble Granular None Moist; PID: 0.0
General Notes: 1” PVC monitoring well installed with a GeoProbe. Set bottom to 9.5’ bgs. Screen is 5.0’ (0.020-inch slot). Bentonite seal installed. Stickup 1.65’. GeoProbe couldn’t penetrate the ground any deeper than 9.5’ due to refusal. Installed steel well guard with padlock. No visual or odor indications of contamination.
F:\57688.00 VELCO McGuinness Spring\ssheets\VELCO McGuinness-Soil Test Pits.docx
11

McGuinness Property
Contaminant Investigation
Utility Pole Constituents
Table Prepared by VHB on July 22, 2014
Residential
RSL (mg/kg)
Industrial RSL
(mg/kg)
Residential
SSV (mg/kg) Lab Method Utility Pole
Date of Sample ‐‐ ‐‐ ‐‐ ‐‐ 4/30/2014
Anthracene (mg/Kg) 17,000 230,000 17,000 EPA 8270D 116
Fluorene (mg/Kg) 2,300 30,000 2,300 EPA 8270D 106
1‐Methylnaphthalene (mg/Kg) 17 73 17 EPA 8270D 127
2‐Methylnaphthalene (mg/Kg) 230 3,000 230 EPA 8270D 208
Pentachlorophenol (mg/Kg) 0.99 4.00 0.99 EPA 8151A 747
Phenanthrene (mg/Kg) ‐‐ ‐‐ ‐‐ EPA 8270D 2,290
All values in mg/kg unless otherwise noted
ND ‐ Not detected below the indicated value
Table 1: Detected PAH and Pesticide Constituents in Sample of Wood Shavings from Structure #190
\\vhb\proj\Vermont\57688.00 VELCO McGuinness Spring\reports\Report Tables| Utility Pole 7/24/2014
12

McGuinness Property
Contaminant Investigation
Groundwater Constituents
Table Prepared by VHB on July 22, 2014
Spring
Date of Sample ‐‐ ‐‐ 4/17/14 4/24/14** 6/26/14 6/26/14 6/26/14 6/26/14 6/26/14 6/26/14 6/26/14 6/26/14
Anthracene (ug/L) 1,050 2,100 EPA 8270D 1.1 ‐‐ ND< 1.0 ‐‐ ‐‐ ‐‐ ‐‐ ND< 1.0 ND< 1.0 ND< 1.0
Fluorene (ug/L) 140 280 EPA 8270D 1.3 ‐‐ ND< 1.0 ‐‐ ‐‐ ‐‐ ‐‐ ND< 1.0 ND< 1.0 ND< 1.0
1‐Methylnaphthalene (ug/L) ‐‐ ‐‐ EPA 8270D 3.2 ‐‐ ND< 1.0 ‐‐ ‐‐ ‐‐ ‐‐ ND< 1.0 ND< 1.0 ND< 1.0
2‐Methylnaphthalene (ug/L) ‐‐ ‐‐ EPA 8270D 6.2 ‐‐ ND< 1.0 ‐‐ ‐‐ ‐‐ ‐‐ ND< 1.0 ND< 1.0 ND< 1.0
Pentachlorophenol (ug/L) 0.3 1.0 EPA 514.4 7.02 1.6 ND< 0.5 ND< 0.5 ND< 0.5 ND< 0.5 ND< 0.5 ND< 0.5 ND< 0.5 ND< 0.5
Phenanthrene (ug/L) ‐‐ ‐‐ EPA 8270D 21.4 ‐‐ ND< 1.0 ‐‐ ‐‐ ‐‐ ‐‐ ND< 1.0 ND< 1.0 ND< 1.0
1,2,3,6,7,8‐HxCDD Dioxin (pg/L) *J ‐‐ ‐‐ EPA 1613B ‐‐ ‐‐ 9.6 ‐‐ ‐‐ ‐‐ ‐‐ ‐‐ ‐‐ ‐‐
1,2,3,4,6,7,8‐HpCDF (pg/L) ‐‐ ‐‐ EPA 1613B ‐‐ ‐‐ 65.0 ‐‐ ‐‐ ‐‐ ‐‐ ‐‐ ‐‐ ‐‐
1,2,3,4,6,7,8‐HpCDD (pg/L) ‐‐ ‐‐ EPA 1613B ‐‐ ‐‐ 240.0 ‐‐ ‐‐ ‐‐ ‐‐ ‐‐ ‐‐ ‐‐
OCDF ‐‐ ‐‐ EPA 1613B ‐‐ ‐‐ 540.0 ‐‐ ‐‐ ‐‐ ‐‐ ‐‐ ‐‐ ‐‐
OCDD ‐‐ ‐‐ EPA 1613B ‐‐ ‐‐ 1600.0 ‐‐ ‐‐ ‐‐ ‐‐ ‐‐ ‐‐ ‐‐
2,3,7,8‐TCDD Dioxin 11 30 EPA 1613B ‐‐ ‐‐ ND< 2.8 ‐‐ ‐‐ ‐‐ ‐‐ ‐‐ ‐‐ ‐‐
Total 2,3,7,8‐TCDD Dioxin Equivalence
(pg/L)11 30 EPA 1613B ‐‐ ‐‐ 4.7 ‐‐ ‐‐ ‐‐ ‐‐ ‐‐ ‐‐ ‐‐
** 4/24/2014 sample collected by Vermont Department of Health
All values in ug/L unless otherwise noted
PAL ‐ VT Preventive Action Level
VGES ‐ VT Groundwater Enforcemnet Standards
ND ‐ Not detected below the indicated value
Bold ‐ Exceeds the PAL
Shaded ‐ Exceeds the VGES
McGuinness Spring
Table 2: Groundwater Constituents
*J ‐ Estimated value. The analyte was detected in the sample at a concentration less than the laboratory Limit of Quantitation (LOQ)(previously called Practical
Quantitation Limit (PQL)), but above the Method Detection Limit (MDL).
PAL VGESParameter Lab Method MW‐1 MW‐2 MW‐3 MW‐4 MW‐6 MW‐7 MW‐9Kitchen Sink
F:\57688.00 VELCO McGuinness Spring\reports\Report Tables| Groundwater 7/25/2014
13
McGuinness Property
Contaminant Investigation
Surface Water Constituents
Table Prepared by VHB on July 22, 2014
Acute Chronic
Date of Sample ‐‐ ‐‐ ‐‐ 6/26/14 6/26/14
Anthracene (ug/L) ‐‐ ‐‐ EPA 8270D ‐‐ ‐‐
Fluorene (ug/L) ‐‐ ‐‐ EPA 8270D ‐‐ ‐‐
1‐Methylnaphthalene (ug/L) ‐‐ ‐‐ EPA 8270D ‐‐ ‐‐
2‐Methylnaphthalene (ug/L) ‐‐ ‐‐ EPA 8270D ‐‐ ‐‐
Pentachlorophenol* (ug/L) 14.8 9.4 EPA 514.4 0.62 ND< 0.5
Phenanthrene (ug/L) ‐‐ ‐‐ EPA 8270D ‐‐ ‐‐
All values in ug/L unless otherwise noted
VWQS ‐ Vermont Water Quality Standard ‐ Maximum Allowable Concentration
ND ‐ Not detected below the indicated value
Shaded ‐ Exceeds the VWQS
Table 3: Surface Water Constituents
*Surface Water Quality Standards for Pentachlorophenol are expressed as exp(1.005 (pH) ‐ 4.830) for Acute criteria, and as exp(1.005 (pH)
5.290) for Chronic criteria. Standards were calculated based on pH of 7.49 measured during low‐flow purge analysis at the spring on site
(6/26/2014). The swale is not used as a source for consumption of water or organisms and therefore the human health criteria are not
applicable.
VWQS: Protection of
Aquatic Biota Lab MethodSwale 1: 7 feet down
stream from spring
Swale 2: 30 feet down
stream from springParameter
\\vhb\proj\Vermont\57688.00 VELCO McGuinness Spring\reports\Report Tables, Surface Water
14

McGuinness Property
Contaminant Investigation
Drinking Water Constituents ‐ new Bedrock Well
Table Prepared by VHB on July 22, 2014
ParameterMCL or
MRDL*VHA VAL Lab Method
Date of Sample 5/14/14* 6/26/14
Total Coliform (MPN/100mls) Absent ‐‐ ‐‐ SM18 9223B (97) ND< 1.0 ‐‐
e. coli (MPN/100mls) Absent ‐‐ ‐‐ SM18 9223B (97) ND< 1.0 ‐‐
Total Arsenic (mg/L) 0.010 ‐‐ ‐‐ SM20 3113B ND< 0.001 ‐‐
Total Barium (mg/L) 2.000 ‐‐ ‐‐ EPA 200.7 0.043 0.045
Total Lead (mg/L) 0.015 ‐‐ 0.015 SM20 3113B ND< 0.001 ‐‐
Bromodichloromethane (ug/L) 80.0 ‐‐ ‐‐ EPA 524.2 ND< 0.5 ND< 0.5
Dibromochloromethane (ug/L) 80.0 ‐‐ ‐‐ EPA 524.2 ND< 0.5 ND< 0.5
Bromoform (ug/L) 80.0 ‐‐ ‐‐ EPA 524.2 ND< 0.5 ND< 0.5
Chloroform (ug/L) 80.0 ‐‐ ‐‐ EPA 524.2 ND< 0.5 ND< 0.5
Vinyl Chloride (ug/L) 2.0 ‐‐ 0.5 EPA 524.2 ND< 0.5 ND< 0.5
Benzene (ug/L) 5.0 ‐‐ 1.0 EPA 524.2 ND< 0.5 ND< 0.5
Carbon tetrachloride (ug/L) 5.0 ‐‐ 0.5 EPA 524.2 ND< 0.5 ND< 0.5
1,2‐Dichloroethane (ug/L) 5.0 ‐‐ 0.5 EPA 524.2 ND< 0.5 ND< 0.5
Trichloroethene (ug/L) 5.0 ‐‐ ‐‐ EPA 524.2 ND< 0.5 ND< 0.5
1,4‐Dichlorobenzene (ug/L) 75.0 ‐‐ ‐‐ EPA 524.2 ND< 0.5 ND< 0.5
1,1‐Dichloroethene (ug/L) 7.0 ‐‐ ‐‐ EPA 524.2 ND< 0.5 ND< 0.5
1,1,1‐Trichloroethane (ug/L) 200.0 ‐‐ ‐‐ EPA 524.2 ND< 0.5 ND< 0.5
cis‐1,2‐Dichloroethene (ug/L) 70.0 ‐‐ ‐‐ EPA 524.2 ND< 0.5 ND< 0.5
1,2‐Dichloropropane (ug/L) 5.0 ‐‐ 0.6 EPA 524.2 ND< 0.5 ND< 0.5
Ethylbenzene (ug/L) 700.0 ‐‐ ‐‐ EPA 524.2 ND< 0.5 ND< 0.5
Chlorobenzene (ug/L) 100.0 ‐‐ ‐‐ EPA 524.2 ND< 0.5 ND< 0.5
Methyl‐t‐butyl ether (MTBE)
(ug/L)40.0 ‐‐ ‐‐ EPA 524.2 ND< 0.5 ND< 0.5
1,2‐Dichlorobenzene (ug/L) 600.0 ‐‐ ‐‐ EPA 524.2 ND< 0.5 ND< 0.5
Styrene (ug/L) 100.0 ‐‐ ‐‐ EPA 524.2 ND< 0.5 ND< 0.5
Tetrachloroethene (ug/L) 5.0 ‐‐ ‐‐ EPA 524.2 ND< 0.5 ND< 0.5
Toluene (ug/L) 1000.0 ‐‐ ‐‐ EPA 524.2 1.4 ND< 0.5
Xylenes, Total (ug/L) 10000.0 ‐‐ ‐‐ EPA 524.2 ND< 1.0 ND< 1.0
1,2,4‐Trichlorobenzene (ug/L) 70.0 ‐‐ ‐‐ EPA 524.2 ND< 0.5 ND< 0.5
1,1,2‐Trichloroethane (ug/L) 5.0 ‐‐ ‐‐ EPA 524.2 ND< 0.5 ND< 0.5
Methylene chloride (ug/L) 5.0 ‐‐ ‐‐ EPA 524.2 ND< 0.5 ND< 0.5
Dalapon (ug/L) 200.0 ‐‐ ‐‐ EPA 515.4 ND< 15.0 ‐‐
2,4‐D (ug/L) 70.0 ‐‐ ‐‐ EPA 515.4 ND< 0.5 ‐‐
Pentachlorophenol (ug/L) 1.0 ‐‐ ‐‐ EPA 515.4 ND< 0.5 ‐‐
2,4,5‐TP (Silvex) (ug/L) 50.0 ‐‐ ‐‐ EPA 515.4 ND< 2.0 ‐‐
Uranium (ug/L) 20.00 ‐‐ ‐‐ EPA 200.8 ‐‐ 2.51
Gross Alpha (pCi/L) 15.0 ‐‐ ‐‐ EPA 900.0 2.58+/‐1.15 ‐‐
pH (SU) 6.5‐8.5 ‐‐ ‐‐ SM 4500‐H B. (97) ‐‐ 7.9
Chloride (mg/L) 250.0 ‐‐ ‐‐ EPA 300.0 ‐‐ ND< 2.5
Odor (TON) 3.0 ‐‐ ‐‐ SM20 2150B (97) ‐‐ 1.0
Total Iron (mg/L) 0.300 ‐‐ ‐‐ EPA 200.7 ‐‐ 0.084
Total Manganese (mg/L) 0.05 ‐‐ ‐‐ EPA 200.7 ‐‐ ND< 0.02
Total Sodium (mg/L) 250.0 ‐‐ ‐‐ EPA 200.7 ‐‐ 5.8
Bromobenzene (ug/L) ‐‐ ‐‐ ‐‐ EPA 524.2 ND< 0.5 ND< 0.5
Bromomethane (ug/L) ‐‐ 10.0 ‐‐ EPA 524.2 ND< 0.5 ND< 0.5
Bromochloromethane (ug/L) ‐‐ 90.0 ‐‐ EPA 524.2 ND< 0.5 ND< 0.5
n‐Butylbenzene (ug/L) ‐‐ ‐‐ ‐‐ EPA 524.2 ND< 0.5 ND< 0.5
s‐Butylbenzene (ug/L) ‐‐ ‐‐ ‐‐ EPA 524.2 ND< 0.5 ND< 0.5
t‐Butylbenzene (ug/L) ‐‐ ‐‐ ‐‐ EPA 524.2 ND< 0.5 ND< 0.5
Chloroethane (ug/L) ‐‐ ‐‐ ‐‐ EPA 524.2 ND< 0.5 ND< 0.5
Chloromethane (ug/L) ‐‐ 30.0 ‐‐ EPA 524.2 ND< 0.5 ND< 0.5
Table 4: Drinking Water Constituents
Radionuclides
Primary Inorganic Chemicals
Disinfection By‐Products (Method 524.2)
Microbiology
New Bedrock Well ‐ Sample
Collected at Pressure Tank
Secondary Standards ‐ Secondary MCL
Non‐Regulated Contaminants
Synthetic Organic Chemicals
Volatile Organic Chemicals (Method 524.2)
\\vhb\proj\Vermont\57688.00 VELCO McGuinness Spring\reports\Report Tables| Drinking Water 7/24/2014
15

McGuinness Property
Contaminant Investigation
Drinking Water Constituents ‐ new Bedrock Well
Table Prepared by VHB on July 22, 2014
ParameterMCL or
MRDL*VHA VAL Lab Method
Date of Sample 5/14/14* 6/26/14
Table 4: Drinking Water Constituents
New Bedrock Well ‐ Sample
Collected at Pressure Tank
2‐Chlorotoluene (ug/L) ‐‐ ‐‐ ‐‐ EPA 524.2 ND< 0.5 ND< 0.5
4‐Chlorotoluene (ug/L) ‐‐ ‐‐ ‐‐ EPA 524.2 ND< 0.5 ND< 0.5
Dibromomethane (ug/L) ‐‐ ‐‐ ‐‐ EPA 524.2 ND< 0.5 ND< 0.5
Dicamba (ug/L) ‐‐ 189.0 ‐‐ EPA 515.4 ND< 10.0 ‐‐
Dichlorodifluoromethane (ug/L) ‐‐ 1000.0 ‐‐ EPA 524.2 ND< 0.5 ND< 0.5
1,3‐Dichlorobenzene (ug/L) ‐‐ ‐‐ ‐‐ EPA 524.2 ND< 0.5 ND< 0.5
1,1‐Dichloroethane (ug/L) ‐‐ 70.0 ‐‐ EPA 524.2 ND< 0.5 ND< 0.5
trans‐1,2‐Dichloroethene (ug/L) ‐‐ ‐‐ ‐‐ EPA 524.2 ND< 0.5 ND< 0.5
1,3‐Dichloropropane (ug/L) ‐‐ 0.5 ‐‐ EPA 524.2 ND< 0.5 ND< 0.5
2,2‐Dichloropropane (ug/L) ‐‐ ‐‐ ‐‐ EPA 524.2 ND< 0.5 ND< 0.5
1,1‐Dichloropropene (ug/L) ‐‐ ‐‐ ‐‐ EPA 524.2 ND< 0.5 ND< 0.5
cis‐1,3‐Dichloropropene (ug/L) ‐‐ ‐‐ ‐‐ EPA 524.2 ND< 0.5 ND< 0.5
trans‐1,3‐Dichloropropene (ug/L) ‐‐ ‐‐ ‐‐ EPA 524.2 ND< 0.5 ND< 0.5
Hexachlorobutadiene (ug/L) ‐‐ 1.0 ‐‐ EPA 524.2 ND< 0.5 ND< 0.5
Isopropylbenzene (ug/L) ‐‐ ‐‐ ‐‐ EPA 524.2 ND< 0.5 ND< 0.5
4‐Isopropyltoluene (ug/L) ‐‐ ‐‐ ‐‐ EPA 524.2 ND< 0.5 ND< 0.5
Naphthalene (ug/L) ‐‐ 20.0 ‐‐ EPA 524.2 ND< 0.5 ND< 0.5
n‐Propylbenzene (ug/L) ‐‐ ‐‐ ‐‐ EPA 524.2 ND< 0.5 ND< 0.5
1,1,1,2‐Tetrachloroethane (ug/L) ‐‐ 70.0 ‐‐ EPA 524.2 ND< 0.5 ND< 0.5
1,1,2,2‐Tetrachloroethane (ug/L) ‐‐ ‐‐ ‐‐ EPA 524.2 ND< 0.5 ND< 0.5
1,2,3‐Trichlorobenzene (ug/L) ‐‐ ‐‐ ‐‐ EPA 524.2 ND< 0.5 ND< 0.5
Trichlorofluoromethane (ug/L) ‐‐ ‐‐ ‐‐ EPA 524.2 ND< 0.5 ND< 0.5
1,2,3‐Trichloropropane (ug/L) ‐‐ 5.0 ‐‐ EPA 524.2 ND< 0.5 ND< 0.5
1,3,5‐Trimethylbenzene (ug/L) ‐‐ 4.0 ‐‐ EPA 524.2 ND< 0.5 ND< 0.5
2,4,5‐T (ug/L) ‐‐ ‐‐ ‐‐ EPA 515.4 ND< 3.0 ‐‐
* 5/14/2014 Sample collected by Chevalier Drilling Co.
All values in ug/L unless otherwise noted
MCL ‐ Maximum Contaminant Level
VAL ‐ VT Action Level
VHA ‐ VT Health Advisory Level
ND ‐ Not detected below the indicated value
Bold ‐ Exceeds the MCL
Shaded ‐ Exceeds the VHA
Non‐Regulated Contaminants, continued
\\vhb\proj\Vermont\57688.00 VELCO McGuinness Spring\reports\Report Tables| Drinking Water 7/24/2014
16

McGuinness Property
Contaminant Investigation
Drinking Water Constituents ‐ new Bedrock Well
Table Prepared by VHB on July 22, 2014
MCL or MRDLLab Method
Date of Sample ‐‐ ‐‐ 5/14/14* 6/26/14
Microbiology
Total Coliform (MPN/100mls) Absent SM18 9223B (97) ND< 1.0 ‐‐
Primary Inorganic Chemicals
Total Arsenic (mg/L) 0.010 SM20 3113B ND< 0.001 ‐‐
Barium (mg/L) 2.000 EPA 200.7 0.043 0.045
Nitrogen, Nitrite (mg/L) 1.00 EPA 300.0 ‐‐ ND< 0.02
Nitrogen, Nitrate (mg/L) 10.00 EPA 300.0 ‐‐ 0.23
Volatile Organic Chemicals
Toluene (ug/L) 1,000.0 EPA 524.2 1.4 ND< 0.5
Radionuclides
Uranium (ug/L) 20 EPA 200.8 ‐‐ 2.51
Gross Alpha (pCi/L) 15.00 EPA 900.0 2.58+/‐1.15 ‐‐
Secondary Standards ‐ Secondary MCL
Chloride (mg/L) 250 EPA 300.0 ‐‐ ND< 2.5
Total Manganese (mg/L) 0.05 EPA 200.7 ‐‐ ND< 0.02
pH (SU) 6.5‐8.5 SM 4500‐H B. (97) ‐‐ 7.9
Odor (TON) 3 SM20 2150B (97) ‐‐ 1
Total Iron (mg/L) 0.3 EPA 200.7 ‐‐ 0.084
Total Sodium (mg/L) 250.0 EPA 200.7 ‐‐ 5.8
* 5/14/2014 Sample collected by Chevalier Drilling Co.
All values in mg/kg unless otherwise noted
MCL ‐ Maximum Contaminant Level
MRDL ‐ Maximum Residual Disinfectant Level
ND ‐ Not detected below the indicated value
Bold ‐ Exceeds the MCL/MRDL
Table 5: Drinking Water Summary ‐ All Detected Parameters in Drinking Water, plus all regulated parameters for a non‐
public water source (VT WSR Tables A‐11‐5 and A‐11‐7)
New Bedrock Well ‐ Sample
Collected at Pressure Tank
\\vhb\proj\Vermont\57688.00 VELCO McGuinness Spring\reports\Report Tables| Drinking Water A11‐7 7/24/2014
17

McGuinness Property
Contaminant Investigation
Soil Constituents
Table Prepared by VHB on July 22, 2014
Parameter Residential RSL Industrial RSLResidential
SSVMW‐1 MW‐2 MW‐3 MW‐4 SB‐5 MW‐6 MW‐7 SB‐8 MW‐9
Date of Sample ‐‐ ‐‐ ‐‐ 6/24/2014 6/24/2014 6/24/2014 6/24/2014 6/18/2014 6/18/2014 6/18/2014 6/24/2014 6/24/2014
Lab Method(s) ‐‐ ‐‐ ‐‐ ‐‐ ‐‐ ‐‐ ‐‐EPA 8270D,
EPA 8015B
EPA 8270D, EPA
8015B
EPA 8270D, EPA
8015B
EPA 8270D,
EPA 8151A‐‐
Depth of Sample (ft bgs) ‐‐ ‐‐ ‐‐ 0 ‐ 8' 0 ‐ 15.75' 0 ‐ 11.0' 0 ‐ 9.5' 3.9 ‐ 5.1' 1.0 ‐ 2.1' 3.5 ‐ 5.0' 9.5 ‐ 11.5' 0 ‐ 9.5'
PID Field Measurement (ppm) ‐‐ ‐‐ ‐‐ 0.0 0.0 0.0 0.0 0.0 0.0 0.0 1.1 0.0
Anthracene (ug/Kg, dry) 17,000,000 230,000,000 17,000,000 ‐‐ ‐‐ ‐‐ ‐‐ ND< 37.0 ND< 45.0 ND< 38.0 ‐‐ ‐‐
Fluorene (ug/Kg, dry) 2,300,000 30,000,000 2,300,000 ‐‐ ‐‐ ‐‐ ‐‐ ND< 37.0 ND< 45.0 ND< 38.0 ‐‐ ‐‐
Pentachlorophenol (ug/Kg, dry) 990 4,000 990 ‐‐ ‐‐ ‐‐ ‐‐ ND< 370.0 ND< 450.0 ND< 380.0 ND< 7.18 ‐‐
Phenanthrene (ug/Kg, dry) ‐‐ ‐‐ ‐‐ ‐‐ ‐‐ ‐‐ ‐‐ ND< 37.0 ND< 45.0 ND< 38.0 ‐‐ ‐‐
1‐Methylnaphthalene (ug/Kg, dry) 17,000 73,000 17,000 ‐‐ ‐‐ ‐‐ ‐‐ ND< 37.0 ND< 45.0 ND< 38.0 ‐‐ ‐‐
2‐Methylnaphthalene (ug/Kg, dry) 230,000 3,000,000 230,000 ‐‐ ‐‐ ‐‐ ‐‐ ND< 37.0 ND< 45.0 ND< 38.0 ‐‐ ‐‐
C10‐C28 TPH‐DRO (mg/Kg, dry) ‐‐ ‐‐ ‐‐ ‐‐ ‐‐ ‐‐ ‐‐ ND< 3.0 4.70 ND< 3.0 ND< 3.0 ‐‐
C28‐C40 TPH (mg/Kg, dry) ‐‐ ‐‐ ‐‐ ‐‐ ‐‐ ‐‐ ‐‐ ND< 3.0 4.12 ND< 3.0 ND< 3.0 ‐‐
Tot. Petroleum Hydrocarbons
(mg/Kg, dry)‐‐ ‐‐ ‐‐ ‐‐ ‐‐ ‐‐ ‐‐ ND< 3.0 8.82 ND< 3.0 ND< 3.0 ‐‐
All values in ug/kg unless otherwise noted
RSL ‐ EPA Regional Screening Level
SSV ‐ VT DEC Soil Screening Value
ND ‐ Not detected below the indicated value
Bold ‐ Exceeds the Residential RSl
Shaded ‐ Exceeds the Industrial RSL
Bold Italic ‐ Exceeds the Residential SSV
ft bgs ‐ feet below ground surface
ppm ‐ parts per million
Table 6: Soil Constituents
\\vhb\proj\Vermont\57688.00 VELCO McGuinness Spring\reports\Report Tables| Soils 7/24/2014
18

VELCO McGuinness‐ Spring InvestigationDepths to GroundwaterTable Prepared by VHB on July 22, 2014
Well ID Total Depth StickupGround
Elevation
TOC
Elevation
Water Level
(Ft BTC)
Water Level
(Ft Below Grade)
Water Elevation
(ft)(ft) (ft) (ft) (ft) 6/26/2014 6/26/2014 6/26/2014
MW‐1 11.60 3.28 378.80 382.08 3.97 0.69 378.11
MW‐2 18.58 3.46 391.10 394.56 16.38 12.92 378.18
MW‐3 15.11 2.55 390.30 392.85 14.00 11.45 378.85
MW‐4 11.24 3.22 383.79 387.01 8.71 5.49 378.30
MW‐6 4.50 1.59 379.50 381.09 2.85 1.26 378.24
MW‐7 9.12 3.51 379.50 383.01 4.74 1.23 378.27
MW‐9 11.82 1.65 426.90 429.05 4.78 3.13 424.27
McGuinness Spring ‐‐ 1.56 378.54 380.10 1.90 0.34 378.20
McGuinness Well ‐‐ ‐‐ ‐‐ 477.61 ‐‐ ‐‐ ‐‐
BTC = Below top of CasingTOC = Top of CasingTotal Depth is measured from top of casing
Well elevations from survey by VHB, 2014
Table 7: Depth to Groundwater
\\vhb\proj\Vermont\57688.00 VELCO McGuinness Spring\ssheets\water_level_data| water_levels 7/22/2014
19

Low-Flow Sampling Data
Site ID: VELCO / McGuinness - Monkton VT Personnel: JWG
Date: 6/26/2014 Personnel: RWL
Start Time: 12:05 Pump ID: down well, dedicated
Weather: -- YSI ID: 3338
Monitor Well ID: Bedrock Well Screen Interval: --
Depth to Water: -- ft BTOP Pump Intake Depth: -- ft
PVC Stick-Up: -- ft. Well Guard Stick-Up (Ft): -- Purge Volume: --
Total Well Depth: -- ft BTOP Well Diameter: -- inches
Sample Time: 12:30 Well Condition: --
Temp DO Sp. Cond pH ORP Turb Pump Rate Depth to Water Visual
(deg C) (mg/L) (mS/cm) (su) (mV) (NTU) (mL/min) (ft BTOP) Observations+/- 3% +/- 10% +/- 3% +/- 0.1 su +/- 10mV +/- 10 NTU
12:18 12.8 5.68 0.403 7.69 # 102.1 -- -- -- clear
Additional Notes:
Time
Shaded cells = Limits to be met within three consecutive readings spaced 5 minutes apart.
Water was purged from kitchen sink at max speed (~5gpm) from 12:05-12:30. Approximate purge volume =125gal. Grab sample was taken from
exit of pressure tank before filter and softener, pressure tank has a 44 gallon storage capacity.
Grab Sample
0
50
100
150
200
250
300
350
400
450
0
2
4
6
8
10
12
14
0:00 12:00 0:00 12:00 0:00 12:00
OR
P
pH
, T
em
p, D
O,S
p. C
on
d.,
D
ep
th
Temp DO SP. Cond pH Depth-to-Water ORP
\\Vtnfdata\projects\57688.00 VELCO McGuinness Spring\ssheets\Low Flow Sampling Data.xlsx| Bedrock Well 7/28/2014
20

Low-Flow Sampling Data
Site ID: VELCO / McGuinness - Monkton VT Personnel: JWG
Date: 6/26/2014 Personnel: RWL
Start Time: 13:20 Pump ID: Peristaltic
Weather: sunny, 70's F YSI ID: 3338
Monitor Well ID: MW-1 Screen Interval: --
Depth to Water: 3.97 ft BTOP Pump Intake Depth: 11 ft
PVC Stick-Up: 3.26 ft. Well Guard Stick-Up (Ft): 3.29 Purge Volume: 0.6 L
Total Well Depth: 11.6 ft BTOP Well Diameter: 1 inches
Sample Time: 13:32 Well Condition: good
Temp DO Sp. Cond pH ORP Turb Pump Rate Depth to Water Visual
(deg C) (mg/L) (mS/cm) (su) (mV) (NTU) (mL/min) (ft BTOP) Observations+/- 3% +/- 10% +/- 3% +/- 0.1 su +/- 10mV +/- 10 NTU
13:20 12.9 0.72 0.660 7.34 106.2 -- -- 4.18 very turbid
13:22 11.7 1.79 0.555 7.32 96.0 -- -- 4.18 very turbid
13:24 11.5 1.82 0.561 7.20 67.3 -- -- 4.18 clearing
13:26 11.2 2.44 0.521 7.20 49.5 -- -- 4.18 clearing
13:28 11.1 2.70 0.504 7.23 42.8 -- -- 4.19 clearing
13:30 11.0 2.93 0.490 7.27 40.9 -- -- 4.19 clearing
Additional Notes:
Shaded cells = Limits to be met within three consecutive readings spaced 5 minutes apart.
Time
0
50
100
150
200
250
300
350
400
450
0
2
4
6
8
10
12
14
13:15 13:20 13:25 13:30 13:35
OR
P
pH
, T
em
p, D
O,S
p. C
on
d., D
ep
th
Temp DO SP. Cond pH Depth-to-Water ORP
\\Vtnfdata\projects\57688.00 VELCO McGuinness Spring\ssheets\Low Flow Sampling Data.xlsx| MW-1 7/28/2014
21

Low-Flow Sampling Data
Site ID: VELCO / McGuinness - Monkton VT Personnel: JWG
Date: 6/26/2014 Personnel: RWL
Start Time: 11:12 Pump ID: Peristaltic
Weather: cloudy, 70's F YSI ID: 3338
Monitor Well ID: MW-2 Screen Interval: --
Depth to Water: 16.38 ft BTOP Pump Intake Depth: 17.5 ft
PVC Stick-Up: 3.30 ft. Well Guard Stick-Up (Ft): 3.64 Purge Volume: 1.5 gal
Total Well Depth: 18.58 ft BTOP Well Diameter: 1 inches
Sample Time: 11:30 Well Condition: good
Temp DO Sp. Cond pH ORP Turb Pump Rate Depth to Water Visual
(deg C) (mg/L) (mS/cm) (su) (mV) (NTU) (mL/min) (ft BTOP) Observations+/- 3% +/- 10% +/- 3% +/- 0.1 su +/- 10mV +/- 10 NTU
11:02 11.5 7.04 0.490 7.53 64.7 -- 100 16.52 very turbid
11:04 10.6 6.07 0.478 7.32 71.9 -- 100 16.52 very turbid
11:06 9.8 6.17 0.461 7.12 81.2 -- 100 16.51 clearing
11:08 9.7 6.27 0.455 7.07 86.6 -- 100 16.50 clearing
11:10 9.6 6.05 0.452 7.07 89.7 -- 100 16.50 clearing
11:12 9.6 5.97 0.452 7.08 88.9 -- 100 16.50 clearing
Additional Notes:
Time
Shaded cells = Limits to be met within three consecutive readings spaced 5 minutes apart.
0
50
100
150
200
250
300
350
400
450
0
2
4
6
8
10
12
14
16
18
11:00 11:05 11:10 11:15
OR
P
pH
, T
em
p, D
O,S
p. C
on
d., D
ep
th
Temp DO SP. Cond pH Depth-to-Water ORP
\\Vtnfdata\projects\57688.00 VELCO McGuinness Spring\ssheets\Low Flow Sampling Data.xlsx| MW-2 7/28/2014
22

Low-Flow Sampling Data
Site ID: VELCO / McGuinness - Monkton VT Personnel: JWG
Date: 6/26/2014 Personnel: RWL
Start Time: 11:35 Pump ID: Peristaltic
Weather: overcast, 70's F YSI ID: 3338
Monitor Well ID: MW-3 Screen Interval: --
Depth to Water: 14.00 ft BTOP Pump Intake Depth: 15 ft
PVC Stick-Up: 2.62 ft. Well Guard Stick-Up (Ft): 2.97 Purge Volume: --
Total Well Depth: 15.11 ft BTOP Well Diameter: 1 inches
Sample Time: 15:55 Well Condition: good
Temp DO Sp. Cond pH ORP Turb Pump Rate Depth to Water Visual
(deg C) (mg/L) (mS/cm) (su) (mV) (NTU) (mL/min) (ft BTOP) Observations+/- 3% +/- 10% +/- 3% +/- 0.1 su +/- 10mV +/- 10 NTU
15:55 14.5 5.63 0.305 7.34 # 80.9 -- -- dry turbid
Additional Notes: Grab sample from bottom because of low recharge rate.
Time
Shaded cells = Limits to be met within three consecutive readings spaced 5 minutes apart.
0
50
100
150
200
250
300
350
400
450
0
2
4
6
8
10
12
14
16
0:00 2:24 4:48 7:12 9:36 12:00 14:24 16:48
OR
P
pH
, T
em
p, D
O,S
p. C
on
d., D
ep
th
Temp DO SP. Cond pH Depth-to-Water ORP
\\Vtnfdata\projects\57688.00 VELCO McGuinness Spring\ssheets\Low Flow Sampling Data.xlsx| MW-3 7/28/2014
23

Low-Flow Sampling Data
Site ID: VELCO / McGuinness - Monkton VT Personnel: JWG
Date: 6/26/2014 Personnel: RWL
Start Time: 10:47 Pump ID: Peristaltic
Weather: cloudy, 70's F YSI ID: 3338
Monitor Well ID: MW-4 Screen Interval: --
Depth to Water: 8.71 ft BTOP Pump Intake Depth: 10 ft
PVC Stick-Up: 3.28 ft. Well Guard Stick-Up (Ft): 3.63 Purge Volume: 0.1 L
Total Well Depth: 11.24 ft BTOP Well Diameter: 1 inches
Sample Time: 10:45 Well Condition: good
Temp DO Sp. Cond pH ORP Turb Pump Rate Depth to Water Visual
(deg C) (mg/L) (mS/cm) (su) (mV) (NTU) (mL/min) (ft BTOP) Observations+/- 3% +/- 10% +/- 3% +/- 0.1 su +/- 10mV +/- 10 NTU
10:45 12.7 3.14 0.610 7.14 78.0 -- 100 10.00 very turbid
10:46 13.6 3.24 0.624 6.98 77.6 -- 0 10.00 very turbid
Additional Notes:
Time
Shaded cells = Limits to be met within three consecutive readings spaced 5 minutes apart.
0
50
100
150
200
250
300
350
400
450
0
2
4
6
8
10
12
14
10:40 10:45 10:50
OR
P
pH
, T
em
p,
DO
,Sp
. C
on
d., D
ep
th
Temp DO SP. Cond pH Depth-to-Water ORP
\\Vtnfdata\projects\57688.00 VELCO McGuinness Spring\ssheets\Low Flow Sampling Data.xlsx| MW-4 7/28/2014
24

Low-Flow Sampling Data
Site ID: VELCO / McGuinness - Monkton VT Personnel: JWG
Date: 6/26/2014 Personnel: RWL
Start Time: 9:50 Pump ID: Peristaltic
Weather: light rain, 70's F YSI ID: 3338
Monitor Well ID: MW-6 Screen Interval: 8 inches
Depth to Water: 2.85 ft BTOP Pump Intake Depth: 4 ft
PVC Stick-Up: 1.58 ft. Well Guard Stick-Up (Ft): na Purge Volume: 2.5 gal
Total Well Depth: 4.5 ft BTOP Well Diameter: 2 inches
Sample Time: 15:30 Well Condition: good
Temp DO Sp. Cond pH ORP Turb Pump Rate Depth to Water Visual
(deg C) (mg/L) (mS/cm) (su) (mV) (NTU) (mL/min) (ft BTOP) Observations+/- 3% +/- 10% +/- 3% +/- 0.1 su +/- 10mV +/- 10 NTU
9:56 14.5 1.14 1.180 7.11 38.7 -- 100 2.88 turbid
9:58 15.1 0.71 0.396 6.70 66.0 -- 100 2.92 turbid
10:00 15.1 0.66 0.432 6.64 71.7 -- 100 2.98 turbid
10:02 15.2 0.62 0.381 6.61 75.5 -- 100 3.04 clearing
10:04 15.2 0.78 0.352 6.58 82.1 -- 100 3.10 clearing
10:06 15.2 0.88 0.351 6.57 82.5 -- 100 3.15 clearing
10:08 15.3 1.19 0.328 6.57 83.7 -- 100 3.20 clearing
10:10 15.3 1.63 0.326 6.57 85.0 -- 100 3.30 clearing
10:12 15.3 2.35 0.322 6.57 86.7 -- 100 3.32 clearing
10:14 15.3 3.33 0.322 6.59 86.3 -- 100 3.42 clearing
10:16 15.2 4.06 0.356 6.63 75.4 -- 100 3.68 clearing
10:18 15.2 4.10 0.588 6.75 24.3 -- 100 3.85 clearing
10:20 14.0 3.55 0.615 6.69 25.0 -- 100 clearing
Additional Notes:
Time
Shaded cells = Limits to be met within three consecutive readings spaced 5 minutes apart.
0
50
100
150
200
250
300
350
400
450
0
2
4
6
8
10
12
14
16
9:50 9:55 10:00 10:05 10:10 10:15 10:20 10:25
OR
P
pH
, T
em
p, D
O,S
p. C
on
d., D
ep
th
Temp DO SP. Cond pH Depth-to-Water ORP
\\Vtnfdata\projects\57688.00 VELCO McGuinness Spring\ssheets\Low Flow Sampling Data.xlsx| MW-6 7/28/2014
25

Low-Flow Sampling Data
Site ID: VELCO / McGuinness - Monkton VT Personnel: JWG
Date: 6/26/2014 Personnel: RWL
Start Time: 9:56 Pump ID: Peristaltic
Weather: sunny, 70's F YSI ID: 3338
Monitor Well ID: MW-7 Screen Interval: --
Depth to Water: 4.74 ft BTOP Pump Intake Depth: ~9 ft
PVC Stick-Up: 3.55 ft. Well Guard Stick-Up (Ft): 3.61 Purge Volume: ~ 0.6 L
Total Well Depth: 9.12 ft BTOP Well Diameter: 2 inches
Sample Time: 12:58 Well Condition: good
Temp DO Sp. Cond pH ORP Turb Pump Rate Depth to Water Visual
(deg C) (mg/L) (mS/cm) (su) (mV) (NTU) (mL/min) (ft BTOP) Observations+/- 3% +/- 10% +/- 3% +/- 0.1 su +/- 10mV +/- 10 NTU
12:44 15.2 0.50 0.529 7.68 100.4 -- 100 5.91 very turbid
12:46 14.6 0.46 0.525 7.46 104.4 -- 100 5.22 clearing
12:48 14.6 0.78 0.521 7.34 107.0 -- 100 6.68 clearing
12:50 14.6 0.88 0.514 7.30 102.4 -- 100 6.97 clearing
12:52 14.4 0.99 0.506 7.32 85.6 -- 100 7.44 clearing
12:54 14.2 1.07 0.505 7.34 78.1 -- 100 7.57 clearing
Additional Notes:
Time
Shaded cells = Limits to be met within three consecutive readings spaced 5 minutes apart.
0
50
100
150
200
250
300
350
400
450
0
2
4
6
8
10
12
14
16
12:40 12:45 12:50 12:55
OR
P
pH
, T
em
p, D
O,S
p. C
on
d., D
ep
th
Temp DO SP. Cond pH Depth-to-Water ORP
\\Vtnfdata\projects\57688.00 VELCO McGuinness Spring\ssheets\Low Flow Sampling Data.xlsx| MW-7 7/28/2014
26

Low-Flow Sampling Data
Site ID: VELCO / McGuinness - Monkton VT Personnel: JWG
Date: 6/26/2014 Personnel: RWL
Start Time: 13:56 Pump ID: Peristaltic
Weather: sunny, 70's F YSI ID: 3338
Monitor Well ID: MW-9 Screen Interval: -- inches
Depth to Water: 4.78 ft BTOP Pump Intake Depth: 11 ft btp
PVC Stick-Up: 1.65 ft. Well Guard Stick-Up (Ft): 2.00 Purge Volume: 0.5 L
Total Well Depth: 11.82 ft BTOP Well Diameter: 1 inches
Sample Time: 14:05 Well Condition: good
Temp DO Sp. Cond pH ORP Turb Pump Rate Depth to Water Visual
(deg C) (mg/L) (mS/cm) (su) (mV) (NTU) (mL/min) (ft BTOP) Observations+/- 3% +/- 10% +/- 3% +/- 0.1 su +/- 10mV +/- 10 NTU
13:56 11.9 3.59 0.97 7.65 36.4 -- 100 5.58 Clear
13:58 12.8 2.87 0.98 7.45 30.5 -- 100 5.89 Clear
14:00 12.8 2.75 1.05 7.29 32.9 -- 100 6.99 Clear
14:02 13.1 2.45 1.11 7.10 31.6 -- 100 7.40 Clear
14:04 13.1 2.23 1.13 7.04 28.4 -- 100 8.45 Clear
14:06 9.15
Additional Notes: Stopped purging at 9.15' to take sample.
Time
Shaded cells = Limits to be met within three consecutive readings spaced 5 minutes apart.
0
50
100
150
200
250
300
350
400
450
0
2
4
6
8
10
12
14
16
18
13:55 14:00 14:05 14:10
OR
P
pH
, T
em
p, D
O,S
p. C
on
d., D
ep
th
Temp DO SP. Cond pH Depth-to-Water ORP
\\Vtnfdata\projects\57688.00 VELCO McGuinness Spring\ssheets\Low Flow Sampling Data.xlsx| MW-9 7/28/2014
27
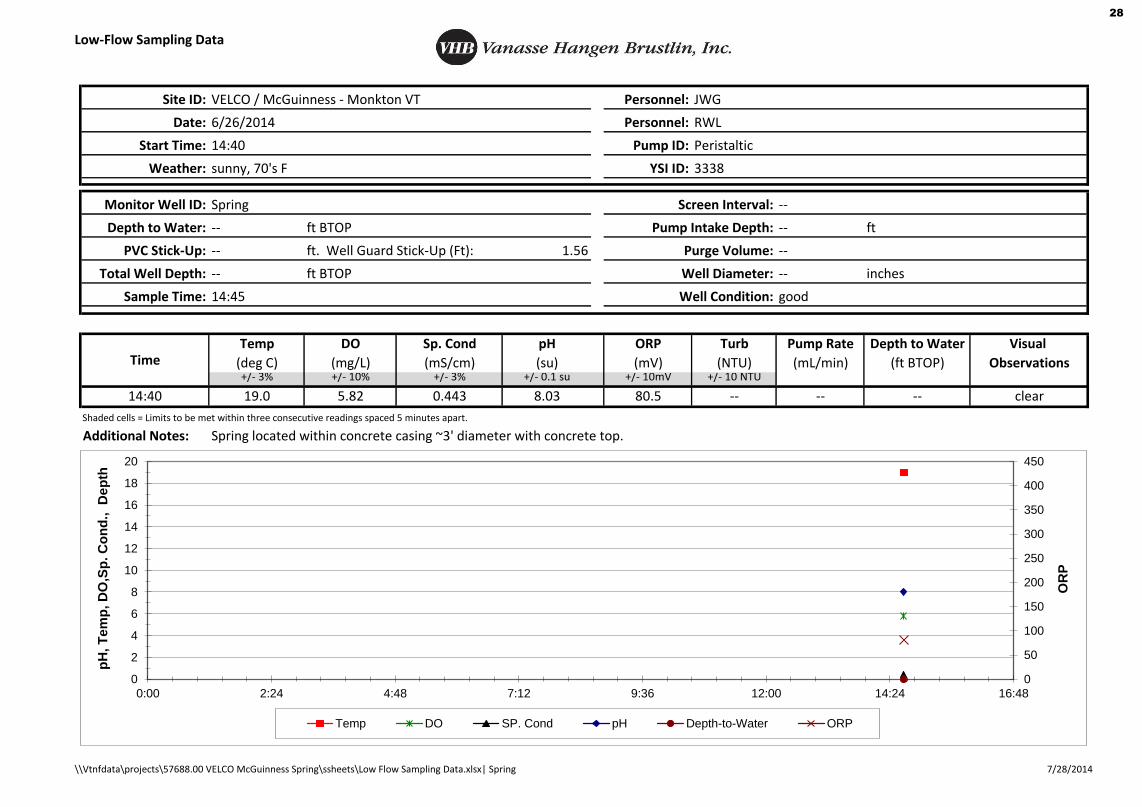
Low-Flow Sampling Data
Site ID: VELCO / McGuinness - Monkton VT Personnel: JWG
Date: 6/26/2014 Personnel: RWL
Start Time: 14:40 Pump ID: Peristaltic
Weather: sunny, 70's F YSI ID: 3338
Monitor Well ID: Spring Screen Interval: --
Depth to Water: -- ft BTOP Pump Intake Depth: -- ft
PVC Stick-Up: -- ft. Well Guard Stick-Up (Ft): 1.56 Purge Volume: --
Total Well Depth: -- ft BTOP Well Diameter: -- inches
Sample Time: 14:45 Well Condition: good
Temp DO Sp. Cond pH ORP Turb Pump Rate Depth to Water Visual
(deg C) (mg/L) (mS/cm) (su) (mV) (NTU) (mL/min) (ft BTOP) Observations+/- 3% +/- 10% +/- 3% +/- 0.1 su +/- 10mV +/- 10 NTU
14:40 19.0 5.82 0.443 8.03 80.5 -- -- -- clear
Additional Notes: Spring located within concrete casing ~3' diameter with concrete top.
Time
Shaded cells = Limits to be met within three consecutive readings spaced 5 minutes apart.
0
50
100
150
200
250
300
350
400
450
0
2
4
6
8
10
12
14
16
18
20
0:00 2:24 4:48 7:12 9:36 12:00 14:24 16:48
OR
P
pH
, T
em
p, D
O,S
p. C
on
d., D
ep
th
Temp DO SP. Cond pH Depth-to-Water ORP
\\Vtnfdata\projects\57688.00 VELCO McGuinness Spring\ssheets\Low Flow Sampling Data.xlsx| Spring 7/28/2014
28

Low-Flow Sampling Data
Site ID: VELCO / McGuinness - Monkton VT Personnel: JWG
Date: 6/26/2014 Personnel: RWL
Start Time: 15:00 Pump ID: --
Weather: sunny, 70's F YSI ID: 3338
Monitor Well ID: Swale 1 Screen Interval: --
Depth to Water: -- ft BTOP Pump Intake Depth: -- ft
PVC Stick-Up: -- ft. Well Guard Stick-Up (Ft): -- Purge Volume: --
Total Well Depth: -- ft BTOP Well Diameter: -- inches
Sample Time: 15:05 Well Condition: --
Temp DO Sp. Cond pH ORP Turb Pump Rate Depth to Water Visual
(deg C) (mg/L) (mS/cm) (su) (mV) (NTU) (mL/min) (ft BTOP) Observations+/- 3% +/- 10% +/- 3% +/- 0.1 su +/- 10mV +/- 10 NTU
15:06 12.9 6.13 0.515 7.75 98.2 -- -- -- clear
Additional Notes: Grab sample collected ~7' downstream from spring.
Time
Shaded cells = Limits to be met within three consecutive readings spaced 5 minutes apart.
0
50
100
150
200
250
300
350
400
450
0
2
4
6
8
10
12
14
0:00 2:24 4:48 7:12 9:36 12:00 14:24 16:48
OR
P
pH
, T
em
p, D
O,S
p. C
on
d., D
ep
th
Temp DO SP. Cond pH Depth-to-Water ORP
\\Vtnfdata\projects\57688.00 VELCO McGuinness Spring\ssheets\Low Flow Sampling Data.xlsx| Swale 1 7/28/2014
29
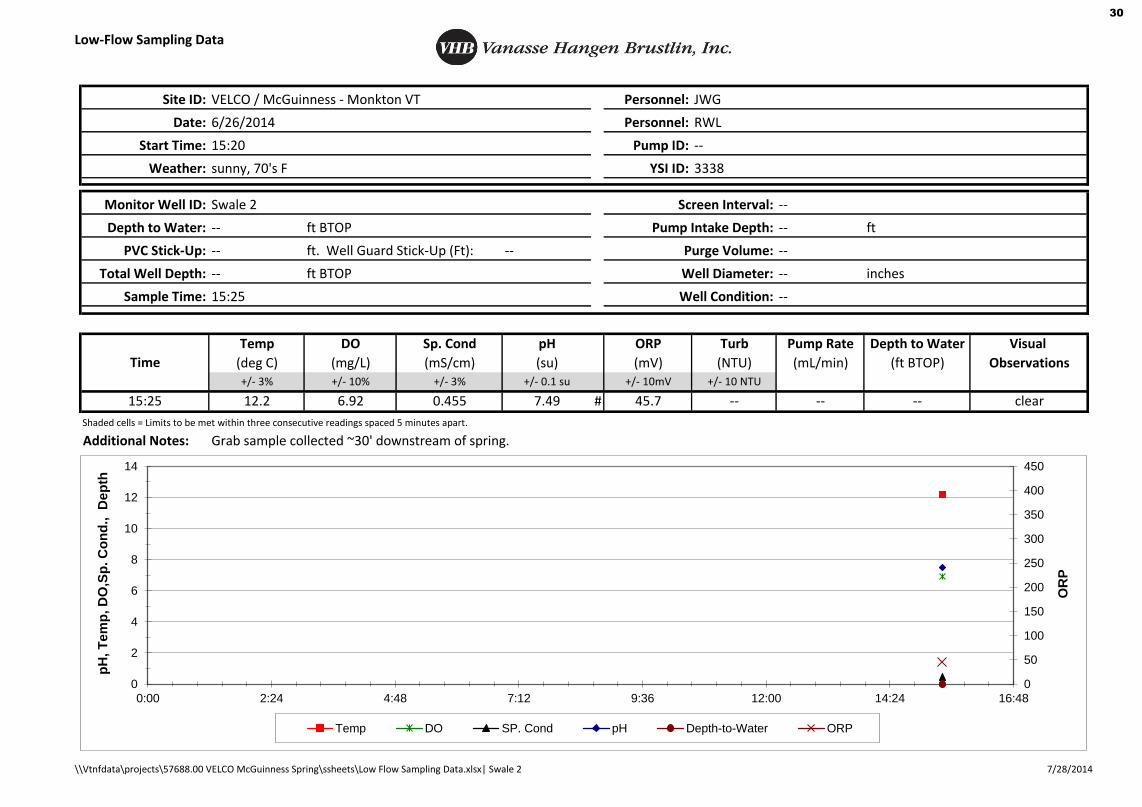
Low-Flow Sampling Data
Site ID: VELCO / McGuinness - Monkton VT Personnel: JWG
Date: 6/26/2014 Personnel: RWL
Start Time: 15:20 Pump ID: --
Weather: sunny, 70's F YSI ID: 3338
Monitor Well ID: Swale 2 Screen Interval: --
Depth to Water: -- ft BTOP Pump Intake Depth: -- ft
PVC Stick-Up: -- ft. Well Guard Stick-Up (Ft): -- Purge Volume: --
Total Well Depth: -- ft BTOP Well Diameter: -- inches
Sample Time: 15:25 Well Condition: --
Temp DO Sp. Cond pH ORP Turb Pump Rate Depth to Water Visual
(deg C) (mg/L) (mS/cm) (su) (mV) (NTU) (mL/min) (ft BTOP) Observations+/- 3% +/- 10% +/- 3% +/- 0.1 su +/- 10mV +/- 10 NTU
15:25 12.2 6.92 0.455 7.49 # 45.7 -- -- -- clear
Additional Notes: Grab sample collected ~30' downstream of spring.
Time
Shaded cells = Limits to be met within three consecutive readings spaced 5 minutes apart.
0
50
100
150
200
250
300
350
400
450
0
2
4
6
8
10
12
14
0:00 2:24 4:48 7:12 9:36 12:00 14:24 16:48
OR
P
pH
, T
em
p, D
O,S
p. C
on
d., D
ep
th
Temp DO SP. Cond pH Depth-to-Water ORP
\\Vtnfdata\projects\57688.00 VELCO McGuinness Spring\ssheets\Low Flow Sampling Data.xlsx| Swale 2 7/28/2014
30

Laboratory Report
McGuinnessPROJECT:
DATE RECEIVED:
WORK ORDER:
DATE REPORTED:
090395Vanasse Hangen Brustlin, Inc.
PO Box 120
N. Ferrisburgh, VT 05473
Atten: Meddie Perry SAMPLER:
July 10, 2014
1406-12383
Rachael
June 27, 2014
Page 1 of 7
Reviewed by:
Harry B. Locker, Ph.D.
Laboratory Director
Enclosed please find the results of the analyses performed for the samples referenced on the attached chain of custody. All required method quality control elements including instrument calibration were performed in accordance with method requirements and determined to be acceptable unless otherwise noted.
The column labeled Lab/Tech in the accompanying report denotes the laboratory facility where the testing was performed and the technician who conducted the assay. A "W" designates the Williston, VT lab under NELAC certification ELAP 11263; "R" designates the Lebanon, NH facility under certification NH 2037 and “N” the Plattsburgh, NY lab under certification ELAP 11892. “Sub” indicates the testing was performed by a subcontracted laboratory. The accreditation status of the subcontracted lab is referenced in the corresponding NELAC and Qual fields.
The NELAC column also denotes the accreditation status of each laboratory for each reported parameter. “A” indicates the referenced laboratory is NELAC accredited for the parameter reported. “N” indicates the laboratory is not accredited. “U” indicates that NELAC does not offer accreditation for that parameter in that specific matrix. Test results denoted with an “A” meet all National Environmental Laboratory Accreditation Program requirements except where denoted by pertinent data qualifiers. Test results are representative of the samples as they were received at the laboratory
Endyne, Inc. warrants, to the best of its knowledge and belief, the accuracy of the analytical
test results contained in this report, but makes no other warranty, expressed or implied, especially no warranties of merchantability or fitness for a particular purpose.
NH2037 ELAP11263
160 James Brown Dr., Williston, VT 05495
Ph 802-879-4333 Fax 802-879-7103
www.endynelabs.com
56 Etna Road, Lebanon, NH 03755
Ph 603-678-4891 Fax 603-678-4893
31

Laboratory Report
Vanasse Hangen Brustlin, Inc.CLIENT:PROJECT: McGuinness
WORK ORDER:DATE RECEIVED:
1406-1238306/27/2014
7/10/2014REPORT DATE:
001 Date Sampled: 6/26/14Site: McGuinness Well Time: 12:30
Analysis DateParameter Result NELACLab/TechUnits Qual.Method
0.00251 mg/L 7/2/14 SUBSW AEPA 200.8Uranium SBK
< 2.5 mg/L 6/27/14 KMBW AEPA 300.0Chloride
0.23 mg/L 6/27/14 KMBW AEPA 300.0Nitrate as N 17:03
< 0.020 mg/L 6/27/14 KMBW AEPA 300.0Nitrite as N 17:03
1 TON 6/27/14 JSSW ASM20 2150B (97)Odor 12:09
7.90 SU at 16.9C 6/30/14 SJMW USM 4500-H B. (97)pH 13:04
0.045 mg/L 7/1/14 RGTW AEPA 200.7Barium, Total
0.084 mg/L 7/1/14 RGTW AEPA 200.7Iron, Total
< 0.020 mg/L 7/1/14 RGTW AEPA 200.7Manganese, Total
5.8 mg/L 7/1/14 RGTW AEPA 200.7Sodium, Total
002 Date Sampled: 6/26/14Site: Spring Time: 14:45
Analysis DateParameter Result NELACLab/TechUnits Qual.Method
See Attached 7/3/14 SUBSW NDioxins, Sub-contracted SPA
Page 2 of 7
32

Laboratory Report
Vanasse Hangen Brustlin, Inc.CLIENT:PROJECT: McGuinness
WORK ORDER:DATE RECEIVED:
1406-1238306/27/2014
7/10/2014REPORT DATE:
TEST METHOD:
001 Sampled: 6/26/14Site: McGuinness Well 6/27/14 SJMWTest Date:12:30Parameter Result
Result
Unit Nelac
Result
Qual Parameter Result
Result
Unit Nelac
Result
Qual
EPA 524.2
< 0.5 Aug/LDichlorodifluoromethane < 0.5 Aug/LChloromethane
< 0.5 Aug/LVinyl chloride < 0.5 Aug/LBromomethane
< 0.5 Aug/LChloroethane < 0.5 Aug/LTrichlorofluoromethane
< 0.5 Aug/L1,1-Dichloroethene < 0.5 Aug/LMethylene chloride
< 0.5 Aug/LMethyl-t-butyl ether (MTBE) < 0.5 Aug/Ltrans-1,2-Dichloroethene
< 0.5 Aug/L1,1-Dichloroethane < 0.5 Aug/L2,2-Dichloropropane
< 0.5 Aug/Lcis-1,2-Dichloroethene < 0.5 Aug/LBromochloromethane
< 0.5 Aug/LChloroform < 0.5 Aug/L1,1,1-Trichloroethane
< 0.5 Aug/LCarbon tetrachloride < 0.5 Aug/L1,1-Dichloropropene
< 0.5 Aug/LBenzene < 0.5 Aug/L1,2-Dichloroethane
< 0.5 Aug/LTrichloroethene < 0.5 Aug/L1,2-Dichloropropane
< 0.5 Aug/LDibromomethane < 0.5 Aug/LBromodichloromethane
< 0.5 Aug/Lcis-1,3-Dichloropropene < 0.5 Aug/LToluene
< 0.5 Aug/Ltrans-1,3-Dichloropropene < 0.5 Aug/L1,1,2-Trichloroethane
< 0.5 Aug/LTetrachloroethene < 0.5 Aug/L1,3-Dichloropropane
< 0.5 Aug/LDibromochloromethane < 0.5 Aug/LChlorobenzene
< 0.5 Aug/LEthylbenzene < 0.5 Aug/L1,1,1,2-Tetrachloroethane
< 1.0 Aug/LXylenes, Total < 0.5 Aug/LStyrene
< 0.5 Aug/LBromoform < 0.5 Aug/LIsopropylbenzene
< 0.5 Aug/L1,1,2,2-Tetrachloroethane < 0.5 Aug/LBromobenzene
< 0.5 Aug/Ln-Propylbenzene < 0.5 Aug/L1,2,3-Trichloropropane
< 0.5 Aug/L2-Chlorotoluene < 0.5 Aug/L1,3,5-Trimethylbenzene
< 0.5 Aug/L4-Chlorotoluene < 0.5 Aug/Lt-Butylbenzene
< 0.5 Aug/L1,2,4-Trimethylbenzene < 0.5 Aug/Ls-Butylbenzene
< 0.5 Aug/L4-Isopropyltoluene < 0.5 Aug/L1,3-Dichlorobenzene
< 0.5 Aug/L1,4-Dichlorobenzene < 0.5 Aug/Ln-Butylbenzene
< 0.5 Aug/L1,2-Dichlorobenzene < 0.5 Aug/L1,2,4-Trichlorobenzene
< 0.5 Aug/LHexachlorobutadiene < 0.5 Aug/LNaphthalene
< 0.5 Aug/L1,2,3-Trichlorobenzene 95 A%Surr. 1 (4-Bromofluorobenzene)
96 A%Surr. 2 (1,2-Dichlorobenzene d4)
Page 3 of 7
33

Laboratory Report
Vanasse Hangen Brustlin, Inc.CLIENT:PROJECT: McGuinness
WORK ORDER:DATE RECEIVED:
1406-1238306/27/2014
7/10/2014REPORT DATE:
TEST METHOD:
002 Sampled: 6/26/14Site: Spring 6/30/14 FAAWTest Date:14:45Parameter Result
Result
Unit Nelac
Result
Qual Parameter Result
Result
Unit Nelac
Result
Qual
EPA 8270D
Completed ALiquid/Liquid Sep Funnel < 1.0 Aug/LNaphthalene
< 1.0 Aug/L2-Methylnaphthalene < 1.0 Uug/L1-Methylnaphthalene
< 1.0 Aug/LAcenaphthylene < 1.0 Aug/LAcenaphthene
< 1.0 Aug/LFluorene < 1.0 Nug/LPhenanthrene
< 1.0 Aug/LAnthracene < 1.0 Aug/LFluoranthene
< 1.0 Aug/LPyrene < 1.0 Aug/LBenzo(a)anthracene
< 1.0 Aug/LChrysene < 1.0 Aug/LBenzo(b)fluoranthene
< 1.0 Aug/LBenzo(k)fluoranthene < 1.0 Aug/LBenzo(a)pyrene
< 1.0 Aug/LIndeno(1,2,3-cd)pyrene < 1.0 Aug/LDibenzo(a,h)anthracene
< 1.0 Aug/LBenzo(g,h,i)perylene < 2.3 Uug/LBaP Toxic Equiv. Quotient
76 N%B/N Surr.1 Nitrobenzene-d5 71 N%B/N Surr.2 2-Fluorobiphenyl
86 N%B/N Surr.3 Terphenyl-d14 0 UUnidentified Peaks
TEST METHOD:
002 Sampled: 6/26/14Site: Spring 6/30/14 MDPWTest Date:14:45Parameter Result
Result
Unit Nelac
Result
Qual Parameter Result
Result
Unit Nelac
Result
Qual
EPA 515.4
Completed A515 Extraction < 15.0 Aug/LDalapon
< 10.0 Aug/LDicamba < 5.0 Aug/L2,4-D
< 0.5 Aug/LPentachlorophenol < 2.0 Aug/L2,4,5-TP (Silvex)
< 3.0 Uug/L2,4,5-T < 5.0 Aug/LPicloram
< 3.0 Aug/LDinoseb 86 A%Surrogate-DCAA
TEST METHOD:
003 Sampled: 6/26/14Site: Swale - 1 6/30/14 MDPWTest Date:15:05Parameter Result
Result
Unit Nelac
Result
Qual Parameter Result
Result
Unit Nelac
Result
Qual
EPA 515.4
Completed A515 Extraction < 15.0 Aug/LDalapon
< 10.0 Aug/LDicamba < 5.0 Aug/L2,4-D
0.62 Aug/LPentachlorophenol < 2.0 Aug/L2,4,5-TP (Silvex)
< 3.0 M-Uug/L2,4,5-T < 5.0 Aug/LPicloram
< 3.0 Aug/LDinoseb 92 A%Surrogate-DCAA
TEST METHOD:
004 Sampled: 6/26/14Site: Swale - 2 6/30/14 MDPWTest Date:15:25Parameter Result
Result
Unit Nelac
Result
Qual Parameter Result
Result
Unit Nelac
Result
Qual
EPA 515.4
Completed A515 Extraction < 15.0 Aug/LDalapon
< 10.0 Aug/LDicamba < 5.0 Aug/L2,4-D
< 0.5 Aug/LPentachlorophenol < 2.0 Aug/L2,4,5-TP (Silvex)
< 3.0 Uug/L2,4,5-T < 5.0 Aug/LPicloram
< 3.0 Aug/LDinoseb 93 A%Surrogate-DCAA
TEST METHOD:
005 Sampled: 6/26/14Site: MW-1 6/30/14 MDPWTest Date:13:32Parameter Result
Result
Unit Nelac
Result
Qual Parameter Result
Result
Unit Nelac
Result
Qual
EPA 515.4
Completed A515 Extraction < 15.0 Aug/LDalapon
< 10.0 Aug/LDicamba < 5.0 Aug/L2,4-D
< 0.5 Aug/LPentachlorophenol < 2.0 Aug/L2,4,5-TP (Silvex)
< 3.0 Uug/L2,4,5-T < 5.0 Aug/LPicloram
< 3.0 Aug/LDinoseb 108 A%Surrogate-DCAA
Page 4 of 7
34

Laboratory Report
Vanasse Hangen Brustlin, Inc.CLIENT:PROJECT: McGuinness
WORK ORDER:DATE RECEIVED:
1406-1238306/27/2014
7/10/2014REPORT DATE:
TEST METHOD:
006 Sampled: 6/26/14Site: MW-2 6/30/14 MDPWTest Date:11:30Parameter Result
Result
Unit Nelac
Result
Qual Parameter Result
Result
Unit Nelac
Result
Qual
EPA 515.4
Completed A515 Extraction < 15.0 Aug/LDalapon
< 10.0 Aug/LDicamba < 5.0 Aug/L2,4-D
< 0.5 Aug/LPentachlorophenol < 2.0 Aug/L2,4,5-TP (Silvex)
< 3.0 Uug/L2,4,5-T < 5.0 Aug/LPicloram
< 3.0 Aug/LDinoseb 88 A%Surrogate-DCAA
TEST METHOD:
007 Sampled: 6/26/14Site: MW-3 6/30/14 MDPWTest Date:15:55Parameter Result
Result
Unit Nelac
Result
Qual Parameter Result
Result
Unit Nelac
Result
Qual
EPA 515.4
Completed A515 Extraction < 15.0 Aug/LDalapon
< 10.0 Aug/LDicamba < 5.0 Aug/L2,4-D
< 0.5 Aug/LPentachlorophenol < 2.0 Aug/L2,4,5-TP (Silvex)
< 3.0 Uug/L2,4,5-T < 5.0 Aug/LPicloram
< 3.0 Aug/LDinoseb 100 A%Surrogate-DCAA
TEST METHOD:
008 Sampled: 6/26/14Site: MW-4 6/30/14 MDPWTest Date:10:45Parameter Result
Result
Unit Nelac
Result
Qual Parameter Result
Result
Unit Nelac
Result
Qual
EPA 515.4
Completed A515 Extraction < 15.0 Aug/LDalapon
< 10.0 Aug/LDicamba < 5.0 Aug/L2,4-D
< 0.5 Aug/LPentachlorophenol < 2.0 Aug/L2,4,5-TP (Silvex)
< 3.0 Uug/L2,4,5-T < 5.0 Aug/LPicloram
< 3.0 Aug/LDinoseb 96 A%Surrogate-DCAA
TEST METHOD:
009 Sampled: 6/26/14Site: MW-6 6/30/14 FAAWTest Date:15:30Parameter Result
Result
Unit Nelac
Result
Qual Parameter Result
Result
Unit Nelac
Result
Qual
EPA 8270D
Completed ALiquid/Liquid Sep Funnel < 1.0 Aug/LNaphthalene
< 1.0 Aug/L2-Methylnaphthalene < 1.0 Uug/L1-Methylnaphthalene
< 1.0 Aug/LAcenaphthylene < 1.0 Aug/LAcenaphthene
< 1.0 Aug/LFluorene < 1.0 Nug/LPhenanthrene
< 1.0 Aug/LAnthracene < 1.0 Aug/LFluoranthene
< 1.0 Aug/LPyrene < 1.0 Aug/LBenzo(a)anthracene
< 1.0 Aug/LChrysene < 1.0 Aug/LBenzo(b)fluoranthene
< 1.0 Aug/LBenzo(k)fluoranthene < 1.0 Aug/LBenzo(a)pyrene
< 1.0 Aug/LIndeno(1,2,3-cd)pyrene < 1.0 Aug/LDibenzo(a,h)anthracene
< 1.0 Aug/LBenzo(g,h,i)perylene < 2.3 Uug/LBaP Toxic Equiv. Quotient
61 N%B/N Surr.1 Nitrobenzene-d5 59 N%B/N Surr.2 2-Fluorobiphenyl
72 N%B/N Surr.3 Terphenyl-d14 0 UUnidentified Peaks
TEST METHOD:
009 Sampled: 6/26/14Site: MW-6 6/30/14 MDPWTest Date:15:30Parameter Result
Result
Unit Nelac
Result
Qual Parameter Result
Result
Unit Nelac
Result
Qual
EPA 515.4
Completed A515 Extraction < 15.0 Aug/LDalapon
< 10.0 Aug/LDicamba < 5.0 Aug/L2,4-D
< 0.5 Aug/LPentachlorophenol < 2.0 Aug/L2,4,5-TP (Silvex)
< 3.0 Uug/L2,4,5-T < 5.0 Aug/LPicloram
< 3.0 Aug/LDinoseb 175 A%Surrogate-DCAA
Page 5 of 7
35
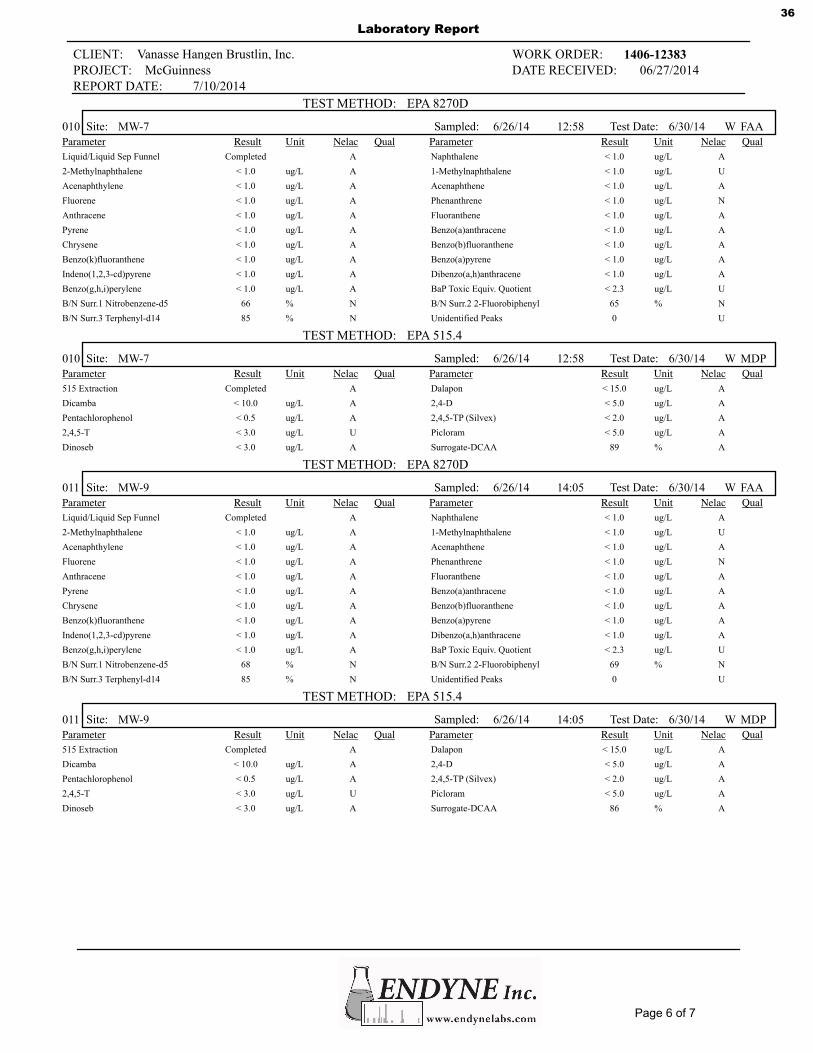
Laboratory Report
Vanasse Hangen Brustlin, Inc.CLIENT:PROJECT: McGuinness
WORK ORDER:DATE RECEIVED:
1406-1238306/27/2014
7/10/2014REPORT DATE:
TEST METHOD:
010 Sampled: 6/26/14Site: MW-7 6/30/14 FAAWTest Date:12:58Parameter Result
Result
Unit Nelac
Result
Qual Parameter Result
Result
Unit Nelac
Result
Qual
EPA 8270D
Completed ALiquid/Liquid Sep Funnel < 1.0 Aug/LNaphthalene
< 1.0 Aug/L2-Methylnaphthalene < 1.0 Uug/L1-Methylnaphthalene
< 1.0 Aug/LAcenaphthylene < 1.0 Aug/LAcenaphthene
< 1.0 Aug/LFluorene < 1.0 Nug/LPhenanthrene
< 1.0 Aug/LAnthracene < 1.0 Aug/LFluoranthene
< 1.0 Aug/LPyrene < 1.0 Aug/LBenzo(a)anthracene
< 1.0 Aug/LChrysene < 1.0 Aug/LBenzo(b)fluoranthene
< 1.0 Aug/LBenzo(k)fluoranthene < 1.0 Aug/LBenzo(a)pyrene
< 1.0 Aug/LIndeno(1,2,3-cd)pyrene < 1.0 Aug/LDibenzo(a,h)anthracene
< 1.0 Aug/LBenzo(g,h,i)perylene < 2.3 Uug/LBaP Toxic Equiv. Quotient
66 N%B/N Surr.1 Nitrobenzene-d5 65 N%B/N Surr.2 2-Fluorobiphenyl
85 N%B/N Surr.3 Terphenyl-d14 0 UUnidentified Peaks
TEST METHOD:
010 Sampled: 6/26/14Site: MW-7 6/30/14 MDPWTest Date:12:58Parameter Result
Result
Unit Nelac
Result
Qual Parameter Result
Result
Unit Nelac
Result
Qual
EPA 515.4
Completed A515 Extraction < 15.0 Aug/LDalapon
< 10.0 Aug/LDicamba < 5.0 Aug/L2,4-D
< 0.5 Aug/LPentachlorophenol < 2.0 Aug/L2,4,5-TP (Silvex)
< 3.0 Uug/L2,4,5-T < 5.0 Aug/LPicloram
< 3.0 Aug/LDinoseb 89 A%Surrogate-DCAA
TEST METHOD:
011 Sampled: 6/26/14Site: MW-9 6/30/14 FAAWTest Date:14:05Parameter Result
Result
Unit Nelac
Result
Qual Parameter Result
Result
Unit Nelac
Result
Qual
EPA 8270D
Completed ALiquid/Liquid Sep Funnel < 1.0 Aug/LNaphthalene
< 1.0 Aug/L2-Methylnaphthalene < 1.0 Uug/L1-Methylnaphthalene
< 1.0 Aug/LAcenaphthylene < 1.0 Aug/LAcenaphthene
< 1.0 Aug/LFluorene < 1.0 Nug/LPhenanthrene
< 1.0 Aug/LAnthracene < 1.0 Aug/LFluoranthene
< 1.0 Aug/LPyrene < 1.0 Aug/LBenzo(a)anthracene
< 1.0 Aug/LChrysene < 1.0 Aug/LBenzo(b)fluoranthene
< 1.0 Aug/LBenzo(k)fluoranthene < 1.0 Aug/LBenzo(a)pyrene
< 1.0 Aug/LIndeno(1,2,3-cd)pyrene < 1.0 Aug/LDibenzo(a,h)anthracene
< 1.0 Aug/LBenzo(g,h,i)perylene < 2.3 Uug/LBaP Toxic Equiv. Quotient
68 N%B/N Surr.1 Nitrobenzene-d5 69 N%B/N Surr.2 2-Fluorobiphenyl
85 N%B/N Surr.3 Terphenyl-d14 0 UUnidentified Peaks
TEST METHOD:
011 Sampled: 6/26/14Site: MW-9 6/30/14 MDPWTest Date:14:05Parameter Result
Result
Unit Nelac
Result
Qual Parameter Result
Result
Unit Nelac
Result
Qual
EPA 515.4
Completed A515 Extraction < 15.0 Aug/LDalapon
< 10.0 Aug/LDicamba < 5.0 Aug/L2,4-D
< 0.5 Aug/LPentachlorophenol < 2.0 Aug/L2,4,5-TP (Silvex)
< 3.0 Uug/L2,4,5-T < 5.0 Aug/LPicloram
< 3.0 Aug/LDinoseb 86 A%Surrogate-DCAA
Page 6 of 7
36

Laboratory Report
Vanasse Hangen Brustlin, Inc.CLIENT:PROJECT: McGuinness
WORK ORDER:DATE RECEIVED:
1406-1238306/27/2014
7/10/2014REPORT DATE:
Report Summary of Qualifiers and Notes
Samples received in this project required pH. The EPA hold time for this analysis is 15 minutes and should be
performed at the time of collection. Analysis was performed as soon as possible upon arrival at the laboratory.
This report is also submitted to the Vermont Department of Health, as mandated by VT regulations (ACT 163) effective
January 1, 2013.
M-: The laboratory fortified matrix (LFM) analysis indicates a potential negative bias in the reported value.
SBK: Analysis performed by subcontracted laboratory, Katahdin Analytical Services, Inc. The complete subcontracted
report has been appended to this report.
SPA: Analysis performed by subcontracted laboratory, Pace Analytical, Minneapolis, MN. The complete
subcontracted report has been appended to this report.
Page 7 of 7
37
July 3, 2014
Project ID: 1406-12383-001
Project Manager: Ms. Shelly Brown
Dear Ms. Toomey:
RE: Katahdin Lab Number: SH4797
Please find enclosed the following information:
Sample Receipt Date(s): June 30, 2014
Ms. Eileen Toomey
Endyne, Inc.
160 James Brown Drive
Williston,VT 05495
* Report of Analysis (Analytical and/or Field)
* Quality Control Data Summary
* Chain of Custody (COC)
* Login Report
A copy of the Chain of Custody is included in the paginated report. The original COC is attached as an
addendum to this report.
Should you have any questions or comments concerning this Report of Analysis, please do not hesitate to
contact the project manager listed above. The results contained in this report relate only to the submitted
samples. This cover letter is an integral part of the ROA.
We certify that the test results provided in this report meet all the requirements of the NELAC standards unless
otherwise noted in an attached technical narrative or in the Report of Analysis.
We appreciate your continued use of our laboratory and look forward to working with you in the future. The
following signature indicates technical review and acceptance of the data.
Please go to http://www.katahdinlab.com/cert.html for copies of Katahdin Analytical Services Inc. current
certificates and analyte lists.
Sincerely,
KATAHDIN ANALYTICAL SERVICES
__________________________________________ _________________
Authorized Signature Date
07/03/2014
Katahdin Analytical Services 0000001
38
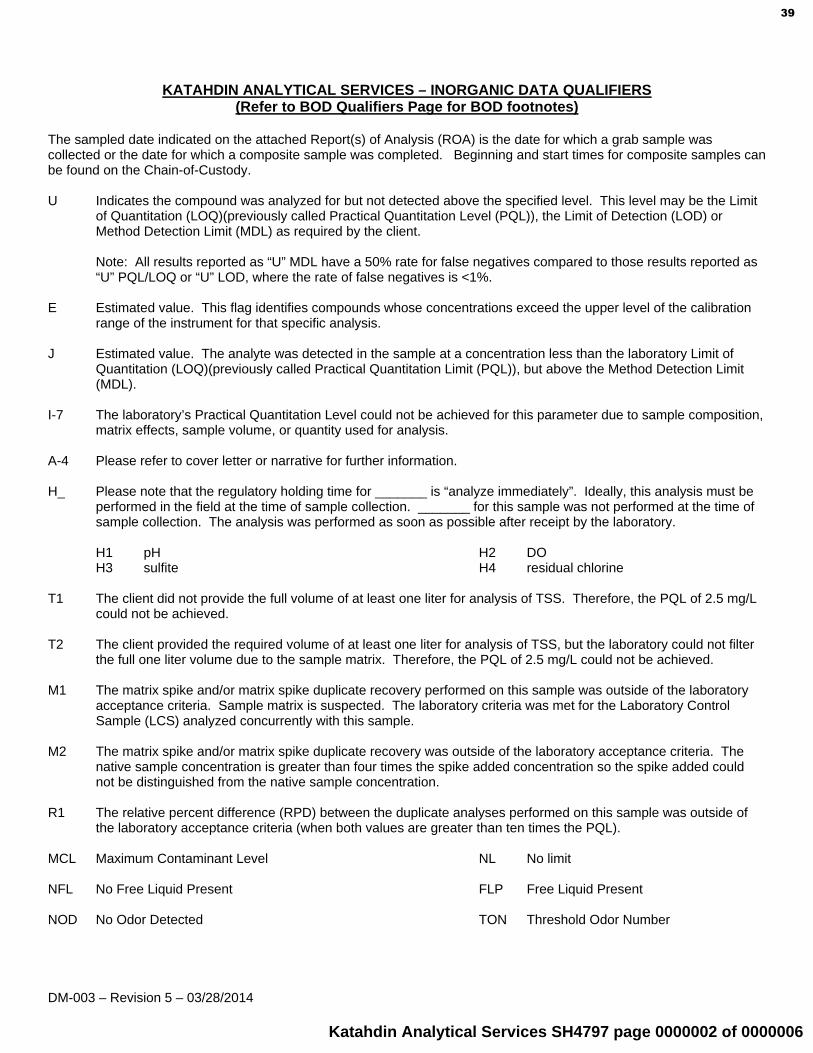
DM-003 – Revision 5 – 03/28/2014
KATAHDIN ANALYTICAL SERVICES – INORGANIC DATA QUALIFIERS (Refer to BOD Qualifiers Page for BOD footnotes)
The sampled date indicated on the attached Report(s) of Analysis (ROA) is the date for which a grab sample was collected or the date for which a composite sample was completed. Beginning and start times for composite samples can be found on the Chain-of-Custody. U Indicates the compound was analyzed for but not detected above the specified level. This level may be the Limit
of Quantitation (LOQ)(previously called Practical Quantitation Level (PQL)), the Limit of Detection (LOD) or Method Detection Limit (MDL) as required by the client.
Note: All results reported as “U” MDL have a 50% rate for false negatives compared to those results reported as “U” PQL/LOQ or “U” LOD, where the rate of false negatives is <1%.
E Estimated value. This flag identifies compounds whose concentrations exceed the upper level of the calibration
range of the instrument for that specific analysis. J Estimated value. The analyte was detected in the sample at a concentration less than the laboratory Limit of
Quantitation (LOQ)(previously called Practical Quantitation Limit (PQL)), but above the Method Detection Limit (MDL).
I-7 The laboratory’s Practical Quantitation Level could not be achieved for this parameter due to sample composition,
matrix effects, sample volume, or quantity used for analysis. A-4 Please refer to cover letter or narrative for further information. H_ Please note that the regulatory holding time for _______ is “analyze immediately”. Ideally, this analysis must be
performed in the field at the time of sample collection. _______ for this sample was not performed at the time of sample collection. The analysis was performed as soon as possible after receipt by the laboratory.
H1 pH H2 DO H3 sulfite H4 residual chlorine T1 The client did not provide the full volume of at least one liter for analysis of TSS. Therefore, the PQL of 2.5 mg/L
could not be achieved. T2 The client provided the required volume of at least one liter for analysis of TSS, but the laboratory could not filter
the full one liter volume due to the sample matrix. Therefore, the PQL of 2.5 mg/L could not be achieved. M1 The matrix spike and/or matrix spike duplicate recovery performed on this sample was outside of the laboratory
acceptance criteria. Sample matrix is suspected. The laboratory criteria was met for the Laboratory Control Sample (LCS) analyzed concurrently with this sample.
M2 The matrix spike and/or matrix spike duplicate recovery was outside of the laboratory acceptance criteria. The
native sample concentration is greater than four times the spike added concentration so the spike added could not be distinguished from the native sample concentration.
R1 The relative percent difference (RPD) between the duplicate analyses performed on this sample was outside of
the laboratory acceptance criteria (when both values are greater than ten times the PQL). MCL Maximum Contaminant Level NL No limit NFL No Free Liquid Present FLP Free Liquid Present NOD No Odor Detected TON Threshold Odor Number
Katahdin Analytical Services SH4797 page 0000002 of 0000006
39

Katahdin Analytical Services SH4797 page 0000003 of 0000006
40

Katahdin Analytical Services SH4797 page 0000004 of 0000006
41

Katahdin Analytical Services SH4797 page 0000005 of 0000006
42

Katahdin Analytical Services SH4797 page 0000006 of 0000006
43

This report should not be reproduced, except in full,without the written consent of Pace Analytical Services, Inc.
The results relate only to the samples included in this report.
Report of Laboratory Analysis
www.pacelabs.com
Pace Analytical Services, Inc.1700 Elm Street
Minneapolis, MN 55414Phone: 612.607.1700
Fax: 612.607.6444
Eileen ToomeyEndyne, Inc.160 James Brown DriveWilliston VT 05495
REPORT OFLABORATORYANALYSIS FOR
PCDD/PCDF
This report has been reviewed by:
Invoicing & Reporting Options:
Report Information:
Report Prepared Date:July 8, 2014
Pace Project #: 10272510Sample Receipt Date: 06/28/2014Client Project #: 1406-12383-WClient Sub PO #: N/A
The report provided has been invoiced as a Level 2PCDD/PCDF Report. If an upgrade of this reportpackage is requested, an additional charge may beapplied.
Please review the attached invoice for accuracy andforward any questions to Scott Unze, your PaceProject Manager.
State Cert #: N/A
Report Prepared for:
Page 1 of 13Report No.....10272510_1613B
July 08, 2014Carolynne Trout, Project Manager(612) 607-6351(612) 607-6444 (fax)[email protected]
44

Pace Analytical Services, Inc.1700 Elm Street
Minneapolis, MN 55414Phone: 612.607.1700
Fax: 612.607.6444
REPORT OF LABORATORY ANALYSIS
This report shall not be reproduced, except in full,without the written consent of Pace Analytical Services, Inc.
This report presents the results from the analysis performed on one sample submitted by a representativeof Endyne, Inc. The sample was analyzed for the presence or absence of polychlorodibenzo-p-dioxins(PCDDs) and polychlorodibenzofurans (PCDFs) using USEPA Method 1613B. The reporting limits werebased on signal-to-noise measurements. Estimated Maximum Possible Concentration (EMPC) valueswere treated as positives in the toxic equivalence calculations. The sample was received above therecommended temperature range of 0-6 degrees Celsius.
The recoveries of the isotopically-labeled PCDD/PCDF internal standards in the sample extract rangedfrom 44-74%. All of the labeled standard recoveries obtained for this project were within the target rangesspecified in Method 1613B. Also, since the quantification of the native 2,3,7,8-substituted congeners wasbased on isotope dilution, the data were automatically corrected for variation in recovery and accuratevalues were obtained. Concentrations below the calibration range were flagged "J" and should beregarded as estimates.
A laboratory method blank was prepared and analyzed with the sample batch as part of our routine qualitycontrol procedures. The results show that PCDDs and PCDFs were not detected.
Laboratory spike samples were also prepared using clean water that had been fortified with nativestandard materials. The recoveries of the native compounds ranged from 87-116% with relative percentdifferences of 0.0-10.4%. These results indicate high degrees of accuracy and precision for thesedeterminations. Matrix spikes were not prepared with the sample batch.
The labeled cleanup standard in the sample batch was inadvertently omitted from the extracts prior to thecleanup steps and subsequently added at the end of the preparation steps. This deviation from thestandard procedures did not impact the accuracy of the native congener determinations.
DISCUSSION
Page 2 of 13Report No.....10272510_1613B
45

REPORT OF LABORATORY ANALYSIS
This report shall not be reproduced, except in full,without the written consent of Pace Analytical Services, Inc.
Pace Analytical Services, Inc.1700 Elm Street - Suite 200
Minneapolis, MN 55414
Tel: 612-607-1700Fax: 612- 607-6444
Report No.....10272510
Minnesota Laboratory Certifications
Authority Certificate # Authority Certificate #
A2LA 2926.01 Minnesota 027-053-137
Alabama 40770 Mississippi MN00064
Alaska MN00064 Montana 92
Arizona AZ0014 Nebraska
Arkansas 88-0680 Nevada MN_00064_200
California 01155CA New Jersey (NE MN002
Colorado MN00064 New York (NEL 11647
Connecticut PH-0256 North Carolina 27700
EPA Region 8 8TMS-Q North Dakota R-036
Florida (NELAP E87605 Ohio 4150
Georgia (DNR) 959 Oklahoma D9922
Guam 959 Oregon (ELAP) MN200001-005
Hawaii SLD Oregon (OREL MN300001-001
Idaho MN00064 Pennsylvania 68-00563
Illinois 200012 Puerto Rico MN00064
Indiana C-MN-01 Saipan MP0003
Indiana C - M N - 0 1 South Carolina 74003001
Iowa 368 Texas T104704192-08
Kansas E-10167 Utah (NELAP) MN00064
Kentucky 90062 Virginia 00251
Louisiana 03086 Washington C755
Maine 2007029 West Virginia 9952C
Maryland 322 Wisconsin 999407970
Michigan 9909 Wyoming 8TMS-Q
Page 3 of 13Report No.....10272510_1613B
46

Appendix A
Sample Management
Pace Analytical Services, Inc. Page 4 of 13Report No.....10272510_1613B
47

Page 5 of 13Report No.....10272510_1613B
48

Page 6 of 13Report No.....10272510_1613B
49

REPORT OF LABORATORY ANALYSISThis report shall not be reproduced, except in full,
without the written consent of Pace Analytical Services, Inc.
Pace Analytical Services, Inc.1700 Elm Street - Suite 200
Minneapolis, MN 55414
Tel: 612-607-1700Fax: 612- 607-6444
Report No.....10272510
Reporting Flags
A =
B =
C =
D =
E =
I =
J =
Nn =
P =
R =
S =
U =
V =
X =
Y =
* =
Reporting Limit based on signal to noise
Less than 10x higher than method blank level
Result obtained from confirmation analysis
Result obtained from analysis of diluted sample
Exceeds calibration range
Interference present
Estimated value
Value obtained from additional analysis
PCDE Interference
Recovery outside target range
Peak saturated
Analyte not detected
Result verified by confirmation analysis
%D Exceeds limits
Calculated using average of daily RFs
See Discussion
Page 7 of 13Report No.....10272510_1613B
50

Appendix B
Sample Analysis Summary
Pace Analytical Services, Inc. Page 8 of 13Report No.....10272510_1613B
51

REPORT OF LABORATORY ANALYSISThis report shall not be reproduced, except in full,
without the written consent of Pace Analytical Services, Inc.
Pace Analytical Services, Inc.1700 Elm Street - Suite 200
Minneapolis, MN 55414
Tel: 612-607-1700Fax: 612- 607-6444
Lab Sample ID
Injected ByFilename
Total Amount Extracted% MoistureDry Weight ExtractedICAL IDCCal Filename(s)Method Blank ID
Client's Sample ID 1406-12383 002 Spring10272510001U140705A_14BAL
NA951 mL
NAU140611U140704B_18BLANK-41197
MatrixDilutionCollectedReceivedExtractedAnalyzed
WaterNA06/26/2014 14:4506/28/2014 08:1406/30/2014 20:3007/05/2014 09:39
Client - Endyne, Inc.Method 1613B Sample Analysis Results
NativeIsomers
Concpg/L pg/L
RL InternalStandards Added
ng's PercentRecovery
EMPCpg/L
2,3,7,8-TCDF ND 1.7 2,3,7,8-TCDF-13C 2.00 50-----Total TCDF 2.5 1.7 2,3,7,8-TCDD-13C 2.00 56J-----
1,2,3,7,8-PeCDF-13C 2.00 592,3,7,8-TCDD ND 2.8 2,3,4,7,8-PeCDF-13C 2.00 58-----Total TCDD ND 2.8 1,2,3,7,8-PeCDD-13C 2.00 65-----
1,2,3,4,7,8-HxCDF-13C 2.00 631,2,3,7,8-PeCDF ND 4.4 1,2,3,6,7,8-HxCDF-13C 2.00 74-----2,3,4,7,8-PeCDF ND 2.0 2,3,4,6,7,8-HxCDF-13C 2.00 70-----Total PeCDF ND 3.2 1,2,3,7,8,9-HxCDF-13C 2.00 65-----
1,2,3,4,7,8-HxCDD-13C 2.00 631,2,3,7,8-PeCDD ND 1.7 1,2,3,6,7,8-HxCDD-13C 2.00 61-----Total PeCDD ND 1.7 1,2,3,4,6,7,8-HpCDF-13C 2.00 51-----
1,2,3,4,7,8,9-HpCDF-13C 2.00 531,2,3,4,7,8-HxCDF ND 3.2 1,2,3,4,6,7,8-HpCDD-13C 2.00 53-----1,2,3,6,7,8-HxCDF ND 2.7 OCDD-13C 4.00 44-----2,3,4,6,7,8-HxCDF ND 2.6-----1,2,3,7,8,9-HxCDF ND 3.6 1,2,3,4-TCDD-13C 2.00 NA-----Total HxCDF 75.0 3.0 1,2,3,7,8,9-HxCDD-13C 2.00 NA-----
1,2,3,4,7,8-HxCDD ND 4.7 2,3,7,8-TCDD-37Cl4 0.20 103-----1,2,3,6,7,8-HxCDD 9.6 3.8 J-----1,2,3,7,8,9-HxCDD ND 3.6-----Total HxCDD 25.0 4.0 J-----
1,2,3,4,6,7,8-HpCDF 65.0 4.4 Total 2,3,7,8-TCDD-----1,2,3,4,7,8,9-HpCDF ND 7.9 Equivalence: 4.7 pg/L-----Total HpCDF 320.0 6.2 (Using 2005 WHO Factors)-----
1,2,3,4,6,7,8-HpCDD 240.0 5.6-----Total HpCDD 390.0 5.6-----
OCDF 540.0 15.0-----OCDD 1600.0 15.0-----
Conc = Concentration (Totals include 2,3,7,8-substituted isomers).EMPC = Estimated Maximum Possible ConcentrationRL = Reporting Limit.
ND = Not DetectedNA = Not ApplicableNC = Not Calculated
J = Estimated value
Page 9 of 13Report No.....10272510_1613B
52

REPORT OF LABORATORY ANALYSISThis report shall not be reproduced, except in full,
without the written consent of Pace Analytical Services, Inc.
Pace Analytical Services, Inc.1700 Elm Street - Suite 200
Minneapolis, MN 55414
Tel: 612-607-1700Fax: 612- 607-6444
Lab Sample ID
Injected By
FilenameTotal Amount ExtractedICAL IDCCal Filename(s)
BLANK-41197U140707A_10
SMT
1010 mLU140611U140707A_01
MatrixDilutionExtractedAnalyzed
Water
06/30/2014 20:3007/07/2014 16:27
NA
Method 1613B Blank Analysis Results
NativeIsomers pg/L
Conc EMPCpg/L pg/L
RL InternalStandards Added
ng's PercentRecovery
2,3,7,8-TCDF ND ----- 2.9 2,3,7,8-TCDF-13C 2.00 41Total TCDF ND ----- 2.9 2,3,7,8-TCDD-13C 2.00 49
1,2,3,7,8-PeCDF-13C 2.00 452,3,7,8-TCDD ND ----- 2.7 2,3,4,7,8-PeCDF-13C 2.00 43Total TCDD ND ----- 2.7 1,2,3,7,8-PeCDD-13C 2.00 52
1,2,3,4,7,8-HxCDF-13C 2.00 521,2,3,7,8-PeCDF ND ----- 4.2 1,2,3,6,7,8-HxCDF-13C 2.00 572,3,4,7,8-PeCDF ND ----- 2.0 2,3,4,6,7,8-HxCDF-13C 2.00 57Total PeCDF ND ----- 3.1 1,2,3,7,8,9-HxCDF-13C 2.00 52
1,2,3,4,7,8-HxCDD-13C 2.00 521,2,3,7,8-PeCDD ND ----- 1.9 1,2,3,6,7,8-HxCDD-13C 2.00 53Total PeCDD ND ----- 1.9 1,2,3,4,6,7,8-HpCDF-13C 2.00 45
1,2,3,4,7,8,9-HpCDF-13C 2.00 441,2,3,4,7,8-HxCDF ND ----- 1.8 1,2,3,4,6,7,8-HpCDD-13C 2.00 481,2,3,6,7,8-HxCDF ND ----- 1.8 OCDD-13C 4.00 302,3,4,6,7,8-HxCDF ND ----- 1.71,2,3,7,8,9-HxCDF ND ----- 2.7 1,2,3,4-TCDD-13C 2.00 NATotal HxCDF ND ----- 2.0 1,2,3,7,8,9-HxCDD-13C 2.00 NA
1,2,3,4,7,8-HxCDD ND ----- 3.4 2,3,7,8-TCDD-37Cl4 0.20 1031,2,3,6,7,8-HxCDD ND ----- 4.31,2,3,7,8,9-HxCDD ND ----- 4.1Total HxCDD ND ----- 3.9
1,2,3,4,6,7,8-HpCDF ND ----- 2.5 Total 2,3,7,8-TCDD1,2,3,4,7,8,9-HpCDF ND ----- 3.7 Equivalence: 0.00 pg/LTotal HpCDF ND ----- 3.1 (Using 2005 WHO Factors)
1,2,3,4,6,7,8-HpCDD ND ----- 4.8Total HpCDD ND ----- 4.8
OCDF ND ----- 11.0OCDD ND ----- 13.0
Conc = Concentration (Totals include 2,3,7,8-substituted isomers).EMPC = Estimated Maximum Possible ConcentrationRL = Reporting Limit
Page 10 of 13Report No.....10272510_1613B
53
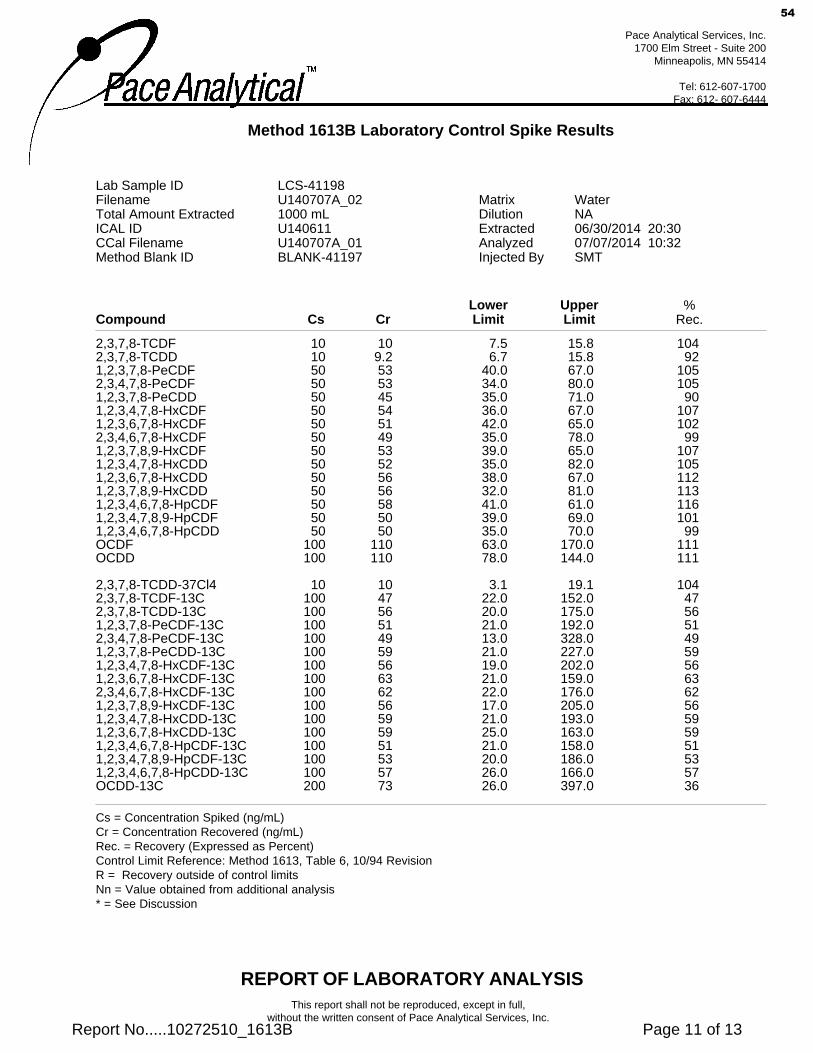
REPORT OF LABORATORY ANALYSISThis report shall not be reproduced, except in full,
without the written consent of Pace Analytical Services, Inc.
Pace Analytical Services, Inc.1700 Elm Street - Suite 200
Minneapolis, MN 55414
Tel: 612-607-1700Fax: 612- 607-6444
Method 1613B Laboratory Control Spike Results
Lab Sample ID
Injected By
FilenameTotal Amount ExtractedICAL IDCCal Filename
LCS-41198U140707A_02
SMT
1000 mLU140611U140707A_01
MatrixDilutionExtractedAnalyzed
Water
06/30/2014 20:3007/07/2014 10:32
NA
Method Blank ID BLANK-41197
Compound Cs CrLower UpperLimit Limit
%Rec.
2,3,7,8-TCDF 10 10 7.5 15.8 1042,3,7,8-TCDD 10 9.2 6.7 15.8 921,2,3,7,8-PeCDF 50 53 40.0 67.0 1052,3,4,7,8-PeCDF 50 53 34.0 80.0 1051,2,3,7,8-PeCDD 50 45 35.0 71.0 901,2,3,4,7,8-HxCDF 50 54 36.0 67.0 1071,2,3,6,7,8-HxCDF 50 51 42.0 65.0 1022,3,4,6,7,8-HxCDF 50 49 35.0 78.0 991,2,3,7,8,9-HxCDF 50 53 39.0 65.0 1071,2,3,4,7,8-HxCDD 50 52 35.0 82.0 1051,2,3,6,7,8-HxCDD 50 56 38.0 67.0 1121,2,3,7,8,9-HxCDD 50 56 32.0 81.0 1131,2,3,4,6,7,8-HpCDF 50 58 41.0 61.0 1161,2,3,4,7,8,9-HpCDF 50 50 39.0 69.0 1011,2,3,4,6,7,8-HpCDD 50 50 35.0 70.0 99OCDF 100 110 63.0 170.0 111OCDD 100 110 78.0 144.0 111
2,3,7,8-TCDD-37Cl4 10 10 3.1 19.1 1042,3,7,8-TCDF-13C 100 47 22.0 152.0 472,3,7,8-TCDD-13C 100 56 20.0 175.0 561,2,3,7,8-PeCDF-13C 100 51 21.0 192.0 512,3,4,7,8-PeCDF-13C 100 49 13.0 328.0 491,2,3,7,8-PeCDD-13C 100 59 21.0 227.0 591,2,3,4,7,8-HxCDF-13C 100 56 19.0 202.0 561,2,3,6,7,8-HxCDF-13C 100 63 21.0 159.0 632,3,4,6,7,8-HxCDF-13C 100 62 22.0 176.0 621,2,3,7,8,9-HxCDF-13C 100 56 17.0 205.0 561,2,3,4,7,8-HxCDD-13C 100 59 21.0 193.0 591,2,3,6,7,8-HxCDD-13C 100 59 25.0 163.0 591,2,3,4,6,7,8-HpCDF-13C 100 51 21.0 158.0 511,2,3,4,7,8,9-HpCDF-13C 100 53 20.0 186.0 531,2,3,4,6,7,8-HpCDD-13C 100 57 26.0 166.0 57OCDD-13C 200 73 26.0 397.0 36
Cs = Concentration Spiked (ng/mL)Cr = Concentration Recovered (ng/mL)Rec. = Recovery (Expressed as Percent)Control Limit Reference: Method 1613, Table 6, 10/94 RevisionR = Recovery outside of control limitsNn = Value obtained from additional analysis* = See Discussion
Page 11 of 13Report No.....10272510_1613B
54

REPORT OF LABORATORY ANALYSISThis report shall not be reproduced, except in full,
without the written consent of Pace Analytical Services, Inc.
Pace Analytical Services, Inc.1700 Elm Street - Suite 200
Minneapolis, MN 55414
Tel: 612-607-1700Fax: 612- 607-6444
Method 1613B Laboratory Control Spike Results
Lab Sample ID
Injected By
FilenameTotal Amount ExtractedICAL IDCCal Filename
LCSD-41199U140707A_03
SMT
991 mLU140611U140707A_01
MatrixDilutionExtractedAnalyzed
Water
06/30/2014 20:3007/07/2014 11:14
NA
Method Blank ID BLANK-41197
Compound Cs CrLower UpperLimit Limit
%Rec.
2,3,7,8-TCDF 10 10 7.5 15.8 1022,3,7,8-TCDD 10 9.0 6.7 15.8 901,2,3,7,8-PeCDF 50 52 40.0 67.0 1042,3,4,7,8-PeCDF 50 49 34.0 80.0 981,2,3,7,8-PeCDD 50 42 35.0 71.0 841,2,3,4,7,8-HxCDF 50 52 36.0 67.0 1041,2,3,6,7,8-HxCDF 50 50 42.0 65.0 1002,3,4,6,7,8-HxCDF 50 48 35.0 78.0 971,2,3,7,8,9-HxCDF 50 52 39.0 65.0 1031,2,3,4,7,8-HxCDD 50 50 35.0 82.0 1011,2,3,6,7,8-HxCDD 50 57 38.0 67.0 1141,2,3,7,8,9-HxCDD 50 55 32.0 81.0 1101,2,3,4,6,7,8-HpCDF 50 55 41.0 61.0 1101,2,3,4,7,8,9-HpCDF 50 50 39.0 69.0 1001,2,3,4,6,7,8-HpCDD 50 53 35.0 70.0 107OCDF 100 110 63.0 170.0 107OCDD 100 110 78.0 144.0 111
2,3,7,8-TCDD-37Cl4 10 9.1 3.1 19.1 912,3,7,8-TCDF-13C 100 40 22.0 152.0 402,3,7,8-TCDD-13C 100 48 20.0 175.0 481,2,3,7,8-PeCDF-13C 100 43 21.0 192.0 432,3,4,7,8-PeCDF-13C 100 42 13.0 328.0 421,2,3,7,8-PeCDD-13C 100 51 21.0 227.0 511,2,3,4,7,8-HxCDF-13C 100 49 19.0 202.0 491,2,3,6,7,8-HxCDF-13C 100 55 21.0 159.0 552,3,4,6,7,8-HxCDF-13C 100 55 22.0 176.0 551,2,3,7,8,9-HxCDF-13C 100 49 17.0 205.0 491,2,3,4,7,8-HxCDD-13C 100 52 21.0 193.0 521,2,3,6,7,8-HxCDD-13C 100 50 25.0 163.0 501,2,3,4,6,7,8-HpCDF-13C 100 45 21.0 158.0 451,2,3,4,7,8,9-HpCDF-13C 100 44 20.0 186.0 441,2,3,4,6,7,8-HpCDD-13C 100 47 26.0 166.0 47OCDD-13C 200 58 26.0 397.0 29
Cs = Concentration Spiked (ng/mL)Cr = Concentration Recovered (ng/mL)Rec. = Recovery (Expressed as Percent)Control Limit Reference: Method 1613, Table 6, 10/94 RevisionR = Recovery outside of control limitsNn = Value obtained from additional analysis* = See Discussion
Page 12 of 13Report No.....10272510_1613B
55

REPORT OF LABORATORY ANALYSISThis report shall not be reproduced, except in full,
without the written consent of Pace Analytical Services, Inc.
Pace Analytical Services, Inc.1700 Elm Street - Suite 200
Minneapolis, MN 55414
Tel: 612-607-1700Fax: 612- 607-6444
Client
Spike 1 IDSpike 1 Filename U140707A_02
LCS-41198
Endyne, Inc.
Spike Recovery Relative Percent Difference (RPD) Results
Spike 2 IDSpike 2 Filename U140702A_03
LCSD-41149
Method 1613B
Spike 1 Spike 2Compound %REC %REC %RPD
2,3,7,8-TCDF 104 99 4.92,3,7,8-TCDD 92 90 2.21,2,3,7,8-PeCDF 105 102 2.92,3,4,7,8-PeCDF 105 99 5.91,2,3,7,8-PeCDD 90 87 3.41,2,3,4,7,8-HxCDF 107 109 1.91,2,3,6,7,8-HxCDF 102 99 3.02,3,4,6,7,8-HxCDF 99 98 1.01,2,3,7,8,9-HxCDF 107 104 2.81,2,3,4,7,8-HxCDD 105 100 4.91,2,3,6,7,8-HxCDD 112 106 5.51,2,3,7,8,9-HxCDD 113 109 3.61,2,3,4,6,7,8-HpCDF 116 111 4.41,2,3,4,7,8,9-HpCDF 101 101 0.01,2,3,4,6,7,8-HpCDD 99 101 2.0OCDF 111 104 6.5OCDD 111 100 10.4
%REC = Percent RecoveredRPD = The difference between the two values divided by the mean value
Page 13 of 13Report No.....10272510_1613B
56
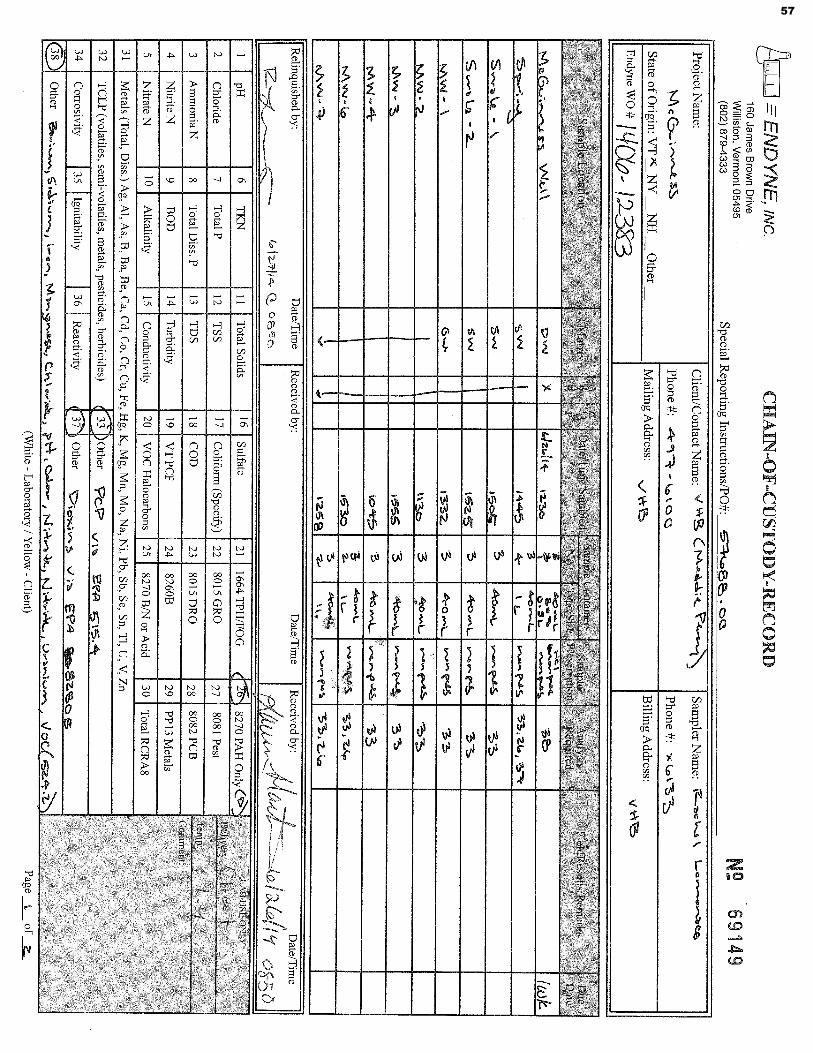
57

58

Laboratory Report
McGuinness SoilPROJECT:
DATE RECEIVED:
WORK ORDER:
DATE REPORTED:
090395
Vanasse Hangen Brustlin, Inc.
PO Box 120
N. Ferrisburgh, VT 05473
Atten: Meddie Perry SAMPLER:
July 03, 2014
1406-12385
Rachael
June 27, 2014
Enclosed please find the results of the analyses performed for the samples referenced on the attached chain of custody. All required method quality control elements including instrument calibration were performed in accordance with method requirements and determined to be acceptable unless otherwise noted.
The column labeled Lab/Tech in the accompanying report denotes the laboratory facility where the testing was performed and the technician who conducted the assay. A "W" designates the Williston, VT lab under NELAC certification ELAP 11263; "R" designates the Lebanon, NH facility under certification NH 2037 and “N” the Plattsburgh, NY lab under certification ELAP 11892. “Sub” indicates the testing was performed by a subcontracted laboratory. The accreditation status of the subcontracted lab is referenced in the corresponding NELAC and Qual fields.
The NELAC column also denotes the accreditation status of each laboratory for each reported parameter. “A” indicates the referenced laboratory is NELAC accredited for the parameter reported. “N” indicates the laboratory is not accredited. “U” indicates that NELAC does not offer accreditation for that parameter in that specific matrix. Test results denoted with an “A” meet all National Environmental Laboratory Accreditation Program requirements except where denoted by pertinent data qualifiers. Test results are representative of the samples as they were received at the laboratory
Endyne, Inc. warrants, to the best of its knowledge and belief, the accuracy of the analytical
test results contained in this report, but makes no other warranty, expressed or implied, especially no warranties of merchantability or fitness for a particular purpose.
Page 1 of 2
Reviewed by:
Harry B. Locker, Ph.D.
Laboratory Director
ELAP 11263
160 James Brown Dr., Williston, VT 05495
Ph 802-879-4333 Fax 802-879-7103
www.endynelabs.com
NH2037
56 Etna Road, Lebanon, NH 03766
Ph 603-678-4891 Fax 603-678-4893
59

Laboratory Report
Vanasse Hangen Brustlin, Inc.
Page 2 of 2
CLIENT:PROJECT: McGuinness Soil
WORK ORDER:DATE RECEIVED:
1406-1238506/27/2014
DATE REPORTED: 07/03/2014
001 Date Sampled: 6/24/14Site: MW-8 Time: 16:30
Analysis Date/TimeMethodParameter Result NELACLab/TechUnits Qual.
93.6 % 7/1/14 JSSW USolids, Total SM 2540 G.-97
TPH DRO Package
Completed 6/27/14 FAAW AUltrasonic Extraction EPA 3550B
< 3.0 mg/Kg, dry 6/30/14 MDPW UC7-C10 TPH EPA 8015B
< 3.0 mg/Kg, dry 6/30/14 MDPW AC10-C28 TPH-DRO EPA 8015B
< 3.0 mg/Kg, dry 6/30/14 MDPW UC28-C40 TPH EPA 8015B
< 3.0 mg/Kg, dry 6/30/14 MDPW UTot. Petroleum Hydrocarbons EPA 8015B
NA 6/30/14 MDPW UHydrocarbon Window EPA 8015B
Phenoxy-Acid Herbicides
Done 7/1/14 FAAW AUltrasonic Extraction EPA 8151A
< 17.9 ug/Kg, dry 7/3/14 MDPW NDalapon EPA 8151A
81 % 7/3/14 MDPW ASurrogate-DCAA EPA 8151A
< 17.9 ug/Kg, dry 7/3/14 MDPW ADicamba EPA 8151A
< 17.9 ug/Kg, dry 7/3/14 MDPW A2,4-D EPA 8151A
< 7.18 ug/Kg, dry 7/3/14 MDPW NPentachlorophenol EPA 8151A
< 17.9 ug/Kg, dry 7/3/14 MDPW A2,4,5-TP (Silvex) EPA 8151A
< 17.9 ug/Kg, dry 7/3/14 MDPW A2,4,5-T EPA 8151A
< 17.9 ug/Kg, dry 7/3/14 MDPW U QA-Picloram EPA 8151A
< 17.9 ug/Kg, dry 7/3/14 MDPW NDinoseb EPA 8151A
Report Summary of Qualifiers and Notes
QA-: QA/QC associated with this analysis did not meet laboratory acceptance limits indicating the results may be
biased low.
60

61
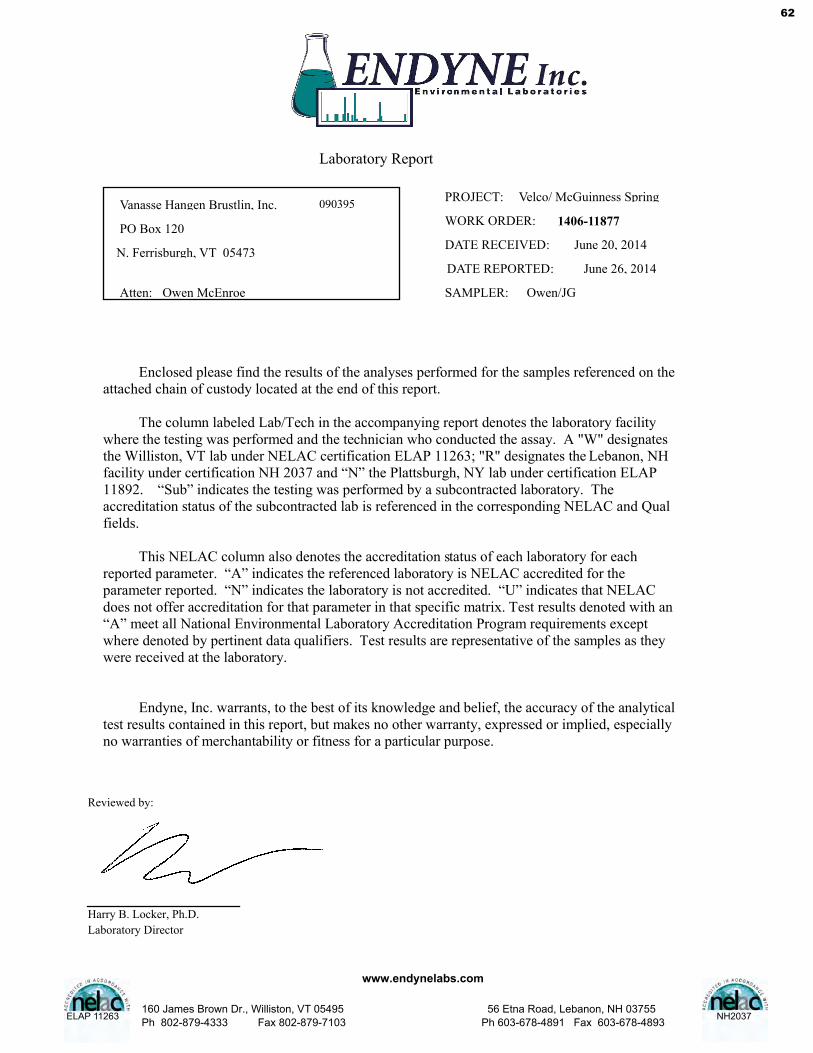
Laboratory Report
Velco/ McGuinness SpringPROJECT:
DATE RECEIVED:
WORK ORDER:
DATE REPORTED:
090395Vanasse Hangen Brustlin, Inc.
PO Box 120
N. Ferrisburgh, VT 05473
Atten: Owen McEnroe SAMPLER:
June 26, 2014
1406-11877
Owen/JG
June 20, 2014
Enclosed please find the results of the analyses performed for the samples referenced on the attached chain of custody located at the end of this report.
The column labeled Lab/Tech in the accompanying report denotes the laboratory facility where the testing was performed and the technician who conducted the assay. A "W" designates the Williston, VT lab under NELAC certification ELAP 11263; "R" designates the Lebanon, NH facility under certification NH 2037 and “N” the Plattsburgh, NY lab under certification ELAP 11892. “Sub” indicates the testing was performed by a subcontracted laboratory. The accreditation status of the subcontracted lab is referenced in the corresponding NELAC and Qual fields.
This NELAC column also denotes the accreditation status of each laboratory for each
reported parameter. “A” indicates the referenced laboratory is NELAC accredited for the parameter reported. “N” indicates the laboratory is not accredited. “U” indicates that NELAC does not offer accreditation for that parameter in that specific matrix. Test results denoted with an “A” meet all National Environmental Laboratory Accreditation Program requirements except where denoted by pertinent data qualifiers. Test results are representative of the samples as they were received at the laboratory.
Endyne, Inc. warrants, to the best of its knowledge and belief, the accuracy of the analytical
test results contained in this report, but makes no other warranty, expressed or implied, especially no warranties of merchantability or fitness for a particular purpose.
Reviewed by:
Harry B. Locker, Ph.D.
Laboratory Director
160 James Brown Dr., Williston, VT 05495
Ph 802-879-4333 Fax 802-879-7103 ELAP 11263
www.endynelabs.com
NH203756 Etna Road, Lebanon, NH 03755
Ph 603-678-4891 Fax 603-678-4893
62

Laboratory Report
Vanasse Hangen Brustlin, Inc.
Page 2 of 7
CLIENT:PROJECT: Velco/ McGuinness Spring
WORK ORDER:DATE RECEIVED:
1406-1187706/20/2014
6/26/2014REPORT DATE:
001 Sampled: 6/18/14Site: SB-5 3.9-5.1 (ft) 6/24/14 FAAWAnalysis Date:
QualNelac
Result
UnitResult
Result
ParameterQualNelac
Result
UnitResult
Result
Parameter
TEST METHOD: EPA 8270D
17:00
AUltrasonic Extraction Completed Aug/Kg, dryN-Nitrosodimethylamine < 370
Aug/Kg, dryPyridine < 370 Nug/Kg, dryAniline < 370
Aug/Kg, dryBis(2-chloroethyl)ether < 185 Aug/Kg, dry1,2-Dichlorobenzene < 74.0
Aug/Kg, dry1,3-Dichlorobenzene < 74.0 Aug/Kg, dry1,4-Dichlorobenzene < 74.0
Nug/Kg, dryBenzyl alcohol < 740 Aug/Kg, dryBis(2-chloroisopropyl)ether < 370
Aug/Kg, dryN-Nitrosodi-n-propylamine < 370 Aug/Kg, dryHexachloroethane < 185
Aug/Kg, dryNitrobenzene < 185 Nug/Kg, dryN-Nitrosopiperidine < 370
Aug/Kg, dryIsophorone < 74.0 Aug/Kg, dryBis(2-chloroethoxy)methane < 185
Aug/Kg, dry1,2,4-Trichlorobenzene < 74.0 Aug/Kg, dryNaphthalene < 37.0
Nug/Kg, dry4-Chloroaniline < 185 Aug/Kg, dryHexachlorobutadiene < 185
Nug/Kg, dryN-Nitrosodi-n-butylamine < 185 Aug/Kg, dry2-Methylnaphthalene < 37.0
Uug/Kg, dry1-Methylnaphthalene < 37.0 Aug/Kg, dryHexachlorocyclopentadiene < 740
Aug/Kg, dry2-Chloronaphthalene < 74.0 Nug/Kg, dry1-Chloronaphthalene < 74.0
Nug/Kg, dry2-Nitroaniline < 740 Aug/Kg, dryDimethyl phthalate < 185
Aug/Kg, dry2,6-Dinitrotoluene < 185 Aug/Kg, dryAcenaphthylene < 37.0
Nug/Kg, dry3-Nitroaniline < 185 Aug/Kg, dryAcenaphthene < 37.0
Nug/Kg, dryDibenzofuran < 74.0 Nug/Kg, dry2,4-Dinitrotoluene < 185
Nug/Kg, dry1-Naphthylamine < 370 Nug/Kg, dry2-Naphthylamine < 370
Aug/Kg, dryFluorene < 37.0 Aug/Kg, dryDiethyl phthalate < 185
Aug/Kg, dry4-Chlorophenyl phenyl ether < 74.0 Nug/Kg, dry4-Nitroaniline < 740
Aug/Kg, dryN-Nitrosodiphenylamine < 185 Uug/Kg, dryAzobenzene < 185
Aug/Kg, dry4-Bromophenyl phenyl ether < 74.0 Aug/Kg, dryHexachlorobenzene < 185
Aug/Kg, dryPhenanthrene < 37.0 Aug/Kg, dryAnthracene < 37.0
Nug/Kg, dryCarbazole < 185 Aug/Kg, dryDi-n-butylphthalate < 370
Aug/Kg, dryFluoranthene < 37.0 Aug/Kg, dryBenzidine < 370
Aug/Kg, dryPyrene < 37.0 Aug/Kg, dryButyl benzyl phthalate < 185
Aug/Kg, dryBenzo(a)anthracene < 37.0 Aug/Kg, dryChrysene < 37.0
Aug/Kg, dry3,3'-Dichlorobenzidine < 185 Aug/Kg, dryBis(2-ethylhexyl)phthalate < 185
Aug/Kg, dryDi-n-octylphthalate < 185 Aug/Kg, dryBenzo(b)fluoranthene < 37.0
Aug/Kg, dryBenzo(k)fluoranthene < 37.0 Aug/Kg, dryBenzo(a)pyrene < 37.0
Aug/Kg, dryIndeno(1,2,3-cd)pyrene < 37.0 Aug/Kg, dryDibenzo(a,h)anthracene < 37.0
Aug/Kg, dryBenzo(g,h,i)perylene < 37.0 Aug/Kg, dryPhenol < 185
Aug/Kg, dry2-Chlorophenol < 185 Aug/Kg, dry2-Methylphenol (o-cresol) < 185
Aug/Kg, dry3&4-Methylphenol (m&p-cresol) < 185 Uug/Kg, dryCresols, Total < 370
Aug/Kg, dry2-Nitrophenol < 370 Aug/Kg, dry2,4-Dimethylphenol < 185
Aug/Kg, dry2,4-Dichlorophenol < 185 Nug/Kg, dry2,6-Dichlorophenol < 185
Aug/Kg, dry4-Chloro-3-methylphenol < 370 Aug/Kg, dry2,4,5-Trichlorophenol < 370
Aug/Kg, dry2,4,6-Trichlorophenol < 370 Aug/Kg, dry2,4-Dinitrophenol < 740
Aug/Kg, dry4-Nitrophenol < 370 Aug/Kg, dry4,6-Dinitro-2-methylphenol < 740
Aug/Kg, dryPentachlorophenol < 370 Uug/Kg, dryBaP Toxic Equiv. Quotient < 86.0
U%B/N Surr.1 Nitrobenzene-d5 73 U%B/N Surr.2 2-Fluorobiphenyl 70
U%B/N Surr.3 Terphenyl-d14 81 U%Acid Surr.1 2-Fluorophenol 47
U%Acid Surr.2 Phenol-d8 73 U%Acid Surr.3 Tribromophenol 77
UUnidentified Peaks 0
63

Laboratory Report
Vanasse Hangen Brustlin, Inc.
Page 3 of 7
CLIENT:PROJECT: Velco/ McGuinness Spring
WORK ORDER:DATE RECEIVED:
1406-1187706/20/2014
6/26/2014REPORT DATE:
001 Sampled: 6/18/14Site: SB-5 3.9-5.1 (ft) 6/24/14 FAAWAnalysis Date:
QualNelac
Result
UnitResult
Result
ParameterQualNelac
Result
UnitResult
Result
Parameter
TEST METHOD: EPA 8015B
17:00
AUltrasonic Extraction Completed Umg/Kg, dryC7-C10 TPH < 3.0
Amg/Kg, dryC10-C28 TPH-DRO < 3.0 Umg/Kg, dryC28-C40 TPH < 3.0
Umg/Kg, dryTot. Petroleum Hydrocarbons < 3.0 UHydrocarbon Window NA
64

Laboratory Report
Vanasse Hangen Brustlin, Inc.
Page 4 of 7
CLIENT:PROJECT: Velco/ McGuinness Spring
WORK ORDER:DATE RECEIVED:
1406-1187706/20/2014
6/26/2014REPORT DATE:
002 Sampled: 6/18/14Site: MW-6 1.-2.1 (ft) 6/24/14 FAAWAnalysis Date:
QualNelac
Result
UnitResult
Result
ParameterQualNelac
Result
UnitResult
Result
Parameter
TEST METHOD: EPA 8270D
17:00
AUltrasonic Extraction Completed Aug/Kg, dryN-Nitrosodimethylamine < 450
Aug/Kg, dryPyridine < 450 Nug/Kg, dryAniline < 450
Aug/Kg, dryBis(2-chloroethyl)ether < 225 Aug/Kg, dry1,2-Dichlorobenzene < 90.0
Aug/Kg, dry1,3-Dichlorobenzene < 90.0 Aug/Kg, dry1,4-Dichlorobenzene < 90.0
Nug/Kg, dryBenzyl alcohol < 900 Aug/Kg, dryBis(2-chloroisopropyl)ether < 450
Aug/Kg, dryN-Nitrosodi-n-propylamine < 450 Aug/Kg, dryHexachloroethane < 225
Aug/Kg, dryNitrobenzene < 225 Nug/Kg, dryN-Nitrosopiperidine < 450
Aug/Kg, dryIsophorone < 90.0 Aug/Kg, dryBis(2-chloroethoxy)methane < 225
Aug/Kg, dry1,2,4-Trichlorobenzene < 90.0 Aug/Kg, dryNaphthalene < 45.0
Nug/Kg, dry4-Chloroaniline < 225 Aug/Kg, dryHexachlorobutadiene < 225
Nug/Kg, dryN-Nitrosodi-n-butylamine < 225 Aug/Kg, dry2-Methylnaphthalene < 45.0
Uug/Kg, dry1-Methylnaphthalene < 45.0 Aug/Kg, dryHexachlorocyclopentadiene < 900
Aug/Kg, dry2-Chloronaphthalene < 90.0 Nug/Kg, dry1-Chloronaphthalene < 90.0
Nug/Kg, dry2-Nitroaniline < 900 Aug/Kg, dryDimethyl phthalate < 225
Aug/Kg, dry2,6-Dinitrotoluene < 225 Aug/Kg, dryAcenaphthylene < 45.0
Nug/Kg, dry3-Nitroaniline < 225 Aug/Kg, dryAcenaphthene < 45.0
Nug/Kg, dryDibenzofuran < 90.0 Nug/Kg, dry2,4-Dinitrotoluene < 225
Nug/Kg, dry1-Naphthylamine < 450 Nug/Kg, dry2-Naphthylamine < 450
Aug/Kg, dryFluorene < 45.0 Aug/Kg, dryDiethyl phthalate < 225
Aug/Kg, dry4-Chlorophenyl phenyl ether < 90.0 Nug/Kg, dry4-Nitroaniline < 900
Aug/Kg, dryN-Nitrosodiphenylamine < 225 Uug/Kg, dryAzobenzene < 225
Aug/Kg, dry4-Bromophenyl phenyl ether < 90.0 Aug/Kg, dryHexachlorobenzene < 225
Aug/Kg, dryPhenanthrene < 45.0 Aug/Kg, dryAnthracene < 45.0
Nug/Kg, dryCarbazole < 225 Aug/Kg, dryDi-n-butylphthalate < 450
Aug/Kg, dryFluoranthene < 45.0 Aug/Kg, dryBenzidine < 450
Aug/Kg, dryPyrene < 45.0 Aug/Kg, dryButyl benzyl phthalate < 225
Aug/Kg, dryBenzo(a)anthracene < 45.0 Aug/Kg, dryChrysene < 45.0
Aug/Kg, dry3,3'-Dichlorobenzidine < 225 Aug/Kg, dryBis(2-ethylhexyl)phthalate < 225
Aug/Kg, dryDi-n-octylphthalate < 225 Aug/Kg, dryBenzo(b)fluoranthene < 45.0
Aug/Kg, dryBenzo(k)fluoranthene < 45.0 Aug/Kg, dryBenzo(a)pyrene < 45.0
Aug/Kg, dryIndeno(1,2,3-cd)pyrene < 45.0 Aug/Kg, dryDibenzo(a,h)anthracene < 45.0
Aug/Kg, dryBenzo(g,h,i)perylene < 45.0 Aug/Kg, dryPhenol < 225
Aug/Kg, dry2-Chlorophenol < 225 Aug/Kg, dry2-Methylphenol (o-cresol) < 225
Aug/Kg, dry3&4-Methylphenol (m&p-cresol) < 225 Uug/Kg, dryCresols, Total < 450
Aug/Kg, dry2-Nitrophenol < 450 Aug/Kg, dry2,4-Dimethylphenol < 225
Aug/Kg, dry2,4-Dichlorophenol < 225 Nug/Kg, dry2,6-Dichlorophenol < 225
Aug/Kg, dry4-Chloro-3-methylphenol < 450 Aug/Kg, dry2,4,5-Trichlorophenol < 450
Aug/Kg, dry2,4,6-Trichlorophenol < 450 Aug/Kg, dry2,4-Dinitrophenol < 900
Aug/Kg, dry4-Nitrophenol < 450 Aug/Kg, dry4,6-Dinitro-2-methylphenol < 900
Aug/Kg, dryPentachlorophenol < 450 Uug/Kg, dryBaP Toxic Equiv. Quotient < 104
U%B/N Surr.1 Nitrobenzene-d5 69 U%B/N Surr.2 2-Fluorobiphenyl 66
U%B/N Surr.3 Terphenyl-d14 87 U%Acid Surr.1 2-Fluorophenol 51
U%Acid Surr.2 Phenol-d8 68 U%Acid Surr.3 Tribromophenol 77
UUnidentified Peaks 0
65
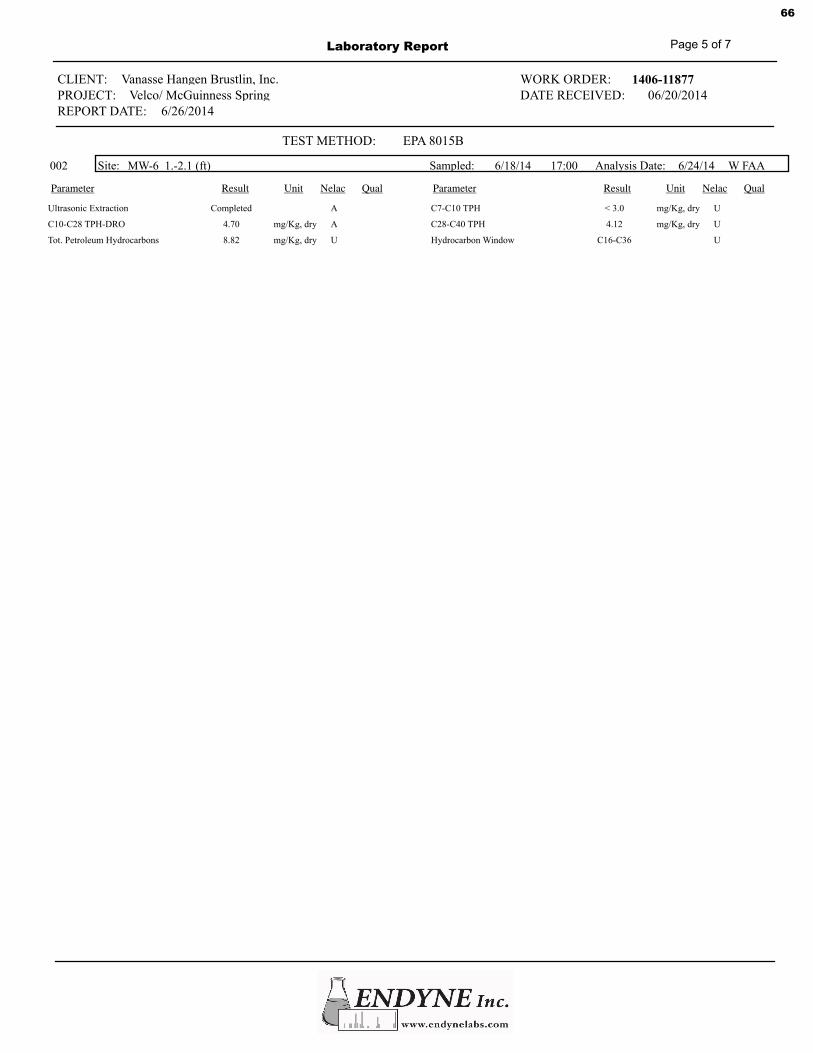
Laboratory Report
Vanasse Hangen Brustlin, Inc.
Page 5 of 7
CLIENT:PROJECT: Velco/ McGuinness Spring
WORK ORDER:DATE RECEIVED:
1406-1187706/20/2014
6/26/2014REPORT DATE:
002 Sampled: 6/18/14Site: MW-6 1.-2.1 (ft) 6/24/14 FAAWAnalysis Date:
QualNelac
Result
UnitResult
Result
ParameterQualNelac
Result
UnitResult
Result
Parameter
TEST METHOD: EPA 8015B
17:00
AUltrasonic Extraction Completed Umg/Kg, dryC7-C10 TPH < 3.0
Amg/Kg, dryC10-C28 TPH-DRO 4.70 Umg/Kg, dryC28-C40 TPH 4.12
Umg/Kg, dryTot. Petroleum Hydrocarbons 8.82 UHydrocarbon Window C16-C36
66

Laboratory Report
Vanasse Hangen Brustlin, Inc.
Page 6 of 7
CLIENT:PROJECT: Velco/ McGuinness Spring
WORK ORDER:DATE RECEIVED:
1406-1187706/20/2014
6/26/2014REPORT DATE:
003 Sampled: 6/18/14Site: MW-7 3.5-5.0 (ft) 6/24/14 FAAWAnalysis Date:
QualNelac
Result
UnitResult
Result
ParameterQualNelac
Result
UnitResult
Result
Parameter
TEST METHOD: EPA 8270D
17:00
AUltrasonic Extraction Completed Aug/Kg, dryN-Nitrosodimethylamine < 380
Aug/Kg, dryPyridine < 380 Nug/Kg, dryAniline < 380
Aug/Kg, dryBis(2-chloroethyl)ether < 190 Aug/Kg, dry1,2-Dichlorobenzene < 76.0
Aug/Kg, dry1,3-Dichlorobenzene < 76.0 Aug/Kg, dry1,4-Dichlorobenzene < 76.0
Nug/Kg, dryBenzyl alcohol < 760 Aug/Kg, dryBis(2-chloroisopropyl)ether < 380
Aug/Kg, dryN-Nitrosodi-n-propylamine < 380 Aug/Kg, dryHexachloroethane < 190
Aug/Kg, dryNitrobenzene < 190 Nug/Kg, dryN-Nitrosopiperidine < 380
Aug/Kg, dryIsophorone < 76.0 Aug/Kg, dryBis(2-chloroethoxy)methane < 190
Aug/Kg, dry1,2,4-Trichlorobenzene < 76.0 Aug/Kg, dryNaphthalene < 38.0
Nug/Kg, dry4-Chloroaniline < 190 Aug/Kg, dryHexachlorobutadiene < 190
Nug/Kg, dryN-Nitrosodi-n-butylamine < 190 Aug/Kg, dry2-Methylnaphthalene < 38.0
Uug/Kg, dry1-Methylnaphthalene < 38.0 Aug/Kg, dryHexachlorocyclopentadiene < 760
Aug/Kg, dry2-Chloronaphthalene < 76.0 Nug/Kg, dry1-Chloronaphthalene < 76.0
Nug/Kg, dry2-Nitroaniline < 760 Aug/Kg, dryDimethyl phthalate < 190
Aug/Kg, dry2,6-Dinitrotoluene < 190 Aug/Kg, dryAcenaphthylene < 38.0
Nug/Kg, dry3-Nitroaniline < 190 Aug/Kg, dryAcenaphthene < 38.0
Nug/Kg, dryDibenzofuran < 76.0 Nug/Kg, dry2,4-Dinitrotoluene < 190
Nug/Kg, dry1-Naphthylamine < 380 Nug/Kg, dry2-Naphthylamine < 380
Aug/Kg, dryFluorene < 38.0 Aug/Kg, dryDiethyl phthalate < 190
Aug/Kg, dry4-Chlorophenyl phenyl ether < 76.0 Nug/Kg, dry4-Nitroaniline < 760
Aug/Kg, dryN-Nitrosodiphenylamine < 190 Uug/Kg, dryAzobenzene < 190
Aug/Kg, dry4-Bromophenyl phenyl ether < 76.0 Aug/Kg, dryHexachlorobenzene < 190
Aug/Kg, dryPhenanthrene < 38.0 Aug/Kg, dryAnthracene < 38.0
Nug/Kg, dryCarbazole < 190 Aug/Kg, dryDi-n-butylphthalate < 380
Aug/Kg, dryFluoranthene < 38.0 Aug/Kg, dryBenzidine < 380
Aug/Kg, dryPyrene < 38.0 Aug/Kg, dryButyl benzyl phthalate < 190
Aug/Kg, dryBenzo(a)anthracene < 38.0 Aug/Kg, dryChrysene < 38.0
Aug/Kg, dry3,3'-Dichlorobenzidine < 190 Aug/Kg, dryBis(2-ethylhexyl)phthalate < 190
Aug/Kg, dryDi-n-octylphthalate < 190 Aug/Kg, dryBenzo(b)fluoranthene < 38.0
Aug/Kg, dryBenzo(k)fluoranthene < 38.0 Aug/Kg, dryBenzo(a)pyrene < 38.0
Aug/Kg, dryIndeno(1,2,3-cd)pyrene < 38.0 Aug/Kg, dryDibenzo(a,h)anthracene < 38.0
Aug/Kg, dryBenzo(g,h,i)perylene < 38.0 Aug/Kg, dryPhenol < 190
Aug/Kg, dry2-Chlorophenol < 190 Aug/Kg, dry2-Methylphenol (o-cresol) < 190
Aug/Kg, dry3&4-Methylphenol (m&p-cresol) < 190 Uug/Kg, dryCresols, Total < 380
Aug/Kg, dry2-Nitrophenol < 380 Aug/Kg, dry2,4-Dimethylphenol < 190
Aug/Kg, dry2,4-Dichlorophenol < 190 Nug/Kg, dry2,6-Dichlorophenol < 190
Aug/Kg, dry4-Chloro-3-methylphenol < 380 Aug/Kg, dry2,4,5-Trichlorophenol < 380
Aug/Kg, dry2,4,6-Trichlorophenol < 380 Aug/Kg, dry2,4-Dinitrophenol < 760
Aug/Kg, dry4-Nitrophenol < 380 Aug/Kg, dry4,6-Dinitro-2-methylphenol < 760
Aug/Kg, dryPentachlorophenol < 380 Uug/Kg, dryBaP Toxic Equiv. Quotient < 83.0
U%B/N Surr.1 Nitrobenzene-d5 67 U%B/N Surr.2 2-Fluorobiphenyl 68
U%B/N Surr.3 Terphenyl-d14 89 U%Acid Surr.1 2-Fluorophenol 55
U%Acid Surr.2 Phenol-d8 66 U%Acid Surr.3 Tribromophenol 75
UUnidentified Peaks 0
67

Laboratory Report
Vanasse Hangen Brustlin, Inc.
Page 7 of 7
CLIENT:PROJECT: Velco/ McGuinness Spring
WORK ORDER:DATE RECEIVED:
1406-1187706/20/2014
6/26/2014REPORT DATE:
003 Sampled: 6/18/14Site: MW-7 3.5-5.0 (ft) 6/24/14 FAAWAnalysis Date:
QualNelac
Result
UnitResult
Result
ParameterQualNelac
Result
UnitResult
Result
Parameter
TEST METHOD: EPA 8015B
17:00
AUltrasonic Extraction Completed Umg/Kg, dryC7-C10 TPH < 3.0
Amg/Kg, dryC10-C28 TPH-DRO < 3.0 Umg/Kg, dryC28-C40 TPH < 3.0
Umg/Kg, dryTot. Petroleum Hydrocarbons < 3.0 UHydrocarbon Window NA
68

69

Laboratory Report
Velco - McGuinness SpringPROJECT:
DATE RECEIVED:
WORK ORDER:
DATE REPORTED:
090395
Vanasse Hangen Brustlin, Inc.
PO Box 120
N. Ferrisburgh, VT 05473
Atten: Owen SAMPLER:
June 05, 2014
1405-09466
Owen/Velco
May 21, 2014
Enclosed please find the results of the analyses performed for the samples referenced on the attached chain of custody. All required method quality control elements including instrument calibration were performed in accordance with method requirements and determined to be acceptable unless otherwise noted.
The column labeled Lab/Tech in the accompanying report denotes the laboratory facility where the testing was performed and the technician who conducted the assay. A "W" designates the Williston, VT lab under NELAC certification ELAP 11263; "R" designates the Lebanon, NH facility under certification NH 2037 and “N” the Plattsburgh, NY lab under certification ELAP 11892. “Sub” indicates the testing was performed by a subcontracted laboratory. The accreditation status of the subcontracted lab is referenced in the corresponding NELAC and Qual fields.
The NELAC column also denotes the accreditation status of each laboratory for each reported parameter. “A” indicates the referenced laboratory is NELAC accredited for the parameter reported. “N” indicates the laboratory is not accredited. “U” indicates that NELAC does not offer accreditation for that parameter in that specific matrix. Test results denoted with an “A” meet all National Environmental Laboratory Accreditation Program requirements except where denoted by pertinent data qualifiers. Test results are representative of the samples as they were received at the laboratory
Endyne, Inc. warrants, to the best of its knowledge and belief, the accuracy of the analytical
test results contained in this report, but makes no other warranty, expressed or implied, especially no warranties of merchantability or fitness for a particular purpose.
Page 1 of 3
Reviewed by:
Harry B. Locker, Ph.D.
Laboratory Director
ELAP 11263
160 James Brown Dr., Williston, VT 05495
Ph 802-879-4333 Fax 802-879-7103
www.endynelabs.com
NH2037
56 Etna Road, Lebanon, NH 03766
Ph 603-678-4891 Fax 603-678-4893
70
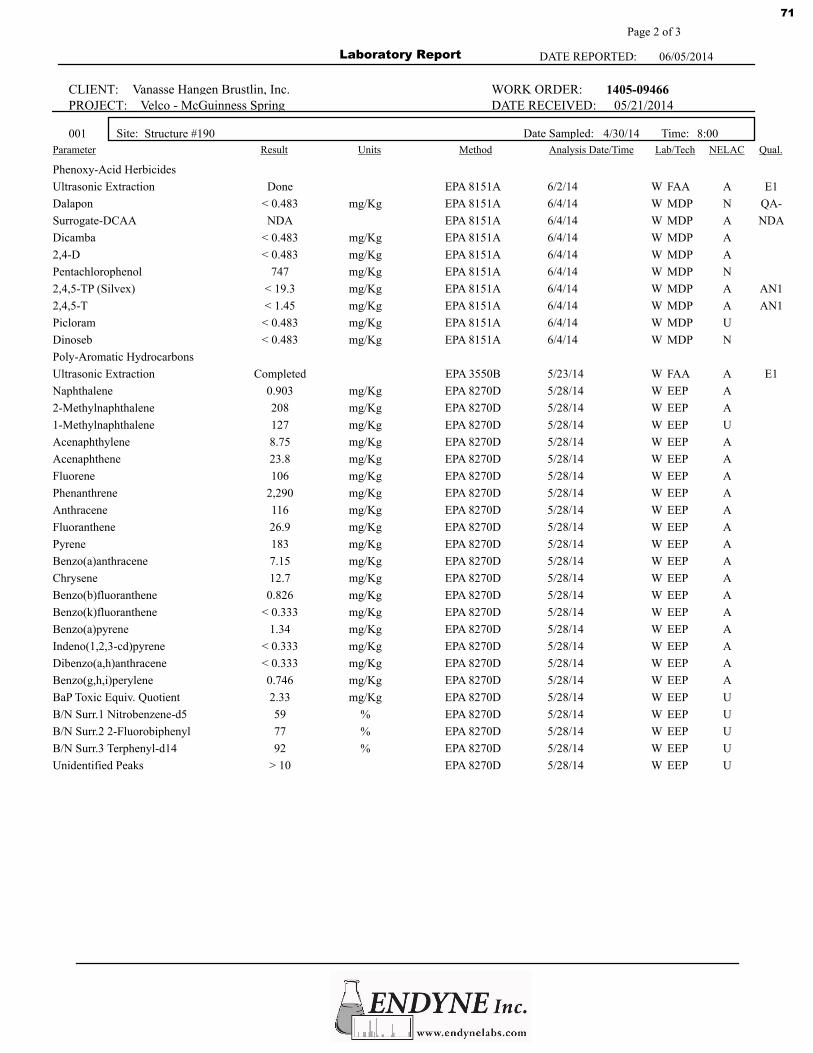
Laboratory Report
Vanasse Hangen Brustlin, Inc.
Page 2 of 3
CLIENT:PROJECT: Velco - McGuinness Spring
WORK ORDER:DATE RECEIVED:
1405-0946605/21/2014
DATE REPORTED: 06/05/2014
001 Date Sampled: 4/30/14Site: Structure #190 Time: 8:00
Analysis Date/TimeMethodParameter Result NELACLab/TechUnits Qual.
Phenoxy-Acid Herbicides
Done 6/2/14 FAAW A E1Ultrasonic Extraction EPA 8151A
< 0.483 mg/Kg 6/4/14 MDPW N QA-Dalapon EPA 8151A
NDA 6/4/14 MDPW A NDASurrogate-DCAA EPA 8151A
< 0.483 mg/Kg 6/4/14 MDPW ADicamba EPA 8151A
< 0.483 mg/Kg 6/4/14 MDPW A2,4-D EPA 8151A
747 mg/Kg 6/4/14 MDPW NPentachlorophenol EPA 8151A
< 19.3 mg/Kg 6/4/14 MDPW A AN12,4,5-TP (Silvex) EPA 8151A
< 1.45 mg/Kg 6/4/14 MDPW A AN12,4,5-T EPA 8151A
< 0.483 mg/Kg 6/4/14 MDPW UPicloram EPA 8151A
< 0.483 mg/Kg 6/4/14 MDPW NDinoseb EPA 8151A
Poly-Aromatic Hydrocarbons
Completed 5/23/14 FAAW A E1Ultrasonic Extraction EPA 3550B
0.903 mg/Kg 5/28/14 EEPW ANaphthalene EPA 8270D
208 mg/Kg 5/28/14 EEPW A2-Methylnaphthalene EPA 8270D
127 mg/Kg 5/28/14 EEPW U1-Methylnaphthalene EPA 8270D
8.75 mg/Kg 5/28/14 EEPW AAcenaphthylene EPA 8270D
23.8 mg/Kg 5/28/14 EEPW AAcenaphthene EPA 8270D
106 mg/Kg 5/28/14 EEPW AFluorene EPA 8270D
2,290 mg/Kg 5/28/14 EEPW APhenanthrene EPA 8270D
116 mg/Kg 5/28/14 EEPW AAnthracene EPA 8270D
26.9 mg/Kg 5/28/14 EEPW AFluoranthene EPA 8270D
183 mg/Kg 5/28/14 EEPW APyrene EPA 8270D
7.15 mg/Kg 5/28/14 EEPW ABenzo(a)anthracene EPA 8270D
12.7 mg/Kg 5/28/14 EEPW AChrysene EPA 8270D
0.826 mg/Kg 5/28/14 EEPW ABenzo(b)fluoranthene EPA 8270D
< 0.333 mg/Kg 5/28/14 EEPW ABenzo(k)fluoranthene EPA 8270D
1.34 mg/Kg 5/28/14 EEPW ABenzo(a)pyrene EPA 8270D
< 0.333 mg/Kg 5/28/14 EEPW AIndeno(1,2,3-cd)pyrene EPA 8270D
< 0.333 mg/Kg 5/28/14 EEPW ADibenzo(a,h)anthracene EPA 8270D
0.746 mg/Kg 5/28/14 EEPW ABenzo(g,h,i)perylene EPA 8270D
2.33 mg/Kg 5/28/14 EEPW UBaP Toxic Equiv. Quotient EPA 8270D
59 % 5/28/14 EEPW UB/N Surr.1 Nitrobenzene-d5 EPA 8270D
77 % 5/28/14 EEPW UB/N Surr.2 2-Fluorobiphenyl EPA 8270D
92 % 5/28/14 EEPW UB/N Surr.3 Terphenyl-d14 EPA 8270D
> 10 5/28/14 EEPW UUnidentified Peaks EPA 8270D
71

Laboratory Report
Vanasse Hangen Brustlin, Inc.
Page 3 of 3
CLIENT:PROJECT: Velco - McGuinness Spring
WORK ORDER:DATE RECEIVED:
1405-0946605/21/2014
DATE REPORTED: 06/05/2014
Report Summary of Qualifiers and Notes
E1: Sample was received past Method specified holding times.
QA-: QA/QC associated with this analysis did not meet laboratory acceptance limits indicating the results may be
biased low.
NDA: No data available for surrogate evaluation due to interference from sample matrix.
AN1: Reporting limit increased due to sample matrix interference.
72

73

Laboratory Report
Ted McGuinessPROJECT:
DATE RECEIVED:
WORK ORDER:
DATE REPORTED:
100132
Chevalier Drilling Co., Inc.
PO Box 164
Highgate Springs, VT 05460
Atten: Claude Chevalier SAMPLER:
May 28, 2014
1405-08827
Claude
May 14, 2014
Enclosed please find the results of the analyses performed for the samples referenced on the attached chain of custody. All required method quality control elements including instrument calibration were performed in accordance with method requirements and determined to be acceptable unless otherwise noted.
The column labeled Lab/Tech in the accompanying report denotes the laboratory facility where the testing was performed and the technician who conducted the assay. A "W" designates the Williston, VT lab under NELAC certification ELAP 11263; "R" designates the Lebanon, NH facility under certification NH 2037 and “N” the Plattsburgh, NY lab under certification ELAP 11892. “Sub” indicates the testing was performed by a subcontracted laboratory. The accreditation status of the subcontracted lab is referenced in the corresponding NELAC and Qual fields.
The NELAC column also denotes the accreditation status of each laboratory for each reported parameter. “A” indicates the referenced laboratory is NELAC accredited for the parameter reported. “N” indicates the laboratory is not accredited. “U” indicates that NELAC does not offer accreditation for that parameter in that specific matrix. Test results denoted with an “A” meet all National Environmental Laboratory Accreditation Program requirements except where denoted by pertinent data qualifiers. Test results are representative of the samples as they were received at the laboratory
Endyne, Inc. warrants, to the best of its knowledge and belief, the accuracy of the analytical
test results contained in this report, but makes no other warranty, expressed or implied, especially no warranties of merchantability or fitness for a particular purpose.
Page 1 of 4
Reviewed by:
Harry B. Locker, Ph.D.
Laboratory Director
ELAP 11263
160 James Brown Dr., Williston, VT 05495
Ph 802-879-4333 Fax 802-879-7103
www.endynelabs.com
NH2037
56 Etna Road, Lebanon, NH 03766
Ph 603-678-4891 Fax 603-678-4893
74

Laboratory Report
Chevalier Drilling Co., Inc.
Page 2 of 4
CLIENT:PROJECT: Ted McGuiness
WORK ORDER:DATE RECEIVED:
1405-0882705/14/2014
DATE REPORTED: 05/28/2014
001 Date Sampled: 5/14/14Site: Tank Time: 15:15
Analysis Date/TimeMethodParameter Result NELACLab/TechUnits Qual.
< 1 MPN/100mls 17:355/14/14 KMBW ATotal Coliform SM18 9223B (97)
< 1 MPN/100mls 17:355/14/14 KMBW Ae. coli SM18 9223B (97)
2.58+/-1.15 pCi/L 5/24/14 SUBSW AGross Alpha EPA 900.0
< 0.001 mg/L 5/20/14 AWMW AArsenic, Total SM20 3113B
0.043 mg/L 5/19/14 RGTW ABarium, Total EPA 200.7
< 0.001 mg/L 5/20/14 AWMW ALead, Total SM20 3113B
VOC Potable Water
< 0.5 ug/L 5/15/14 SJMW ADichlorodifluoromethane EPA 524.2
< 0.5 ug/L 5/15/14 SJMW AChloromethane EPA 524.2
< 0.5 ug/L 5/15/14 SJMW AVinyl chloride EPA 524.2
< 0.5 ug/L 5/15/14 SJMW ABromomethane EPA 524.2
< 0.5 ug/L 5/15/14 SJMW AChloroethane EPA 524.2
< 0.5 ug/L 5/15/14 SJMW ATrichlorofluoromethane EPA 524.2
< 0.5 ug/L 5/15/14 SJMW A1,1-Dichloroethene EPA 524.2
< 0.5 ug/L 5/15/14 SJMW AMethylene chloride EPA 524.2
< 0.5 ug/L 5/15/14 SJMW AMethyl-t-butyl ether (MTBE) EPA 524.2
< 0.5 ug/L 5/15/14 SJMW Atrans-1,2-Dichloroethene EPA 524.2
< 0.5 ug/L 5/15/14 SJMW A1,1-Dichloroethane EPA 524.2
< 0.5 ug/L 5/15/14 SJMW A2,2-Dichloropropane EPA 524.2
< 0.5 ug/L 5/15/14 SJMW Acis-1,2-Dichloroethene EPA 524.2
< 0.5 ug/L 5/15/14 SJMW ABromochloromethane EPA 524.2
< 0.5 ug/L 5/15/14 SJMW AChloroform EPA 524.2
< 0.5 ug/L 5/15/14 SJMW A1,1,1-Trichloroethane EPA 524.2
< 0.5 ug/L 5/15/14 SJMW ACarbon tetrachloride EPA 524.2
< 0.5 ug/L 5/15/14 SJMW A1,1-Dichloropropene EPA 524.2
< 0.5 ug/L 5/15/14 SJMW ABenzene EPA 524.2
< 0.5 ug/L 5/15/14 SJMW A1,2-Dichloroethane EPA 524.2
< 0.5 ug/L 5/15/14 SJMW ATrichloroethene EPA 524.2
< 0.5 ug/L 5/15/14 SJMW A1,2-Dichloropropane EPA 524.2
< 0.5 ug/L 5/15/14 SJMW ADibromomethane EPA 524.2
< 0.5 ug/L 5/15/14 SJMW ABromodichloromethane EPA 524.2
< 0.5 ug/L 5/15/14 SJMW Acis-1,3-Dichloropropene EPA 524.2
1.4 ug/L 5/15/14 SJMW AToluene EPA 524.2
< 0.5 ug/L 5/15/14 SJMW Atrans-1,3-Dichloropropene EPA 524.2
< 0.5 ug/L 5/15/14 SJMW A1,1,2-Trichloroethane EPA 524.2
< 0.5 ug/L 5/15/14 SJMW ATetrachloroethene EPA 524.2
< 0.5 ug/L 5/15/14 SJMW A1,3-Dichloropropane EPA 524.2
< 0.5 ug/L 5/15/14 SJMW ADibromochloromethane EPA 524.2
< 0.5 ug/L 5/15/14 SJMW AChlorobenzene EPA 524.2
< 0.5 ug/L 5/15/14 SJMW AEthylbenzene EPA 524.2
< 0.5 ug/L 5/15/14 SJMW A1,1,1,2-Tetrachloroethane EPA 524.2
< 1.0 ug/L 5/15/14 SJMW AXylenes, Total EPA 524.2
< 0.5 ug/L 5/15/14 SJMW AStyrene EPA 524.2
< 0.5 ug/L 5/15/14 SJMW ABromoform EPA 524.2
< 0.5 ug/L 5/15/14 SJMW AIsopropylbenzene EPA 524.2
< 0.5 ug/L 5/15/14 SJMW A1,1,2,2-Tetrachloroethane EPA 524.2
75

Laboratory Report
Chevalier Drilling Co., Inc.
Page 3 of 4
CLIENT:PROJECT: Ted McGuiness
WORK ORDER:DATE RECEIVED:
1405-0882705/14/2014
DATE REPORTED: 05/28/2014
001 Date Sampled: 5/14/14Site: Tank Time: 15:15
Analysis Date/TimeMethodParameter Result NELACLab/TechUnits Qual.
< 0.5 ug/L 5/15/14 SJMW ABromobenzene EPA 524.2
< 0.5 ug/L 5/15/14 SJMW An-Propylbenzene EPA 524.2
< 0.5 ug/L 5/15/14 SJMW A1,2,3-Trichloropropane EPA 524.2
< 0.5 ug/L 5/15/14 SJMW A2-Chlorotoluene EPA 524.2
< 0.5 ug/L 5/15/14 SJMW A1,3,5-Trimethylbenzene EPA 524.2
< 0.5 ug/L 5/15/14 SJMW A4-Chlorotoluene EPA 524.2
< 0.5 ug/L 5/15/14 SJMW At-Butylbenzene EPA 524.2
< 0.5 ug/L 5/15/14 SJMW A1,2,4-Trimethylbenzene EPA 524.2
< 0.5 ug/L 5/15/14 SJMW As-Butylbenzene EPA 524.2
< 0.5 ug/L 5/15/14 SJMW A4-Isopropyltoluene EPA 524.2
< 0.5 ug/L 5/15/14 SJMW A1,3-Dichlorobenzene EPA 524.2
< 0.5 ug/L 5/15/14 SJMW A1,4-Dichlorobenzene EPA 524.2
< 0.5 ug/L 5/15/14 SJMW An-Butylbenzene EPA 524.2
< 0.5 ug/L 5/15/14 SJMW A1,2-Dichlorobenzene EPA 524.2
< 0.5 ug/L 5/15/14 SJMW A1,2,4-Trichlorobenzene EPA 524.2
< 0.5 ug/L 5/15/14 SJMW AHexachlorobutadiene EPA 524.2
< 0.5 ug/L 5/15/14 SJMW ANaphthalene EPA 524.2
< 0.5 ug/L 5/15/14 SJMW A1,2,3-Trichlorobenzene EPA 524.2
101 % 5/15/14 SJMW ASurr. 1 (4-Bromofluorobenzene) EPA 524.2
102 % 5/15/14 SJMW ASurr. 2 (1,2-Dichlorobenzene d4) EPA 524.2
PHENOXY-ACID HERBICIDES
Completed 5/15/14 MDPW A515 Extraction EPA 515.4
< 15.0 ug/L 5/15/14 MDPW A AN1Dalapon EPA 515.4
< 10.0 ug/L 5/15/14 MDPW ADicamba EPA 515.4
< 5.0 ug/L 5/15/14 MDPW A2,4-D EPA 515.4
< 0.5 ug/L 5/15/14 MDPW APentachlorophenol EPA 515.4
< 2.0 ug/L 5/15/14 MDPW A2,4,5-TP (Silvex) EPA 515.4
< 3.0 ug/L 5/15/14 MDPW U2,4,5-T EPA 515.4
< 5.0 ug/L 5/15/14 MDPW APicloram EPA 515.4
< 3.0 ug/L 5/15/14 MDPW ADinoseb EPA 515.4
57 % 5/15/14 MDPW A QS-Surrogate-DCAA EPA 515.4
002 Date Sampled: 5/16/14Site: Tank Time: 14:30
Analysis Date/TimeMethodParameter Result NELACLab/TechUnits Qual.
PHENOXY-ACID HERBICIDES
Completed 5/19/14 MDPW A515 Extraction EPA 515.4
< 15.0 ug/L 5/19/14 MDPW ADalapon EPA 515.4
< 10.0 ug/L 5/19/14 MDPW ADicamba EPA 515.4
< 5.0 ug/L 5/19/14 MDPW A2,4-D EPA 515.4
< 0.5 ug/L 5/19/14 MDPW APentachlorophenol EPA 515.4
< 2.0 ug/L 5/19/14 MDPW A2,4,5-TP (Silvex) EPA 515.4
< 3.0 ug/L 5/19/14 MDPW U2,4,5-T EPA 515.4
< 5.0 ug/L 5/19/14 MDPW APicloram EPA 515.4
< 3.0 ug/L 5/19/14 MDPW ADinoseb EPA 515.4
73 % 5/19/14 MDPW ASurrogate-DCAA EPA 515.4
76

Laboratory Report
Chevalier Drilling Co., Inc.
Page 4 of 4
CLIENT:PROJECT: Ted McGuiness
WORK ORDER:DATE RECEIVED:
1405-0882705/14/2014
DATE REPORTED: 05/28/2014
Report Summary of Qualifiers and Notes
This report is also submitted to the Vermont Department of Health, as mandated by VT regulations (ACT 163) effective
January 1, 2013.
Property:
Rotary Rd
Monkton, VT
AN1: The Laboratory Fortified Blank recovery for this element was less than the 70% acceptance criteria indicating
that the sample result may be biased low. A matrix spike analysis with the same spiking solution as the LFB was
performed on the sample with passing results.
QS-: Surrogate associated with this analysis did not meet laboratory acceptance limits indicating the results may be
biased low.
SPA: Analysis performed by subcontracted laboratory, Pace Analytical, VT-0282. The complete
subcontracted report has been appended to this report.
77
#=CL#
May 28, 2014
LIMS USE: FR - EILEEN TOOMEY
LIMS OBJECT ID: 30120810
30120810
Project:
Pace Project No.:
RE:
Ms. Eileen ToomeyEndyne, Inc.160 James Brown DriveWilliston, VT 05495
1405-08827
Dear Ms. Toomey:
Enclosed are the analytical results for sample(s) received by the laboratory on May 19, 2014. Theresults relate only to the samples included in this report. Results reported herein conform to themost current TNI standards and the laboratory's Quality Assurance Manual, where applicable, unlessotherwise noted in the body of the report.
If you have any questions concerning this report, please feel free to contact me.
Sincerely,
Jacquelyn Collins
Project Manager
Enclosures
cc: Mr. Mark Fausel, Endyne, Inc.
REPORT OF LABORATORY ANALYSIS
This report shall not be reproduced, except in full,
without the written consent of Pace Analytical Services, Inc..
Pace Analytical Services, Inc.
1638 Roseytown Road - Suites 2,3,4
Greensburg, PA 15601
(724)850-5600
Page 1 of 11
78

#=CP#
CERTIFICATIONS
Pace Project No.:
Project:
30120810
1405-08827
Pennsylvania Certification IDs1638 Roseytown Rd Suites 2,3&4 Greensburg, PA 15601ACLASS DOD-ELAP Accreditation #: ADE-1544Alabama Certification #: 41590Arizona Certification #: AZ0734Arkansas CertificationCalifornia/TNI Certification #: 04222CAColorado CertificationConnecticut Certification #: PH-0694Delaware CertificationFlorida/TNI Certification #: E87683Guam/PADEP CertificationHawaii/PADEP CertificationIdaho CertificationIllinois/PADEP CertificationIndiana/PADEP CertificationIowa Certification #: 391Kansas/TNI Certification #: E-10358Kentucky Certification #: 90133Louisiana DHH/TNI Certification #: LA140008Louisiana DEQ/TNI Certification #: 4086Maine Certification #: PA00091Maryland Certification #: 308Massachusetts Certification #: M-PA1457Michigan/PADEP CertificationMissouri Certification #: 235
Montana Certification #: Cert 0082Nebraska Certification #: NE-05-29-14Nevada CertificationNew Hampshire/TNI Certification #: 2976New Jersey/TNI Certification #: PA 051New Mexico CertificationNew York/TNI Certification #: 10888North Carolina Certification #: 42706North Dakota Certification #: R-190Oregon/TNI Certification #: PA200002Pennsylvania/TNI Certification #: 65-00282Puerto Rico Certification #: PA01457South Dakota CertificationTennessee Certification #: TN2867Texas/TNI Certification #: T104704188Utah/TNI Certification #: PA014572014-4Vermont Dept. of Health: ID# VT-0282Virgin Island/PADEP CertificationVirginia/VELAP Certification #: 460198Washington Certification #: C868West Virginia DEP Certification #: 143West Virginia DHHR Certification #: 9964CWisconsin/PADEP CertificationWyoming Certification #: 8TMS-Q
REPORT OF LABORATORY ANALYSIS
This report shall not be reproduced, except in full,
without the written consent of Pace Analytical Services, Inc..
Pace Analytical Services, Inc.
1638 Roseytown Road - Suites 2,3,4
Greensburg, PA 15601
(724)850-5600
Page 2 of 11
79

#=SS#
SAMPLE SUMMARY
Pace Project No.:
Project:
30120810
1405-08827
Lab ID Sample ID Matrix Date Collected Date Received
30120810001 1405-08827 001 Tank Drinking Water 05/14/14 15:15 05/19/14 09:45
REPORT OF LABORATORY ANALYSIS
This report shall not be reproduced, except in full,
without the written consent of Pace Analytical Services, Inc..
Pace Analytical Services, Inc.
1638 Roseytown Road - Suites 2,3,4
Greensburg, PA 15601
(724)850-5600
Page 3 of 11
80
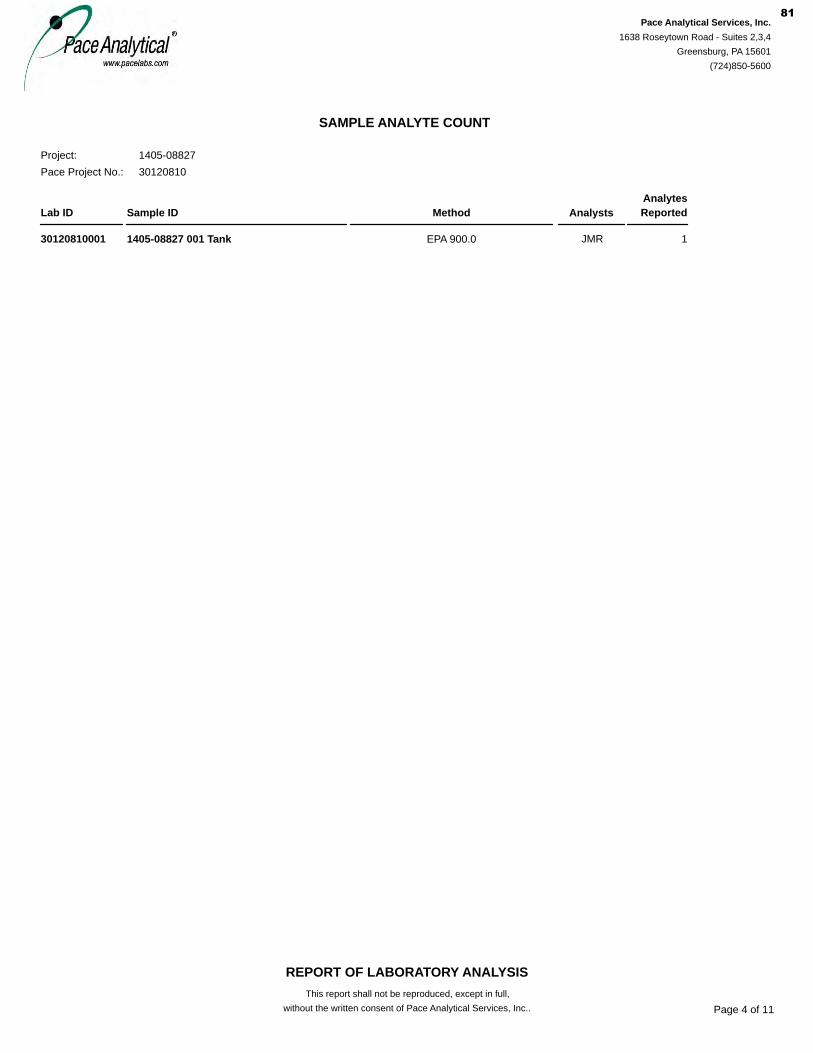
#=SA#
SAMPLE ANALYTE COUNT
Pace Project No.:
Project:
30120810
1405-08827
Lab ID Sample ID Method
Analytes
ReportedAnalysts
30120810001 1405-08827 001 Tank EPA 900.0 1JMR
REPORT OF LABORATORY ANALYSIS
This report shall not be reproduced, except in full,
without the written consent of Pace Analytical Services, Inc..
Pace Analytical Services, Inc.
1638 Roseytown Road - Suites 2,3,4
Greensburg, PA 15601
(724)850-5600
Page 4 of 11
81

#=NA#
PROJECT NARRATIVE
Pace Project No.:
Project:
30120810
1405-08827
Method:
Client: Endyne, Inc.
EPA 900.0
Date: May 28, 2014
Description: 900.0 Gross Alpha/Beta
General Information:
1 sample was analyzed for EPA 900.0. All samples were received in acceptable condition with any exceptions noted below.
Hold Time:
The samples were analyzed within the method required hold times with any exceptions noted below.
Method Blank:
All analytes were below the report limit in the method blank, where applicable, with any exceptions noted below.
Laboratory Control Spike:
All laboratory control spike compounds were within QC limits with any exceptions noted below.
Matrix Spikes:
All percent recoveries and relative percent differences (RPDs) were within acceptance criteria with any exceptions noted below.
Additional Comments:
This data package has been reviewed for quality and completeness and is approved for release.
REPORT OF LABORATORY ANALYSIS
This report shall not be reproduced, except in full,
without the written consent of Pace Analytical Services, Inc..
Pace Analytical Services, Inc.
1638 Roseytown Road - Suites 2,3,4
Greensburg, PA 15601
(724)850-5600
Page 5 of 11
82

#=AR#
ANALYTICAL RESULTS
Pace Project No.:
Project:
30120810
1405-08827
Sample: 1405-08827 001 Tank Lab ID: 30120810001 Collected: 05/14/14 15:15 Received: 05/19/14 09:45 Matrix: Drinking Water
Parameters Act ± Unc (MDC) Carr Trac Units Analyzed CAS No. QualMethod
PWS: Site ID: Sample Type:
Gross Alpha 2.58 ± 1.15 (1.74)C:NA T:NA
pCi/L 05/24/14 14:40 12587-46-1EPA 900.0
REPORT OF LABORATORY ANALYSIS
This report shall not be reproduced, except in full,
without the written consent of Pace Analytical Services, Inc..Date: 05/28/2014 11:59 AM
Pace Analytical Services, Inc.
1638 Roseytown Road - Suites 2,3,4
Greensburg, PA 15601
(724)850-5600
Page 6 of 11
83

#=QC#
QUALITY CONTROL DATA
Pace Project No.:
Project:
30120810
1405-08827
Results presented on this page are in the units indicated by the "Units" column except where an alternate unit is presented to the right of the result.
QC Batch:
QC Batch Method:
Analysis Method:
Analysis Description:
RADC/19857
EPA 900.0
EPA 900.0
900.0 Gross Alpha/Beta
Associated Lab Samples: 30120810001
Parameter UnitsAct ± Unc (MDC) Carr Trac Qualifiers
METHOD BLANK: 732754
Associated Lab Samples: 30120810001
Matrix: Water
Analyzed
Gross Alpha pCi/L 05/24/14 14:380.821 ± 0.430 (0.536) C:NA T:NA
REPORT OF LABORATORY ANALYSIS
This report shall not be reproduced, except in full,
without the written consent of Pace Analytical Services, Inc..Date: 05/28/2014 11:59 AM
Pace Analytical Services, Inc.
1638 Roseytown Road - Suites 2,3,4
Greensburg, PA 15601
(724)850-5600
Page 7 of 11
84

#=QL#
QUALIFIERS
Pace Project No.:
Project:
30120810
1405-08827
DEFINITIONS
DF - Dilution Factor, if reported, represents the factor applied to the reported data due to changes in sample preparation, dilution ofthe sample aliquot, or moisture content.
ND - Not Detected at or above adjusted reporting limit.
J - Estimated concentration above the adjusted method detection limit and below the adjusted reporting limit.
MDL - Adjusted Method Detection Limit.
PRL - Pace Reporting Limit.
RL - Reporting Limit.
S - Surrogate
1,2-Diphenylhydrazine (8270 listed analyte) decomposes to Azobenzene.
Consistent with EPA guidelines, unrounded data are displayed and have been used to calculate % recovery and RPD values.
LCS(D) - Laboratory Control Sample (Duplicate)
MS(D) - Matrix Spike (Duplicate)
DUP - Sample Duplicate
RPD - Relative Percent Difference
NC - Not Calculable.
SG - Silica Gel - Clean-Up
U - Indicates the compound was analyzed for, but not detected.
N-Nitrosodiphenylamine decomposes and cannot be separated from Diphenylamine using Method 8270. The result reported foreach analyte is a combined concentration.
Act - Activity
Unc - Uncertainty: SDWA = 1.96 sigma count uncertainty, all other matrices = Expanded Uncertainty (95% confidence interval).Gamma Spec = Expanded Uncertainty (95.4% Confidence Interval)
(MDC) - Minimum Detectable Concentration
Trac - Tracer Recovery (%)
Carr - Carrier Recovery (%)
Pace Analytical is TNI accredited. Contact your Pace PM for the current list of accredited analytes.
TNI - The NELAC Institute.
REPORT OF LABORATORY ANALYSIS
This report shall not be reproduced, except in full,
without the written consent of Pace Analytical Services, Inc..Date: 05/28/2014 11:59 AM
Pace Analytical Services, Inc.
1638 Roseytown Road - Suites 2,3,4
Greensburg, PA 15601
(724)850-5600
Page 8 of 11
85
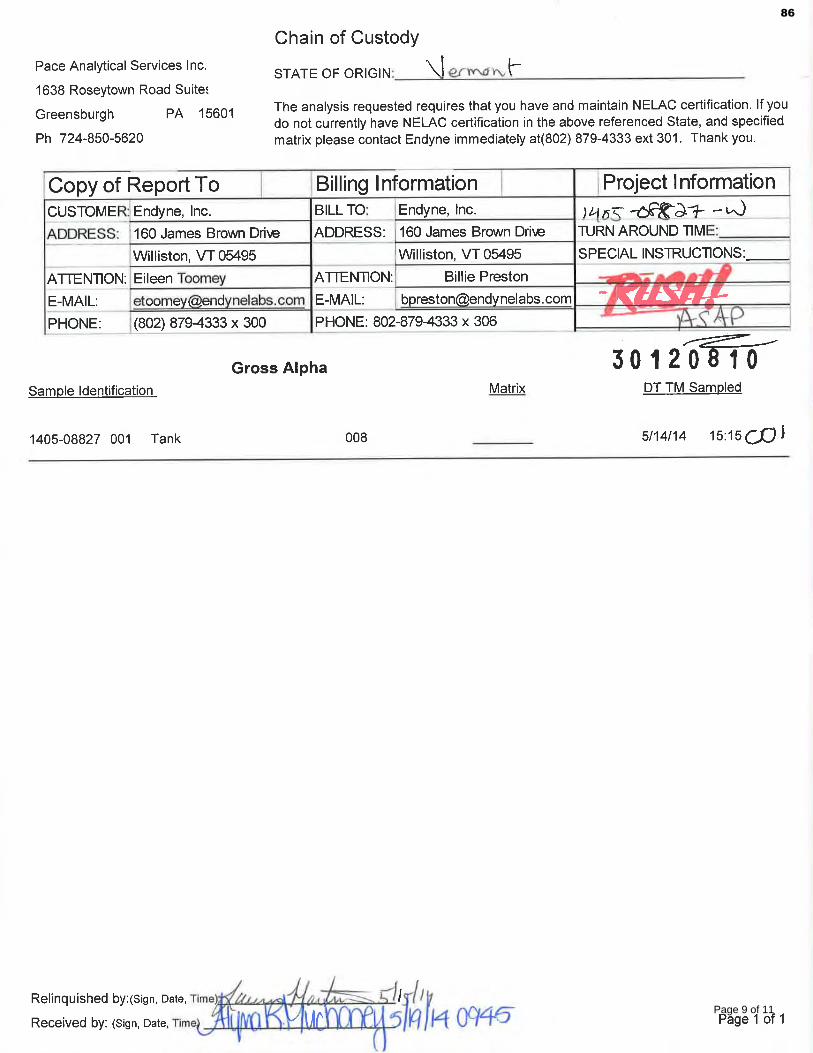
Page 9 of 11
86

Page 10 of 11
87

Page 11 of 11
88

89
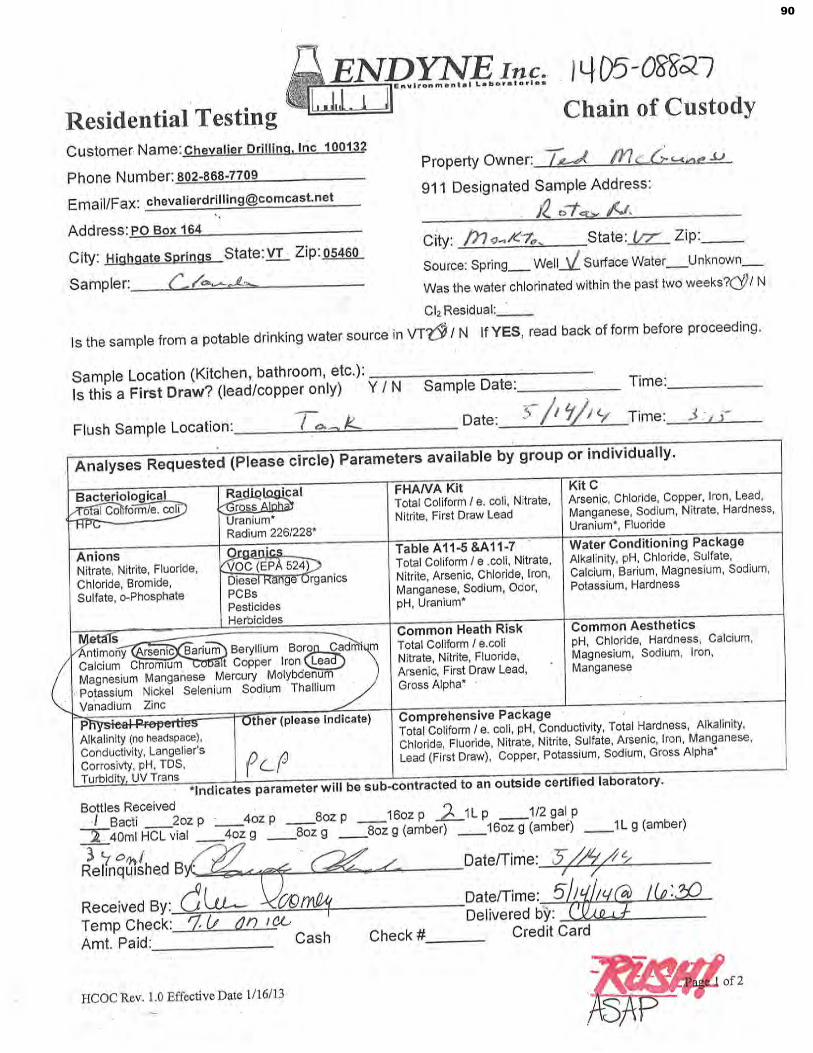
90

91

Laboratory Report
McGuiness Water SupplyPROJECT:
DATE RECEIVED:
WORK ORDER:
DATE REPORTED:
300037VELCO
366 Pinnacle Ridge Road
Rutland, VT 05701
Atten: Jake Reed SAMPLER:
April 22, 2014
1404-06775
Jason Smith
April 17, 2014
Enclosed please find the results of the analyses performed for the samples referenced on the attached chain of custody located at the end of this report.
The column labeled Lab/Tech in the accompanying report denotes the laboratory facility where the testing was performed and the technician who conducted the assay. A "W" designates the Williston, VT lab under NELAC certification ELAP 11263; "R" designates the Lebanon, NH facility under certification NH 2037 and “N” the Plattsburgh, NY lab under certification ELAP 11892. “Sub” indicates the testing was performed by a subcontracted laboratory. The accreditation status of the subcontracted lab is referenced in the corresponding NELAC and Qual fields.
This NELAC column also denotes the accreditation status of each laboratory for each
reported parameter. “A” indicates the referenced laboratory is NELAC accredited for the parameter reported. “N” indicates the laboratory is not accredited. “U” indicates that NELAC does not offer accreditation for that parameter in that specific matrix. Test results denoted with an “A” meet all National Environmental Laboratory Accreditation Program requirements except where denoted by pertinent data qualifiers. Test results are representative of the samples as they were received at the laboratory.
Endyne, Inc. warrants, to the best of its knowledge and belief, the accuracy of the analytical
test results contained in this report, but makes no other warranty, expressed or implied, especially no warranties of merchantability or fitness for a particular purpose.
Reviewed by:
Harry B. Locker, Ph.D.
Laboratory Director
160 James Brown Dr., Williston, VT 05495
Ph 802-879-4333 Fax 802-879-7103 ELAP 11263
www.endynelabs.com
NH203756 Etna Road, Lebanon, NH 03755
Ph 603-678-4891 Fax 603-678-4893
92
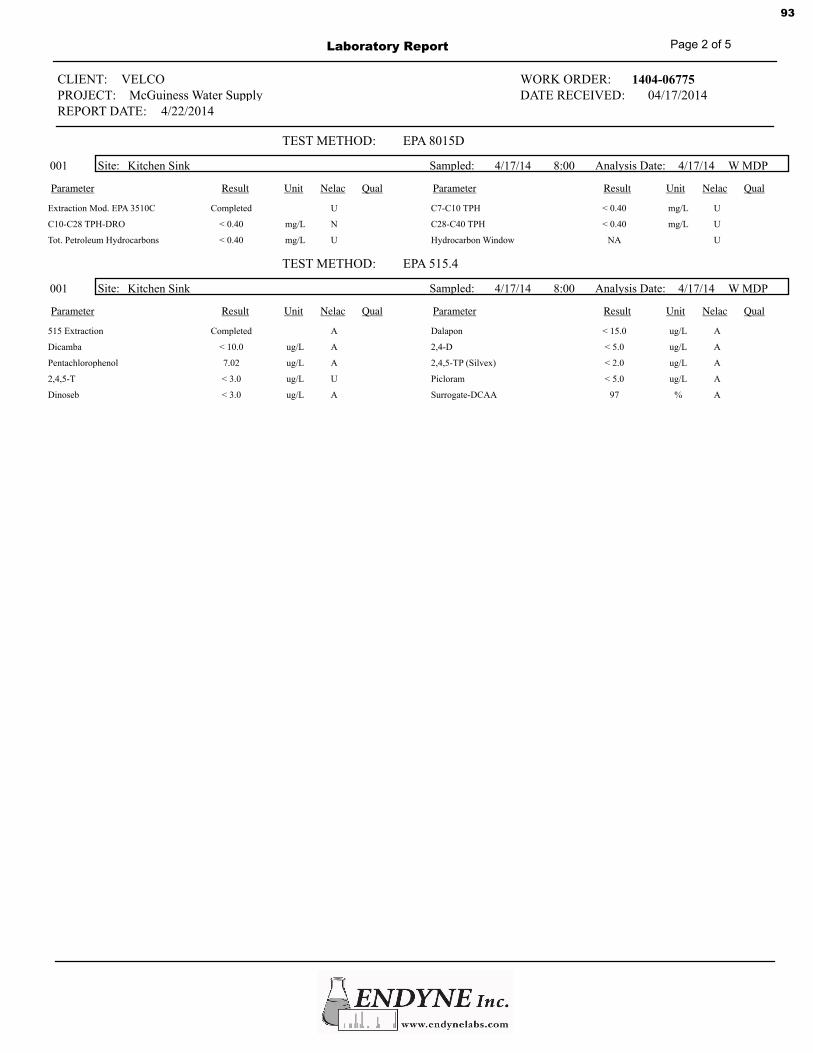
Laboratory Report
VELCO
Page 2 of 5
CLIENT:PROJECT: McGuiness Water Supply
WORK ORDER:DATE RECEIVED:
1404-0677504/17/2014
4/22/2014REPORT DATE:
001 Sampled: 4/17/14Site: Kitchen Sink 4/17/14 MDPWAnalysis Date:
QualNelac
Result
UnitResult
Result
ParameterQualNelac
Result
UnitResult
Result
Parameter
TEST METHOD: EPA 8015D
8:00
UExtraction Mod. EPA 3510C Completed Umg/LC7-C10 TPH < 0.40
Nmg/LC10-C28 TPH-DRO < 0.40 Umg/LC28-C40 TPH < 0.40
Umg/LTot. Petroleum Hydrocarbons < 0.40 UHydrocarbon Window NA
001 Sampled: 4/17/14Site: Kitchen Sink 4/17/14 MDPWAnalysis Date:
QualNelac
Result
UnitResult
Result
ParameterQualNelac
Result
UnitResult
Result
Parameter
TEST METHOD: EPA 515.4
8:00
A515 Extraction Completed Aug/LDalapon < 15.0
Aug/LDicamba < 10.0 Aug/L2,4-D < 5.0
Aug/LPentachlorophenol 7.02 Aug/L2,4,5-TP (Silvex) < 2.0
Uug/L2,4,5-T < 3.0 Aug/LPicloram < 5.0
Aug/LDinoseb < 3.0 A%Surrogate-DCAA 97
93

Laboratory Report
VELCO
Page 3 of 5
CLIENT:PROJECT: McGuiness Water Supply
WORK ORDER:DATE RECEIVED:
1404-0677504/17/2014
4/22/2014REPORT DATE:
001 Sampled: 4/17/14Site: Kitchen Sink 4/17/14 SJMWAnalysis Date:
QualNelac
Result
UnitResult
Result
ParameterQualNelac
Result
UnitResult
Result
Parameter
TEST METHOD: EPA 524.2
8:00
Aug/LDichlorodifluoromethane < 0.5 Aug/LChloromethane < 0.5
Aug/LVinyl chloride < 0.5 Aug/LBromomethane < 0.5
Aug/LChloroethane < 0.5 Aug/LTrichlorofluoromethane < 0.5
Aug/L1,1-Dichloroethene < 0.5 Aug/LMethylene chloride < 1.0
Aug/LMethyl-t-butyl ether (MTBE) < 0.5 Aug/Ltrans-1,2-Dichloroethene < 0.5
Aug/L1,1-Dichloroethane < 0.5 Aug/L2,2-Dichloropropane < 0.5
Aug/Lcis-1,2-Dichloroethene < 0.5 Aug/LBromochloromethane < 0.5
Aug/LChloroform < 0.5 Aug/L1,1,1-Trichloroethane < 0.5
Aug/LCarbon tetrachloride < 0.5 Aug/L1,1-Dichloropropene < 0.5
Aug/LBenzene < 0.5 Aug/L1,2-Dichloroethane < 0.5
Aug/LTrichloroethene < 0.5 Aug/L1,2-Dichloropropane < 0.5
Aug/LDibromomethane < 0.5 Aug/LBromodichloromethane < 0.5
Aug/Lcis-1,3-Dichloropropene < 0.5 Aug/LToluene < 0.5
Aug/Ltrans-1,3-Dichloropropene < 0.5 Aug/L1,1,2-Trichloroethane < 0.5
Aug/LTetrachloroethene < 0.5 Aug/L1,3-Dichloropropane < 0.5
Aug/LDibromochloromethane < 0.5 Aug/LChlorobenzene < 0.5
Aug/LEthylbenzene < 0.5 Aug/L1,1,1,2-Tetrachloroethane < 0.5
Aug/LXylenes, Total < 1.0 Aug/LStyrene < 0.5
Aug/LBromoform < 0.5 Aug/LIsopropylbenzene < 0.5
Aug/L1,1,2,2-Tetrachloroethane < 0.5 Aug/LBromobenzene < 0.5
Aug/Ln-Propylbenzene < 0.5 Aug/L1,2,3-Trichloropropane < 0.5
Aug/L2-Chlorotoluene < 0.5 Aug/L1,3,5-Trimethylbenzene < 0.5
Aug/L4-Chlorotoluene < 0.5 Aug/Lt-Butylbenzene < 0.5
Aug/L1,2,4-Trimethylbenzene < 0.5 Aug/Ls-Butylbenzene < 0.5
Aug/L4-Isopropyltoluene < 0.5 Aug/L1,3-Dichlorobenzene < 0.5
Aug/L1,4-Dichlorobenzene < 0.5 Aug/Ln-Butylbenzene < 0.5
Aug/L1,2-Dichlorobenzene < 0.5 Aug/L1,2,4-Trichlorobenzene < 0.5
Aug/LHexachlorobutadiene < 0.5 Aug/LNaphthalene < 0.5
Aug/L1,2,3-Trichlorobenzene < 0.5 A%Surr. 1 (4-Bromofluorobenzene) 103
A%Surr. 2 (1,2-Dichlorobenzene d4) 105
94

Laboratory Report
VELCO
Page 4 of 5
CLIENT:PROJECT: McGuiness Water Supply
WORK ORDER:DATE RECEIVED:
1404-0677504/17/2014
4/22/2014REPORT DATE:
002 Sampled: 4/17/14Site: Kitchen Sink 4/17/14 FAAWAnalysis Date:
QualNelac
Result
UnitResult
Result
ParameterQualNelac
Result
UnitResult
Result
Parameter
TEST METHOD: EPA 8270D
10:40
AExtraction EPA 3510C Extracted Aug/LN-Nitrosodimethylamine < 10.0
Aug/LPyridine < 10.0 Nug/LAniline < 10.0
Aug/LBis(2-chloroethyl)ether < 5.0 Aug/L1,2-Dichlorobenzene < 2.0
Aug/L1,3-Dichlorobenzene < 2.0 Aug/L1,4-Dichlorobenzene < 2.0
Nug/LBenzyl alcohol < 20.0 Nug/LBis(2-chloroisopropyl)ether < 10.0
Aug/LN-Nitrosodi-n-propylamine < 10.0 Aug/LHexachloroethane < 5.0
Aug/LNitrobenzene < 5.0 Nug/LN-Nitrosopiperidine < 10.0
Aug/LIsophorone < 2.0 Aug/LBis(2-chloroethoxy)methane < 5.0
Aug/L1,2,4-Trichlorobenzene < 2.0 Aug/LNaphthalene < 1.0
Nug/L4-Chloroaniline < 5.0 Aug/LHexachlorobutadiene < 5.0
Nug/LN-Nitrosodi-n-butylamine < 5.0 Aug/L2-Methylnaphthalene 6.2
Uug/L1-Methylnaphthalene 3.2 Aug/LHexachlorocyclopentadiene < 20.0
Aug/L2-Chloronaphthalene < 2.0 Nug/L1-Chloronaphthalene < 2.0
Nug/L2-Nitroaniline < 20.0 Aug/LDimethyl phthalate < 5.0
Aug/L2,6-Dinitrotoluene < 5.0 Aug/LAcenaphthylene < 1.0
Nug/L3-Nitroaniline < 5.0 Aug/LAcenaphthene < 1.0
Nug/LDibenzofuran < 2.0 Aug/L2,4-Dinitrotoluene < 5.0
Nug/L1-Naphthylamine < 10.0 Nug/L2-Naphthylamine < 10.0
Aug/LFluorene 1.3 Aug/LDiethyl phthalate < 5.0
Aug/L4-Chlorophenyl phenyl ether < 2.0 Nug/L4-Nitroaniline < 20.0
Aug/LN-Nitrosodiphenylamine < 5.0 Uug/LAzobenzene < 5.0
Aug/L4-Bromophenyl phenyl ether < 2.0 Aug/LHexachlorobenzene < 5.0
Nug/LPhenanthrene 21.4 Aug/LAnthracene 1.1
Nug/LCarbazole < 5.0 Aug/LDi-n-butylphthalate < 10.0
Aug/LFluoranthene < 1.0 Aug/LBenzidine < 10.0
Aug/LPyrene < 1.0 Aug/LButyl benzyl phthalate < 5.0
Aug/LBenzo(a)anthracene < 1.0 Aug/LChrysene < 1.0
Aug/L3,3'-Dichlorobenzidine < 5.0 Aug/LBis(2-ethylhexyl)phthalate < 5.0
Nug/LDi-n-octylphthalate < 5.0 Aug/LBenzo(b)fluoranthene < 1.0
Aug/LBenzo(k)fluoranthene < 1.0 Aug/LBenzo(a)pyrene < 1.0
Aug/LIndeno(1,2,3-cd)pyrene < 1.0 Aug/LDibenzo(a,h)anthracene < 1.0
Aug/LBenzo(g,h,i)perylene < 1.0 Aug/LPhenol < 5.0
Aug/L2-Chlorophenol < 5.0 Aug/L2-Methylphenol (o-cresol) < 5.0
Aug/L3&4-Methylphenol (m&p-cresol) < 5.0 Aug/LCresols, Total < 10.0
Aug/L2-Nitrophenol < 10.0 Aug/L2,4-Dimethylphenol < 5.0
Aug/L2,4-Dichlorophenol < 5.0 Nug/L2,6-Dichlorophenol < 5.0
Aug/L4-Chloro-3-methylphenol < 10.0 Aug/L2,4,5-Trichlorophenol < 10.0
Aug/L2,4,6-Trichlorophenol < 10.0 Aug/L2,4-Dinitrophenol < 20.0
Aug/L4-Nitrophenol < 10.0 Aug/L4,6-Dinitro-2-methylphenol < 20.0
Aug/LPentachlorophenol < 10.0 Uug/LBaP Toxic Equiv. Quotient < 2.3
N%B/N Surr.1 Nitrobenzene-d5 73 N%B/N Surr.2 2-Fluorobiphenyl 83
N%B/N Surr.3 Terphenyl-d14 112 N%Acid Surr.1 2-Fluorophenol 34
N%Acid Surr.2 Phenol-d8 24 N%Acid Surr.3 Tribromophenol 86
UUnidentified Peaks > 10
95
Laboratory Report
VELCO
Page 5 of 5
CLIENT:PROJECT: McGuiness Water Supply
WORK ORDER:DATE RECEIVED:
1404-0677504/17/2014
4/22/2014REPORT DATE:
Report Summary of Qualifiers and Notes
This report is also submitted to the Vermont Department of Health, as mandated by VT regulations (ACT 163) effective
January 1, 2013.
96

97

98

99

100

101