Embed Size (px)
Citation preview

Investigation on the Sourcesand Fates of Marine Refuse
in Hong Kong
Study Report
April 2015
Environmental Protection Department


319475 ENP ENL 03/09 V6r
P:\Hong Kong\ENL\PROJECTS\319475_Marine Refuse\03Deliverables\09 Executive Summary\Rev 8\20150409 Received from
February 2015
Investigation on the Sources and Fates of Marine Refuse in H
Study Report
Investigation on the Sources and Fates of Marine Refuse in Hong Kong
Study Report
April 2015
Environmental Protection Department
Mott MacDonald, 20/F AIA Kowloon Tower, Landmark East, 100 How Ming Street, Kwun Tong, Kowloon, Hong Kong
T +852 2828 5757 F +852 2827 1823 W www.mottmac.com

319475/ENP/ENL/03/09/V6r February 2015 P:\Hong Kong\ENL\PROJECTS\319475_Marine Refuse\03 Deliverables\09 Executive Summary\Rev.8\20150409 Received from EPD\StudyReport(ENG)v8a_20150408.docx
Investigation on the Sources and Fates of Marine Refuse in Hong Kong Study Report
Chapter Title Page
Study Report 1
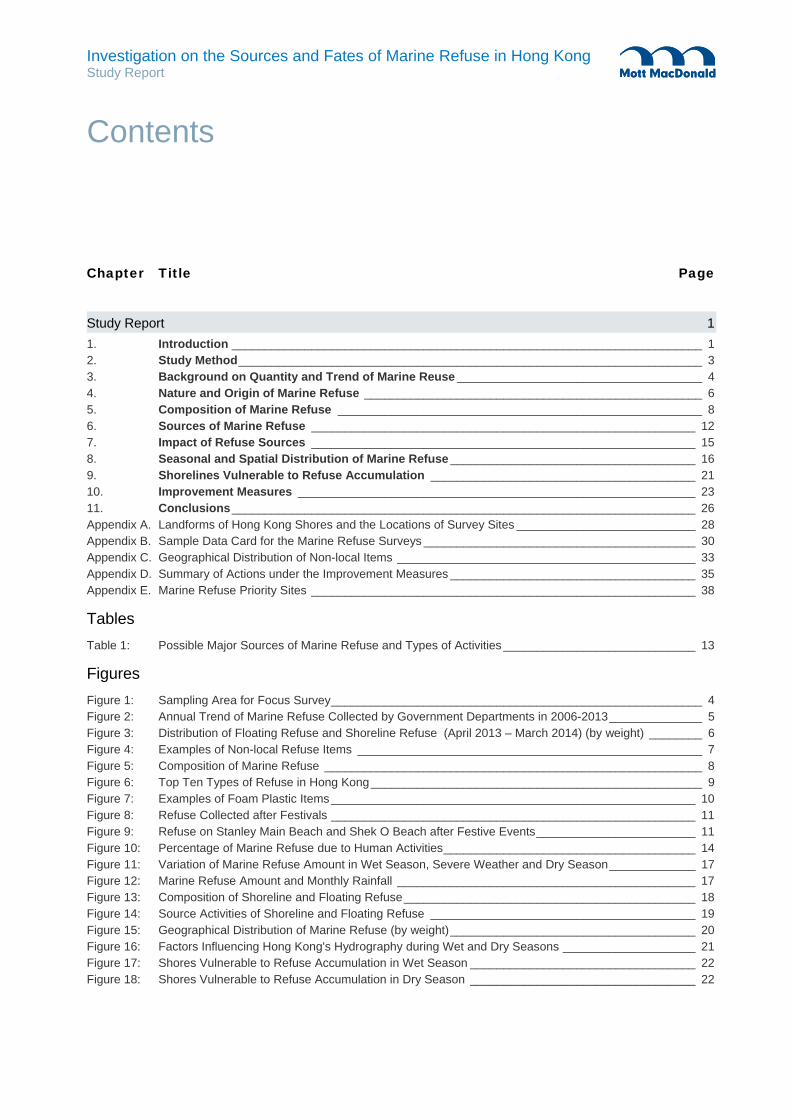
1. Introduction _______________________________________________________________________ 12. Study Method ______________________________________________________________________ 33. Background on Quantity and Trend of Marine Reuse _____________________________________ 44. Nature and Origin of Marine Refuse ___________________________________________________ 65. Composition of Marine Refuse _______________________________________________________ 86. Sources of Marine Refuse __________________________________________________________ 127. Impact of Refuse Sources __________________________________________________________ 158. Seasonal and Spatial Distribution of Marine Refuse _____________________________________ 169. Shorelines Vulnerable to Refuse Accumulation ________________________________________ 2110. Improvement Measures ____________________________________________________________ 2311. Conclusions ______________________________________________________________________ 26Appendix A. Landforms of Hong Kong Shores and the Locations of Survey Sites ___________________________ 28Appendix B. Sample Data Card for the Marine Refuse Surveys _________________________________________ 30Appendix C. Geographical Distribution of Non-local Items _____________________________________________ 33Appendix D. Summary of Actions under the Improvement Measures _____________________________________ 35Appendix E. Marine Refuse Priority Sites __________________________________________________________ 38
Tables
Table 1: Possible Major Sources of Marine Refuse and Types of Activities _____________________________ 13
Figures
Figure 1: Sampling Area for Focus Survey ________________________________________________________ 4Figure 2: Annual Trend of Marine Refuse Collected by Government Departments in 2006-2013 ______________ 5Figure 3: Distribution of Floating Refuse and Shoreline Refuse (April 2013 – March 2014) (by weight) ________ 6Figure 4: Examples of Non-local Refuse Items ____________________________________________________ 7Figure 5: Composition of Marine Refuse _________________________________________________________ 8Figure 6: Top Ten Types of Refuse in Hong Kong __________________________________________________ 9Figure 7: Examples of Foam Plastic Items _______________________________________________________ 10Figure 8: Refuse Collected after Festivals _______________________________________________________ 11Figure 9: Refuse on Stanley Main Beach and Shek O Beach after Festive Events ________________________ 11Figure 10: Percentage of Marine Refuse due to Human Activities ______________________________________ 14Figure 11: Variation of Marine Refuse Amount in Wet Season, Severe Weather and Dry Season _____________ 17Figure 12: Marine Refuse Amount and Monthly Rainfall _____________________________________________ 17Figure 13: Composition of Shoreline and Floating Refuse ____________________________________________ 18Figure 14: Source Activities of Shoreline and Floating Refuse ________________________________________ 19Figure 15: Geographical Distribution of Marine Refuse (by weight) _____________________________________ 20Figure 16: Factors Influencing Hong Kong's Hydrography during Wet and Dry Seasons ____________________ 21Figure 17: Shores Vulnerable to Refuse Accumulation in Wet Season __________________________________ 22Figure 18: Shores Vulnerable to Refuse Accumulation in Dry Season __________________________________ 22
Contents

1
319475/ENP/ENL/03/09/V6r February 2015 P:\Hong Kong\ENL\PROJECTS\319475_Marine Refuse\03 Deliverables\09 Executive Summary\Rev.8\20150409 Received from EPD\StudyReport(ENG)v8a_20150408.docx
Investigation on the Sources and Fates of Marine Refuse in Hong Kong Study Report
1. Introduction
Marine refuse refers to any solid waste, discarded or lost material, resulting from human activities, that has entered Hong Kong’s marine environment irrespective of their sources. While it comprises less than 0.5% of municipal solid waste disposed of by the Government, the presence of marine refuse may pose adverse impacts on the marine ecosystems and other sensitive beneficial uses of our waters. The Government set up an Interdepartmental Working Group on Clean Shorelines (WG) in November 2012 to enhance coordination among the relevant government departments in addressing the marine refuse problem, and in support of the WG, this study was conducted to collect, collate and analyse up-to-date information on the sources, distribution and movement of marine refuse in Hong Kong waters, and to suggest measures to further improve the cleanliness of our shorelines.
Abbreviations
The following abbreviations are used in this report:
AFCD Agriculture, Fisheries and Conservation Department
ECC Environmental Campaign Committee
ECF Environment and Conservation Fund
FEHD Food and Environmental Hygiene Department
ICC International Coastal Cleanup
IOC Intergovernmental Oceanographic Commission
LCSD Leisure and Cultural Services Department
m/s Meter per second
MD Marine Department
NGO Non-Governmental Organisation
NMDMP National Marine Debris Monitoring Program
NOWPAP Northwest Pacific Action Plan
OC Ocean Conservancy
SEPA Student Environmental Protection Ambassador
UNEP United Nations Environment Programme
USEPA US Environmental Protection Agency
WG Interdepartmental Working Group on Clean Shorelines
WWF World Wildlife Fund
Study Report

2
319475/ENP/ENL/03/09/V6r February 2015 P:\Hong Kong\ENL\PROJECTS\319475_Marine Refuse\03 Deliverables\09 Executive Summary\Rev.8\20150409 Received from EPD\StudyReport(ENG)v8a_20150408.docx
Investigation on the Sources and Fates of Marine Refuse in Hong Kong Study Report
Definitions
"Marine refuse" refers to any solid waste, discarded or lost material, resulting from human activities, that has entered the marine environment irrespective of their sources. According to the Guidelines on Survey and Monitoring of Marine Litter (Cheshire et al. 2009) published by the United Nations Environment Programme (UNEP) and Intergovernmental Oceanographic Commission (IOC), "marine refuse" can be broadly classified into the following materials of man-made origins, including: Plastics (e.g. moulded, soft, foam, nets, ropes, buoys, monofilament line and other fisheries-related
equipment, smoking-related items such as cigarette butts or lighters); Metal (e.g. drink cans, bottle caps, pull tabs); Glass (e.g. buoys, light bulbs, fluorescent tubes, bottles); Processed timber (including particle board); Paper (including cardboard); Rubber; and Cloth. Following the above definition and the current practices of refuse collection by government departments (Section 3), “marine refuse” in this Study includes the refuse floating on the sea which is collected by MD and LCSD, together with refuse that has been washed ashore and collected by AFCD, FEHD and LCSD. “Floating refuse collected by the Marine Department” refers to floating refuse within Hong Kong waters including foreshore areas and typhoon shelters. Domestic refuse collected from dwelling vessels inside typhoon shelters is not considered in this Study. "Land refuse" refers to any solid waste, discarded or lost material, resulting from human activities that has not yet entered the marine environment and found on land. In this Study, it also refers to refuse collected on the sandy area of gazetted beaches by LCSD. “Shoreline refuse” refers to marine refuse collected by government departments but excludes floating refuse collected by MD. Land refuse collected by LCSD is not defined as marine refuse.
“Natural debris” refers to refuse generated by natural causes such as severe weather events in which human activities are not involved (e.g. seaweed, tree branches, dead leaves. seashells, etc.). It is not regarded as “marine refuse” in this study and excluded in all charts, figures and analysis, unless otherwise specified.
“Refuse from marine-based sources” refers to refuse generated from ocean/waterway activities and marine littering.
“Refuse from land-based sources” refers to refuse generated from human activities conducted on land, near the coast or nearshore.
“Wet season” refers to period starting from April to October.
“Dry season” refers to period starting from November to March.

3
319475/ENP/ENL/03/09/V6r February 2015 P:\Hong Kong\ENL\PROJECTS\319475_Marine Refuse\03 Deliverables\09 Executive Summary\Rev.8\20150409 Received from EPD\StudyReport(ENG)v8a_20150408.docx
Investigation on the Sources and Fates of Marine Refuse in Hong Kong Study Report
Analysis of marine refuse is mainly based on the survey findings and data collected from April 2013 to March 2014. The results expressed in percentages and shown in various in figures are based on the count of refuse items, unless otherwise stated.
2. Study Method
The Study’s Methodology made reference to the recommendations and practices adopted by the UNEP/ IOC’s Guidelines on Survey and Monitoring of Marine Litter, International Coastal Cleanup (ICC) and the USEPA’s National Marine Debris Monitoring Program (NMDMP) in monitoring marine refuse. Modifications were made so as to address local concerns and conditions, such as surveying items of local concern (e.g. glow sticks, incense sticks), refuse items of non-local origin (i.e. items with labelling in simplified Chinese characters), and accommodating the current refuse collection practices of the relevant government departments.
The Study involved site surveys to collect refuse data from suitable coastal locations; mathematical modelling to study the transport and accumulation of marine refuse in Hong Kong waters and to examine the dominant factors influencing the sources, transport and distribution of marine refuse; and collation of historical data (2010-2013) on the quantity and types of marine refuse collected by government departments (i.e. AFCD, FEHD, LCSD, and MD), Non-Government Organisations (NGOs) and other relevant sources.
Two types of field surveys were conducted, namely: Refuse Characteristics Survey at Priority Areas for both floating and shoreline refuse; Focus Survey at Priority Coastlines for shoreline refuse.
Each survey type comprised five rounds of surveys over a period of 12 months from April 2013 to March 2014, covering both wet and dry seasons. Appendix A shows the locations of the survey sites and the coastal landforms. The survey sites were selected after considering several factors, namely, the conditions of the shorelines, feedback and past records of marine refuse problem provided by government departments, district councils and NGOs, and pre-survey site visits.
The Refuse Characteristics Survey was conducted at 36 locations of different landforms including rocky shores, mud flats, mangroves, sandy beaches, man-made sea banks, etc., for surveying shoreline refuse, and marine waters for surveying floating refuse. Frequent cleansing services to these sites were provided by government departments to ensure sufficient data could be collected for analysis. Bags of refuse collected at the locations were selected randomly for sorting in accordance with the classification system as shown in Appendix B, followed by a systematic process of weighing and counting of each refuse type. Surveys were also conducted during festive periods to identify any possible changes in refuse quantity and composition.
The Focus Survey determined the pattern and composition of shoreline refuse deposited on 6 selected locations. The sites were selected by reference to the UNEP/IOC’s Guidelines on Survey and Monitoring of Marine Litter. They were relatively remote, not covered in any NGO’s cleanup operations, and with

4
319475/ENP/ENL/03/09/V6r February 2015 P:\Hong Kong\ENL\PROJECTS\319475_Marine Refuse\03 Deliverables\09 Executive Summary\Rev.8\20150409 Received from EPD\StudyReport(ENG)v8a_20150408.docx
Investigation on the Sources and Fates of Marine Refuse in Hong Kong Study Report
infrequent refuse cleansing service. Refuse within the sampling area (Figure 1) were sorted, weighed and counted in accordance with the classification system as shown in Appendix B.
Figure 1: Sampling Area for Focus Survey
Source: UNEP Marine Litter Survey and Monitoring Guidelines
3. Background on Quantity and Trend of Marine Reuse
Collection of Marine Refuse is undertaken by four government departments: from gazetted beaches by LCSD, marine parks and marine reserve by AFCD, unallocated coastal area by FEHD, and coastal waters/open waters/typhoon shelters by MD.
AFCD collects marine refuse along the shores within the marine parks and marine reserve. Depending on the field situation, the cleanup frequency ranges from 3 to 6 times per week for marine parks and monthly for the Cape D’Aguilar Marine Reserve where no recreational activities are allowed.
FEHD collects marine refuse washed ashore together with other waste found present at unallocated coastal areas on an ad-hoc or regular basis ranging from, depending on the field situation, daily to half yearly.
LCSD collects marine refuse in the water or washed ashore within the gazetted beaches, and land refuse from the area behind the foreshore to the back of the beach. Refuse collection is done by staff stationed at beaches on a daily basis, at least twice per day.
MD collects floating refuse within Hong Kong waters including foreshore areas and typhoon shelters through contractual services. Its contractor deploys about 70 scavenging boats of various types to collect
5
319475/ENP/ENL/03/09/V6r February 2015 P:\Hong Kong\ENL\PROJECTS\319475_Marine Refuse\03 Deliverables\09 Executive Summary\Rev.8\20150409 Received from EPD\StudyReport(ENG)v8a_20150408.docx
Investigation on the Sources and Fates of Marine Refuse in Hong Kong Study Report
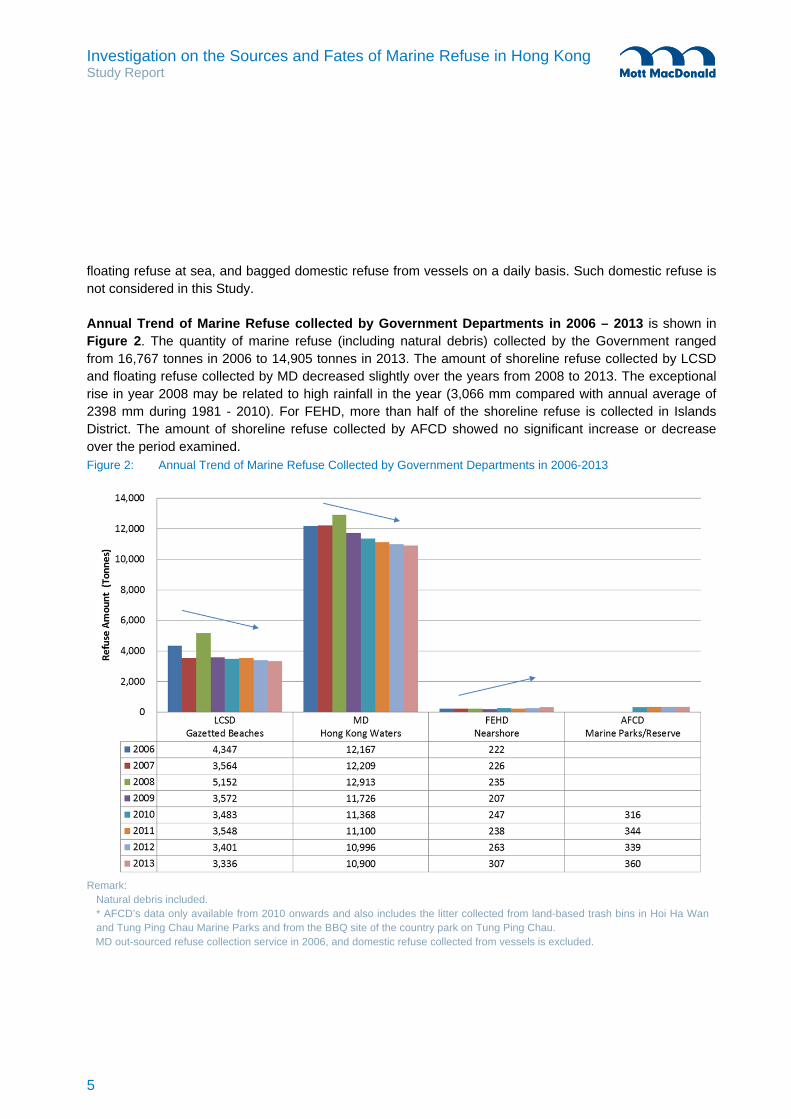
floating refuse at sea, and bagged domestic refuse from vessels on a daily basis. Such domestic refuse is not considered in this Study.
Annual Trend of Marine Refuse collected by Government Departments in 2006 – 2013 is shown in Figure 2. The quantity of marine refuse (including natural debris) collected by the Government ranged from 16,767 tonnes in 2006 to 14,905 tonnes in 2013. The amount of shoreline refuse collected by LCSD and floating refuse collected by MD decreased slightly over the years from 2008 to 2013. The exceptional rise in year 2008 may be related to high rainfall in the year (3,066 mm compared with annual average of 2398 mm during 1981 - 2010). For FEHD, more than half of the shoreline refuse is collected in Islands District. The amount of shoreline refuse collected by AFCD showed no significant increase or decrease over the period examined. Figure 2: Annual Trend of Marine Refuse Collected by Government Departments in 2006-2013
Remark: Natural debris included. * AFCD’s data only available from 2010 onwards and also includes the litter collected from land-based trash bins in Hoi Ha Wan and Tung Ping Chau Marine Parks and from the BBQ site of the country park on Tung Ping Chau.
MD out-sourced refuse collection service in 2006, and domestic refuse collected from vessels is excluded.

6
319475/ENP/ENL/03/09/V6r February 2015 P:\Hong Kong\ENL\PROJECTS\319475_Marine Refuse\03 Deliverables\09 Executive Summary\Rev.8\20150409 Received from EPD\StudyReport(ENG)v8a_20150408.docx
Investigation on the Sources and Fates of Marine Refuse in Hong Kong Study Report
4. Nature and Origin of Marine Refuse
Natural Debris (e.g. seaweed, tree branches, dead leaves, seashells, etc.) was found on the shores all year round. Natural debris in floating refuse was negligible, though large amount (e.g. water duckweed) was occasionally found in wet season. About 18% (by weight) of marine refuse was natural debris collected near the shoreline and attributable to dense vegetation in the hinterland in which tree branches, leaves, etc., might have been ripped off and blown into the sea while submerged vegetation might have been churned up by tidal actions and surfaced. The debris drifted in the sea and finally washed ashore and collected. It is currently collected and disposed of off-site at landfill. Due to the high salt content, it is unsuitable for use as compost or fertilizer.
Floating Refuse and Shoreline Refuse are the two terms used to differentiate marine refuse based on the collection method by government departments. Floating refuse is collected by MD while shoreline refuse is collected by AFCD, FEHD and LCSD. Some 73.2% (10,931 tonnes) of the total marine refuse is floating refuse, including natural debris, and the rest was shoreline refuse collected by LCSD (22.3%, 3,331 tonnes), AFCD (2.4%, 353 tonnes) and FEHD (2.1%, 317 tonnes). Furthermore, the composition of floating and shoreline refuse was similar, suggesting that floating refuse is mostly land-generated waste and has entered into the marine environment through stormwater drains, run-offs, or being blown or thrown into the sea. Figure 3 shows the relative amount of shoreline and floating refuse.
Figure 3: Distribution of Floating Refuse and Shoreline Refuse (April 2013 – March 2014, by weight)
The Origin of marine refuse was examined to identify any non-local items by counting refuse items with packaging labels in simplified Chinese characters. As there was no other viable method to distinguish non-local items originating from the Mainland, identification based on packaging labels was the only technically feasible method that could be adopted to provide a rough approximation of the percentage of non-local items in Hong Kong. Local items comprised 95% of marine refuse while non-local items contributed

7
319475/ENP/ENL/03/09/V6r February 2015 P:\Hong Kong\ENL\PROJECTS\319475_Marine Refuse\03 Deliverables\09 Executive Summary\Rev.8\20150409 Received from EPD\StudyReport(ENG)v8a_20150408.docx
Investigation on the Sources and Fates of Marine Refuse in Hong Kong Study Report
approximately 5%. More non-local items were found at Ap Chau, Luk Keng, Tung Ping Chau Marine Park, Hoi Ha Wan Marine Park near Mirs Bay and Pak Lap Tsai in Sai Kung as compared with other regions. No significant seasonal difference was observed in the amount of non-local items in the whole territory of Hong Kong. Even in the wet season during when the southern and the western parts of Hong Kong were subject to greater influences from the outflow of the Pearl River and prevailing south-westerly oceanic flow, there had not been any significant surge in non-local items in the said regions where, on the whole, only a slightly higher amount of non-local items were found at Cheung Chau Tung Wan Beach, Lo Tik Wan, the rocky shore between Stanley Main Beach and Hong Kong Sea School, Sha Chau and Lung Kwu Chau Maine Park, and Tuen Mun. Overall, the problem of non-local items was not significant. The distribution and percentage of non-local items by count at each survey site is presented in Appendix C.
Majority of non-local items were of packaging materials such as plastic food wrappers, plastic or glass beverage bottles, metal food cans, metal cigarette tins. There are several probable sources of these refuse items. These items could have been purchased in local stores or brought into Hong Kong by tourists/local residents for consumption at the shores and then left behind as litter; littered at sea by vessel operators/passengers; or brought into Hong Kong waters from outside our territorial water by wind and tidal actions. Plastic household cleaning packets and plastic bait packets related to fishing activities were commonly found in Mirs Bay, since the water body is located near potential sources from Mainland (e.g. the populated Yantian), and the presence of fish farms in Hong Kong and Mainland waters. Figure 4 shows some examples of non-local refuse items found in the site surveys.
Figure 4: Examples of Non-local Refuse Items

8
319475/ENP/ENL/03/09/V6r February 2015 P:\Hong Kong\ENL\PROJECTS\319475_Marine Refuse\03 Deliverables\09 Executive Summary\Rev.8\20150409 Received from EPD\StudyReport(ENG)v8a_20150408.docx
Investigation on the Sources and Fates of Marine Refuse in Hong Kong Study Report
5. Composition of Marine Refuse
Composition analysis is conducted by grouping marine refuse into eight types, namely, plastic, foam plastic, cloth, glass/ceramic, wood, paper/cardboard and others. Over 70% of marine refuse were plastic and foam plastic items (Figure 5). Tiny refuse items such as fragmented plastic, foam plastic and ceramic constituted quite a large percentage of the total refuse amount. These items had already been broken down by sun, sea and wind into small fragments and often hard to identify. They were often trapped in rocky areas or blown further inland into bushes at the edge of the beaches, adding difficulties to the cleanup. Excluding the tiny refuse fragments, food-related packaging plastic items, often of single-use and disposable nature, were the most prevalent type of refuse found in shoreline refuse, while foam plastic foods containers and cups, followed by plastic beverage bottles, and foam insulation packaging like foam boxes were the most prevalent items found in floating refuse collected by MD.
Figure 5: Composition of Marine Refuse
Shoreline Refuse Floating Refuse

9
319475/ENP/ENL/03/09/V6r February 2015 P:\Hong Kong\ENL\PROJECTS\319475_Marine Refuse\03 Deliverables\09 Executive Summary\Rev.8\20150409 Received from EPD\StudyReport(ENG)v8a_20150408.docx
Investigation on the Sources and Fates of Marine Refuse in Hong Kong Study Report
Cleanup Data from Other Organisations revealed similar findings. Several organizations provided their cleanup data and their results were considered in the data analysis. Findings from this Study were comparable to those of the two organisations, namely, Green Council and Hong Kong Cleanup, which organised annual ICC cleanups on a large scale, in which various forms of plastic and foam plastic items featured the top ten list, though deviations were observed regarding glass and ceramic fragments, cigarette butts, and plastic bags. Besides tiny trash fragments which topped the list, plastic items of single-use and disposable nature; plastic bags, plastic beverage bottles, plastic/foam plastic food containers and cups, foam insulation and packaging, and cigarette butts were the most commonly found items in the ICC cleanup operations (Figure 6).
Figure 6: Top Ten Types of Refuse in Hong Kong
Results from Refuse Characteristics Survey for Shoreline Refuse of this Study
Results from Green Council (2013 International Coastal Cleanup)

10
319475/ENP/ENL/03/09/V6r February 2015 P:\Hong Kong\ENL\PROJECTS\319475_Marine Refuse\03 Deliverables\09 Executive Summary\Rev.8\20150409 Received from EPD\StudyReport(ENG)v8a_20150408.docx
Investigation on the Sources and Fates of Marine Refuse in Hong Kong Study Report
Results from Hong Kong Cleanup (2013 International Coastal Cleanup)
*Refuse type was adjusted to follow the classification adopted by this study.
Foam Plastic Items included large foam boxes used for carrying aquatic products and vegetables; foam boxes used by the public for keeping their catch during angling; and food containers from recreational activities (Figure 7). Broken foam boxes and their fragments were often found in the floating refuse near fish markets or typhoon shelters, especially at Aberdeen waters. These items are light and can easily be blown into the sea if carelessly put aside or littered in the waterfront areas. When not scavenged by MD, they become smaller fragments due to wind and tidal actions over time, and scattered along the shorelines.
Figure 7: Examples of Foam Plastic Items
Special Events generated more refuse. Refuse doubled in amount on/after festivals at popular beaches, for example, 1,500 kg of marine and land refuse was collected at Stanley Main Beach on the Dragon Boat Festival (42% increase) and 4,200 kg was collected at Shek O Beach after the Mid-Autumn Festival (122% increase) (Figure 8). The increase in refuse amount was more prominent in land refuse. Mooncake tin cans, candle packaging, poker, lanterns, beach mats, tissues, etc., were common items left behind on beaches or promenades (Figure 9). This illustrates the result of littering and poor awareness of the consequence of such behaviour.

11
319475/ENP/ENL/03/09/V6r February 2015 P:\Hong Kong\ENL\PROJECTS\319475_Marine Refuse\03 Deliverables\09 Executive Summary\Rev.8\20150409 Received from EPD\StudyReport(ENG)v8a_20150408.docx
Investigation on the Sources and Fates of Marine Refuse in Hong Kong Study Report
Figure 8: Refuse Collected after Festivals
Natural debris included.
Figure 9: Refuse on Stanley Main Beach and Shek O Beach after Festive Events Dragon Boat Festival

12
319475/ENP/ENL/03/09/V6r February 2015 P:\Hong Kong\ENL\PROJECTS\319475_Marine Refuse\03 Deliverables\09 Executive Summary\Rev.8\20150409 Received from EPD\StudyReport(ENG)v8a_20150408.docx
Investigation on the Sources and Fates of Marine Refuse in Hong Kong Study Report
Mid-Autumn Festival
6. Sources of Marine Refuse
Potential sources of marine refuse in Hong Kong waters are either marine- or land-based, however, it is not possible to precisely estimate the quantities and types of refuse input to the marine water. Faris and Hart (1994)1 estimated that 80% of the marine litter enters the ocean by land and it was assumed the remaining 20% was derived from maritime activities such as commercial and recreational fishing, cruises and shipping. According to a report on addressing marine litter problem by NOWPAP member states2, around 80% of marine refuse collected originated from shoreline and recreational activities. The findings of this Study are comparable to the results of the abovementioned reports.
Hong Kong is a city with long coastlines and dense populations on both sides of the Victoria Harbour and some coastal areas, hence much refuse is generated from human-related activities. An increase in the use of single-use disposable products and packaging has resulted in an increase in solid waste arising. The most prevalent types of marine refuse found are plastic beverage bottles and food-related packaging items which are associated with shoreline and recreational activities. Natural events such as storms, heavy rainfalls can transport significant quantities of this marine refuse from coastal areas. It is therefore
1 Faris, J., Hart, K., 1994. Seas of Debris: A Summary of the Third International Conference on Marine Debris. N.C. Sea Grant
College Program and NOAA. 2 NOWAP 2011. Third Overview: Marine Litter in the Northwest Pacific Action Plan (NOWPAP) Region. Member states covered in
the report include China, Japan, Korea and Russia.
13
319475/ENP/ENL/03/09/V6r February 2015 P:\Hong Kong\ENL\PROJECTS\319475_Marine Refuse\03 Deliverables\09 Executive Summary\Rev.8\20150409 Received from EPD\StudyReport(ENG)v8a_20150408.docx
Investigation on the Sources and Fates of Marine Refuse in Hong Kong Study Report
important to identify specific locations and types of activities that generate and cause materials to become marine refuse.
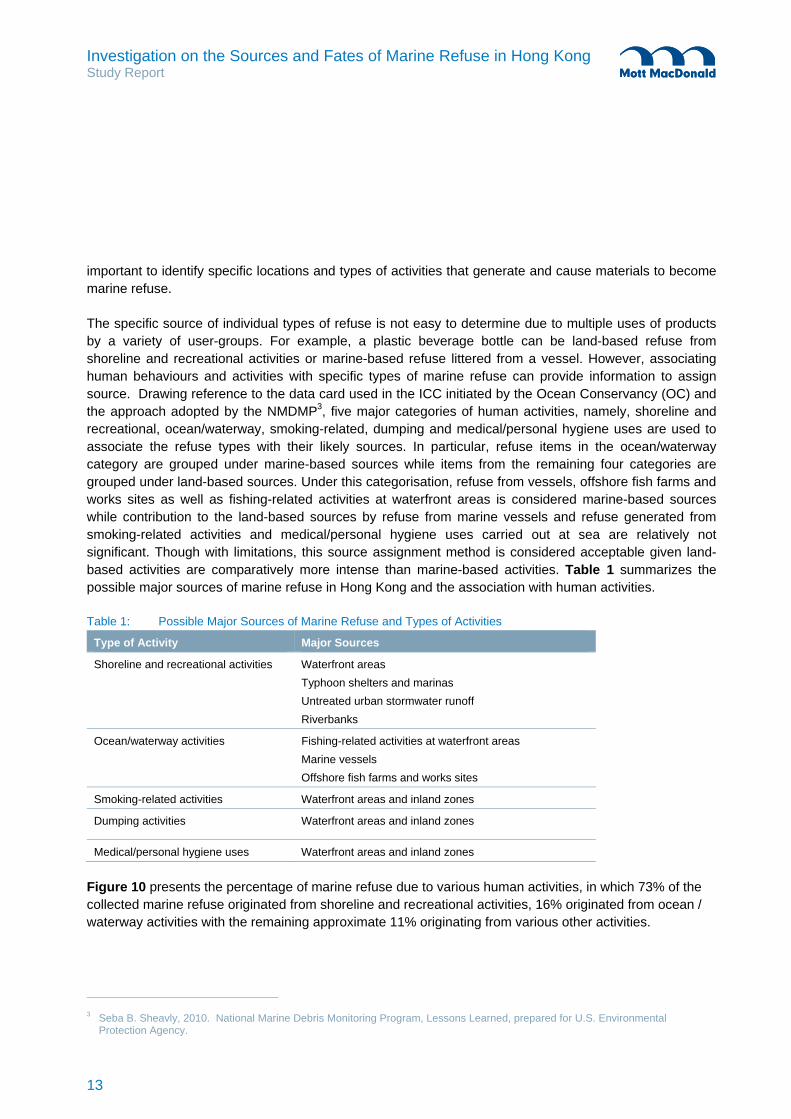
The specific source of individual types of refuse is not easy to determine due to multiple uses of products by a variety of user-groups. For example, a plastic beverage bottle can be land-based refuse from shoreline and recreational activities or marine-based refuse littered from a vessel. However, associating human behaviours and activities with specific types of marine refuse can provide information to assign source. Drawing reference to the data card used in the ICC initiated by the Ocean Conservancy (OC) and the approach adopted by the NMDMP3, five major categories of human activities, namely, shoreline and recreational, ocean/waterway, smoking-related, dumping and medical/personal hygiene uses are used to associate the refuse types with their likely sources. In particular, refuse items in the ocean/waterway category are grouped under marine-based sources while items from the remaining four categories are grouped under land-based sources. Under this categorisation, refuse from vessels, offshore fish farms and works sites as well as fishing-related activities at waterfront areas is considered marine-based sources while contribution to the land-based sources by refuse from marine vessels and refuse generated from smoking-related activities and medical/personal hygiene uses carried out at sea are relatively not significant. Though with limitations, this source assignment method is considered acceptable given land-based activities are comparatively more intense than marine-based activities. Table 1 summarizes the possible major sources of marine refuse in Hong Kong and the association with human activities.
Table 1: Possible Major Sources of Marine Refuse and Types of Activities
Type of Activity Major Sources
Shoreline and recreational activities Waterfront areas
Typhoon shelters and marinas
Untreated urban stormwater runoff
Riverbanks
Ocean/waterway activities Fishing-related activities at waterfront areas
Marine vessels
Offshore fish farms and works sites
Smoking-related activities Waterfront areas and inland zones
Dumping activities Waterfront areas and inland zones
Medical/personal hygiene uses Waterfront areas and inland zones
Figure 10 presents the percentage of marine refuse due to various human activities, in which 73% of the collected marine refuse originated from shoreline and recreational activities, 16% originated from ocean / waterway activities with the remaining approximate 11% originating from various other activities.
3 Seba B. Sheavly, 2010. National Marine Debris Monitoring Program, Lessons Learned, prepared for U.S. Environmental
Protection Agency.

14
319475/ENP/ENL/03/09/V6r February 2015 P:\Hong Kong\ENL\PROJECTS\319475_Marine Refuse\03 Deliverables\09 Executive Summary\Rev.8\20150409 Received from EPD\StudyReport(ENG)v8a_20150408.docx
Investigation on the Sources and Fates of Marine Refuse in Hong Kong Study Report
Figure 10: Percentage of Marine Refuse due to Human Activities
Land-based Sources of marine refuse may originate from coastal areas or from further inland. Refuse generated from recreational activities and left behind at waterfront areas such as beaches, piers, promenades, shore, etc., may enter the marine environment by tidal wave, wind or rain.
Improper disposal of waste by operators at wholesale fish and vegetable markets and marine works sites; users of public piers, typhoon shelters and marinas, etc., may also introduce refuse into the marine environment.
Littering by vessels moored inside typhoon shelters is used to be considered a potential source of marine refuse. The MD has employed contractors to scavenge floating refuse and collect domestic refuse from vessels inside typhoon shelters to alleviate the problem. As such, this source of marine refuse has become secondary. Refuse from storm drains (e.g. Shau Kei Wan Typhoon Shelter) and waterfront activities within the typhoon shelter areas (e.g. Aberdeen and To Kwa Wan Typhoon Shelter) are now the predominant sources.
Although most of the inlets of the public stormwater drainage systems (e.g. upstream intakes, roadside gully, channels etc.) are provided with gratings to prevent debris/rubbish being washed into the drainage systems, part of the land refuse could be washed into the stormwater drains and flushed out to the sea during adverse weather such as tropical storms and heavy rain. In particular, districts with a high

15
319475/ENP/ENL/03/09/V6r February 2015 P:\Hong Kong\ENL\PROJECTS\319475_Marine Refuse\03 Deliverables\09 Executive Summary\Rev.8\20150409 Received from EPD\StudyReport(ENG)v8a_20150408.docx
Investigation on the Sources and Fates of Marine Refuse in Hong Kong Study Report
population density (e.g. the harbour area) are susceptible to stormwater pollution due to increased human activities.
Streams and rivers are also potential carriers of floating refuse as demonstrated by the fact that more refuse were found at Pui O Beach, Hung Shing Yeh Beach after heavy rain. Streams entering these beaches may be a likely source of refuse.
Marine-based Sources of marine refuse are mainly due to littering at sea by people conducting fish farm operations, water sports, leisure boating activities or angling. Marine refuse items likely generated from marine and fishing vessels were ropes, buoys/floats, and oil/lubricant or coolant bottles, broken nets, strapping bands, etc, whereas items from water sports, leisure boating activities were found to be of domestic waste in nature, such as plastic beverage bottles, food packets, and metal beverage cans, etc. The refuse composition was similar to that of the land-based sources of refuse generated from shoreline and recreational activities, making it difficult to distinguish from land-based sources.
Cruise ships and cargo carriers could possibly be another potential source introducing refuse to the marine waters. Domestic waste from cruise ships is significant due to the large number of passengers. Domestic items for marine voyage often come in large packaging size. However, waste items with such packaging were not found in the marine refuse collected by MD during the survey. Currently, MD provides free of charge domestic refuse collection service to vessels at anchorage and harbour moorings while they are staying in port. Domestic waste from vessels is under proper management in Hong Kong.
Cargo container lost at sea from cargo ships in severe weather is a very rare and exceptional occurrence. Refuse resulted from lost cargo is not regarded as marine refuse in normal circumstances.
7. Impact of Refuse Sources
Shoreline and Recreational Activities generated the largest amount of marine refuse (22.3% and 50.4% of shoreline and floating refuse respectively, Figure 10). Most of the items were of single-use disposable nature and food-related (e.g. beverage bottles, caps and lids, food packets, and food packaging materials). The quantity of refuse was highly related to human activities carried out at shorelines and littering behaviour. A significant increase in the amount of land and marine refuse collected during the Dragon Boat and Mid-autumn Festivals was observed while the increase was insignificant after the Chinese New Year during which shoreline activities were less common. For instance, abandoned mooncake tin cans, lanterns, beach mats, etc., were seen on beaches and promenades after Mid-autumn festival celebration. Besides festive events, more refuse was collected during summer where people went to the bathing beaches and the seaside for leisure.
Ocean / Waterway Activities contributed a moderate percentage of marine refuse (2.9% and 13.3% of shoreline and floating refuse respectively, Figure 10). Plastic hard items, plastic rope, plastic strapping bands, processed timber and plastic baits packets were commonly found items. These small pieces were possibly originated from fisherman vessels and off-shore fish farms.

16
319475/ENP/ENL/03/09/V6r February 2015 P:\Hong Kong\ENL\PROJECTS\319475_Marine Refuse\03 Deliverables\09 Executive Summary\Rev.8\20150409 Received from EPD\StudyReport(ENG)v8a_20150408.docx
Investigation on the Sources and Fates of Marine Refuse in Hong Kong Study Report
Smoking-related Activities generated trash like cigarette butts, package and lighters, and comprised a very small percentage of marine refuse (0.4% and 3.9% of shoreline and floating refuse respectively, Figure 10). More smoking-related items were found on land (including land above high tide mark and within the inter-tidal zone) than in water, especially on gazetted beaches. People smoked and littered. The refuse was then washed or blown into the sea and, if not collected by MD, eventually landed on a shore elsewhere. Fewer cigarette butts were found in floating refuse as soaked cigarette butts sink, and would only be collected by MD when they were churned up by water currents and uplifted to water surface.
Dumping Activities contributed a very small percentage of the marine refuse (1.1% and 2.3% of shoreline and floating refuse respectively, Figure 10). Common refuse items were fragments of foam plastic sponge, rubber sheet, plastic household cleaning bottles, and paper cardboard boxes, due to littering of smaller items of construction materials and household waste rather than dumping of construction materials in larger loads.
Medical / Personal Hygiene Uses contributed a very small percentage of the marine refuse (0.3% and 3.1% of shoreline and floating refuse respectively, Figure 10). Sanitary items such as cotton buds, diapers, were the most commonly found types of medical / personal hygiene waste. Problem of medical waste such as used syringes and vials was rather limited.
8. Seasonal and Spatial Distribution of Marine Refuse
Seasonal Variation. Refuse amount varied in different weather conditions. More marine refuse was collected during the wet season and following severe weather (e.g. typhoons) than during the dry season (Figure 11). It was also positively related to rainfall (Figure 12). Refuse amount increased from May and reached a maximum in August during which more people would go to beaches and seaside for bathing, carnivals and water sports.

17
319475/ENP/ENL/03/09/V6r February 2015 P:\Hong Kong\ENL\PROJECTS\319475_Marine Refuse\03 Deliverables\09 Executive Summary\Rev.8\20150409 Received from EPD\StudyReport(ENG)v8a_20150408.docx
Investigation on the Sources and Fates of Marine Refuse in Hong Kong Study Report
Figure 11: Variation of Marine Refuse Amount in Wet Season, Severe Weather and Dry Season
Figure 12: Marine Refuse Amount and Monthly Rainfall
Nature debris included.
In terms of refuse composition, seasonal variation was insignificant for shoreline refuse but a noticeable increase in foam plastic items in wet season for floating refuse (Figure 13), possibly due to more intense fishing-related and water sports activities during that period.

18
319475/ENP/ENL/03/09/V6r February 2015 P:\Hong Kong\ENL\PROJECTS\319475_Marine Refuse\03 Deliverables\09 Executive Summary\Rev.8\20150409 Received from EPD\StudyReport(ENG)v8a_20150408.docx
Investigation on the Sources and Fates of Marine Refuse in Hong Kong Study Report
Figure 13: Composition of Shoreline and Floating Refuse
Wet Season Dry Season
Shoreline Refuse
Floating Refuse
In terms of refuse source, shoreline and recreational activities contributed the major source of refuse, followed by ocean/waterway activities and smoking-related activities (Figure 14) in both wet and dry seasons. The distribution pattern was similar for shoreline and floating refuse in the two seasons. However, a noticeable increase was observed for refuse from ocean/waterway activities in wet season, possibly due to more intense water sports, leisure boating and fishing-related activities during that period.

19
319475/ENP/ENL/03/09/V6r February 2015 P:\Hong Kong\ENL\PROJECTS\319475_Marine Refuse\03 Deliverables\09 Executive Summary\Rev.8\20150409 Received from EPD\StudyReport(ENG)v8a_20150408.docx
Investigation on the Sources and Fates of Marine Refuse in Hong Kong Study Report
Figure 14: Source Activities of Shoreline and Floating Refuse
Wet season Dry Season
Shoreline Refuse
Floating Refuse
Spatial Distribution. More refuse was found in the western and southern parts of Hong Kong (Figure 15). Shoreline refuse was mainly found in Tsuen Wan, Tuen Mun, Southern District and Islands District while more floating refuse was found in Outlying Islands, Harbour East, Harbour West, Hong Kong South, and Kowloon West.

20
319475/ENP/ENL/03/09/V6r February 2015 P:\Hong Kong\ENL\PROJECTS\319475_Marine Refuse\03 Deliverables\09 Executive Summary\Rev.8\20150409 Received from EPD\StudyReport(ENG)v8a_20150408.docx
Investigation on the Sources and Fates of Marine Refuse in Hong Kong Study Report
Figure 15: Geographical Distribution of Marine Refuse (by weight)
Shoreline Refuse Floating Refuse
Natural debris included. Demarcation for shoreline refuse follows that of the District Councils. Demarcation for floating refuse:
Harbour West: Yaumatei, Sham Shui Po, Western District, Central District, Tsim Sha Tsui Harbour East: Hung Hom, To Kwa Wan, Kwun Tong, Sam Ka Tsuen, Chai Wan & Lei Yue Mun, Wan Chai, Causeway Bay,
North Point & Quarry Bay, Shau Kei Wan, Junk Bay Hong Kong South: Aberdeen, Tin Wan, Stanley Bay, Deep Water & Repulse Bay Kowloon West: Urmston Road, Castle Peak Bay, Tuen Mun, Tai Lam, Ma Wan, Tsing Yi (North), Tsuen Wan, Ramble Channel Sai Kung & Tai Po: Sai Kung Harbour, Sai Kung Hoi, Pak Sha Wan, Tolo (North), Tolo (West), Tolo (South) Outlying Islands: Cheung Chau, Lamma Island, Lantau (East), Tai O, Chep Lap Kok
Overall Distribution. More marine refuse is collected from different parts of Hong Kong in wet seasons since more people go to bathing beaches and the seaside in the summer period, hence higher amount of marine refuse is observed. This can be further explained by the influence of water movements in the South East China where south-westerly oceanic flow prevails in the summer period. In summer when rainfall is at its highest, refuse accumulated in local storm drains and on the shores will be flushed into the sea or some refuse may be carried by the Pearl River flow and brought to Hong Kong’s waters and shores. The influence of Pearl River outflow and the oceanic flow is progressively reduced towards the east, and the eastern and north eastern coasts of Hong Kong (i.e. Sai Kung, Tai Po) are virtually unaffected. This phenomenon is reflected by the higher refuse accumulation rate observed at Tuen Mun, Tsuen Wan and Southern District and Islands District in the wet season. The influence on seasonal variation on spatial distribution is presented in Figure 16.
The spatial distribution of marine refuse during the wet season would have implications on the MD’s cleansing programmes for the collection of floating refuse from western and southern waters during the wet season, including the arrangement for special cleansing of shoreline refuse trapped in foreshore water, etc., before and during wet season.

21
319475/ENP/ENL/03/09/V6r February 2015 P:\Hong Kong\ENL\PROJECTS\319475_Marine Refuse\03 Deliverables\09 Executive Summary\Rev.8\20150409 Received from EPD\StudyReport(ENG)v8a_20150408.docx
Investigation on the Sources and Fates of Marine Refuse in Hong Kong Study Report
Figure 16: Factors Influencing Hong Kong's Hydrography during Wet and Dry Seasons
Wet Season Dry Season
Source: Project WATERMAN, University of HONG KONG, 2010.
9. Shorelines Vulnerable to Refuse Accumulation
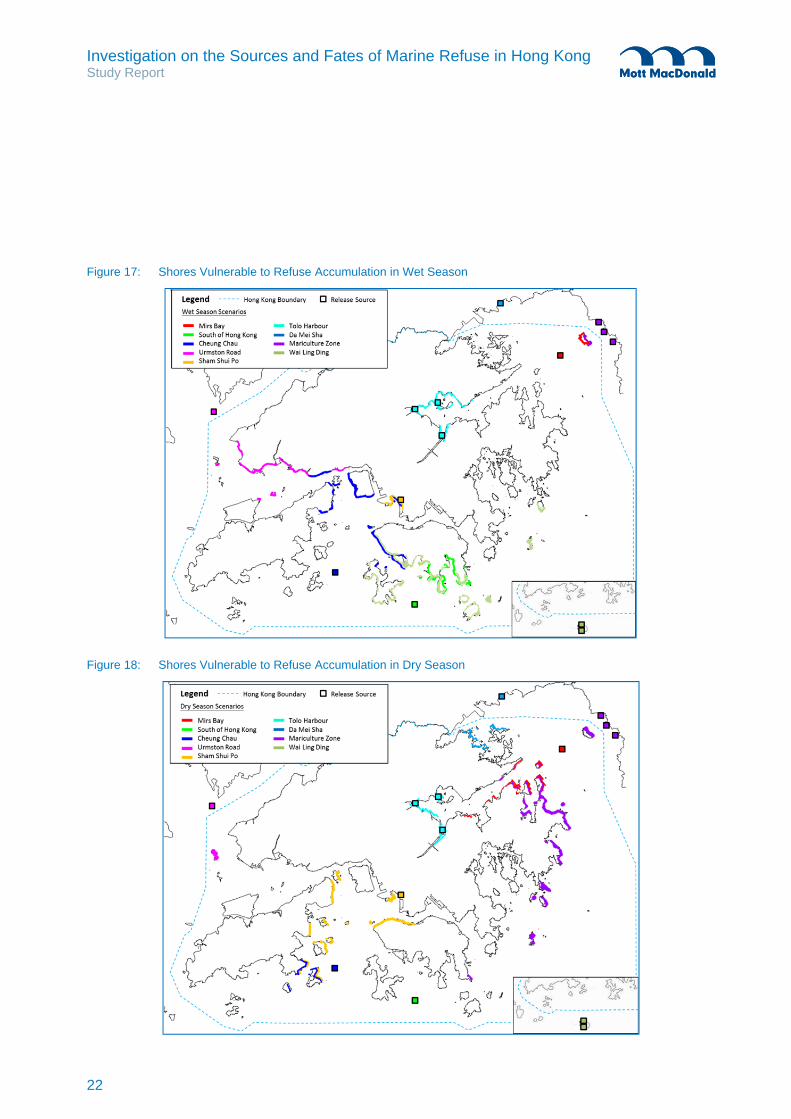
Computer modelling results suggest that wind direction, instead of water current, is a dominant factor affecting the distribution of marine refuse when the wind speed is greater than 4 m/s (moderate wind)4. This factor would be more obvious under adverse weather conditions such as typhoon. The northeast monsoon generally prevails over the coast of southern China in winter while the southwest monsoon dominates in summer and as a result, shorelines facing the prevailing wind direction tend to accumulate more refuse. Coupled with the less dominant water current factor, shores along the south and southwest coast of Hong Kong are more vulnerable to refuse accumulation than those in the east or northeast in the wet season. Hence, the refuse cleanup schedule can be drawn up in light of the seasonal pattern of refuse accumulation.
The deposition of floating refuse along Hong Kong shorelines in wet and dry seasons are presented in Figures 17 and 18. Shorelines are highlighted by different colours to indicate the predicted deposition at these shores under different modelling scenarios.
4 The Beaufort Scale is used to describe wind speeds. The scale is divided into 13 levels, from the calm wind force of 0 (<0.56 m/s),
light wind force of 1-2 (0.56-3.33 m/s), moderate wind force of 3-4 (3.61-8.33 m/s), to hurricane wind force of 12 (>32.8 m/s).
22
319475/ENP/ENL/03/09/V6r February 2015 P:\Hong Kong\ENL\PROJECTS\319475_Marine Refuse\03 Deliverables\09 Executive Summary\Rev.8\20150409 Received from EPD\StudyReport(ENG)v8a_20150408.docx
Investigation on the Sources and Fates of Marine Refuse in Hong Kong Study Report
Figure 17: Shores Vulnerable to Refuse Accumulation in Wet Season
Figure 18: Shores Vulnerable to Refuse Accumulation in Dry Season

23
319475/ENP/ENL/03/09/V6r February 2015 P:\Hong Kong\ENL\PROJECTS\319475_Marine Refuse\03 Deliverables\09 Executive Summary\Rev.8\20150409 Received from EPD\StudyReport(ENG)v8a_20150408.docx
Investigation on the Sources and Fates of Marine Refuse in Hong Kong Study Report
10. Improvement Measures
In light of the survey findings and the computer modelling results, and drawing reference to the Honolulu Strategy5 in addressing marine refuse from the global perspective, a three-pronged strategy is necessary to address marine refuse problem in Hong Kong:
Reduce overall waste generation at source;
Reduce the amount of refuse entering the marine environment;
Remove refuse from the marine environment.
With due account of the current local practices, five key improvement areas have been identified to improve the cleanliness of our shorelines:
Measure 1 Conduct publicity campaigns to engage the community to contribute and participate;
Measure 2 Promote educational messages to target groups, beach users, students and local community;
Measure 3 Provide support measures and facilities to reduce refuse from entering the marine environment;
Measure 4 Enhance efforts to remove refuse from the marine environment; and
Measure 5 Engage public participation to report marine littering and refuse problem.
With support of relevant government departments, a series of specific actions will be implemented to improve the cleanliness of Hong Kong’s shorelines. A summary of actions under the five improvement measures is given in Appendix D.
Measure 1: Conduct publicity campaigns to engage the community to contribute and participate. The WG initiated various promotional activities in 2013 and 2014, e.g. Clean Shoreline Campaign, Clean Shoreline Day, a slogan competition, comics competition and video filming competition to promote clean shoreline messages, i.e. ”Use reusable instead of disposable items at the coast”, “Take away your rubbish, dispose properly or recycle it”; and “Protect our coast Leave no trace”. A thematic website6 was set up to serve as a platform for public education, information sharing, promoting participation in cleanup events, and reporting on marine refuse pollution.
Since the launch of the promotional activities, more schools and commercial companies have shown interest in organizing cleanups or joining cleanup events organised by NGOs/community groups. Two enquires were received about organizing cleanup in 2013 and twenty three enquires in 2014. A total of fifty four schools7 joined the cleanup events of the Student Environmental Protection Ambassador (SEPA)
5 The Honolulu Strategy was developed at the Fifth International Marine Debris Conference which was co-organised by the US
National Oceanic and Atmospheric Administration and the United Nations Environment Programme in March 2011.
6 http://www.epd.gov.hk/epd/clean_shorelines/
7 38 schools joined the cleanup under a regular programme and due to overwhelming response, a top-up session was organised

24
319475/ENP/ENL/03/09/V6r February 2015 P:\Hong Kong\ENL\PROJECTS\319475_Marine Refuse\03 Deliverables\09 Executive Summary\Rev.8\20150409 Received from EPD\StudyReport(ENG)v8a_20150408.docx
Investigation on the Sources and Fates of Marine Refuse in Hong Kong Study Report
Scheme in the 2013-14 school year and thirty seven schools have registered to join in 2014-15. Fostering government-community partnership and widening the community network will be continued so as to promote community awareness of and joint efforts in keeping the shorelines clean.
Starting from April 2015, the EPD will partner with NGOs/community groups to conduct special cleanup events on a monthly basis in 2015-16, with the assistance of WG departments8. Students and the public will be invited to join the cleanup events. Other promotional campaigns to be conducted in 2015 and 2016 include the WWF’s Coastal Watch programme which is sponsored by the Environmental and Conservation Fund (ECF) and Environmental Campaign Committee (ECC); the beach cleanup event of the LCSD’s annual sand sculpture competition and beach carnival, and an underwater cleanup event to be co-organised by the AFCD and the Hong Kong Underwater Association at selected coral sites to spread the message of protecting our marine environment and marine conservation.
Measure 2: Promote educational messages to target groups, beach users, students and local community. The marine refuse problem in Hong Kong is mainly a result of littering and poor awareness about the consequence of such behaviour. Various educational and outreach activities are being carried out regularly by departments for target groups such as visitors to beaches and shoreline recreational facilities; fishermen; users of typhoon shelters and marinas, operators at fish and vegetable wholesale markets, and major marine works sites, etc. Departments will continue to spread the anti-littering message with seasonal appeal to the public to help keep public venues and places clean, especially during festival celebrations. Publicity and education activities will be organised by WG departments while the EPD will continue to coordinate the WG activities and maintain the thematic website. Apart from collaboration with the ECC to promote the “Marine Conservation, Greener and Cleaner Shorelines Programme” under the SEPA Scheme, the EPD will collaborate with ECC to develop teaching materials to educate the younger generation on marine refuse and clean shoreline message.
During the forthcoming outreach activities, the MD will give greater emphasis to the issue of floating refuse during the regular meetings with fisherman organizations. Slide shows, pamphlets and statistics will be used to further publicize the message of keeping the sea clean. Fisherman representatives will be educated about penalties for marine littering at meetings held with MD during regular visits to the fish wholesale markets as part of the routine patrol. With the assistance of the Fish Marketing Organization’s staff, MD patrol officers will inspect the refuse collection facilities of fishing vessels operated at the market to ensure there is proper storage and disposal of refuse generated during the operation. Both MD and AFCD patrol officers will remind workers at the fish and vegetable wholesale markets to properly store their foam boxes to avoid boxes falling into the sea by accident. Beside, staff of AFCD will inspect the market hygiene and enforce the Market Administrative Rules (“the Rules”) for improper depositing of trade refuse. Anyone who contravenes the Rules may result in termination of the stall tenancy.
Measure 3: Provide support measures and facilities to reduce refuse from entering the marine environment. Drinking fountains have been installed at some gazetted beaches, water sports centres, promenades, waterfront parks and recreational sites of some country parks. The LCSD will consider
for 16 more schools.
8 Assistance such as provision of gloves, garbage bags and refuse removal service is required.
25
319475/ENP/ENL/03/09/V6r February 2015 P:\Hong Kong\ENL\PROJECTS\319475_Marine Refuse\03 Deliverables\09 Executive Summary\Rev.8\20150409 Received from EPD\StudyReport(ENG)v8a_20150408.docx
Investigation on the Sources and Fates of Marine Refuse in Hong Kong Study Report
providing more drinking fountains at more gazetted beaches, parks, waterfront promenades and other recreational venues. In particular, the LCSD has planned to install drinking fountains at four beaches in the Sai Kung District and a promenade in the Kowloon City District, namely, Clear Water Bay First Beach, Clear Water Bay Second Beach, Silverstrand Beach and Hung Hom Promenade in 2015 and Trio Beach in 2016. Departments will explore the viability of installing more drinking water fountains along the shoreline and suitable locations and also seek to encourage the public to use the drinking fountains in publicity and education activities.
The Study notes that there is a noticeable increase in floating refuse following heavy rain and adverse weather conditions, since the refuse will enter the sea through water courses and storm water drains. Cleansing at storm water drains would need to be stepped up to remove refuse before and during the rainy seasons. The DSD will continue to try out the installation of floating booms at three new locations in Kowloon City, Yau Tong and Shau Kei Wan to trap floating refuse from drainage outlets.
Departments will review the location, size and number of rubbish bins and waste separations bins at the shores and beaches, and the clearance frequency of the bins to encourage the public to recycle or dispose of their waste properly.
Measure 4: Enhance efforts to remove refuse from the marine environment. Since more floating refuse is observed soon after typhoons, the MD will conduct land-based patrols after typhoons to identify areas which have accumulated floating refuse requiring clean-up once the collection fleet can proceed to work. The MD will increase shoreline cleansing and carry out joint operations with the departments concerned to remove refuse trapped at the rocky bays by deploying foreshore cleansing teams before and during wet seasons. Additional resources will be deployed as necessary.
During wet season, the prevailing south-westerly wind has marked effect on refuse accumulation, and more refuse is also collected especially after heavy rain, as observed at some shorelines in Tuen Mun, Tsuen Wan, Southern District and Islands District. The Study has drawn up a list of priority sites (Appendix E), which are more prone to refuse accumulation and subject to more complaints. Three gazetted beaches are included in the list, since they have more shoreline refuse collected due to their geographical location which makes them more prone to refuse accumulation under the influence of the prevailing wind and heavy rain, apart from human activities in the beach hinterland. Regarding other locations, the list includes a marine park and a marine reserve, and the rest are more remote areas facing the prevailing winds during the wet or dry seasons. These sites are subject to more complaints since the existing cleansing frequency cannot keep up with the pace of refuse accumulation. This Study has therefore suggested the need for adjusting the cleansing frequency in order to remove the accumulated refuse before it becomes an eyesore.
The AFCD and FEHD will strategically enhance the cleansing frequency at priority sites according to the refuse accumulation pattern as concluded by this Study. FEHD will conduct an overview of the cleansing frequency at the priority sites in accordance with the refuse accumulation pattern in the summer and the winter seasons, as appropriate. AFCD plans to increase the cleanup frequencies at the Sha Chau & Lung Kwu Chau Marine Park from three times per week to four times per week and Cape D’Aguilar from once a month to twice a month in 2015-2016. The LCSD’s on-site cleansing contractor at the three gazetted

26
319475/ENP/ENL/03/09/V6r February 2015 P:\Hong Kong\ENL\PROJECTS\319475_Marine Refuse\03 Deliverables\09 Executive Summary\Rev.8\20150409 Received from EPD\StudyReport(ENG)v8a_20150408.docx
Investigation on the Sources and Fates of Marine Refuse in Hong Kong Study Report
beaches listed as priority sites will continue to regularly remove the refuse before it generates complaints. LCSD will also conduct 100 additional ad-hoc cleanups at the priority sites during wet seasons. On top of the enhanced cleansing by government departments, the EPD has identified some locations including the priority sites suitable for special monthly cleanup events to be organised in partnership with NGOs/community groups.
Measure 5: Engage public participation to report marine littering and refuse problem. To complement the patrols by government departments in keeping the shorelines clean, signage, posters or stickers will be put up at prominent seaside locations to remind the public about the 1823 hotline for reporting marine littering from vessels or refuse at sea and coastal areas. The MD will also produce a leaflet to explain the key information that should be provided in reporting marine littering from vessels that would facilitate follow-up by the department. To ensure speedy referral and to enhance co-ordination among departments in handling complaints, the key contacts of relevant government departments will continue to be updated on a regular basis, so that follow up actions such as cleanup could be arranged expeditiously soon after receipt of the complaints and clarification with the complainants on the exact locations.
11. Conclusions
The following summarises the key messages from this study:
Overall, marine refuse does not constitute a serious problem in Hong Kong. Marine refuse, comprised less than 0.5% of municipal solid waste in terms of weight. Non-local refuse item (i.e. items with labelling in simplified Chinese characters) is not a significant problem in most shorelines, but relatively more common in Mirs Bay. However, refuse accumulated at shores or floating on sea becomes a visual amenity problem and an eyesore generating complaints, and could cause impacts to the marine environment threatening the health of ecosystems. Concerted actions from the government and the community should be called for to keep the shorelines clean.
Improper handling and disposal is the major attribution to marine refuse. Marine refuse is mainly a result of littering and poor awareness of the community about the consequence of such behavior. Over 80% of marine refuse originates from land-based sources with shoreline and recreational activities being the predominant activity type contributing to marine refuse. The majority of this refuse becomes floating refuse, which enters the marine environment via stormwater drains, run-offs, or being disposed of irresponsibly at the seaside and got blown into the sea. Education campaigns targeting people carrying out shoreline and recreational activities at beaches, waterfront areas, piers, water sports centres as well as shore users including vessel operators/passengers and fish farmers should be organised.
Marine refuse distribution is mainly affected by prevailing winds. In general, the western and southern part of Hong Kong are more prone to refuse accumulation, particularly, Tuen Mun, Tusen Wan, Southern District and Islands District in wet season due to south-westerly prevailing wind coupled with oceanic flow and discharge of the Pearl River; whereas, Tai Po and Sai Kung will receive more

27
319475/ENP/ENL/03/09/V6r February 2015 P:\Hong Kong\ENL\PROJECTS\319475_Marine Refuse\03 Deliverables\09 Executive Summary\Rev.8\20150409 Received from EPD\StudyReport(ENG)v8a_20150408.docx
Investigation on the Sources and Fates of Marine Refuse in Hong Kong Study Report
marine refuse in dry seasons due to north-easterly prevailing wind and the oceanic flows from north-west.
Education, enforcement and waste prevention and removal are key improvement measures. Drawing reference to the Honolulu Strategy, a recognized global framework for prevention and management of marine debris, a 3-pronged strategy is necessary for Hong Kong to address the local marine refuse problem where strengthened publicity and outreach would be an effective way to instill a sense of responsibility and care for shorelines; enforcement and patrols would have a deterrent effect against irresponsible littering; and finally, waste prevention and removal would reduce the amount of refuse entering the marine environment while timely or enhanced cleanup of marine refuse would reduce refuse accumulation to the extent of becoming an eyesore.
Government and community partnership is crucial to tackle marine refuse problem. Hong Kong
has a long shoreline and considerable amount of resources is required to keep the shorelines clean especially when the refuse sources are diffuse. While the Government has put in place cleansing regimes to remove refuse from the sea, beaches and shorelines, many community organizations have also been conducting regular beach cleanups which play an important part in raising public awareness, and the cleanups themselves improve the local environment for the benefit of all. NGOs’ efforts should be supported and expanded to build up the capacity of the public to co-manage marine refuse problem with the Government through source prevention and community cleanup efforts.

319475/ENP/ENL/03/09/V6r February 2015 P:\Hong Kong\ENL\PROJECTS\319475_Marine Refuse\03 Deliverables\09 Executive Summary\Rev.8\20150409 Received from EPD\StudyReport(ENG)v8a_20150408.docx
Investigation on the Sources and Fates of Marine Refuse in Hong Kong Study Report
Appendix A. Landforms of Hong Kong Shores and the Locations of Survey Sites

319475/ENP/ENL/03/09/V6r February 2015 P:\Hong Kong\ENL\PROJECTS\319475_Marine Refuse\03 Deliverables\09 Executive Summary\Rev.8\20150409 Received from EPD\StudyReport(ENG)v8a_20150408.docx
Investigation on the Sources and Fates of Marine Refuse in Hong Kong Study Report
Appendix A: Landforms of Hong Kong Shores and the Locations of Survey Sites
Investigation on the Sources and Fates of Marine Refuse in Hong Kong Study Report
319475/ENP/ENL/03/09/V6r February 2015 P:\Hong Kong\ENL\PROJECTS\319475_Marine Refuse\03 Deliverables\09 Executive Summary\Rev.8\20150409 Received from EPD\StudyReport(ENG)v8a_20150408.docx
Appendix B. Sample Data Card for the Marine Refuse Surveys

Investigation on the Sources and Fates of Marine Refuse in Hong Kong Study Report
319475/ENP/ENL/03/09/V6r February 2015 P:\Hong Kong\ENL\PROJECTS\319475_Marine Refuse\03 Deliverables\09 Executive Summary\Rev.8\20150409 Received from EPD\StudyReport(ENG)v8a_20150408.docx

Investigation on the Sources and Fates of Marine Refuse in Hong Kong Study Report
319475/ENP/ENL/03/09/V6r February 2015 P:\Hong Kong\ENL\PROJECTS\319475_Marine Refuse\03 Deliverables\09 Executive Summary\Rev.8\20150409 Received from EPD\StudyReport(ENG)v8a_20150408.docx
Investigation on the Sources and Fates of Marine Refuse in Hong Kong Study Report
319475/ENP/ENL/03/09/V6r February 2015 P:\Hong Kong\ENL\PROJECTS\319475_Marine Refuse\03 Deliverables\09 Executive Summary\Rev.8\20150409 Received from EPD\StudyReport(ENG)v8a_20150408.docx
Appendix C. Geographical Distribution of Non-local Items

34 319475/ENP/ENL/03/09/V6r February 2015 P:\Hong Kong\ENL\PROJECTS\319475_Marine Refuse\03 Deliverables\09 Executive Summary\Rev.8\20150409 Received from EPD\StudyReport(ENG)v8a_20150408.docx
Investigation on the Sources and Fates of Marine Refuse in Hong Kong Study Report

Investigation on the Sources and Fates of Marine Refuse in Hong Kong Study Report
319475/ENP/ENL/03/09/V6r February 2015 P:\Hong Kong\ENL\PROJECTS\319475_Marine Refuse\03 Deliverables\09 Executive Summary\Rev.8\20150409 Received from EPD\StudyReport(ENG)v8a_20150408.docx
Appendix D. Summary of Actions under the Improvement Measures

Investigation on the Sources and Fates of Marine Refuse in Hong Kong Study Report
319475/ENP/ENL/03/09/V6r February 2015 P:\Hong Kong\ENL\PROJECTS\319475_Marine Refuse\03 Deliverables\09 Executive Summary\Rev.8\20150409 Received from EPD\StudyReport(ENG)v8a_20150408.docx
Measure 1: Conduct publicity campaigns to engage the community to contribute and participate
1.1 Maintain and improve the dedicated website as a platform for interaction with local community and the public
1.2 Conduct monthly cleanup event coordinated by EPD in partnership with community groups
1.3 Conduct beach cleanup event during the annual sand sculpture competition and beach carnival
1.4 Conduct an underwater cleanup event at selected coral sites
Measure 2: Promote educational message to target groups, students and local community
2.1 Promote waste reduction/clean shorelines messages through programmes for target groups, e.g. visitors to beaches, BBQ sites, visitors’ attractions, camp sites, marine parks, fishermen; users of typhoon shelters and marinas; operators at fish and vegetable wholesale markets and major marine works sites, etc.
2.2 Education against smoking at gazetted beaches (i.e. displaying more posters, stickers and notices to advise visitors not to smoke in non-smoking area at gazetted beaches.)
2.3 Collaborate with Environmental Campaign Committee to promote “Marine Conservation, Greener and Cleaner Shorelines Programme”, and to develop educational tools for students
2.4 Arrange printing of environmental message, including telephone numbers for requesting the collection service, on garbage bags being distributed to vessels in typhoon shelters for collection of their domestic garbage
2.5 Conduct campaigns to promote related themes or messages and to embrace the broader context of “Keeping Hong Kong Clean”
Measure 3: Provide support measures and facilities to reduce refuse from entering the marine environment
3.1 Support community groups in launching cleanup operations and promotional activities by providing guidance information on organizing cleanup operation and publicizing their upcoming cleanup operations on the thematic website, providing gloves and garbage bags, arranging for refuse disposal and rendering assistance upon request
3.2 Support community groups in undertaking educational, research and other projects and activities for understanding, control and prevention of marine refuse
3.3 Provide more drinking fountains at gazetted beaches, parks, waterfront promenades, and other recreational venues
3.4 Conduct more frequent refuse removal from surface drainage (e.g. road gullies, upstream catch-pits, storm drains)
3.5 Continue to try out floating booms at storm drain/culvert outlets

Investigation on the Sources and Fates of Marine Refuse in Hong Kong Study Report
319475/ENP/ENL/03/09/V6r February 2015 P:\Hong Kong\ENL\PROJECTS\319475_Marine Refuse\03 Deliverables\09 Executive Summary\Rev.8\20150409 Received from EPD\StudyReport(ENG)v8a_20150408.docx
3.6 Review the location, size and number of rubbish bins/waste separation bins, and the clearance frequency of the bins
Measure 4: Enhance efforts to remove refuse from the marine environment
4.1 Step up enforcement on marine littering through more regular patrols, and special operations after festive events at coastal locations which are popular places for festival celebration
4.2 Conduct land-based patrols soon after typhoons and organise subsequent cleanup by MD
4.3 Consider deploying additional resources as necessary to set up shoreline cleanup by MD and carry out joint operation with concerned departments to remove refuse trapped at the foreshore during wet seasons
4.4 Step up cleansing at priority areas which are more prone to accumulate marine refuse as identified by the “Marine Refuse Study", and enhance cleanup after festive events at coastal locations which are popular places for festival celebration
Measure 5: Engage public participation to report marine littering and refuse problem
5.1 Put up signage/posters/stickers at prominent locations to encourage the public to report marine littering and refuse problem at sea and coastal areas through the 1823 hotline services
5.2 Educate the public to record key information in reporting marine littering
5.3 Update key contacts of the relevant departments regularly for speedy referral and cleanup in handling complaints/report of marine refuse
Investigation on the Sources and Fates of Marine Refuse in Hong Kong Study Report
319475/ENP/ENL/03/09/V6r February 2015 P:\Hong Kong\ENL\PROJECTS\319475_Marine Refuse\03 Deliverables\09 Executive Summary\Rev.8\20150409 Received from EPD\StudyReport(ENG)v8a_20150408.docx
Appendix E. Marine Refuse Priority Sites

39 319475/ENP/ENL/03/09/V6r February 2015 P:\Hong Kong\ENL\PROJECTS\319475_Marine Refuse\03 Deliverables\09 Executive Summary\Rev.8\20150409 Received from EPD\StudyReport(ENG)v8a_20150408.docx
Investigation on the Sources and Fates of Marine Refuse in Hong Kong Study Report