Embed Size (px)
Citation preview

International Journal of Environmental Pollution Control & ManagementVol. 3, No. 1, January-June 2011; pp. 23-40
INVESTIGATION ON THE MINIMIZATION OF SO2 EMISSIONS AT ADGAS (UAE)PART II – IMPACT ON DAS ISLAND AIR QUALITY
Samir I. Abu-Eishah1 & Haitham S. A. Babahar2
1UAE University, Chemical & Petroleum Engineering, P.O. Box 17555, Al Ain, UAE2Process Engineer, ADGAS Co., P.O. Box 22994, Al Ain, UAE
Abstract: In Part I of this work, two SO2 minimization schemes, namely, Fuel Gas Sweetening (FGS)
and Seawater-Flue Gas Desulfurization (SW-FGD) schemes have been proposed to be implemented atthe ADGAS plant (Das Island, UAE). The implementation of such schemes is expected to reduce the SO
2
emissions by 77%. The FGS scheme is expected to reduce the H2S content in the fuel gas system by 94%
and result in decreasing the total SO2 emissions due to fuel gas usage by 98%. The SW-FGD scheme is
expected to reduce the SO2 emissions due to incomplete sulfur recovery by 99.5%.
This work is based on on-site measurements and data collected from specific locations at the ADGASplant and over the Das Island. These data were loaded into the AERMOD software model and simulatedto predict future air quality on the Island. The SO
2 ground level concentrations (GLCs) were predicted for
the current and proposed SO2 minimization schemes (proposed in Part I of this work) using the BREEZE
AERMOD Pro software model. Upon implementing the proposed SO2 minimization schemes, the predicted
GLCs were found to comply with the (UAE-FEA) standard limit (500 mg/Nm3) at all sites in the ADGASplant and over the Island. Also the remaining SO
2 emissions have the potential to challenge any future
stringent limits set by the UAE-FEA with a high level of confidence since the emission rates afterimplementing the proposed SO
2 minimization schemes will be reduced to about 5% of the current standard
limit (25 mg/Nm3). The contour plots indicate that upon implementation of the proposed SO2 minimization
schemes most of the Das Island area and the Island residential areas will comply with the UAE-FEAstandards.
Keywords: SO2 emissions, Ground Level Concentrations, Air Quality Modelling & Simulation.
1. INTRODUCTION
Throughout its history, the ADGAS Plant at Das Island (UAE) suffers high rates of SO2
emissions. The source of SO2 emissions is mainly coming from the H
2S containment in the
feed natural gas. The SO2 is the dominant air pollutant to the high pollution levels in the Western
Region of the UAE. The high levels of SO2 emissions there necessitate the need to research all
possible means to combat the SO2 impacts. Lewis et al. [1] described a model predictive control
(MPC) that can dramatically result in the minimization of flaring from fuel gas supply networksat the LNG facility at ADGAS. In our opinion, this will also contribute in the reduction ofsulfur-containing gases emitted into the atmosphere.
Globally, the SO2 emitted has the potential to travel in any direction for hundreds of
kilometers depending on climate conditions. SO2 is relatively stable in the atmosphere and has
the ability to travel as far as 1000 km [2]. The health and environmental impacts of SO2 can be

24 / INTERNATIONAL JOURNAL OF ENVIRONMENTAL POLLUTION CONTROL & MANAGEMENT
found elsewhere [3]. Jie [4] constructed a model to study the impact of SO2pollution on health
over 78 Chinese counties and found that, after attaining the threshold (8 µg/m2), continuousincrease in industrial SO
2emission density will raise the ratio of population suffering chronicle
diseases, among which respiratory diseases occupy a significant proportion.
In general, the workers of ADGAS (and other inhabitants) are subject to be exposed tothe outdoor air at all locations within the Das Island during their stay time. There is a lack of long-term studies on the effect of exposure on the health of the workers there. Such studies will help indetermining the highest continuous exposure time an employee can withstand during his stay atthe Island. In fact, the average exposure duration for the Das Island inhabitants to the various SO
2
ground level concentrations (GLCs) for the various time averages cannot yet be easily determined.
The aim of Part I of this work was to explore feasible technologies that can be implementedin the ADGAS plant at Das Island (UAE) that will result in minimizing SO
2 emissions [5]. Two
modifications on the SO2 minimization schemes have been proposed and suggested to be applied
on the current Fuel Gas Sweetening (FGS) and Flue Gas Desulfurization (FGD) systems. It isworth noting that the effect of implementing the SO
2 minimization schemes on plant operations
through the FGS and FGD schemes aspects has been discussed elsewhere [5]. The total SO2
emission rates from ADGAS three LNG trains under current and proposed SO2 minimization
schemes are presented in Table 1. The contribution of the various sources at the ADGAS planttoward total SO
2 emission rates at current and proposed conditions is shown in Figure 1.
Table 1Total SO
2 Emissions (ton/yr) at Current vs. Proposed SO
2 Minimization
Schemes from Various Sources at ADGAS
Source Current Proposed % Reduction
Fuel Gas Usage 10,092 168 98.34Incomplete Sulfur Recovery 11,299 57 99.50Continuous Flaring of Flash Gas 6,140 6,140 0.00Total 27,532 6,364 76.88
Figure 1: Contribution of ADGAS Sources Toward Total SO2 Emission Rates under Current and
Proposed SO2
Minimization Schemes

INVESTIGATION ON THE MINIMIZATION OF SO2 EMISSIONS AT ADGAS… / 25
Based on the results of part I of this work [5], the current contribution of fuel gas usage ofTrains 1 & 2 is 37% of the total SO
2 emissions (Figure 1). Upon implementation of the proposed
FGS scheme, the total SO2 emissions due to fuel gas usage will be reduced by 98.34% (Table 1)
and result in reducing the contribution of fuel gas usage to only 3% of the total SO2 emissions.
On the other hand, the current contribution of the Sulfur Recovery Units (SRUs) to the totalSO
2 emissions is 41% (Figure 1) and upon implementation of the proposed FGD scheme the
SO2 emissions due to incomplete sulfur recovery in the SRUs will be reduced by 99.50%
(Table 1) and it will become only 1% of the total SO2 emissions upon the implementation of the
proposed SO2 minimization schemes.
Furthermore, the implementation of the proposed schemes is expected to result in reducingthe total SO
2 emissions from the ADGAS plant by 76.88% (Table 1) and it will result in
minimizing the SO2 emissions from the fuel gas usage and incomplete sulfur recovery but
leaves the SO2 emissions from the continuous flaring of flash gas (CFFG) as the main contributor
to the total SO2 emissions. If the contribution of the flash gas flaring is excluded, the SO
2
minimization schemes will reduce the SO2 emissions by 98.96% (from 21,391 to 224 ton/yr),
which can be considered as the optimum minimization level [5].
The ultimate goal of this work is to minimize SO2 emissions thus have better air quality
and consequently better environmental and occupational health impacts for the residents of theDas Island. The “BREEZE AERMOD GIS Pro” has been used in this work as the air qualitymodel to establish and predict the baseline of the SO
2 GLC at the Das Island post the
implementation of the proposed SO2 minimization schemes. More about the AERMOD steady-
state air dispersion model can be found elsewhere [6-9].
Al-Nuaimi [10] studied the effect of upgrading of the SRUs at the ADGAS plant fromconventional Claus® to SuperClaus® technology and used AERMOD to only estimate the highestSO
2 GLCs at the Das Island. The study resulted in a maximum reduction of 33.9%, 0% and
11.4% for the 1-h, 24-h and 1-yr base, respectively. Deligiorgi et al. [11] have used AERMODsteady-state dispersion model to model air pollutant emission from a power plant and identifiedthe dispersion patterns in complex topography in the Chania plain on the Crete Island (Greece).The meteorological assessment is based on a two year dataset (August 2004 – July 2006) fromsix automated surface meteorological stations. Case studies of the predicted ground-leveldistributions of SO
2 are presented for days with commonly observed meteorological phenomena.
Saqer & Al-Haddad [12] used AERMOD to estimate the total emissions of SO2, non-methanated
hydrocarbons (VOCs) and NOx from flares in two petroleum refineries and assessed the impact
of these pollutants on air quality in industrial and suburban areas in Kuwait.
Currently the Das Island is lacking continuous monitoring of SO2 GLCs, which is the
indicator of effectiveness of any minimization scheme. However, starting from 2003, ADGAShired a private company to carry out air quality monitoring at Das Island twice a year. Variouspollutants, including SO
2, are measured at specific locations for a period of 24-h. The used
methodology in this work includes the following:
• Establishing the design basis for the AERMOD GIS Pro software in order topredict the SO
2 ground-level concentrations under current conditions and predict the
26 / INTERNATIONAL JOURNAL OF ENVIRONMENTAL POLLUTION CONTROL & MANAGEMENT
1-h, 24-h and 1-year SO2 levels on the Das Island. This will acquire site meteorological
and air quality data, selection of receptors locations for SO2 GLCs, and characteristics
and rates of all SO2 emission sources from the ADGAS plant.
• Using the AERMOD GIS Pro software to predict the SO2 ground-level concentrations
upon implementing the proposed fuel gas sweetening and flue gas desulfurizationschemes by simulating the 1-h, 24-h and 1-year SO
2 levels over the Das Island.
• Exploring the compliance of the predicted SO2 emission levels upon implementation
of the proposed SO2 minimization schemes to the United Arab Emirates Federal
Environment Agency (UAE-FEA) standards.
2. DESIGN BASIS FOR THE AERMOD GIS PRO SOFTWARE
The design basis for running the BREEZE AERMOD Pro software includes (1) physicalcharacteristics of all SO
2 emission sources, (2) locations of the selected receptor within the Das
Island where the SO2 GLCs are to be predicted, and (3) SO
2 emission rates from the various
sources at the ADGAS plant under current conditions. These data, along with site meteorologicaldata, are required to run the AERMOD air dispersion model to simulate the background SO
2
GLCs and predict them once the proposed SO2 minimization schemes are implemented.
2.1. Site Meteorological Data
The meteorological data of the site at hand has to be possessed, and if not available, wellestablished meteorological data at the nearest station has to be used. Since the meteorologicaldata of the Das Island is not available, then the meteorological data of the nearest station(Abu Dhabi International Airport) have been used in running the AERMOD air dispersionmodel. The data for the years 2003 to 2007 have been collected and used to study themeteorological effects on the SO
2 GLCs at the Das Island. In fact, the meteorological data for
numerous locations around the world are available through “AERMOD GIS Pro”. Acquisitionof such data from the “AERMOD GIS Pro” supplier is considered the best choice becausethese data are reliable and accurate and the supplier provides the necessary data in a format thatsuits the software itself.
2.2. Receptors’ Locations for Prediction of SO2 Ground Level Concentration
Three locations were selected as receptors for prediction of the SO2 GLCs over the Das Island.
The physical characteristics of these receptors are given in Table 2.
Table 2Receptors’ Locations for the SO
2 GLCs Prediction
Receptor Location E(m) : N(m) Latitude Longitude
Al-Jimi Camp (Contractors housing area) 1457 : 3148 25.148737 52.878168Al-Sahil Accommodation (Housing area for 1803 : 3075 25.144231 52.872718
ADGAS and ADMA-OPCO employees)Sailing Club (Popular outdoor recreation 1772 : 3075 25.142212 52.880448
area at Das Island)

INVESTIGATION ON THE MINIMIZATION OF SO2 EMISSIONS AT ADGAS… / 27
2.3. Physical Characteristics of the SO2 Emission Sources
The physical characteristics of the SO2 emission sources include the physical parameters and
SO2 emission rates from each emission source. The locations of the SO
2 emission sources have
been obtained from the ADGAS plant records and placed on the Das Island Map. Each locationwas oriented through the determination of its longitude and latitude ordinates. The diameterand height of each emission source were also obtained. The available physical data were thencollected from the data sheets of each stack at the ADGAS plant. See Table 3.
Table 3SO
2 Emission Sources, Location: Average Latitude and Longitude, and Stack Height and Diameter*
Emission Source (Stacks) No. Latitude Longitude Height range (m) Diam. range (m)
Boilers 6 25.16252 52.87633 30.9 - 43.3 (37) 3.5 - 3.8 (3.6)Regeneration Gas Heater 4 25.16077 52.87480 26.4 (26.4) 1.32 (1.32)Gas Turbines 5 25.15777 52.87206 13 - 20 (18.6) 3.25 - 3.84 (3.49)SRU Incinerators 3 25.16023 52.87661 46 - 70.3 (54.1) 2 - 4.23 (2.73)Flares 9 25.16410 52.87780 10 - 75 (58.9) 0.6 - 1.8 (0.96)* Numbers in parenthesis are average values.
2.4. Estimation of SO2 Emission Rates from Various Sources at ADGAS
All the data necessary to estimate the SO2 emission rates from all sources were collected. The
SO2 emission rate (kg/h) from each source was determined using the data available from the
fuel gas usages (that are emitted from all non-flare sources such as boilers and gas turbines)and the data from flared gases in the continuous flaring of flashed gas sources. The data acquiredare the flow rates (mol/h) and the H
2S concentration (mol %) of the fuel gas usage and flare gas
systems. The SO2 emission rates were then calculated based on the following equations (1 and 2):
2H2S (g) + 30
2 (g) → 2SO
2 (g) + 2H
2O (g) (1)
( )%( / ) SO
mol H S mol SO kg kmolSO Emission Rate kg h MW Gas Flow
mol H S kmol h
= 2 2
2 22
1100
(2)
Table 4 presents a summary of the estimated H2S and SO
2 emission rates under current
conditions from the various sources at ADGAS. Table 5 summarizes the SO2 emission rates at
the current and proposed SO2 minimization conditions as well as per cent reduction in SO
2
emission upon implementation of the proposed minimization schemes.
3. PREDICTION OF SO2 GROUND LEVEL CONCENTRATIONS
The main objective of air quality models is, in general, to simulate and/or predict the ambientlevel concentrations of any pollutant given the necessary emissions’ source data(i.e., stack size, location and emission rate), and terrain description and meteorological data ofthe site of interest. Typical outputs of any air quality model include location and magnitude ofthe pollutant highest GLC and the magnitude of the pollutant GLC at specified receptor locations.Air quality models are also used to verify air quality standards’ compliance of existing orproposed industrial facilities, and to assist in the design of effective control strategies to reduceemissions of harmful air pollutants [13].

28 / INTERNATIONAL JOURNAL OF ENVIRONMENTAL POLLUTION CONTROL & MANAGEMENT
Table 4Estimated H
2S and SO
2 Emission Rates from Various Sources at ADGAS under Current Conditions
Emission Sources No H2S Flow rate Total SO
2
(mol %) (each) emission rate(kmol/h) (ton/day)
Boilers 1, 2, 3, & 4 4 0.08 1,159.99 2081.08
Boilers 5 & 6 2 0.0004 1,522.27 6.82
Fired Heaters of Plant 3 & 9 - Trains 1 & 2 2 0.12 32.48 87.41
Combined Flares - Trains 1 & 2 (Pilot) 2 0.12 0.45 1.21
Sweet & Sour Flares (Purge & Pilot) - Trains 1 & 2 2 0.0004 9.42 0.09
Sour Flare (Carbonate Flash Gas) - Trains 1 & 2 2 7.67 29.87 4636.71
Sour Flare (DEA Flash Gas) - Trains 1 & 2 2 0.06 9.96 13.40
Continuous Sweet & Sour Flare (Purge & Pilot) - Train 3 1 0.0004 9.42 0.02
Sour Flares (Carbonate Flash Gas) -Train 3 1 4.95 14.94 1503.36
Sour Flares (DEA Flash Gas) - Train 3 1 0.11 4.98 3.07
Sour Flares (Excess Fuel Gas) - Train 3 1 0.0004 149.37 0.33
Gas Turbines (GT-1, GT-2 & GT-3) 3 2.22 198.98 7429.64
LG Turbines (LG-5 & LG-6) 2 0.12 348.44 468.84
Purge & Pilot Flares of LNG/LPG & LPG Tankage 2 0.0004 37.68 0.17
Purge & Pilot Burners of Sour (Warm) Liquid & LNG 2 0.0004 37.68 0.17
SRU Incinerators - Trains 1 & 2 2 0.17 4,735.90 9027.44
SRU Incinerator - Train 3 1 0.13 3,117.40 2271.96
Total 27531.71
Table 5SO
2 Emission Rates from ADGAS Plant under Current and Modified SO
2 Minimization Schemes
Emission Source Current Total Modified Total % Reduction(ton/year) (ton/year)
Combined Sweet & H2S Flare - Trains 1 & 2 1.60 0.08 94.75
Sour Gas High Level Flare - Trains 1 & 2 4,636.71 4,636.71 0.00
Sour Gas High Level Flare - Train 3 1,503.36 1,503.36 0.00
LNG / LPG Flare, LPG Tankage Flare, Sour 12.69 0.66 94.75
(Warm) Liquid Burner
LNG Burner 12.68 0.67 94.75
Power Generation Gas Turbine 468.84 28.18 93.99
ADMA Power Generation Gas Turbine 7,429.77 23.07 99.69
Plant 3 Regeneration Gas Heater 43.70 2.64 93.97
Plant 9 Regeneration Gas Heater 41.78 2.52 93.95
Plant 31 Boilers 1, 2, 3, & 4 2,081.08 109.88 94.72
SRU Incinerator - Trains 1 & 2 9,027.44 45.14 99.50
SRU Incinerator - Train 3 2,271.96 11.36 99.50
Total 27,531.61 6,364.27 76.88

INVESTIGATION ON THE MINIMIZATION OF SO2 EMISSIONS AT ADGAS… / 29
In fact, the absence of continuous SO2 GLC monitoring on the Das Island necessitates the
use of air quality models in order to simulate the SO2 GLCs under current conditions and reveal
the effectiveness of the proposed SO2 minimization schemes on the SO
2 GLCs, in particular,
and air quality over the Island, in general.
3.1. Measured vs. Predicted SO2 GLCs at the Selected Receptors
A comparison between the measured and AERMOD predicted 24-h highest SO2 GLCs at the
three receptors for the years 2003 to 2007 are shown in Table 6. In fact, AERMOD only predictsthe highest pollutant GLC for a given average. So for various receptors, AERMOD predicts the24-h highest SO
2 GLCs for a given year. As seen in Table 6, the predicted SO
2 GLC is not
occurring in the period when the actual SO2 GLC measurements were made. Thus, the AERMOD
model cannot be verified for the ADGAS SO2 GLC database because the available data are not
sufficient for validation purposes. In addition, the measured SO2 GLCs are not indicative because
there is a possibility that the meteorological conditions during the test period allow for the SO2
GLCs to be lower than should be. Thus, the ADGAS meteorological data cannot indicate theactual air quality conditions for the SO
2 pollutant.
In order to solve this problem and get reliable and accurate results, the meteorologicalavailable from the “AERMOD GIS Pro” supplier have been ordered and used in this work.These data are considered indicative since they average the SO
2 GLCs for the whole year and
indicate the highest SO2 GLCs that can be reached at any selected location. In this case, the
AERMOD predictions were then used as a basis to any decision related to the evaluation of theimpact of SO
2 emissions from the ADGAS plant.
Table 6Measured vs. AERMOD-Predicted 24-h Highest SO
2GLCs for the years 2004 to 2007
Location Date Measured GLC Predicted GLC(µg/m3) (µg/m3) (Date)
Al Sahil 18-05-2004 18 124.9420-05-2004 21 (26-09-2004)21-05-2004 4
5/12/2004 106/12/2004 107/12/2004 6
16-03-2005 86 203.2617-03-2005 78 (19-03-2005)18-03-2005 4217-11-2005 6918-11-2005 3619-11-2005 5113-06-2006 60 94.2814-06-2006 49 (17-08-2006)15-06-2006 7111/11/2006 3412/11/2006 4013-11-2006 37
Contd...

30 / INTERNATIONAL JOURNAL OF ENVIRONMENTAL POLLUTION CONTROL & MANAGEMENT
Location Date Measured GLC Predicted GLC(µg/m3) (µg/m3) (Date)
6/9/2007 13 142.117/9/2007 12 (15-04-2007)8/9/2007 18
Sailing Club 18-05-2004 87 136.9021-05-2004 21 (08-02-2004)23-05-2004 8
5/12/2004 106/12/2004 146/12/2004 17
16-03-2005 67 118.8217-03-2005 172 (24-03-2005)18-03-2005 8117-11-2005 4418-11-2005 1219-11-2005 3013-06-2006 44 111.0614-06-2006 63 (30-01-2006)15-06-2006 4011/11/2006 6312/11/2006 11613-11-2006 83
6/9/2007 88 150.137/9/2007 109 (19-03-2007)8/9/2007 97
Al Jimi Camp 18-05-2004 9 187.5720-05-2004 85 (16-03-2004)21-05-2004 4622-05-2004 6623-05-2004 7924-05-2004 67
5/12/2004 386/12/2004 797/12/2004 648/12/2004 98
16-03-2005 103 221.2117-03-2005 136 (30-12-2005)18-03-2005 10517-11-2005 12918-11-2005 5119-11-2005 6514-06-2006 89 194.9215-06-2006 76 (10-07-2006)16-06-2006 69
4/11/2006 13412/11/2006 10913-11-2006 125
6/9/2007 82 192.177/9/2007 96 (11-03-2007)8/9/2007 68

INVESTIGATION ON THE MINIMIZATION OF SO2 EMISSIONS AT ADGAS… / 31
3.2. Temporal Variations of Highest SO2 GLC Distribution
The temporal variations in the SO2 highest GLC averages over the Das Island for the years
2003 to 2007 show similar trends for the 1-h, 24-h and 1-yr toward the distribution of theSO
2 GLC highest averages. This can be observed through examining the location of the highest
SO2 GLC averages, and the comparison of SO
2 GLCs at the selected receptors.
3.2.1. Location of the Highest Averages of the SO2 GLCs
Currently, the 1-h highest SO2 levels are centered in the mid-west part of the Island; more
specifically at the end of the Das Island Airport runway. This runway is used by individuals forexercise and run around in the evening (the last flight leaves Das Island at 2 pm). Thus thismight lead to increasing the potential of exposure to high SO
2 concentrations. The 24-h highest
SO2 levels occur in either the middle of the Island (for 2003, 2004 and 2006) or in the north-
west part of the Island (for 2005 and 2007). The middle area of the Island is an empty areawhere almost no activities take place while the north-west area is an industrial area. The 1-yrhighest SO
2 levels take place either in the middle of the Island (for 2005, 2006 and 2007) or in
the north-east part of the Island (for 2003 and 2004) toward the LNG/LPG storage tanks area.It has been noticed under the current conditions that the locations of the highest predicted SO
2
GLCs at the Das Island are not much affected over the 5-years test period.
3.2.2. Comparison of the SO2 GLCs at the Selected Receptors
The average 1-h, 24-h and 1-yr, the mean and the standard deviation (SD) of the SO2 levels at
the selected receptors are presented in Table 7. The standard deviations for the 1-h, 24-h and 1-yr averages of the highest SO
2 level are considered low; hence this indicates that the predicted
SO2 levels at each receptor for the specified duration are close to each other. This in turn
implies that the variations in SO2 levels over the 5-years period is small, and, therefore, the
effect of yearly-temporal variations does not impact the SO2 levels at the specified receptors.
Table 7Highest Average SO
2 GLCs at the Selected Receptors for the Years 2003 to 2007
1-h (µg/m3)
Location 2003 2004 2005 2006 2007 Mean SD, %
Al-Sahil 587.32 587.37 579.69 586.75 585.96 585.42 2.91Sailing Club 373.56 377.45 362.67 383.68 384.11 376.29 7.87Al-Jimi 484.64 490.41 493.99 486.70 486.64 488.48 3.33
24-h (µg/m3)
Location 2003 2004 2005 2006 2007 Mean SD, %
Al-Sahil 118.97 124.94 203.26 94.28 142.11 136.71 36.64Sailing Club 119.79 136.90 118.82 111.06 150.13 127.34 14.18Al-Jimi 239.47 187.57 221.21 194.92 192.17 207.07 20.00
1-yr (µg/m3)
Location 2003 2004 2005 2006 2007 Mean SD, %
Al-Sahil 22.27 20.62 32.29 28.45 27.43 26.21 4.25Sailing Club 32.39 34.24 39.84 35.21 36.76 35.69 2.51Al-Jimi 45.57 47.43 61.26 49.49 52.46 51.24 5.51
32 / INTERNATIONAL JOURNAL OF ENVIRONMENTAL POLLUTION CONTROL & MANAGEMENT
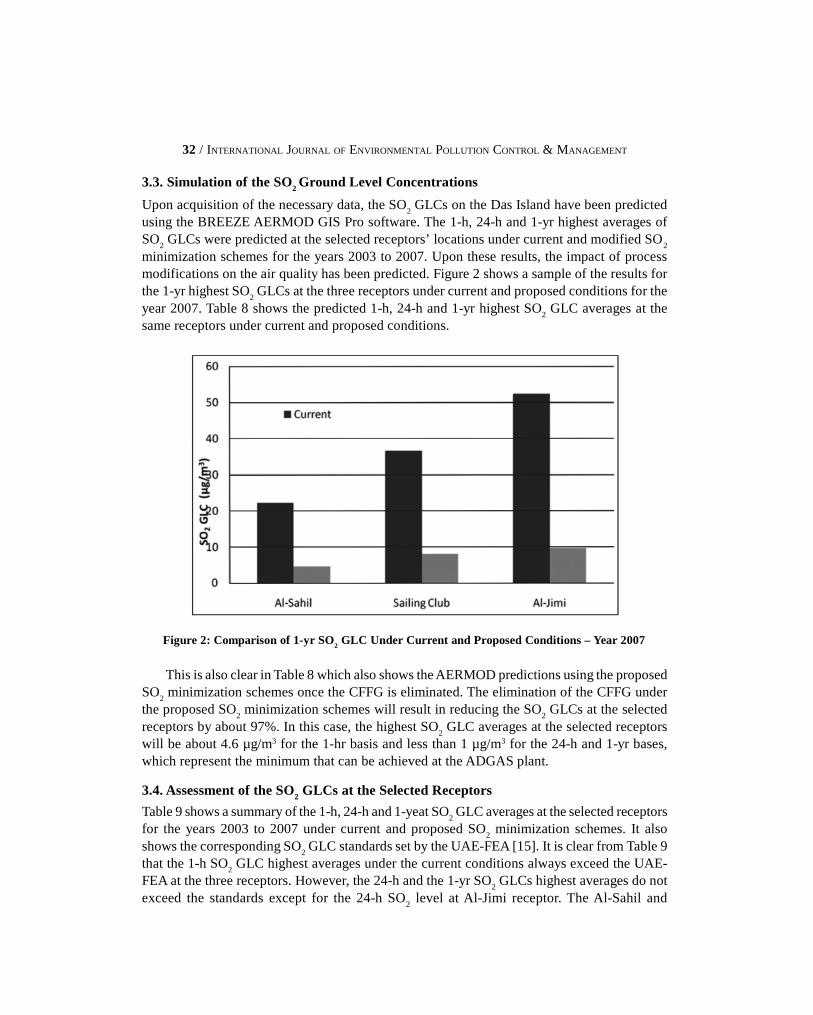
3.3. Simulation of the SO2 Ground Level Concentrations
Upon acquisition of the necessary data, the SO2 GLCs on the Das Island have been predicted
using the BREEZE AERMOD GIS Pro software. The 1-h, 24-h and 1-yr highest averages ofSO
2 GLCs were predicted at the selected receptors’ locations under current and modified SO
2
minimization schemes for the years 2003 to 2007. Upon these results, the impact of processmodifications on the air quality has been predicted. Figure 2 shows a sample of the results forthe 1-yr highest SO
2 GLCs at the three receptors under current and proposed conditions for the
year 2007. Table 8 shows the predicted 1-h, 24-h and 1-yr highest SO2 GLC averages at the
same receptors under current and proposed conditions.
Figure 2: Comparison of 1-yr SO2 GLC Under Current and Proposed Conditions – Year 2007
This is also clear in Table 8 which also shows the AERMOD predictions using the proposedSO
2 minimization schemes once the CFFG is eliminated. The elimination of the CFFG under
the proposed SO2 minimization schemes will result in reducing the SO
2 GLCs at the selected
receptors by about 97%. In this case, the highest SO2 GLC averages at the selected receptors
will be about 4.6 µg/m3 for the 1-hr basis and less than 1 µg/m3 for the 24-h and 1-yr bases,which represent the minimum that can be achieved at the ADGAS plant.
3.4. Assessment of the SO2 GLCs at the Selected Receptors
Table 9 shows a summary of the 1-h, 24-h and 1-yeat SO2 GLC averages at the selected receptors
for the years 2003 to 2007 under current and proposed SO2 minimization schemes. It also
shows the corresponding SO2 GLC standards set by the UAE-FEA [15]. It is clear from Table 9
that the 1-h SO2 GLC highest averages under the current conditions always exceed the UAE-
FEA at the three receptors. However, the 24-h and the 1-yr SO2 GLCs highest averages do not
exceed the standards except for the 24-h SO2 level at Al-Jimi receptor. The Al-Sahil and

INVESTIGATION ON THE MINIMIZATION OF SO2 EMISSIONS AT ADGAS… / 33
Table 8Predicted SO
2 GLCs (µg/m3) under Current and Proposed SO
2Minimization Schemes and Post
Elimination of Continuous Flaring of Flash Gas (CFFG) at the Three Selected Receptors’ Locationsfor the Years 2003 to 2007
Year Location Condition 1-h Highest 24-h Highest 1-yr Highest
2003 Al-Sahil Current 587.32 118.97 22.27Proposed 230.57 36.02 4.59Proposed + CFFG 4.78 0.68 0.12
Sailing Club Current 373.56 119.79 32.39Proposed 253.41 31.61 7.06Proposed + CFFG 4.02 0.73 0.21
Al-Jimi Current 484.64 239.47 45.57Proposed 218.89 40.07 8.03Proposed + CFFG 5.11 0.97 0.28
2004 Al-Sahil Current 587.37 124.94 20.62Proposed 203.70 30.25 3.90Proposed + CFFG 4.74 0.82 0.12
Sailing Club Current 377.45 136.90 34.24Proposed 216.02 38.18 7.49Proposed + CFFG 4.05 0.76 0.21
Al-Jimi Current 490.41 187.57 47.43Proposed 255.77 41.34 8.01Proposed + CFFG 4.91 1.03 0.29
2005 Al-Sahil Current 579.69 203.26 32.29Proposed 317.44 31.03 4.35Proposed + CFFG 4.64 1.16 0.18
Sailing Club Current 362.67 118.82 39.84Proposed 333.13 46.75 7.12Proposed + CFFG 3.93 0.92 0.25
Al-Jimi Current 493.99 221.21 61.26Proposed 376.00 65.48 9.69Proposed + CFFG 5.18 1.19 0.38
2006 Al-Sahil Current 586.75 94.28 28.45Proposed 200.22 30.60 5.19Proposed + CFFG 4.73 0.69 0.16
Sailing Club Current 383.68 111.06 35.21Proposed 227.14 42.16 8.91Proposed + CFFG 4.07 0.86 0.23
Al-Jimi Current 486.70 194.92 49.49Proposed 258.21 54.31 10.66Proposed + CFFG 5.09 1.08 0.32
2007 Al-Sahil Current 585.96 142.11 27.43Proposed 210.88 34.92 4.76Proposed + CFFG 4.72 0.72 0.15
Sailing Club Current 384.11 150.13 36.76Proposed 240.25 47.68 8.06Proposed + CFFG 5.22 1.14 0.23
Al-Jimi Current 486.64 192.17 52.46Proposed 283.25 53.00 9.76Proposed + CFFG 4.05 1.52 0.32

34 / INTERNATIONAL JOURNAL OF ENVIRONMENTAL POLLUTION CONTROL & MANAGEMENT
Al-Jimi receptors show SO2 levels ≥ 500 µg/m3 for the 1-h average periods; this imposes serious
health effects as per the WHO Air Quality Guidelines [16]. The 24-h SO2 levels at the receptors
frequently comply with UAE-FEA standards but are far exceeding the WHO 24-h set standards(20 µg/m3). Exposure to such levels may exert serious health effects as indicated by the recordedWHO studies [16]. The 1-yr SO
2 levels at the three receptors always comply with UAE-FEA at
the three selected receptors. In general, the ambient air quality at Das Island under thecurrent conditions with respect to SO
2 GLCs is considered deteriorated and has the potential
to impact the health of the residents of the Island as high SO2 levels are experienced in the
residential areas.
Table 9SO
2 GLCs under Current and Proposed SO
2 Minimization Schemes for the Selected Receptors
1-h SO2 GLC (µg/m3)
Location UAE-FEA Standard Current Proposed % Reduction
Al-Sahil 350 585.42 232.56 60.3
Sailing Club 350 376.29 253.93 32.5
Al-Jimi 350 488.48 278.42 43.0
24-h SO2 GLC (µg/m3)
Location UAE-FEA Standard Current Proposed % Reduction
Al-Sahil 150 136.71 32.56 76.2
Sailing Club 150 127.34 41.28 67.6
Al-Jimi 150 207.07 50.84 75.4
1-yr SO2 GLC (µg/m3)
Location UAE-FEA Standard Current Proposed % Reduction
Al-Sahil 60 26.21 4.56 82.6
Sailing Club 60 35.69 7.73 78.3
Al-Jimi 60 51.24 9.23 82.0
3.5. Spatial Distribution of Highest SO2 Ground Level Concentrations
The BREEZE AERMOD GIS Pro software has been used in this work to generate thecontour plots of the predicted SO
2 GLCs over the Das Island. The generated contour plots
for the 1-yr highest average under current and proposed SO2 minimization schemes for the
year 2007 are shown in Figures 3 and 4, respectively, for comparison purposes. Thecomplete set of the contour plots of the SO
2 GLC distribution over the Das Island is available
elsewhere [17].
Based on these contour plots, the highest 1-h highest averages under current conditionsoccur in the central-west part of the Das Island (residential area). The 24-h highest averagesoccur in the middle and north-west parts of the Island and the 1-yr highest averages occur in themiddle and north-east parts of the Island. Thus under the current conditions, the 1-h, 24-h and1-yr SO
2 GLCs frequently exceed the standard limits [15]. Table 10 shows the SO
2 highest
GLCs under current and proposed SO2minimization schemes for the years 2003 to 2007.

INVESTIGATION ON THE MINIMIZATION OF SO2 EMISSIONS AT ADGAS… / 35
Table 10Highest SO
2 GLCs (µg/m3) at Das Island Under Current and Proposed SO
2 Minimization Schemes
Basis UAE-FEA Condition 2003 2004 2005 2006 2007 AverageStandard [15]
1-h 350 Current 1988 1674 1708 2024 1953 1869Proposed 659 642 630 603 647 636
24-h 150 Current 496 373 425 485 758 507Proposed 157 134 159 168 170 158
1-yr 60 Current 66 69 92 70 74 74Proposed 35 37 46 33 35 37
As seen in Table 10, the current conditions highest SO2 levels within Das Island, over the
years 2003-2007, frequently exceed the standard limits set by the UAE-FEA. The 1-h highestSO
2level is 1869 µg/m3 (0.65 ppm). However, exposure to 0.15-0.25 ppm SO
2 (which is less than
the current highest 1-h level at Das Island) has the potential to cause cardio respiratory effects tohuman body. The WHO limit is not to exceed 500 µg/m3SO
2 in 10-minutes periods as this imposes
health risks on humans in the form of changes in pulmonary functions and respiratory symptoms[16]. On the other hand, the 24-h highest average SO
2 level is 507 µg/m3 (or 0.18 ppm); the WHO
24-h average limit is 20 µg/m3. The effect of this is similar to that of the 1-h highest level. Moreover,the 1-yr highest average SO
2 level is 74 µg/m3 (or 0.02 ppm); long time exposure to such
concentration may have serious effects. Thus, the 1-h, 24-h and 1-yr highest SO2 levels under the
current conditions represent threat to the health of the Das Island residents.
Table 10 also shows the highest SO2 levels at Das Island, over the years 2003 to 2007,
upon implementation of the proposed SO2 minimization schemes. The 1-h highest SO
2 level is
636 µg/m3 (or 0.22 ppm); the exposure to such level is associated with cardio respiratory responseeffect on human health. The 24-h and 1-yr highest SO
2 levels are 158 and 37 µg/ m3, respectively;
the exposure to such levels has the potential to affect the health of the Island residents. However,none of these highest GLC levels exceed the UAE-FEA standards.
Lastly, it should be kept in mind that upon implementation of the proposed SO2 minimization
schemes, the highest 1-h, 24-h and 1-yr SO2 levels will be shifted to the north and north-east
parts of the Island. The north-east art of the Island is no more than an industrial area. SeeFigures 3 and 4. This shift in SO
2 levels to non-residential areas is justified by the elimination
of the SO2 emissions from the ADMA Gas Turbines (GTs) and the SRU incinerators of Trains
1, 2 and 3. In this case the only remaining contributor to the SO2 emissions at the Island is the
CFFG from the fuel gas sweetening units of Trains 1, 2 and 3, which as mentioned above, canbe routed back to the ADGAS plant gas feed inlet and will result in the reduction of the SO
2
levels to much less than the UAE-FEA standard limits.
4. COMPLIANCE OF THE PREDICTED SO2 EMISSION LEVELS TO THEUAE-FEA STANDARDS UPON IMPLEMENTATION OF THE PROPOSED
SO2 MINIMIZATION SCHEMES
Currently, the SO2 emission from the ADMA-GTs and the SRU incinerators of Trains 1, 2 and
3 are not complying with UAE-FEA standard limits. Also, the current SO2 emission rates from

36 / INTERNATIONAL JOURNAL OF ENVIRONMENTAL POLLUTION CONTROL & MANAGEMENT
Figure 3: Contour Plot of the 1-yr Highest Average SO2 GLCs Under Current Conditions, Year 2007
Figure 4: Contour Plot of the 1-yr Highest Average SO2 GLC Under Modified SO
2Minimization
Schemes, Year 2007

INVESTIGATION ON THE MINIMIZATION OF SO2 EMISSIONS AT ADGAS… / 37
the Fuel Gas Users of Trains 1 & 2 are 89.54% of the UAE-FEA standard limits. This makesthese sources susceptible to exceeding these limits in case of malfunction (sudden decrease inthe UGAs removal efficiency as a result of process parameters changes). However, uponimplementation of the proposed FGS scheme the SO
2 emission rates (from the Fuel Gas Users
of Trains 1 & 2) will be only 5.37% of the UAE-FEA limits (i.e., it will decrease the currentSO
2emission rates by 94%). Furthermore, Table 11 shows that the implementation of the
proposed SO2 minimization schemes has resulted in all SO
2 emission sources at the ADGAS
plant to comply with the UAE-FEA limits and have the potential to challenge any future stringentlimits imposed by the UAE-FEA with high level of confidence.
The compliance of the SO2 levels with the UAE-FEA standards for the 1-h, 24-h and 1-yr
at the Das Island have been plotted using the BREEZE AERMOD GIS Pro software. Figure 5is the 1-yr compliance plot under current and proposed SO
2 minimization schemes for the year
2007. The complete set of the compliance plots is available elsewhere [17]. Table 11 shows thecompliance results for the ADGAS plant SO
2 emission sources under current conditions and
after implementation of the proposed SO2 minimization schemes.
Figure 5: Compliance Plot of the 1-yr SO2 GLC Under Current (left) and Modified
(Right) SO2
Minimization Schemes for the Year 2007
Table 11Compliance of the Various SO
2 Emission Sources at ADGAS to the UAE-FEA Standards
Equipment UAE-FEA Standard Current Proposed % Proposed /(mg/Nm3) (mg/Nm3) (mg/Nm3) Reduction FEA (%)
Boilers 1, 2, 3 and 4 500 290 15.40 97.7 1.95ADMA-GTs 500 8554 26.84 99.7 5.37Trains 1 & 2 Fuel Gas Users 500 448 26.84 94.0 5.37Trains 1 & 2 SRU Incinerators 500 4854 24.28 99.5 4.86Train 3 SRU Incinerator 500 3712 18.55 99.5 1.99

38 / INTERNATIONAL JOURNAL OF ENVIRONMENTAL POLLUTION CONTROL & MANAGEMENT
On the other hand, Table 12 summarizes the main observations of the spatial distributioncompliances at the current and proposed SO
2 minimization schemes.
Table 12Compliances of SO
2 GLCs Spatial Distribution Under Current and Proposed SO
2
Minimization Schemes
Basis Current Conditions Proposed Conditions
1-h All of the Das Island areas do not comply Generally, the northern part of the Das Islandwith the UAE-FEA standards (350 µg/m3) exceeds the limits. Residential areas comply with
the standards. The highest concentration is about650 µg/m3, which is 32.5% of the highest currentaverage (2000 µg/m3)
24-h Most of the Das Island areas do not comply All of the Das Island areas comply with the UAE-with the UAE-FEA standards (150 µg/m3) FEA standards (150 µg/m3)
1-yr Most of the Das Island areas comply with All of the Das Island area complies with the UAE-the UAE-FEA standards (60 µg/m3) except FEA standards (60 µg/m3)the Middle and Jetty areas.
Lastly, the contour plots indicate that the implementation of the proposed SO2 minimization
schemes will result in a greater area of the Das Island and most of the Island residential areaswill comply with the UAE-FEA standards. Another aspect is that even though the northern partof the Island does not totally comply with the 1-h standard, its air quality will be improved.Also the highest predicted SO
2 level around the northern part of the Island will be about 650
µg/m3 compared to the current 2000 µg/m3 highest level. This means that under the proposedSO
2 minimization schemes all the Das Island area will comply with the 24-h and the 1-yr limits
of the UAE-FEA.
5. CONCLUSIONS
Currently the SO2 emission rates from the ADGAS plant at Das Island are as follows:
1. The SO2 emission rates from the SRU incinerators of Trains 1, 2 & 3 and ADMA-GTs
do not comply with the UAE-FEA standards. The SO2 emission rates from Fuel Gas
Users of Trains 1 and 2 are 89.54% of the UAE-FEA limits. This makes these sourcessusceptible to exceeding the standards’ limits in case of malfunctions.
2. All locations in the Das Island do not comply with the 1-h SO2 GLC of the UAE-FEA
standards (350 µg/m3), most of the Island does not comply with the 24-h standards(150 µg/m3), while most of the Island complies with the 1-yr standards (60 µg/m3).
3. The highest 1-h, 24-h and 1-yr SO2 levels are 1869, 507 and 74 µg/m3, respectively.
4. The locations of the highest SO2 levels are more of Residential Areas which represent
a threat to the health of the Das Island residents.
Upon implementation of the proposed SO2 minimization schemes, the situation at the Das
Island will be as follows:

INVESTIGATION ON THE MINIMIZATION OF SO2 EMISSIONS AT ADGAS… / 39
1. The 1-h, 24-h and 1-yr SO2 GLC highest averages at the specified receptors will comply
with the UAE-FEA standards. In addition, SO2 levels > 500 µg/m3 will not be
experienced for short periods.
2. The average of the 1-h highest SO2 levels is 636.2 µg/m3. The averages of the 24-h and
1-yr highest SO2 levels are 157.6 and 37.2 µg/ m3, respectively. The highest SO
2 GLC
will shift to the north-east part of the Island (i.e., the Industrial Area).
3. The temporal variations in the SO2 highest averages in the Das Island through
years 2003 to 2007 show similar trends toward the distribution of SO2 GLC levels for
the 1-h, 24-h and 1-yr highest averages.
4. Generally, the SO2 GLC in the north part of the Island exceeds the 1-h limits of the
UAE-FEA standards. However, the residential areas comply with these standards. Thehighest 1-h SO
2 GLCs are 650 µg/m3, which is 32.5% of the highest current averages
of 2000 µg/m3). Moreover, all the Das Island area complies with the UAE-FEA 24-hstandards (150 µg/m3) and 1-yr standards (60 ìg/m3).
5. A greater area of the Das Island will be within the standards of UAE-FEA. Also all theIsland area will comply with the 24-h and 1-yr UAE-FEA standards.
6. The implementation of the proposed SO2 minimization schemes along with the
elimination of the continuous flaring of flash gases will result in 99.2% reduction inthe total SO
2 emissions at ADGAS. Once the flash gas flaring is eliminated, the SO
2
GLC 1-h highest averages at the selected receptors will be about 4 - 5 µg/m3 while the24-h and 1-yr highest averages will be < 1 µg/m3.
7. The routing of the continuous flaring of the flash gas (CFFG) back to the inlet feed gasof the plant trains will result in 99.19% reduction in the total SO
2 emissions at the
ADGAS plant.
6. RECOMMENDATIONS
Based on the results of this work, it is recommended:
(1) To implement the proposed SO2 minimization schemes presented in Part I of this work
(i.e., fuel gas sweetening and flue gas desulfurization) in order maintain good air qualityat ADGAS and in the Das Island. This also requires the replacement of the HYPAKpacking of the UGAs of Trains 1 and 2 by IMTP packing.
(2) To have continuous monitoring of the air quality on the Island that should be easilyaccessed by the Island workers through brochures and/or broadcasting. This will helpto worn the workers in occasions of high levels of SO
2emissions.
(3) To carry out comprehensive studies on the occupational health of the workers andresidence of the Island.
References
Lewis, D. G.; Liu, Z.; Akhter, S. M. (2009), Sustainable Application of Model Predictive Control (MPC) tothe Minimization of Flaring from Fuel Gas Supply Networks, 15 pages. Available from: http://

40 / INTERNATIONAL JOURNAL OF ENVIRONMENTAL POLLUTION CONTROL & MANAGEMENT
iom.invensys.com/EN/pdfLibrary/WhitePaper_Invensys_SustainableApplicationofModelPredictiveControl-MinofFlaringfromFuelGasSupplyNetworks_08.pdf
Peavy, H. S., Rowe, D. R., Tchobanoglous G. (1985), Environmental Engineering Europe: McGraw HillEducation.
US EPA (2009), Sulfur Dioxide: Health and Environmental Impacts of SO2, Retrieved from http://www.epa.gov/
air/urbanair/so2/hlth1.html
Jie, J. (2008), Industrialization, Environment and Health: The Impacts of Industrial SO2Emission on Public
Health in China, Chinese J. Population, Resources & Environment, 6 (1), 14-24.
Abu-Eishah, S. I., Babahar, H.S.A. (2011), Investigation on the Minimization of SO2 Emissions at Das Island
(UAE): Part I-Current Schemes vs. Modified Schemes. Accepted for Publication in the Int. J.Environmental Pollution Control & Management (IJEPCM)
BREEZE AERMOD User Guide (2008), Trinity Consultants, Available with Product from BREEZE : OfficialSite Website: http://www.breeze-software.com
AERMOD (1998), Model Evaluation Results for AERMOD: Draft Document, December 17, US EnvironmentalProtection Agency.
AERMOD (2003), Latest Features and Evaluation Results. US Environmental Protection Agency. EPA-454/R-03-003, 41 pages, June.
AERMOD (2004), Description of Model Formulation, US Environmental Protection Agency, EPA-454/R-03-004, September.
Al Nuaimi, A. (1999), Management of Emissions at ADGAS, MS Thesis, UAE University, Al Ain, UAE.
Deligiorgi, D., Philippopoulos, K., Karvounis, G., Tzanakou, M. (2009). Identification of Pollution DispersionPatterns In Complex Terrain Using AERMOD Modeling System, Int. J. Energy & Environment, 3(3),143-150.
Saqer, S. S.; Al-Haddad, A. A. (2010), Oil Refineries Emissions: A Study using AERMOD, Proceedings of the3rd Int. Conference on Environmental and Geological Science and Engineering, pp. 45-52. ISBN: 978-960-474-221-9. Available from: www.wseas.us/e-library/conferences/2010/Constantza/EG/EG-07.pdf
Anonymous (2009), Atmospheric Dispersion Modeling. Retrieved from http://en.wikipedia.org/wiki/Atmospheric_dispersion_modeling
HSE Annual Report 2007-ADGAS. Available from http://issuu.com/akana/docs/adgas_final_e/17?mode=a_p
UAE-Federal Environmental Agency (UAE-FEA), Standards, Appendices 1 & 2: Federal Law No. (24), 1999,Protection and Development of the Environment.
WHO (2005), WHO Air Quality Guidelines for Particulate Matter, Ozone, Nitrogen Dioxide and Sulfur Dioxide:Global Update 2005, Retrieved from http://www.ispm-unibasel.ch/ludok/AQG05Summary.pdf
Babahar, H.S.A. (2009), Investigation on the Minimization of Sulfur Dioxide Emissions at Abu Dhabi GasLiquefaction Company Limited (ADGAS) and Its Impact on Ambient Air Quality, MS Thesis, UAEUniversity, Al Ain, UAE.


![Forecasting Earth Quake Using Back Propagation Algorithm ...serialsjournals.com/serialjournalmanager/pdf/1483683448.pdf · successful implementation of predicting earthquakes. [1]](https://img.pdfslide.us/doc/110x75/5aaa47487f8b9a95188de25c/forecasting-earth-quake-using-back-propagation-algorithm-implementation-of-predicting.jpg)
