Embed Size (px)
Citation preview

International Journal of Engineering amp Technology IJET-IJENS Vol13 No05 24
I J E N S IJENS copy October 2013 IJENS -IJET-9494-5130-401384
Investigation on Performance and Emissions
Characteristics of an Internal Combustion Engine
Fuelled with Petroleum Gasoline and a Hybrid
MethanolndashGasoline Fuel
Ashraf Elfasakhany
Department of Mechanical Engineering Faculty of Engineering Taif University Box 888 Taif Saudi Arabia Corresponding author Tel +966 (02) 7272020 Fax +966 (02)7274299
E-mail address ashr12000yahoocom
Abstract-- The objectives of this work are to study the
characteristic performance and pollutant emissions of the
internal combustion engine using gasoline fuel and hybrid
methanol-gasoline-blends (0vol 3vol 7vol and 10vol
methanol) A fully functioning internal combustion engine
experiment is built up for that purpose The experiment setup
includes a single cylinder four-stroke spark-ignition engine
brake and drive unit (BDU) that functions as a dynamometer
and a combustion engine basic module (CEBM) that functions
as a display and control panel For monitoring pollutant
emissions exhaust gas analyser with hand held remote
operating unit is used to examine the carbon monoxide (CO)
carbon dioxide (CO2) and unburned hydrocarbons (HC) levels
in exhaust gases of the SI engine The analyser applies an
interference filter correlation procedure using an infrared
energy The infrared energy in the test bench is transmitted
through the flow of exhaust gases to a filtered infrared
detector A rotating chopper wheel cyclically interrupts the
infrared rays and produces a sequence of signals The analysis
of the measured signals is done automatically by a
microprocessor Experimental results of the analyser as well as
engine performance declare that when methanol is added into
gasoline the fuel blend contains more oxygen which improves
performance and reduces CO and HC emissions Low fraction
of methanol in methanolgasoline blend (eg 10vol
methanol) can be used in SI engines without need to modify the
engines
Index Term-- engine gasoline methanol performance
emissions
1 INTRODUCTION
Increasing motorization of the world has led to a steep rise
for the demand of petroleum-based fuels The global
population of motor vehicles on the roads today is half a
billion which is more than 10 times higher than what was in
1950 [1] For example the number of cars in Saudi Arabia
(KSA) is about 13 million and this number is growing at a
rate too high to exceed the growth in population The
population is growing at a rate of 25 while increasing the
number of cars at a rate of 54 per year equivalent
increase by 700000 cars annually This rise in the number
of vehicles leads to an expansion of the fuel consumption
and according to statistics the amount of vehicles fuel
consumption in KSA rose in 2007 to reach about 1156
million barrels which increases by 66 million barrels (a
rate of 61) than the year 2006 where the total quantities
consumed in 2006 was about 1087 million barrels Besides
statistics declare the following important facts in KSA
- Saudi individual is the most consumed of gasoline
in the world with an estimated annual consumption
of about thousand liters and this amount is in
continual rising (where the growth rate is estimated
to be about 6 annually)
- KSA consumes all gasoline produced from national
refineries (about 300 thousand barrels per day)
- Cars in the KSA consume more than one hundred
million barrels of gasoline a year
Because of these facts the scientists declare that the fuel
consumption reaches a sensitive condition which must be
alert to the speed up processing and aggravate the situation
In addition to the problem of increased petroleum-
based fuel consumption there is another problem of not less
seriousness of which is air pollution This problem can be
categorized as one of the environmental disasters that may
destroy human as well as environment Excessive use of
fossil fuels has led to global environmental degradation
effects such as greenhouse effect acid rain ozone depletion
climate change etc In the Kyoto conference on global
climate change nations over the world have committed to
reduce greenhouse gases (GHG) emissions significantly
There is a growing realization worldwide that something
constructive has to be done soon to reduce the GHG
emissions Gasoline-driven automobiles are the major
sources of the GHG emission [2ndash4] Projections for a 30-
year period from 1990 to 2020 estimate that vehicles travel
and consequently fossil-fuel demand will almost triple and
the resulting emissions will pose a more serious problem [5ndash
7]
To quench the ever-increasing pollutants of fossil
fuels scientists around the world have explored several
alternative energy resources The alternative energy
resources explored include biomass biogas primary
alcohols vegetable oils and biodiesel [8] These alternative
energy resources are largely environment-friendly but they
need to be evaluated on case-to-case basis for their
advantages disadvantages and specific applications [1]
Alcohol which is one of the promising renewable
resources is made from biofuels like biomass that locally
grow crops and even waste products such as waste paper
grass and tree trimmings etc Alcohol is a promising
International Journal of Engineering amp Technology IJET-IJENS Vol13 No05 25
SI J E N IJENS copy October 2013 IJENS -IJET-9494-5130-401384
alternative transportation fuel since it has properties to use
in existing engines with minor hardware modifications
Alcohols have higher octane number than gasoline and that
can endure higher compression ratios before engine starts
knocking Hence engine has an ability to deliver more
power efficiently and economically
From the literature review some studies were
conducted with blends of different alcohols (methanol and
ethanol) in gasoline by Furey and King [9] and more
recently by Gautam et al [1011] Most of the studies in the
literature however concern the addition of ethanol in
gasoline [12] However methanol is seldom used now
[1314] Besides methanol has more advantages compared
with ethanol for its richer resource and lower cost [15]
Within few literatures found in methanol-gasoline
blend as a fuel in internal combustion engines the outcomes
are not very clear Some studies indicated that HC CO and
CO2 emissions can be significantly reduced at all engine
speeds with using methanol-gasoline blend than using a pure
gasoline [16-18] However other researchers found the
opposite impact [19] Broustail et al [20] showed that the
CO2 emissions increase with the addition of methanol to
gasoline Ozsezen and Canakci [21] also showed that the
CO2 and CO emissions are increased by 08 and 12
with the use of 10vol and 5volcompared to that pure
gasoline However Bahattin et al [22] showed that the CO
and CO2 emissions are decreases when adding methanol to
gasoline Power torque and specific fuel consumption
decreased while the brake thermal efficiency improved with
the methanol fraction increase in the fuel blend [23]
However Pourkhesalian et al [24] showed that specific fuel
consumption of methanol blended gasoline is more than
pure gasoline The power increases with methanol gasoline
blends than pure gasoline [21] The power and brake
thermal efficiency increases by up to 14 and 36
respectively with methanol blended engine [22]
The aim of this work is to investigate the
performance and pollutant emissions of methanol-gasoline
blends in SI engines at different conditions especially the
methanol production begins at ultra-high capacity plant in
KSA This plant has brought the annual production to 5
million tons making it the largest single methanol-
production in the world These facts make it appealing to us
testing methanol-gasoline blended i n SI engines for
performance and emissions
2 EXPERIMRNTS
The experiments are carried out as two separated
experimental set ups (1) engine performance experiment
and (2) exhaust gas analyser Detailed description of both
experiments is as follows
21- Engine Performance Experiment
211- Experimental Apparatus
The equipment of experimental apparatus includes three
units as shown in Figure 1 (1) an internal combustion
engine (ICE) (2) a combustion engine basic module
(CEBM) and (3) a universal brake and drive unit (UBDU)
In the following a brief detail of each unit
Fig 1 Engine Performance Experiment Set-Up
CEBM
UBDU
CEBM ICE
CEBM
International Journal of Engineering amp Technology IJET-IJENS Vol13 No05 26
SI J E N IJENS copy October 2013 IJENS -IJET-9494-5130-401384
2111- Internal Combustion Engine (ICE)
The experimental module of a spark ignition engine with a
4-stroke air cooled and external carburetor is employed as
shown in Figure 2 The petrol engine of a single cylinder
with 17 kg weight651 mm bore and 444 mm stroke is
applied to produce an output power of 15 kW with a
compression ratio of 7The detailed specifications of the
engine are presented in Table I below
The equipment set up of the ICE as shown in
Figures 2-4 is mounted on a base plate (No 1) which is
installed in the seat of the Combustion Engines Basic
Module (CEBM) Vibration attenuators (No 2) dampen the
vibrations that occur during the operation of the engine The
crankcase (No 3) contains the oil drain screw (No 4) and
oil filling connection (No 6) The sleeve for the cylinder
(No 7) has fins for better cooling The cylinder head of the
engine (No 8) has an opening for the spark plug (No 9)
The engine is equipped with a temperature sensor (No 10)
to measure the exhaust temperature which is installed in the
area of the exhaust muffler The connection for the exhaust
hose (No 11) is also located at the exhaust muffler (No 12)
The engine is started with a recoil starter (No 15) and the
choke (No 19) should be activated at this point Paddles are
attached to the flywheel (No 13) to cool the engine which
is provided with a cover (No 14) A pulley (No 21) is
mounted on the output shaft of the engine (No 5) which is
used to couple the engine to the dynamometer in a Universal
Brake and Drive Unit (UBDU) The enginersquos spark plug is
supplied with the required ignition voltage through a
connection (No 16) The fuel line (No 17) is provided with
a filter and the line is attached to the carburetor (No 18)
which also has a connection for the air hose (No 20)
Fig 2 View of the Internal Combustion Engine (ICE)
Fig 3 Schematic of the ICE in Side View
1 - Base plate
2 - Vibration attenuator 3 - Crankcase
4 - Oil drain screw
5 - Output shaft 6 - Oil filling connection
7 - Sleeve
8 - Cylinder head 9 - Spark plug with plug
10 - Temperature sensor exhaust
11 - Exhaust hose connection
12 - Exhaust muffler
International Journal of Engineering amp Technology IJET-IJENS Vol13 No05 27
SI J E N IJENS copy October 2013 IJENS -IJET-9494-5130-401384
Fig 4 Schematic of the ICE in Top View
Table I
ICE Specifications
Design Specification
Engine type Spark ignition engine
Cooling Air cooled
No of cylinders One cylinder
Configuration External carburetion
Weight 17 kg approx
Dimensions 515 x 345 x 370 mm (LxWxH)
Bore 651 mm
Stroke 444 mm
Length of the connecting rod L= 7955 mm
Output 15 kW approx
Oil volume 06 liter
Ignition voltage Magnetic ignition
Compression ratio 71
Temperature sensor for exhaust temperature Measuring range 0-1000degC
Pulley Oslash 125 mm
Belt type V-Belt ndashModel SPA 1250
Table II
Technical Data of Combustion Engine Basic Module Unit (CEBM)
Parameter Technical data
Voltage Nominal 230 V ~50 Hz
Dimensions L x W x H 90 x 80 x 190 cm
Weight approx 100 kg
Fuel pump Q max 130 literh
Fuel measurement tube
Material Polycarbonate
Diameter 24 mm
Pressure sensor for fuel consumption Measuring range 0 ndash 100 mbar
Differential pressure sensor for air consumption Measuring range 0 ndash 5 mbar
Measuring ranges
Ambient temperature 0 ndash 100 degC
Fuel temperature 0 ndash 100 degC
Exhaust-gas temp 0 ndash 1000 degC Air consumption 0 ndash 333 litermin
13 - Flywheel
14 - Flywheel cover
15 - Recoil starter
16 - Plug for ignition voltage
17 - Fuel line with filter
18 - Carburetor
19 - Choke
20 - Air hose connection
21 - Pulley
13 - Flywheel
14 - Flywheel cover
15 - Recoil starter 16 - Plug for ignition voltage
17 - Fuel line with filter
18 - Carburetor 19 - Choke
20 - Air hose connection
21 - Pulley
International Journal of Engineering amp Technology IJET-IJENS Vol13 No05 28
I J E N S IJENS copy October 2013 IJENS -IJET-9494-5130-401384
2112- Combustion Engine Basic Module (CEBM)
The basic module as shown in Figure 5 consists of a
mobile laboratory frame supporting a display and control
panel mounted on vibration dampers (No 5) The lower part
of the frame is equipped with a fixture for various fuel tanks
(No 1) a pipeline (not visible here) is used to fill the
measurement tube (No 8) for fuel consumption
measurements A hose (No 2) with fuel filter (No 4)
connects the fuel tank and pipeline The measurement tube
is filled by means of a standard fuel pump operated via unit
control (No 6) After the filling process the fuel can be fed
to the engine via a connection with a self-locking coupling
(No 14) a second connection (No 9) is provided for
engines with a return line The engine is mounted on a
ready-to-install base plate which is inserted into a seat and
fastened in place The air drawn in by the engine flows
through a filter (No 1) and then through a settling tank with
a measuring aperture (No 17) After that it flows via an air
hose (No 3) to the engine Measurements of different
parameters such as air consumption ambient air and fuel
temperatures and exhaust gas temperature are directed to
the digital displays (Nos 10 - 13) as well as to a PC data
acquisition for further processing The connection for PC
data acquisition (No 15) is located on the side of the basic
module Measurements for torque and speed are transferred
via a separate cable to the basic module (CEBM) The
measuring range of different displays is presented in Table
II
The unit control (No 6) contains as shown in
Figure 6 engine onoff switch (No 18) fuel pump onoff
switch (No 19) socket for connecting the ignition cable
(No 20) socket for connecting the exhaust-gas
thermocouple (No 21) valve for filling the measurement
tube (No 22) valve for draining the measurement tube (No
23) and button valve for controlling the fuel pump (No 24)
Fig 5 Schematic View of Combustion Engine Basic Module (CEBM)
1- Fuel tank with pump 2 - Fuel hose
3 - Air hose
4 - Fuel Filter 5 - Vibration dampers
6 - Unit control
7 - Manual valve for fuel feed 8 - Fuel measurement tube
9 - Reflux line connection
10 - Air consumption display 11 - Air temperature display
12 - Fuel temperature display
13 - Exhaust gas temperature display 14 - Fuel line connection
15 - PC measurement program interface
16 - Air filter 17 - Settling tank with measurement
aperture
International Journal of Engineering amp Technology IJET-IJENS Vol13 No05 29
SI J E N IJENS copy October 2013 IJENS -IJET-9494-5130-401384
2113- Universal Brake and Drive Unit (UBDU)
The employed combustion engine is loaded by a universal
brake and drive unit (UBDU) which acts as a driving unit in
start up condition and a braking device at shutdown
condition The UBDU as shown in Figure 7 is designed to
be fitted to a laboratory trolley on castors (No 1) This
support is equipped with snap-action fasteners (No 7) for
secure coupling to the basic modules Once the universal
unit (UBDU) and the basic module (CEBM) have been
joined together the three-phase motor and the engine are
connected together with a V-belt The V-belt is tensioned
with a tensioning device that is integrated into the UBDU
The tensioning device comprises a slide with which the
three-phase motor can be rotated using a spindle (No 3)
After tensioning the slide is locked with two clamping
screws (No 2) The motor spindle and slide as well as the
clamping device are fitted under a cover (No 4) in which
connections displays controls and a maintenance panel for
changing the belt are located A guide is provided to prevent
loosing the belt from jumping off the belt pulley The
UBDU is completed by a belt guard with interlock (No 5)
that prevents the operation of the belt drive without the
guard maintenance panel (No 6) and snap action fasteners
(No 7) are mandatory for maintenance and fastening the
unit A shelf (No 8) provides a mounting for a measuring
unit block with a connected basic module
Fig 6 Unit Control
Fig 7 Layout of Universal Brake and Drive Unit (UBDU)
18 - Engine onoff switch
19 - Fuel pump onoff switch
20 - Socket for connecting the ignition cable
21 - Socket for connecting the exhaust-
gas thermocouple 22 - Valve for filling the measurement
tube
23 - Valve for draining the measurement tube
24 - Button for controlling the fuel pump
1- Laboratory trolley on castors 2- Slide clamping device
3- Belt tensioning device
4- Cover with connections controls and displays
5- Protective hood for V-belt
6- Maintenance panel 7- Snap action fasteners
8- Mounting for measuring unit
block
International Journal of Engineering amp Technology IJET-IJENS Vol13 No05 30
I J E N S IJENS copy October 2013 IJENS -IJET-9494-5130-401384
On the front view of the panel as shown in Figure
8 there are two digital displays for speed (No 1) and torque
(No 3) Below the displays potentiometers are fitted for the
speed (No 2) and torque setting (No 4) The switch (No 6)
is used to specify the required direction of rotation and the
Control changeover switch (No 7) is used to set the
required variable (speed or torque) The three-phase motor
is turned on and off using the switch (No 9) The master
switch (No 5) and emergency stop switch (No 8) complete
the controls It is important to clarify that the direction
switch should always be operated when the motor is
stopped otherwise the change of direction will not take
effect until after the next stoppage
On the rear view as shown in Figure 9 the unit
contains the main connection (No 4) and the USB port (No
3) for connecting to a PC There is also a connection (No 2)
for the signal from the measuring unit block and an
electrical power socket (No 1) This socket supplies the
power to the measuring unit block All measured data
recorded is transferred to a PC via electronic indicating
system (EIS)
The electronic indicating system (EIS) is part of an
equipment series that facilitates investigations and
experiments on combustion engines The EIS consists
primarily of sensors for pressure measurement (No 1) and
speed measurement (No 2) as shown in Figure 10 The EIS
is switched on and off using a switch (No 3) On the rear of
the housing there are connectors for the mains plug (No 4)
and the ribbon cable (No 5) which is used to feed the
signals from the amplifier to the data acquisition card as
shown in Figure 11 The data acquisition card specifications
is scanning and output rate of 100 kHz maximum
resolution of 12 bit 16 digital inputs 16 digital outputs and
16 analogue inputs This card is installed in the PC that is to
be used with the system via software The software allows
the pressure signal acquired to be displayed in various forms
on the PC monitor as shown in Figure 12 Conducting
experiments supported by PC data acquisition provides the
user with several advantages clearly arranged screen
displays facilitate controlling and the measured values
become directly available for further processing
Fig 8 Universal Brake and Drive Unit (UBDU) in Front View
Fig 9 Universal Brake and Drive Unit (UBDU) in Rear View
1- Digital display for speed
2- Potentiometers for speed control
3 - Digital displays for torque 4 - Potentiometers for torque control
5 - Master switch
6 - Switch to specify the required direction of rotation
7 - Changeover switch to set the
required variable (speed or torque) 8 - Emergency stop switch
9 - OnOff switch for the three-phase
motor
1- Electrical power socket for
supplies the power to the measuring unit block
2- Signal from the measuring unit
block
3- USB port for data transferred
to a PC
4- Main connection
International Journal of Engineering amp Technology IJET-IJENS Vol13 No05 31
SI J E N IJENS copy October 2013 IJENS -IJET-9494-5130-401384
Fig 10 Electronic Indicating Systems in Two Views (a) Front View and (b) Rear View
Fig 11 Data Acquisition Card With Related Software and Data Cable
Fig 12 Illustration of Electrical Connections in Rear View of Experimental Setup With PC
1- Pressure measurement
2- Speed measurement
3- OnOff switch 4- Connectors for the mains plug
5- PC Interface
1 2
3
(a) (b)
4 5
International Journal of Engineering amp Technology IJET-IJENS Vol13 No05 32
I J E N S IJENS copy October 2013 IJENS -IJET-9494-5130-401384
A proximity switch is installed in the experimental
layout as a UDC sensor as shown in Figure 13 The
proximity switch is installed on the test stand base plate To
obtain the UDC signal a metal ring is fitted onto the
coupling half of the combustion engine and secured with a
grub screw as shown in Figure 14 This ring includes a slot
around its circumference which is detected by the UDC
sensor To ensure that the sensor works reliably a stipulated
distance to the ring must be maintained With the sensor
used this distance is about 1 mm The distance is correctly
set if the small LED on the rear of the sensor lights up when
the slot rotates past the UDC sensor After setting the
distance the radial position of the slot must then be
checked The procedure is as following Spin the engine
manually in the direction of rotation (anticlockwise) until
the UDC marking appears in the window on the flywheel
cover When the UDC markings on the flywheel and the
engine block are aligned the engine is set to UDC The slot
on the ring must now be positioned in front of the sensor
such that the sensor emits a signal (the diode lights up) If
the diode does not light up when the engine is in UDC
position loosen the grub screw on the ring and turn the ring
until the diode lights up After tightening the grub screw we
check the position of the slot again by spinning the engine
manually in the direction of rotation until the diode on the
sensor lights up
Fig 13 UDC Sensor
Fig 14 UDC Sensor Installation Position
212- Experimental Set up for Engine Performance
To couple the CEBM with the UBDU the two devices are
aligned mutually such that they can be linked via the snap
closures Small lugs welded to the frames facilitate this
union After the connection has been established the frames
need to be secured against inadvertent motion by means of
their lockable guide rollers
The experimental procedure consists of several
steps Firstly filling the system with fuel commissioning
the drive unit commissioning the engine starting the engine
using either recoil starter or DC motor operating the engine
and finally stopping the engine and draining the fuel system
Further description of each step is provided below
a- Filling in the Fuel System
ndash Turn on the fuel pump by means of its switch (No 19)
see Figure 6
ndash Fully open the filling valve (No 22)
ndash Fully close the drainage valve (No 23)
ndash Hold down the filling button (No 24) until the required
filling level has been attained
b- Commissioning the Drive Unit
In order for the three-phase motor to be started the
following preconditions must be met
The potentiometer for the speed (see Figure 8) must
be set to zero
The mains connector must be plugged in
The emergency stop switch must be pulled out (not
pressed)
The master switch must be in the ldquoOnrdquo position
The guard for the V-belt must be placed in the
guide from above so that the interlock is operated
If the interlock is not operated the system is
inhibited So we should set the control switch to
set either the speed or the torque When setting the
speed a maximum torque is used to try and
maintain the speed When setting the torque the
unit attempts to maintain the torque up to the
maximum In this case the speed depends on the
torque and it is possible to decrease the speed to
zero
The onoff switch (9) must be turned on If the
switch is not operated the motor cannot start So
prior to operating the potentiometer to set the
required speed check the direction of rotation of
the motor
Depending on the mode the potentiometer for
setting the required speed or torque must be
pressed
The motor can then start to turn
c- Commissioning the Engine
The ignition must be switched on by pressing the
engine start switch at CEBM (see Figures 5 and 6)
The air hose and exhaust hose must be attached and
the exhaust hose must be outside the enclosed
building
Care must be taken to ensure that the belt guard is
in place
The engine oil level must be checked
The OnOff switch at the combustion engine must
be set to on
The rotational direction display on the UBDU must
show left see Figure 8
The DC motor that functions as the breaking device
must be switched on via the switch ldquoMotorrdquo
International Journal of Engineering amp Technology IJET-IJENS Vol13 No05 33
SI J E N IJENS copy October 2013 IJENS -IJET-9494-5130-401384
The potentiometers of the UBDU may not yet be
activated at this point (potentiometer speed and
torque to 0)
The engine choke must be activated for the starting
process as shown in Figure 15 The lever should be
secured with the wing nut to prevent unintentional
adjustment
The speed controller of the combustion engine must
be set to Fast
Fig 15 Top View Choke
d- Starting the Engine With Recoil Starter
Slowly pull out the starter cable until a slight
resistance is felt
Allow cable to rewind so that the entire length of
the cable can be used for the start process
Grasp handle with both hands and pull with steady
and increasing speed (do not jerk suddenly) until
the engine starts
If the engine is still not running after several
attempts we should push in the choke slightly and
try again
e- Starting the Engine With DC Motor
There is also a possibility to start the combustion engine
with the DC motor as follows
The motor switch at the UBDU has to be in the
position ldquoOFFrdquo
The potentiometer of speed has to be mounted at
middle position (see Figure 8)
The potentiometer of torque has to be at maximum
position
We set the motor switch at the UBDU to position
ldquoONrdquo the DC motor starts up and the combustion
engine gets started
f- Engine Operation
After the engine has been started up (by recoil starter or DC
motor) it should run without load for a time to warm up
Then we check the condition of the engine on the basis of
noise propagation and exhaust The engine runs without
load if the following is obeyed
The potentiometer of speed at UBDU to ldquo0rdquo
The potentiometer of torque at the UBDU to ldquo0rdquo
We set the desired motor speed at the speed
controller of the combustion engine
It is important to clarify that during operation the
motor is cooled by a fan wheel fitted to the motor
shaft This results in poor cooling at low speeds To
ensure adequate cooling at low speeds the motor is
also cooled with a separate fan However high
torques should be avoided at low speeds to prevent
thermal overload The frequency converter
monitors the motor current and shuts down the
motor in case of an overload
g- Stopping the Engine
The engine is shut down as follows
Release the engine at the DC-motor in UBDU ie
set potentiometer ldquoTorquerdquo and potentiometer
ldquoSpeedrdquo to 0
Shut off fuel supply
Set Engine Start switch on the CEBM to Off
(engine will go off)
Set OnOff switch on the combustion engine to
off
h- Draining the Fuel System
Fully close the filling valve (No 22) see Figure 6
Fully open the drainage valve (No 23) and the fuel
then flows into the fuel tank
Table III
Specifications of the Gas Analyser
Value Specifications
10 minutes Warm-up period
width 294 mm
depth 430 mm height 260 mm
Dimensions
approx 9 kg Weight
5 - 45 degC Exhaust gas temperature
CO 0-10 vol CO2 0-20 vol
HC 0-2000 ppm vol (as C6H14)
Measurement Ranges
230 V (+10-15) Power
50 +- 1 Hz Frequency
Max 45 VA Power consumption
0-130degC resolution 1degC
Accuracy +- 1degC
Range of apparatus heating
0-8000 RPM range
International Journal of Engineering amp Technology IJET-IJENS Vol13 No05 34
SI J E N IJENS copy October 2013 IJENS -IJET-9494-5130-401384
22- Gas Analyser Experiment
Motor vehicle exhaust gas analyser of model Infralyt CL for
petrol engines with hand held remote operating unit is used
to accurately measure specific components of the exhaust of
petrol engined vehicles The complete specifications of the
gas analyser is shown in Table III The measurement range
is about 10 for CO 20 for CO2 and 2000 ppm for
hydrocarbons as shown in Table III
221- Experimental Apparatus The gas analyser is housed in a sturdy aluminum case with a
carrying handle on the top panel The displays and controls
as shown in Figure 16 are easily accessible on the front
panel The front panel shows the measurements of CO CO2
HC O2 and LCD in four-digit displays However the rear
panel as shown in Figure 17 demonstrates detailed
structure of the gas analyser unit The exhaust gas comes
into the unit via port 1 and leave via port 4 But port 2 is
used for gas calibrations port 3 for clean air input for zero
gas condition and port 5 for pressure input of leak test
adapter The power inputs via socket 6 is switched on and
off via button 7 The water trap (No 8 in Figure 17) consists
of a two-stage separator unit with filters and condensate
pump (within the casing) The condensate outlet is situated
below the two separator bowls on the rear panel and the
condensate leaves via prop 9
Din sockets are provided on the rear panel for the
connection of various sensors to enable the engine speed
and exhaust temperature to be measured The uppermost din
socket (No 10) is provided to connect a pulse clip rpm
probe or pulse receiver A stroboscope (not illustrated) can
be connected to the middle din socket (No 11) for top dead
center transducer The oil temperature probe connects to the
lower din socket (No 12) Three multi-pin interfaces are
also provided on the rear panel One is used for connection
to an external printer (No 14) another to connect a remote
operating unitkey pad (No 13) and the third is provided for
data transmission to a personal computer (PC) and can also
be used to make certain adjustments (No 15)The O2
measurement is carried out using an electrochemical cell
(No 16) The activated charcoal filter (No 18) and fine disc
filter situated on the rear panel (No 19) removes small
particles which can affect the measuring system and thus
the test result
The sampling probe of the analyser is connected to
the water trap by a length of flexible hose To avoid
excessive amounts of condensate entering the filters we
avoid suddenly raising the hose above the level of the
analyser It is recommended that the hose is disconnected
from the water trap and drained at the end of each day of
use
The gas analyser is equipped with an integrated
revolution counter and exhaust temperature measuring
device as shown in Figure 18 which carries out rapid fault
diagnosis on engines using the composition of the exhaust
gas and other measurable factors The hand held appliance
as shown in Figure 19 permits extra option to simply carry
out the exhaust gas test through dialog The key pad is used
to control the analysers software operating system
Fig 16 Gas Analyser-Front View
1- O2 display
2- LCD display
3- Function selection key to measure andor calibrate
4- Down key
5- Up key 6- Enter key
7- Pump key
8- Engine speedtemp key
8
International Journal of Engineering amp Technology IJET-IJENS Vol13 No05 35
I J E N S IJENS copy October 2013 IJENS -IJET-9494-5130-401384
Fig 17 Gas Analyser- Rear View
Fig18 RPM Sensors Oil Temperature Probe
Fig 19 Hand Held Appliance
1- Gas input for exhaust gas
2- Gas input for calibration gas 3- Gas input for zero gas (clean air)
4- Exhaust gas outlet
5- Pressure input (for leak test adapter) 6- Mains input
7- Mains OnOff switch
8- Water trap 9- Condensate outlet
10- Din Socket for pulse clip rpm
sensor (terminal 115) and pulse receiver
11- Din Socket for top dead center
transducer strobe light and others 12- Din Socket for oil temp sensor
13- Interface for remote operating
unitkey pad 14- External Printer Interface
15- Service and data output interface
16- O2 cell (electrochemical)
18- Activated charcoal filter
19- Fine disc filter
1- Interface to the base unit 2- LC-Display 128 x 64 pixel
3- Printer Keys 4- Enter button
5- ESC button
8
International Journal of Engineering amp Technology IJET-IJENS Vol13 No05 36
I J E N S IJENS copy October 2013 IJENS -IJET-9494-5130-401384
222- Experimental Set up For Gas Analyser
The complete hardware setup is linked as shown in Figure
20 To ensure the safe discharge of the measured exhaust
gases into the open air and to avoid the analyser taking-in
engine exhaust during a zero check a hose of at least one
meter in length should be connected to the exhaust gas
outlet (No 4 in Figure 17) The site must be free of
vibration dry and frost-free Direct exposure of the analyser
to strong sunlight or other intense sources of heat must be
avoided
The flexible exhaust sample hose is to be
connected to the inlet connector on the block of the
separator bowl The sample is passed through the water trap
to the outlet on the other side of the block It is fed via a
short hose to the gas sample inlet on the analyser casing
(No 1 in Figure 17) The oil temperature probe and rpm
probe or pulse clip are to be connected using the
appropriately labelled din sockets After connecting the
analyser to the power supply it can be powered-up using the
main switch situated on the rear panel (No 7 in Figure 17)
When first switched on the gas analyser it makes a series of
three regular illuminations enabling the user to make a
check for the correct operation of all LED display segments
Simultaneously the Liquid Crystal (LC) display indicates
the installed program version and the type of O2 cell
If a suction device is used to safely dispose of the
measured gas a partial vacuum must not be created at the
measured gas outlet (No 4 in Figure 17) After a maximum
of 60 seconds a significantly lower pressure must be
detected by the analyser If this pressure differential is not
maintained then either no connection has been made or
there is a leak The display will read Leakage test not ok
This prompts for the external gas lines and connections to be
checked for leaks or means that the unit needs to be
repaired
If the detected leak was caused by operator error
the check can be repeated by pressing the ENTER key or
switching off the unit and re-starting Otherwise the
message will read Leakage test is running please wait On
satisfactory completion of the leak test the program will
display Warm-up time There is a count-down displayed of
the remaining warm-up time (in all 10 min) on the first LED
indicator During such process the exhaust probe and leak
adaptor must be disconnected from each other
Gas connections and hoses must be checked for
blockages and leaks The sampling probe and connection
hose to the water trap are to be freed of dirt and
condensation Cleanliness of the gas ways especially in the
case of hydrocarbons is of great importance when carrying
out emissions testing The appliance will not take new
measurements and display the message HC residues if a
hydrocarbon concentration of more than 20 ppm is detected
prior to a new measurement taking place (eg through
incompletely flushed gas ways)
To ensure the measuring cell is cleaned and
prepared for a zero calibration the purging pump is switched
on automatically for the last two minutes of the warm-up
time A zero check automatically follows at the end of the
warm-up period and the following message is displayed
Zero check
Scavenging time
Still seconds
Fig 20 Hardware Setup
International Journal of Engineering amp Technology IJET-IJENS Vol13 No05 37
I J E N S IJENS copy October 2013 IJENS -IJET-9494-5130-401384
After a successful leak test and warm-upcalibration phase
(zero check) the analyser is ready for use The analyser will
request a test after 24 hrs of continuous operation The
measuring principle of the Infralyt CL modular analyser is
based in the interference filter correlation procedure In the
test bench infrared energy is transmitted through the flow of
exhaust gas to a filtered infrared detector A rotating
chopper wheel cyclically interrupts the rays and produces a
sequence of signals The analysis of the measurement signal
is done automatically by a microprocessor Oxygen
measurement takes place using an electrochemical cell The
detailed gas flow diagram within analyser is shown in
Figure 21 All data of the test conducted are stored in the
remote control unit and can be viewed by selecting display
results and downloaded to a personal computer Technical
data and working principles of the gas analyser are shown in
Table IV
3 RESULTS AND DISCUSSIONS
After the engine and gas analyser have been set up into
operation experimental measurements take a place The
measurements include (1) study the performance of the ICE
at using gasoline fuel and methanol-gasoline blends(0vol
3vol 7vol and 10vol methanol eg M0 M3 M7 and
M10) and (2) study the emissions emitted from the ICE at
using gasoline fuel and methanol-gasoline blends (M0 M3
M7 and M10) For engine performance the measured values
are indicated and recorded in the PC at the corresponding
points using a software The program performs all the
calculations and displays results as shown in Figure 22
However the emission results are indicated in the analyser
and recorded manually
Fig 21 Gas Flow Diagram
Table IV
Working Principles and Technical Data of the Gas Analyser
Technical data Principle
Four characters with decimal point 7-segment LED red when illuminated Data on concentration in each channel
Errors shown on the LC display Appliance status
- Remote Operating UnitKey Pad (25 pin)
- Parallel printer port (25 pin) - Serial RS 232 port for service and data transmission to a PC
Interfaces
At the set time interval when certain temperature variations occur and user
initiated
Automatic zero check
The analyser sets its own zero using a zero gas The contents therefore of the
components to be measured must be negligible in the gas
Gas for zero check
Flexible gas probe with 7m sampling hose with in-line filter coarse filters
automatic water separator fine filter and integral pump gt 90 litreshr
Gas sampling
The exhaust gas pressure in the measuring bench must be constant Exhaust gas pressure
Horizontal constrained by the arrangement for the discharge of condensate
However operation with the amount of inclination provided by the retractable foot is acceptable
Operating position
International Journal of Engineering amp Technology IJET-IJENS Vol13 No05 38
I J E N S IJENS copy October 2013 IJENS -IJET-9494-5130-401384
Fig 22 System Diagram
31 Engine Performance Results
311 Exhaust Gas Temperature
Exhaust gas temperature changes proportionally with the
maximum cylinder temperature ie adiabatic flame
temperatures The change in the exhaust gas temperature at
vehicle speeds and different fuel blends is shown in Figure
23 The exhaust gas temperature of methanolgasoline
blends (M3 M7 and M10) is lower than that of pure
gasoline (M0) because methanol absorbs more heat from the
cylinder during the vaporization since methanol has higher
latent heat of vaporization than that of gasoline [2325]
312 Cylinder Gas Pressure
The relationship between cylinder gas pressures and engine
speed for different blends and gasoline is shown in Figure
24 The cylinder gas pressure is indications of combustion
characteristics for the methanol blends compared with
gasoline As shown from Figure 24 the cylinder gas
pressure with the use of pure gasoline is lower than that
blended fuel The maximum pressures are 26 bar for M10
and 235 bar for pure gasoline The reason for this may be
explained with the longer combustion duration of gasoline
[23]
313 Volumetric Efficiency
Figure 25 shows the relationship between the volumetric
efficiency and the percentage of methanol in the fuel blends
at different engine speeds As shown in this figure the
volumetric efficiency increases as the methanol percentage
increases The heat of evaporation of methanol is higher
than that gasoline this provides fuelndashair charge cooling and
increases the density of the charge and consequently in
volumetric efficiency However gasoline fuels have lower
heat of evaporation and that causes a decrease in volumetric
efficiency due to larger volume of fuel in inlet mixture
314 Specific Fuel Consumption (SFC)
Figure 26 shows the relationship between engine speed and
specific fuel consumption for different methanolgasoline
blends As seen the SFC decreases as the methanol
percentage increases For all tested fuels the SFC values
started to decrease with the increasing of wheel speed As
engine speed increases reaching 2900 to 3100 rpm the SFC
decreases reaching its minimum values The reason for the
decrease in SFC is the increase in the combustion efficiency
315 Torque
Figure 27 shows the effect of various blended fuels on
engine torque When the methanol content in the blended
fuel is increased the engine torque increased for all engine
speeds The gain of the engine torque can be attributed to
the more efficient burning of fuel Added methanol
produces lean mixtures that increase the relative airndashfuel
ratio to a higher value and makes the burning more efficient
[26] Besides the addition of methanol improves octane
number and in turn improves the antiknock behavior of
fuel The improved antiknock allows a more advanced
timing that results in higher combustion pressure (see Figure
24) and thus higher torque [2728]
316 Brake Power
Figure 28 shows the influence of different methanolndash
gasoline blended fuels on engine brake power The increase
of methanol content increases the output power of the
engine The gain of the engine power can be attributed to the
increase of the indicated mean effective pressure (see Figure
24) and the heat of evaporation for higher methanol content
blends As the heat of evaporation increases this provides
fuelndashair charge with more cooling capacity and in turn
increases the density of the charge With the increase in the
density of the charge the engine volumetric efficiency
increases as shown early in Figure 25 and thus higher
power output is obtained It is observed that fuel blends has
little effect on power performance In order to gain more
power two methods can be used Turbo-charging andor
raising the compression ratio under naturally aspirated
operation Engine maximum power for all of the fuels
happens between 3000 and 3100 rpm
International Journal of Engineering amp Technology IJET-IJENS Vol13 No05 39
I J E N S IJENS copy October 2013 IJENS -IJET-9494-5130-401384
Fig 23 Exhaust Gas Temperature Versus Engine Speed
Fig 24 P-V Diagram
Fig 25 Volumetric Efficiency Versus Engine Speed
500
520
540
560
580
600
620
640
660
680
700
720
740
2500 2600 2700 2800 2900 3000 3100 3200 3300 3400 3500
G 90 M 10G 93 M 7G 97 M 3G 100
Speed N (rpm)
Exh
au
st g
as
tem
pe
ratu
re
(C)
0
2
4
6
8
10
12
14
16
18
20
22
24
26
28
0 01 02 03 04 05 06 07 08 09 10
G 90 M 10G 93 M 7G 97 M 3G 100
Normalized volume ()
Pre
ssu
re in
cyl
ind
er
(ba
r)
N = 3000 rpm
02
03
04
05
06
2500 2600 2700 2800 2900 3000 3100 3200 3300 3400 3500
G 90 M 10G 93 M 7G 97 M 3G 100
Speed N (rpm)
Vo
lum
etr
ic E
ffe
cie
ncy
International Journal of Engineering amp Technology IJET-IJENS Vol13 No05 40
SI J E N IJENS copy October 2013 IJENS -IJET-9494-5130-401384
Fig26 Specific Fuel Consumption (SFC) Versus Engine Speed
Fig 27 Torque Versus Engine Speed
Fig 28 Brake Power Versus Engine Speed
0
50
100
150
200
250
300
350
400
450
500
550
600
650
700
2500 2600 2700 2800 2900 3000 3100 3200 3300 3400 3500
G 90 M 10G 93 M 7G 97 M 3G 100
Speed N (rpm)
Sp
eci
fic F
ue
l Co
nsu
mp
tion
(g
KW
hr)
440
445
450
455
460
465
470
475
480
485
490
2500 2600 2700 2800 2900 3000 3100 3200 3300 3400 3500
G 90 M 10G 93 M 7G 97 M 3G 100
Speed N (rpm)
To
rqu
e (
Nm
)
20
22
24
26
28
2500 2600 2700 2800 2900 3000 3100 3200 3300 3400 3500
G 90 M 10G 93 M 7G 97 M 3G 100
Speed N (rpm)
Bra
ke P
ow
er
(KW
)
International Journal of Engineering amp Technology IJET-IJENS Vol13 No05 41
SI J E N IJENS copy October 2013 IJENS -IJET-9494-5130-401384
32 Exhaust Emission Results
321 CO Emission
Figure 29 shows the relationship between the CO
concentrations and engine speeds for different blends
percentage As seen more CO is produced when engine is
performed with gasoline while CO production of methanol
blends (M3-M10) is decreased at all speeds When
methanol is added into gasoline the fuel blend contains
more oxygen which reduces CO concentrations besides
gasoline contains higher CH ratio than methanol fuel As
engine speed increases CO concentration in exhaust gases
decreases since airfuel ratio is closer to stoichiometric The
more the operating condition is close to the stoichiometric
point the less amount of CO is produced since the most
significant parameter affecting CO concentration is the
relative airndashfuel ratio [2930]
322 CO2 Emission
In Figure 30 CO2 concentration is shown for different fuel
blends at different engine speeds Results indicate that CO2
concentration increases as the methanol percentage in the
fuel blend increases The CO2 concentration in the exhaust
gas emission at 2600 rpm for gasoline fuel was 85 (V)
while the CO2 concentration of M3 M5 and M10 at same
speed was 9 93 and 98 (V) respectively The CO2
concentrations at 2600 rpm using M3 M5 and M10 was
increased by 105 109 and 115 respectively in
comparison to gasoline The CO2 emission increased
because of the improved combustion since CO2 emission
strongly depends on relative airndashfuel ratio and CO emission
concentration [26 29-31]
Fig 29 Carbon Monoxide Versus Engine Speed
Fig 30 Carbon Dioxide Versus Engine Speed
0
1
2
3
4
5
6
7
8
9
10
2500 2600 2700 2800 2900 3000 3100 3200 3300 3400 3500 3600
G 90 M 10G 93 M 7G 97 M 3G 100
Speed N (rpm)
CO
(
)
8
9
10
11
12
13
14
15
2500 2600 2700 2800 2900 3000 3100 3200 3300 3400 3500 3600
G 90 M 10G 93 M 7G 97 M 3G 100
Speed N (rpm)
CO
2 (
)
International Journal of Engineering amp Technology IJET-IJENS Vol13 No05 42
SI J E N IJENS copy October 2013 IJENS -IJET-9494-5130-401384
323 Hydrocarbon (HC) Emission
Figure 31 shows the variation of HC emissions with respect
to engine speed at different methanolgasoline blends As
seen when the engine utilizes fuel blends HC emission is
better than that of pure gasoline operation When methanol
is added into gasoline the fuel blend contains more oxygen
which reduces HC emissions A significant reduction in HC
emissions is observed at all rage of speeds as a result of the
leaning effect and oxygen enrichment caused by the
methanol addition Furthermore the airndashfuel mixing process
improves as the turbulence intensity increase at the higher
engine speeds This provides more complete combustion
and reduction in HC emissions Generally the reason for the
decrease of HC concentration is almost similar to that of CO
concentration [2630]
Fig 31 Hydrocarbon (HC) Versus Engine Speed
4 CONCLUSIONS
The effects of gasoline and gasolinendashmethanol blends
(0vol 3vol 7vol and 10vol methanol) on engine
performance and pollutant emissions were investigated
experimentally in a single cylinder four-stroke spark-
ignition engine The engine speed was changed from 2500
to 3500 rpm at wide open throttle (WOT) condition while
the PC data acquisition is applied for advance processing
and controlling facilities When methanol is added into
gasoline the fuel blend contains more oxygen which
reduces CO and HC emissions As engine speed increases
CO and HC concentration in exhaust gases decreases since
airfuel ratio is closer to stoichiometric and in turn improve
combustion and reduce emissions However CO2
concentration increases as the methanol percentage in the
fuel blend increases The CO2 emission increased because
of the improved combustion and the reduction in CO
concentration
Methanol-gasoline blends provide higher cylinder
gas pressures evaporation heat and flammability
temperature than base gasoline fuel (0vol) Furthermore
engine power torque and volumetric efficiency with
blended fuels were generally found to be higher than that of
the base gasoline within all the speed range and therefore
positive influence on engine performance The higher
combustion efficiency of methanolndashgasoline fuel causes
some decline in specific fuel consumption of the engine
depending on methanol in the blend
Finally some researches in early studies concluded
that methanolndashgasoline fuel blends unimproved engine
performance and pollutant emissions However others were
concluded the opposite impact In the current study we may
confirm that methanolgasoline blend up to 10vol improve
sufficiently engine performance and pollutant emission and
in turn can partially replace the needs for the fossil fuels
Lastly it can be concluded that methanolgasoline blends up
to 10vol can be used in SI engines without hardware
modifications
ACKNOWLEDGEMENT
This work is supported by Taif University under a contract
No 1-434-2654 The University is highly acknowledged for
the financial support
REFRENCES
[1] Avinash Kumar Agarwal Biofuels (alcohols and biodiesel)
applications as fuels for internal combustion engines Progress in
Energy and Combustion Science 2007 33233ndash271
[2] Kesse DG Global warming-facts assessment countermeasures J Pet Sci Eng 200026157ndash168
[3] Cao X Climate change and energy development implications for
developing countries Resour Policy 2003 2961ndash67 [4] Johansson T McCarthy S Global warming post-Kyoto continuing
impasse or prospects for progress Energy Dev Rep Energy
199969ndash71 [5] Stern DI Reversal of the trend in global anthropogenic sulfur
emissions Global Environ Change 200616(2)207ndash220
180
200
220
240
260
280
300
320
340
360
380
400
2500 2600 2700 2800 2900 3000 3100 3200 3300 3400 3500 3600
G 90 M 10G 93 M 7G 97 M 3G 100
Speed N (rpm)
HC
(p
pm
)
International Journal of Engineering amp Technology IJET-IJENS Vol13 No05 43
SI J E N IJENS copy October 2013 IJENS -IJET-9494-5130-401384
[6] National Air Pollutant Emissions Trends 1900ndash1998 USEPA report
no 454R-00-002 2000 [7] National Air Quality and Emissions Trends Report special studies
edition USEPA report no 454R-03-005 2003
[8] Murphy JD McCarthy K The optimal production of biogas for use as a transport fuel in Ireland Renew Energy 2005302111ndash2127
[9] Furey RL King JB Emissions fuel economy and driveability
effects of methanolbutanolgasoline fuel blends Toronto Ont Can SAE 1982
[10] Gautam M Martin II DW Combustion characteristics of higher-
alcoholgasoline blends ProcInstnMechEngrs 2000 214(Part A)497ndash511
[11] Gautam M Martin II DW Carder D Emissions characteristics of
higher alcohol gasoline blends Proc Inst Mech Eng 2000214 (Part A)165ndash182
[12] Broustail G Haltern F Seers P Moreacuteac G Mounaim-Rousselle
C Comparison of regulated and non-regulated pollutants with iso-octanebutanol and iso-octaneethanol blends in a port-fuel injection
Spark-Ignition engine Paper in press Fuel 2011
[13] Hasegawa F Yokoyama S Imou K Methanol or ethanol produced from woody biomass Which is more advantageous Bioresource
Technology 2010101 S109ndashS111
[14] Fumio Hasegawa Shinya Yokoyama Kenji Imou Methanol or ethanol produced from woody biomass Which is more
advantageous Bioresource Technology 2010101S109ndashS111
[15] Shan Jian Cao Ai You Hao Hong Yuan Sun Tao Sun A convenient preparation of ethoxymethoxymethane and its effect on
the solubility of methanolgasoline blends Chinese Chemical Letters 2009 20973ndash976
[16] Pourkhesalian AM Shamekhi AH Salimi F Alternative fuel and
gasoline in an SI engine A comparative study of performance and emissions characteristics Fuel 2010891056ndash1063
[17] Cavalcante Cordeiro de Melo T Bastos Machado G Machado RT
Pereira Belchior Jr CR Pereira PP Thermodynamic modeling of compression combustion and expansion processes of gasoline
ethanol and natural gas with experimental validation on a flexible
fuel engine SAE World Congress 200724-35 [18] Shenghua L Cuty Clemente ER Tiegang H Yanjv W Study of
spark ignition engine fueled with methanolgasoline fuel blends
Applied Thermal Engineering 2007271904ndash1910 [19] Ozsezen AN Canakci M Performance and combustion
characteristics of alcohole gasoline blends at wide-open throttle
Energy 2011362747-2752 [20] G Broustail F Halter P Seers G Moreacuteac C Mounaim-Rousselle
Comparison of regulated and non-regulated pollutants with iso-
octanebutanol and iso-octaneethanol blends in a port-fuel injection Spark-Ignition engine Fuel xxx (2011) xxxndashxxx
[21] Ahmet Necati Ozsezen Mustafa Canakci Performance and
combustion characteristics of alcohol-gasoline blends at wide-open throttle Energy 2011362747-2752
[22] M Bahattin Ccedilelik Buumllent Oumlzdalyan Faruk Alkan The use of pure
methanol as fuel at high compression ratio in a single cylinder gasoline engine 2010
[23] Muharrem Eyidogan Ahmet Necati Ozsezen Mustafa Canakci Ali
Turkcan Impact of alcoholndashgasoline fuel blends on the performance and combustion characteristics of an SI engine Fuel 2010892713ndash
2720
[24] Ali M Pourkhesalian Amir H Shamekhi FarhadSalimi Alternative fuel and gasoline in an SI engine A comparative study of
performance and emissions characteristics Fuel 2010891056ndash
1063 [25] Turns SR An introduction to combustion-concepts and applications
New York McGraw-Hill 2000
[26] Hsieh WD Chen RH Wu TL Lin TH Engine performance and pollutant emission of an SI engine using ethanolndashgasoline blended
fuels Atmos Environ 200236403ndash410
[27] Agarwal AK Biofuels (alcohols and biodiesel) applications as fuels for internal combustion engines Prog Energy Combust Sci
200733233ndash271
[28] Mouloungui Z Vaitilingom G Berge JC Caro PS Interest of combining an additive with diesel ethanol blends for use in diesel
engines Fuel 200180(4)565ndash574
[29] Celik MB Experimental determination of suitable ethanolndashgasoline blend rate at high compression ratio for gasoline engine Appl
Therm Eng 200828396ndash404
[30] Wu CW Chen RH Pu JY Lin TH The influence of airndashfuel ratio on engine performance and pollutant emission of an SI engine using
ethanolndashgasoline blended fuels Atmos Environ 2004387093ndash
7100 [31] Al-Hasan M Effect of ethanol-unleaded gasoline blends on engine
performance and exhaust emissions Energy Conv Manage
2003441547ndash1561
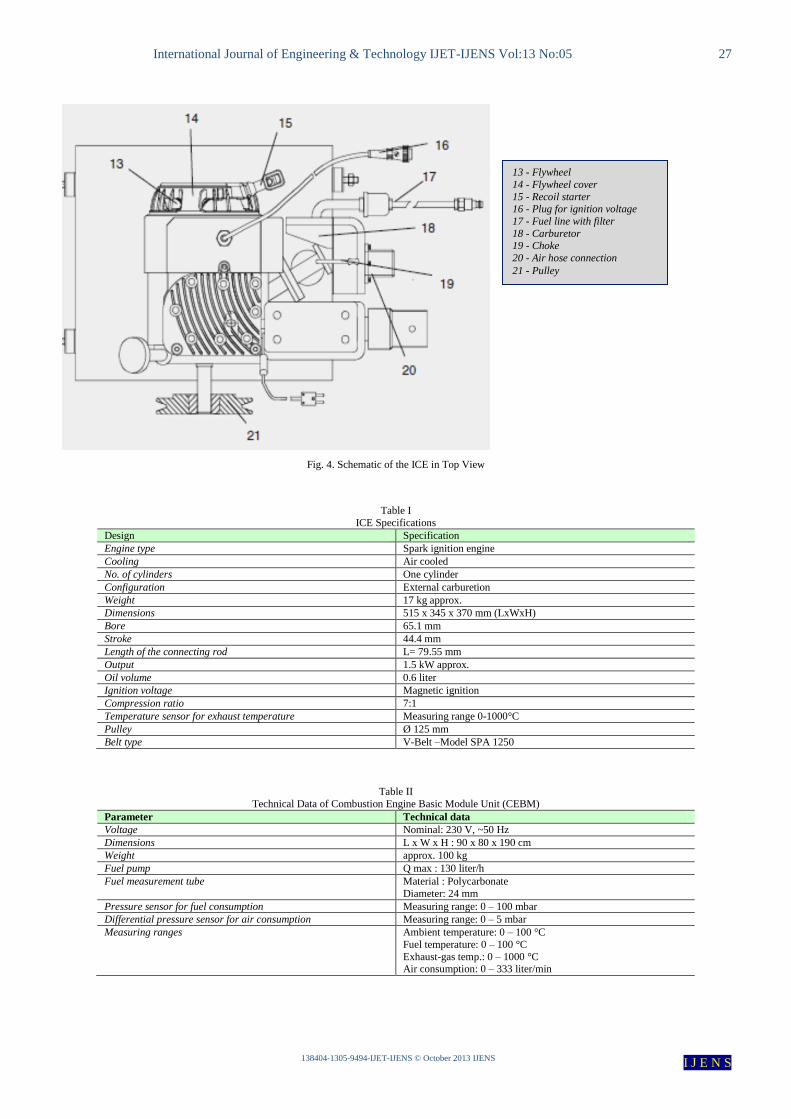
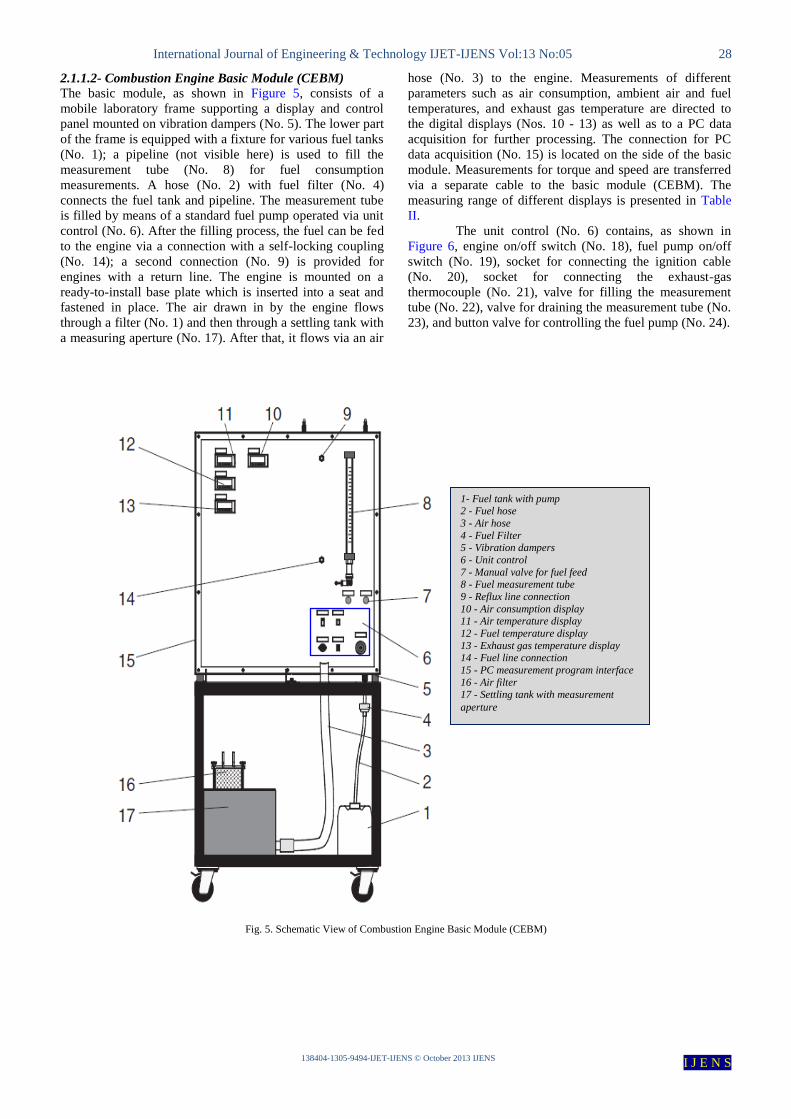
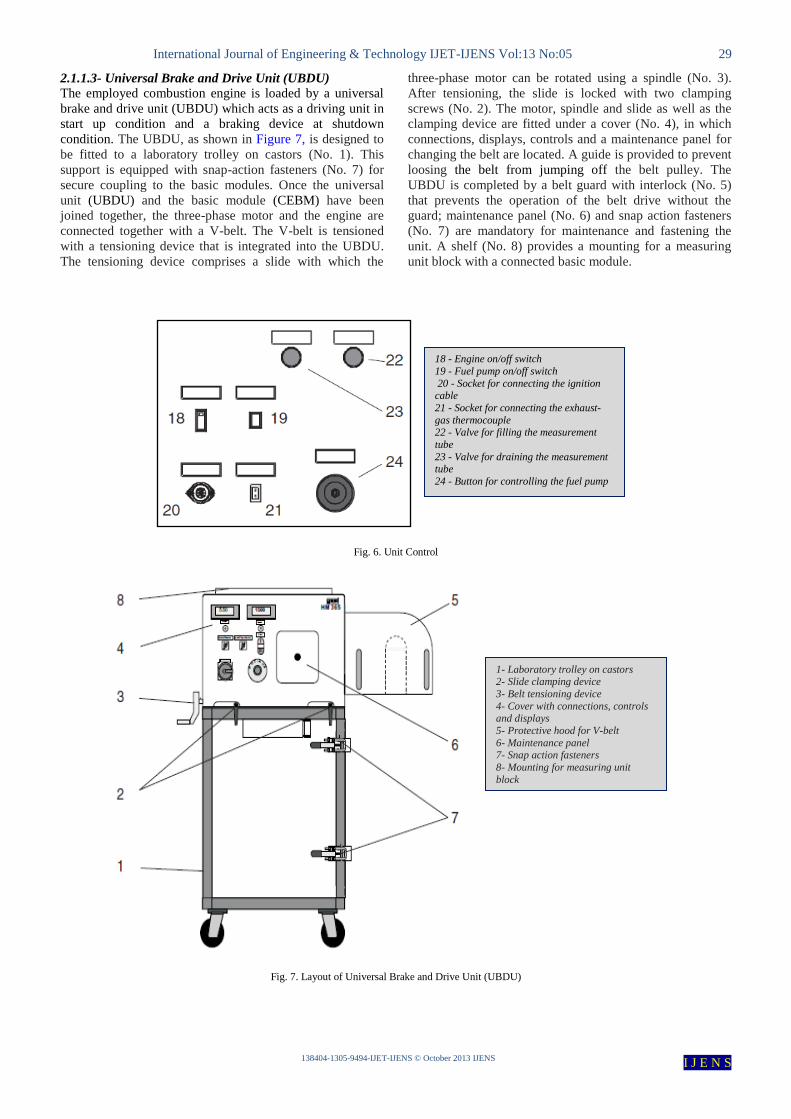