Embed Size (px)
Citation preview
International Research Journal of Engineering and Technology (IRJET) e-ISSN: 2395-0056
Volume: 07 Issue: 12 | Dec 2020 www.irjet.net p-ISSN: 2395-0072
© 2020, IRJET | Impact Factor value: 7.529 | ISO 9001:2008 Certified Journal | Page 2244
Investigation on Natural Draft Cooling Tower with Different Case Study
of Slenderness Ratios
Pratik Kumar Goyal1, Kajal Mistry2, Anurag Wahane3
1Assistant Professor, Dept. of Civil Engineering, University Teaching Department, CSVTU, Bhilai, C.G., India 2PG Scholar, Dept. of Civil Engineering, MM College of Technology, Raipur, C.G., India
3PhD Scholar, Dept. of Civil Engineering, University Teaching Department, CSVTU, Bhilai, C.G., India -----------------------------------------------------------------------***-------------------------------------------------------------------------- Abstract- The prime focus of the present major project work is to study the behavior of chimney structure under the effect of wind loads. The location selected for the study is Raipur in Chhattisgarh (INDIA). This Research Study comprises of wind analysis with the design of Reinforced Concrete (RC) Natural draft-cooling tower. Such chimneys or cooling tower are designed with Indian Standard code of practice (IS 4998:1992). RCC Natural Draft Cooling Tower is been modeled in STAAD.Pro V8i. Self-weight of the tower along with steel supports and temperature load are considered for this study. Particularly as cooling tower as a huge RCC Structure is at risk to the wind pressures so it is essential for us to derive correct measure for the tower against the wind analysis or design wind speed. In other words, model with different H/D ratio i.e., 1,2,3,4,5 with common height and differ in base diameter are analyzed for wind speed 39m/s for the parameters such as Displacement, Stress & Drag force. After the analysis, the tower whomever are efficient and practically safe are suitable for the general construction. The main objectives of this study are as follows- To model the tower with common height with different
base diameter having slenderness ratio (H/D) varying from 1.0 to 5.0.
To analyze & design concrete & wind analysis for each main cases.
To analyze individual & comparison outputs of Cooling Tower cases for parameters such as Displacement, Plate Stress and Drag Force.
To check the practical efficient behavior of RCC Cooling Tower with graphical representation of each cases.
Keywords: Cooling Tower, H/D, Displacement, Drag Force, RCC
1. INTRODUCTION In 19th century, cooling towers originated through the development of condensers for use with the steam engine. Condensers use relatively cool water, via various means, to condense the steam coming out of the cylinders or turbines. This reduces the back pressure, which in turn reduces the steam consumption, and thus the fuel consumption, while at the same time increasing power and recycling boiler-water. However, the condensers require an ample supply of cooling water, without which they are impractical. A
hyperboloid cooling tower was patented by the Dutch engineers Frederik van Iterson and Gerard Kuypers in 1918. The first hyperboloid cooling towers were built in 1918 near Heerlen. The first ones in the United Kingdom were built in 1924 at Lister Drive power station in Liverpool, England, to cool water used at a coal-fired electrical power station.
By the turn of the 20th Century, several evaporative methods of recycling cooling water were in use in areas lacking an established water supply, as well as in urban locations where municipal water mains may not be of sufficient supply; reliable in times of demand; or otherwise, adequate to meet cooling needs. In areas with available land, the systems took the form of cooling ponds; in areas with limited land, they took the form of cooling towers.
1.1 Various Classifications of Cooling Tower
Classification by Use - 1. Heating, Ventilation & Air
Conditioning 2. Industrial cooling
towers
Classification by build - 1. Package type 2. Field erected type
Classification With respect to the Heat Transfer
Mechanism -
1. Wet Cooling Towers 2. Closed Circuit Cooling Towers
3. Dry Cooling Towers 4. Hybrid Cooling Towers Classification With Respect to Drawing Air through
the Tower – 1. Natural Draft 2. Mechanical Draft 3. Fan Assisted Natural Draft HVAC (Heating, Ventilating, And Air Conditioning) Cooling Tower is used to dispose of ("reject") unwanted heat from a chiller. Water-cooled chillers are normally more energy efficient than air-cooled chillers due to heat rejection to tower water at or near wet-bulb temperatures. Industrial cooling towers are much larger than HVAC towers. HVAC use of a cooling tower pairs the cooling tower with a water-cooled chiller condenser.
International Research Journal of Engineering and Technology (IRJET) e-ISSN: 2395-0056
Volume: 07 Issue: 12 | Dec 2020 www.irjet.net p-ISSN: 2395-0072
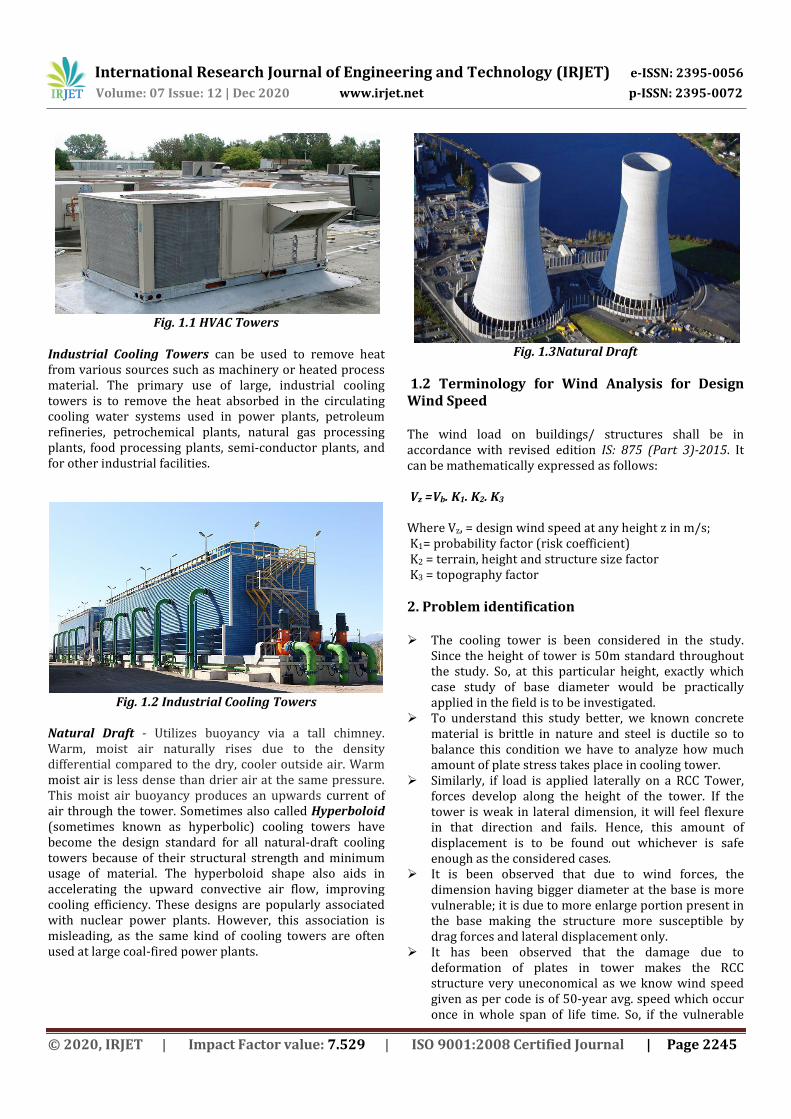
Fig. 1.1 HVAC Towers
Industrial Cooling Towers can be used to remove heat from various sources such as machinery or heated process material. The primary use of large, industrial cooling towers is to remove the heat absorbed in the circulating cooling water systems used in power plants, petroleum refineries, petrochemical plants, natural gas processing plants, food processing plants, semi-conductor plants, and for other industrial facilities.
Fig. 1.2 Industrial Cooling Towers
Natural Draft - Utilizes buoyancy via a tall chimney. Warm, moist air naturally rises due to the density differential compared to the dry, cooler outside air. Warm moist air is less dense than drier air at the same pressure. This moist air buoyancy produces an upwards current of air through the tower. Sometimes also called Hyperboloid (sometimes known as hyperbolic) cooling towers have become the design standard for all natural-draft cooling towers because of their structural strength and minimum usage of material. The hyperboloid shape also aids in accelerating the upward convective air flow, improving cooling efficiency. These designs are popularly associated with nuclear power plants. However, this association is misleading, as the same kind of cooling towers are often used at large coal-fired power plants.
Fig. 1.3Natural Draft
1.2 Terminology for Wind Analysis for Design Wind Speed The wind load on buildings/ structures shall be in accordance with revised edition IS: 875 (Part 3)-2015. It can be mathematically expressed as follows: Vz =Vb. K1. K2. K3
Where Vz, = design wind speed at any height z in m/s;
K1= probability factor (risk coefficient) K2 = terrain, height and structure size factor K3 = topography factor
2. Problem identification The cooling tower is been considered in the study.
Since the height of tower is 50m standard throughout the study. So, at this particular height, exactly which case study of base diameter would be practically applied in the field is to be investigated.
To understand this study better, we known concrete material is brittle in nature and steel is ductile so to balance this condition we have to analyze how much amount of plate stress takes place in cooling tower.
Similarly, if load is applied laterally on a RCC Tower, forces develop along the height of the tower. If the tower is weak in lateral dimension, it will feel flexure in that direction and fails. Hence, this amount of displacement is to be found out whichever is safe enough as the considered cases.
It is been observed that due to wind forces, the dimension having bigger diameter at the base is more vulnerable; it is due to more enlarge portion present in the base making the structure more susceptible by drag forces and lateral displacement only.
It has been observed that the damage due to deformation of plates in tower makes the RCC structure very uneconomical as we know wind speed given as per code is of 50-year avg. speed which occur once in whole span of life time. So, if the vulnerable
© 2020, IRJET | Impact Factor value: 7.529 | ISO 9001:2008 Certified Journal | Page 2245
International Research Journal of Engineering and Technology (IRJET) e-ISSN: 2395-0056
Volume: 07 Issue: 12 | Dec 2020 www.irjet.net p-ISSN: 2395-0072
conditions can be identified by the study then there is no worry at the time of high-speed tornado or cyclone or hurricane.
3. Methodology 3.1 Summary of the Study
Fig. 3.1 Flow Chart of Summary of Methodology
3.2 Structural & Material Properties of Cooling Tower to be analyzed The Top area i.e., top diameter considered here are taken equal for all different cases as well as the height of cooling tower is kept constant for all different cases i.e., Slenderness Ratio (H/D) = 1, Slenderness Ratio (H/D) =2, Slenderness Ratio (H/D) = 3, Slenderness Ratio (H/D) = 4, Slenderness Ratio (H/D) = 5, respectively analyzed under wind analysis as per IS 4998:1992. The top diameter of cooling tower is of 12 mm with an effective height of 50 meter excluding the support. The total height of cooling tower is taken as 50 meter plus the fixed support of 3 meter height equal to 53 meter for all the structures and also the section properties is also common for all case frame structures. The following below are the Case Study to be analyzed and designed in this research study-
Table 3.1 Case Distribution List of all Models for the Research Study
Main Cases
Ratios Case Study Details
Case 1 Tower
Slenderness Ratio (H/D=1)
Tower Having H/D Ratio 1.0 with wind speed 39
m/sec
Case 2 Tower
Slenderness Ratio (H/D=2)
Tower Having H/D Ratio 2.0 with wind speed 39
m/sec
Case 3 Tower
Slenderness Ratio (H/D=3)
Tower Having H/D Ratio 3.0 with wind speed 39
m/sec
Case 4 Tower
Slenderness Ratio (H/D=4)
Tower Having H/D Ratio 4.0 with wind speed 39
m/sec
Case 5 Tower
Slenderness Ratio (H/D=5)
Tower Having H/D Ratio 5.0 with wind speed 39
m/sec
The various important structural configuration of Cooling Tower plays an important role in the design and analysis of the tower especially base diameter of tower. The parts are as follows – Height of tower, Top diameter of tower, Throat diameter of tower & distance of top from the throat. In this study, were “H” is height of cooling tower and “D” is Base diameter of tower. The ratio of H/D is said to be slenderness ratio as discussed above in the table. The cooling tower cases is divided into cases based on the different slenderness ratio i.e. Tower Having H/D Ratio 1.0(Case 1 Tower), Tower Having H/D Ratio 2.0(Case 2 Tower), Tower Having H/D Ratio 3.0(Case 3 Tower), Tower Having H/D Ratio 4.0(Case 4 Tower), Tower Having H/D Ratio 5.0 (Case 5 Tower) with each case is analyzed for wind speed 39 m/sec as per IS code 875 Part -3 and also analyzed for the drag force parameter developed due to lateral force. The structural data provided in this study and considered for design analysis of cooling tower are given below-
Table 3.2 Structural Properties for Design of RCC Cooling Tower
Slenderness Ratio (Height/Lateral
Dimension)
Top Diameter(
m)
Base Diameter(m)
Throat Diameter(m)
Distance of Top from
Throat (m)
H/D = 1.0
12 49.58 9 7
H/D = 2.0
12 24.31 9 13
START
Problem Identification
Planning of RCC Cooling Tower
(H/D)= 1 (CASE 1)
Structural & Material Properties Applied In The Following Case Study
Load Specifications (Ie. Primary Loads & Load Combinations) & Load Calculations Used In STAAD Pro. Common For All Cooling Tower
Application Of Wind Definiton & Applying In Lateral Direction
Using STAAD Pro. V8i Software Explaination Of Procedure Of Wind Analysis
Output Reports of all RCC Cooling Tower analyzed on basis of Wind parameters
Comparative Study of the Reports
Conclusions For Existing Case Study
Improvement Of Cooling Tower Based On The Results And Thier Remedial Measures
END
(H/D)= 2 (CASE 2)
(H/D)= 3 (CASE 3)
(H/D)= 4 (CASE 4)
(H/D)= 5 (CASE 5)
© 2020, IRJET | Impact Factor value: 7.529 | ISO 9001:2008 Certified Journal | Page 2246

International Research Journal of Engineering and Technology (IRJET) e-ISSN: 2395-0056
Volume: 07 Issue: 12 | Dec 2020 www.irjet.net p-ISSN: 2395-0072
H/D = 3.0
12 16.73 9 18
H/D = 4.0
12 12.44 9 24
H/D = 5.0
12 10.02 10 45
The following below table shows all the structural properties common for all the case study considered on this project and the case models have been designed for these properties –
Table 3.3 Structural Properties used for all buildings
Particulars Structural Properties
Number of Sections (according to height)
0 m to 50 m
Total height including the supports
53 meter
Slab/Plate thickness 300 mm
Height of Fixed Supports 3 meter
Steel Section for supports ISA 200 X 150 X 20 mm
Dead load IS 875 Part-1
Live load IS 875 Part-2
Wind Load & Analysis IS 875 Part-3
Code for RCC Cooling Tower
IS 4998:1992
Table 3.4 Material Properties used in all Frames
Particular Details
Grade of Concrete M30
Grade of Main Steel Fe415
Grade of Secondary Steel Fe415
Density of Reinforced Concrete
25 KN/m3
Ultimate Tensile Strength of Steel (Indian std.)
420 N/mm2
Yield Strength of Steel (Indian std.)
250 N/mm2
3.3 Loading Specification & Calculations Common for all cases The loads which is to be studied in the project is discussed under following clauses below in which their calculation detail is also been discussed such as Primary load, Wind Load & their load combination etc. 3.3.1 Primary Loads Applied for Analysis – In STAAD.Pro Software, the loads are taken in the form of load cases i.e., primary load cases and the load combination of primary load cases also which are used same for all four Cooling Towers adding to “load case detail” section in the software. The total number of load cases, magnitude of loads and load combinations used is same for all the four model cases. Firstly, here are the primary load cases which have been used in STAAD.Pro software analysis are given below in table 3.5 with their load type & numbers.
Table 3.5 Primary Load Cases
Load Case No.
Abbreviation Used
Load Type
1 WX Wind Load
2 WZ Wind Load
3 D.L. Dead Load
4 Temp. Temperature Load
3.3.2 Load Calculations Applied for the Design The calculated load acting on the structures of dead load, temperature Load which is external load due to heavy gas fumes temperature and wind intensity calculation under basic wind speed 39 m/sec for further action in the analysis are given below-
Dead Load (D.L) –
The dead load of the RCC frame structure containing beam, column and created Surface/Plate elements for the swimming pool is applied in the structure by assigning self-weight load in Y-Direction with load factor -1.
Temperature Load (Temp) –
In this research, live load is in the form of temperature in the cooling tower which is considered here according to IS
© 2020, IRJET | Impact Factor value: 7.529 | ISO 9001:2008 Certified Journal | Page 2247
International Research Journal of Engineering and Technology (IRJET) e-ISSN: 2395-0056
Volume: 07 Issue: 12 | Dec 2020 www.irjet.net p-ISSN: 2395-0072
4998:1992 i.e., “Temperature Change for axial elongation” here it is equal to 500, “Temperature Differential from Top to Bottom” consideration not greater than 100 and “Temperature Differential from Side to Side” equal to 1000. Temperature load is from inside of tower as a function. Temperature Load is designated or stands for Temp or “T” in STAAD.Pro while designing tower in this research work.
Wind Load (WX & WZ) –
Wind load calculation involves the calculation of wind pressure or wind intensity which is to be embedded in the software for the wind analysis which is done purely as per IS 875 Part-3. Here, Basic wind speeds presented in have been worked out for a 50 year return period. Basic wind speed Vb for some important cities/towns is also given in Appendix-A of IS 875 Part-3 as our location of cooling tower is in Raipur, Chhattisgarh having basic wind speed 39 m/sec applied for wind analysis. Here, the Coefficient of Risk Factor (K1) is 1.08, Terrain Category 2- Open terrain with well scattered obstructions having heights generally between 1.5 to 10 m along with Class C- Structures and/or their components such as cladding, glazing, roofing, etc. having maximum dimension (greatest horizontal or vertical dimension) lies greater than 50 m giving the value of K2 as per Table 2 (IS 875 Part-3). For Topography factor(K3), in this cooling tower we are considering the condition of wind slope greater than 30 hence the value is 1.0 as per IS 875 Part-3 . For Calculation of Design Wind Speed (refer Article 1.2) i.e., Vz = Vb* K1 * K2* K3 and all the calculation is done with the help of STAAD Software. WIND LOAD is designated as WX & WZ where “W” stands for Wind load whereas X & Z represents their respective direction in STAAD Pro.
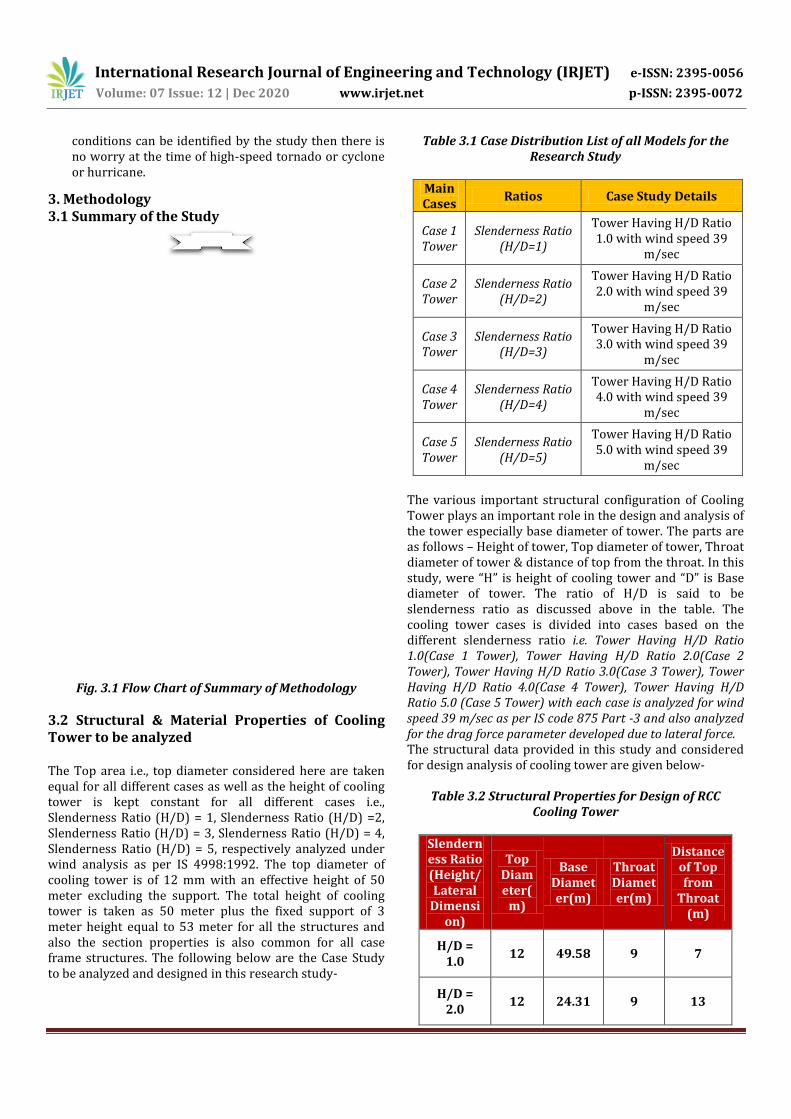
Fig. 4.1 Diameter of Tower from distance 5-50 m of all modal cases
4. Results & Discussions 4.1 Comparison report of Displacement The displacement of Cooling tower concludes that the efficient value of displacement for slenderness ratio (i.e. H/D =1.0) settled maximum value as compare to displacement for slenderness ratio (i.e. H/D =5.0) gives minimum value at 50 m height. Hence, it’s concluded that the Diameter of RCC cooling tower plays a major factor in displacement. The table 5.16shows that report of maximum value of displacement for the cases are as follows- 222.69 mm (Case 1 tower) > 99.95 mm (Case 2 tower) > 69.61 mm (Case 3 tower)> 48.5 mm (Case 4 tower)> 40.8 mm (Case 5 tower) respectively. We concluded that Greater the Slenderness ratio, Lesser the
© 2020, IRJET | Impact Factor value: 7.529 | ISO 9001:2008 Certified Journal | Page 2248

International Research Journal of Engineering and Technology (IRJET) e-ISSN: 2395-0056
Volume: 07 Issue: 12 | Dec 2020 www.irjet.net p-ISSN: 2395-0072
Displacement in Cooling tower. Greater the Diameter of tower, greater the Displacement in Cooling towers. When compared between the Case Towers at 5 m height due to common diameter of 12 m, the displacement shows not much difference but when compared at 50 m height, huge difference is analyzed making the respective Case 5 tower much practically safer.
Table 4.1Comparison of Displacement Report
At Heig
ht (m)
Displacement
for Case 1 (mm)
Displacement
for Case 2 (mm)
Displacement
for Case 3 (mm)
Displacement
for Case 4 (mm)
Displacement
for Case 5 (mm)
5 m 48.044 48.045 47.848 46.188 48.168
10 m
34.864 38.48 39.929 39.588 43.728
15 m
41.043 34.453 36.122 36.505 42.299
20 m
55.941 35.297 34.013 34.288 41.083
25 m
74.0 40.164 34.507 33.031 40.02
30 m
93.397 47.358 37.197 33.173 39.116
35 m
113.442 55.988 41.367 34.627 38.383
40 m
133.851 65.488 46.594 37.073 37.841
45 m
154.32 75.575 52.534 40.389 37.511
50 m
222.692 99.955 69.613 48.508 40.8
Graph 4.1 Comparison of Displacement Report
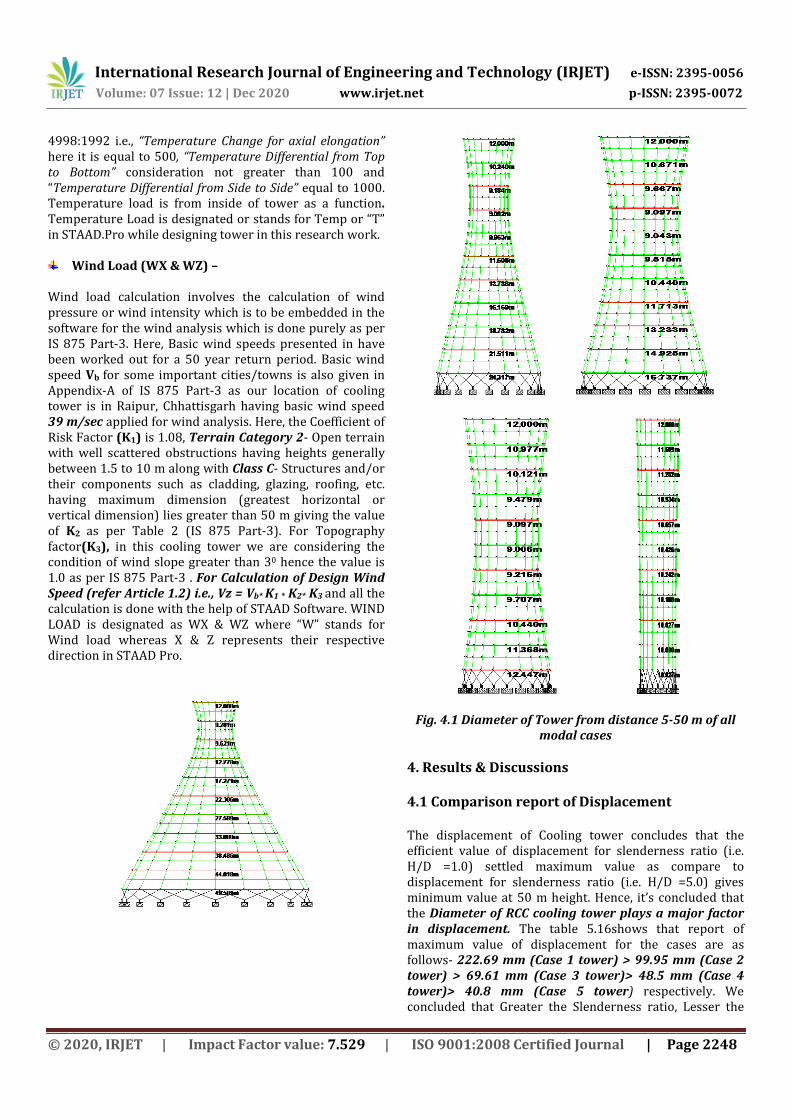
4.2 Comparison report of Plate Stress The Plate stress in cooling tower concludes that the efficient value of stress for slenderness ratio (i.e. H/D =1.0) settled maximum value as compare to all other cases which shows much similar response in terms of stresses. Hence, concluded that Greater the Diameter of Cooling Tower, Greater the Plate stress in RCC towers.
Table 4.2 Comparison of Plate Stress Report
At Heig
ht (m)
Plate Stress
for Case 1
(N/mm2)
Plate Stress
for Case 2
(N/mm2)
Plate Stress
for Case 3
(N/mm2)
Plate Stress
for Case 4
(N/mm2)
Plate Stress
for Case 5
(N/mm2)
5 m 20.882 20.863 20.861 20.865 20.852
10 m 19.538 19.634 19.656 19.685 19.656
15 m 19.478 19.584 19.62 19.656 19.638
20 m 19.465 19.56 19.606 19.643 19.64
25 m 19.433 19.548 19.596 19.633 19.652
30 m 19.39 19.543 19.594 19.652 19.671
35 m 19.342 19.537 19.605 19.679 19.693
40 m 19.334 19.529 19.673 19.715 19.715
45 m 19.879 19.678 19.994 19.797 19.779
50 m
25.508 19.747 22.566 22.416 22.179
In the above table five comparative analysis is done for the RCC Towers, according to which value of stress is given by i.e. The table 5.2shows that report of maximum value of stresses for the cases are as follows- 25.5 N/mm2 (Case 1 tower) > 22.566 N/mm2 (Case 3 tower) > 22.41 N/mm2(Case 4 tower)> 22.17 N/mm2 (Case 5 tower)> 19.74 N/mm2 (Case 2 tower) respectively. When compared between the Case Towers at 5 m height due to common diameter of 12 m, the stress shows not much difference but when compared at 50 m height, difference is analyzed making the respective Case 2 & 5 towers much practically safer.
222.692
99.955
69.613
48.508
40.8
0
50
100
150
200
250
5 m 10 m 15 m 20 m 25 m 30 m 35 m 40 m 45 m 50 m
Displacement for Case 1 Displacement for Case 2Displacement for Case 3 Displacement for Case 4Displacement for Case 5
© 2020, IRJET | Impact Factor value: 7.529 | ISO 9001:2008 Certified Journal | Page 2249
International Research Journal of Engineering and Technology (IRJET) e-ISSN: 2395-0056
Volume: 07 Issue: 12 | Dec 2020 www.irjet.net p-ISSN: 2395-0072
Graph 4.2 Comparison of Plate Stress Report
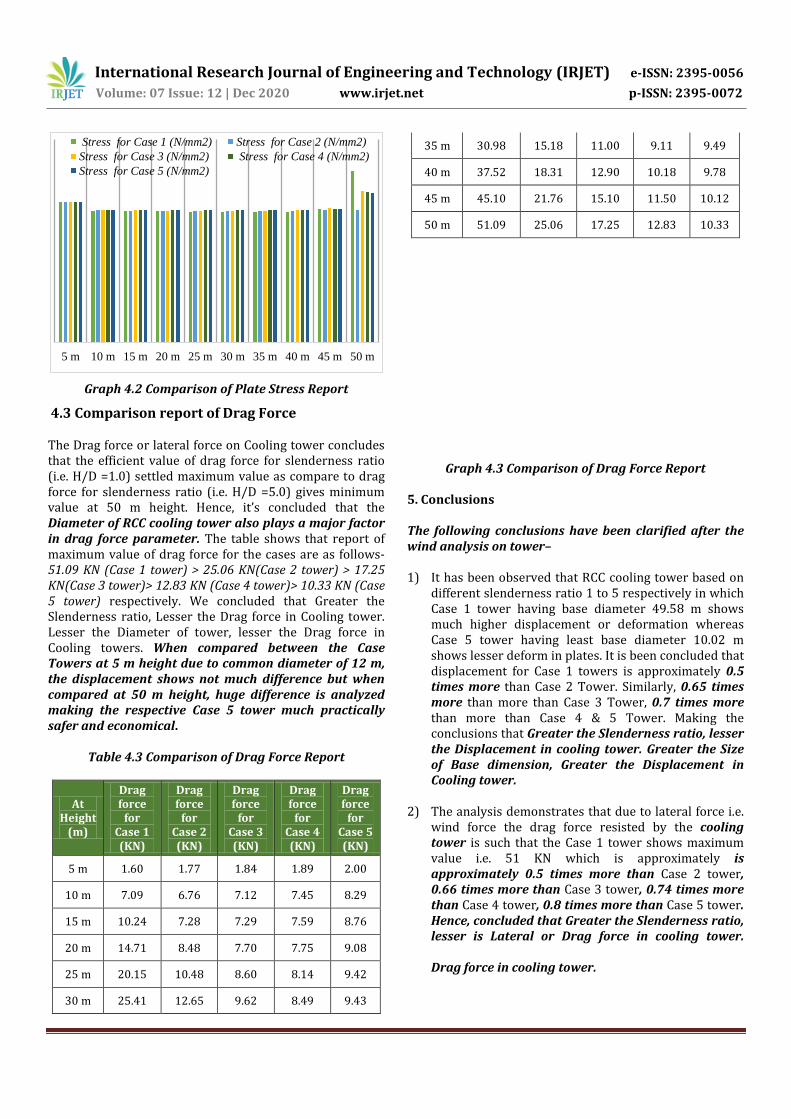
4.3 Comparison report of Drag Force The Drag force or lateral force on Cooling tower concludes that the efficient value of drag force for slenderness ratio (i.e. H/D =1.0) settled maximum value as compare to drag force for slenderness ratio (i.e. H/D =5.0) gives minimum value at 50 m height. Hence, it’s concluded that the Diameter of RCC cooling tower also plays a major factor in drag force parameter. The table shows that report of maximum value of drag force for the cases are as follows- 51.09 KN (Case 1 tower) > 25.06 KN(Case 2 tower) > 17.25 KN(Case 3 tower)> 12.83 KN (Case 4 tower)> 10.33 KN (Case 5 tower) respectively. We concluded that Greater the Slenderness ratio, Lesser the Drag force in Cooling tower. Lesser the Diameter of tower, lesser the Drag force in Cooling towers. When compared between the Case Towers at 5 m height due to common diameter of 12 m, the displacement shows not much difference but when compared at 50 m height, huge difference is analyzed making the respective Case 5 tower much practically safer and economical.
Table 4.3 Comparison of Drag Force Report
At Height
(m)
Drag force
for Case 1 (KN)
Drag force
for Case 2 (KN)
Drag force
for Case 3 (KN)
Drag force
for Case 4 (KN)
Drag force
for Case 5 (KN)
5 m 1.60 1.77 1.84 1.89 2.00
10 m 7.09 6.76 7.12 7.45 8.29
15 m 10.24 7.28 7.29 7.59 8.76
20 m 14.71 8.48 7.70 7.75 9.08
25 m 20.15 10.48 8.60 8.14 9.42
30 m 25.41 12.65 9.62 8.49 9.43
35 m 30.98 15.18 11.00 9.11 9.49
40 m 37.52 18.31 12.90 10.18 9.78
45 m 45.10 21.76 15.10 11.50 10.12
50 m 51.09 25.06 17.25 12.83 10.33
Graph 4.3 Comparison of Drag Force Report
5. Conclusions The following conclusions have been clarified after the wind analysis on tower– 1) It has been observed that RCC cooling tower based on
different slenderness ratio 1 to 5 respectively in which Case 1 tower having base diameter 49.58 m shows much higher displacement or deformation whereas Case 5 tower having least base diameter 10.02 m shows lesser deform in plates. It is been concluded that displacement for Case 1 towers is approximately 0.5 times more than Case 2 Tower. Similarly, 0.65 times more than more than Case 3 Tower, 0.7 times more than more than Case 4 & 5 Tower. Making the conclusions that Greater the Slenderness ratio, lesser the Displacement in cooling tower. Greater the Size of Base dimension, Greater the Displacement in Cooling tower.
2) The analysis demonstrates that due to lateral force i.e. wind force the drag force resisted by the cooling tower is such that the Case 1 tower shows maximum value i.e. 51 KN which is approximately is approximately 0.5 times more than Case 2 tower, 0.66 times more than Case 3 tower, 0.74 times more than Case 4 tower, 0.8 times more than Case 5 tower. Hence, concluded that Greater the Slenderness ratio, lesser is Lateral or Drag force in cooling tower.
Drag force in cooling tower.
5 m 10 m 15 m 20 m 25 m 30 m 35 m 40 m 45 m 50 m
Stress for Case 1 (N/mm2) Stress for Case 2 (N/mm2)
Stress for Case 3 (N/mm2) Stress for Case 4 (N/mm2)
Stress for Case 5 (N/mm2)
0
10
20
30
40
50
60
5 m 10 m 15 m 20 m 25 m 30 m 35 m 40 m 45 m 50 m
© 2020, IRJET | Impact Factor value: 7.529 | ISO 9001:2008 Certified Journal | Page 2250
Lesser the Size of CFST column, lesser is Lateral or
International Research Journal of Engineering and Technology (IRJET) e-ISSN: 2395-0056
Volume: 07 Issue: 12 | Dec 2020 www.irjet.net p-ISSN: 2395-0072
REFERENCES 1) Shaikh M. G., Khan H.A.M.I., “Governing Loads for
Design of A tall RCC Chimney”, IOSR Journal of Mechanical and Civil Engineering, ISSN: 2278-1684, 2014.
2) Vananje Bhagyashree, Shinde Namrata, “Comparison between Steel Chimney and R.C.C. Chimney”, International Journal on Recent and Innovation Trends in Computing and Communication, ISSN: 2321-8169, Volume: 4 Issue: 4, April 2016.
3) Naik Sagar S., Bhatt Aditya,“A Review on Parametric Study of RCC Chimney For Different Loading Condition”, International Journal of Advance Engineering and Research Development, e-ISSN (O): 2348-4470, Volume 4, Issue 11, November -2017.
4) Baiju Amitha , “Analysis of Tall RC Chimney as per Indian Standard Code”, International Journal of Science and Research (IJSR) ISSN (Online): 2319-7064,Volume 5 Issue 9, September 2016.
5) IS: 875 (Part I) – 1987, “Code of Practice for Design Loads (Other than Earthquake) For Buildings and Structures”, Part 1 Dead Loads - Unit Weights Of Building Materials And Stored Materials, Second Revision, September 2003.
6) IS 456:2000, “Plain and Reinforced Concrete - Code of Practice”, Fourth Revision, 2000.
7) N.Krishna Raju, “Design of Reinforced Concrete Structures”, CBS Publishers & Distributors Pvt. Ltd., Fourth Edition, 2010.
8) IS 4998:1992, “Criteria for design of reinforced concrete chimneys, Part 1: Assessment of loads [CED 38: Special Structures]”, Second Revision, 2003.
9) IS: 875 (Part 2) – 1987, “Code of Practice for Design Loads (Other Than Earthquake) For Buildings and Structures”, Part 2 Imposed Loads, Second Revision and June 1998.
© 2020, IRJET | Impact Factor value: 7.529 | ISO 9001:2008 Certified Journal | Page 2251