Embed Size (px)
Citation preview
Investigation of Thermal Inversions as a MajorContributer to the Black Cloud Episodes over Cairo
Hesham El-AskaryDepartment of Environmental Studies, Faculty of Science,
Alexandria University,Alexandria, [email protected]
Abstract- Aerosol index measurements from the Total OzoneMonitoring Spectroradiometer (TOMS) revealed the aerosolconcentrations scattering properties to the UV radiations duringthe season well known to the locals and named as the Black cloudseason. Aerosol Optical Depth (AOD) obtained from Moderateresolution Imaging Spectroradiometer (MODIS) showed the highaerosol concentrations during October of each year. Verticaltemperature profiles obtained from the Atmospheric InfraredSounder (AIRS) level-3 daily global girded data product duringthe months of September and October over Cairo are analyzed.AIRS, is one of the most advanced space-based atmosphericsounding systems. These profiles reveal the occurrence of aninversion layer in the lower troposphere in the vicinity of lessthan 1 km above the ground surface over Cairo. Meanwhile,over the same time period, a regular negative temperaturegradient is observed over Alexandria, located 250 km away fromCairo.
Keywords- Anthropogenic Pollutants; Temperature Profiles;Inversion Layer; AIRS Observations;Albedo; Black Cloud; Cairo
I. INTRODUCTION
Cairo one of the mega cities suffers from the rapid increaseof population in its vicinity due to the increasing number ofvehicles as well as industrial activities. These factorscontribute in severe air pollution events that reach maximumlevels during the months of September and October of eachyear. Cairo's air pollution crisis has been increasing lately andhence, has a major impact on the environment and the health ofits inhabitants. Specifically, air quality has been reachingdangerous levels for lead, carbon dioxide, sulfur dioxide, andsuspended particulate matter (PM) concentrations due todecades of unregulated car emissions, urban industrialoperations, and chaff and trash burning. A "Black Cloud" hasoften appeared since 1999, over the Nile Delta and Cairo,during October and has been well reported by media. Duringthat time of the year, farmers bum rice straw, a byproduct fromthe rice harvest, to clear fields for the next crop. The result ofthis pollution problem is a permanent haze over the city withparticulate matter in the air reaching over three times normallevels. It is estimated that 10,000 to 25,000 people a year inCairo die due to air pollution-related diseases as reported bythe government. The lower topographic nature of Cairo isresponsible for pollutants blocking and suppressing the motionof suspended particulates, due to the presence of the Nile valleybetween Giza (Western Highs) and Mokatam (Eastern Highs).The weakening or diminishing of the trade wind systems over
This work is supported by a joint funding from the Egyptian Academy ofScience and the National Science Foundation (NSF)
Menas KafatosCenter for Earth Observing and Space Research (CEOSR),
George Mason University (GMU)Fairfax, VA, [email protected]
the Mediterranean leading to poor ventilation during this periodis another reason for black cloud occurrences. An inversioncan develop aloft as a result of air gradually sinking over awide area and being warmed by adiabatic compression, usuallyassociated with subtropical high pressure areas. With theceasing of convection, which is normally present in theatmosphere, a number of phenomena are associated with atemperature inversion: The air becomes stiller, hence itbecomes murky because dust and pollutants are no longer liftedfrom the surface. Hence, they can be removed only by stronghorizontal winds which are not available due to the topographicnature of Cairo and the Greater Delta region.
Aerosol in the atmosphere is a mixture of differentcomponents. The detection and identification of a specificrange of aerosol particles (pollutants in our context) requiresknowledge of the microphysical and optical properties in thesolar and terrestrial spectral range. Once characterized, theability of these aerosols to modify the incoming solar radiationcan be used to effectively identify the onset of pollutionepisodes and monitoring of the same at different times of theyear. We are making use of satellite datasets like the radiationbudget data from the AOD from MODIS and Aerosol Index(AI) from TOMS to calculate the radiation at the top of theatmosphere (TOA) [1], [2]. Moreover, numerical models canbe used to predict the radiation at the surface. The aerosolforcing at TOA, middle atmosphere and surface can becalculated based on a combination of the satellite observationsand numerical calculations [3].
II. AEROSOL INDEX MEASURMENTS
TOMS was mainly designed for total ozone retrieval wheremeasured radiances are interpreted by understanding how theEarth's atmosphere scatters ultraviolet radiation as a functionof solar zenith angle. However, Incoming solar radiationsuffers attenuation due to absorption and scattering in theatmosphere by atmospheric constituents. Radiation thatpenetrates to the troposphere is scattered by clouds andaerosols, and radiation that reaches the ground is scattered bysurfaces of widely varying reflectivity. The key parameterused here for detection of anthropogenic pollutants in thetroposphere using TOMS is the aerosol index (A.I.), which isdefined as a residue of intensities at 331 nm and 360 nm [4],[5]. The TOMS A.I. is based on the backscattered radiance
1-4244-1212-9/07/$25.00 ©2007 IEEE. 4298
1.4....--------------------------,
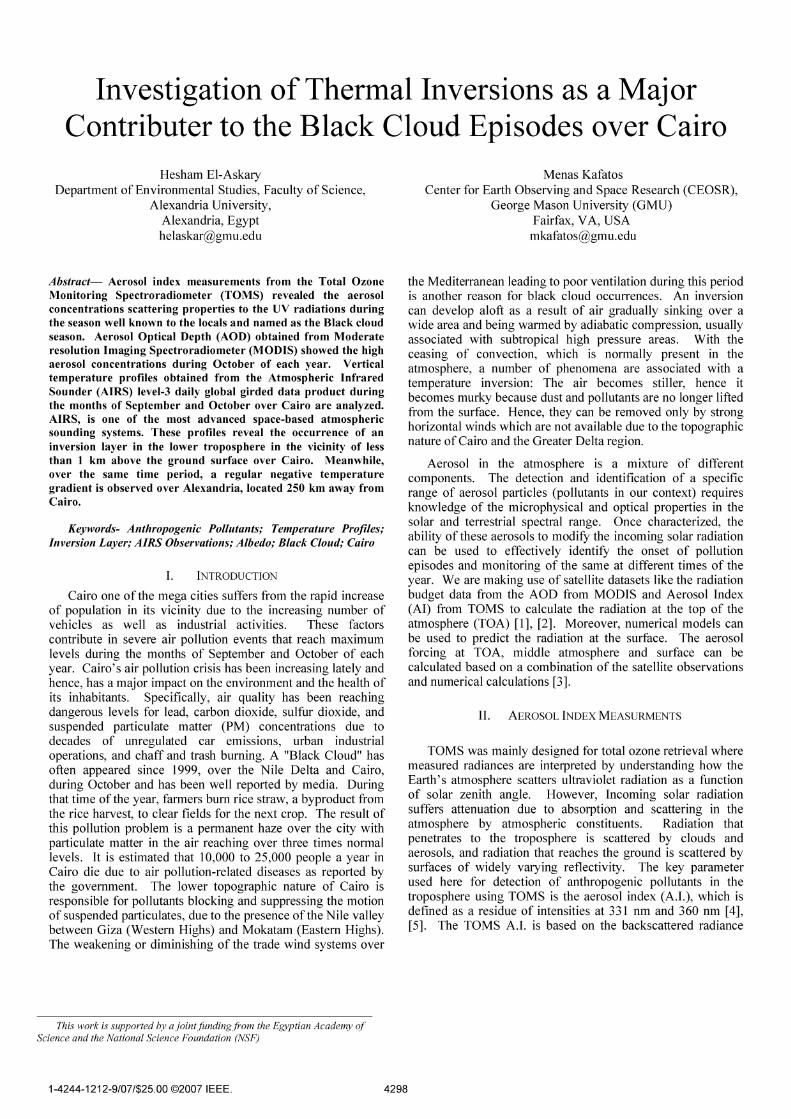
observed during September and early October which are themain time period for this event. The scattering behavior ofthese aerosols within this part of the spectrum reflects thedifferent absorbing characteristics of these aerosols.
III. AEROSOL OPTICAL DEPTH MEASURMENTS
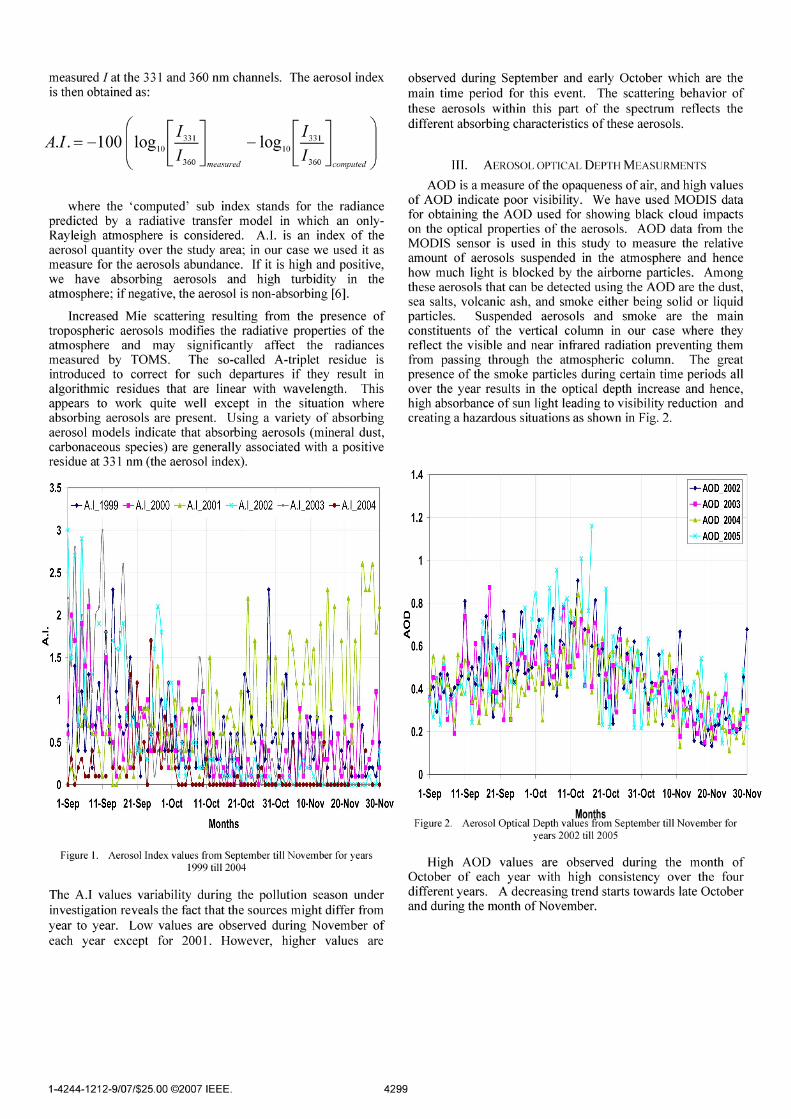
AOD is a measure of the opaqueness of air, and high valuesof AOD indicate poor visibility. We have used MODIS datafor obtaining the AOD used for showing black cloud impactson the optical properties of the aerosols. AOD data from theMODIS sensor is used in this study to measure the relativeamount of aerosols suspended in the atmosphere and hencehow much light is blocked by the airborne particles. Amongthese aerosols that can be detected using the AOD are the dust,sea salts, volcanic ash, and smoke either being solid or liquidparticles. Suspended aerosols and smoke are the mainconstituents of the vertical column in our case where theyreflect the visible and near infrared radiation preventing themfrom passing through the atmospheric column. The greatpresence of the smoke particles during certain time periods allover the year results in the optical depth increase and hence,high absorbance of sun light leading to visibility reduction andcreating a hazardous situations as shown in Fig. 2.
measured I at the 331 and 360 nm channels. The aerosol indexis then obtained as:
[ [I ] [I] JA.I. == -100 Iog., ~ -loglO ~1360 measured 1360 computed
where the 'computed' sub index stands for the radiancepredicted by a radiative transfer model in which an onlyRayleigh atmosphere is considered. A.1. is an index of theaerosol quantity over the study area; in our case we used it asmeasure for the aerosols abundance. If it is high and positive,we have absorbing aerosols and high turbidity in theatmosphere; if negative, the aerosol is non-absorbing [6].
Increased Mie scattering resulting from the presence oftropospheric aerosols modifies the radiative properties of theatmosphere and may significantly affect the radiancesmeasured by TOMS. The so-called A-triplet residue isintroduced to correct for such departures if they result inalgorithmic residues that are linear with wavelength. Thisappears to work quite well except in the situation whereabsorbing aerosols are present. Using a variety of absorbingaerosol models indicate that absorbing aerosols (mineral dust,carbonaceous species) are generally associated with a positiveresidue at 331 nm (the aerosol index).
3.5 --r------------------------,
-+-A.L1999 "'A.L2000 A.L2001 A.L2002 --A.L2003 -+-A.L2004
3 -
2.5
1.2
-+- AOD_2002
"'AOD_2003AOD_2004
AOD_2005
2
.(
1.5
0.5
o.....-....,...- -~~___rW- ....~MM~~.....-Wt........u~-~.....-...1-Sep 11-Sep 21-Sep t-Oct 11-0ct 21-0ct 31-0ct 10-NoY 20-NoY 30-NoY
Months
Figure 1. Aerosol Index values from September till November for years1999 till 2004
The A.I values variability during the pollution season underinvestigation reveals the fact that the sources might differ fromyear to year. Low values are observed during November ofeach year except for 2001. However, higher values are
0.8co-(
0.6
0.2
O-+------,---------r-------r----r------,----~----r-------!
1-Sep 11-Sep 21-Sep t-Oct 11-0ct 21-0ct 31-0ct 10-NoY 20-NoY 30-NoY
MonthsFigure 2. Aerosol Optical Depth values from September till November for
years 2002 till 2005
High AOD values are observed during the month ofOctober of each year with high consistency over the fourdifferent years. A decreasing trend starts towards late Octoberand during the month of November.
1-4244-1212-9/07/$25.00 ©2007 IEEE. 4299
IV. TEMPERATURE INVERSION BACKGROUND
. Atmospheric Temperature inversion (TI) is a veryImportant phenomenon and is considered as one of the majorfactors affecting air quality and pollution patterns over cities.Thermal inversion is a function of temperature variation withrespect to altitude where that rate of temperature change withheight is known as the lapse rate. Under normal conditionstemperature decreases with height and is known as wetadiabatic air where the standard atmospheric lapse rate is 6.5°C/km. However, under abnormal conditions the lapse ratehas a positive value where the atmospheric air temperatureincreases with height and such situation is known astemperature inversion. During the temperature inversionsituation the air is prevented from the natural verticalventilation and hence contribute in blocking different aerosolsand pollutants under the inversion layer that lead to an increasein the pollutions concentration creating a hazardous situation.Atmospheric temperature inversion is categorized into threetypes which are Radiation (ground) inversion, subsidence(elevated) inversion and frontal (capping) inversion, mentionedin [7].
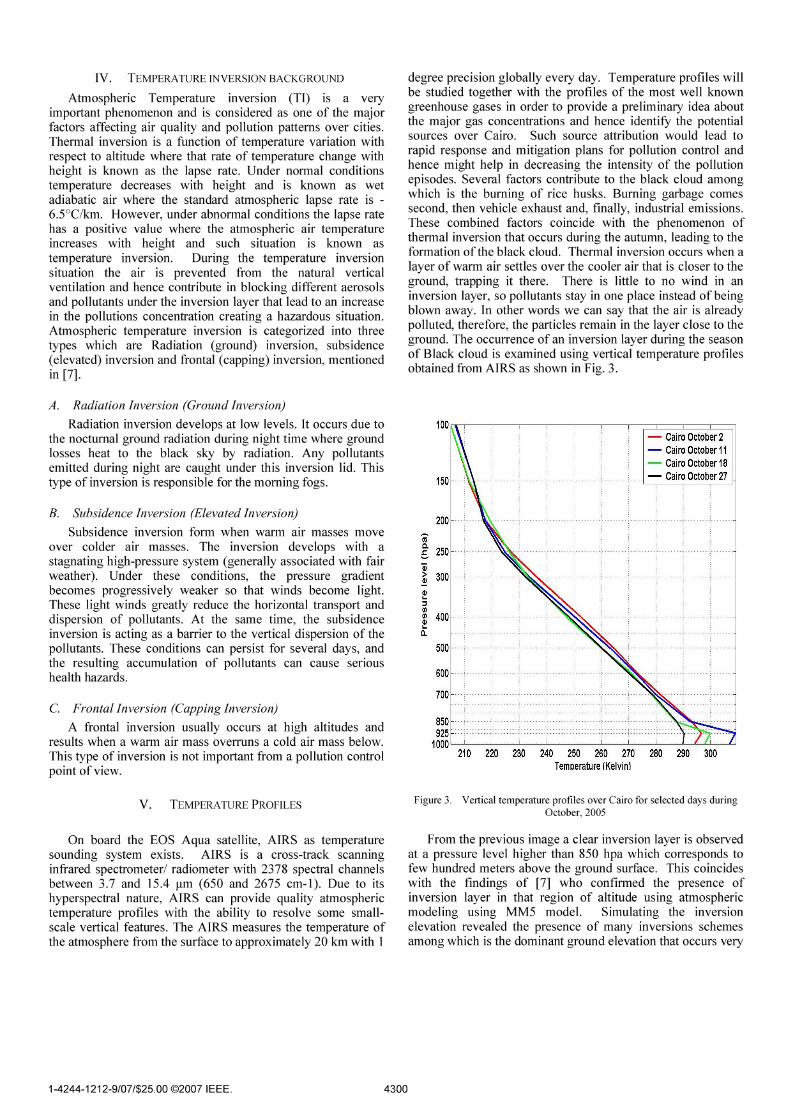
degree precision globally every day. Temperature profiles willbe studied together with the profiles of the most well knowngreenhouse gases in order to provide a preliminary idea aboutthe major gas concentrations and hence identify the potentialsources over Cairo. Such source attribution would lead torapid response and mitigation plans for pollution control andhence might help in decreasing the intensity of the pollutionepisodes. Several factors contribute to the black cloud amongwhich is the burning of rice husks. Burning garbage comessecond, then vehicle exhaust and, finally, industrial emissions.These combined factors coincide with the phenomenon ofthermal inversion that occurs during the autumn, leading to theformation of the black cloud. Thermal inversion occurs when alayer of warm air settles over the cooler air that is closer to theground, trapping it there. There is little to no wind in aninversion layer, so pollutants stay in one place instead of beingblown away. In other words we can say that the air is alreadypolluted, therefore, the particles remain in the layer close to theground. The occurrence of an inversion layer during the seasonof Black cloud is examined using vertical temperature profilesobtained from AIRS as shown in Fig. 3.
500
100
150
200
- Cairo October 2- Cairo October 11
Cairo October 18\ - Cairo October 27
\'\,~~~~,~~~
~~
"&.,,,,-"""\. ~
/ I210 220 230 240 250 260 270 280 290 300
Temoerature (Kelvin)
850925
1000
600
700
(?a.:S 250Qi§ 300QIL.::::JIJl~ 400L.
CL.
B. Subsidence Inversion (Elevated Inversion)
Subsidence inversion form when warm air masses moveover colder air masses. The inversion develops with astagnating high -pressure system (generally associated with fairweather). Under these conditions, the pressure gradientbecomes progressively weaker so that winds become light.These light winds greatly reduce the horizontal transport anddispersion of pollutants. At the same time, the subsidenceinversion is acting as a barrier to the vertical dispersion of thepollutants. These conditions can persist for several days, andthe resulting accumulation of pollutants can cause serioushealth hazards.
C. Frontal Inversion (Capping Inversion)
A frontal inversion usually occurs at high altitudes andresults when a warm air mass overruns a cold air mass below.This type of inversion is not important from a pollution controlpoint of view.
A. Radiation Inversion (Ground Inversion)
Radiation inversion develops at low levels. It occurs due tothe nocturnal ground radiation during night time where groundlosses heat to the black sky by radiation. Any pollutantsemitted during night are caught under this inversion lid. Thistype of inversion is responsible for the morning fogs.
V. TEMPERATURE PROFILES Figure 3. Vertical temperature profiles over Cairo for selected days duringOctober, 2005
On board the EOS Aqua satellite, AIRS as temperaturesounding system exists. AIRS is a cross-track scanninginfrared spectrometer/ radiometer with 2378 spectral channelsbetween 3.7 and 15.4 urn (650 and 2675 cm-I). Due to itshyperspectral nature, AIRS can provide quality atmospherictemperature profiles with the ability to resolve some smallscale vertical features. The AIRS measures the temperature ofthe atmosphere from the surface to approximately 20 km with 1
From the previous image a clear inversion layer is observedat a pressure level higher than 850 hpa which corresponds tofew hundred meters above the ground surface. This coincideswith the findings of [7] who confirmed the presence ofinversion layer in that region of altitude using atmosphericmodeling using MM5 model. Simulating the inversionelevation revealed the presence of many inversions schemesamong which is the dominant ground elevation that occurs very
1-4244-1212-9/07/$25.00 ©2007 IEEE. 4300
REFERENCES
[1] H. M. El-Askary, "Air pollution Impact on Aerosol Variability overmega cities using Remote Sensing Technology: Case study, Cairo,"Egyptian Journal of Remote Sensing and Space Sciences, 2006, , V. 9,31-40,2006
[2] H. M. El-Askary, R. Gautam, R. P. Singh, and M. Kafatos, "Dust StormsDetection over the Indo-Gangetic basin using multi sensor data,"Advances in Space Research Journal, 2006, 37: 728-733,2006.
[3] X. L. Zhang, L. S. Cheng, and Y. S. Chung, "Development of a severesand-dust storm model and its application to Northwest China," Water,Air and Soil Pollution: Focus, 3(2), 2003, pp. 173-190.
[4] 1. R. Herman, P. K. Bhartia, O. Torres, C. Seftor, and E. Celarier,"Global distribution of UV-absorbing aerosols from Nimbus 7/TOMSdata," 1. Geophys. Res., 102, 16911-16922, 1997.
[5] Cakmur, R. V., R. L. Miller, and I. Tegen, 2001: A comparison ofseasonal and interannual variability of soil dust aerosols over theAtlantic Ocean as inferred by the TOMS AI and AVHRR AOTretrievals. 1. Geophys. Res., 106(DI6), 18,287-18,303.
[6] Hsu, N.C., 1. R. Herman, , 1. F. Gleason, , O. Torres, , and C. 1. Seftor,1999: Satellite detection of smoke aerosols over a snow/ice surface byTOMS. Geophys. Res. Lett., 26, 1165-1168.
[7] Kandil, H. A., M. A. Kader, A. Moaty, B. EI-Hadidi, and A. O. Sherif(2006), Simulation of atmospheric temperature inversions over greaterCairo using the MM5 meso-scale atmospheric model, Egyptian Journalof Remote Sensing and Space Sciences, 2006, , V. 9,2006
[8] El-Askary H., and Kafatos M, "Dust Storm and Black Cloud Influenceon Aerosol Optical Properties over Cairo and the Greater Delta Region,Egypt" International Journal ofRemote Sensing (Submitted)
for water vapor particles formation is note worth and will befurther investigated in future research.
300290280220 230 240 250 260 270Temperature (Kelvin)
~I-cairo I- Alexandria
~
\~"
~~~
,~
"~~
,,~
<,~~,~
,".)(
850925
1000200 210
150
200
r0-c.
250:SW> 300!11IL-::Jr.nr.n 40011IL-
a.500
600
700
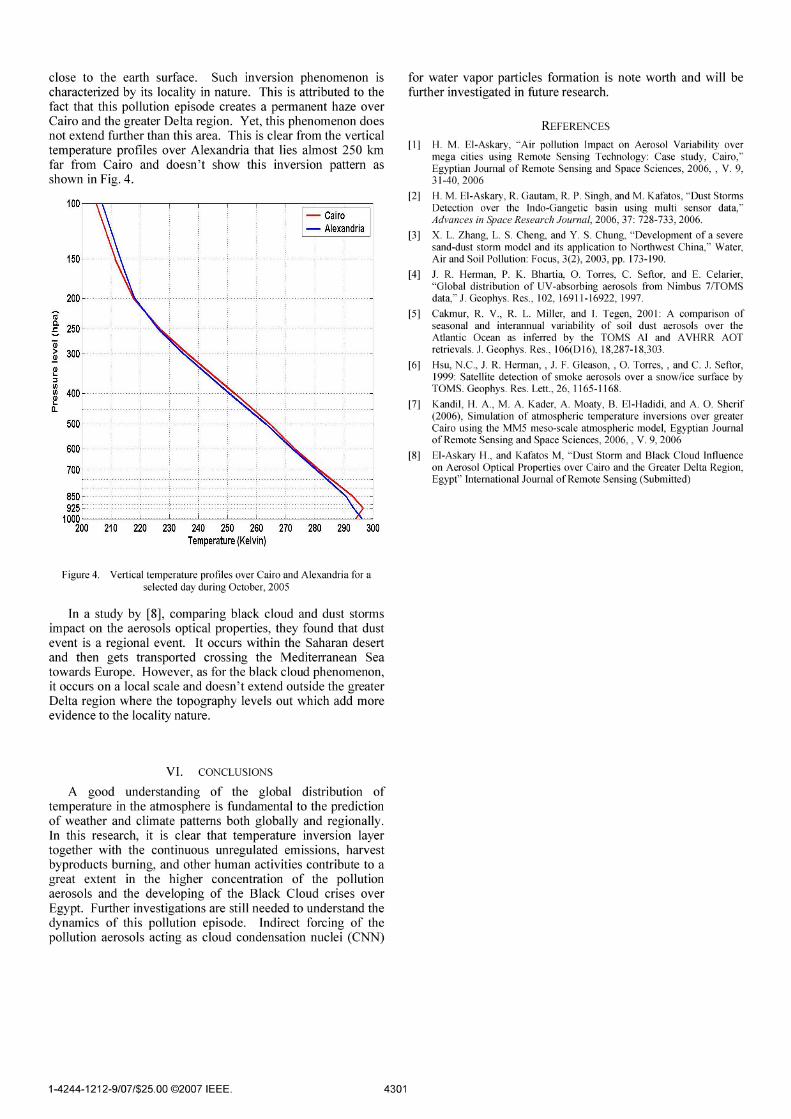
close to the earth surface. Such inversion phenomenon ischaracterized by its locality in nature. This is attributed to thefact that this pollution episode creates a permanent haze overCairo and the greater Delta region. Yet, this phenomenon doesnot extend further than this area. This is clear from the verticaltemperature profiles over Alexandria that lies almost 250 kmfar from Cairo and doesn't show this inversion pattern asshown in Fig. 4.
100
Figure 4. Vertical temperature profiles over Cairo and Alexandria for aselected day during October, 2005
In a study by [8], comparing black cloud and dust stormsimpact on the aerosols optical properties, they found that dustevent is a regional event. It occurs within the Saharan desertand then gets transported crossing the Mediterranean Seatowards Europe. However, as for the black cloud phenomenon,it occurs on a local scale and doesn't extend outside the greaterDelta region where the topography levels out which add moreevidence to the locality nature.
VI. CONCLUSIONS
A good understanding of the global distribution oftemperature in the atmosphere is fundamental to the predictionof weather and climate patterns both globally and regionally.In this research, it is clear that temperature inversion layertogether with the continuous unregulated emissions, harvestbyproducts burning, and other human activities contribute to agreat extent in the higher concentration of the pollutionaerosols and the developing of the Black Cloud crises overEgypt. Further investigations are still needed to understand thedynamics of this pollution episode. Indirect forcing of thepollution aerosols acting as cloud condensation nuclei (CNN)
1-4244-1212-9/07/$25.00 ©2007 IEEE. 4301