Embed Size (px)
Citation preview

PollutantsTransport on
MASP
AtenágorasSouza Silva
Goal
Introduction
AreaDescription
Methods
Models Setup
MASP's COsources
Cubatão'sPM10Sources
Results
BRAMSSimulatons
SPRAYSimulations
CO
PM10
Conclusion
Acknowledgments
Investigation of the transport of pollutants from
the Metropolitan Area of São Paulo and from
the industrial city of Cubatão to nearby areas 1
Atenágoras Souza Silva1
Américo A F S Kerr1
Simone Gioia2
Marly Babinsky3
1Instituto de Física da Universidade de São Paulo2 Centro Tecnológico da Marinha de São Paulo, São Paulo, Brazil3 Centro de Pesquisas Geocronológicas, Instituto de Geociências,
Universidade de São Paulo, São Paulo, Brazil
May 10, 2016
1

PollutantsTransport on
MASP
AtenágorasSouza Silva
Goal
Introduction
AreaDescription
Methods
Models Setup
MASP's COsources
Cubatão'sPM10Sources
Results
BRAMSSimulatons
SPRAYSimulations
CO
PM10
Conclusion
Acknowledgments
Summary
1 Goal
2 IntroductionArea Description
3 MethodsModels Setup
MASP's CO sources
Cubatão's PM10 Sources
4 ResultsBRAMS SimulatonsSPRAY Simulations
CO
PM10
5 Conclusion
6 Acknowledgments

PollutantsTransport on
MASP
AtenágorasSouza Silva
Goal
Introduction
AreaDescription
Methods
Models Setup
MASP's COsources
Cubatão'sPM10Sources
Results
BRAMSSimulatons
SPRAYSimulations
CO
PM10
Conclusion
Acknowledgments
Goal
• Examine pollution episodes at Metropolitan Area of SãoPaulo (MASP) Cubatão and nearby areas shown atwintertime experiments in São Paulo state.

PollutantsTransport on
MASP
AtenágorasSouza Silva
Goal
Introduction
AreaDescription
Methods
Models Setup
MASP's COsources
Cubatão'sPM10Sources
Results
BRAMSSimulatons
SPRAYSimulations
CO
PM10
Conclusion
Acknowledgments
Area Description
• São Paulo: Most important city of MASP. >11 million people and >5 million vehicles.700m above sealevel.• Cubatão: It is 40 km farther from MASP. Strong industrial city. Complex terrain• Juquitiba: Small City in a remote border area of the MASP, rounded by native vegetation.

PollutantsTransport on
MASP
AtenágorasSouza Silva
Goal
Introduction
AreaDescription
Methods
Models Setup
MASP's COsources
Cubatão'sPM10Sources
Results
BRAMSSimulatons
SPRAYSimulations
CO
PM10
Conclusion
Acknowledgments
Methods
• Simulations with mesoscale atmospheric model BRAMS(BRAMS, 2013) and Lagrangian Stochastic Model SPRAYto investigate episodes in a wintertime experiment (Gioia,2006).
• Studied Experiment: PM2.5 and PM10 collected in IGC(Instituto de Geociências - Institute of Geosciences ofUniversity of São Paulo), São Paulo city; Juquitiba andCubatão (at Mogi's Valley), every 12h, for one week.

PollutantsTransport on
MASP
AtenágorasSouza Silva
Goal
Introduction
AreaDescription
Methods
Models Setup
MASP's COsources
Cubatão'sPM10Sources
Results
BRAMSSimulatons
SPRAYSimulations
CO
PM10
Conclusion
Acknowledgments
Models Con�guration
• BRAMS initialized with CPTEC (Centro de Previsão de Tempoe Estudos Climáticos, a Brazilian Weather Forecast Center)Global Files (time resolution of 12h, and Lat-Lon resolution of0.9375o, with 28 vertical levels).
• Time resolution = 2s.
• 3 nested grids.
• Time Period: from 23 to 29, August 2006.
• Coupling BRAMS/SPRAY with GAP and SurfPro softwares(provided by Arianet), and USGS landuse data.
• Probability Density Functions (PDF): Gram-Charlier truncatedto the third order in the vertical, and Gaussian in the horizontal.
• BRAMS's Grid 2 (3Km resolution): input for SPRAY's COdispersion simulation (MASP's source)
• BRAMS's Grid 3 (1Km resolution): input for SPRAY's PM10
dispersion simulation (Mogi Valleys's source)

PollutantsTransport on
MASP
AtenágorasSouza Silva
Goal
Introduction
AreaDescription
Methods
Models Setup
MASP's COsources
Cubatão'sPM10Sources
Results
BRAMSSimulatons
SPRAYSimulations
CO
PM10
Conclusion
Acknowledgments
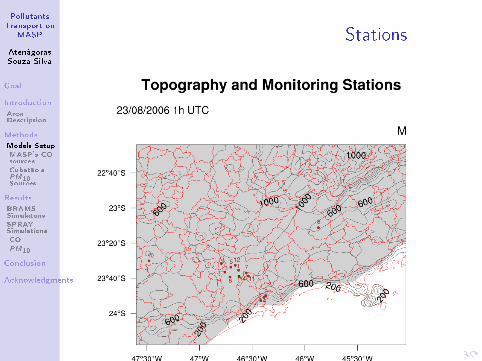
Simulation Area
Figure: Simulated Area using BRAMS. Grid Resolution: 12Km (G1 -Larger), 3Km (G2 - within G1) and 1Km (G3 - smaller)
PollutantsTransport on
MASP
AtenágorasSouza Silva
Goal
Introduction
AreaDescription
Methods
Models Setup
MASP's COsources
Cubatão'sPM10Sources
Results
BRAMSSimulatons
SPRAYSimulations
CO
PM10
Conclusion
Acknowledgments
Stations

PollutantsTransport on
MASP
AtenágorasSouza Silva
Goal
Introduction
AreaDescription
Methods
Models Setup
MASP's COsources
Cubatão'sPM10Sources
Results
BRAMSSimulatons
SPRAYSimulations
CO
PM10
Conclusion
Acknowledgments
MASP's CO sources
(Keer et al, 2005)
• 169 squares with:
• Resolution:5km2.
• Fleet composition and tra�c �ow, estimated by Kerr, A., et al., 2005, forthe year 2000 at MASP (a total of 1.69x10⁶t.y−1).
• Reduction factor of 1.5 from 2000 to 2006 CO emissions related withmeasures at Congonhas' station (CETESB, 2001 and 2007).

PollutantsTransport on
MASP
AtenágorasSouza Silva
Goal
Introduction
AreaDescription
Methods
Models Setup
MASP's COsources
Cubatão'sPM10Sources
Results
BRAMSSimulatons
SPRAYSimulations
CO
PM10
Conclusion
Acknowledgments
Time Modulation (Daily cicle of the sources)
• CO and PM10 time modulation based on 2006Congonhas's station pattern.
• Why Congonhas's? - Near a high tra�c Avenue (representsthe MASP's CO and PM10 time emission pro�le)
• ratio CO/PM10 = 40.7 (�rst aproximation: PM10
emissions related with vehicular �eet)

PollutantsTransport on
MASP
AtenágorasSouza Silva
Goal
Introduction
AreaDescription
Methods
Models Setup
MASP's COsources
Cubatão'sPM10Sources
Results
BRAMSSimulatons
SPRAYSimulations
CO
PM10
Conclusion
Acknowledgments
Cubatão's PM10 Sources

PollutantsTransport on
MASP
AtenágorasSouza Silva
Goal
Introduction
AreaDescription
Methods
Models Setup
MASP's COsources
Cubatão'sPM10Sources
Results
BRAMSSimulatons
SPRAYSimulations
CO
PM10
Conclusion
Acknowledgments
Wind
• σ2 = σ2u + σ2v• σs , σo and RMSVE are close
• r: Good correlation and large sample to compare (N)
• P: Good signi�cance levels

PollutantsTransport on
MASP
AtenágorasSouza Silva
Goal
Introduction
AreaDescription
Methods
Models Setup
MASP's COsources
Cubatão'sPM10Sources
Results
BRAMSSimulatons
SPRAYSimulations
CO
PM10
Conclusion
Acknowledgments
CO simulation results
• Even low rs have good signi�cance levels (due to large N)
• σ and average CO for station 12 are poorer because it is in ahigh tra�c Streets and Avenues.
• Station 1 is a park rounded by high tra�ce Avenues. Due to COSource resolution, model preditics high emission at this point.
• Better resolution for CO Source could improve the results foraverage CO values and σs.
PollutantsTransport on
MASP
AtenágorasSouza Silva
Goal
Introduction
AreaDescription
Methods
Models Setup
MASP's COsources
Cubatão'sPM10Sources
Results
BRAMSSimulatons
SPRAYSimulations
CO
PM10
Conclusion
Acknowledgments
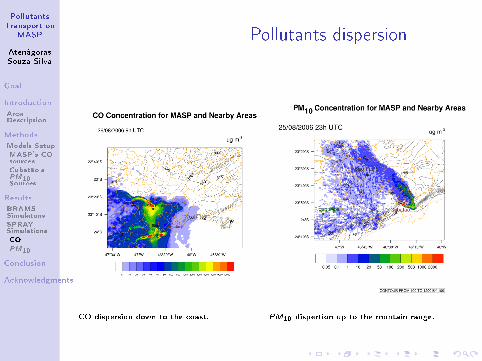
Pollutants dispersion
CO dispersion down to the coast. PM10 dispertion up to the montain range.

PollutantsTransport on
MASP
AtenágorasSouza Silva
Goal
Introduction
AreaDescription
Methods
Models Setup
MASP's COsources
Cubatão'sPM10Sources
Results
BRAMSSimulatons
SPRAYSimulations
CO
PM10
Conclusion
Acknowledgments
PM10
World Health Organization Daily Guideline exceedance for MP10 (WHO, 2005): 50µg/m3
• PM10 Results for IGC are well explained by vehicular related emission(initial gess).
• MASP's contributions for PM10 episodes in Juquitiba: up to 3%.
• Cubatão's PM10 episodes were well simulated, but better knowlegde aboutsources can improve the results.

PollutantsTransport on
MASP
AtenágorasSouza Silva
Goal
Introduction
AreaDescription
Methods
Models Setup
MASP's COsources
Cubatão'sPM10Sources
Results
BRAMSSimulatons
SPRAYSimulations
CO
PM10
Conclusion
Acknowledgments
Conclusion
• BRAMS/SPRAY were able to simulate reliableconcentration �elds for vehicular CO emitted in the MASP,as well as the PM10 emitted by fertilizer plants at Cubatão.
• Simulations and measures are well correlated
• For Juquitiba, clearly, PM10 emitted in MASP related withvehicular �eet is not the main source for the measures inthis city.

PollutantsTransport on
MASP
AtenágorasSouza Silva
Goal
Introduction
AreaDescription
Methods
Models Setup
MASP's COsources
Cubatão'sPM10Sources
Results
BRAMSSimulatons
SPRAYSimulations
CO
PM10
Conclusion
Acknowledgments
References
• BRAMS; 2013 ;http://brams.cptec.inpe.br/, acessado em 20/03/2013.
• GIOIA, SIMONE; (2006). Estudo da Composição dos Aerossóis e daassinatura isotópica de Pb como traçador das fontes de poluiçãoatmosférica da cidade de São Paulo. post-doc work.
• Kerr, A., Landmann, M. C., Carvalho, J., 2005: Investigation of COdispersion from São Paulo Metropolis by means of modelling system forcomplex terrain. 9Th Harmonisation, 2005.
• Tinarelli, G., D. Anfossi, G. Brusasca, E. Ferreiro, Giostra U., M.G.Morselli, Moussa�r J., Tampieri F., Trombetti F., 1994: Lagrangian ParticleSimulation of Tracer Dispersion in the Lee of a schematic Two-DimensionalHill. Journal of Applied Meteorology, 33, 744-756.
• Tinarelli, G., D. Anfossi, M. Bider, E. Ferrero, S. Trini Castelli, 2000: Anew high performance version of the Lagrangian particle dispersiondispersion model SPRAY, some case studies. Air Pollution Modelling andits Applications XII, S.E. Gryning and E. Batchvarova, eds, KluwerAcademic/Plenum Press. New York, 499-507.
• WHO - World Health Organization, 2005. Air quality guidelines forparticulate matter, ozone, nitrogen dioxide and sulfur dioxide.

PollutantsTransport on
MASP
AtenágorasSouza Silva
Goal
Introduction
AreaDescription
Methods
Models Setup
MASP's COsources
Cubatão'sPM10Sources
Results
BRAMSSimulatons
SPRAYSimulations
CO
PM10
Conclusion
Acknowledgments
Acknowledgments
• Arianet
• FAPESP (Fundo de Amparo à Pesquisa do Estado de SãoPaulo - São Paulo Research Foundation)
• MASTER-IAG (http://master.iag.usp.br)

PollutantsTransport on
MASP
AtenágorasSouza Silva
Goal
Introduction
AreaDescription
Methods
Models Setup
MASP's COsources
Cubatão'sPM10Sources
Results
BRAMSSimulatons
SPRAYSimulations
CO
PM10
Conclusion
Acknowledgments
THANK YOU!More Questions:[email protected]
Figure for São Paulo city: Rafael Neddermeyerhttps://br.boell.org/sites/default/�les/uploads/2015/01/populuicao-em-sao-paulo
fotos − publicasr afael − neddermeyer2.jpg
Licence: Creative Commons: http://creativecommons.org/licenses/by/3.0/deed.pt


![Transport processes Emission – [mass/time] pollutants released into the environment Imission – [mass/volume] amount of pollutants received by a living](https://img.pdfslide.us/doc/110x75/56649f4e5503460f94c6f192/transport-processes-emission-masstime-pollutants-released-into-the-environment.jpg)