Embed Size (px)
Citation preview

Korea-Australia Rheology Journal March 2009 Vol. 21, No. 1 17
Korea-Australia Rheology JournalVol. 21, No. 1, March 2009 pp. 17-25
Investigation of the numerical analysis for the ultrasonic vibration in the injection molding
Jaeyeol Lee and Naksoo Kim*
Department of Mechanical Engineering, Sogang University, 1, Sinsu-dong, Mapo-gu, Seoul 121-742, Korea(Received August 25, 2008; final revision received November 4, 2008)
Abstract
We studied the flow characteristics of the polymer melt in the injection molding process with ultrasonicvibration by using the numerical analysis. To minimize the error between the experimental data and numer-ical result, we presented a methodology using the design of experiments and the response surface methodfor reverse engineering. This methodology can be applied to various fields to obtain a valid and accuratenumerical analysis. Ultrasonic vibration is generally applied between an extruder and the entrance of a moldfor improvement the flow rate in injection molding. In comparison with the general ultrasonic process, themode shape of the mold must be also considered when the ultrasonic vibration is applied on the mold. Themode shape is defined as the periodic and spatial deformation of the structure owing to the effect of thevibration, and it varies greatly according to vibration conditions such as the forcing frequency. Therefore,we considered new index and found the forcing frequency for obtaining the highest flow rate within therange from 20 to 60 kHz on the basis of the index. Ultimately, we presented the methodology for not onlyobtaining a valid and accurate numerical analysis, but also for finding the forcing frequency to obtain thehighest flow rate in injection molding using ultrasonic vibration.
Keywords : polymer, ultrasonic, vibration, numerical analysis, filling process, injection molding
1. Introduction
Recently, thin and light-weight products of polymer con-
sumption have been in the limelight. On the other hand, the
viscosity characteristic of the polymer melt during the
manufacturing of these products raises problems such as
the short shot problem. An ultrasonic process is applied to
the filling process of injection molding to solve these prob-
lems.
Chen and Li (2006; 2007) studied the ultrasonic process
when a polymer melt is injected into a thin cavity. Their
study concluded that the low viscosity due to ultrasonic
vibration caused a decrease in cavity pressure and an
increase in the flow rate. Feng and Isayev (2004) along
with Swain and Isayev (2007) carried out an experimental
study about the interrelation between the ultrasonic inten-
sity and amplitude. Their studies looked at the variation in
cavity pressure and examined mechanical properties such
as the stress-strain curve with respect to the amplitude of
the ultrasonic vibration.
Ho et al. (1993) studied the variation of these mechanical
properties due to ultrasonic vibration on the polymer melt
mixing. Morii et al. (1999) performed a research study that
investigated the variation of a mechanical property of FRP
(fiber reinforced plastics) as a result of the effect of ultra-
sonic vibration.
In general, there are two primary factors that have influ-
ence on the polymer melt due to ultrasonic vibration: the
viscosity and the molecular weight. Kim et al. (2002) per-
formed an experimental study about the variation of the
viscosity with respect to the forcing frequency of the ultra-
sonic vibration, the applied time of the ultrasonic vibration
and mixing temperature in the extruder. Madras et al.
(2000) carried out an experiment about the variation of the
molecular weight due to ultrasonic vibration. Kanwal et al.
(2000) studied the decrease of the molecular weight and
the variation in the mechanical properties with respect to
the ultrasonic time. With respect to the ultrasonic intensity
and time, Li et al. (2005) carried out a research study that
investigated the variations of the viscosity and the molec-
ular weight of two polymer melts: polystyrene and eth-
ylene-propylene diene monomer.
Price et al. (2002) additionally studied the variation of
the molecular weight as well as the melting point due to
ultrasonic vibration. Sahnoune and Piche (1998) performed
a research study that investigated the variation of a thermal
property such as the thermal expansivity of the polymer
melt. Shim et al. (2002) carried out an experimental study
on the number and diameter of bubbles in the polymer melt
with respect to the ultrasonic intensity and pressure in the
polymer melt.
On the other hand, there are also many studies about the
*Corresponding author: [email protected]© 2009 by The Korean Society of Rheology
Jaeyeol Lee and Naksoo Kim
18 Korea-Australia Rheology Journal
numerical analysis used to predict the behavior of the poly-
mer melt in injection molding. Buchmann et al. (1997)
experimentally investigated viscosity models of the poly-
mer melt. On the basis of these viscosity models, the
numerical analysis was utilized to predict the flow char-
acteristic of the polymer melt with respect to the injection
conditions. Kim et al. (2006a; 2006b) and Ye et al. (2005)
numerically analyzed the behavior of the polymer melt in
the extruder using FVM (finite volume method). Mousavi
et al. (2007) performed a numerical analysis to predict the
decrease of the extruder force with respect to an increase in
the ultrasonic intensity using FEM (finite element method).
In a preceding study, Lee and Kim (2008) numerically
analyzed the flow rate of the polymer melt with respect to
the mode shapes of a mold and investigated the charac-
teristics of the mode shape to find a more efficient mode
shape for high flow rates. Lee et al. (2008) also studied
injection conditions and vibration conditions for a higher
filling efficiency.
In this study, we compared our numerical results with the
experimental results of Chen and Li (2006) to verify the
validity of the numerical analysis. Using this numerical
analysis, we modeled the injection of the polymer melt into
a thin cavity and investigated the flow rate of the polymer
melt with respect to the forcing frequency of the ultrasonic
vibration. Ultimately, we introduced a methodology for
finding the forcing frequency at the highest flow rate.
2. Theory
2.1. Ultrasonic vibrationA piezoelectric transducer generates an ultrasonic vibra-
tion from an applied AC (alternating current), and an ultra-
sonic horn is a device used to amplify this vibration. As a
result, the polymer melt in the cavity is filled due to the
effect of this ultrasonic vibration. When this ultrasonic
vibration propagates, the vibrational energy in a unit area
vertical to the direction of propagation is known as the
intensity (Li et al., 2005), and is as follows:
, (1)
where ρ is the density of the material, c is the propagation
velocity of the ultrasonic vibration, f is the forcing fre-
quency of the ultrasonic vibration and x is the amplitude of
the ultrasonic vibration. The forcing frequency of the ultra-
sonic vibration is generally 20 kHz or more, which causes
the intensity to be very high.
2.2. Governing equationIn general, the polymer melt is a non-Newtonian fluid.
Its flow characteristics are incompressible and laminar. To
express these flow characteristics in the Cartesian coor-
dinate system, the continuity and momentum equations
(Kim et al., 2006a) are given as follows:
, (2)
, (3)
. (4)
These equations are calculated using the PISO (pressure
implicit with splitting of operators) algorithm in FVM. The
flux term is solved by the upwind scheme. The shear stress
is expressed by the following constitutive law.
, (5)
where .
2.3. Carreau-WLF modelThe Carreau-WLF (Williams-Landel-Ferry) model is
considered as a viscosity model of the polymer melt. This
model is the modified Carreau-Yasuda model, which
includes temperature dependence by using a WLF relation
and is written as follows:
, (6)
where
and .
As shown in equation (6), the Carreau-WLF model
(Buchmann et al., 1997) includes both the deformation rate
( ) and shift (aT) as a function of temperature. k1, k2, k3, k4
and k5 are material-dependent constants. This viscosity
model is transformed to a user subroutine in the FVM cal-
culation.
2.4. Design of experiments using the orthogonalarray table
Design of experiments is defined as a plan of experi-
ments that includes the method of setting up an experiment
about a problem, method of data collection and method of
obtaining the maximum amount of information in the min-
imum number of experiments based on statistical data
analysis (Lim et al., 1999). In other words, using design of
experiments requires the selection of parameters about a
problem, selection of an experimental method, decision on
the experiment order and selection of the optimum analysis
method for the data obtained from the experiment.
There are many parameters to be considered in general.
I 2π2ρcf
2x2
Af2x2
= =
∂ρ∂t------
∂∂xj
------ ρuj( )+ sm=
∂ ρui( )∂t
---------------∂∂xj
------ ρujui τij–( )+∂p
∂xi
------– si+=
∂ ρh( )∂t
--------------∂∂xj
------ ρhuj Fh j,+( )+∂p
∂t------ uj
∂p
∂xj
------ τij∂ui
∂xj
------- sh+ + +=
τij 2µsij2
3---µ
∂uk
∂xk
-------δij–=
sij1
2---
∂ui
∂xj
-------∂uj
∂xi
-------+⎝ ⎠⎛ ⎞=
µk1ar
1 k2γ·aT+[ ]
k3
----------------------------=
aTln8.86 k4 k5–( )
101.6 k4 k5–+--------------------------------
8.86 T k5–( )101.6 T k5–+------------------------------–=
γ· 1
2--- sijsij siisjj–( )=
γ·

Investigation of the numerical analysis for the ultrasonic vibration in the injection molding
Korea-Australia Rheology Journal March 2009 Vol. 21, No. 1 19
The orthogonal array table not only considers all param-
eters, but also excludes information about the interaction
between parameters. As a result, the number of a numerical
analysis or experiments can be minimized. We can also
easily analyze the effect of parameters from the results.
2.5. Response surface methodRSM (response surface method) is a chain of processes
that assumes a relation between the parameters and the
response function as a mathematical equation, assumes a
coefficient of the equation with the least squares method
from results, and then makes a useful response surface
model (Youn and Choi, 2004). In this study, a second
response surface model is used as follows:
, (7)
where xi is the parameter, nd is the number of the parameter
and βi is coefficient assumed by the least squares method.
Equation (8) is the calculation method of the coefficient
of the response surface model.
, (8)
where X is a parameter matrix composed of experimental
points and Y is a response vector.
2.6. Forced vibrationA forced vibration occurs when a structure is influenced
by a periodic external force or displacement. The forced
vibration (Orhan, 2007) can be expressed by the following
equation.
, (9)
where M is a mass of the vibrated structure, C is a damp-
ing constant, K is a spring constant, x is a displacement, ω
is a forcing frequency and t is a time period. If the external
force (Fo) is zero, this equation reduces down to a free
vibration.
3.Verification of the numerical analysis
3.1. Geometry and material propertiesChen and Li (2006) experimentally investigated the flow
rate of PS (polystyrene). Fig. 1(a) shows the geometry of
the extruder system that is used for their experiment. On
the basis of this extruder system, we modeled an analysis
domain for analyzing the filling process in the cavity as
shown in Fig. 1(b). They concluded that the flow rate of PS
increased with an increase in the intensity at the same cav-
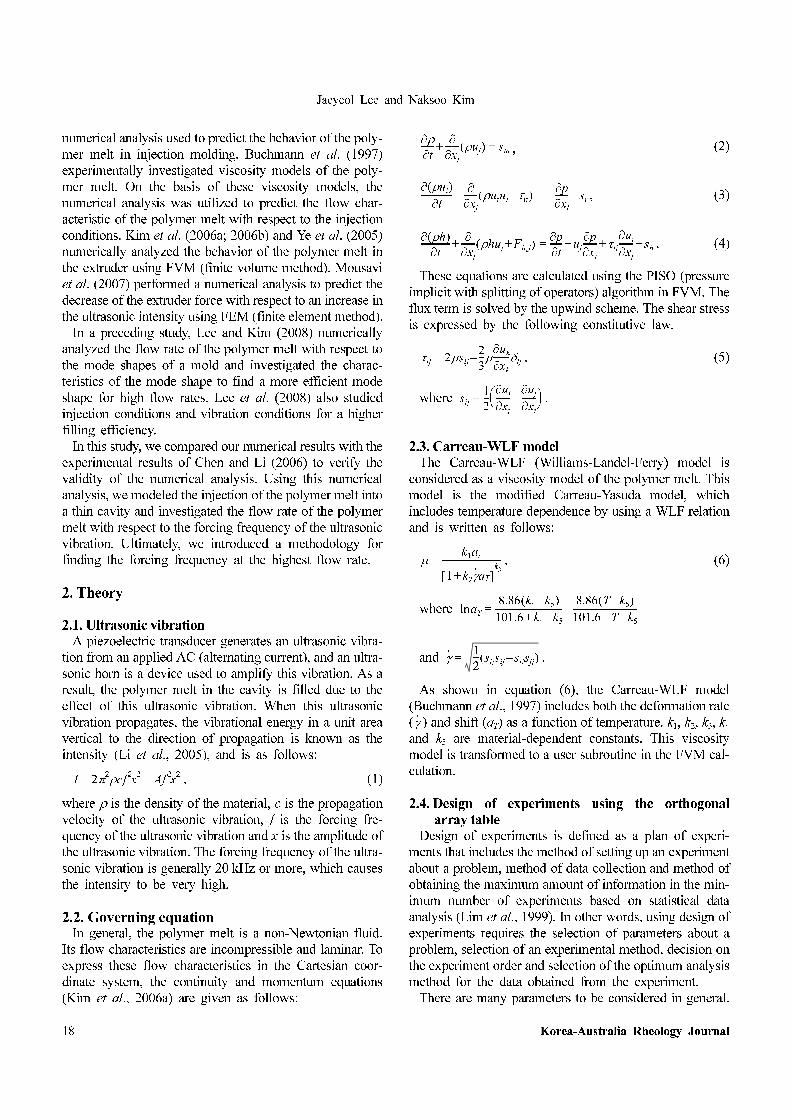
ity pressure as shown in Fig. 2.
To verify the validity of our numerical analysis, we com-
pared the numerical results with the experimental data of
Chen and Li (2006). FVM was used in this numerical anal-
ysis for the behavior of the polymer melt in the filling pro-
cess. We used the commercial code STAR-CD for this
FVM calculation. A vibration phenomenon, which occurs
on the surfaces of a cavity or mold due to ultrasonic vibra-
tion, is also applied to the velocity and wall boundary con-
ditions using the moving grid method. The rest of the
injection and boundary conditions are applied with refer-
ence to the experiment of Chen and Li (2006).
3.2. Applications of the orthogonal array and RSMIt is generally difficult to measure the viscosity of the
polymer melt flowing inside of the mold to determine the
viscosity characteristic. In addition to this inherent diffi-
culty, there is also the possibility of measurement error.
Therefore, it is necessary to investigate these material
properties in order to make sure of the accuracy and valid-
ity of the results, especially in the numerical analysis. For
this reason, we considered the parameters k1, k2 and k3 in
equation (6) to be constant values, while both k4 and k5 are
not considered in the analysis since the effect of temper-
y β0 βixi
i 1=
nd
∑ βijxixj
j i≥
nd
∑i 1=
nd
∑+ +=
β XTX( )
1–
XTY=
Mx·· Cx· Kx+ + Fo ωtsin=
Fig. 1. Geometry of the extruder system; (a) geometry in the
experimental study of Chen and Li (2006): 1, extruder; 2,
ultrasonic generator; 3, piezoelectric transducer; 4, ultra-
sonic horn with diameter φ=10 mm; 5, cavity; 6, the gap
between the horn tip and entry to the cavity is 10 mm, (b)
geometry of the analysis domain.
Jaeyeol Lee and Naksoo Kim
20 Korea-Australia Rheology Journal
ature is minor. Each parameter is classified to 3 levels and
Table 1 shows the values of the parameters according to
their level and the composition of the table of the orthog-
onal array L9(34).
In this study, the object function (Φ) is the total error rate
between the experimental data (y) and the numerical result
( ) as shown in equation (10).
. (10)
As a result of the numerical analysis, the object function
is shown in equation (11) as a function of the constant val-
ues using the response surface method.
Φ=30683.046+8351.863k1−5164.352k2−8418.794k3
Φ=+198.074 +260.141 +525.548 −577.235k1k2Φ=+563.611k2k3−790.084k1k3. (11)
The parameters of the minimum object function, along
with the minimum total error rate between the experi-
mental and the numerical results are shown as follows:
,
where the constraints of the parameters k1, k2 and k3 are set
to be from 5000 to 5200, 0.064 to 0.066 and 0.81 to 0.85,
respectively, but the initial values of the parameters are
5000, 0.066 and 0.81, respectively.
3.3. Investigation of the amplitude due to the ul-trasonic vibration
The amplitude of the ultrasonic vibration is the most
important parameter that has influence on the flow char-
acteristic of the polymer melt in the ultrasonic process:
therefore, we used RSM for the investigation of the ampli-
tude. The initial values of the amplitude are 0.05, 0.15 and
0.25 µm. As shown in equation (10), the object function is
a total error rate when the intensities are 50, 100, 150 and
200 W. As a result, the object function is shown in equa-
tion (12) as a function of the amplitude using the response
surface method.
, (12)
where x is the amplitude (µm) at 50 W and x as the ampli-
tude at 50 W is 0.130 µm. Additionally, the amplitudes of
100, 150 and 200 W are calculated on the basis of equation
(1) as a function between the intensity and the amplitude of
the ultrasonic vibration.
3.4. Results and discussionsWe compared the numerical results with the experimen-
tal data to verify the validity of our numerical analysis as
shown in Fig. 2. The flow rate of PS increases with an
increases in the cavity pressure and intensity.
In particular, the two results between the numerical anal-
ysis and the experimental study have a slight difference
without the ultrasonic vibration. Over-all, there is little dif-
ference between the numerical and experimental results
despite several error factors including: the variation of the
material properties of the polymer melt due to pressure, the
generation of cavitations owing to a phase change of the
polymer melt and the effect of measurement errors.
In conclusion, the numerical analysis in this study is a
valid method for analyzing the filling process of injection
molding by use of ultrasonic vibration. We also indicated
the method of obtaining the accuracy of the numerical
analysis as the methodology of using both the design of
experiments and response surface method for reverse engi-
neering. This method can be used for not only the numer-
ical analysis of injection molding but also for various other
fields of study.
y'
Φ y y'–
y----------- 100×∑=
k12
k22
k32
k1 5000= k2 0.06503= k3 0.82811=
Φ 4691.126 53978.858x– 213904.670x2
+=
Table 1. Table of orthogonal arrays
No. k1 k2 k3 Φ
1 5000 0.064 0.81 34.38
2 5000 0.065 0.83 4.08
3 5000 0.066 0.85 43.58
4 5100 0.064 0.85 13.42
5 5100 0.065 0.81 41.50
6 5100 0.066 0.83 6.11
7 5200 0.064 0.83 29.80
8 5200 0.065 0.85 9.67
9 5200 0.066 0.81 46.25 Fig. 2. Comparison of the results
[* : computational results, + : experimental results of
Chen and Li (2006)].
Investigation of the numerical analysis for the ultrasonic vibration in the injection molding
Korea-Australia Rheology Journal March 2009 Vol. 21, No. 1 21
4. Flow characteristics with the ultrasonic vib-ration
4.1. Analysis domainWe used the same numerical analysis to study the flow
characteristics of the polymer melt when a periodic defor-
mation on the cavity surfaces occurs due to the effect of
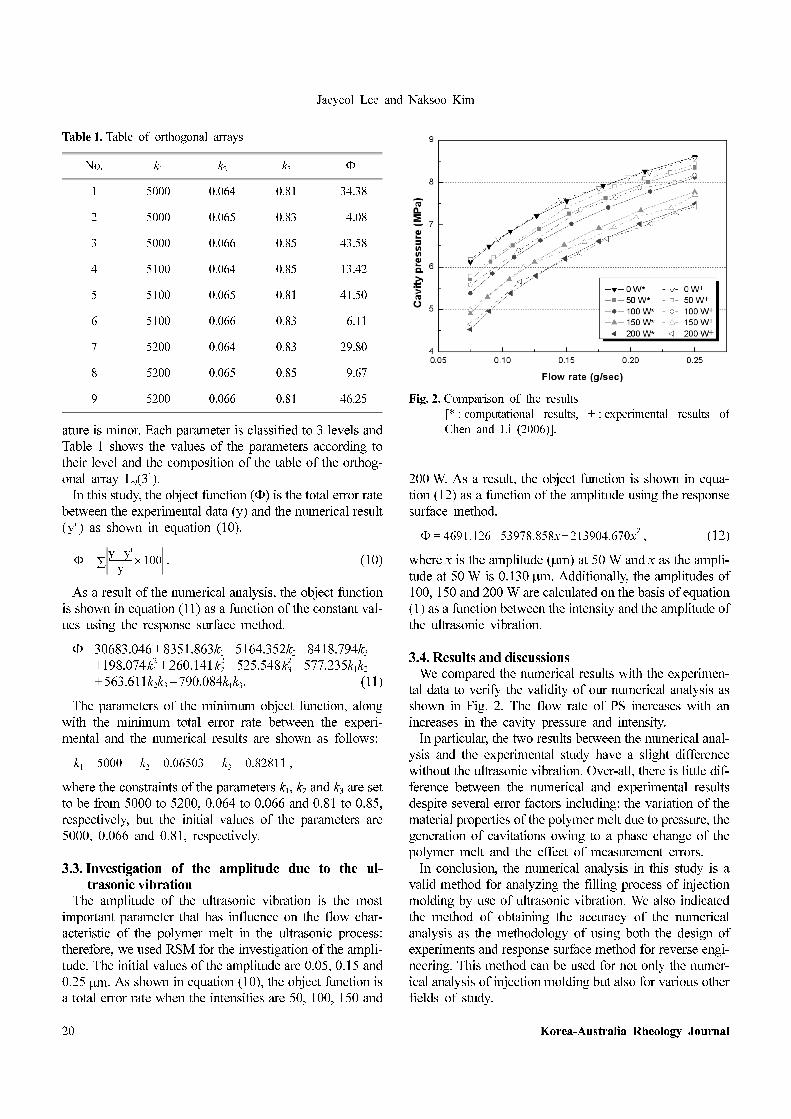
ultrasonic vibration. Fig. 3 shows the analysis domain and
illustrates the deformation on both the upper (positive y-
directional) and lower (negative y-directional) cavity sur-
face with respect to the phase difference.
This domain is the cavity (200×20×2 mm3). The poly-
mer melt at the inlet is injected into the cavity and is
ejected out of the cavity through the outlet after it passes
through the vibration region. The vibration region, which is
assumed to simplify the analysis, is composed of both the
upper and lower cavity surfaces. If the boundary conditions
are not separately mentioned in this study, then the injec-
tion conditions are the following constant values: inlet
pressure of 60 MPa, inlet temperature of 473.15 K, mold
temperature of 323.15 K, outlet pressure of 0 MPa and out-
let temperature of 323.15 K.
We investigated the variation of the flow rate as the flow
characteristic due to the phase difference. The phase dif-
ference is the difference between the motion directions of
the upper and lower cavity surfaces. For example, in the
case of 180o phase difference, the upper cavity surface
moves in the positive y-direction, while the lower cavity
surface moves in the negative y-direction. In other words,
it is with the 180o phase difference that one motion direc-
tion is opposite of the other.
One of our prior studies already concluded that the effect
of the y-directional motion is higher than that of the x-
directional motion for the improvement of flow rate from
the standpoint of flow physics. Therefore, this study only
considered the y-directional motion on the cavity surfaces.
4.2. Viscosity modelThis study considered three polymer melts: HDPE (high
density polyethylene), LDPE (low density polyethylene)
and PP (polypropylene). The viscosity model for the
numerical analysis is considered to be the Carreau model
as expressed in equation (13).
, (13)
where
and ,
where aT is the shift, is the deformation rate, λ is the time
constant, µo is the zero shear rate viscosity and n is the
power-law index. Each value is shown in Table 2. We
referred to the study of Collier et al. (2003) for these values.
4.3. ResultsThis study used MFI (melt flow index, g/sec) as an index
for the estimation of the flow rate of the polymer melt.
MFI is defined as the total mass flow passing the flow
cross section per unit time. Table 3 shows the MFI of each
polymer melt with respect to the phase difference.
The MFI of HDPE is the highest, whereas the MFI of
LDPE is the lowest regardless of the phase difference. On
the other hand, the MFI with a 180o phase difference is the
highest, whereas MFI without the ultrasonic vibration is
the lowest within each polymer material.
From the standpoint of flow physics, the primary char-
acteristic of the phase difference is the periodic change of
the flow cross section; the magnitude of the flow cross sec-
µ µoaT 1 λaTγ·( )
2
+[ ]n 1–( ) 2⁄
=
aT
H∆R
--------1
T---
1
To
-----–⎝ ⎠⎛ ⎞exp=
γ· 1
2--- sijsij siisjj–( )=
γ·
Fig. 3. Analysis domain of the cavity.
Table 2. Constant values of polymer materials
HDPE LDPE PP
∆H/R [K] 3623.6 7460.7 7537.5
λ [sec] 10.32 3.28 0.13
µo [Pa-sec] 36775 5645 2410
n 0.53 0.61 0.43
Table 3. MFI with respect to the phase difference
Phase
difference
MFI of
HDPE
MFI of
LDPE
MFI of
PP
No vibration 0.103 0.010 0.019
0 0.105 0.011 0.029
180 1.323 0.388 1.180

Jaeyeol Lee and Naksoo Kim
22 Korea-Australia Rheology Journal
tion with a 180o phase difference changes periodically,
whereas that of the flow cross section with a 0o phase dif-
ference does not change. In other words, the flow rate is
only affected by the vibrational energy that is transmitted
from the cavity surface to the polymer melt in the case of
the 0o phase difference, but the flow rate is not only
affected by this but also by the pumping effect in the case
of the 180o phase difference. The pumping effect is the
phenomenon of improving the flow rate and is caused by
the periodic change of the flow cross section, like in a
pump. As a result, the flow rate for the 180o phase dif-
ference is higher than that for 0o the phase difference.
5. Investigation of MFI with respect to theforcing frequency
5.1. Intensity factor and pumping factorOn the basis of the above results, we present two new
indexes for the prediction of the flow rate in the filling pro-
cess with ultrasonic vibration as follows:
, (14)
where f is the forcing frequency (kHz) of the ultrasonic
vibration, y is the y-directional amplitude (µm) of the upper
cavity surface due to the vibration, L is the z-directional
length (200 mm) of the cavity. IF (intensity factor) is the
vibrational energy per unit length that is transmitted from
the cavity surface to the polymer melt due to ultrasonic
vibration. On the other hand, PF (pumping factor) is the
maximum change of the flow cross section in the cavity
per unit length owing to ultrasonic vibration.
5.2. Forced vibration analysis of the moldWe modeled a mold to investigate the periodic defor-
mation of the cavity due to ultrasonic vibration as shown in
Fig. 4.
The mold (220×60×30 mm3) is vibrated by an external
force (0.1N) in the middle (20×20 mm2) of the upper
mold, while the contact condition is applied between the
upper and lower mold. The constraint condition is also
applied at the bottom of the mold and at the guide pins
(φ=8 mm).
Table 4 shows the material properties of the mold used
for the forced vibration analysis. We referred to the study
of Chen and Kim (2003) for these values and used the
commercial code ANSYS for the FEM calculation of this
analysis.
A mode shape is a specific pattern of the deformation of
the vibrated structure at a specific forcing frequency. The
mode shapes can generally be classified as two flexural
modes and a torsional mode with respect to the primary
direction of the deformation. Therefore, the frequency
response is used for investigation of this deformation with
respect to the forcing frequency.
Fig. 5 shows the frequency response that results in the
middle of the upper cavity surface with respect to the forc-
ing frequency (20 to 60 kHz). The peak point does not
exist below 30 kHz, which means that there is no response
of the mold below a forcing frequency of 30 kHz. As a
result, it is hard to obtain a high flow rate because of the
unchanged amplitude in this range of the forcing fre-
quency. On the contrary, there are many peak points
IF f2y2( ) xd∫[ ]/L=
PF y xd∫[ ]/L=
Fig. 4. Dimensions of the mold.
Table 4. Material properites of S45C
Young’s modulus (GPa) 206
Shear modulus (GPa) 79
Density (kg/m3) 7600
Poisson’s ratio 0.298
Fig. 5. Frequency response.

Investigation of the numerical analysis for the ultrasonic vibration in the injection molding
Korea-Australia Rheology Journal March 2009 Vol. 21, No. 1 23
throughout the rest of the forcing frequency range, which
indicates that a high flow rate can be obtained if the mold
is vibrated at the forcing frequency of the peak point.
To investigate the forcing frequency for this high flow
rate, we calculated IF and PF as defined in equation (13)
on the basis of the frequency response in A-A’ of Fig. 3. As
a result, we selected total five forcing frequencies: 59.3,
36.4, 42.1, 57.5 and 48.6 kHz. We predicted that the flow
rate at 59.3 kHz is the highest among these frequencies,
whereas the flow rate at 48.6 kHz is the lowest.
Fig. 6 shows the deformation of the upper cavity surface
with respect to the forcing frequency. The distance in this
case is the distance from the inlet of the cavity to the outlet.
For example, the distance of 200 mm is the outlet of the
cavity. The wavelength, which is defined as the distance
between repeating units of a propagating wave, decreases
as the forcing frequency increases, similar to the general
pattern of deformation due to vibration. In the case of the
same forcing frequency, the deformation at a distance of 90
to 110 mm is the largest because this region is closest to
the external force.
To confirm the flow rate at each forcing frequency, Table
5 shows the MFI of the three polymer melts with respect
to the forcing frequency. We predicted the order of the flow
rate according to the forcing frequency on the basis of the
multiplication of IF with PF. This value is the highest at
59.3 kHz as shown in Table 5. Therefore, we predicted that
the flow rate at 59.3 kHz is the highest regardless of the
type of polymer material. Over-all, these results are similar
to the prediction given by the calculations of IF and PF. We
concluded that the order of the flow rate is similar to the
predicted order as a result of the flow analysis. On the
other hand, the order of the flow rate between 57.5 and
48.6 kHz is different from the predicted order due to the
complicated and local flow characteristics of the polymer
melt that is caused by the deformation of the cavity as
shown in Fig. 6.
In conclusion, we predicted that the flow rate at 59.3 kHz
is the highest in the range from 20 to 60 kHz of the forcing
frequency on the basis of the multiplication of IF and PF.
The result of the flow analysis shows that the flow rate is
the highest at 59.3 kHz.
6. Conclusions
We studied the flow characteristics of the polymer melt
in the injection molding process with ultrasonic vibration
by using the numerical analysis. We modeled the same
extruder system as the experiment by Chen and Li (2006)
and compared the numerical results with the experimental
data. Also, we present two new indexes for the prediction
of the flow rate according to the forcing frequency.
In the previous study, we applied the constant value of
the viscosity model for PS on the basis of the reference. As
a result, there are some differences between the experi-
mental data and the numerical result in the previous study.
On the other hand, we used the reverse engineering using
both the design of experiments and response surface
method to minimize the error between the experimental
and numerical result in this study. So, the numerical results
in this study are more accurate than those in the previous
study.
We ultimately presented the methodology for not only
obtaining a valid and accurate numerical analysis, but also
for finding the forcing frequency to obtain the highest flow
rate in injection molding using ultrasonic vibration. We are
to carry out an experiment to verify this study.
From the results, we obtained the following conclusions.
1) To obtain a valid and accurate numerical analysis, we
presented the methodology using both the design of
experiments and response surface method. As a result,
the total error rates between the experimental data and
the numerical result are 4% and below.
2) The MFI of HDPE is the highest within each polymer
material, whereas the MFI of LDPE is the lowest
regardless of the phase difference.
3) The MFI with a 180o phase difference is the highest,
whereas MFI without the ultrasonic vibration is the
Fig. 6. Deformation of the upper cavity surface.
Table 5. MFI with respect to the forcing frequency
Frequency
(kHz)IF×PF
MFI of
HDPE
MFI of
LDPE
MFI of
PP
59.3 0.111 0.558 0.112 0.381
36.4 0.066 0.492 0.095 0.309
42.1 0.022 0.400 0.084 0.242
57.5 0.020 0.248 0.049 0.125
48.6 0.001 0.248 0.056 0.148
Jaeyeol Lee and Naksoo Kim
24 Korea-Australia Rheology Journal
lowest. In other words, the flow rate for the 180o phase
difference is higher than that for 0o the phase difference.
4) As a result of the forced vibration (20 to 60 kHz) of the
mold, there is no response of the mold below a forcing
frequency of 30 kHz. In other words, it is hard to obtain
a high flow rate because of the unchanged amplitude in
this range of the forcing frequency.
5) We predicted that the flow rate at 59.3 kHz is the highest
in the range from 20 to 60 kHz of the forcing frequency
on the basis of the multiplication of IF and PF. The
result of the flow analysis shows that the flow rate is the
highest at 59.3 kHz.
Acknowledgments
This work was supported by Korean Research Founda-
tion Grant (KRF-2006-005-J02302).
Nomenclatures
A : Constant
aT : Temperature shift factor
C : Damping constant
c : Propagating velocity of the ultrasonic vibra-
tion
Fh,j : Diffusional energy flux in the xj-direction
Fo : External force
f : Frequency of the ultrasonic vibration
h : Enthalpy
I : Vibration intensity
ki : Constants in Carreau-WLF model
K : Spring constant
M : Mass of the vibrated structure
n : Power-law index
nd : The number of the parameter
p : Pressure
sm : Mass source term
si : Momentum source term
sh : Energy source term
sij : Strain rate tenser
t : Time
T : Temperature
Tref : Reference temperature
ui : Velocity component in the xj-direction
u, v, w : Velocity components in the x-, y-, z-directions,
respectively
x : Amplitude of the ultrasonic vibration
xj : Cartesian coordinate (j=1, 2, 3)
x : Displacement
xi : Parameters
X : Parameter matrix
Y : Response vector
y : y-directional amplitude of the upper cavity
surface
Greek symbols
β : Coefficient of the response surface model
δij : Kronecker delta
: Deformation rate
λ : Time constant
µ : Viscosity
µ0 : Zero shear viscosity
ρ : Density
τij : Stress tensor components
ω : Forcing frequency
References
Buchmann, M., R. Theriault and T. A. Osswald, 1997, Polymer
flow length simulation during injection mold filling, Polymer
Eng. and Sci. 37, 667-671.
Chen, X. and K. S. Kim, 2003, Modeling of ratcheting behavior
under multiaxial cyclic loading, Acta Mechanica 163, 9-23.
Chen, Y. and H. Li, 2006, Effect of ultrasound on the vis-
coelasticity and rheology of polystyrene extruded through a slit
die, J. of Appl. Polymer Science 100, 2907-2911.
Chen, Y. and H. Li, 2007, Mechanism for effect of ultrasound on
polymer melt in extrusion, J. of Polymer Sci. 45, 1226-1233.
Collier, J. R., S. Petrovan and P. Patil, 2003, Temperature shifting
of convergent flow measured effective elongational viscosity,
J. of Appl. Polymer Science. 87, 1387-1396.
Feng, W. and A. I. Isayev, 2004, In situ compatibilization of PP/
EPDM blends during ultrasound aided extrusion, Polymer 45,
1207-1216.
Ho, R. M., A. C. Su and C. H. Wu, 1993, Functionalization of
polypropylene via melt mixing, Polymer 34, 3264-3269.
Kanwal, F., J. J. Liggat and R. A. Pethrick, 2000, Ultrasonic deg-
radation of polystyrene solutions, Polymer Degradation and
Stability 68, 445-449.
Kim, H. S., J. G. Ryu and J. W. Lee, 2002, Evolution of phase
morphology and in-situ compatibilization of polymer blends
during ultrasound-assisted melt mixing, Korea-Australia
Rheol. J. 14, 121-128.
Kim, N. S., H. B. Kim and J. W. Lee, 2006a, Numerical analysis
of internal flow and mixing performance in polymer extruder
I: single screw element, Korea-Australia Rheol. J. 18, 143-151.
Kim, N. S., H. B. Kim and J. W. Lee, 2006b, Numerical analysis
of internal flow and mixing performance in polymer extruder
II: twin screw element, Korea-Australia Rheol. J. 18, 153-160.
Lee, J. Y. and N. S. Kim, 2008, Prediction of charging rate in
ultrasonic vibration of injection molding, Journal of Materials
Processing Technology 201, 710-715.
Lee, J. Y., N. S. Kim and J. W. Lee, 2008, Numerical analysis of
injection molding for filling efficiency on ultrasonic process,
Korea-Australia Rheol. J. 20, 79-88.
Li, J., S. Guo and X. Li, 2005, Degradation kinetics of poly-
styrene and EPDM melts under ultrasonic irradiation, Polymer
Degradation and Stability 89, 6-14.
Lim, J. M., S. Han, S. Jeon, D. Woo and G. J. Park, 1999, Anal-
ysis and design considerations of energy absorbing steering
γ·

Investigation of the numerical analysis for the ultrasonic vibration in the injection molding
Korea-Australia Rheology Journal March 2009 Vol. 21, No. 1 25
system using orthogonal arrays, Trans. KSAE 7, 144-155.
Madras, G., S. Kumar and S. Chattopadhyay, 2000, Continuous
distribution kinetics for ultrasonic degradation of polymers,
Polymer Degradation and Stability 60, 73-78.
Morii, T., N. Ikuta and H. Hamada, 1999, Influence of ultrasonic
vibration frequency on acceleration of hydrothermal aging of
FRP, J. of Thermoplastic Composite Materials 12, 465-476.
Mousavi, S. A. A. A., H. Feizi and R. Madoliat, 2007, Inves-
tigations on the effects of ultrasonic vibrations in the extrusion
process, J. of Materials Processing Tech. 187-188, 657-661.
Orhan, S., 2007, Analysis of free and forced vibration of a
cracked cantilever beam, NDT&E Inter. 40, 443-450.
Price, G. J., E. J. Lenz and C. W. G. Ansell, 2002, The effect of
high-intensity ultrasound on the ring-opening polymerization
of cyclic lactones, European Polymer J. 38, 1753-1760.
Sahnoune, A. and L. Piche, 1998, Ultrasonic study of anhar-
monicity in amorphous polymers: temperature, pressure and
molecular weight effects, J. of Non-Crystalline Solids 235-237,
664-669.
Shim, S. E., S. Ghose and A. I. Isayev, 2002, Formation of bub-
bles during ultrasonic treatment of cured poly(dimethyl silox-
ane), Polymer 43, 5535-5543.
Swain, S. K. and A. I. Isayev, 2007, Effect of ultrasound on
HDPE/clay nanocomposites: rheology, structure and proper-
ties, Polymer 48, 281-289.
Ye, Y. S., H. B. Kim, N. S. Kim and J. W. Lee, 2005, A study on
analysis of polymer extruder process using finite element
method, The Korean Society of Mech. Eng. Part A 29, 1, 145-
155.
Youn, B. D. and K. K. Choi, 2004, A new response surface meth-
odology for reliability based design optimization, Computers
and Structures 82, 241-256.
![INTEGRATED NUMERICAL SIMULATION OF INJECTION MOLDING … · injection molding filling simulation [8]. Numerical experiments confirm the reliability and efficiency of the solver. Integrated](https://img.pdfslide.us/doc/110x75/5d0d0f7388c993ed388b4830/integrated-numerical-simulation-of-injection-molding-injection-molding-filling.jpg)
![Resin transfer molding process: a numerical and … Resin transfer molding process: a numerical and experimental investigation gradient are the main factors [2], so their optimizations](https://img.pdfslide.us/doc/110x75/5aa25be67f8b9a436d8cdb13/resin-transfer-molding-process-a-numerical-and-resin-transfer-molding-process.jpg)