Embed Size (px)
Citation preview
1
Investigation of the effects of financial regulation and supervision
on bank stability: The application of CAMEL-DEA to quantile
regressions
by
Ali Shaddadya and Tomoe Moore
b*
Department of Finance, king Abdulaziz University,
Jeddah, Saudi Arabia, P.O. Box : 80200. Zip Code : 21589.
Tel: +966126400000
a b
Department of Economics and Finance, Brunel University London,
Uxbridge, Middlesex, UB8 3PH, UK.
Tel: + 44 1895274000, Fax: +44 1895269770
*Corresponding author
2
Investigation of the effects of financial regulation and supervision on bank
stability: The application of CAMEL-DEA to quantile regressions
Abstract
We rigorously investigate the multifaceted effects of financial regulation and supervision on
bank stability using an unbalanced panel data of 2210 banks across 47 countries over the
period 2000–2016. The CAMELS rating system is applied to quantile regressions. We find
that greater capital regulation is positively associated with bank stability, while tighter
restrictions, deposit insurance and excess of supervision appear to exert an adverse effect on
bank stability. These effects are more pronounced among banks with a high level of stability.
Empirical results also reveal the heterogenous effects of regulations depending on business
models, bank size and economic development. It appears that commercial banks, smaller
banks and banks in emerging countries tend to be more sensitive to regulatory shocks.
Keywords: Bank stability; Financial regulation and supervision; CAMELS; Quantile
approach
JEL classifications: G21; G28; G24
3
1. Introduction
The controversy about the relationship between regulation and stability has created
theoretical questions, whether strict regulations besides supervisions are appropriate for all
financial markets and institutions, and which type of regulations can be pursued. For
example, Barth et al. (2004), Pasiouras et al. (2006), Pasiouras et al. (2009), Barakat and
Hussainey (2013) and Delis (2015) highlight the need for tighter financial regulation to
promote financial stability and the importance of building stable buffers to meet any financial
distress. On the other hand, some researchers have argued that stricter regulation may
destabilise the financial system. Hakenes and Schnabel (2011) stated that onerous regulation
may attenuate the ability of banks to provide financial resources for economic sectors. Such
regulation may also have an adverse effect on bank competition leading to higher loan rates
and to potentially a higher probability of loan defaults. Demirgüç-Kunt and Detragiache
(2011) did not find any significant positive impact of regulation and supervision on financial
stability.
In this paper, we rigorously investigate the multifaceted effects of regulation together
with supervision on bank stability using a large data set of an unbalanced panel of 2210 banks
across 47 countries over the period 2000–2016. Our study distinguishes from existing
studies in the following manner: We consider the multifaceted influences of the concepts of
regulations and supervisions with variations in bank size, business models and economic
development. Whilst most financial stability research has suffered from inadequate
measurement of stability scores (Wanke et al., 2016), we adopt a CAMELS-DEA rating
system as a stability indicator. CAMELS is an acronym for categories of financial variables
that are encountered in the financial literature, referring to capital adequacy (C), asset quality
(A), management efficiency (M), earnings (E), liquidity (L) and sensitivity to market risk (S),
and DEA is data envelopment analysis. Our study combines this system with a quantile
regression technique.
Several studies have investigated the concept of financial stability, however, debate
regarding the precise definition of financial stability has been ongoing. Crockett (1997)
considered stability in both institutions and markets, whereby stability in financial institutions
may refer to the absence of stress, and stability in the financial market may refer to the
absence of volatile price movements. Issing (2003) defines financial stability as a system
which can guarantee an efficient allocation of savings in order to enhance investment
4
opportunities. In a similar vein, European Central (2005) interprets financial stability as a
system which can provide continued support for an economy. Borio (2003) expounded
financial stability based on two main paradigms, the micro-prudential and macro-prudential.
See also Garry and Schinasi (2004). The complexity of identifying financial stability
conceptually leads to different ways of quantifying such stability for a empirical work. The
widely used indicator at the micro-level is the Z-score (Altman 1968, Altman et al.1977,
Boyd and Graham 1986, Hannan and Hanweck 1988, and Uhde and Heimeshoff 2009). This
reflects the probability of default in the banking system. However, this indicator suffers from
several limitations. The Z-score is based purely on an accounting and auditing framework,
and hence it does not take into account other sources of risk such as the sensitivity of market
risk or management risk (Čihák et al. 2012 and Creel et al. 2015). Iannotta (2007) used loan
loss provision (LLP) to total loans as a proxy for banking credit risk. At a macro-level,
Loayza and Ranciere (2006) utilised the standard deviation of private credit to GDP so as to
capture financial fragility. In addition, Hollo et al. (2012) developed a financial stability
measurement through a composite indicator of systemic stress (CISS).
Männasoo and Mayes (2009) propose CAMELS indicators that appear to have a
significant ability to detect any financial distress. The related financial variables of the
CAMELS acronym have been adopted in several studies as an appropriate standard for
detecting financial distress. See, for example, Cole and Gunther (1995), DeYoung (1998),
Kumar and Ravi (2007) and Poghosyan and Čihák (2009). Avkiran and Cai (2012) presented
empirical evidence which emulated the CAMELS rating system in Australian bank holding
companies through the use of a non-parametric technique, DEA. They emphasised that DEA
can be utilised as a forward-looking substitute method that assists in detecting financial
distress in the near future. More recently, Wanke et al. (2015) and Wanke et al. (2016) also
examined the CAMELS rating system in Brazilian and Malaysian banks by using DEA, and
proved that the CAMELS rating system with DEA is an appropriate method to discover any
financial distress. In this paper, we adopt this CAMELS-DEA method.
Many studies have examined the influence of banks’ business models on financial
stability. For example, Demirgüç-Kunt and Huizinga (2010) find that banks with a high
degree of diversified activities may produce more risks. Altunbas et al. (2011) stated that
banks’ business models that shape an aggressive credit growth and large balance sheets may
face distress, conversely, any bank business model that is based on high deposits coupled
5
with significant diversification of assets is less likely to face financial distress. Likewise,
Ayadi et al. (2012) argue that retail-oriented banks are more profitable and stable, compared
with other types of financial institutions. See also Köhler (2015) and Mergaerts and Vander
Vennet (2016). Mergaerts and Vander Vennet (2016) argue that heterogeneity among banks’
business models may have different reactions to prudential regulations and methods of
supervision.
The debate about the effect of bank size on financial stability has also gained much
attention since it was evidenced that the crisis originated in the large global banks has spread
the source of financial distress across many countries. The agency theory suggests that
managers who run large banks can gain private benefits and obtain more compensation
(Murphy 1985, Jensen 1986 and Gabaix and Landier 2008). By this perspective, it is possible
to observe a negative relationship between bank size and financial stability. On the other
hand, the stewardship theory presents a manager as an inherently trustworthy person, and it is
unlikely that such a person misappropriates a bank’s resources (Davis et al., 1997). It is also
argued that a large bank may reflect structural convenience, which may reinforce financial
stability (Donaldson and Davis, 1991). This suggests that a sensitivity to regulatory shocks
may vary according to banks size.
Demirg et al. (1998) studied the determinants of banking distress across developing
and emerging countries. They discovered that structural characteristics of the financial system
together with a weak macroeconomic environment play key roles in increasing the
probability of financial distress, especially in less developed countries. Further, Čihák et al.
(2012) and Wen and Yu (2013) find that there are significant variations in the relationship
between financial depth and financial stability across high-income and low-income countries.
It is argued that this is due to the different propagation of financial distress and the sources of
stress. Weak early warning indicators in emerging economies are also said to influence the
variations of the financial stability and the related determinants (Babecký et al., 2014).
The above arguments warrant us to distinguish the effect of regulation and
supervision on bank stability in terms of banks' business models, size and the stage of
economic development.
Our empirical work reveals the following main findings: In general, capital
regulation has a positive influence on stability across all quantiles. Such as concentration and
6
economic freedom also exert a preferable effect on bank stability. This is contrasted with the
activity restrictions, deposit insurance, monitoring and supervision which have shown to
adversely affect banks. These effects tend to be more pronounced in banks with a high level
of stability. Note also that there appears to be heterogenous effect across different business
types of bank, bank size and economic development. In particular, commercial banks,
smaller banks and also banks in emerging countries, albeit to a lesser degree, tend to be more
sensitive to shocks in financial regulations and supervision. These empirical results should
serve to provide guidance for financial policymakers in designing and setting bank
regulations and supervisions.
The rest of this paper proceeds as follows. Section 2 presents the relevant literature on
the effects of regulation and supervision on bank stability. Other determinants are also
discussed in this section. In Section 3, we describe the model specification, variables and
data. The empirical results are presented in Section 4, and we conclude in Section 5.
2. The relevant literature
2.1 Bank regulation, supervision and internal monitoring
It is pointed out that capital requirement regulation is as one of the key instruments to
enhance financial stability. Boot and Greenbaum (1992) and Besanko and Kanatas (1993),
however, pointed out that a strict capital requirement decreases monitoring power. Moreover,
Hakenes and Schnabel (2011) argue that a stringent capital requirement attenuates
competition for loans, thereby banks raise loan rates, leading to an increasing probability of
bank default among borrowers. Nonetheless, an effective capital requirement is considered a
useful instrument to absorb losses and act as a buffer. Kim and Santomero (1988) showed
the way in which a capital requirement can redress the bias towards risk. Further, although
banks may have to fund their capital requirements by new share issues, strict capital
requirements could prompt banks to reduce risky lending (Gambacorta and Mistrulli, 2004).
Furlong and Keeley (1989) added that adequate capital requirements may maximise banks’
values by enhancing investors’ confidence, boosting banks' reputations and their franchise
values (Repullo, 2004).
There are conflicting propositions regarding the influence of restrictions in non-
traditional financial activities such as insurance, securities and property on financial stability.
7
It is argue that tight restrictions may boost monitoring due to low complex banking activities
coupled with a reduction in informational asymmetries. However, relaxing restrictions
enables banks to gain the benefits of diversifying their products. This may affect financial
services and assist banks to provide more efficient services and enhance bank stability (Barth
et al., 2004). See also Laeven and Levine (2007) and Barth et al. (2013b).
It is argued that official supervision could overcome market failure caused by
imperfect information. Such supervision, together with enhanced monitoring and the
disciplining of banks, could consequently boost the governance of bank lending and reduce
corruption (Beck et al. 2006b). In particular, it is argued that active supervisory agencies
improve banks’ efficiency and the banks’ ability to face any financial distress (Barth et al.
2004 and Barth et al. 2013b). It is, however, counter-argued that supervisors may concentrate
on promoting self-interest. For example, based on a self-interest hypothesis, supervisors may
be able to conceal some supervisory information and to exchange it for private benefits
(Boyer and Ponce, 2012), impeding financial stability (Beck et al. 2006b and Barth et al.
2013b). Additionally, powerful and more independent supervisors working in a weak
governance environment may hamper prudential supervision, creating a financial system
which is less resistant to financial shocks (Melecky and Podpiera, 2013). Yet, supervision has
varying impacts from country to country and from one financial environment to another (Ben
Bouheni, 2014). In general, powerful and independent supervisory authorities in a well-
developed financial system are less prone to financial shocks, while supervisory authorities in
poor financial governance environments could be more sensitive to financial distress
(Chortareas et al. 2012).
In terms of banks' internal monitoring, it is argued that it reduces credit risk through
the reduction of asymmetric information problems between banks and borrowers (Winton,
1995). It also enhances internal governance and thereby boosting stability in financial
institutions.
Deposit insurance is also deemed to offer a safety buffer in the financial system. This
guarantee can boost depositors’ confidence and reduce the role of government with regard to
banks' obligations in the face of financial shocks (Anginer et al. 2014 and Constantinescu
2015). However, Santomero (1997) and Demirgüç-Kunt and Detragiache (2002) highlight
that deposit insurance may increase the incentive of banks to take risks. Moreover, achieving
an optimal deposit insurance scheme with an appropriate structure is an arduous task with
8
governments potentially absorbing all losses. This accelerate banks to take further risks,
which makes them more vulnerable to financial shocks (Cull et al. 2005, Demirgüç-Kunt et
al. 2008 and Chernykh and Cole 2011).
2.2 Market, institutional and economic environments
There are two conflicting views on the relationship between concentration (or competition)
and financial stability (Uhde and Heimeshoff 2009 and Fu et al. 2014). The traditional view
adopts the concentration–fragility perspective. Highly concentrated banking systems may
boost market power, reducing competition in financial services. This may lead to increased
loan rates and the market becomes prone to loan defaults (Beck et al. 2006a). See also Fu et
al. (2014). On the other hand, the concentration–stability advocators emphasise that high
concentration produces greater competition in an optimal market structure, imposing banks to
lower interest rates. Further, concentration in the financial system may tend to have larger,
better-diversified banks, which enhances stability in banking. Moreover, banks in a
concentrated financial system are less prone to insolvency because of a strong capital buffer.
It is also argued that possibility of economies of scale and scope would enable to achieve
higher profit (Mirzaei and Moore, 2014). Regulators find that fewer market players can
improve effective supervision, enhance monitoring and reduce the risk of contagion across
banks (Beck et al., 2006a).
There is almost a consensus about the active role of governance in enhancing stability
in the financial system. Kirkpatrick (2009) provided substantial evidence that weaknesses in
the implementation of governance principles have contributed to the failures of banks and
poor risk management due to inaccuracies in conveying information and also an inadequate
disclosure of predicted risk.
During the financial crisis, governments undertook majority of stakes in most of the
beleaguered financial institutions through bailouts in developed countries. This arose the
debate about whether government-owned banks enhance financial soundness (Nsengiyumva
2016). Three alternative theories can explain the relation between government ownership
and financial stability: the social, political and agency theories. The classical view is based on
the social perspective, which suggests that government ownership is instrumental in
addressing market failures, improving public welfare (Stiglitz 1993). The political
perspective considers government-owned banks as a tool for implementing the individual
goals of politicians (Shleifer and Vishny 1994), e.g. providing financial support for favoured
9
enterprises or increasing employment for their supporters (Shleifer 1998). The agency
perspective shares with the social perspective to the extent that it aims to improve social
welfare, however, this perspective can generate weak management, misallocation and
corruption as a result of government bureaucracy (Banerjee, 1997). Hence, if the political or
agency hypothesis holds, the government-owned banks may be a cause of instability.
The liberty of individuals and institutions is one of the most important pillars of
economic development that has been pursued to achieve economic goals and to improve
financial stability. Financial institutions can efficiently control their costs and reduce risk
through the reduction of constraints (Chortareas et al. 2013). It surely should have preferable
impact on the development of financial intermediaries (Hafer 2013). It is also argued that a
high level of economic freedom creates greater political stability and thus reduces uncertainty
in the financial system (Blau et al. 2014).
Significant academic efforts have aimed to identify the link between macroeconomic
indicators and financial stability. Such as economic growth and inflation are found to affect
the level of bank capitalisation and the quality of banks' assets (Schaeck and Cihak 2012).
For example, Boyd et al. (2005) provided strong evidence that unstable economic growth
increases uncertainty about a financial system’s future. Ayuso et al. (2004) and Jokipii and
Milne (2008) also argued need for steady economic growth to enhance banks' capital buffers
and improve financial soundness. With regard to inflation, it is often seen as an obstacle to
stability in the financial markets. An inflationary environment may raise a bank’s incentive
to increase loan rates and banks may gain more income. However, it may impede financial
soundness by increasing the probability of borrowers' defaulting (Tan and Floros 2012).
3. Methodology, variables and data
3.1 Methodology
The study utilises the CAMELS-DEA model for a bank stability as a dependent variable.
The estimated bank stability is, then, regressed on regulations, supervision and other
determinants in order to investigate the multifaceted effects on financial stability. A quantile
regression (QR) is applied for estimation. QR mitigates an econometric issue of
heteroskedasticity.
Bank behaviour studies usually rely on a one-dimensional risk indicator such as a Z-
score, non-performing loans, credit ratings, return on equity or capital ratios. These indicators
10
do not reflect bank-specific characteristics and may contain some measurement errors
because of differences in measurement for on- and off-balance issues (Klomp and De Haan,
2012). Therefore, there is doubt about the ability of these indicators to capture banking risk.
Although a non-unique set of indicators exists, the CAMELS indicators appear to have a
significant capacity to assess banks’ soundness with the combination of indicators (Wanke et
al. 2016). We adopt the CAMELS combination as a proxy of financial stability. The
financial dimensions of this combination are employed by regulators and supervisors to
assess banks' overall health (Avkiran and Cai 2012, Klomp and De Haan 2012, Wanke et al.
2015, Wanke et al. 2016, Buch et al. 2016 and Calabrese et al. 2017). However, the original
criteria of the categories of CAMELS ratings are undisclosed and unavailable to the public,
hence the proxy of each category is selected based on data availability and prior studies (Jin
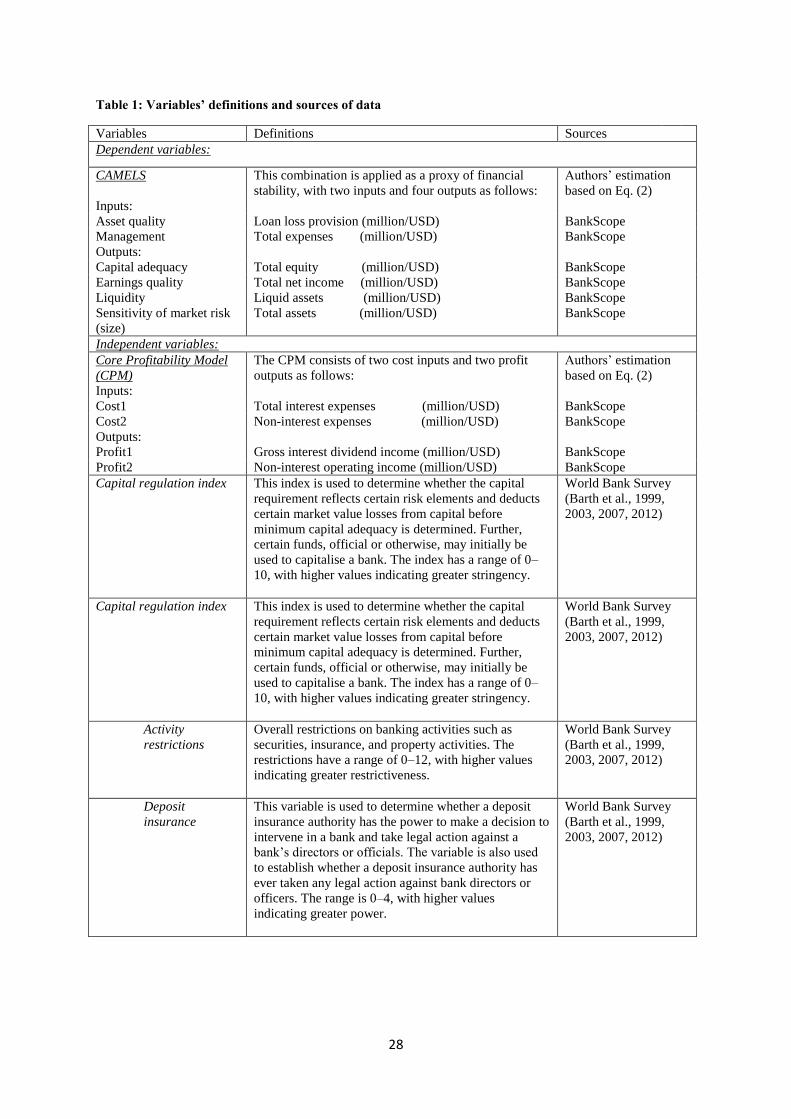
et al. 2011, Avkiran and Cai 2012 and Wanke et al. 2016). Table 1 contains the proxy for
each category of CAMELS with a definition of each proxy.
[Table 1 about here]
CAMELS indicators are multi-dimensional risk indicators, being useful for assessing
the financial vulnerability of banks (Klomp and De Haan, 2012). DEA is an efficient frontier
technique which calculates comparative ratios of multi-weighted inputs to multi-weighted
outputs by using linear programming for each decision-making unit (DMU) (Avkiran, 2011).
Accordingly, the application of DEA to CAMELS serves to deal with, and interact among,
multi-inputs and multi-outputs by minimising inputs and maximising outputs. This provides a
distinct advantage over traditional risk ratios.
The components of CAMELS are as follows: Capital adequacy (C) is captured by
total equity and treated as a desirable output. It should be maximised when more equity is
conducive to less financial distress. Asset quality (A) is captured by loan loss provisions
(LLP), which is an undesirable input and should be minimised. In a similar manner,
management efficiency (M) has a proxy in the form of total expenses (personnel and
operating) and is regarded as an undesirable input. However, earnings quality (E) has a proxy
in the form of total net income and is maximised as a desirable output. Liquidity (L) is
another desirable output that has a proxy in the form of total liquid assets. Sensitivity to
market risk (S) is measured by total assets and treated as a desirable output because of the
role of total assets in impeding default risk (Wanke et al., 2016).
11
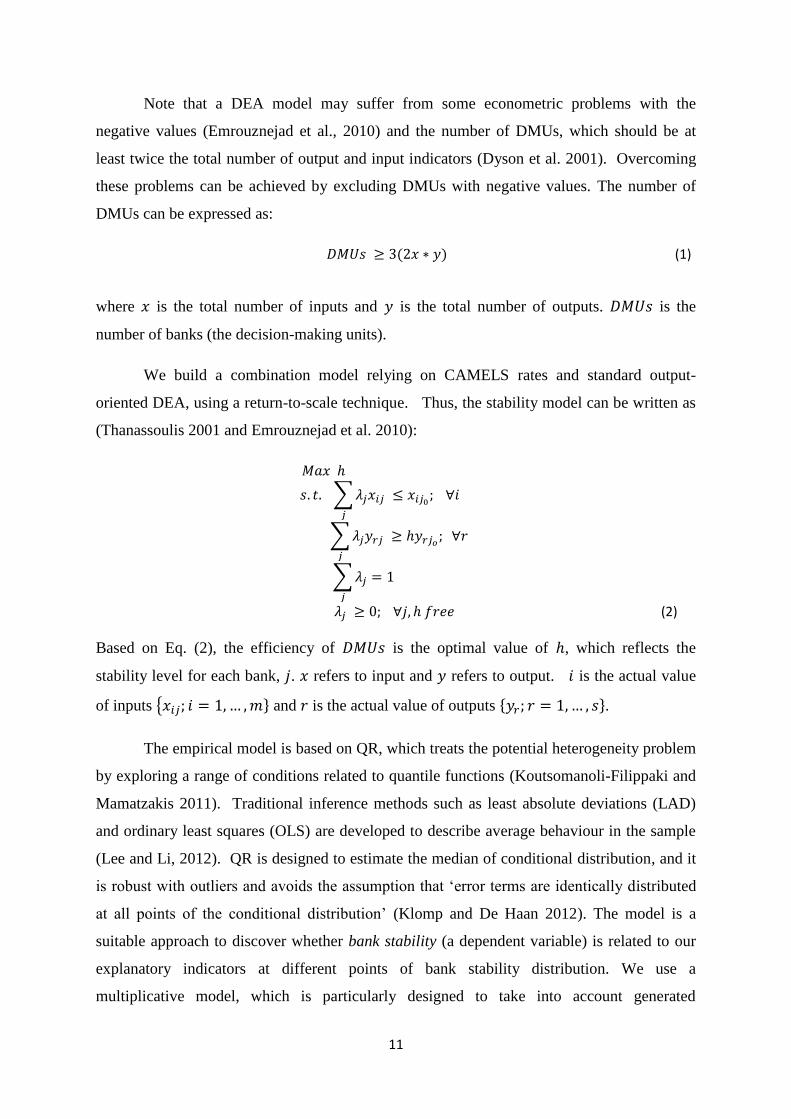
Note that a DEA model may suffer from some econometric problems with the
negative values (Emrouznejad et al., 2010) and the number of DMUs, which should be at
least twice the total number of output and input indicators (Dyson et al. 2001). Overcoming
these problems can be achieved by excluding DMUs with negative values. The number of
DMUs can be expressed as:
(1)
where is the total number of inputs and is the total number of outputs. is the
number of banks (the decision-making units).
We build a combination model relying on CAMELS rates and standard output-
oriented DEA, using a return-to-scale technique. Thus, the stability model can be written as
(Thanassoulis 2001 and Emrouznejad et al. 2010):
(2)
Based on Eq. (2), the efficiency of is the optimal value of , which reflects the
stability level for each bank, . refers to input and refers to output. is the actual value
of inputs and is the actual value of outputs .
The empirical model is based on QR, which treats the potential heterogeneity problem
by exploring a range of conditions related to quantile functions (Koutsomanoli-Filippaki and
Mamatzakis 2011). Traditional inference methods such as least absolute deviations (LAD)
and ordinary least squares (OLS) are developed to describe average behaviour in the sample
(Lee and Li, 2012). QR is designed to estimate the median of conditional distribution, and it
is robust with outliers and avoids the assumption that ‘error terms are identically distributed
at all points of the conditional distribution’ (Klomp and De Haan 2012). The model is a
suitable approach to discover whether bank stability (a dependent variable) is related to our
explanatory indicators at different points of bank stability distribution. We use a
multiplicative model, which is particularly designed to take into account generated
12
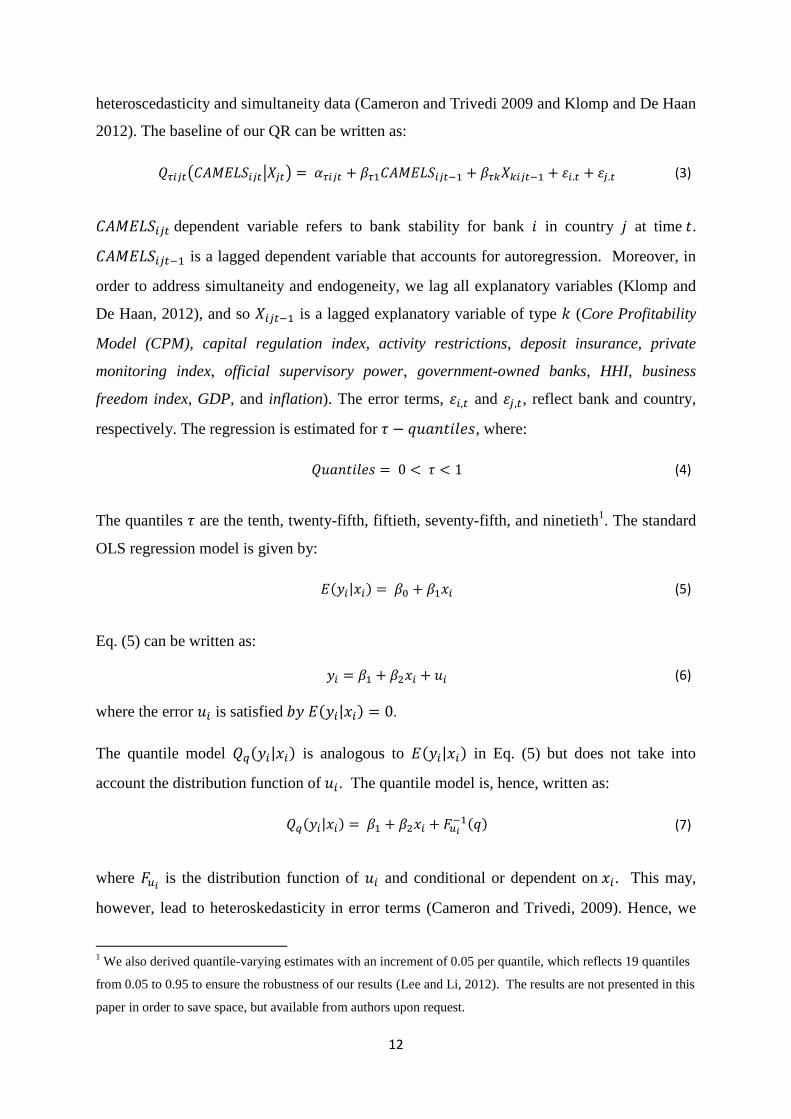
heteroscedasticity and simultaneity data (Cameron and Trivedi 2009 and Klomp and De Haan
2012). The baseline of our QR can be written as:
(3)
dependent variable refers to bank stability for bank in country at time .
is a lagged dependent variable that accounts for autoregression. Moreover, in
order to address simultaneity and endogeneity, we lag all explanatory variables (Klomp and
De Haan, 2012), and so is a lagged explanatory variable of type (Core Profitability
Model (CPM), capital regulation index, activity restrictions, deposit insurance, private
monitoring index, official supervisory power, government-owned banks, HHI, business
freedom index, GDP, and inflation). The error terms, and , reflect bank and country,
respectively. The regression is estimated for , where:
(4)
The quantiles are the tenth, twenty-fifth, fiftieth, seventy-fifth, and ninetieth1. The standard
OLS regression model is given by:
(5)
Eq. (5) can be written as:
(6)
where the error is satisfied .
The quantile model is analogous to in Eq. (5) but does not take into
account the distribution function of . The quantile model is, hence, written as:
(7)
where is the distribution function of and conditional or dependent on . This may,
however, lead to heteroskedasticity in error terms (Cameron and Trivedi, 2009). Hence, we
1 We also derived quantile-varying estimates with an increment of 0.05 per quantile, which reflects 19 quantiles
from 0.05 to 0.95 to ensure the robustness of our results (Lee and Li, 2012). The results are not presented in this
paper in order to save space, but available from authors upon request.
13
apply 1000 bootstrap replications so as to enhance the adequacy of the standard error and
increase the construction of the confidence intervals (Hahn, 1995).
We examine our quantile model by distinguishing the different type of business model
in banks, bank size and economic development across countries (Haas and Murphy 2003 and
Thompson et al. 2006). We also re-estimate the effect of these explanatory variables on bank
stability using a two-stage least squares (2SLS) instrumental regression model (Lee and Li
2012 and Klomp and De Haan 2012).
3.2 Variable definitions
Efficient banks which maximise profitability are more likely to build strong capital buffers
and are less liable to be exposed to financial distress (Athanasoglou et al. 2008, Uhde and
Heimeshoff 2009 and Vives 2011). The model specifies the Core Profitability Model (CPM)
as a proxy for maximising profits and minimising costs by using the input-output technical
efficiency approach with Eq. (2) (Avkiran 2011 and Avkiran and Cai 2012). CPM consists of
two cost inputs (total interest expenses and total non-interest expenses) and two profit outputs
(gross interest and dividend income and total non-interest operating income).
We uses the capital regulatory index as a measurement of overall capital regulation.
The index consists of overall capital stringency which evaluates the amount of capital that
banks should hold and also initial capital stringency which measures certain funds that may
initially be utilised to capitalise a bank (Barth et al., 2004). The variable of activity
restrictions indicates the extent to which individual banks are able to handle and underwrite
securities, to sell and underwrite insurance and to invest in property (Barth et al., 2004).
Deposit insurance determines whether deposit insurance authorities have the power to make a
decision to intervene in a bank and to take legal action against a bank’s officers or directors.
The variable is also used to determine whether deposit insurance authorities have ever taken
any legal action against a bank’s officers or directors (Barth et al., 2013a).
Private monitoring index measures whether there are incentives to privately monitor
companies. The official supervisory power evaluates whether official supervisory power has
the power to take concrete actions to correct and prevent problems (Barth et al., 2013a). The
variable of Government-owned banks reflects the percentages of a banking system's equity
which are owned or controlled by a government (Barth et al., 2013a).
14
We utilise the Herfindahl-Hirschman (HHI) as a proxy of concentration in the
banking sector. It captures, through squaring, the market share (deposits) for each bank
competing in the banking sector in each country, and has a range from zero to 10.000 points
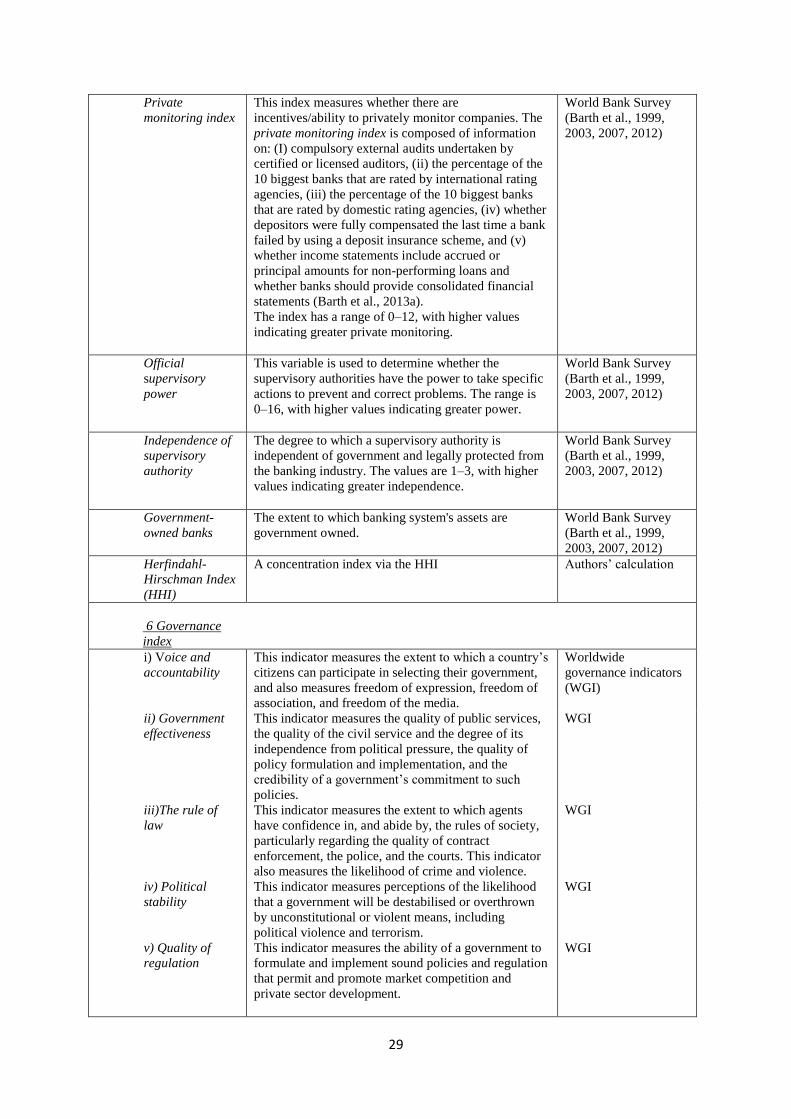
(Al-Muharrami et al., 2006). This study relies on the worldwide governance indicators
(WGI) to investigate the impact of governance on financial stability. These indicators reflect
six dimensions of governance: voice and accountability, government effectiveness, the rule of
law, political stability, quality of regulation and control of corruption (Kaufmann et al.,
2011). We develop the governance index by calculating the average value of all governance
dimensions. While the governance index reflects only the quality of the legal and regulatory
environment, the business freedom index is more comprehensive. The latter is based on 10
essential dimensions grouped into four broad pillars: i) the rule of law, which includes
property rights and freedom from corruption, ii) limited government, which combines fiscal
freedom and government spending, iii) regulatory efficiency, which refers to business
freedom, labour freedom and monetary freedom and iv) the open market, which reflects
freedom of trade, investment and finance.
This study includes the natural logarithm of GDP to capture the influence of an
economic growth rate on financial stability. The consumer price index is used for inflation.
The definitions and sources of these variables are presented in Table 1.
3.3. Data and descriptive analysis
For this study, unbalanced panel data of 2210 banks are used over 17 years from 2000 to
2016. The sample includes commercial banks, investment banks and bank holding companies
in 47 European countries. Unlike most financial literature, which has concentrated on listed
banks (e.g. Demirgüç-Kunt and Huizinga 2010 and Altunbas et al. 2011), our sample
includes both listed and unlisted banks. Unlisted banks usually reflect significant numbers of
small banks (Köhler, 2015) and so the inclusion of unlisted banks is likely to enhance the
data’s ability to identify the effect of variation in business models and bank size on financial
stability (Demsetz and Strahan, 1997). The data set, however, excludes the followings: i)
banks that do not report the values of total assets or LLP. ii) banks with headquarters outside
European countries, iii) banks with fewer than three years of consecutive observations, and
(iv) banks with outliers in figures, which may reflect errors in measurement and hence may
influence the stability score, specifically when utilising the DEA technique.
15
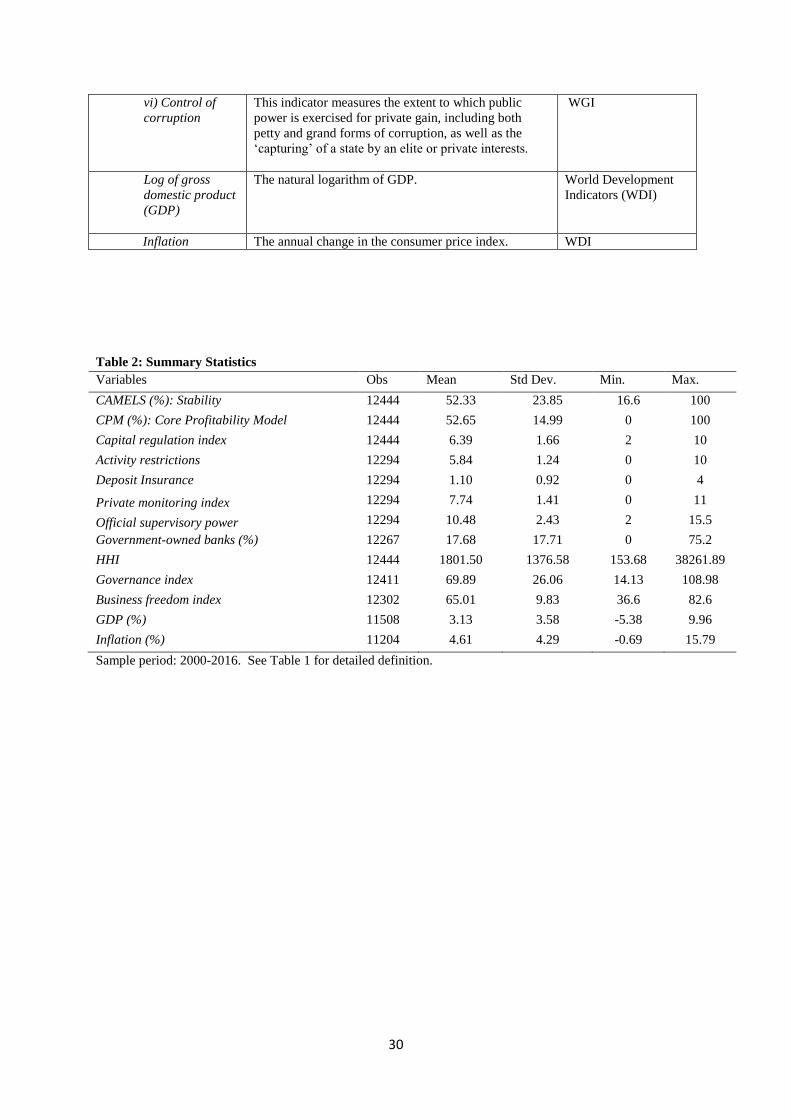
[Table 2 about here]
The summary statistics of the indicators are found in Table 2. Winsorising is used
for the CAMELS and CPM modelling2. The values in the table reflect the overall average for
all sample countries. CAMELS has an average of 52.3%. A large standard deviation suggests
that CAMELS varies widely across banks. The average of the capital regulation index is
approximately 6.4 out of 10. The emerging European markets have had a significant negative
impact on the overall level of capital regulation index, while advanced markets are, in
general, above the average level, reflecting the stringent capital buffers held in banks in
advanced countries3. European countries, in general, appear to have relatively fewer
restrictions regarding non-traditional bank activities with an average of 5.8 out of 12, and
deposit insurance seems to be weak with 1.1 out of 4.
Government-owned banks is relatively low at approximately 17.8%. It indicates a
remarkable shift in Russia and former Eastern European countries in the context of
privatisation of financial institutions. The average value of HHI at 1802 points seems to
indicate concentrated markets in the European banking sector4. A figure of 3.13% GDP
growth suggests stable economic growth in European countries. A relatively high inflation
rate of 4.6% may reflect monetary stimulus policies in some European countries or may be
due to a fast growth in some emerging European countries.
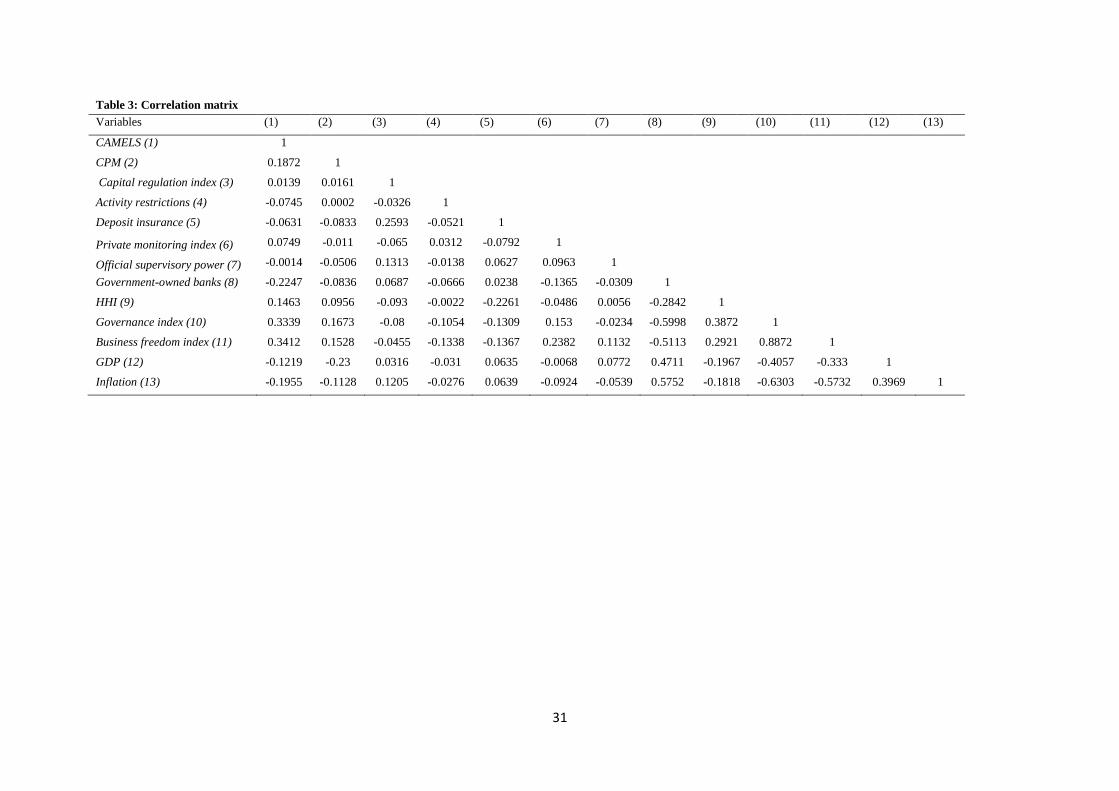
[Table 3 about here]
The cross-correlation matrix between the variables is presented in Table 3. The matrix
does not show significant correlations between most of the variables except for the
correlation coefficient between governance index and business freedom index, which records
at approximately 0.89. Hence, we specify the business freedom index in the main analysis
and the governance index in the robustness analysis.
2 Recall that both are estimated based on Eq. [2].
3 The stability scores for individual countries are not presented to save space, but available upon request from
the authors.
4 The US merger guideline suggests that HHI exceeding 1800 is deemed to be a high concentrated market. The
EU guideline is similar to that of US.
16
4. Empirical results
4.1. Main model
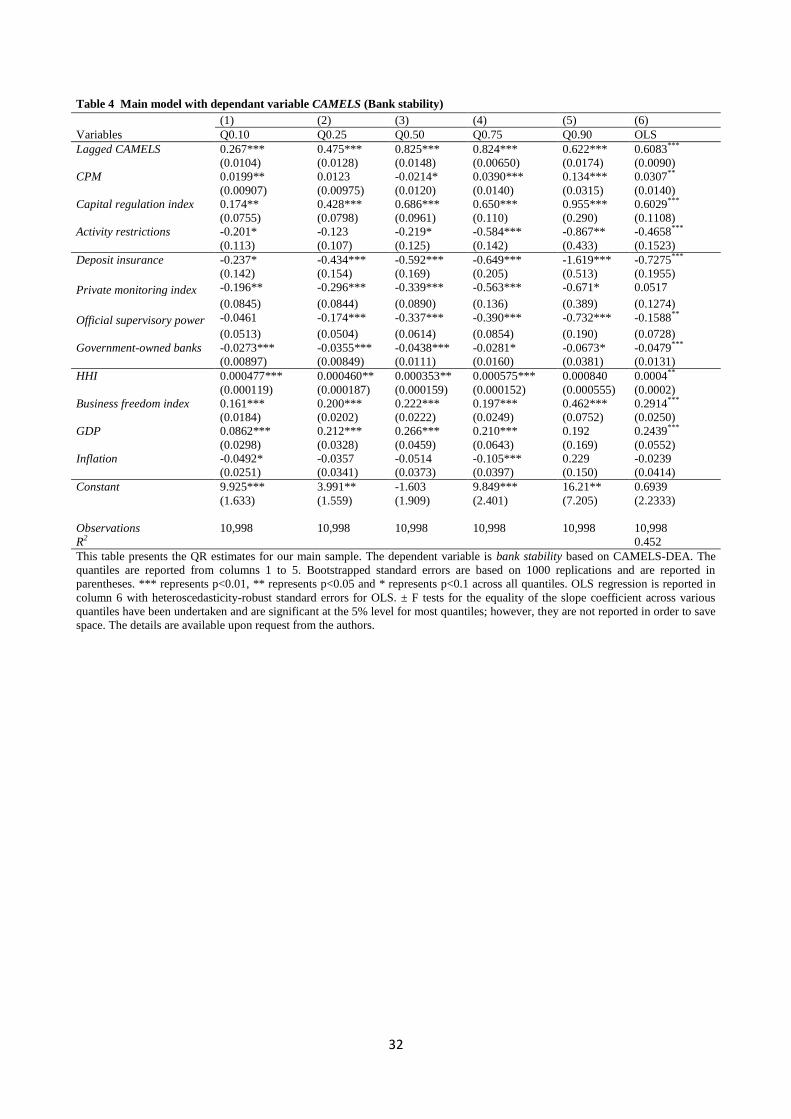
The estimated parameters of Eq. (3) are presented in Table 4 with five quantile results of
Q0.10, Q0.25, Q0.50, Q0.75 and Q0.90. The results of OLS are also presented for
comparison. OLS depends on the approximation of the mean function of conditional
distribution, which does not provide a complete picture of the influence of explanatory
variables on stability dispersion across banks. Quantiles can deliver a clear picture about the
influence of explanatory variables by distinguishing high and low stability banks. Fig. 1
shows the distribution of explanatory variables.
[Table 4 and Figure 1 are about here]
The results indicate the significant positive impact of most CPM quartiles on financial
stability, except for Q0.25. The distribution of impact in Fig 1 indicates the sharp increase at
Q0.90. We also observe a significant variation in the capital regulation index estimates
across quantiles with regard to their influence on bank stability. This is particularly evident
with the tails of the distribution with Q0.10 at approximately 0.176 that is compared with
Q0.90 at 0.955. See also Figure 1 which shows an upward movement.
Greater activity restrictions have a highly significant negative influence on bank
stability among stable banks, since the coefficients are significant for Q0.75 and Q0.90 at the
1% and 5% level, respectively. The results suggest that a greater restriction in number of non-
traditional financial activities may reduce the ability of banks to diversify risk, thus impeding
their stability. The impact of deposit insurance on bank stability is also negative and mostly
highly significant across various quantiles. Deposit insurance may motivate a bank to relax
its restrictions on lending and also disrupt the ability of banks to maximise liquidity.
Particularly, the largest coefficient is found at Q0.90 with -1.6, implying the increased
negative impact of deposit insurance on high-stability banks.
With respect to private monitoring index, we observe a significant negative impact on
bank stability across different quantiles. The coefficient on official supervisory power also
shows a negative effect on bank stability, which may be due to the influence of self-interest
promotion among some supervisors by decreasing bank stability (Barth et al. 2013b). The
analysis indicates that government-owned banks appear to jeopardise bank stability across all
quantiles, albeit the statistically strong effect is felt more at low-stability quantiles. The
17
finding demonstrates that bureaucracy in government agencies may generate such as weak
management, corruption and misallocation of resources, decreasing stability in the banking
system.
Concentration proxied by HHI has a positive significant influence on stability from
Q0.10 to Q0.75. This result is consistent with the concentration-stability approach (Uhde and
Heimeshoff, 2009). Concentration may generate fewer market players, enhancing
supervision and stability in the banking industry. Yet, concentration does not seem to exert
any impact on already stable banks as the coefficient becomes insignificant at Q0.90. We
also observe a significant positive effect of the business freedom index on bank stability. It
demonstrates that if a country is in a high level of economic freedom, such factors as market
liberalization, transparency, political stability and less government control are likely to boost
banking stability.
With regard to macroeconomic factors, the empirical results reveal that GDP has a
positive significant impact on stability across most quantiles. This can be attributed to the
decreasing probability of uncertainty because of stable economic growth. inflation is not
well-determined, and this may imply mixed implications to banking sector. It is often the
case that banks can benefit from inflation by gaining more profit due to a higher spread
between lending and borrowing rates, however, an inflationary environment may increase the
uncertainty in economy, impeding stability in banking sector.
It is noteworthy that, in general, banks in high-stability groups are affected to a
greater extent compared with banks in low-stability groups. A comparison of the QR
estimates with the OLS estimates indicates that employing the OLS in which data are pooled
together without considering heteroskedasticity across banks may lead to incomplete and
misleading conclusions regarding the relationship between bank stability and regulations and
other determinants.
4.2. Business models
In this section, we extend our empirical analysis to different types of bank business model
We split the sample into three classifications of business model: i) commercial banks, ii)
investment banks and iii) bank holding companies. The empirical results are found in Table
5.
[Table 5 about here]
18
Our results highlight that CPM is generally consistent with our main results for
commercial banks, where it has a significant positive impact on bank stability. This
emphasise the importance of maximising profits for enhancement of stability. However,
there is little such effect found in investment banks and bank holding companies. This may
reveal a lack of dependence on profits as a buffer in these types of bank. The estimated
coefficients of the capital regulation index are positive and significant across different
quantiles in commercial banks, though it has a marginal impact on other banks. This result
reflects the nature of risk in commercial banks, where one of the major bank risks is
insolvency and banks need to be facilitated with adequate capital as a cushion against non-
performing loans (Chateau and Wu, 2007). However, investment banks and bank holding
companies have multifaceted businesses including brokering, trading, core investments, fund
management and interest spreads, thus, capital adequacy alone may not be able to promote
stability (Radić et al., 2012). Activity restrictions are significantly negative for the median
and higher quantiles in commercial banks and bank holding companies; higher quantiles are
adversely affected by a tightening of activity restrictions, being consistent with the main
results in Table 4. Deposit insurance authority, Private monitoring index and Official
supervisory power exert a significantly adverse effect on stability in commercial banks,
whilst these effects are almost absent in investment banks and bank holding companies.
The estimates of the coefficients of Government-owned banks are significantly
negative in most quantiles and across different business models, albeit, modest influence on
bank holding companies. The results reaffirm the initial main results that banks with greater
government ownership are, indeed, hindrance to financial stability. The estimates of the
coefficients of HHI are positive and significant only in commercial banks, suggesting
commercial banks are more sensitive to concentrated markets. The positive effect of
Business freedom index is also found only in commercial banks across all quantiles.
Overall, the empirical results in Table 5 indicate that commercial banks are more
sensitive to regulatory shocks. This is not surprising since commercial banks are heavily
framed by regulatory bodies as compared with other types of bank5.
5 Note also that this may be, in part, due to the large number of observations in commercial banks with 9,789
banks compared with investment banks (624 banks) and bank holding companies (585 banks).
19
4.3 Bank size
In this section, we re-group our sample into large and small banks based on a median point6
in order to see any particular features and to avoid bias due to bank size. The estimation
results are presented in Table 6.
[Table 6 about here]
In general, the results are consistent with our primary findings. Banks are affected
positively by CPM. With regard to the capital regulation index, the positive significant
coefficients are observed in lower quantiles in large banks, whereas in higher quantiles in
small banks. This implies that in small banks, a high stability is maintained by the capital
adequacy. Interestingly, while small banks are adversely affected by activity restrictions,
large banks are not sensitive to the variable across most quantiles. However, size may prove
costly for large banks in terms of deposit insurance, as evidenced by the significantly
negative coefficients across all quantiles for large banks. The empirical findings also reveal
the absence of effects derived from the Private monitoring index, Official supervisory power
and Government ownership on the stability of large banks, meanwhile, stability of small
banks seems to be jeopardised by the excessive monitoring and government intervention.
HHI, the business freedom index, and GDP are almost consistent with our main results across
large and small banks. In sum, the estimation results are broadly consistent with our main
results for large and small banks, however, the significance levels of the regulatory and
supervisory variables are much higher across small banks.
4.4 Economic development
The new global financial system increases the depth of links between advanced and emerging
economies. Thus, the crises in advanced economies are rapidly and significantly transmitted
to emerging economies (Balakrishnan et al., 2011). Nonetheless, sophisticated application of
governance, supervision and internal monitoring may enhance the resistance of advanced
economies against crises. In contrast, poor governance may lead to elevated financial stress in
emerging economies. Indeed, some economies may face unprecedented financial stress. In
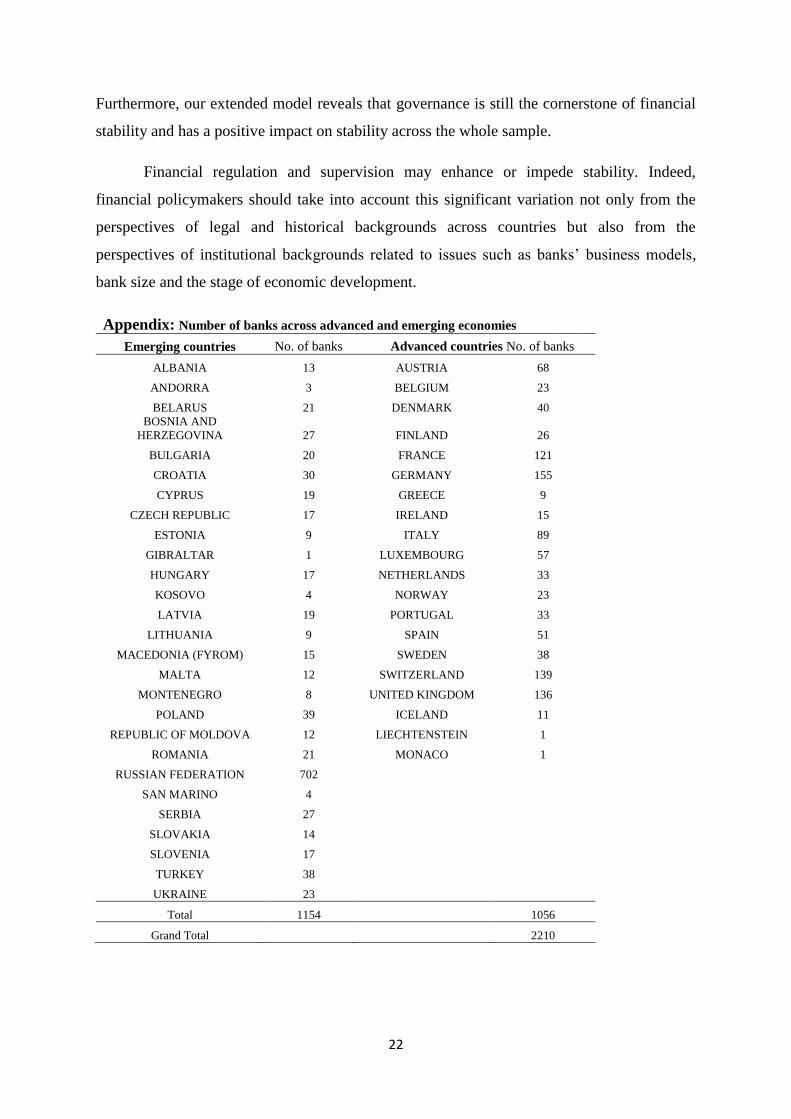
this section, we split our sample into 17 advanced and 30 emerging European countries7 in
6 The median point of total assets among the banks is US$1212.011 million.
7 See Appendix.
20
order to examine the impact of financial regulation and supervisory power across different
stages of economic development.
[Table 7 about here]
The empirical results are shown in Table 7. Amongst others, we can observe the
opposite direction of the coefficients in Private monitoring index and Official supervisory
power where the negative influence is found for emerging European economies and positive
for advanced economies. The possible explanation is that powerful supervisory agencies can
enhance private monitoring by reducing the barriers to the conveyance of information,
thereby boosting bank stability in advanced economies. Meanwhile, supervisors in emerging
economies may use this power to generate private benefits by weakening private monitoring,
causing instability (Barth et al. 2004). The result also highlights the poor quality of
government owned banks in emerging countries. With regard to other variables, the results
are similar to our main findings. CPM, the capital regulation index, HHI, business freedom
index and GDP all have a positive impact on stability. In contrast, activity restrictions,
deposit insurance, and inflation have a perverse influence on stability.
4.5 Robustness checks
[Table 8 and Table 9 about here]
Governance is the main pillar in any financial system and an essential instrument for
improving stability. We modify the model specification by replacing Business freedom index
with Governance index with six dimensions of the WGI to control for the effects of a
country's governance level on bank stability (see Table 1 for six dimensions). The results are
shown in Table 8, where all explanatory variables almost maintain their significance and
signs in accordance with the main findings. The coefficients on Governance index are
positive and highly significant, suggesting that a better governance environment helps to
increase stability in the banking system. It is evidenced that a highest quantile at Q0.90 is the
most sensitive to the index, implying that better governance is conducive to more stable
banks, specifically banks with high-level of stability.
Moreover, in order to address the possibility of the endogeneity problem, we employ
an instrumental variable (IV) technique. Indeed, two common causes may exist for
endogeneity: i) reverse causality between the dependent variable and the explanatory
variables, and ii) the correlation between the explanatory variables and the error term. Based
21
on literature on financial regulation, specifically, we select IVs of ethnic fractionalisation and
legal origins that are likely to help to interpret the development in financial institutions
(Barth et al. 2013b). We also include independence of supervision as an instrumental
variable which measures the differences across supervisory authorities (Klomp and De Haan
2012). Table 9 indicates that the results of 2SLS regression seem to support our primary
findings. In order to confirm the validity of our IVs, we apply an over-identified model. We
find that the model rejects the null hypothesis where the IVs are weak8.
5. Conclusion
In this article, we provide further insight into the theoretical issue of the effect of financial
regulation and supervisory on bank stability. We take into account variations of business
models, bank size and economic development through CAMELS-DEA rating system
combined with a quantile technique. The data set covers 2210 banks from 2000 to 2016.
The main empirical results reveal that the CPM and capital regulation index variables
have a positive influence on stability. The results also show the adverse impact of activity
restrictions on stability, suggesting that restriction in non-traditional financial activity
jeopardises bank stability due to lower degrees of diversification. Other regulatory and
supervisory variables also turn out to be causes of instability. In general, the banks in high-
stability groups are more responsive to the explanatory variables,
Clear variations are evident across different bank business models, where the
explanatory variables for commercial banks are well-determined for expounding stability,
whereas a weak effect of regulations and supervision on stability is found across investment
banks and bank holding companies. This may be explained by the fact that financial
regulations are more heavily imposed on commercial banks. With regard to bank size, small
banks are more sensitive to regulatory shocks as compared with large banks. This suggests
the importance of financial regulation for small banks to help provide a buffer against
financial distress. We also find that while the private monitoring index and official
supervisory power are negative for interpreting stability across emerging economies, their
effect is positive across advanced economies. This may indicate the better quality of such
operations and management of monitoring and supervision in the advanced banks.
8 The results of the weak instrumental variables are not reported in order to save space but are available upon
request.
22
Furthermore, our extended model reveals that governance is still the cornerstone of financial
stability and has a positive impact on stability across the whole sample.
Financial regulation and supervision may enhance or impede stability. Indeed,
financial policymakers should take into account this significant variation not only from the
perspectives of legal and historical backgrounds across countries but also from the
perspectives of institutional backgrounds related to issues such as banks’ business models,
bank size and the stage of economic development.
Appendix: Number of banks across advanced and emerging economies
Emerging countries No. of banks Advanced countries No. of banks
ALBANIA 13 AUSTRIA 68
ANDORRA 3 BELGIUM 23
BELARUS 21 DENMARK 40
BOSNIA AND
HERZEGOVINA 27 FINLAND 26
BULGARIA 20 FRANCE 121
CROATIA 30 GERMANY 155
CYPRUS 19 GREECE 9
CZECH REPUBLIC 17 IRELAND 15
ESTONIA 9 ITALY 89
GIBRALTAR 1 LUXEMBOURG 57
HUNGARY 17 NETHERLANDS 33
KOSOVO 4 NORWAY 23
LATVIA 19 PORTUGAL 33
LITHUANIA 9 SPAIN 51
MACEDONIA (FYROM) 15 SWEDEN 38
MALTA 12 SWITZERLAND 139
MONTENEGRO 8 UNITED KINGDOM 136
POLAND 39 ICELAND 11
REPUBLIC OF MOLDOVA 12 LIECHTENSTEIN 1
ROMANIA 21 MONACO 1
RUSSIAN FEDERATION 702
SAN MARINO 4
SERBIA 27
SLOVAKIA 14
SLOVENIA 17
TURKEY 38
UKRAINE 23
Total 1154
1056
Grand Total
2210
23
References
AL-MUHARRAMI, S., MATTHEWS, K. & KHABARI, Y. 2006. Market structure and
competitive conditions in the Arab GCC banking system. Journal of Banking &
Finance, 30, 3487-3501.
ALTMAN, E. I. 1968. Financial ratios, discriminant analysis and the prediction of corporate
bankruptcy. The journal of finance, 23, 589-609.
ALTMAN, E. I., HALDEMAN, R. G. & NARAYANAN, P. 1977. Zeta tm analysis a new
model to identify bankruptcy risk of corporations. Journal of banking & finance, 1,
29-54.
ALTUNBAS, Y., MANGANELLI, S. & MARQUES-IBANEZ, D. 2011. Bank risk during
the financial crisis: do business models matter?
ANGINER, D., DEMIRGUC-KUNT, A. & ZHU, M. 2014. How does deposit insurance
affect bank risk? Evidence from the recent crisis. Journal of Banking & finance, 48,
312-321.
ATHANASOGLOU, P. P., BRISSIMIS, S. N. & DELIS, M. D. 2008. Bank-specific,
industry-specific and macroeconomic determinants of bank profitability. Journal of
international financial Markets, Institutions and Money, 18, 121-136.
AVKIRAN, N. K. 2011. Association of DEA super-efficiency estimates with financial ratios:
Investigating the case for Chinese banks. Omega, 39, 323-334.
AVKIRAN, N. K. & CAI, L. Predicting bank financial distress prior to crises. New Zealand
Finance Colloquium, 2012.
AYADI, R., ARBAK, E. & PIETER DE GROEN, W. 2012. Regulation of European banks
and business models: towards a new paradigm? Centre for European Policy Studies,
Forthcoming.
AYUSO, J., PÉREZ, D. & SAURINA, J. 2004. Are capital buffers pro-cyclical?: Evidence
from Spanish panel data. Journal of financial intermediation, 13, 249-264.
BABECKÝ, J., HAVRÁNEK, T., MATĚJŮ, J., RUSNÁK, M., ŠMÍDKOVÁ, K. &
VAŠÍČEK, B. 2014. Banking, debt, and currency crises in developed countries:
Stylized facts and early warning indicators. Journal of Financial Stability, 15, 1-17.
BALAKRISHNAN, R., DANNINGER, S., ELEKDAG, S. & TYTELL, I. 2011. The
transmission of financial stress from advanced to emerging economies. Emerging
Markets Finance and Trade, 47, 40-68.
BANERJEE, A. V. 1997. A theory of misgovernance. The Quarterly Journal of Economics,
1289-1332.
BARAKAT, A. & HUSSAINEY, K. 2013. Bank governance, regulation, supervision, and
risk reporting: Evidence from operational risk disclosures in European banks.
International Review of Financial Analysis, 30, 254-273.
BARTH, J. R., CAPRIO, G. & LEVINE, R. 2004. Bank regulation and supervision: what
works best? Journal of Financial intermediation, 13, 205-248.
BARTH, J. R., CAPRIO JR, G. & LEVINE, R. 2013a. Bank Regulation and Supervision in
180 Countries from 1999 to 2011. Journal of Financial Economic Policy, 5, 111-219.
BARTH, J. R., LIN, C., MA, Y., SEADE, J. & SONG, F. M. 2013b. Do bank regulation,
supervision and monitoring enhance or impede bank efficiency? Journal of Banking
& Finance, 37, 2879-2892.
BECK, T., DEMIRGÜÇ-KUNT, A. & LEVINE, R. 2006a. Bank concentration, competition,
and crises: First results. Journal of Banking & Finance, 30, 1581-1603.
BECK, T., DEMIRGÜÇ-KUNT, A. & LEVINE, R. 2006b. Bank supervision and corruption
in lending. Journal of Monetary Economics, 53, 2131-2163.
24
BEN BOUHENI, F. 2014. Banking regulation and supervision: can it enhance stability in
Europe? Journal of Financial Economic Policy, 6, 244-269.
BESANKO, D. & KANATAS, G. 1993. Credit market equilibrium with bank monitoring and
moral hazard. Review of Financial studies, 6, 213-232.
BLAU, B. M., BROUGH, T. J. & THOMAS, D. W. 2014. Economic freedom and the
stability of stock prices: A cross-country analysis. Journal of International Money and
Finance, 41, 182-196.
BOOT, W. A. & GREENBAUM, S. I. 1992. Bank regulation, reputation and rents: Theory
and policy implications.
BORIO, C. 2003. Towards a macroprudential framework for financial supervision and
regulation? CESifo Economic Studies, 49, 181-215.
BOYD, J. H. & GRAHAM, S. L. 1986. Risk, regulation, and bank holding company
expansion into nonbanking. Quarterly Review, 2-17.
BOYD, J. H., KWAK, S. & BRUCE, D. 2005. The real output losses associated with modern
banking crises. Journal of money, credit, and banking, 37, 977-999.
BOYER, P. C. & PONCE, J. 2012. Regulatory capture and banking supervision reform.
Journal of Financial Stability, 8, 206-217.
BUCH, C. M., BUCH, C. M., HILBERG, B., OUML, RN & TONZER, L. 2016. Taxing
banks: An evaluation of the German bank levy. Journal of banking & finance, 72, 52-
66.
CALABRESE, R., DEGL’INNOCENTI, M. & OSMETTI, S. A. 2017. The effectiveness of
TARP-CPP on the US banking industry: A new copula-based approach. European
Journal of Operational Research, 256, 1029-1037.
CAMERON, A. C. & TRIVEDI, P. K. 2009. Microeconometrics using stata, Stata Press
College Station, TX.
CHATEAU, J.-P. & WU, J. 2007. Basel-2 capital adequacy: Computing the ‘fair’capital
charge for loan commitment ‘true’credit risk. International Review of Financial
Analysis, 16, 1-21.
CHERNYKH, L. & COLE, R. A. 2011. Does deposit insurance improve financial
intermediation? Evidence from the Russian experiment. Journal of Banking &
Finance, 35, 388-402.
CHORTAREAS, G. E., GIRARDONE, C. & VENTOURI, A. 2012. Bank supervision,
regulation, and efficiency: Evidence from the European Union. Journal of Financial
Stability, 8, 292-302.
CHORTAREAS, G. E., GIRARDONE, C. & VENTOURI, A. 2013. Financial freedom and
bank efficiency: Evidence from the European Union. Journal of Banking & Finance,
37, 1223-1231.
ČIHÁK, M., DEMIRGÜÇ-KUNT, A., FEYEN, E. & LEVINE, R. 2012. Benchmarking
financial systems around the world. World Bank Policy Research Working Paper.
COLE, R. A. & GUNTHER, J. W. 1995. Separating the likelihood and timing of bank
failure. Journal of Banking & Finance, 19, 1073-1089.
CONSTANTINESCU, L. A. 2015. Challenges for Deposit Insurance and Financial Stability
in European Cooperative Banks. Knowledge Horizons. Economics, 7, 43.
CREEL, J., HUBERT, P. & LABONDANCE, F. 2015. Financial stability and economic
performance. Economic Modelling, 48, 25-40.
CROCKETT, A. 1997. Why is financial stability a goal of public policy? Economic Review-
Federal Reserve Bank of Kansas City, 82, 5.
CULL, R., SENBET, L. W. & SORGE, M. 2005. Deposit insurance and financial
development. Journal of Money, Credit and Banking, 43-82.
25
DAVIS, J. H., SCHOORMAN, F. D. & DONALDSON, L. 1997. Toward a stewardship
theory of management. Academy of Management review, 22, 20-47.
DELIS, M. 2015. Bank risk, financial stability, and the role of regulation. Journal of banking
and finance, 61, 1-2.
DEMIRG, XFC, XE, KUNT, A. & DETRAGIACHE, E. 1998. The Determinants of Banking
Crises in Developing and Developed Countries. Staff Papers (International Monetary
Fund), 45, 81-109.
DEMIRGÜÇ-KUNT, A. & DETRAGIACHE, E. 2002. Does deposit insurance increase
banking system stability? An empirical investigation. Journal of monetary economics,
49, 1373-1406.
DEMIRGÜÇ-KUNT, A. & DETRAGIACHE, E. 2011. Basel Core Principles and bank
soundness: Does compliance matter? Journal of Financial Stability, 7, 179-190.
DEMIRGÜÇ-KUNT, A. & HUIZINGA, H. 2010. Bank activity and funding strategies: The
impact on risk and returns. Journal of Financial Economics, 98, 626-650.
DEMIRGÜÇ-KUNT, A., KANE, E. J. & LAEVEN, L. 2008. Determinants of deposit-
insurance adoption and design. Journal of Financial Intermediation, 17, 407-438.
DEMSETZ, R. S. & STRAHAN, P. E. 1997. Diversification, size, and risk at bank holding
companies. Journal of money, credit, and banking, 300-313.
DEYOUNG, R. 1998. Management quality and X-inefficiency in national banks. Journal of
Financial Services Research, 13, 5-22.
DONALDSON, L. & DAVIS, J. H. 1991. Stewardship theory or agency theory: CEO
governance and shareholder returns. Australian Journal of management, 16, 49-64.
DYSON, R. G., ALLEN, R., CAMANHO, A. S., PODINOVSKI, V. V., SARRICO, C. S. &
SHALE, E. A. 2001. Pitfalls and protocols in DEA. European Journal of operational
research, 132, 245-259.
EMROUZNEJAD, A., ANOUZE, A. L. & THANASSOULIS, E. 2010. A semi-oriented
radial measure for measuring the efficiency of decision making units with negative
data, using DEA. European Journal of Operational Research, 200, 297-304.
EUROPEAN CENTRAL, B. 2005. Assessing financial stability: conceptual boundaries and
challenges.
FU, X. M., LIN, Y. R. & MOLYNEUX, P. 2014. Bank competition and financial stability in
Asia Pacific. Journal of Banking & Finance, 38, 64-77.
FURLONG, F. T. & KEELEY, M. C. 1989. Capital regulation and bank risk-taking: A note.
Journal of Banking & Finance, 13, 883-891.
GABAIX, X. & LANDIER, A. 2008. Why Has CEO Pay Increased so Much? The Quarterly
Journal of Economics, 123, 49-100.
GAMBACORTA, L. & MISTRULLI, P. E. 2004. Does bank capital affect lending behavior?
Journal of Financial intermediation, 13, 436-457.
GARRY, J. S. & SCHINASI, G. 2004. Defining financial stability. IMF Working Paper,
2004: 128-190.
HAAS, D. A. & MURPHY, F. H. 2003. Compensating for non-homogeneity in decision-
making units in data envelopment analysis. European Journal of Operational
Research, 144, 530-544.
HAFER, R. W. 2013. Economic freedom and financial development: International evidence.
Cato Journal, 33, 111-126.
HAHN, J. 1995. Bootstrapping quantile regression estimators. Econometric Theory, 11, 105-
121.
HAKENES, H. & SCHNABEL, I. 2011. Capital regulation, bank competition, and financial
stability. Economics Letters, 113, 256-258.
26
HANNAN, T. H. & HANWECK, G. A. 1988. Bank insolvency risk and the market for large
certificates of deposit. Journal of Money, Credit and Banking, 20, 203-211.
HOLLO, D., KREMER, M. & LO DUCA, M. 2012. CISS-a composite indicator of systemic
stress in the financial system.
IANNOTTA, G. 2007. Ownership structure, risk and performance in the European banking
industry. Journal of banking & finance, 31, 2127-2149.
ISSING, O. 2003. Monetary and financial stability: is there a trade-off? BIS Papers, 18, 16-
23.
JENSEN, M. C. 1986. Agency cost of free cash flow, corporate finance, and takeovers.
Corporate Finance, and Takeovers. American Economic Review, 76.
JIN, J. Y., KANAGARETNAM, K. & LOBO, G. J. 2011. Ability of accounting and audit
quality variables to predict bank failure during the financial crisis. Journal of Banking
& Finance, 35, 2811-2819.
JOKIPII, T. & MILNE, A. 2008. The cyclical behaviour of European bank capital buffers.
Journal of banking & finance, 32, 1440-1451.
KAUFMANN, D., KRAAY, A. & MASTRUZZI, M. 2011. The worldwide governance
indicators: methodology and analytical issues. Hague Journal on the Rule of Law, 3,
220-246.
KIM, D. & SANTOMERO, A. M. 1988. Risk in banking and capital regulation. The Journal
of Finance, 43, 1219-1233.
KIRKPATRICK, G. 2009. The corporate governance lessons from the financial crisis. OECD
Journal: Financial Market Trends, 2009, 61-87.
KLOMP, J. & DE HAAN, J. 2012. Banking risk and regulation: Does one size fit all?
Journal of Banking & Finance, 36, 3197-3212.
KÖHLER, M. 2015. Which banks are more risky? The impact of business models on bank
stability. Journal of Financial Stability, 16, 195-212.
KOUTSOMANOLI-FILIPPAKI, A. I. & MAMATZAKIS, E. C. 2011. Efficiency under
quantile regression: What is the relationship with risk in the EU banking industry?
Review of Financial Economics, 20, 84-95.
KUMAR, P. R. & RAVI, V. 2007. Bankruptcy prediction in banks and firms via statistical
and intelligent techniques–A review. European journal of operational research, 180,
1-28.
LAEVEN, L. & LEVINE, R. 2007. Is there a diversification discount in financial
conglomerates? Journal of Financial Economics, 85, 331-367.
LEE, B. S. & LI, M.-Y. L. 2012. Diversification and risk-adjusted performance: A quantile
regression approach. Journal of Banking & Finance, 36, 2157-2173.
LOAYZA, N. V. & RANCIERE, R. 2006. Financial development, financial fragility, and
growth. Journal of Money, Credit and Banking, 1051-1076.
MÄNNASOO, K. & MAYES, D. G. 2009. Explaining bank distress in Eastern European
transition economies. Journal of Banking & Finance, 33, 244-253.
MELECKY, M. & PODPIERA, A. M. 2013. Institutional structures of financial sector
supervision, their drivers and historical benchmarks. Journal of Financial Stability, 9,
428-444.
MERGAERTS, F. & VANDER VENNET, R. 2016. Business models and bank performance:
A long-term perspective. Journal of Financial Stability, 22, 57-75.
MIRZAEI, A. & MOORE, T. 2014. What are the driving forces of bank competition across
different income groups of countries? Journal of International Financial Markets,
Institutions and Money, 32, 38-71.
MURPHY, K. J. 1985. Corporate performance and managerial remuneration: An empirical
analysis. Journal of accounting and economics, 7, 11-42.
27
NSENGIYUMVA, J. 2016. Does Government Ownership Negatively Affect Soundness of
Banks? New Evidence. International Review of Management and Business Research,
5, 743.
PASIOURAS, F., GAGANIS, C. & ZOPOUNIDIS, C. 2006. The impact of bank regulations,
supervision, market structure, and bank characteristics on individual bank ratings: A
cross-country analysis. Review of Quantitative Finance and Accounting, 27, 403-438.
PASIOURAS, F., TANNA, S. & ZOPOUNIDIS, C. 2009. The impact of banking regulations
on banks' cost and profit efficiency: Cross-country evidence. International Review of
Financial Analysis, 18, 294-302.
POGHOSYAN, T. & ČIHÁK, M. 2009. Distress in European banks: An analysis based on a
new dataset. IMF Working Papers, 1-37.
RADIĆ, N., FIORDELISI, F. & GIRARDONE, C. 2012. Efficiency and risk-taking in pre-
crisis investment banks. Journal of Financial Services Research, 41, 81-101.
REPULLO, R. 2004. Capital requirements, market power, and risk-taking in banking.
Journal of financial Intermediation, 13, 156-182.
SANTOMERO, A. M. 1997. Deposit insurance: Do we need it and why?
SCHAECK, K. & CIHAK, M. 2012. Banking competition and capital ratios. European
Financial Management, 18, 836-866.
SHLEIFER, A. 1998. State versus private ownership. National bureau of economic research.
SHLEIFER, A. & VISHNY, R. W. 1994. Politicians and firms. The Quarterly Journal of
Economics, 995-1025.
STIGLITZ, J. E. 1993. The role of the state in financial markets. The World Bank Economic
Review, 7, 19-52.
TAN, Y. & FLOROS, C. 2012. Bank profitability and inflation: the case of China. Journal of
Economic Studies, 39, 675-696.
THANASSOULIS, E. 2001. Introduction to the theory and application of data envelopment
analysis, Springer.
UHDE, A. & HEIMESHOFF, U. 2009. Consolidation in banking and financial stability in
Europe: Empirical evidence. Journal of Banking & Finance, 33, 1299-1311.
VIVES, X. 2011. Competition and stability in banking. Central Banking, Analysis, and
Economic Policies Book Series, 16, 455-502.
WANKE, P., AZAD, M. A. K. & BARROS, C. P. 2016. Financial distress and the Malaysian
dual baking system: A dynamic slacks approach. Journal of Banking & Finance, 66,
1-18.
WANKE, P., BARROS, C. P. & FARIA, J. R. 2015. Financial distress drivers in Brazilian
banks: A dynamic slacks approach. European Journal of Operational Research, 240,
258-268.
WEN, S.-Y. & YU, J. 2013. Banking stability, market structure and financial system in
emerging countries. Journal of applied finance and Banking, 3, 1.
WINTON, A. 1995. Delegated monitoring and bank structure in a finite economy. Journal of
Financial Intermediation, 4, 158-187.
28
Table 1: Variables’ definitions and sources of data
Variables Definitions Sources
Dependent variables:
CAMELS This combination is applied as a proxy of financial
stability, with two inputs and four outputs as follows:
Authors’ estimation
based on Eq. (2)
Inputs:
Asset quality Loan loss provision (million/USD) BankScope
Management Total expenses (million/USD) BankScope
Outputs:
Capital adequacy Total equity (million/USD) BankScope
Earnings quality Total net income (million/USD) BankScope
Liquidity Liquid assets (million/USD) BankScope
Sensitivity of market risk
(size)
Total assets (million/USD) BankScope
Independent variables:
Core Profitability Model
(CPM)
The CPM consists of two cost inputs and two profit
outputs as follows:
Authors’ estimation
based on Eq. (2)
Inputs:
Cost1 Total interest expenses (million/USD) BankScope
Cost2 Non-interest expenses (million/USD) BankScope
Outputs:
Profit1 Gross interest dividend income (million/USD) BankScope
Profit2 Non-interest operating income (million/USD) BankScope
Capital regulation index This index is used to determine whether the capital
requirement reflects certain risk elements and deducts
certain market value losses from capital before
minimum capital adequacy is determined. Further,
certain funds, official or otherwise, may initially be
used to capitalise a bank. The index has a range of 0–
10, with higher values indicating greater stringency.
World Bank Survey
(Barth et al., 1999,
2003, 2007, 2012)
Activity
restrictions
Overall restrictions on banking activities such as
securities, insurance, and property activities. The
restrictions have a range of 0–12, with higher values
indicating greater restrictiveness.
World Bank Survey
(Barth et al., 1999,
2003, 2007, 2012)
Deposit
insurance
This variable is used to determine whether a deposit
insurance authority has the power to make a decision to
intervene in a bank and take legal action against a
bank’s directors or officials. The variable is also used
to establish whether a deposit insurance authority has
ever taken any legal action against bank directors or
officers. The range is 0–4, with higher values
indicating greater power.
World Bank Survey
(Barth et al., 1999,
2003, 2007, 2012)
29
Private
monitoring index
This index measures whether there are
incentives/ability to privately monitor companies. The
private monitoring index is composed of information
on: (I) compulsory external audits undertaken by
certified or licensed auditors, (ii) the percentage of the
10 biggest banks that are rated by international rating
agencies, (iii) the percentage of the 10 biggest banks
that are rated by domestic rating agencies, (iv) whether
depositors were fully compensated the last time a bank
failed by using a deposit insurance scheme, and (v)
whether income statements include accrued or
principal amounts for non-performing loans and
whether banks should provide consolidated financial
statements (Barth et al., 2013a).
The index has a range of 0–12, with higher values
indicating greater private monitoring.
World Bank Survey
(Barth et al., 1999,
2003, 2007, 2012)
Official
supervisory
power
This variable is used to determine whether the
supervisory authorities have the power to take specific
actions to prevent and correct problems. The range is
0–16, with higher values indicating greater power.
World Bank Survey
(Barth et al., 1999,
2003, 2007, 2012)
Independence of
supervisory
authority
The degree to which a supervisory authority is
independent of government and legally protected from
the banking industry. The values are 1–3, with higher
values indicating greater independence.
World Bank Survey
(Barth et al., 1999,
2003, 2007, 2012)
Government-
owned banks
The extent to which banking system's assets are
government owned.
World Bank Survey
(Barth et al., 1999,
2003, 2007, 2012)
Herfindahl-
Hirschman Index
(HHI)
A concentration index via the HHI Authors’ calculation
6 Governance
index
i) Voice and
accountability
This indicator measures the extent to which a country’s
citizens can participate in selecting their government,
and also measures freedom of expression, freedom of
association, and freedom of the media.
Worldwide
governance indicators
(WGI)
ii) Government
effectiveness
This indicator measures the quality of public services,
the quality of the civil service and the degree of its
independence from political pressure, the quality of
policy formulation and implementation, and the
credibility of a government’s commitment to such
policies.
WGI
iii)The rule of
law
This indicator measures the extent to which agents
have confidence in, and abide by, the rules of society,
particularly regarding the quality of contract
enforcement, the police, and the courts. This indicator
also measures the likelihood of crime and violence.
WGI
iv) Political
stability
This indicator measures perceptions of the likelihood
that a government will be destabilised or overthrown
by unconstitutional or violent means, including
political violence and terrorism.
WGI
v) Quality of
regulation
This indicator measures the ability of a government to
formulate and implement sound policies and regulation
that permit and promote market competition and
private sector development.
WGI
30
vi) Control of
corruption
This indicator measures the extent to which public
power is exercised for private gain, including both
petty and grand forms of corruption, as well as the
‘capturing’ of a state by an elite or private interests.
WGI
Log of gross
domestic product
(GDP)
The natural logarithm of GDP. World Development
Indicators (WDI)
Inflation The annual change in the consumer price index. WDI
Table 2: Summary Statistics
Variables Obs Mean Std Dev. Min. Max.
CAMELS (%): Stability 12444 52.33 23.85 16.6 100
CPM (%): Core Profitability Model 12444 52.65 14.99 0 100
Capital regulation index 12444 6.39 1.66 2 10
Activity restrictions 12294 5.84 1.24 0 10
Deposit Insurance 12294 1.10 0.92 0 4
Private monitoring index 12294 7.74 1.41 0 11
Official supervisory power 12294 10.48 2.43 2 15.5
Government-owned banks (%) 12267 17.68 17.71 0 75.2
HHI 12444 1801.50 1376.58 153.68 38261.89
Governance index 12411 69.89 26.06 14.13 108.98
Business freedom index 12302 65.01 9.83 36.6 82.6
GDP (%) 11508 3.13 3.58 -5.38 9.96
Inflation (%) 11204 4.61 4.29 -0.69 15.79
Sample period: 2000-2016. See Table 1 for detailed definition.
31
Table 3: Correlation matrix
Variables (1) (2) (3) (4) (5) (6) (7) (8) (9) (10) (11) (12) (13)
CAMELS (1) 1
CPM (2) 0.1872 1
Capital regulation index (3) 0.0139 0.0161 1
Activity restrictions (4) -0.0745 0.0002 -0.0326 1
Deposit insurance (5) -0.0631 -0.0833 0.2593 -0.0521 1
Private monitoring index (6) 0.0749 -0.011 -0.065 0.0312 -0.0792 1
Official supervisory power (7) -0.0014 -0.0506 0.1313 -0.0138 0.0627 0.0963 1
Government-owned banks (8) -0.2247 -0.0836 0.0687 -0.0666 0.0238 -0.1365 -0.0309 1
HHI (9) 0.1463 0.0956 -0.093 -0.0022 -0.2261 -0.0486 0.0056 -0.2842 1
Governance index (10) 0.3339 0.1673 -0.08 -0.1054 -0.1309 0.153 -0.0234 -0.5998 0.3872 1
Business freedom index (11) 0.3412 0.1528 -0.0455 -0.1338 -0.1367 0.2382 0.1132 -0.5113 0.2921 0.8872 1
GDP (12) -0.1219 -0.23 0.0316 -0.031 0.0635 -0.0068 0.0772 0.4711 -0.1967 -0.4057 -0.333 1
Inflation (13) -0.1955 -0.1128 0.1205 -0.0276 0.0639 -0.0924 -0.0539 0.5752 -0.1818 -0.6303 -0.5732 0.3969 1
32
Table 4 Main model with dependant variable CAMELS (Bank stability)
(1) (2) (3) (4) (5) (6)
Variables Q0.10 Q0.25 Q0.50 Q0.75 Q0.90 OLS
Lagged CAMELS 0.267*** 0.475*** 0.825*** 0.824*** 0.622*** 0.6083***
(0.0104) (0.0128) (0.0148) (0.00650) (0.0174) (0.0090)
CPM 0.0199** 0.0123 -0.0214* 0.0390*** 0.134*** 0.0307**
(0.00907) (0.00975) (0.0120) (0.0140) (0.0315) (0.0140)
Capital regulation index 0.174** 0.428*** 0.686*** 0.650*** 0.955*** 0.6029***
(0.0755) (0.0798) (0.0961) (0.110) (0.290) (0.1108)
Activity restrictions -0.201* -0.123 -0.219* -0.584*** -0.867** -0.4658***
(0.113) (0.107) (0.125) (0.142) (0.433) (0.1523)
Deposit insurance -0.237* -0.434*** -0.592*** -0.649*** -1.619*** -0.7275***
(0.142) (0.154) (0.169) (0.205) (0.513) (0.1955)
Private monitoring index -0.196** -0.296*** -0.339*** -0.563*** -0.671* 0.0517
(0.0845) (0.0844) (0.0890) (0.136) (0.389) (0.1274)
Official supervisory power -0.0461 -0.174*** -0.337*** -0.390*** -0.732*** -0.1588**
(0.0513) (0.0504) (0.0614) (0.0854) (0.190) (0.0728)
Government-owned banks -0.0273*** -0.0355*** -0.0438*** -0.0281* -0.0673* -0.0479***
(0.00897) (0.00849) (0.0111) (0.0160) (0.0381) (0.0131)
HHI 0.000477*** 0.000460** 0.000353** 0.000575*** 0.000840 0.0004**
(0.000119) (0.000187) (0.000159) (0.000152) (0.000555) (0.0002)
Business freedom index 0.161*** 0.200*** 0.222*** 0.197*** 0.462*** 0.2914***
(0.0184) (0.0202) (0.0222) (0.0249) (0.0752) (0.0250)
GDP 0.0862*** 0.212*** 0.266*** 0.210*** 0.192 0.2439***
(0.0298) (0.0328) (0.0459) (0.0643) (0.169) (0.0552)
Inflation -0.0492* -0.0357 -0.0514 -0.105*** 0.229 -0.0239
(0.0251) (0.0341) (0.0373) (0.0397) (0.150) (0.0414)
Constant 9.925*** 3.991** -1.603 9.849*** 16.21** 0.6939
(1.633) (1.559) (1.909) (2.401) (7.205) (2.2333)
Observations 10,998 10,998 10,998 10,998 10,998 10,998
R2 0.452
This table presents the QR estimates for our main sample. The dependent variable is bank stability based on CAMELS-DEA. The
quantiles are reported from columns 1 to 5. Bootstrapped standard errors are based on 1000 replications and are reported in
parentheses. *** represents p<0.01, ** represents p<0.05 and * represents p<0.1 across all quantiles. OLS regression is reported in
column 6 with heteroscedasticity-robust standard errors for OLS. ± F tests for the equality of the slope coefficient across various
quantiles have been undertaken and are significant at the 5% level for most quantiles; however, they are not reported in order to save
space. The details are available upon request from the authors.
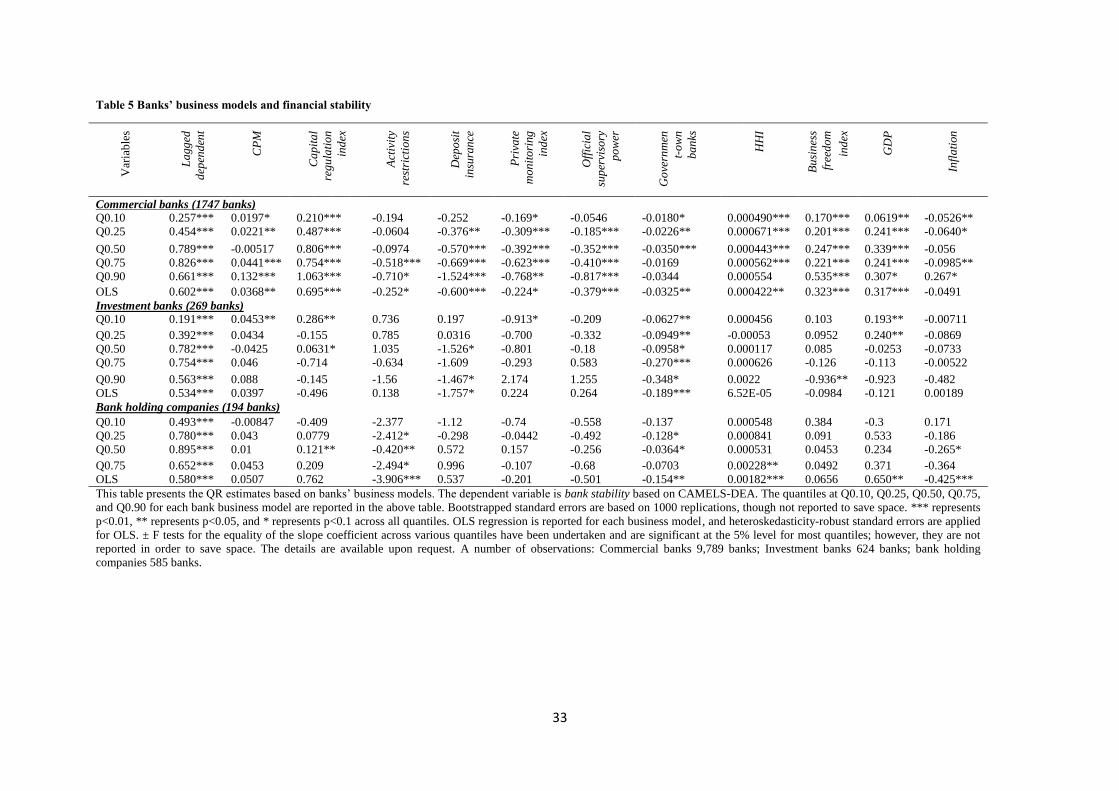
33
Table 5 Banks’ business models and financial stability
Var
iab
les
La
gg
ed
dep
end
ent
CP
M
Ca
pit
al
reg
ula
tio
n
ind
ex
Act
ivit
y
rest
rict
ion
s
Dep
osi
t
insu
ran
ce
Pri
vate
mo
nit
ori
ng
ind
ex
Off
icia
l
sup
ervi
sory
po
wer
Go
vern
men
t-o
wn
ba
nks
HH
I
Bu
sin
ess
free
do
m
ind
ex
GD
P
Infl
ati
on
Commercial banks (1747 banks)
Q0.10 0.257*** 0.0197* 0.210*** -0.194 -0.252 -0.169* -0.0546 -0.0180* 0.000490*** 0.170*** 0.0619** -0.0526**
Q0.25 0.454*** 0.0221** 0.487*** -0.0604 -0.376** -0.309*** -0.185*** -0.0226** 0.000671*** 0.201*** 0.241*** -0.0640*
Q0.50 0.789*** -0.00517 0.806*** -0.0974 -0.570*** -0.392*** -0.352*** -0.0350*** 0.000443*** 0.247*** 0.339*** -0.056
Q0.75 0.826*** 0.0441*** 0.754*** -0.518*** -0.669*** -0.623*** -0.410*** -0.0169 0.000562*** 0.221*** 0.241*** -0.0985**
Q0.90 0.661*** 0.132*** 1.063*** -0.710* -1.524*** -0.768** -0.817*** -0.0344 0.000554 0.535*** 0.307* 0.267*
OLS 0.602*** 0.0368** 0.695*** -0.252* -0.600*** -0.224* -0.379*** -0.0325** 0.000422** 0.323*** 0.317*** -0.0491
Investment banks (269 banks)
Q0.10 0.191*** 0.0453** 0.286** 0.736 0.197 -0.913* -0.209 -0.0627** 0.000456 0.103 0.193** -0.00711
Q0.25 0.392*** 0.0434 -0.155 0.785 0.0316 -0.700 -0.332 -0.0949** -0.00053 0.0952 0.240** -0.0869
Q0.50 0.782*** -0.0425 0.0631* 1.035 -1.526* -0.801 -0.18 -0.0958* 0.000117 0.085 -0.0253 -0.0733
Q0.75 0.754*** 0.046 -0.714 -0.634 -1.609 -0.293 0.583 -0.270*** 0.000626 -0.126 -0.113 -0.00522
Q0.90 0.563*** 0.088 -0.145 -1.56 -1.467* 2.174 1.255 -0.348* 0.0022 -0.936** -0.923 -0.482
OLS 0.534*** 0.0397 -0.496 0.138 -1.757* 0.224 0.264 -0.189*** 6.52E-05 -0.0984 -0.121 0.00189
Bank holding companies (194 banks)
Q0.10 0.493*** -0.00847 -0.409 -2.377 -1.12 -0.74 -0.558 -0.137 0.000548 0.384 -0.3 0.171
Q0.25 0.780*** 0.043 0.0779 -2.412* -0.298 -0.0442 -0.492 -0.128* 0.000841 0.091 0.533 -0.186
Q0.50 0.895*** 0.01 0.121** -0.420** 0.572 0.157 -0.256 -0.0364* 0.000531 0.0453 0.234 -0.265*
Q0.75 0.652*** 0.0453 0.209 -2.494* 0.996 -0.107 -0.68 -0.0703 0.00228** 0.0492 0.371 -0.364
OLS 0.580*** 0.0507 0.762 -3.906*** 0.537 -0.201 -0.501 -0.154** 0.00182*** 0.0656 0.650** -0.425***
This table presents the QR estimates based on banks’ business models. The dependent variable is bank stability based on CAMELS-DEA. The quantiles at Q0.10, Q0.25, Q0.50, Q0.75,
and Q0.90 for each bank business model are reported in the above table. Bootstrapped standard errors are based on 1000 replications, though not reported to save space. *** represents
p<0.01, ** represents p<0.05, and * represents p<0.1 across all quantiles. OLS regression is reported for each business model, and heteroskedasticity-robust standard errors are applied
for OLS. ± F tests for the equality of the slope coefficient across various quantiles have been undertaken and are significant at the 5% level for most quantiles; however, they are not
reported in order to save space. The details are available upon request. A number of observations: Commercial banks 9,789 banks; Investment banks 624 banks; bank holding
companies 585 banks.
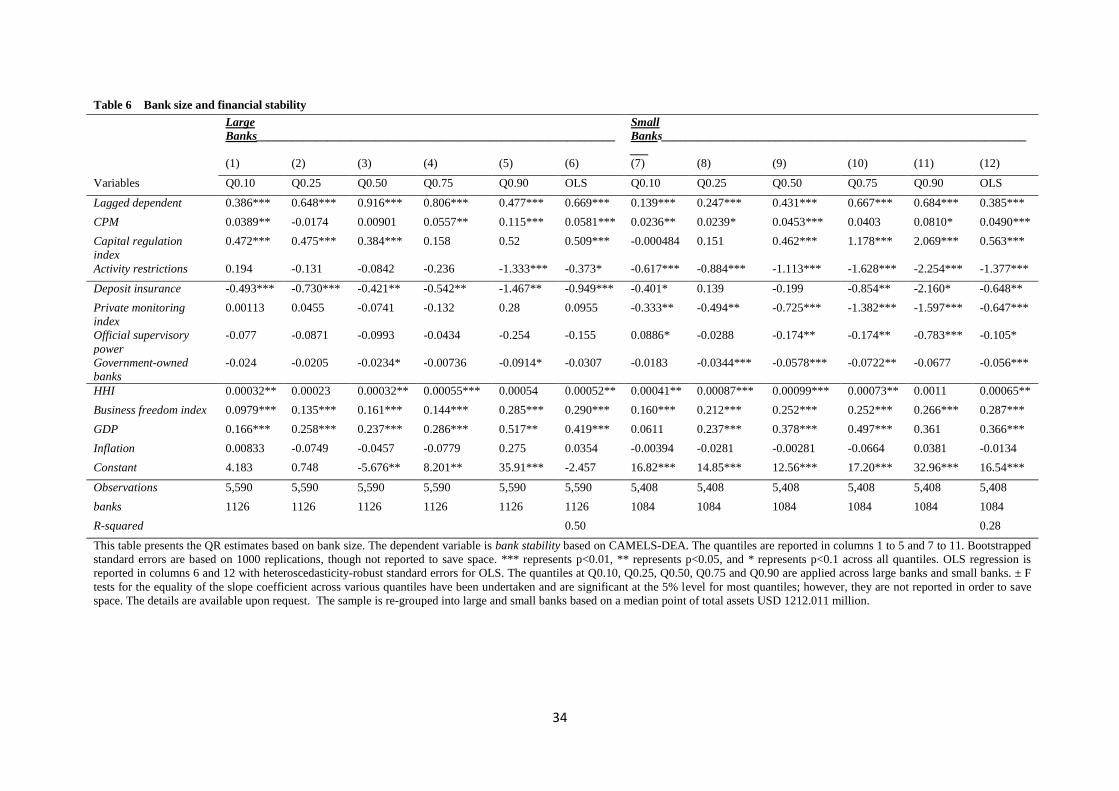
34
Table 6 Bank size and financial stability
Large
Banks____________________________________________________________
Small
Banks_____________________________________________________________
___ (1) (2) (3) (4) (5) (6) (7) (8) (9) (10) (11) (12)
Variables Q0.10 Q0.25 Q0.50 Q0.75 Q0.90 OLS Q0.10 Q0.25 Q0.50 Q0.75 Q0.90 OLS
Lagged dependent 0.386*** 0.648*** 0.916*** 0.806*** 0.477*** 0.669*** 0.139*** 0.247*** 0.431*** 0.667*** 0.684*** 0.385***
CPM 0.0389** -0.0174 0.00901 0.0557** 0.115*** 0.0581*** 0.0236** 0.0239* 0.0453*** 0.0403 0.0810* 0.0490***
Capital regulation
index
0.472*** 0.475*** 0.384*** 0.158 0.52 0.509*** -0.000484 0.151 0.462*** 1.178*** 2.069*** 0.563***
Activity restrictions 0.194 -0.131 -0.0842 -0.236 -1.333*** -0.373* -0.617*** -0.884*** -1.113*** -1.628*** -2.254*** -1.377***
Deposit insurance -0.493*** -0.730*** -0.421** -0.542** -1.467** -0.949*** -0.401* 0.139 -0.199 -0.854** -2.160* -0.648**
Private monitoring
index
0.00113 0.0455 -0.0741 -0.132 0.28 0.0955 -0.333** -0.494** -0.725*** -1.382*** -1.597*** -0.647***
Official supervisory
power
-0.077 -0.0871 -0.0993 -0.0434 -0.254 -0.155 0.0886* -0.0288 -0.174** -0.174** -0.783*** -0.105*
Government-owned
banks
-0.024 -0.0205 -0.0234* -0.00736 -0.0914* -0.0307 -0.0183 -0.0344*** -0.0578*** -0.0722** -0.0677 -0.056***
HHI 0.00032** 0.00023 0.00032** 0.00055*** 0.00054 0.00052** 0.00041** 0.00087*** 0.00099*** 0.00073** 0.0011 0.00065**
Business freedom index 0.0979*** 0.135*** 0.161*** 0.144*** 0.285*** 0.290*** 0.160*** 0.212*** 0.252*** 0.252*** 0.266*** 0.287***
GDP 0.166*** 0.258*** 0.237*** 0.286*** 0.517** 0.419*** 0.0611 0.237*** 0.378*** 0.497*** 0.361 0.366***
Inflation 0.00833 -0.0749 -0.0457 -0.0779 0.275 0.0354 -0.00394 -0.0281 -0.00281 -0.0664 0.0381 -0.0134
Constant 4.183 0.748 -5.676** 8.201** 35.91*** -2.457 16.82*** 14.85*** 12.56*** 17.20*** 32.96*** 16.54***
Observations 5,590 5,590 5,590 5,590 5,590 5,590 5,408 5,408 5,408 5,408 5,408 5,408
banks 1126 1126 1126 1126 1126 1126 1084 1084 1084 1084 1084 1084
R-squared 0.50 0.28
This table presents the QR estimates based on bank size. The dependent variable is bank stability based on CAMELS-DEA. The quantiles are reported in columns 1 to 5 and 7 to 11. Bootstrapped
standard errors are based on 1000 replications, though not reported to save space. *** represents p<0.01, ** represents p<0.05, and * represents p<0.1 across all quantiles. OLS regression is
reported in columns 6 and 12 with heteroscedasticity-robust standard errors for OLS. The quantiles at Q0.10, Q0.25, Q0.50, Q0.75 and Q0.90 are applied across large banks and small banks. ± F
tests for the equality of the slope coefficient across various quantiles have been undertaken and are significant at the 5% level for most quantiles; however, they are not reported in order to save
space. The details are available upon request. The sample is re-grouped into large and small banks based on a median point of total assets USD 1212.011 million.
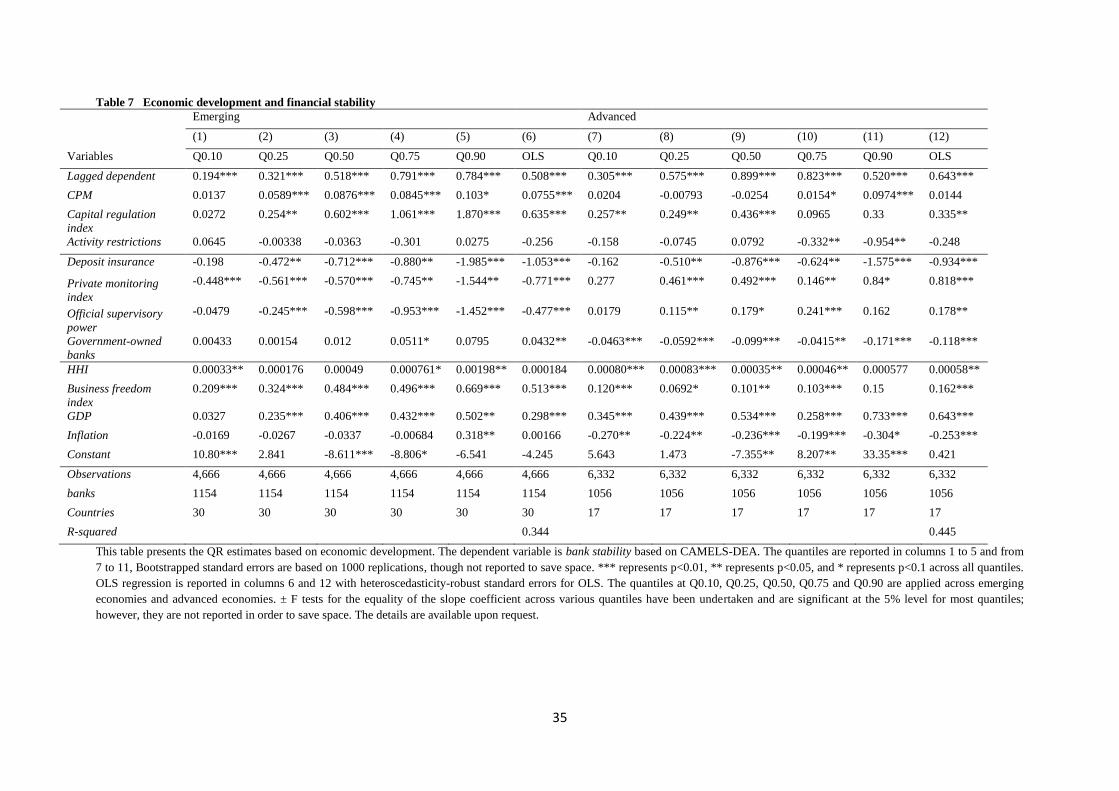
35
Table 7 Economic development and financial stability
Emerging Advanced
(1) (2) (3) (4) (5) (6) (7) (8) (9) (10) (11) (12)
Variables Q0.10 Q0.25 Q0.50 Q0.75 Q0.90 OLS Q0.10 Q0.25 Q0.50 Q0.75 Q0.90 OLS
Lagged dependent 0.194*** 0.321*** 0.518*** 0.791*** 0.784*** 0.508*** 0.305*** 0.575*** 0.899*** 0.823*** 0.520*** 0.643***
CPM 0.0137 0.0589*** 0.0876*** 0.0845*** 0.103* 0.0755*** 0.0204 -0.00793 -0.0254 0.0154* 0.0974*** 0.0144
Capital regulation
index
0.0272 0.254** 0.602*** 1.061*** 1.870*** 0.635*** 0.257** 0.249** 0.436*** 0.0965 0.33 0.335**
Activity restrictions 0.0645 -0.00338 -0.0363 -0.301 0.0275 -0.256 -0.158 -0.0745 0.0792 -0.332** -0.954** -0.248
Deposit insurance -0.198 -0.472** -0.712*** -0.880** -1.985*** -1.053*** -0.162 -0.510** -0.876*** -0.624** -1.575*** -0.934***
Private monitoring
index
-0.448*** -0.561*** -0.570*** -0.745** -1.544** -0.771*** 0.277 0.461*** 0.492*** 0.146** 0.84* 0.818***
Official supervisory
power
-0.0479 -0.245*** -0.598*** -0.953*** -1.452*** -0.477*** 0.0179 0.115** 0.179* 0.241*** 0.162 0.178**
Government-owned
banks
0.00433 0.00154 0.012 0.0511* 0.0795 0.0432** -0.0463*** -0.0592*** -0.099*** -0.0415** -0.171*** -0.118***
HHI 0.00033** 0.000176 0.00049 0.000761* 0.00198** 0.000184 0.00080*** 0.00083*** 0.00035** 0.00046** 0.000577 0.00058**
Business freedom
index
0.209*** 0.324*** 0.484*** 0.496*** 0.669*** 0.513*** 0.120*** 0.0692* 0.101** 0.103*** 0.15 0.162***
GDP 0.0327 0.235*** 0.406*** 0.432*** 0.502** 0.298*** 0.345*** 0.439*** 0.534*** 0.258*** 0.733*** 0.643***
Inflation -0.0169 -0.0267 -0.0337 -0.00684 0.318** 0.00166 -0.270** -0.224** -0.236*** -0.199*** -0.304* -0.253***
Constant 10.80*** 2.841 -8.611*** -8.806* -6.541 -4.245 5.643 1.473 -7.355** 8.207** 33.35*** 0.421
Observations 4,666 4,666 4,666 4,666 4,666 4,666 6,332 6,332 6,332 6,332 6,332 6,332
banks 1154 1154 1154 1154 1154 1154 1056 1056 1056 1056 1056 1056
Countries 30 30 30 30 30 30 17 17 17 17 17 17
R-squared 0.344 0.445
This table presents the QR estimates based on economic development. The dependent variable is bank stability based on CAMELS-DEA. The quantiles are reported in columns 1 to 5 and from
7 to 11, Bootstrapped standard errors are based on 1000 replications, though not reported to save space. *** represents p<0.01, ** represents p<0.05, and * represents p<0.1 across all quantiles.
OLS regression is reported in columns 6 and 12 with heteroscedasticity-robust standard errors for OLS. The quantiles at Q0.10, Q0.25, Q0.50, Q0.75 and Q0.90 are applied across emerging
economies and advanced economies. ± F tests for the equality of the slope coefficient across various quantiles have been undertaken and are significant at the 5% level for most quantiles;
however, they are not reported in order to save space. The details are available upon request.
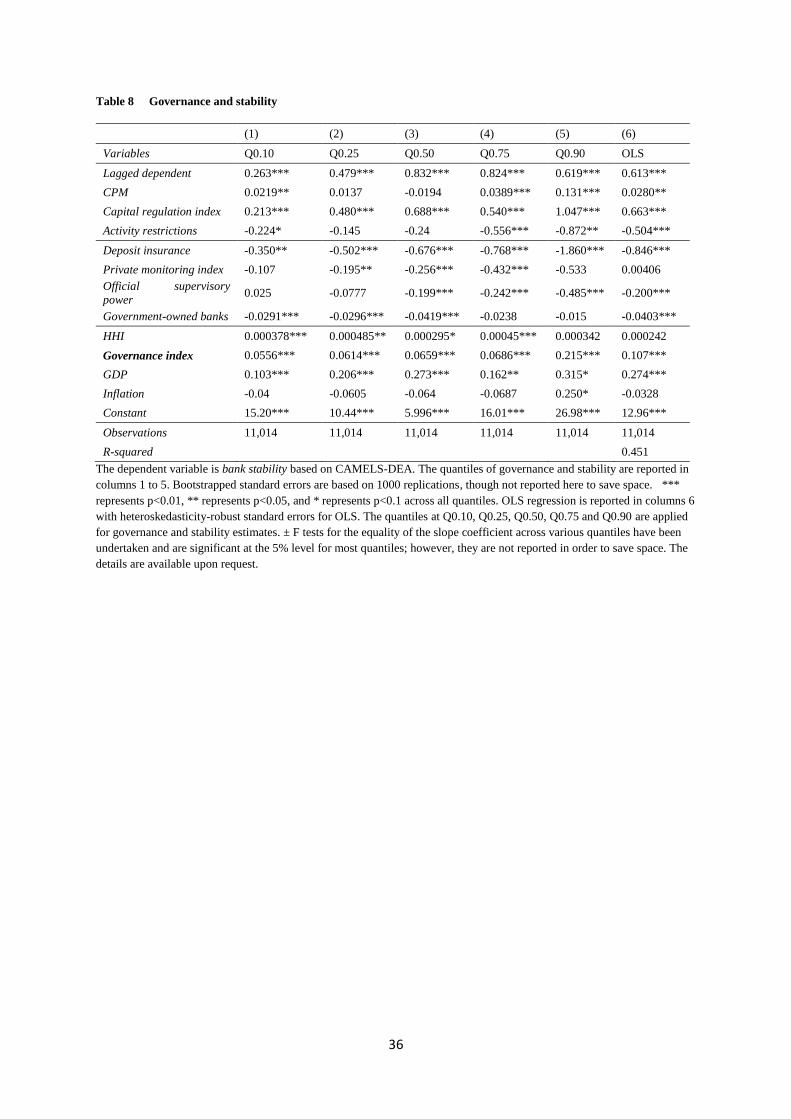
36
Table 8 Governance and stability
(1) (2) (3) (4) (5) (6)
Variables Q0.10 Q0.25 Q0.50 Q0.75 Q0.90 OLS
Lagged dependent 0.263*** 0.479*** 0.832*** 0.824*** 0.619*** 0.613***
CPM 0.0219** 0.0137 -0.0194 0.0389*** 0.131*** 0.0280**
Capital regulation index 0.213*** 0.480*** 0.688*** 0.540*** 1.047*** 0.663***
Activity restrictions -0.224* -0.145 -0.24 -0.556*** -0.872** -0.504***
Deposit insurance -0.350** -0.502*** -0.676*** -0.768*** -1.860*** -0.846***
Private monitoring index -0.107 -0.195** -0.256*** -0.432*** -0.533 0.00406
Official supervisory
power 0.025 -0.0777 -0.199*** -0.242*** -0.485*** -0.200***
Government-owned banks -0.0291*** -0.0296*** -0.0419*** -0.0238 -0.015 -0.0403***
HHI 0.000378*** 0.000485** 0.000295* 0.00045*** 0.000342 0.000242
Governance index 0.0556*** 0.0614*** 0.0659*** 0.0686*** 0.215*** 0.107***
GDP 0.103*** 0.206*** 0.273*** 0.162** 0.315* 0.274***
Inflation -0.04 -0.0605 -0.064 -0.0687 0.250* -0.0328
Constant 15.20*** 10.44*** 5.996*** 16.01*** 26.98*** 12.96***
Observations 11,014 11,014 11,014 11,014 11,014 11,014
R-squared 0.451
The dependent variable is bank stability based on CAMELS-DEA. The quantiles of governance and stability are reported in
columns 1 to 5. Bootstrapped standard errors are based on 1000 replications, though not reported here to save space. ***
represents p<0.01, ** represents p<0.05, and * represents p<0.1 across all quantiles. OLS regression is reported in columns 6
with heteroskedasticity-robust standard errors for OLS. The quantiles at Q0.10, Q0.25, Q0.50, Q0.75 and Q0.90 are applied
for governance and stability estimates. ± F tests for the equality of the slope coefficient across various quantiles have been
undertaken and are significant at the 5% level for most quantiles; however, they are not reported in order to save space. The
details are available upon request.
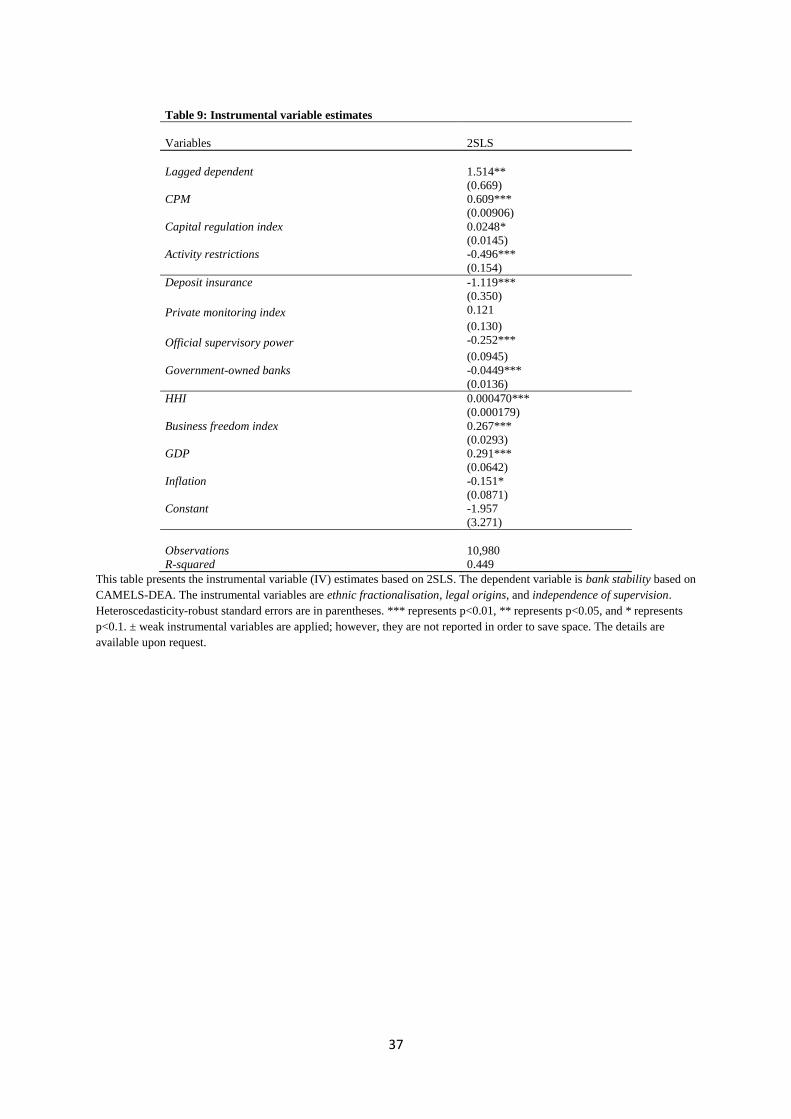
37
Table 9: Instrumental variable estimates
Variables 2SLS
Lagged dependent 1.514**
(0.669)
CPM 0.609***
(0.00906)
Capital regulation index 0.0248*
(0.0145)
Activity restrictions -0.496***
(0.154)
Deposit insurance -1.119***
(0.350)
Private monitoring index 0.121
(0.130)
Official supervisory power -0.252***
(0.0945)
Government-owned banks -0.0449***
(0.0136)
HHI 0.000470***
(0.000179)
Business freedom index 0.267***
(0.0293)
GDP 0.291***
(0.0642)
Inflation -0.151*
(0.0871)
Constant -1.957
(3.271)
Observations 10,980
R-squared 0.449
This table presents the instrumental variable (IV) estimates based on 2SLS. The dependent variable is bank stability based on
CAMELS-DEA. The instrumental variables are ethnic fractionalisation, legal origins, and independence of supervision.
Heteroscedasticity-robust standard errors are in parentheses. *** represents p<0.01, ** represents p<0.05, and * represents
p<0.1. ± weak instrumental variables are applied; however, they are not reported in order to save space. The details are
available upon request.
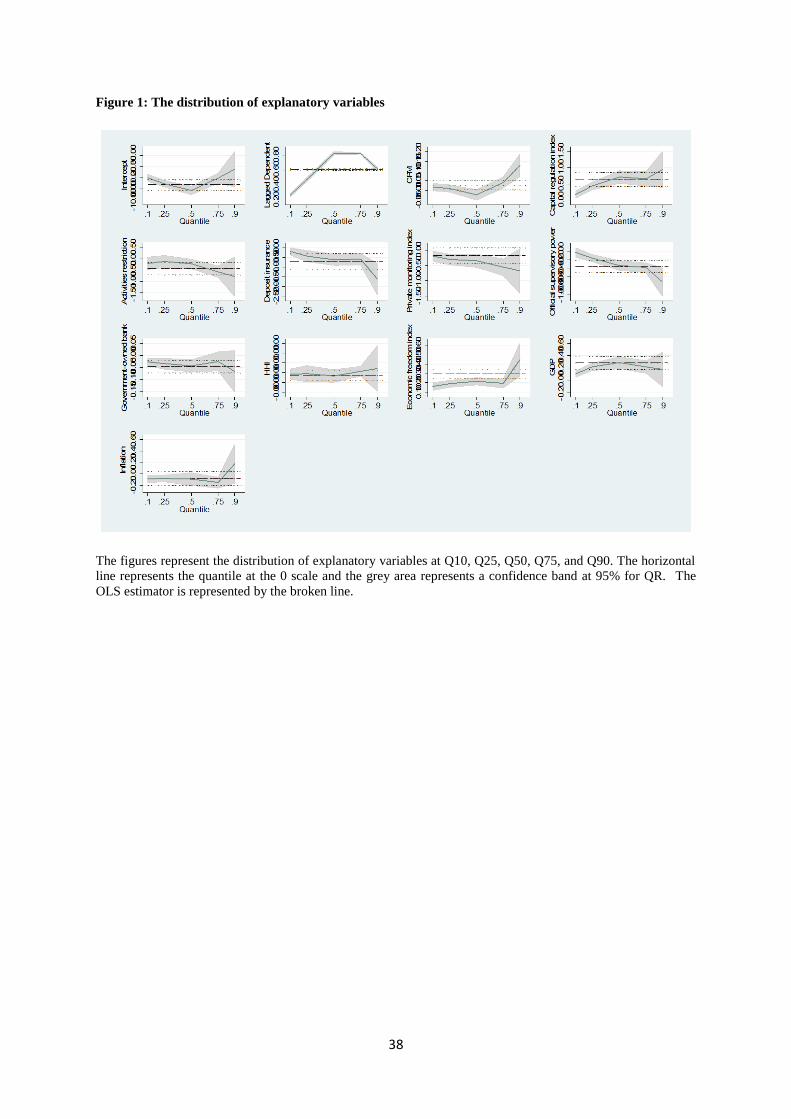
38
Figure 1: The distribution of explanatory variables
The figures represent the distribution of explanatory variables at Q10, Q25, Q50, Q75, and Q90. The horizontal
line represents the quantile at the 0 scale and the grey area represents a confidence band at 95% for QR. The
OLS estimator is represented by the broken line.