Embed Size (px)
Citation preview
Prepared for: Pacific Gas & Electric Company
Research and Development Department 3400 Crow Canyon Road
San Ramon, CA 94583
Investigation Of The AC2 Air Conditioner
Project Manager: Lance Elberling, P.E.
Final Report, December 30, 1998
Prepared by: Proctor Engineering Group
Contributors: Tom Downey
John Proctor, P.E.
© 1998, Pacific Gas & Electric Company- All Rights Reserved
legal Notice
This report was prepared by Pacific Gas and Electric Company for exclusive use by its employees and agents. Neither Pacific Gas and Electric Company nor any of its employees and agents: (1) makes any written or oral warranty, expressed or implied, including, but not limited to those
concerning merchantability or fitness for a particular purpose; (2) assumes any legal liability or responsibility for the accuracy, completeness, or usefulness of any
information, apparatus, product, process, method, or policy contained herein; or (3) represents that its use would not infringe any privately owned rights, including, but not limited to,
patents, trade marks, or copyrights.
TABLE OF CONTENTS
EXECUTIVE SUMl\fARY .•.......•..........•.......•..•...••...•..•...•.••..••••••..•.•...•..•••••..•••...........••.•..•••......••..•••......•••••.•..•••..•..•....•.••. i
I. INTRODUCTION ...•..•...•.....•........•..•••.•...•••.•••...••.•.•.•..•......•.••.••...•••.•..•.•••••..•••....••..•...••..•....•••.•.•.••.•...•.••••••••..•.•••••.•• 1-1
BACKGROUND ................................................................................................................................................................... 1-1
PROJECT HISTORY····························································································································································· 1-1 PURPOSE ............................................................................................................................................................................ 1-2
AC2 TECHNOLOGY DESCRIPTION····································································································································· 1-2 DEFINITIONS AND CONVENTIONS ...................................................................................................................................... 1-3
II. METHODOLOGY •...••.•••.....••••....•.•.........••....•.••.••......•...•.••.•.•...••....•..••..•••••••••..•.•...•••....••..•.•••.•••.•••••••••••••••.••••.••...•• 2-1
SITE SELECTION ................................................................................................................................................................ 2-1 Target Site Characteristics ........................................................................................................................................... 2-1 Water Quality Concerns and Site Selection .................................................................................................................. 2-1 House Recruitment ........................................................................................................................................................ 2-3 On-Site House Screening .............................................................................................................................................. 2-3 Sample House Characteristics ...................................................................................................................................... 2-5
EQUIPMENT SELECTION ..................................................................................................................................................... 2-6 Heat Gain Calculations ................................................................................................................................................ 2-6 Equipment Sizing .......................................................................................................................................................... 2-7
DATA ACQUISITION SYSTEM············································································································································· 2-8 Data Point Description and Sensor Specifications ....................................................................................................... 2-9
REDUCING POTENTIAL MEASUREMENT ERROR ............................................................................................................... 2-10 CALCULATIONS ............................................................................................................................................................... 2-10
System Peiformance ................................................................................................................................................... 2-10 System Degradation .................................................................................................................................................... 2-11 Water Consumption .................................................................................................................................................... 2-12
COMPARISONS TO AR1 CONDITIONS DATA ..................................................................................................................... 2-12 PEG3 lNTERACTNEMODEL ........................................................................................................................................... 2-12
Air Conditioner Performance Modeling ..................................................................................................................... 2-12 Duct Efficiency Modeling ........................................................................................................................................... 2-13 Energy Usage Modeling ............................................................................................... , ............................................. 2-13 Summary of Model Inputs ........................................................................................................................................... 2-13 Model Verification ...................................................................................................................................................... 2-15
ill. INSTALLATIONS I FIELD EXPERIENCE ....•..••.....•...•••..•..••..•••..•.•••..•...••••....••••.•....•...••.•.•••.•••..••.••••••••••.•..•...• 3-1
Initial Comments --AC2 Design Changes .................................................................................................................... 3-1 INSTALLATION ................................................................................................................................................................... 3-2
Contractor Selection ..................................................................................................................................................... 3-2 Site Details .............................................................. : ..................................................................................................... 3-2
CONCORD ................................................................................................................................................................................... 3-2 FRESN0 ....................................................................................................................................................................................... 3-2 AUBURN ..................................................................................................................................................................................... 3-2 TRAC¥ ......................................................................................................................................................................................... 3-3 DAVIS .......................................................................................................................................................................................... 3-3
Factory Quality Control ............................................................................................................................................... 3-3 .Training and Documentation ........................................................................................................................................ 3-4
TRAINING METHODOLOGY ................................................................................................................................................... 3-4 AC2 INSTALLATION DOCUMENTATION ............................................................................................................................. 3-4 OTHER TRAINING ISSUES ....................................................................................................................................................... 3-5
Time Requirements ................................................................................................................................................... , ... 3-5
RELIABILITY ........ ······ .............................................................................................. ············ .............................................. 3-6 Site Details .................................................................................................................................................................... 3-6
CONCORD ................................................................................................................................................................................... 3-6 FRESN0 ....................................................................................................................................................................................... 3-7 AUBURN ..................................................................................................................................................................................... 3-7 TRACY ......................................................................................................................................................................................... 3-7 DAVIS .......................................................................................................................................................................................... 3-8
CUSTOMER SATISFACTION AND SYSTEM RETENTION ........................................................................................................ 3-9 LESSONS ILLUSTRATED ..................................................................................................................................................... 3-9
Proper Installation ........................................................................................................................................................ 3-9 Installation Design and Equipment Selection ............................................................................................................. 3-10 Training, Documentation, and Field Quality Assurance ............................................................................................ 3-10 Manufacturer Quality Assurance .............................................................................................................................. 3-310
IV. RESULTS ................................................................................................................................................................. 4-1
TOTAL CAPACITY .............................................................................................................................................................. 4-1 SENSIBLE CAPACITY .......................................................................................................................................................... 4-1 ENERGY EFFICIENCY RATIO .............................................................................................................................................. 4-3 CORRECTING DATA FOR AIR COOLED CONDENSER UNITS ................................................................................................ 4-5 CYCLING SENSIBLE EER ......................................................... ··········· ............................................................................... 4-6 SENSIBLE COOLING LOAD ................................................................................................................................................. 4-8 DEGRADATION .................................................................................................................................................................. 4-9 WATER USE ..................................................................................................................................................................... 4-11 INTERACTIVE MODELING OF AC, DUCT SYSTEM, AND COOLING LOADS ........................................................................ 4-11 TRAcY PERFORMANCE .................................................................................................................................................... 4-12
V. CONCLUSIONS AND RECOMMENDATIONS ................................................................................................... 5-1
CONCLUSIONS ................................................................................................................................................................... 5-l RECOMMENDATIONS ......................................................................................................................................................... 5-3
APPENDIX A-PALIN INDEX CALCULATION ..................................................................................................... A-1
APPENDIX B --RECRUITMENT SURVEY, SITE TESTING, AND DATA ACQUISITION FORM ................. B-1
APPENDIX C --TEST SITE HOUSE CHARACTERISTICS ................................................................................... C-1
CONCORD .................................................................................................................................................................................. C-1 FRESNO ...................................................................................................................................................................................... C-1 AUBURN .................................................................................................................................................................................... C-2 TRACY ........................................................................................................................................................................................ C-2 DAVIS ......................................................................................................................................................................................... C-3
APPENDIX D --EQUIPMENT SELECTION ............................................................................................................. D-1
Manufacturers' Data Refinements ................................................................................................................................ D-1
APPENDIX E --INDIVIDUAL SITE DATA SlJMMARIES ..................................................................................... E-1
APPENDIX F -- GLOSSARY ........................................................................................................................................ F-1
APPENDIX G- COMPREHENSIVE MODEL RESULTS ...................................................................................... G-1
APPENDIX H --REFERENCES ................................................................................................................................. H-1
LIST OF TABLES
TABLE 2-1. PALIN INDEX SCALE ............................................................................................................................ 2-2
TABLE 2-2. WATER QUALITY ANALYSIS RESULTS .......................................................................................... 2-3
TABLE 2-3. HOUSE SCREENING TESTS & DATA ACQUISITION .................................................................... 2-5
TABLE 2-4. BUILDING HEAT GAIN BY COMPONENT ....................................................................................... 2-6
TABLE 2-5. COMPARISON OF DESIGN LOAD AND EQUIPMENT CAPACITY AT ARI CONDITIONS .•.. 2-8
TABLE 2-6. COMPARISON OF SIZING METHODOLOGY TOTAL CAP A CITY VS. RULE OF THUMB .... 2-8
TABLE 2-7. DATA POINTS, SENSOR TYPE & LOCATION ................................................................................. 2-9
TABLE 2-8. MODEL INPUTS .................................................................................................................................... 2-14
TABLE 4-1. DOE ASSUMED VS. ACTUAL FAN WATT DRAW ........................................................................... 4-4
TABLE 4-2. ENERGY SAVINGS AND PEAK REDUCTION BY OUTSIDE TEMPERATURE ......................... 4-7
TABLE 4-3. DESIGN SENSffiLE LOAD VS. MANUAL 1 ........................................................................................ 4-8
TABLE 4-4. DEGRADATION MEASUREMENTS .................................................................................................... 4-9
TABLE 4-5. PERFORMANCE CHANGE ESTIMATES DUE TO OUTSIDE COIL ........................................... 4-10
TABLE 4-6. WATER USE ........................................................................................................................................... 4-11
TABLE 4-7. AC2 ENERGY SAVINGS PREDICTIONS FROM COMPREHENSIVE MODEL ........................ 4-12
TABLE D-1. ACCAMANUAL S DATA INTERPRETATION ISSUES .................................................................. D-2
TABLE G-1. PERCENTAGE COOLING ENERGY SAVINGS- FRESNO WEATHER .................................... G-1
TABLE G-2. PERCENTAGE COOLING ENERGY SAVINGS -SACRAMENTO WEATHER ....................... G-2
LIST OF FIGURES
FIGURE 4-1. STEADY STATE TOTAL CAPACITY-- AUBURN .•..•..•••.•..••••.••.•••••.•........•.•••••••••••••••••••••••..•..••••••• 4-1
FIGURE 4-2. CYCLIN"G SENSffiLE CAP A CITY- CONCORD •.••••.••.•••.••••..••...••..•••••••••••.••..•.•.•.•....••••••..•.•.•••..•.. 4-2
FIGURE 4-3. STEADY STATE EER- DAVIS •..•..•..•......•.•.•...•••••.••.•..•.•...••••••••....•..••••.•••.•.••.••••••.••••.••...•..•••.••.•••••••• 4-3
FIGURE 4-4. MEASURED STEADY STATE EER VS. CORRECTED ARI EER- FRESNO ............................ 4-4
FIGURE 4-5. PUBLISHED EER VS. CORRECTED EER --TYPICAL SEER 10 UNIT ••••••••••..•..•.•..••..•..•••.•.•.••.• 4-5
FIGURE 4-6. CYCLIN"G SENSffiLE EER- AC2 UNITS VS. TYPICAL SEER 10 AND SEER 12 UNITS •••.••.• 4-7
FIGURE 4-7. STEADY STATE EER- TRACY •.•.•.•..•.•.•.••..••..•....•...••...•..••...•...•.••...•••...•..•...••.•.••••..•...••..••.••••••••.•.• 4-13
EXECUTIVE SUMMARY
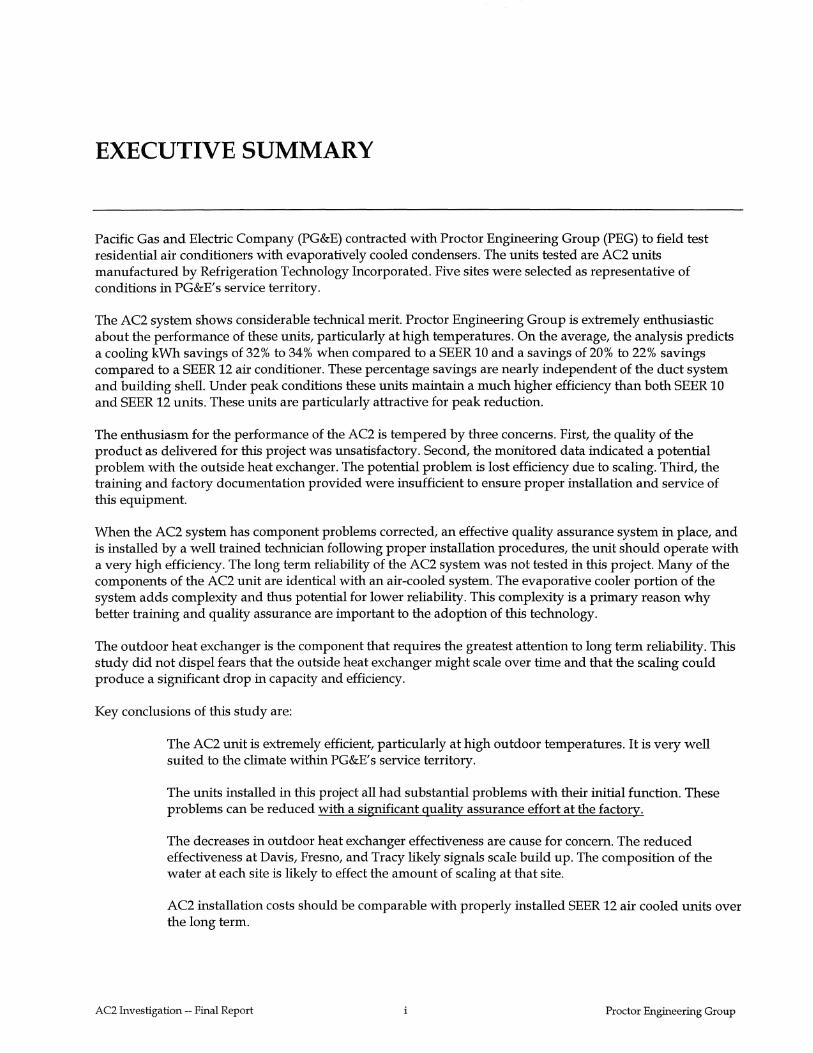
Pacific Gas and Electric Company (PG&E) contracted with Proctor Engineering Group (PEG) to field test residential air conditioners with evaporatively cooled condensers. The units tested are AC2 units manufactured by Refrigeration Technology Incorporated. Five sites were selected as representative of conditions in PG&E's service territory.
The AC2 system shows considerable technical merit. Proctor Engineering Group is extremely enthusiastic about the performance of these units, particularly at high temperatures. On the average, the analysis predicts a cooling kWh savings of 32% to 34% when compared to a SEER 10 and a savings of 20% to 22% savings compared to a SEER 12 air conditioner. These percentage savings are nearly independent of the duct system and building shell. Under peak conditions these units maintain a much higher efficiency than both SEER 10 and SEER 12 units. These units are particularly attractive for peak reduction.
The enthusiasm for the performance of the AC2 is tempered by three concerns. First, the quality of the product as delivered for this project was unsatisfactory. Second, the monitored data indicated a potential problem with the outside heat exchanger. The potential problem is lost efficiency due to scaling. Third, the training and factory documentation provided were insufficient to ensure proper installation and service of this equipment.
When the AC2 system has component problems corrected, an effective quality assurance system in place, and is installed by a well trained technician following proper installation procedures, the unit should operate with a very high efficiency. The long term reliability of the AC2 system was not tested in this project. Many of the components of the AC2 unit are identical with an air-cooled system. The evaporative cooler portion of the system adds complexity and thus potential for lower reliability. This complexity is a primary reason why better training and quality assurance are important to the adoption of this technology.
The outdoor heat exchanger is the component that requires the greatest attention to long term reliability. This study did not dispel fears that the outside heat exchanger might scale over time and that the scaling could produce a significant drop in capacity and efficiency.
Key conclusions of this study are:
The AC2 unit is extremely efficient, particularly at high outdoor temperatures. It is very well suited to the climate within PG&E' s service territory.
The units installed in this project all had substantial problems with their initial function. These problems can be reduced with a significant quality assurance effort at the factory.
The decreases in outdoor heat exchanger effectiveness are cause for concern. The reduced effectiveness at Davis, Fresno, and Tracy likely signals scale build up. The composition of the water at each site is likely to effect the amount of scaling at that site.
AC2 installation costs should be comparable with properly installed SEER 12 air cooled units over the long term.
AC2 Investigation-- Final Report Proctor Engineering Group
Executive Summary
Air conditioners sized to meet Manual J calculated loads will produce cooling capacity in excess of the needs of the house.
The AC2 manufacturer's suggestion that the air conditioners be sized by square footage encourages oversizing and unnecessarily increases the first cost of the air conditioner as well as of the duct system.
The manufacturer must increase the effectiveness of the installation and service technician training as well as printed installation instructions.
Key recommendations of this study are:
Any PG&E promotion of the AC2 units should be tied to quality assurance at two levels: Manufacturer -- product function, training, documentation, and technical support; Contractor-certifying proper sizing, brazing, evacuation, charge, and air flow.
The AC2 undergo continuous testing with both scaling water and corrosive water similar to that found in approximately 2% of the water supplies.
PG&E investigate and promote lower watt draw fan/motor/ air distribution systems with particular attention to inlet and exit conditions as well as low static pressure.
PG&E investigate the effects of smaller refrigerant line sizes on air conditioner performance.
AC2 Investigation-- Final Report ii Proctor Engineering Group
I. INTRODUCTION
Background
Pacific Gas and Electric (PG&E) has been looking into the potential of evaporatively cooled residential air conditioners for several years. Cooling towers and direct evaporative condensers are common in large commercial and industrial applications. The energy benefits of large commercial and industrial evaporatively cooled condensers are well known. The same benefits apply to the residential and small commercial applications.
The primary benefit is the reduced watt draw and increased capacity associated with lower operating compressor discharge temperatures. Evaporatively cooled condensers are affected by the ambient wet bulb temperature. Since the amount of moisture in the air remains relatively stable, the wet bulb temperatures swing less than dry bulb temperatures. As a result, these systems are less affected by large swings in the dry bulb temperature. The use of evaporatively cooled condensers is particularly well suited for dry climates, such as PG&E' s service territory.
The use of evaporatively cooled water as a heat sink for the condenser has several advantages:
1. Better heat transfer-- Water's heat transfer characteristics are far superior to those of air.
2. Better compressor efficiency-- The volumetric efficiency of compressors, and capacity of the system, are greatly increased with the lower condenser operating temperatures.
3. Lower amperage and watt draw-- The improved volumetric efficiency of the compressor allows the compressor to be downsized. The smaller compressor provides a lower wattage input and reduced connected load.
Several versions of evaporatively cooled residential air conditioners have been experimented with over the . years, but with little success or market acceptance. The most common of these are the pre-cooler methodologies. This approach uses conventional air-cooled condensers supplied with air cooled through an evaporative media or mist The main problem with these systems has been poor reliability. The misters tend to become clogged or mis-aligned and the metal condenser fins experience a high degree of scaling.
The AC2 with its condenser coil to water heat exchange has the potential to provide better performance and market acceptance. PG&E wished to perform a field test to determine the differences between the AC2 and conventional systems.
Project History
Starting in 1996, PG&E conducted laboratory testing on evaporatively cooled condenser air conditioning systems. The objectives of the tests were to establish the performances of conventional and evaporatively cooled residential air conditioners. Most recently, the laboratory testing covered four units. Two of the units were conventional air-cooled condensers, a "base case" SEER 10 system and a SEER 12 system. Two of the systems were evaporatively cooled condensers, produced by Bacchus Industries, Inc. Bacchus was later bought out by Refrigeration Technology, Inc., the current manufacturer of the AC2 air conditioner.
AC2 Investigation-- Final Report 1-1 Proctor Engineering Group
Introduction
The two evaporatively cooled systems represent the first and second generation model of the AC2 system. The first system was called the EvapCon. The EvapCon system was a conventional condenser inside an evaporative cooler. This allowed the air to be pre-cooled before entering the condenser. The second generation model, the AC2, used conventional evaporative cooler technology with the refrigerant condenser coil located in the evaporative water sump.
The PG&E laboratory tests looked at system performance under both steady state and cycling conditions (cycling run time fractions of 57%, 50%, and 25% ). The units were tested at four outdoor temperatures 85°F, 95°F, 105°F, and 115°F. The indoor temperature was held constant at 80°F with relative humidity in the 30% to 40% range. Additionally, the outdoor relative humidity was varied in some additional steady-state tests for the evaporatively cooled condensers. Forty or more tests were performed on each system.
The PG&E laboratory testing results indicated that the AC2 unit could provide the same amount of cooling as the SEER 10 unit for about half the outdoor unit power.
Purpose
PG&E contracted with Proctor Engineering Group (PEG) to implement a field test of the AC2 technology. The project design called for installation and monitoring of five AC2 systems over one summer at various sites within PG&E's service territory. The project was designed to obtain data necessary to answer questions concerning:
• Efficiency -- how do the systems' performances in actual installations compare to the laboratory results?
• Reliability-- how reliable are the systems and what, if any, are the potential problems with system reliability?
• Water quality -- does the condenser coil experience scaling when exposed to poor water quality, and how does it effect system performance?
• Installation- what is the installation cost additions and can these be reduced? what difficulties are experienced?
AC2 Technology Description
The AC2 air conditioner is produced by Refrigeration Technology, Inc., (RTI), of Sunland Park, New Mexico. The AC2 system utilizes traditional refrigerant-based direct-expansion cooling technology. The system uses the same components found in other residential AC systems; for example: scroll compressor, contactor, condenser fan, etc. The system uses a standard furnace or air handler and evaporator coils for the indoor section. The AC2 is designed for split system applications in the 2 to 5 ton range.
The AC2 air conditioner employs condenser coils immersed in a sump located at the base of the unit. The sump water is passed through a medium and air is drawn through the medium, thus cooling the water by evaporation. The immersed coil is able to reject heat much more effectively than an air-cooled condenser resulting in greater unit efficiency.
AC2 Investigation-- Final Report 1-2 Proctor Engineering Group
Introduction
Definitions and Conventions
In this report, the following definitions and conventions apply:
• All temperatures are in op; • When the moisture content of the air is important (such as indoor conditions), the dry bulb
temperature is listed first and the wet bulb temperature second (e.g. so 167 is soop dry bulb and 67°F wet bulb);
• Unit watt draw is the watt draw of the air conditioner including indoor fan, outdoor fan, pumps, and compressor;
• Entering air conditions are the air conditions prior to the indoor fan and motor;
• Capacity is the amount of energy (Btu/hr) removed from the air stream measured from before the indoor fan to after the indoor coil;
• EER is the capacity (Btujhr) divided by the unit watt draw.
AC2 Investigation - Final Report 1-3 Proctor Engineering Group
II. METHODOLOGY
Proctor Engineering Group performed a field test of the AC2 technology. The field test consisted of site selection, equipment sizing, installation and service monitoring, as well as intensive performance monitoring over one summer.
Site Selection
Proctor Engineering Group consulted with PG&E staff to determine criteria for inclusion in the sample. The final selection procedure assessed both the housing type and climate zone. PEG collaborated with PG&E in recruiting, selecting and securing agreements for the five houses used as test sites.
Target Site Characteristics
PG&E determined the ideal housing types representative of typical California housing stock. The houses targeted were:
• Post 1980 construction 1761 ft2 standard CEC house
• Post 1980 construction 1800 ft2 single story
• Post 1980 construction 2000 ft2 two story
• Post 1980 construction 2500 ft2 two story
• Pre 1976 construction 1800 ft2 single story
PG&E targeted locations were representative of the climatic regions in PG&E's service territory. The areas selected and the reasons for their inclusion were:
• Concord/Walnut Creek-- representative of hot bay area/ delta locations
• Fresno - representative of hot central valley locations
• Sierra Foothills -- representative of hot foothills locations with little nighttime cooling
• Stockton/Sacramento -representative of hot upper central valley locations
• Poor Water Quality Site -- chosen because of the scaling characteristics of the water supply
Water Quality Concerns and Site Selection
One goal of the research was to examine AC2 systems installed in areas with potentially scaling water. The concern is that solids in the water might deposit on the coil located in the sump and reduce heat transfer. The concern was that AC2 units would experience rapid degradation of performance due to condenser coil fouling.
RTI acknowledges that mineral build up or corrosion can be concerns. According to RTI' s literature, these concerns have been addressed by:
1. Designing the system to fully purge the contents of the sump once every eight hours of compressor operation to prevent heavy concentrations of minerals in the water.
AC2 Investigation- Final Report 2-1 Proctor Engineering Group
Methodology
2. Providing a condenser coil with a wall thickness of 0.32 compared to the 0.12 common on air-cooled condensers.
3. Ensuring the coil is fully submerged in water during operation. This prevents contact with the air and greatly slows the corrosion process.
4. Utilizing a helical coil that naturally expands and contracts with temperature changes and tends to break loose and shed mineral deposits.
5. Recommending annual servicing of the AC2 unit, including the flushing of the sump j coil to remove mineral deposits.
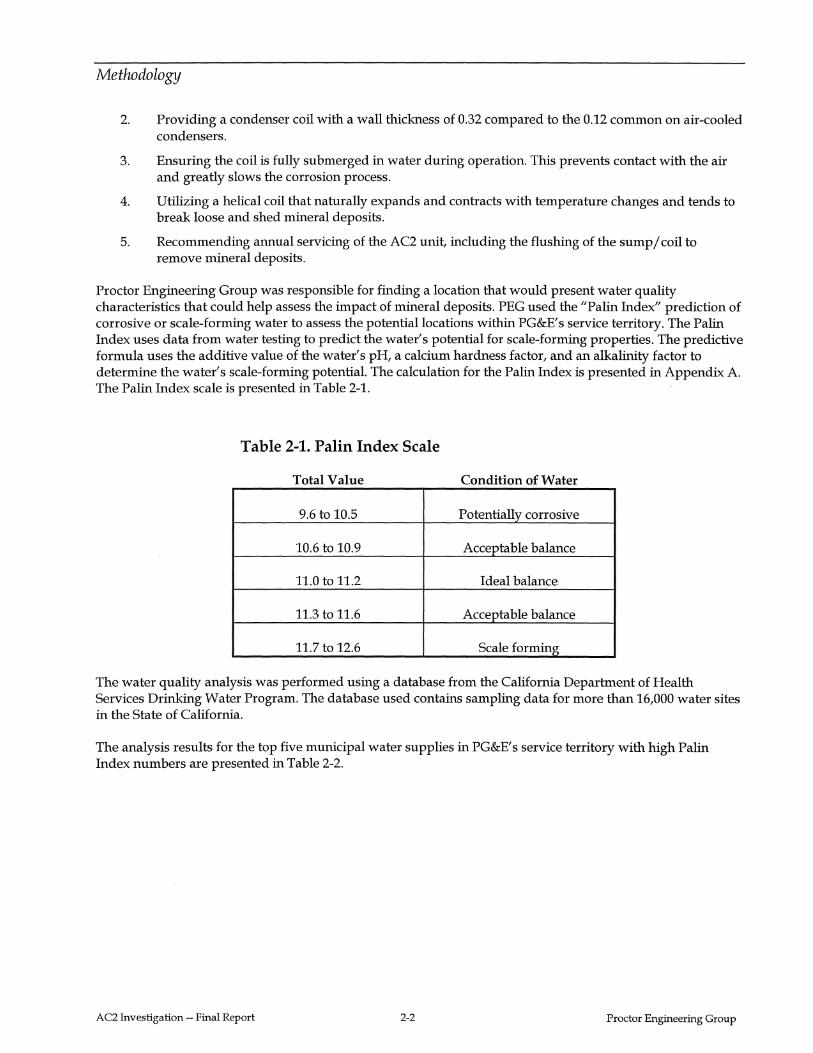
Proctor Engineering Group was responsible for finding a location that would present water quality characteristics that could help assess the impact of mineral deposits. PEG used the "Palin Index" prediction of corrosive or scale-forming water to assess the potential locations within PG&E' s service territory. The Palin Index uses data from water testing to predict the water's potential for scale-forming properties. The predictive formula uses the additive value of the water's pH, a calcium hardness factor, and an alkalinity factor to determine the water's scale-forming potential. The calculation for the Palin Index is presented in Appendix A. The Palin Index scale is presented in Table 2-1.
Table 2-1. Palin Index Scale
Total Value Condition of Water
9.6 to 10.5 Potentially corrosive
10.6 to 10.9 Acceptable balance
11.0 to 11.2 Ideal balance
11.3 to 11.6 Acceptable balance
11.7 to 12.6 Scale forming
The water quality analysis was performed using a database from the California Department of Health Services Drinking Water Program. The database used contains sampling data for more than 16,000 water sites in the State of California.
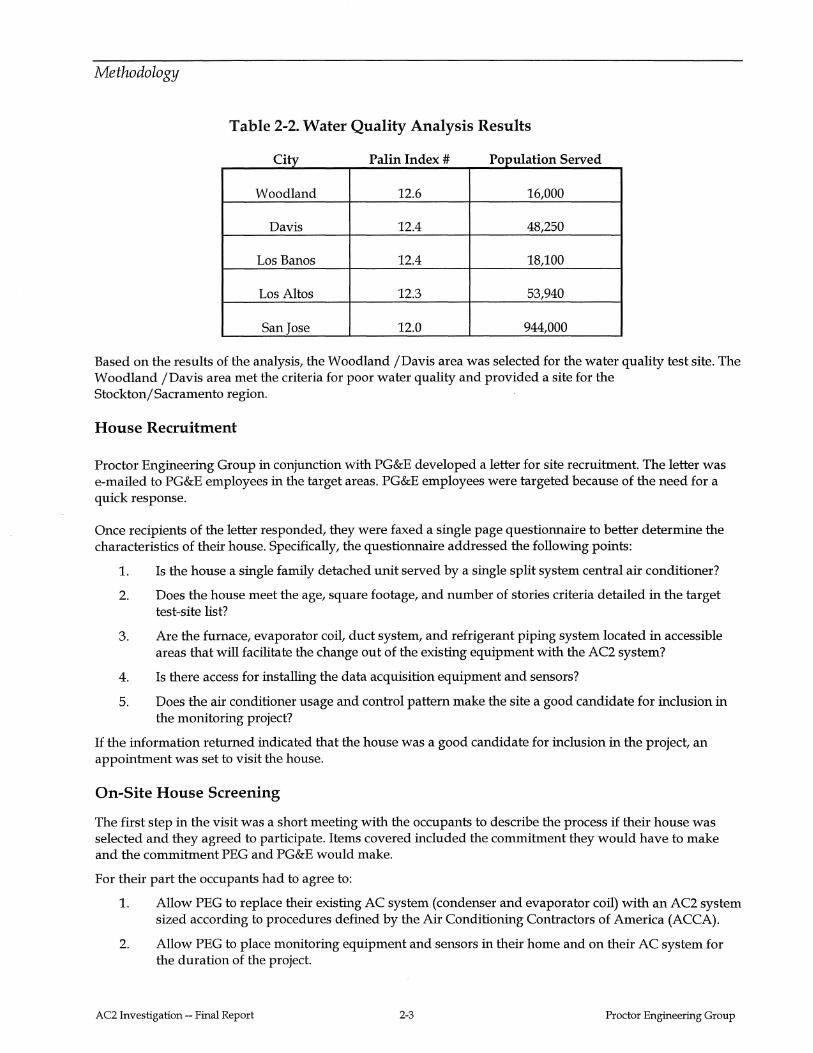
The analysis results for the top five municipal water supplies in PG&E' s service territory with high Palin Index numbers are presented in Table 2-2.
AC2 Investigation-- Final Report 2-2 Proctor Engineering Group
Methodology
Table 2-2. Water Quality Analysis Results
City Palin Index # Population Served
Woodland 12.6 16,000
Davis 12.4 48,250
Los Banos 12.4 18,100
Los Altos 12.3 53,940
San Jose 12.0 944,000
Based on the results of the analysis, the Woodland /Davis area was selected for the water quality test site. The Woodland /Davis area met the criteria for poor water quality and provided a site for the Stockton/ Sacramento region.
House Recruitment
Proctor Engineering Group in conjunction with PG&E developed a letter for site recruitment. The letter was e-mailed to PG&E employees in the target areas. PG&E employees were targeted because of the need for a quick response.
Once recipients of the letter responded, they were faxed a single page questionnaire to better determine the characteristics of their house. Specifically, the questionnaire addressed the following points:
1. Is the house a single family detached unit served by a single split system central air conditioner?
2. Does the house meet the age, square footage, and number of stories criteria detailed in the target test-site list?
3. Are the furnace, evaporator coil, duct system, and refrigerant piping system located in accessible areas that will facilitate the change out of the existing equipment with the AC2 system?
4. Is there access for installing the data acquisition equipment and sensors?
5. Does the air conditioner usage and control pattern make the site a good candidate for inclusion in the monitoring project?
If the information returned indicated that the house was a good candidate for inclusion in the project, an appointment was set to visit the house.
On-Site House Screening
The first step in the visit was a short meeting with the occupants to describe the process if their house was selected and they agreed to participate. Items covered included the commitment they would have to make and the commitment PEG and PG&E would make.
For their part the occupants had to agree to:
1. Allow PEG to replace their existing AC system (condenser and evaporator coil) with an AC2 system sized according to procedures defined by the Air Conditioning Contractors of America (ACCA).
2. Allow PEG to place monitoring equipment and sensors in their home and on their AC system for the duration of the project.
AC2 Investigation-- Final Report 2-3 Proctor Engineering Group
Methodology
3. Provide PEG personnel access to the property, AC system, and monitoring equipment.
4. Use and operate the AC2 system, as they normally would use their old AC system.
5. Notify PEG of any changes in the use of property or any changes in occupancy (including extended vacations) that would significantly affect the amount or pattern of energy use.
In exchange for their willingness to participate PG&E and PEG agreed to provide them with a properly sized AC2 system, free of charge. PEG also agreed to perform any enhancements necessary to obtain acceptable levels of duct leakage and airflow through the evaporator coil.
During the visit to the house PEG performed a screening of the house's suitability for the project. This screening consisted of a physical check to confirm if:
• the house met the age, square footage, number of stories, and other criteria
• the air conditioner was a split system and the condenser location was acceptable
• there was a way to run new refrigerant and water lines to the AC2
• there was access to allow wires to be run from the monitoring equipment to the sensors
• the evaporator coil could be replaced
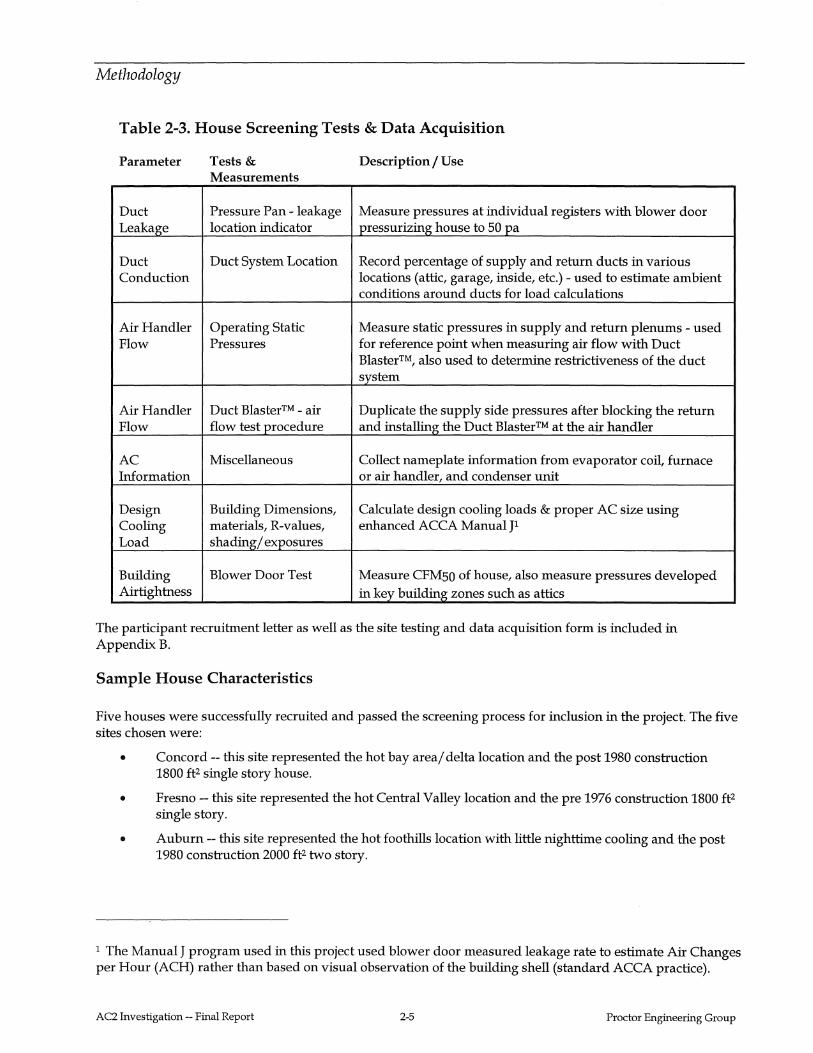
Once the determination had been made that the house was a good candidate for successful installation of the AC2 unit, testing and data gathering were performed. Table 2-3 presents the testing and data acquisition that took place.
AC2 Investigation-- Final Report 2-4 Proctor Engineering Group
Methodology
Table 2-3. House Screening Tests & Data Acquisition
Parameter
Duct Leakage
Duct Conduction
Air Handler Flow
Air Handler Flow
AC Information
Design Cooling Load
Building Airtightness
Tests & Measurements
Pressure Pan - leakage location indicator
Duct System Location
Operating Static Pressures
Duct Blaster™ - air flow test procedure
Miscellaneous
Building Dimensions, materials, R-values, shading/exposures
Blower Door Test
Description I Use
Measure pressures at individual registers with blower door pressurizing house to 50 pa
Record percentage of supply and return ducts in various locations (attic, garage, inside, etc.)- used to estimate ambient conditions around ducts for load calculations
Measure static pressures in supply and return plenums - used for reference point when measuring air flow with Duct Blaster™, also used to determine restrictiveness of the duct system
Duplicate the supply side pressures after blocking the return and installing the Duct Blaster™ at the air handler
Collect nameplate information from evaporator coil, furnace or air handler, and condenser unit
Calculate design cooling loads & proper AC size using enhanced ACCA Manual p
Measure CFMso of house, also measure pressures developed in key building zones such as attics
The participant recruitment letter as well as the site testing and data acquisition form is included in Appendix B.
Sample House Characteristics
Five houses were successfully recruited and passed the screening process for inclusion in the project. The five sites chosen were:
• Concord --this site represented the hot bay area/ delta location and the post 1980 construction 1800 ft2 single story house.
• Fresno-- this site represented the hot Central Valley location and the pre 1976 construction 1800 ft2 single story.
• Auburn - this site represented the hot foothills location with little nighttime cooling and the post 1980 construction 2000 ft2 two story.
1 The Manual J program used in this project used blower door measured leakage rate to estimate Air Changes per Hour (ACH) rather than based on visual observation of the building shell (standard ACCA practice).
AC2 Investigation - Final Report 2-5 Proctor Engineering Group
Methodology
• Tracy -- this site represented the hot upper Central Valley location and the post 1980 construction 2500 ft2 two story.
• Davis - this site represented a scaling water quality location.
The five sites are detailed in Appendix C.
Equipment Selection
The Air Conditioning Contractors of America (ACCA) has developed a method of calculating the heating and cooling loads of buildings and selecting the right equipment to meet those loads. Proctor Engineering Group follows the suggested ACCA procedures in sizing heating and cooling equipment.
Heat Gain Calculations
ACCA Manual J was used in this project to determine the cooling loads of the houses. Manual J is a standard reference for estimating the design load for residential air conditioning systems. Manual J calculates the total building heat gain as a sum of the heat gains through the building envelope and internal gains. The Manual J calculations require detailed information on house characteristics; for example: glazing type, area, orientation, exterior surface insulation R-values, etc.
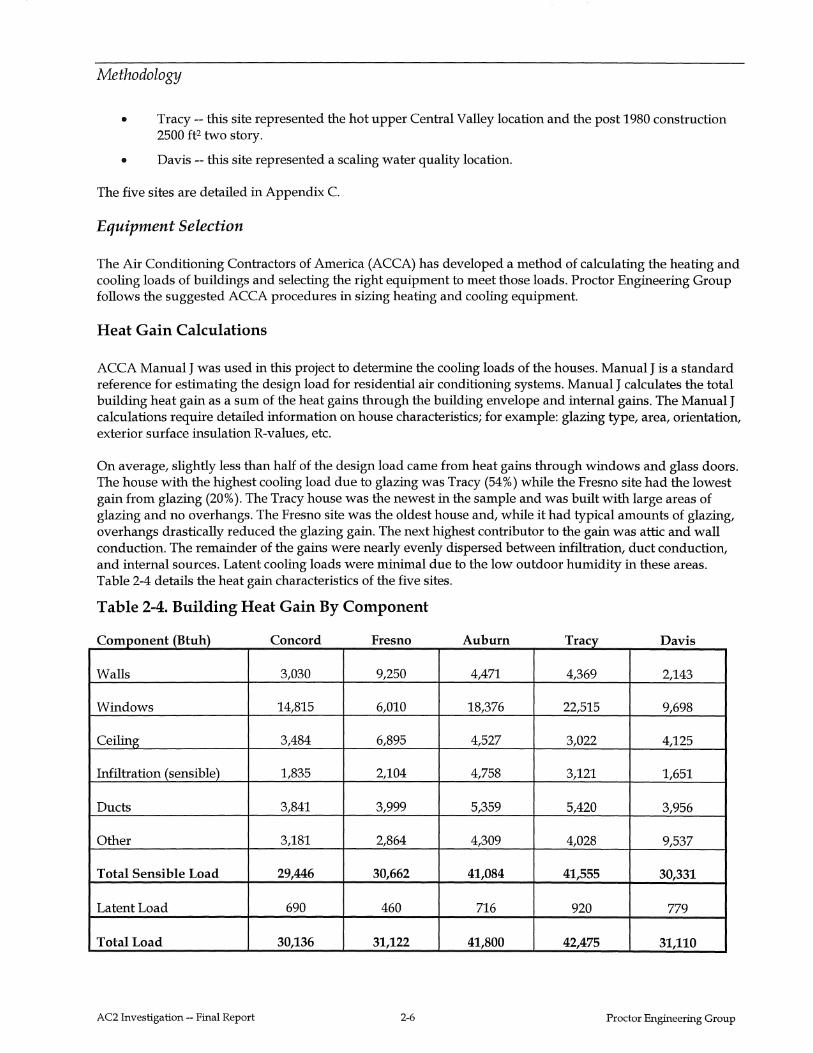
On average, slightly less than half of the design load came from heat gains through windows and glass doors. The house with the highest cooling load due to glazing was Tracy (54%) while the Fresno site had the lowest gain from glazing (20% ). The Tracy house was the newest in the sample and was built with large areas of glazing and no overhangs. The Fresno site was the oldest house and, while it had typical amounts of glazing, overhangs drastically reduced the glazing gain. The next highest contributor to the gain was attic and wall conduction. The remainder of the gains were nearly evenly dispersed between infiltration, duct conduction, and internal sources. Latent cooling loads were minimal due to the low outdoor humidity in these areas. Table 2-4 details the heat gain characteristics of the five sites.
Table 2-4. Building Heat Gain By Component
Component (Btuh) Concord Fresno Auburn Tracy Davis
Walls 3,030 9,250 4,471 4,369 2,143
Windows 14,815 6,010 18,376 22,515 9,698
Ceiling 3,484 6,895 4,527 3,022 4,125
Infiltration (sensible) 1,835 2,104 4,758 3,121 1,651
Ducts 3,841 3,999 5,359 5,420 3,956
Other 3,181 2,864 4,309 4,028 9,537
Total Sensible Load 29,446 30,662 41,084 41,555 30,331
Latent Load 690 460 716 920 779
Total Load 30,136 31,122 41,800 42,475 31,110
AC2 Investigation - Final Report 2-6 Proctor Engineering Group
Methodology
Equipment Sizing
ACCA provides Manual S, a methodology for selecting equipment to meet the load of the house based on the Manual J results and the detailed unit performance information provided by the equipment manufacturers. The Manual S selection method, like most selection methods, requires substantial interpretation of manufacturers' data. Manual S is hard to apply with data supplied by most manufacturers and the AC2 units were no exception. Appendix D contains a detailed discussion of ACCA Manual S procedures and the problems associated with the current state of manufacturers' data.
RTI (the manufacturer of the AC2) tests, certifies, and provides capacity/ efficiency data for their equipment matched with ADP coils. The local AC2 distributor does not carry ADP coils. This forced the project to follow the same route as installation contractors- installation of an after-market evaporator coil. The distributor recommended Superior brand coils. Like other after-market evaporator coil manufacturers, Superior provided only a total capacity estimate at ARI conditions. To apply ManualS, sensible and latent capacities across a range of indoor conditions, outdoor conditions, and air flows are necessary.
Proctor Engineering Group contacted RTI for assistance. The technical assistance personnel at RTI could not provide detailed data for the AC2 with Superior coils. RTI suggested sizing the systems using a "ru1e of thumb". They suggested one ton of nominal capacity for every 400 square feet of living space if the house was old or had a lot of high ceilings, or one ton for every 500 square feet if the house was newer construction. Past research (Proctor and Katsnelson, 1995) has shown the rule of thumb to be very inaccurate and PEG rejected the suggestion.
Because of the lack of available data, PEG was unable to use ACCA ManualS for equipment selection.
Prior research in PG&E' s service territory has shown that sizing a residential central air conditioner to the total capacity (sum of sensible and latent capacities) at design can provide resu1ts similar to ManualS. See page 8-3 of the PG&E Sizing Report (Proctor and Katsnelson, 1995) for more details.
Because of the lack of data available for ManualS application, the Design Total Load sizing method was used in this project.
The AC2 unit is unique because its capacity is almost completely independent of the outdoor dry bu1b temperature. Its performance is determined by the outdoor wet bulb temperature (which influences the sump temperature). For areas with higher wet bulb temperatures RTI should provide performance at a variety of outdoor wet bu1b temperatures. Their current data are for 75 and 80 wet bulb.
For equipment sizing in this project, the listed total capacity at ARI conditions provided by the Superior Coils company was used as the total capacity of the unit at design conditions. The following considerations led to this decision:
1. The capacity of the AC2 unit is nearly independent of the outdoor drybu1b.
2. The design outdoor wet bulb in all locations is less than the 75 wet bu1b test conditions listed in RTI' s data. This would produce a somewhat oversized unit.
3. The Superior Coil capacities were not significantly different from the AC2 data with the ADP coils.
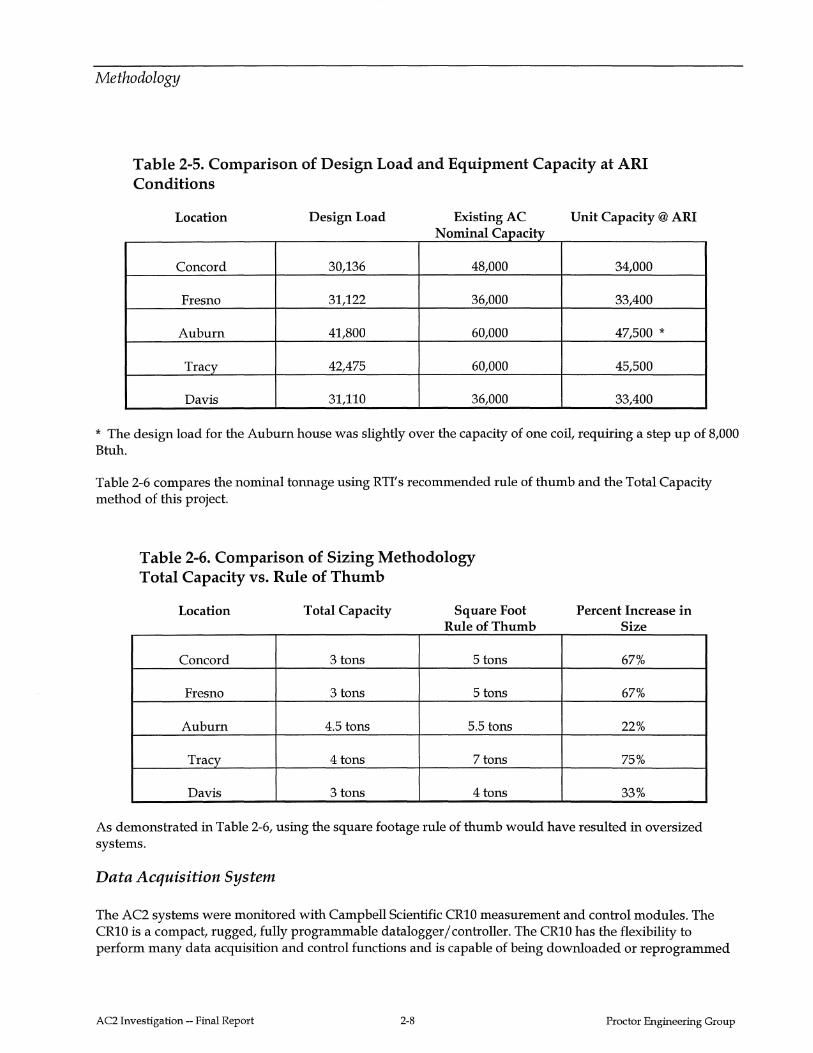
PEG picked the condenser and evaporator coil combination that was the first unit to exceed the total design load. Table 2-5 presents the results of the equipment selection for each location.
AC2 Investigation-- Final Report 2-7 Proctor Engineering Group
Methodology
Table 2-5. Comparison of Design Load and Equipment Capacity at ARI Conditions
Location Design Load Existing AC Unit Capacity @ ARI Nominal Capacity
Concord 30,136 48,000 34,000
Fresno 31,122 36,000 33,400
Auburn 41,800 60,000 47,500 *
Tracy 42,475 60,000 45,500
Davis 31,110 36,000 33,400
* The design load for the Auburn house was slightly over the capacity of one coil, requiring a step up of 8,000 Btuh.
Table 2-6 compares the nominal tonnage using RTI's recommended rule of thumb and the Total Capacity method of this project.
Table 2-6. Comparison of Sizing Methodology Total Capacity vs. Rule of Thumb
Location
Concord
Fresno
Auburn
Tracy
Davis
Total Capacity
3tons
3 tons
4.5 tons
4tons
3 tons
Square Foot Rule of Thumb
5 tons
5tons
5.5 tons
7tons
4tons
Percent Increase in Size
67%
67%
22%
75%
33%
As demonstrated in Table 2-6, using the square footage rule of thumb would have resulted in oversized systems.
Data Acquisition System
The AC2 systems were monitored with Campbell Scientific CR10 measurement and control modules. The CR10 is a compact, rugged, fully programmable datalogger/ controller. The CR10 has the flexibility to perform many data acquisition and control functions and is capable of being downloaded or reprogrammed
AC2 Investigation-- Final Report 2-8 Proctor Engineering Group
Methodology
via modem. PEG used the CR10 to gather data on the operating parameters of the air conditioners. Several types of measurement devices were used in conjunction with the CR10.
Data Point Description and Sensor Specifications
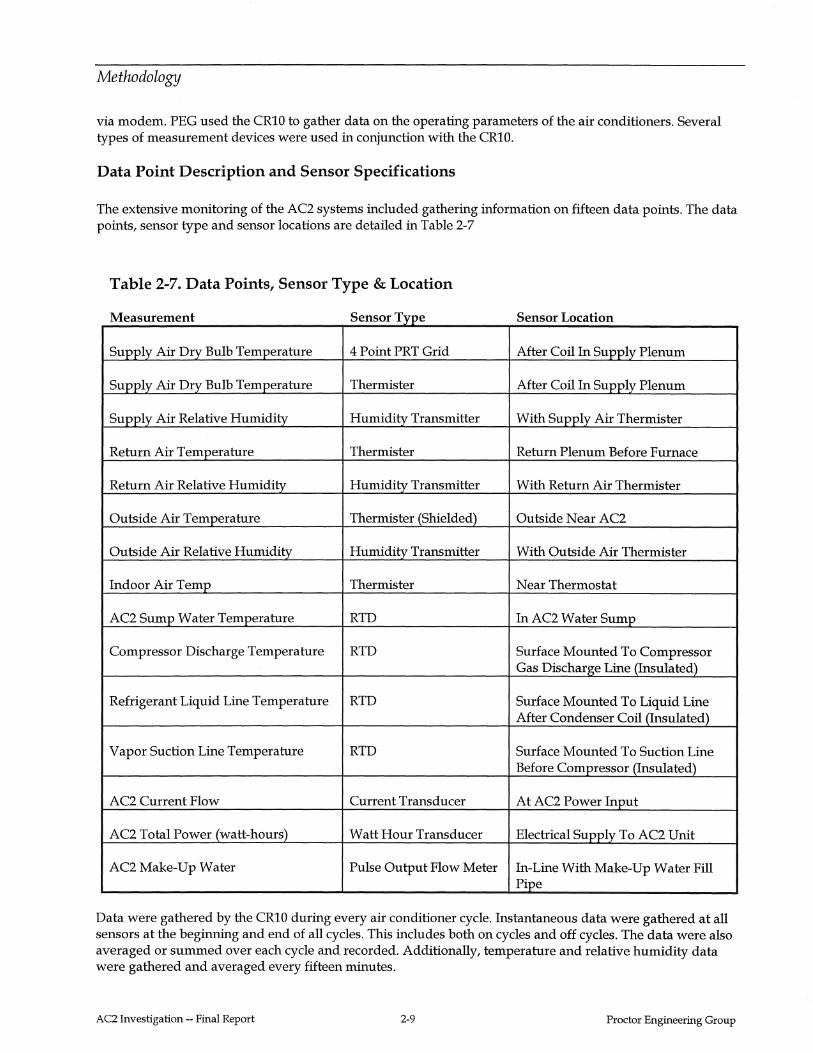
The extensive monitoring of the AC2 systems included gathering information on fifteen data points. The data points, sensor type and sensor locations are detailed in Table 2-7
Table 2-7. Data Points, Sensor Type & Location
M easuremen t s T ensor Lype s ens or L t• oca ton
Supply Air Dry Bulb Temperature 4 Point PRT Grid After Coil In Supply Plenum
Supply Air Dry Bulb Temperature Thermister After Coil In Supply Plenum
Supply Air Relative Humidity Humidity Transmitter With Supply Air Thermister
Return Air Temperature Thermister Return Plenum Before Furnace
Return Air Relative Humidity Humidity Transmitter With Return Air Thermister
Outside Air Temperature Thermister (Shielded) Outside Near AC2
Outside Air Relative Humidity Humidity Transmitter With Outside Air Thermister
Indoor Air Temp Thermister Near Thermostat
AC2 Sump Water Temperature RTD In AC2 Water Sump
Compressor Discharge Temperature RTD Surface Mounted To Compressor Gas Discharge Line (Insulated)
Refrigerant Liquid Line Temperature RTD Surface Mounted To Liquid Line After Condenser Coil (Insulated)
Vapor Suction Line Temperature RTD Surface Mounted To Suction Line Before Compressor (Insulated)
AC2 Current Flow Current Transducer At AC2 Power Input
AC2 Total Power (watt-hours) Watt Hour Transducer Electrical Supply To AC2 Unit
AC2 Make-Up Water Pulse Output Flow Meter In-Line With Make-Up Water Fill Pipe
Data were gathered by the CR10 during every air conditioner cycle. Instantaneous data were gathered at all sensors at the beginning and end of all cycles. This includes both on cycles and off cycles. The data were also averaged or summed over each cycle and recorded. Additionally, temperature and relative humidity data were gathered and averaged every fifteen minutes.
AC2 Investigation-- Final Report 2-9 Proctor Engineering Group
Methodology
A dedicated computer in the PEG office was programmed to call the Campbell nightly via modem to download the data. Some systems employed a switching device to route the incoming call to the Campbell using the occupants' existing phone line, while other sites received a new phone line. The data were analyzed daily and graphs were printed for review by PEG staff.
Reducing Potential Measurement Error
The largest potential sources of error are the return humidity reading, the supply humidity reading, and the supply temperature reading. Even high quality humidity sensors are subject to drift and loose accuracy at high relative humidities such as those in the supply air stream. While the return air stream is generally well mixed, the supply air stream is not. Measurements in one part of the air stream are not necessarily representative of the mixed values.
In order to reduce measurement error, humidity sensors were post calibrated using a closed container and salt slurries. Salt slurries produce fixed relative humidities at each temperature, providing a very accurate calibration method for humidity sensors. Two pure salt slurries were used, Sodium Chloride and Magnesium Chloride. In order to reduce measurement error of the supply temperature, an averaging grid was employed.
Calculations
System Performance
The capacities, watt draws, and EERs of these units were analyzed over a 63-day period. This period extended from July 24, 1998, to September 25, 1998, and represents the operation of these units while they are functioning properly.
The primary parameter of interest effecting the performance of residential air conditioners is the outdoor temperature. Capacities, efficiencies, and watt draws for air conditioners change with outside temperature. At the same time, the cooling load changes with outside temperature as tempered by the indoor thermostat set point, the mass of the structure, the amount of direct gain through windows, and the amount of ventilation. The cooling load interacts with the capacity of the unit to produce varying cycle lengths, equipment performance, and energy consumption.
For air cooled air conditioners there is a high amount of variability in the capacity and efficiency attributable to changes in outdoor temperature. A thirty degree F change in outdoor temperature will produce a 14% change in steady state capacity and a 47% change in steady state efficiency for typical units. For comparison purposes some of the most useful models of the AC2 units would be ones that relate performance to outdoor temperature.
The analysis used regression techniques. Measured capacity and efficiency from each on cycle were regressed against outdoor temperature and the natural log of outdoor temperature. The measured sensible load for each operating hour was regressed against outdoor temperature in the previous hour and indoor temperature. These equations are detailed in Appendix E.
Because monitored data contains some outliers a well-documented technique known generically as "robust regression" was used for the regressions. As stated in Stata Reference Manual P-Z Page 117 (Stata, 1997), this consists of estimating the regression, calculating Cook's Distance, and excluding any observation for which Cook's Distance is greater than 1. Thereafter it works iteratively: it performs a regression, calculates case weights based on absolute residuals, and regresses again using those weights. Iterations stop when the maximum change in weights drops below .01. Weights derive from one of two weight functions, Huber
AC2 Investigation - Final Report 2-10 Proctor Engineering Group
Methodology
weights and biweights. Huber weights are used until convergence and then, based on that result, biweights are used until convergence.
System Degradation
The performance of air conditioners drops over time. The primary causes are fouling of the indoor coil and fouling of the outdoor coil.
One measure of indoor coil fouling is the increase in temperature split over time (corrected for other factors such as outside temperature). The temperature split across the coil was regressed against combinations of the potential predictors.
Another measure of degradation in evaporator coil effectiveness is the evaporator coil (refrigerant saturation) temperature. If under the same conditions, the evaporator coil temperature is reduced, the efficiency of the air conditioner will drop. The evaporator coil temperature was not monitored in this project, but a surrogate, the suction line temperature, was monitored. Four of the units in this study used TXV refrigerant metering devices. A TXV is a constant superheat valve. In essence this means that the suction line temperature is equal to the evaporator coil temperature plus a constant (superheat). Suction line temperature was monitored in this project. The suction line temperature was regressed against combinations of potential predictors.
Of particular interest is the outside heat exchanger in the AC2 unit. The heat exchange coil submerged in the evaporative cooler sump could be subject to scaling or corrosion. Scaling would reduce the heat exchange, while corrosion would increase the heat exchange. Outdoor heat exchanger effectiveness was indicated by the following equation:
Effectiveness= Cl x (thotg-tliquid)/(thotg-tsmp)
Where:
Effectiveness is the ratio of actual heat exchange to the ideal heat exchange
Cl is a constant for the heat exchanger under any given set of conditions
thotg is the hot gas discharge temperature (the temperature of the refrigerant entering the outside heat exchanger)
tliquid is the liquid line temperature (the temperature of the refrigerant leaving the outside heat exchanger)
tsmp is the temperature of the water in the sump
The outdoor heat exchanger effectiveness was regressed against combinations of potential predictors including the Julian day.
Another measure of degradation in outside coil effectiveness is the condenser refrigerant saturation temperature. If under the same conditions, the condenser saturation temperature is increased, the efficiency of the air conditioner will drop. As with the evaporator, the condenser saturation temperature was not monitored in this project, but a surrogate, liquid line temperature, was monitored. For the four TXV units, the liquid line temperature changes in a direct relationship with the condenser saturation temperature. Liquid line temperature was monitored in this project. The liquid line temperature was regressed against combinations of potential predictors including Julian day.
AC2 Investigation- Final Report 2-11 Proctor Engineering Group
Methodology
The changes in evaporator and condenser saturation temperatures (as determined by their surrogates) were used as inputs to typical scroll compressor performance curves. The resulting changes in compressor only efficiency were combined with measured fan wattages and unit capacities. The results were estimated EER degradation over time.
Water Consumption
Daily water use was regressed against the minutes of air conditioner run time.
Comparisons to ARI Conditions Data
For comparisons of monitored performance to listed performance, the data provided by RTI with ADP coils for ARI conditions were used. The following considerations led to this decision:
1. The data include both total capacity and sensible capacity.
2. The EER data supplied by Superior was inconsistent and considered umeliable.
PEG3 Interactive Model
This model has been verified against monitored field performance in Phoenix, Arizona and Las Vegas, Nevada.
PEG3 (Proctor Engineering Group Comprehensive HVAC Model Version 3.0) is a fully interactive model of cooling equipment functioning with an attached duct system and conditioning a home. PEG has adapted the Palmiter Duct Model (Palmiter and Bond, 1991) and created an equipment model based on field data, laboratory data, ASHRAE models, and DOE2 models. The AC and duct models are combined into a comprehensive model that incorporates many of the complex interactions in the systems. The model calculates system efficiencies, losses, loads, and energy usage based on a typical weather year (TMY2).
This model is based on basic physics, but it accepts higher level inputs whenever they are available. For example, it will model the sensible load on a home based on characteristics of the home -- or it will use monitored information on the true load that the home experienced. This flexibility was particularly useful in this project where a number of higher level parameters were known.
Air Conditioner Performance Modeling
Air conditioner performance can be characterized at given conditions by system capacity and EER. These two quantities can be used to calculate the power draw and, along with air handler flow rate, the temperature drop across the indoor coil. System capacity is modeled as a function of outdoor temperature, return plenum temperature, return humidity, on-cycle time, air handler flow rate, and charge. EER is modeled as a function of the same variables. The air conditioner model return plenum conditions are calculated from the duct system model.
For this use of PEG3, a number of these parameters were available from higher level data. These data were used whenever possible as long as the AC2 units and the standard air conditioners could be treated the same.
For both capacity and EER, factors effecting performance are based on available published data and studies by PEG.
AC2 Investigation- Final Report 2-12 Proctor Engineering Group
Methodology
Duct Efficiency Modeling
The impact of duct leakage and conduction on effective system efficiency and building loads is complex. Duct leakage can cause four types of efficiency losses:
• the supply air that leaks to the exterior is a direct efficiency loss;
• the return air coming from outside and spaces warmer than outside (e.g. the attic) adds to building loads;
• the supply and return flows increase the air leakage rate of the building shell depending upon the relative size of the flows and the building's natural infiltration rate;
• when the air handler is off, the duct leaks still add to the building shell leakage rate.
Each of these effects is accounted for in the duct efficiency model. The model inputs include the supply and return leak fractions, the temperature of the air surrounding the return ducts, and the natural air leakage rate of the building shell (based on the blower door test and a limited implementation of the LBL infiltration model).
Conductive heat gain into the ducts is modeled as a function of duct area, R-values, the temperature of the air around the ducts (which depends on outdoor temperature and duct location), and the temperature of the air in the ducts (which depends on the air conditioner capacity, duct air flow, AC on time, and duct leakage rate). Duct conduction losses are dependent on the duty cycle of the air conditioner and as such are dependent on the relationship between the load, capacity, and duct size.
The leakage and conduction models interact in terms of calculating return plenum and average supply duct temperatures and in avoiding any "double-counting" (e.g., the efficiency loss due to conductive gains into the portion of supply air which leaks out of the ducts is not included).
Energy Usage Modeling
All of the duct-related losses are expressed in terms of percentage efficiency losses to the air conditioning system. The effective capacity of the air conditioner is calculated as the system capacity at given conditions adjusted for duct efficiency losses. The building shell load for this application of PEG3 was derived from the monitored data on each building. The effective capacity and the building shell load are used to calculate the duty cycle, which is used to calculate the cycle on time, and hourly energy usage through an iterative process. These calculations are performed for each cooling hour in the TMY2 to arrive at an annual energy usage rate.
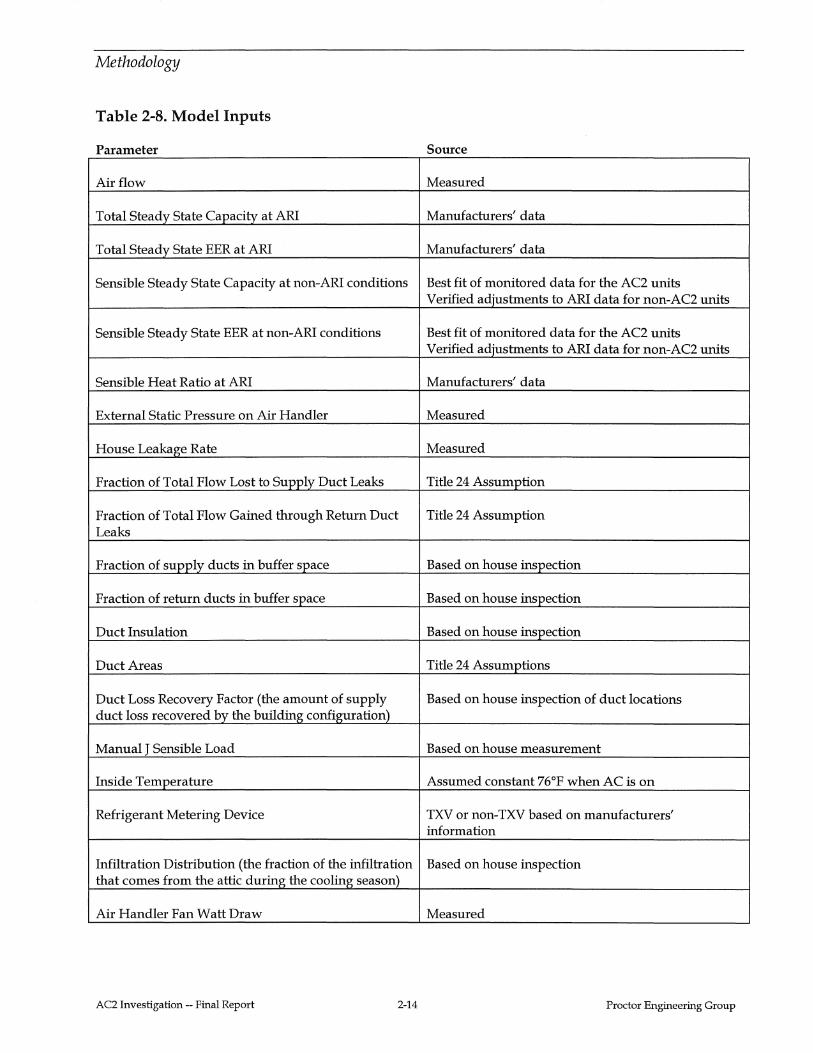
Summary of Model Inputs
The cooling model requires information on numerous aspects of the air conditioner, the duct system and its surroundings, and the building shell. Table 2-8 describes the inputs used in this project.
AC2 Investigation-- Final Report 2-13 Proctor Engineering Group
Methodology
Table 2-8. Model Inputs
Parameter Source
Airflow Measured
Total Steady State Capacity at ARI Manufacturers' data
Total Steady State EER at ARI Manufacturers' data
Sensible Steady State Capacity at non-ARI conditions Best fit of monitored data for the AC2 units Verified adjustments to ARI data for non-AC2 units
Sensible Steady State EER at non-ARI conditions Best fit of monitored data for the AC2 units Verified adjustments to ARI data for non-AC2 units
Sensible Heat Ratio at ARI Manufacturers' data
External Static Pressure on Air Handler Measured
House Leakage Rate Measured
Fraction of Total Flow Lost to Supply Duct Leaks Title 24 Assumption
Fraction of Total Flow Gained through Return Duct Title 24 Assumption Leaks
Fraction of supply ducts in buffer space Based on house inspection
Fraction of return ducts in buffer space Based on house inspection
Duct Insulation Based on house inspection
Duct Areas Title 24 Assumptions
Duct Loss Recovery Factor (the amount of supply Based on house inspection of duct locations duct loss recovered by the building configuration)
Manual J Sensible Load Based on house measurement
Inside Temperature Assumed constant 76°F when AC is on
Refrigerant Metering Device TXV or non-TXV based on manufacturers' information
Infiltration Distribution (the fraction of the infiltration Based on house inspection that comes from the attic during the cooling season)
Air Handler Fan Watt Draw Measured
AC2 Investigation-- Final Report 2-14 Proctor Engineering Group
Methodology
Model Verification
This model has been verified against monitored field performance in Phoenix, Arizona and Las Vegas, Nevada.
For example, the Phoenix verification consisted of 16 sites with single ACs. Seventeen days between August 26, 1995, and September 12, 1995, were suitable for analyzed. The airport weather data for the period was used to drive the model for each site. Actual outdoor temperatures varied from 77op to 110°F, providing a good range of conditions for testing the model.
The total modeled cooling usage for the period averaged 713 kWh per site. The actual metered average consumption was 712 kWh. This is a surprisingly high level of agreement. The site-by-site correlation was generally weak, which was to be expected given variations in occupant behavior and thermostat settings.
The comprehensive model used in this study is unique in modeling many of the interactions between ducts, air conditioner, and building shell. Many of the interactions have been tested and based on the monitored houses in this study and prior field monitoring. At the same time this model, like all models, is based on simplifications of the systems and their interactions.
AC2 Investigation-- Final Report 2-15 Proctor Engineering Group
III. INSTALLATIONS/ FIELD EXPERIENCE
Proctor Engineering Group monitored and documented the installation of each AC2 unit in this test. This included: selection of the contractor, issues documentation for each site, observation and analysis of installation labor requirements, observation of unit quality from the factory, and observation of training effectiveness.
After installation Proctor Engineering observed and analyzed the ongoing issues and acceptance of the AC2 units. Included in these observations were: site specific performance and reliability, customer feedback, and retention of the unit. A number of lessons were determined from these observations.
The installation and ongoing reliability observations are best understood in light of the stage of development of the AC2 product. Prior to this project the AC2 underwent several design changes as detailed below.
Initial Comments -- AC2 Design Changes
RTI implemented several design changes in the second generation AC2. Some of these changes resulted in problems with the systems while the new arrangements were being implemented. Some of the changes in the second generation are:
1. Float valve assembly-- The float valve was changed from a simple evaporative cooler type brass float arm with a plastic float valve that manually controlled water inlet to a float valve assembly that uses two single level floats in conjunction with an electric solenoid to control water inlet. Problems were encountered with the float assemblies not being wired correctly at the factory, the float valve sticking, and water making contact with the float terminals providing false signals.
2. Water inlet valve/ solenoid assemblies-- The simple on/ off brass float arm type water inlet control was replaced with a water inlet valve that is controlled with an electrical solenoid valve. Problems were encountered with water leakage at the inlet valve, positioning/ securing of the solenoid, water line debris becoming caught in the valve causing it to stay open, and water hammer when the valve closed.
3. Circuit boards --The circuit boards and their logic/ functions were changed. During the early phases of production a high failure rate was experienced with these boards.
4. Water purge-- The first generation AC2 used a bleed tube that dumped some of the water whenever the evaporator pump ran. The second-generation system employs a purge cycle that uses a separate pump to empty the sump after eight hours of compressor run time. Problems were encountered when the termination of the purge line was lower than the AC2 unit. Under those conditions, a siphon would be established that continued to drain the sump after the purge pump was shut off.
All of these problems have been dealt with by RTI. The units in this project were purchased before many of the bugs had been worked out, so PEG did not have the opportunity to determine if any of these problems still exist.
AC2 Investigation-- Final Report 3-1 Proctor Engineering Group
Installations I Field Experience
Installation
Contractor Selection
Proctor Engineering Group's first step was to locate a qualified contractor to install the systems according to the manufacturer's specifications. PEG contacted RTI to locate a factory-authorized contractor. RTI referred PEG to the local distributor of the AC2 equipment, Specialty AC Products, of Benicia, California. The marketing and distribution manager for Specialty AC Products was contacted for a referral. PEG was referred to Dave A vels, the owner of Central Heating & A/ C. Specialty AC Products indicated that Central Heating & A/ C was the highest volume dealer of the AC2 systems in this region. Central Heating & A/ C was also recommended because of its reputation for performing quality work.
Site Details
The following section details the specifics of the AC2 system installation at each of the test sites.
CONCORD
The AC2 system was installed at the Concord site on June 4. The system consisted of a model10K2C37 AC2 unit with a V1042 Superior evaporator coil equipped with a TXV. The V1042 coil is rated at a higher capacity than needed and was selected because its dimensions were in line with the existing evaporator coil.
The installation included removing the furnace in order to replace the evaporator coil. A new 11/8" suction line was installed per the manufacturer recommendations. The installation of the new suction line (32 foot long, installed in the crawl space) and the water line took an additional hour. The most time consuming aspect of the installation was the removal of the furnace to install the new coil.
The existing 50 AMP service disconnect was replaced with a 20 AMP service disconnect, the proper size for the AC2 unit installed. The airflow through the new evaporator coil was measured at 1118 CFM or 371 CFM per nominal ton.
FRESNO
The AC2 system was installed at the Fresno site on June 16. The system consisted of a model10K2C37 AC2 unit with a V1036 Superior evaporator coil equipped with a TXV. The installation included removing the furnace in order to replace the evaporator coil. A new 11/8" suction line was installed per the manufacturer recommendations. The installation of the new suction line (38 foot long, installed in the crawl space) and the water line took approximately 40 minutes. The existing air conditioner did not have a service disconnect located near the unit. A 20 AMP service disconnect was installed. The airflow through the new evaporator coil was measured at 1178 CFM or 393 CFM per nominal ton.
AUBURN
The AC2 system was installed at the Auburn site on June 30. The system consisted of a model10K2C50 AC2 unit with a HL2348 Superior evaporator coil equipped with a TXV. The furnace is a horizontal flow located in the attic so the coil was easy to replace. The furnace did not have to be removed.
A new 11/8" suction line was installed per the manufacturer recommendations. This required more effort than the other lineset replacements. The existing lineset ran through an inaccessible sloped ceiling area and an exterior wall. The only way to get the new suction line in place was to cut a hole in the gable end wall of the
AC2 Investigation -- Final Report 3-2 Proctor Engineering Group
Installations/ Field Experience
attic and run the line down the exterior of the house. The lineset was then covered with a sheetmetal enclosure.
The nearest accessible outside faucet for the water line was about 45 feet from the AC2 unit. The water line had to be routed under a deck on the back of the house. The time required for the water line installation, suction line installation, and installation of the cover was approximately 6 hours.
The existing 60 AMP service disconnect was replaced with a 25 AMP service disconnect. The airflow through the new evaporator coil was measured at 1585 CFM or 352 CFM per nominal ton.
TRACY
The AC2 system was installed at the Tracy site on May 29. The system consisted of a model10K2C50 AC2 unit. The original design called for a V1048 Superior evaporator coil.
At the time of the installation it was discovered that the furnace or existing evaporator coil could not be removed from the hall closet without removing one of the closet walls. The builder had constructed the front wall of the closet after the furnace and evaporator coil had been installed. The only real option for removing the existing evaporator coil was to remove the section of wall under the closet door (approximately 12" tall). The decision was made to leave the wall in place and install the AC2 system with the existing coil. Because of the lack of access to the evaporator coil, the existing 7 /8" suction line had to be left in place. The manufacturers' specifications had called for a 11/8" suction line. The orifice metering device for the existing five ton evaporator coil also was inaccessible and was left in place.
Because the original coil was left in place, no information was available for the system's capacity. It was anticipated that the performance of the system would not be very good. The existing coil had an orifice metering device, sized for a five ton condenser. It was further assumed that the evaporator coil was probably dirty and would not have the same heat exchange properties of a new coil. The existing 60 AMP service disconnect was replaced with a 25 AMP service disconnect. The air flow through the evaporator coil did not change from the originally measured at 1583 CFM or 396 CFM per nominal ton (for a 4 ton nominal tonnage).
Despite the fact that the system was not installed as intended, this house provided a good test site for what will happen when contractors replace systems without oversight. It is not uncommon for contractors to replace condensers without replacing the evaporator coil. This site allowed PG&E to monitor the performance of a system that did not have a properly matched evaporator coil.
DAVIS
The AC2 system was installed at the Davis site on June 12. The system consisted of a model10K2C37 AC2 unit with a V1036 Superior evaporator coil equipped with a TXV. Both the furnace and the evaporator coil were replaced. A new 11/8" suction line was installed per the manufacturers' recommendations. The installation of the new suction line (25 foot long, installed in the crawl space) and the water line took an additional hour.
The existing 40 AMP service disconnect was replaced with a 20 AMP service disconnect. The air flow through the new furnace and evaporator coil was measured at 1119 CFM or 373 CFM per nominal ton.
Factory Quality Control
At the time of the first installation, in Tracy, it became evident that there were problems with product quality from the factory. The AC2 unit installed at Tracy had a water inlet solenoid valve that was frozen open. After
AC2 Investigation- Final Report 3-3 Proctor Engineering Group
Installations j Field Experience
the valve was replaced it was determined that the float control for the water inlet solenoid valve had not been connected. All of the systems came with the float assembly mis-wired.
Other as-delivered problems included:
• All systems came with leaks at the water line connections at the solenoid valve.
• One of the units had the water inlet valve solenoid reversed. The contractor had to reverse the solenoid before the system would fill with water.
• One of the units had a bad float valve assembly. The float would not shut the water off and would not allow the compressor or condenser fan to come on.
• Two of the units came with pump related problems. The base of the pump had come off and the impeller was laying in the sump of the AC2 housing.
RTI is aware of the problems with their quality control system and has taken steps to correct the situation. RTI hired a quality assurance manager to oversee products leaving the factory at both of their plants. In addition, the plant managers are taking an active role in helping to ensure consistency in the manufacturing process. RTI has also developed a run test machine that puts the AC2 units through a test to check compatibility of the condenser fan motor and fan blade, capacitors, compressor, pumps, water level sensors, and wiring continuity. The run test machine prints out a label that is affixed to the AC2. No unit is allowed to leave the factory without a run test machine label.
Proctor Engineering Group did not install or monitor any of the units produced after these quality assurance mechanisms were in place.
Training and Documentation
Contractor training is a genuine concern with this product. The installation of the AC2 requires training above and beyond that needed for air cooled systems. From the time of the first installation it was evident that the training was not adequate. Several problems were encountered that can be traced to the contractor training.
TRAINING METHODOLOGY
The contractor's training on the second generation systems consisted of the owner of the company attending a classroom session at the distributor's office. As is relatively common in the HV AC industry, the installation technicians (the people that need the training) did not attend the training. The owner of the company brought one of his installers to the first job and taught him how to install the system as they installed it. The technician had never seen an AC2 system prior to that day. The technician was the lead person on the next job and he trained another technician as they installed the system. This is typical training in the HV AC industry. This problem needs to be addressed by RTI and the local distributor. Installation technicians need hands on training on how to correctly install these systems.
AC2 INSTALLATION DOCUMENTATION
The contractor selected for this project had not installed any of the second generation models of AC2. He was not familiar with the system, had forgotten much of what he heard in the classroom training, and was forced to figure out the system as it was installed. The task of installing the unit was made more difficult because the instructions supplied had not been updated to cover the changes to the second generation units. The electrical schematic on the unit had not been updated to cover the components present in the second generation unit. It is critical that the documentation be complete. The installation instructions should assume that the installation technician did not receive any training on the AC2 system.
AC2 Investigation- Final Report 3-4 Proctor Engineering Group
Installations/ Field Experience
As an example, one of the primary difficulties was the refrigerant charging. The manufacturer's supporting documentation did not reflect changes in the recommended charging procedures. RTI is now recommending that a liquid line sight glass be installed and used in charging the systems. The sight glass allows the installer to see if there is a solid flow of liquid to the metering device. Charge is added until the sight glass indicates that the flow is essentially all liquid, with no vapor bubbles. This was not included in their installation instructions. In fact, the installation instructions gave conflicting information on proper system charge. Page 8 of the installation instructions indicates that the factory refrigerant charge is adequate for a 15 foot line set, while page 14 states it is adequate for a 25 foot set. The contractor only remembered hearing about the sight glass recommendation after the third program installation. Had the installing technician been able to achieve the specified subcooling on these units, the change to sight glass charging would probably not have been discovered within this program. In spite of the new sight glass recommendation, in the end, the president of RTI used subcooling to finally determine correct charge on the units.
OTHER TRAINING ISSUES
There are many other problems associated with training and retention. For example, the contractor forgot that the system needed to have an anti-siphon assembly. From speaking with the contractor, it does not appear that the training addressed the differences in the AC2 system and how they effect routine tasks, such as, brazing, refrigerant line evacuation, and electrical connections.
To achieve a successful entrance into the market and provide reliable service, RTI must increase the effectiveness of the installation and service technician training. The AC2 technology is more complex than aircooled systems. Correct installation and servicing require the technician to better understand the operation of the AC2 and the differences between it and air-cooled systems. Training program changes are needed to produce a smooth introduction of the AC2.
Time Requirements
The installation of the AC2 system is not easily compared to the installation of a typical SEER 10 air-cooled air conditioning system. Most minimal efficiency SEER 10 systems are not installed correctly. The typical SEER 10 system installation is nothing more than a condenser change out. These typically require less than one half day for a single technician.
A better comparison is between an AC2 and a legitimate SEER 12 system. SEER 12 systems require nearly the same amount of labor as the AC2. Both the AC2 and the SEER 12 require the replacement of both the condenser unit and the evaporator coil. In most cases when old inefficient units are being replaced and in nearly all cases where properly sized units are installed in place of oversized units, a new smaller service disconnect must be installed. In many cases a new SEER 12 unit will require a new larger suction line to meet manufacturers' specifications.
In new construction the only differences are the installation of the water line and drain line. In retrofit applications the AC2 will require the installation of the water line and a larger suction line. This could be as little as one hour of additional time (as it was in three of the program installations) or as great as six hours (as it was in one program installation). Compared to a proper installation of a SEER 12 air conditioner the additional labor would be less than an hour. As technicians become proficient at installation this penalty should drop to 1/2 hour.
The installation of a new suction line can be problematic, as it was at the Auburn site. The requirement of a 11/8 inch suction line also increases the difficulty of proper brazing. The performance effect of a smaller suction line is unknown.
AC2 Investigation-- Final Report 3-5 Proctor Engineering Group
Installations I Field Experience
Reliability
Site Details
The installation and commissioning of the AC2 systems was not smooth. All of the sites required numerous visits to get and keep the systems operating as designed. Problems encountered at each of the sites are detailed below.
Proctor Engineering Group was impressed with the support provided by RTI during the course of this project. Rocky Bacchus, of RTI, was very helpful and responsive. When he was made aware of the problems that were being encountered, he traveled to California to meet with PEG and the installation contractor. He personally commissioned four of the five sites. During his visit the AC2 systems had:
• both pumps replaced
• water level sensors replaced
• refrigerant system high pressure switch replaced
• water inlet strainer and water hammer eliminator installed
• new anti-syphon assembly installed
• commisioning procedure completed, including charge adjustment.
Unfortunately, it took the president of the company to get the systems to work properly. After the visit, problems were reduced, but not eliminated.
The AC2 system shows considerable technical merit. When the AC2 system has component problems corrected, an effective quality assurance system in place, and is installed by a well trained technician following proper installation procedures, the unit will operate with a very high efficiency. The long term reliability of the AC2 system was not tested in this project. Many of the components of the AC2 unit are identical with an air-cooled system. The evaporative cooler portion of the system adds complexity and thus potential for lower reliability. This complexity is a primary reason why better training and quality assurance are important to the adoption of this technology. The outdoor heat exchanger is the component that requires the greatest attention to long term reliability. The performance of the outdoor heat exchanger is discussed in the results section of this report.
CONCORD
The Concord installation was the smoothest in the project. The installation modifications were repair of a water leak at the inlet valve and freeing a float valve.
The unit was charged using a sight glass and charging was not a problem.
The primary on-going problem was that the contractor forgot to install an anti-siphon assembly. The termination of the purge line was two feet below the AC2 unit in a tree well. On several occasions the home owner had to call the contractor because the system would not operate. A siphon had been established and the sump drained activating the compressor lock out.
The contractor did not have information on the AC2 self test which could have helped diagnose the problem. Using typical diagnostic techniques, the contractor would accidentally reset the unit by interrupting power. As a result the unit would begin to work without a repair to the initial problem.
AC2 Investigation - Final Report 3-6 Proctor Engineering Group
Installations j Field Experience
The repeated lock out of the unit and the contractor's inability to diagnose the cause of the problem did not make the homeowners happy. At one point they asked that the AC2 system be removed and their old system re-installed. The homeowner remarked that "The system works fine until it gets hot out. Then it quits." Once the problem was properly diagnosed and corrected, the contractor was able to explain the problem to the homeowner. The homeowners agreed to keep the system as long as there were no further interruptions. The system worked reliably for the remainder of the monitoring period.
FRESNO
The Fresno installation went relatively smoothly. The water leak at the inlet valve had to be repaired and the float valve had to be repaired. The float valve problem took a long time to diagnose. This was the first installation with the stuck float valve. Initially the unit worked, but after a short while, it quit. Diagnostics showed that the compressor was not getting power, but without the correct wiring schematic it took a long time to determine that the problem was in the float valve. Once the float valve was freed the unit worked properly.
The system was installed prior to implementation of the site-glass charging technique. Adjusting the charge took a long time. When the subcooling was correct, the temperature split at the indoor coil or the superheat would be wrong. Several hours were spent unsuccessfully trying to charge the unit. In a return visit a sight glass was installed and the system was properly charged.
The unit had a crack in the base of the fiberglass sump. This was not noticed at installation but was found on a return visit. The sump was drained and a fiberglass patch was installed on the inside of the sump.
The system experienced no operational problems during the monitoring period.
AUBURN
The installation at Auburn did not go smoothly. The AC2 unit came from the factory with a bad float valve. When power was applied to the unit, the sump filled with water, but the water did not shut off. The float assembly was not sensing the water level. It took three days to get the replacement float installed and the charge adjusted.
The unit also came with the purge pump impeller lying in the base of the sump. If the installing contractor had not noticed it, the purge cycle would never have worked.
The Auburn site experienced water hammer when the solenoid valve closed. The homeowner said that the water hammer was very predictable, occurring about once every ten minutes during unit operation. RTI knew about the problem and installed a pressure relief device to alleviate the water hammer.
The system experienced no operational problems, other than the water hammer, during the monitoring period.
TRACY
The Tracy installation was the first and had the most problems. The first problems were not associated with the AC2 unit, but rather with the original AC installation in the home. The evaporator coil and lineset could not be replaced within reasonable cost.
AC2 problems were numerous.
AC2 Investigation-- Final Report 3-7 Proctor Engineering Group
Installations I Field Experience
The unit had a water inlet solenoid valve frozen in the open position. As a result the AC2 could not be started. The contractor returned four days later with a replacement valve. During that visit, the contractor tested the unit and declared it operational. Three days later the system had no water and did not operate. The following day the contractor tried to determine the cause of the problem. However without the correct wiring schematic or any detailed troubleshooting procedures, they were unable to determine the cause of the problem.
The contractor consulted with the factory and determined that the unit was factory mis-wired. The float control was not wired into the system. A fourth visit resolved the problem and verified that the unit functioned properly. The customer had been without an air conditioner for 13 days.
Three days later the participant reported that the system did not work. The contractor went out the following day and got it to start. Within fifteen minutes of the contractor's departure the compressor quit again. At this point the participant requested either a new AC2 unit or their old system be re-installed.
The AC2 system was replaced the following day. The second AC2 unit had the solenoid valve reversed when delivered from the factory and the contractor corrected that problem. The unit also had a pump problem. The base of the pump was not attached and was interfering with the impeller. The pump was disassembled and repaired.
The second AC2 system worked for about two weeks then started intermittent shut downs. The contractor found that the unit had power but would not operate. After several more communications with RTI the contractor learned that there were written instructions for trouble-shooting. Neither the contractor nor the local distributor had this information. RTI faxed the information and the contractor was able to determine that the unit had a bad sump thermister.
At this point the participant felt that the AC2 unit was unreliable and requested their old unit be re-installed. PEG and the contractor persuaded them to give the AC2 one more try. They left on vacation the following day and it was agreed that if the AC2 was still working when they returned they would give it another try. The AC2 system worked reliably the remainder of the monitoring period and the participant was very happy with the cooling it provided. The participant kept the AC2 after the monitoring was concluded.
The neighbor's living room window is very close to the outdoor unit. This neighbor was very happy with the reduced noise level.
DAVIS
The installation at Davis was also problematic. The AC2 unit installation, other than the charge adjustment, went smoothly. This was the job where charging problems were discovered. It took four visits, including one by the technical representative from the local distributor and the last from Rocky Bacchus, before the charge was correct.
One problem area was the float valve. The unit would work intermittently. When the contractor arrived to check out the problem, the unit usually worked. Eventually, the participant learned that if they hit the AC2 unit on the side it would start working. After several visits it was determined that the float valve was sticking.
Toward the end of the monitoring period the unit started experiencing shut downs again. The contractor determined that the problem was in the thermostat. Once the participant replaced the thermostat the unit worked again.
AC2 Investigation - Final Report 3-8 Proctor Engineering Group
Installations j Field Experience
Customer Satisfaction and System Retention
Except for the Concord homeowner, the customers were pleased with the cooling ability (capacity) of the AC2 systems. The customers all commented on the drastically reduced outdoor unit noise level compared to their old air conditioners. Most of the customers said that their utility bills were lower.
Customers were concerned with the reliability of the system given the major start up problems. The purge cycle was cited as a problem because it dumped more water than the plants near it could handle and the purge pump was noisy at the end of the cycle when it is attempting to pump air. The Concord homeowner thought it used too much water.
Four of the five project participants elected to keep their AC2 system. The Concord homeowner elected to have their old system reinstalled at the end of the project.
The Concord homeowner decided to remove the AC2 system because: "The system does not keep the family room as cool as the previous unit." The family room is where they spent most of their time. One resident commented that the rest of the house was freezing, while the family room would never get comfortable. PEG checked the duct system to ensure that nothing had happened to reduce the amount of cooling delivered to the family room. No problems were found with the duct system. The amount of air flow through the evaporator coil increased when the new coil was installed. The air flow with the old evaporator coil was 1044 CFM and the air flow through the new coil was 1118 CFM. The air flow and amount of conditioning provided to the family room should have been increased with the new system.
It is possible that the participant was not comfortable with the new system because the system had been down-sized and believed that the smaller capacity unit would not be able to cool the house. The homeowner had commented at the time of the installation that they did not believe a smaller capacity unit would be able to cool their house. Monitored data show the inside temperatures were maintained and the system cycled even on the hottest days.
Lessons Illustrated
During installation and monitoring it was clear that there were problems with both the AC2 equipment and the contractors understanding of the systems. Lessons illustrated by this project include:
Proper Installation
Charging Procedures -- Proper charging is critical. The sight glass method, used with a full understanding of subcooling and TXV operation, can produce positive results. Sight glass charging is not common in residential applications. The training and quality assurance need to pay particular attention to ensuring the technicians understand how to apply this procedure.
Brazing-- Brazing is a critical element in proper installation. The AC2 routinely uses a 11/8" suction line which is more difficult to braze. Four of the five systems in this project had suction line leaks detected in the initial leak test. The training and quality assurance need to pay particular attention to ensuring the technicians understand how to braze larger diameter lines properly.
Evacuation-- Without proper evacuation moisture and air remain in the refrigerant loop. With air in the loop the unit will never perform to specifications. Moisture in the system will lead to premature compressor failure. Without PEG's supervision proper evacuation of these units would not have taken place. The depth of vacuum cannot be adequately determined without a micron gauge. The training and quality assurance need to pay particular attention to proper evacuation.
AC2 Investigation-- Final Report 3-9 Proctor Engineering Group
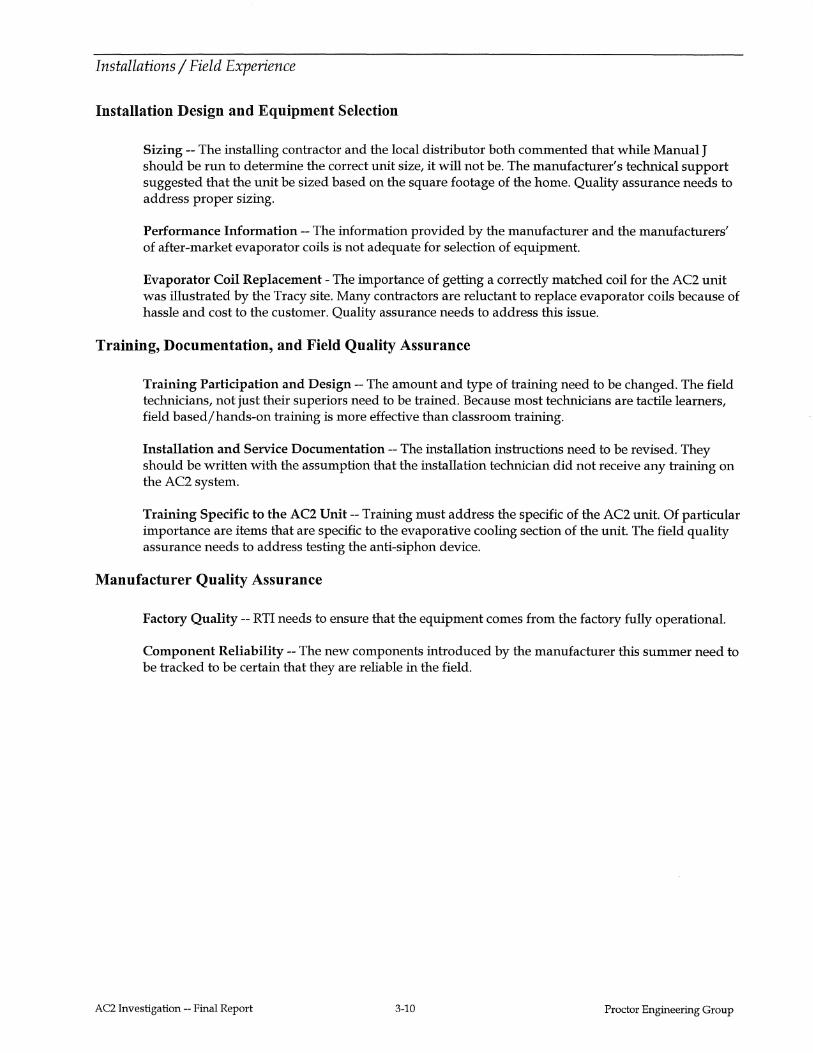
Installations/ Field Experience
Installation Design and Equipment Selection
Sizing -- The installing contractor and the local distributor both commented that while Manual J should be run to determine the correct unit size, it will not be. The manufacturer's technical support suggested that the unit be sized based on the square footage of the home. Quality assurance needs to address proper sizing.
Performance Information -- The information provided by the manufacturer and the manufacturers' of after-market evaporator coils is not adequate for selection of equipment.
Evaporator Coil Replacement- The importance of getting a correctly matched coil for the AC2 unit was illustrated by the Tracy site. Many contractors are reluctant to replace evaporator coils because of hassle and cost to the customer. Quality assurance needs to address this issue.
Training, Documentation, and Field Quality Assurance
Training Participation and Design-- The amount and type of training need to be changed. The field technicians, not just their superiors need to be trained. Because most technicians are tactile learners, field based/hands-on training is more effective than classroom training.
Installation and Service Documentation -- The installation instructions need to be revised. They should be written with the assumption that the installation technician did not receive any training on the AC2 system.
Training Specific to the AC2 Unit-- Training must address the specific of the AC2 unit. Of particular importance are items that are specific to the evaporative cooling section of the unit. The field quality assurance needs to address testing the anti-siphon device.
Manufacturer Quality Assurance
Factory Quality-- RTI needs to ensure that the equipment comes from the factory fully operational.
Component Reliability -- The new components introduced by the manufacturer this summer need to be tracked to be certain that they are reliable in the field.
AC2 Investigation-- Final Report 3-10 Proctor Engineering Group
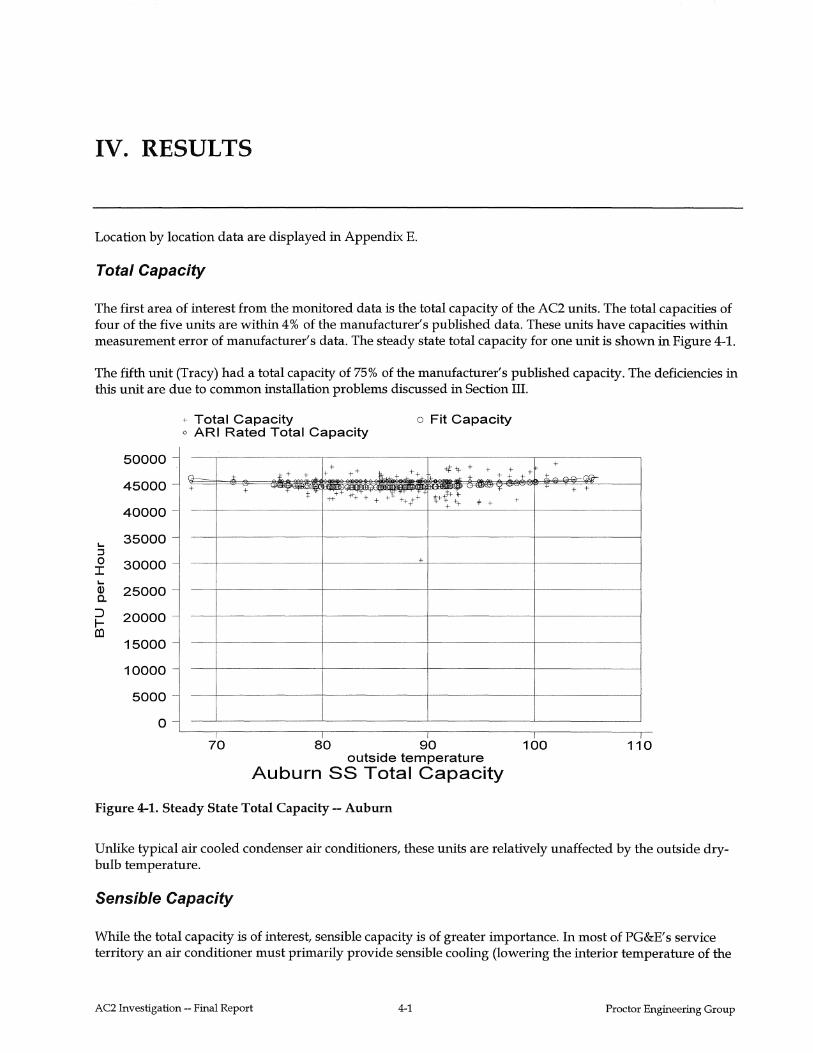
IV. RESULTS
Location by location data are displayed in Appendix E.
Total Capacity
The first area of interest from the monitored data is the total capacity of the AC2 units. The total capacities of four of the five units are within 4% of the manufacturer's published data. These units have capacities within measurement error of manufacturer's data. The steady state total capacity for one unit is shown in Figure 4-1.
The fifth unit (Tracy) had a total capacity of 75% of the manufacturer's published capacity. The deficiencies in this unit are due to common installation problems discussed in Section III.
+ Total Capacity o Fit Capacity o ARI Rated Total Capacity
50000 +tit + +
't_ + ++ .:J!c ++ + + + G- ± + + + + + + + ~-C?fil-
45000
40000
+ + ++++ -tf-+ + Jc+~~:r-~- '-J'>U~ + + +
:j: + +'~' f_,:f-+ ++ * + +
..... 35000 :::J 0 30000 I
+
.... Q) 25000 0..
::J 20000 1-co 15000
10000
5000
0
70 80 90 100 110 outside temperature
Auburn SS Total Capacity
Figure 4-1. Steady State Total Capacity-- Auburn
Unlike typical air cooled condenser air conditioners, these units are relatively unaffected by the outside drybulb temperature.
Sensible Capacity
While the total capacity is of interest, sensible capacity is of greater importance. In most of PG&E' s service territory an air conditioner must primarily provide sensible cooling (lowering the interior temperature of the
AC2 Investigation- Final Report 4-1 Proctor Engineering Group
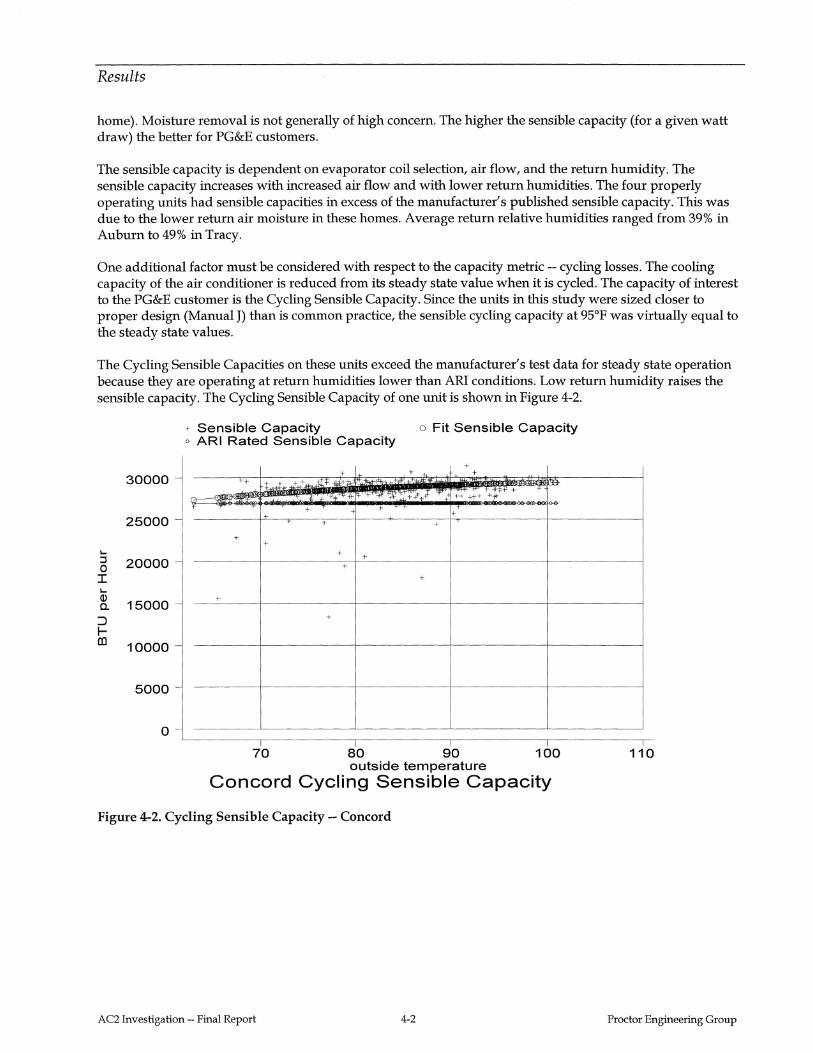
Results
home). Moisture removal is not generally of high concern. The higher the sensible capacity (for a given watt draw) the better for PG&E customers.
The sensible capacity is dependent on evaporator coil selection, air flow, and the return humidity. The sensible capacity increases with increased air flow and with lower return humidities. The four properly operating units had sensible capacities in excess of the manufacturer's published sensible capacity. This was due to the lower return air moisture in these homes. Average return relative humidities ranged from 39% in Auburn to 49% in Tracy.
One additional factor must be considered with respect to the capacity metric -- cycling losses. The cooling capacity of the air conditioner is reduced from its steady state value when it is cycled. The capacity of interest to the PG&E customer is the Cycling Sensible Capacity. Since the units in this study were sized closer to proper design (Manual J) than is common practice, the sensible cycling capacity at 95°F was virtually equal to the steady state values.
The Cycling Sensible Capacities on these units exceed the manufacturer's test data for steady state operation because they are operating at return humidities lower than ARI conditions. Low return humidity raises the sensible capacity. The Cycling Sensible Capacity of one unit is shown in Figure 4-2.
30000
25000
.... :s 20000 0 I .... G)
15000 a. :J 1-al 10000
5000
0
+ Sensible Capacity o Fit Sensible Capacity o ARI Rated Sensible Capacity
+ + + _,_ +
+ ,t .. t .. ++,.k,,.i/i;f_
.-I< '-l'j;' * ''lW'j!i' +:f,_l 'II"' ++ +++ +:;;!+' +
+ + +
+ +
+ +
+ + +
+
+
+
70 80 90 100 outside temperature
Concord Cycling Sensible Capacity
Figure 4-2. Cycling Sensible Capacity-- Concord
AC2 Investigation-- Final Report 4-2
110
Proctor Engineering Group
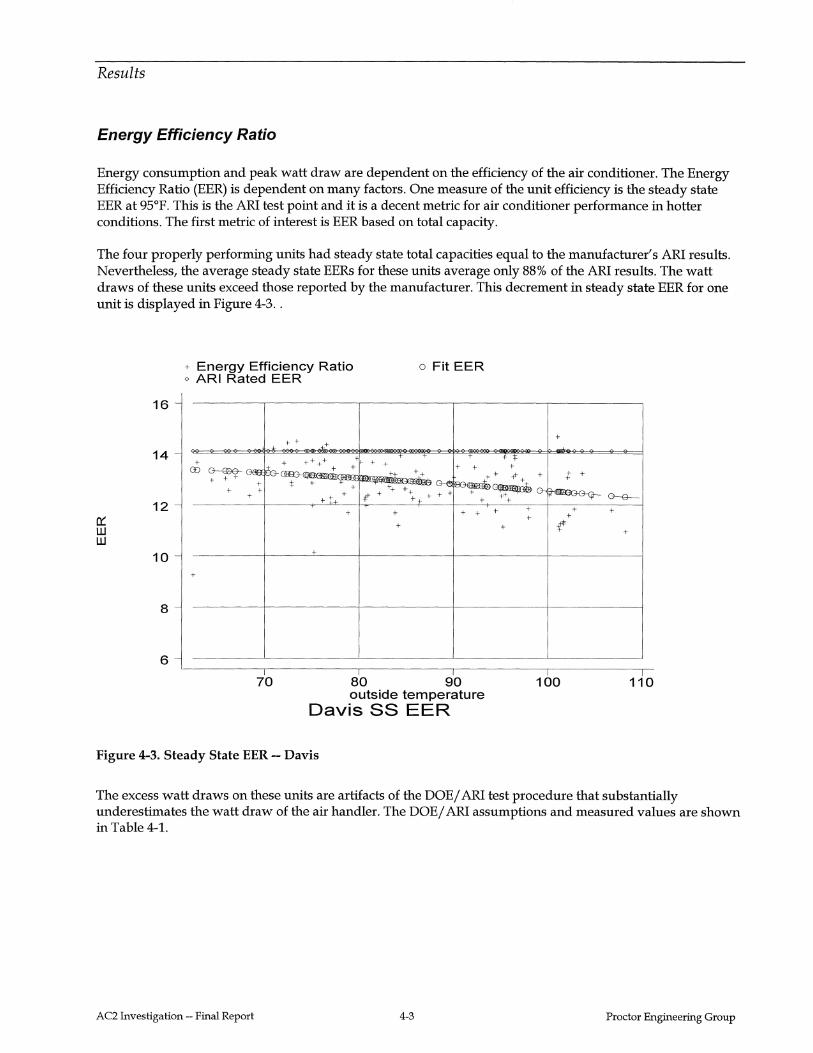
Results
Energy Efficiency Ratio
Energy consumption and peak watt draw are dependent on the efficiency of the air conditioner. The Energy Efficiency Ratio (EER) is dependent on many factors. One measure of the unit efficiency is the steady state EER at 95°F. This is the ARI test point and it is a decent metric for air conditioner performance in hotter conditions. The first metric of interest is EER based on total capacity.
The four properly performing units had steady state total capacities equal to the manufacturer's ARI results. Nevertheless, the average steady state EERs for these units average only 88% of the ARI results. The watt draws of these units exceed those reported by the manufacturer. This decrement in steady state EER for one unit is displayed in Figure 4-3 ..
0::: w w
16
14
12
10
8
6
+ Energy Efficiency Ratio o ARI Rated EER
+ + .±!
+ fu,+ ++ ++ (£) ~Gl& Cl!B3- + +
+ t + + + + + ++ +
+
+
+
+
:f +
o Fit EER
+
-1' + + + + +
++ ++ + + .p- + + :t '"" ++ +""""'~'"" ++ + + + + +++ +t-
t- + + + + + +
+ + (
70 80 90 100 outside temperature
Davis SS EER
Figure 4-3. Steady State EER -- Davis
+
G-e-+ +
+
110
The excess watt draws on these units are artifacts of the DOE/ ARI test procedure that substantially underestimates the watt draw of the air handler. The DOE/ ARI assumptions and measured values are shown in Table 4-1.
AC2 Investigation - Final Report 4-3 Proctor Engineering Group
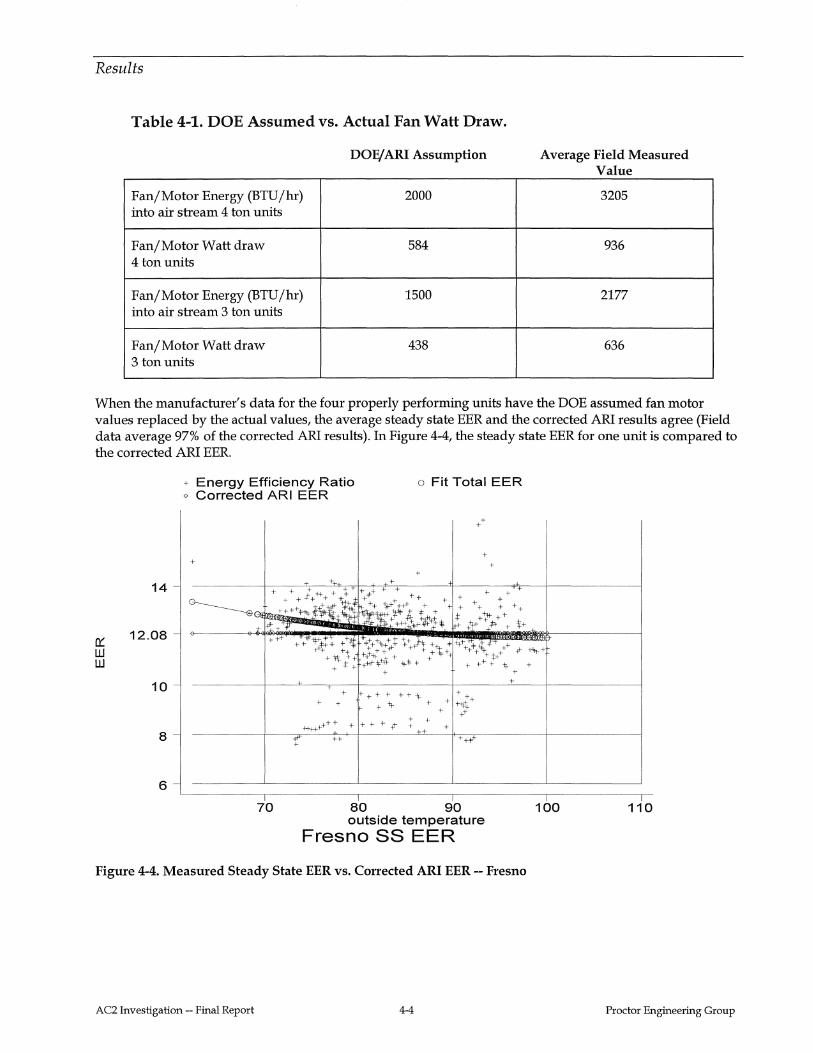
Results
Table 4-1. DOE Assumed vs. Actual Fan Watt Draw.
DOE/ ARI Assumption
Fan/Motor Energy (BTU /hr) 2000 into air stream 4 ton units
Fan/Motor Watt draw 584 4 ton units
Fan/Motor Energy (BTU /hr) 1500 into air stream 3 ton units
Fan/Motor Watt draw 438 3 ton units
Average Field Measured Value
3205
936
2177
636
When the manufacturer's data for the four properly performing units have the DOE assumed fan motor values replaced by the actual values, the average steady state EER and the corrected ARI results agree (Field data average 97% of the corrected ARI results). In Figure 4-4, the steady state EER for one unit is compared to the corrected ARI EER.
14
+ Energy Efficiency Ratio o Corrected ARI EER
+
+ + + ;-+ + t
~e. + + *++t~
+ +{( *-Hh _,+++ ¥0!r(~lr 'l:t¥ ± tl- f
o Fit Total EER
+
+ +
+ +
+ + + + + + + +* + + + + + + +
1'1- ++ itt-+ +++ + + + + + ++ rc'r#l+ ij-" + * + + +~* + + .or; :h ++ 1+ ~4l<++ $. +* lf-+~_: ++ +it-+ 4-=t- + t+
~ w w
12.08 +++ +·t;+i ++fl; ++
-~-~ ++
1'"+++ +.q./ t j_+ ./-lr ~:, 1"-'+:*}t{ ,++ .p- +~;;.+ +++.F + +
+,;-.,_ + +'**tf\: ''* + + j: + + ++ -It- +
+ + +
+ + + + + ++-Jr + + + + + -It + + +"J't-+
+ ++
++++++ +: + + + + _p-+ + + + ++
r ++ ++-t+ 8
10
6
70 80 90 100 outside temperature
Fresno SS EER
Figure 4-4. Measured Steady State EER vs. Corrected ARI EER -- Fresno
AC2 Investigation-- Final Report 4-4
110
Proctor Engineering Group
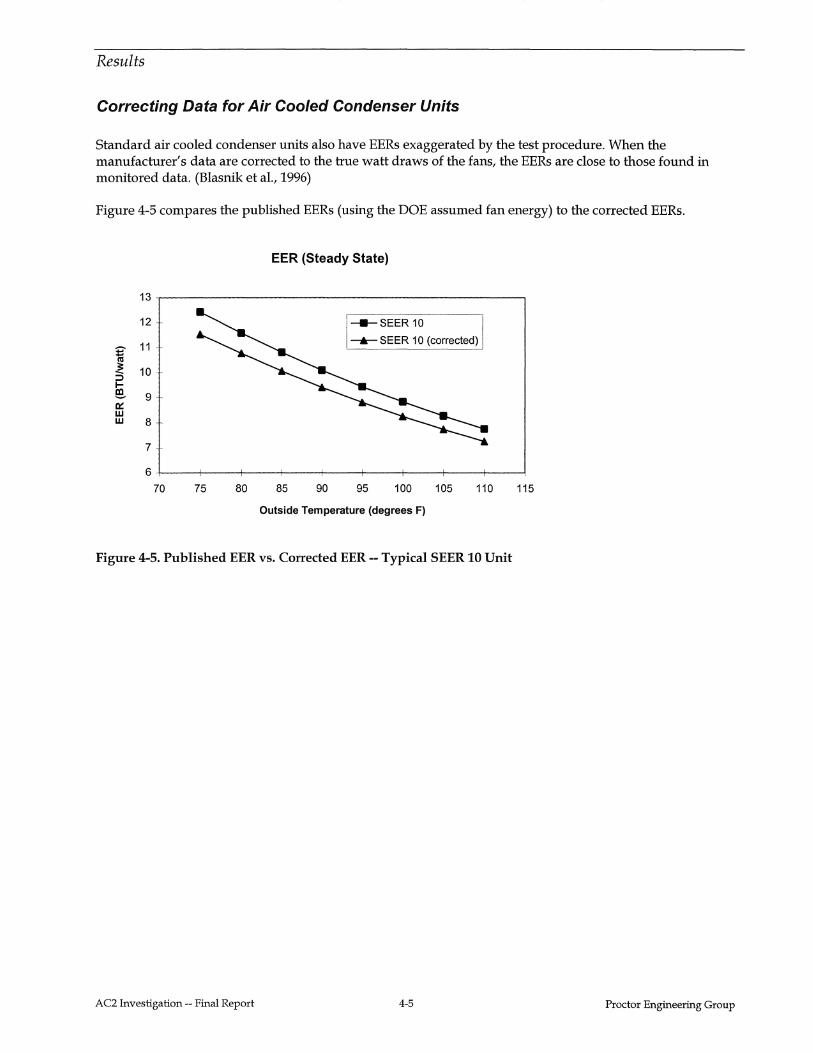
Results
Correcting Data for Air Cooled Condenser Units
Standard air cooled condenser units also have EERs exaggerated by the test procedure. When the manufacturer's data are corrected to the true watt draws of the fans, the EERs are close to those found in monitored data. (Blasnik et al., 1996)
Figure 4-5 compares the published EERs (using the DOE assumed fan energy) to the corrected EERs.
13
12
E' 11 fa
~ 10 ::J 1-!:!!. 9 0:: w w 8
7
6
70 75 80
EER (Steady State)
85 90
_.,_SEER 10
_._SEER 10 (corrected)
95 100 105 110
Outside Temperature (degrees F)
Figure 4-5. Published EER vs. Corrected EER -- Typical SEER 10 Unit
AC2 Investigation-- Final Report 4-5
115
Proctor Engineering Group
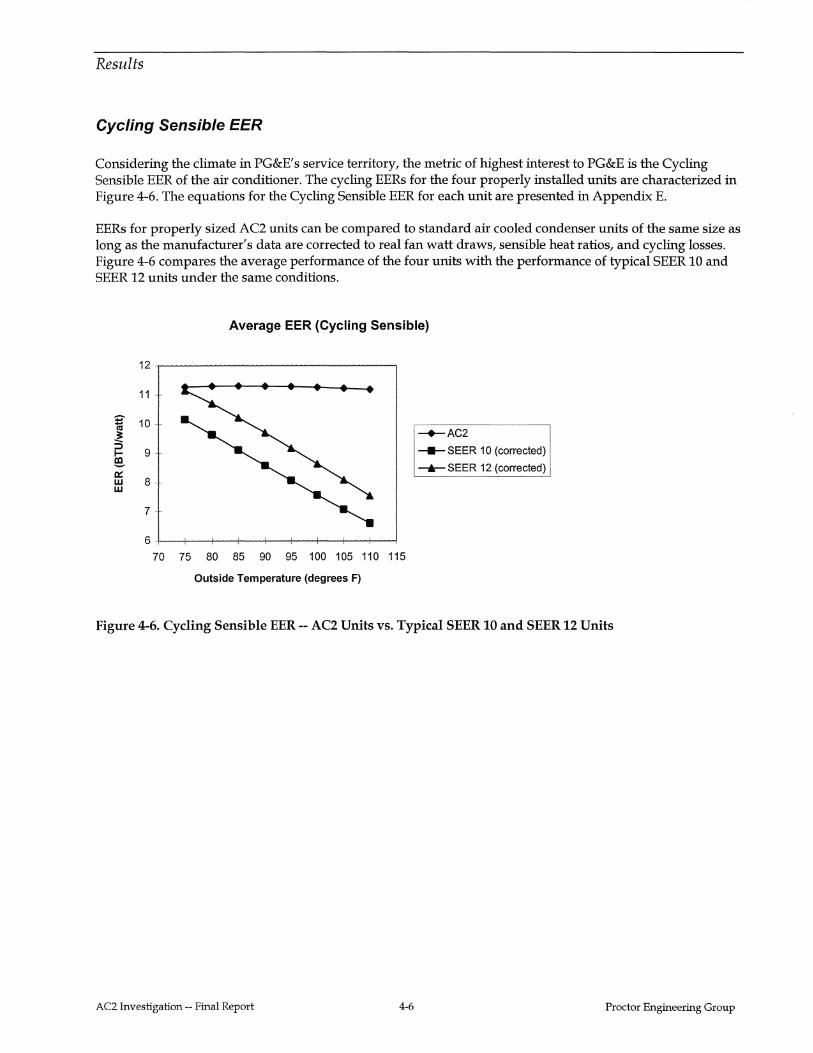
Results
Cycling Sensible EER
Considering the climate in PG&E' s service territory, the metric of highest interest to PG&E is the Cycling Sensible EER of the air conditioner. The cycling EERs for the four properly installed units are characterized in Figure 4-6. The equations for the Cycling Sensible EER for each unit are presented in Appendix E.
EERs for properly sized AC2 units can be compared to standard air cooled condenser units of the same size as long as the manufacturer's data are corrected to real fan watt draws, sensible heat ratios, and cycling losses. Figure 4-6 compares the average performance of the four units with the performance of typical SEER 10 and SEER 12 units under the same conditions.
11
I 10
i= 9 e. IX! w 8 w
7
Average EER (Cycling Sensible)
-+-AC2
-SEER 10 (corrected)
---...-sEER 12 (corrected)
70 75 80 85 90 95 100 105 110 115
Outside Temperature (degrees F)
Figure 4-6. Cycling Sensible EER -- AC2 Units vs. Typical SEER 10 and SEER 12 Units
AC2 Investigation- Final Report 4-6 Proctor Engineering Group
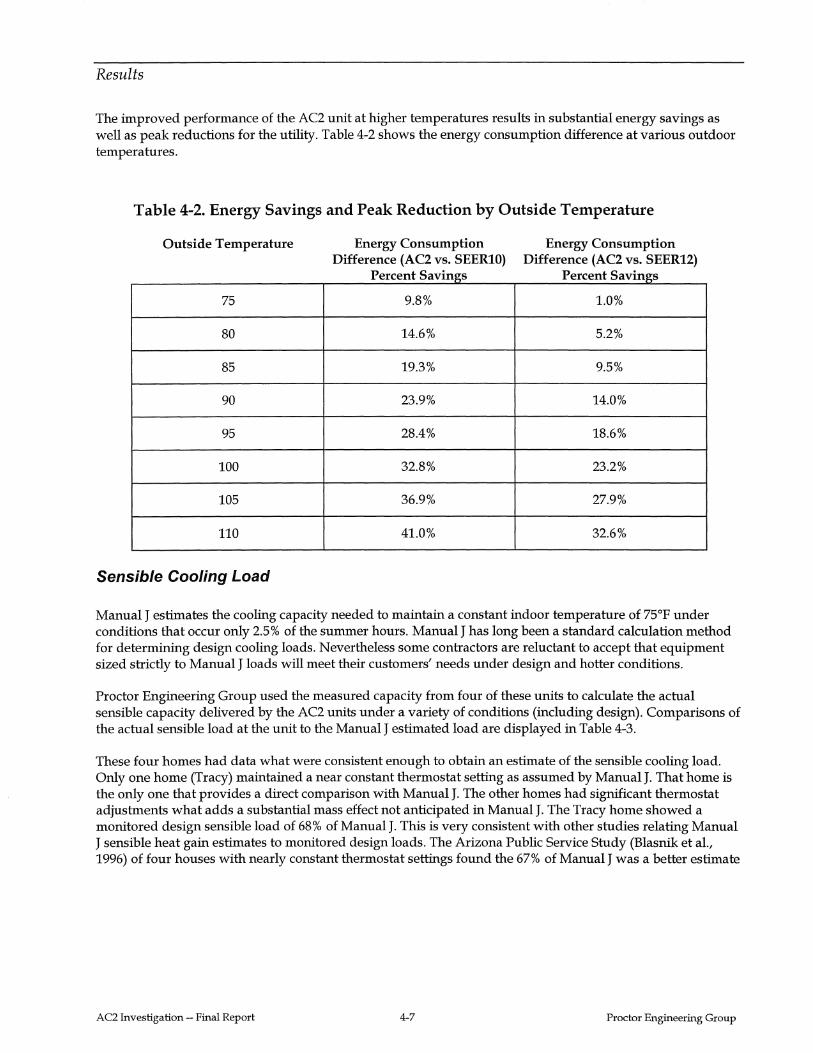
Results
The improved performance of the AC2 unit at higher temperatures results in substantial energy savings as well as peak reductions for the utility. Table 4-2 shows the energy consumption difference at various outdoor temperatures.
Table 4-2. Energy Savings and Peak Reduction by Outside Temperature
Outside Temperature
75
80
85
90
95
100
105
110
Sensible Cooling Load
Energy Consumption Difference (AC2 vs. SEER10)
P tS . ercen avmgs
9.8%
14.6%
19.3%
23.9%
28.4%
32.8%
36.9%
41.0%
Energy Consumption Difference (AC2 vs. SEER12)
P tS . ercen avtngs
1.0%
5.2%
9.5%
14.0%
18.6%
23.2%
27.9%
32.6%
Manual J estimates the cooling capacity needed to maintain a constant indoor temperature of 75°F under conditions that occur only 2.5% of the summer hours. Manual J has long been a standard calculation method for determining design cooling loads. Nevertheless some contractors are reluctant to accept that equipment sized strictly to Manual J loads will meet their customers' needs under design and hotter conditions.
Proctor Engineering Group used the measured capacity from four of these units to calculate the actual sensible capacity delivered by the AC2 units under a variety of conditions (including design). Comparisons of the actual sensible load at the unit to the Manual J estimated load are displayed in Table 4-3.
These four homes had data what were consistent enough to obtain an estimate of the sensible cooling load. Only one home (Tracy) maintained a near constant thermostat setting as assumed by Manual J. That home is the only one that provides a direct comparison with Manual J. The other homes had significant thermostat adjustments what adds a substantial mass effect not anticipated in Manual J. The Tracy home showed a monitored design sensible load of 68% of Manual J. This is very consistent with other studies relating Manual J sensible heat gain estimates to monitored design loads. The Arizona Public Service Study (Blasnik et al., 1996) of four houses with nearly constant thermostat settings found the 67% of Manual J was a better estimate
AC2 Investigation-- Final Report 4-7 Proctor Engineering Group
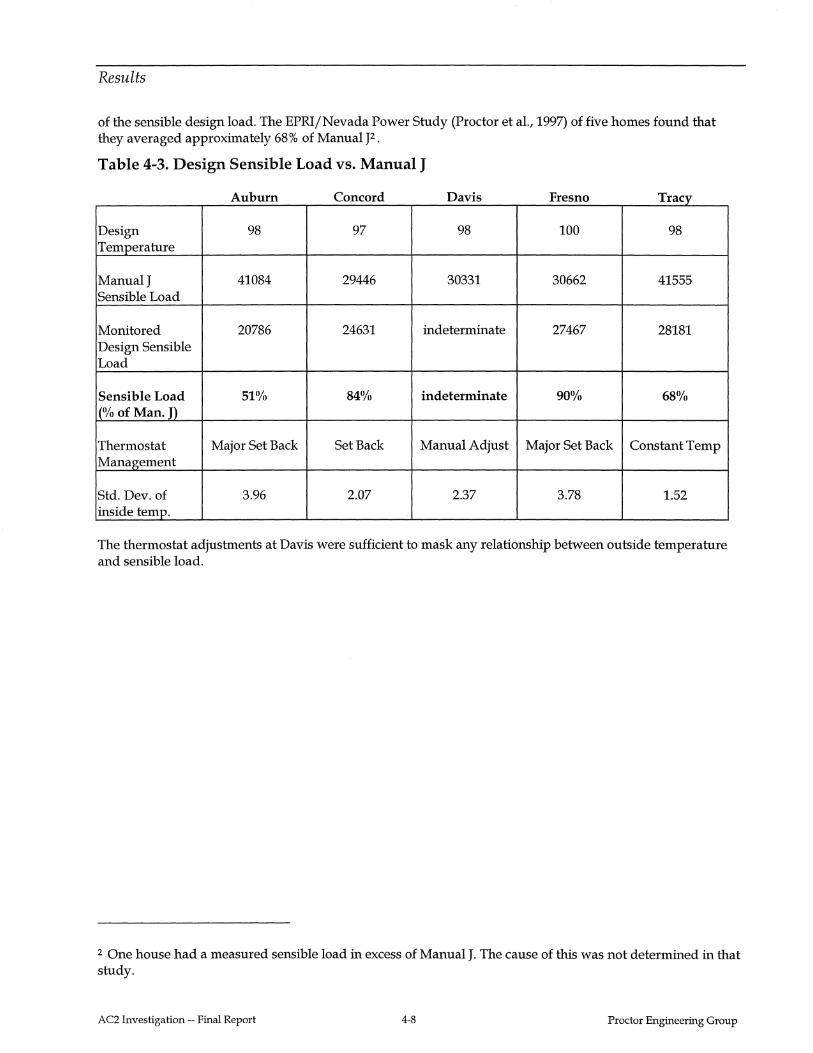
Results
of the sensible design load. The EPRifNevada Power Study (Proctor et al., 1997) of five homes found that they averaged approximately 68% of Manual J2.
Table 4-3. Design Sensible Load vs. Manual J
Ab u urn c one or d D . aVIS F resno T racy
Design 98 97 98 100 98 Temperature
ManualJ 41084 29446 30331 30662 41555 Sensible Load
Monitored 20786 24631 indeterminate 27467 28181 Design Sensible Load
Sensible Load 51% 84% indeterminate 90% 68% I(% of Man. J)
Thermostat Major Set Back SetBack Manual Adjust Major Set Back Constant Temp Management
Std. Dev. of 3.96 2.07 2.37 3.78 1.52 inside temp.
The thermostat adjustments at Davis were sufficient to mask any relationship between outside temperature and sensible load.
2 One house had a measured sensible load in excess of Manual J. The cause of this was not determined in that study.
AC2 Investigation-- Final Report 4-8 Proctor Engineering Group
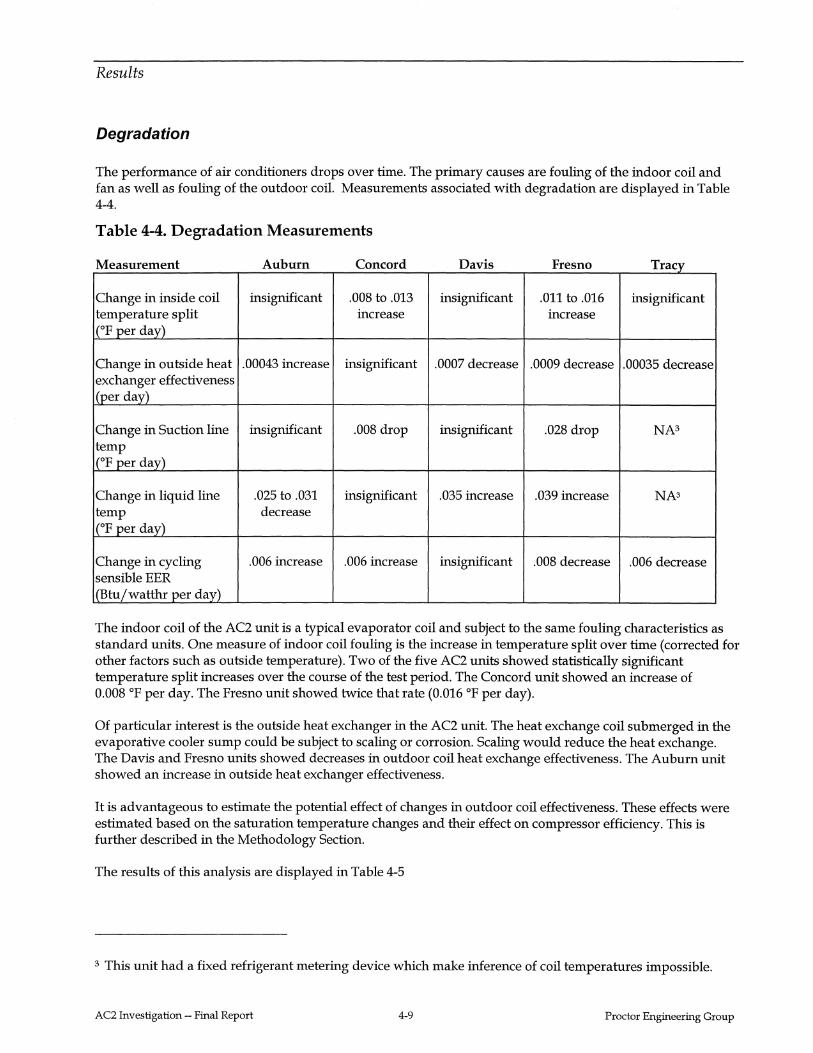
Results
Degradation
The performance of air conditioners drops over time. The primary causes are fouling of the indoor coil and fan as well as fouling of the outdoor coil. Measurements associated with degradation are displayed in Table 4-4.
Table 4-4. Degradation Measurements
Measurement Ab u urn c on cor d D aVIS F res no T racy
Change in inside coil insignificant .008 to .013 insignificant .011 to .016 insignificant temperature split increase increase
ICoF per day)
Change in outside heat .00043 increase insignificant .0007 decrease .0009 decrease .00035 decrease exchanger effectiveness l(per day)
Change in Suction line insignificant .008 drop insignificant .028 drop NA3
temp !(oF per day)
Change in liquid line .025 to .031 insignificant .035 increase .039 increase NA3
temp decrease ICoF per day)
Change in cycling .006 increase .006 increase insignificant .008 decrease .006 decrease sensible EER I(Btufwatthr per day)
The indoor coil of the AC2 unit is a typical evaporator coil and subject to the same fouling characteristics as standard units. One measure of indoor coil fouling is the increase in temperature split over time (corrected for other factors such as outside temperature). Two of the five AC2 units showed statistically significant temperature split increases over the course of the test period. The Concord unit showed an increase of 0.008 °F per day. The Fresno unit showed twice that rate (0.016 °F per day).
Of particular interest is the outside heat exchanger in the AC2 unit. The heat exchange coil submerged in the evaporative cooler sump could be subject to scaling or corrosion. Scaling would reduce the heat exchange. The Davis and Fresno units showed decreases in outdoor coil heat exchange effectiveness. The Auburn unit showed an increase in outside heat exchanger effectiveness.
It is advantageous to estimate the potential effect of changes in outdoor coil effectiveness. These effects were estimated based on the saturation temperature changes and their effect on compressor efficiency. This is further described in the Methodology Section.
The results of this analysis are displayed in Table 4-5
3 This unit had a fixed refrigerant metering device which make inference of coil temperatures impossible.
AC2 Investigation-- Final Report 4-9 Proctor Engineering Group
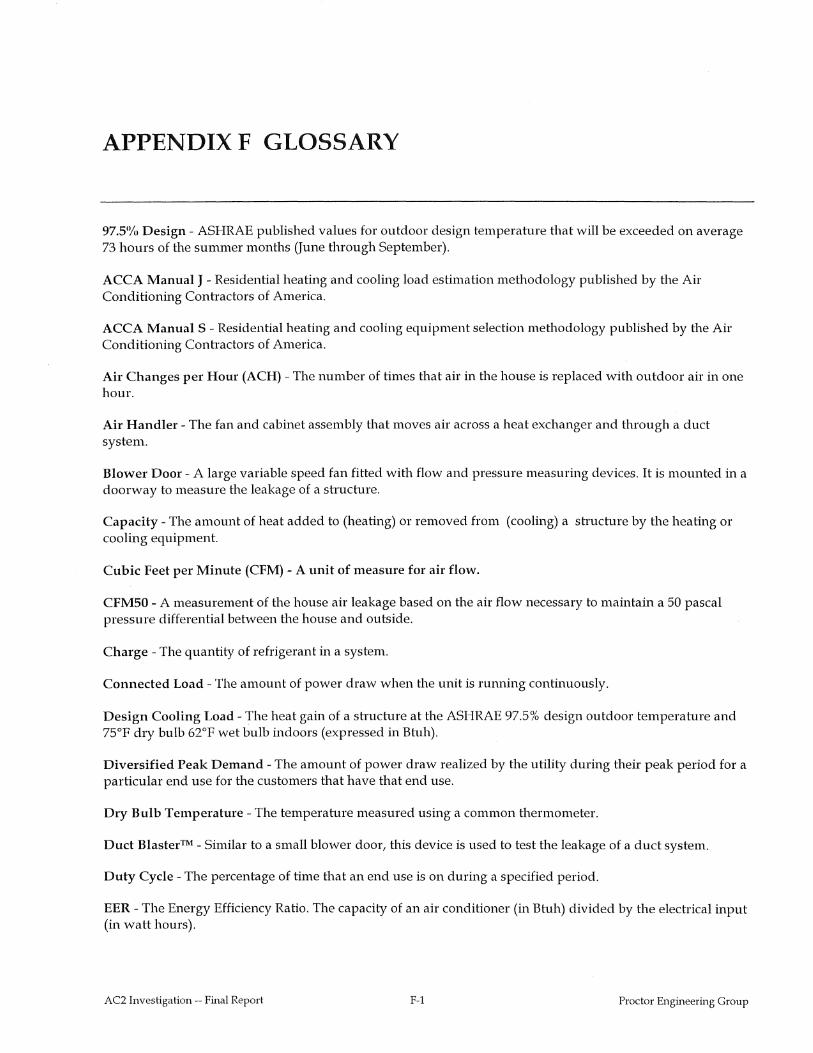
APPENDIX F GLOSSARY
97SYt, Design - ASHRAE published values for outdoor design temperature that will be exceeded on average 73 hours of the summer months (June through September).
ACCA Manual J - Residential heating and cooling load estimation methodology published by the Air Conditioning Contractors of America.
ACCA Manual S - Residential heating and cooling equipment selection methodology published by the Air Conditioning Contractors of America.
Air Changes per Hour (ACH) -The number of times that air in the house is replaced with outdoor air in one hour.
Air Handler - The fan and cabinet assembly that moves air across a heat exchanger and through a duct system.
Blower Door- A large variable speed fan fitted with flow and pressure measuring devices. It is mounted in a doorway to measure the leakage of a structure.
Capacity- The amount of heat added to (heating) or removed from (cooling) a structure by the heating or cooling equipment.
Cubic Feet per Minute (CFM) -A unit of measure for air flow.
CFM50 - A measurement of the house air leakage based on the air flow necessary to maintain a 50 pascal pressure differential between the house and outside.
Charge - The quantity of refrigerant in a system.
Connected Load- The amount of power draw when the unit is running continuously.
Design Cooling Load- The heat gain of a structure at the ASHRAE 97.5% design outdoor temperature and 75°F dry bulb 62°F wet bulb indoors (expressed in Btuh).
Diversified Peak Demand -The amount of power draw realized by the utility during their peak period for a particular end use for the customers that have that end use.
Dry Bulb Temperature -The temperature measured using a common thermometer.
Duct Blaster™ - Similar to a small blower door, this device is used to test the leakage of a duct system.
Duty Cycle -The percentage of time that an end use is on during a specified period.
EER - The Energy Efficiency Ratio. The capacity of an air conditioner (in Btuh) divided by the electrical input (in watt hours).
AC2 Investigation-- Final Report F-1 Proctor Engineering Group
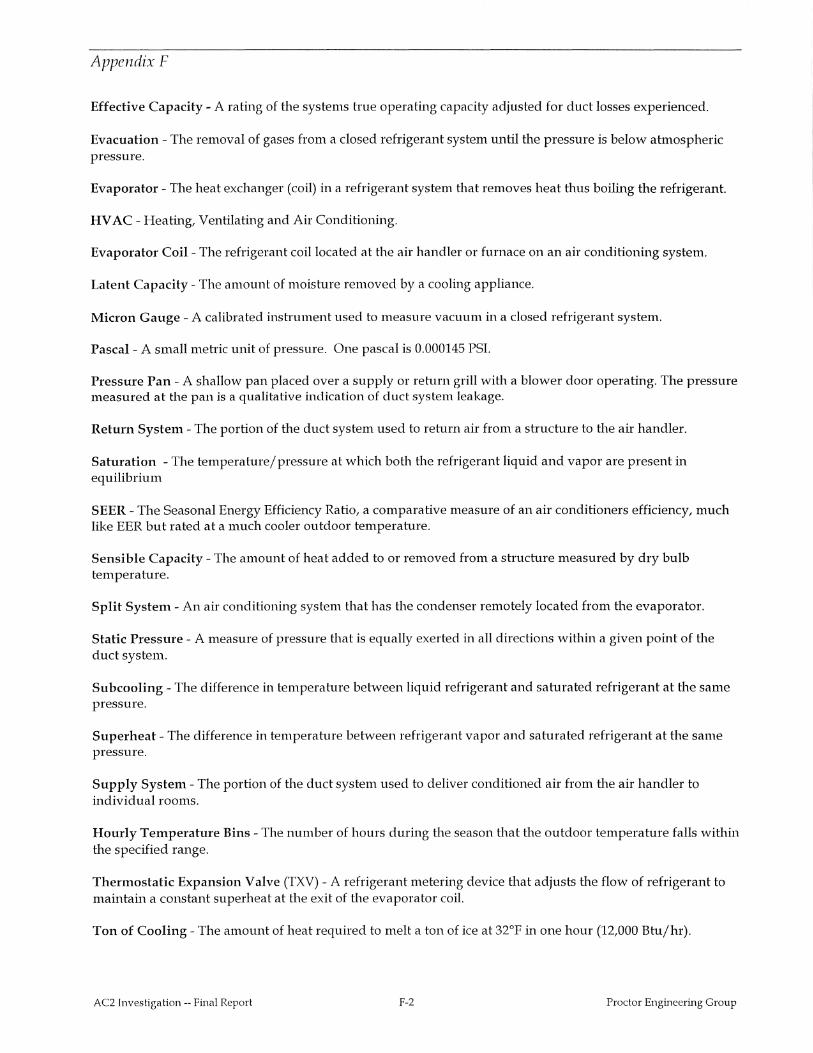
Appendix F
Effective Capacity- A rating of the systems h·ue operating capacity adjusted for duct losses experienced.
Evacuation - The removal of gases from a closed refrigerant system until the pressure is below ahnospheric pressure.
Evaporator- The heat exchanger (coil) in a refrigerant system that removes heat thus boiling the refrigerant.
HV AC- Heating, Ventilating and Air Conditioning.
Evaporator Coil - The refrigerant coil located at the air handler or furnace on an air conditioning system.
Latent Capacity - The amount of moisture removed by a cooling appliance.
Micron Gauge - A calibrated insh·ument used to measure vacuum in a closed refrigerant system.
Pascal- A small mehic unit of pressure. One pascal is 0.000145 PSI.
Pressure Pan - A shallow pan placed over a supply or rehun grill with a blower door operating. The pressure measured at the pan is a qualitative indication of duct system leakage.
Return System -The portion of the duct system used to return air from a shucture to the air handler.
Saturation -The temperature/pressure at which both the refrigerant liquid and vapor are present in equilibrium
SEER - The Seasonal Energy Efficiency Ratio, a comparative measure of an air conditioners efficiency, much like EER but rated at a much cooler outdoor temperature.
Sensible Capacity- The amount of heat added to or removed from a structure measured by dry bulb temperature.
Split System - An air conditioning system that has the condenser remotely located from the evaporator.
Static Pressure - A measure of pressure that is equally exerted in all directions within a given point of the duct system.
Subcooling- The difference in temperature between liquid refrigerant and sahuated refrigerant at the same pressure.
Superheat - The difference in temperature between refrigerant vapor and saturated refrigerant at the same pressure.
Supply System -The portion of the duct system used to deliver conditioned air from the air handler to individual rooms.
Hourly Temperature Bins- The number of hours during the season that the outdoor temperature falls within the specified range.
Thermostatic Expansion Valve (TXV) - A refrigerant metering device that adjusts the flow of refrigerant to maintain a constant superheat at the exit of the evaporator coil.
Ton of Cooling- The amount of heat required to melt a ton of ice at 32°F in one hour (12,000 Btu/hr).
AC2 Investigation-- Final Report F-2 Proctor Engineering Group
Appendix F
Unconditioned Space- The part of a struchue that is not intentionally heated or cooled by the heating or cooling equipment.
Weighing in Charge -A method of charging refrigerant systems by using a scale.
Wet Bulb Temperature- The temperature measured by a thermometer covered with a wet wick with air blowing across it. The measured temperature is lower than the dry bulb temperature and is a measure of moisture in the air.
AC2 Investigation-- Final Report F-3 Proctor Engineering Group
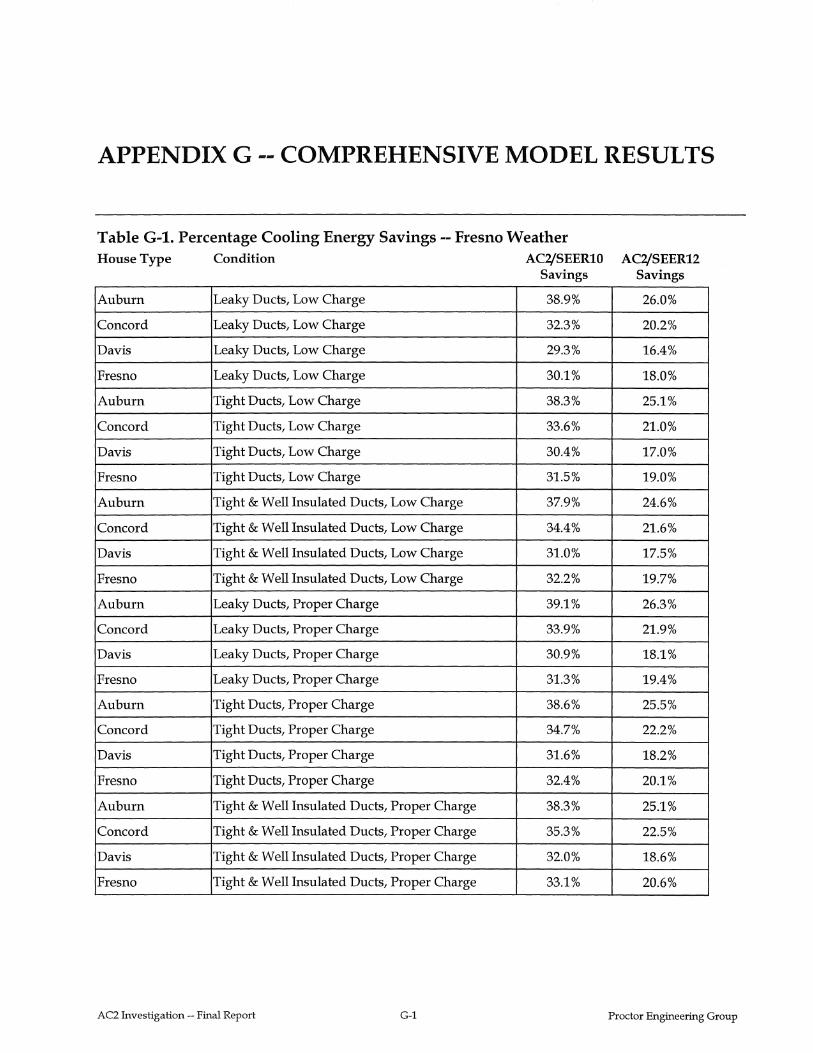
APPENDIX G --COMPREHENSIVE MODEL RESULTS
Table G-1. Percentage Cooling Energy Savings-- Fresno Weather House Type Condition AC2/SEER10 AC2/SEER12
Savings Savings
Auburn Leaky Ducts, Low Charge 38.9% 26.0%
Concord Leaky Ducts, Low Charge 32.3% 20.2%
Davis Leaky Ducts, Low Charge 29.3% 16.4%
Fresno Leaky Ducts, Low Charge 30.1% 18.0%
Auburn Tight Ducts, Low Charge 38.3% 25.1%
Concord Tight Ducts, Low Charge 33.6% 21.0%
Davis Tight Ducts, Low Charge 30.4% 17.0%
Fresno Tight Ducts, Low Charge 31.5% 19.0%
Auburn Tight & Well Insulated Ducts, Low Charge 37.9% 24.6%
Concord Tight & Well Insulated Ducts, Low Charge 34.4% 21.6%
Davis Tight & Well Insulated Ducts, Low Charge 31.0% 17.5%
Fresno Tight & Well Insulated Ducts, Low Charge 32.2% 19.7%
Auburn Leaky Ducts, Proper Charge 39.1% 26.3%
Concord Leaky Ducts, Proper Charge 33.9% 21.9%
Davis Leaky Ducts, Proper Charge 30.9% 18.1%
Fresno Leaky Ducts, Proper Charge 31.3% 19.4%
Auburn Tight Ducts, Proper Charge 38.6% 25.5%
Concord Tight Ducts, Proper Charge 34.7% 22.2%
Davis Tight Ducts, Proper Charge 31.6% 18.2%
Fresno Tight Ducts, Proper Charge 32.4% 20.1%
Auburn Tight & Well Insulated Ducts, Proper Charge 38.3% 25.1%
Concord Tight & Well Insulated Ducts, Proper Charge 35.3% 22.5%
Davis Tight & Well Insulated Ducts, Proper Charge 32.0% 18.6%
Fresno Tight & Well Insulated Ducts, Proper Charge 33.1% 20.6%
AC2 Investigation-- Final Report G-1 Proctor Engineering Group
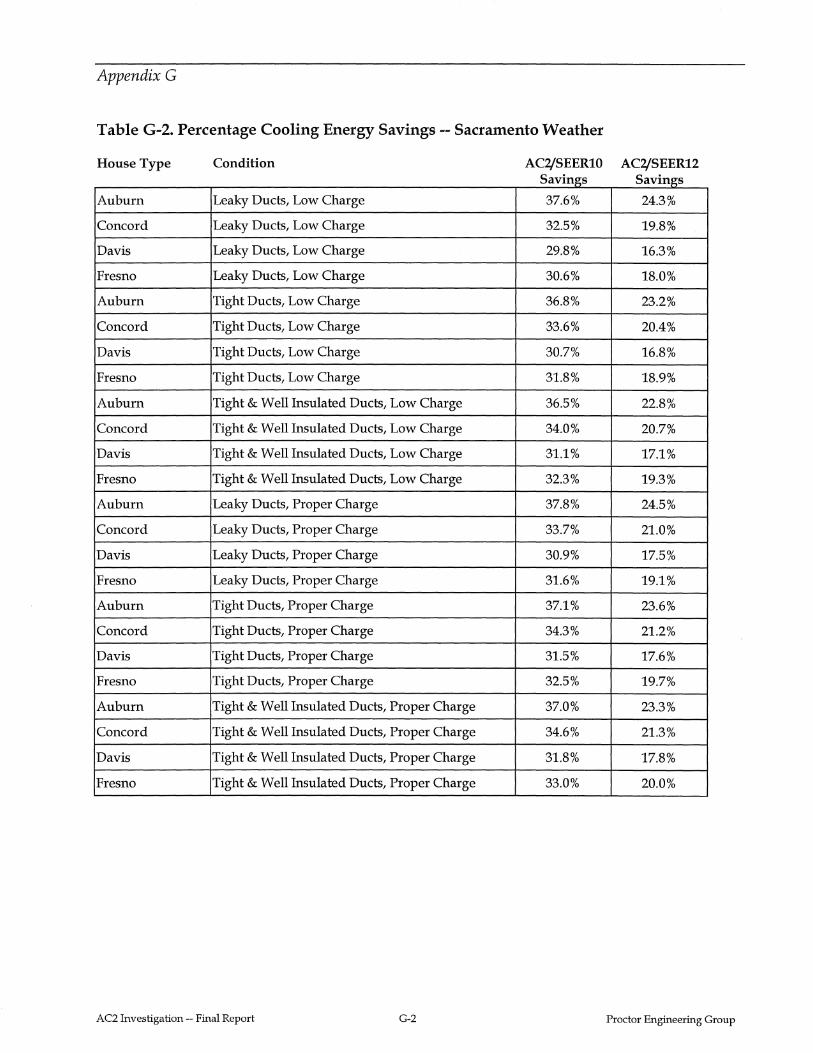
Appendix G
Table G-2. Percentage Cooling Energy Savings-- Sacramento Weather
House Type Condition
Auburn Leaky Ducts, Low Charge
Concord Leaky Ducts, Low Charge
Davis Leaky Ducts, Low Charge
Fresno Leaky Ducts, Low Charge
Auburn Tight Ducts, Low Charge
Concord Tight Ducts, Low Charge
Davis Tight Ducts, Low Charge
Fresno Tight Ducts, Low Charge
Auburn Tight & Well Insulated Ducts, Low Charge
Concord Tight & Well Insulated Ducts, Low Charge
Davis Tight & Well Insulated Ducts, Low Charge
Fresno Tight & Well Insulated Ducts, Low Charge
Auburn Leaky Ducts, Proper Charge
Concord Leaky Ducts, Proper Charge
Davis Leaky Ducts, Proper Charge
Fresno Leaky Ducts, Proper Charge
Auburn Tight Ducts, Proper Charge
Concord Tight Ducts, Proper Charge
Davis Tight Ducts, Proper Charge
Fresno Tight Ducts, Proper Charge
Auburn Tight & Well Insulated Ducts, Proper Charge
Concord Tight & Well Insulated Ducts, Proper Charge
Davis Tight & Well Insulated Ducts, Proper Charge
Fresno Tight & Well Insulated Ducts, Proper Charge
AC2 Investigation - Final Report G-2
AC2/SEER10 s . avtngs
37.6%
32.5%
29.8%
30.6%
36.8%
33.6%
30.7%
31.8%
36.5%
34.0%
31.1%
32.3%
37.8%
33.7%
30.9%
31.6%
37.1%
34.3%
31.5%
32.5%
37.0%
34.6%
31.8%
33.0%
AC2/SEER12 s . avtngs
24.3%
19.8%
16.3%
18.0%
23.2%
20.4%
16.8%
18.9%
22.8%
20.7%
17.1%
19.3%
24.5%
21.0%
17.5%
19.1%
23.6%
21.2%
17.6%
19.7%
23.3%
21.3%
17.8%
20.0%
Proctor Engineering Group
APPENDIX H -- REFERENCES
Blasnik, M., J. Proctor, T. Downey, J. Sundal, and G. Peterson. 1995. Assessment ofHVAC Installations in New Homes in Nevada Power Company's Service Territory. EPRI Report TR-105309 Palo Alto, CA: Electric Power Research Institute.
Blasnik, M., T. Downey, J. Proctor, and G. Peterson. 1996. Assessment ofHVAC Installations in New Homes in APS Service Territory. San Rafael, CA: Proctor Engineering Group.
Jung, L. 1987. Impact of Air-Filter Condition on HVAC Equipment. Rpt. ORNL-TM-9894. Oak Ridge, TN: Oak Ridge National Laboratory.
Palmiter L. and T. Bond. 1991. "Interaction of Mechanical Systems and Natural Infiltration." Proceedings from the AIVC Conference on Air Movement and Ventalation Control within Buildings.
Proctor J. and Z. Katsnelson. 1995. PG&E Final Report-- Residential Cooling Load Calculation Methods Analysis. San Francisco, CA: Pacific Gas & Electric Company.
Proctor, J., T. Downey, M. Blasnik, and G. Peterson. 1997. Residential New Construction Pilots in Nevada Power Company Service Territory. EPRI Report TR-108445 Palo Alto, CA: Electric Power Research Institute.
Stata Corporation. 1997. Stata Reference Manual Release 5 Volume 3 P-Z. College Station, TX: Stata Press.
AC2 Investigation -- Final Report H-1 Proctor Engineering Group
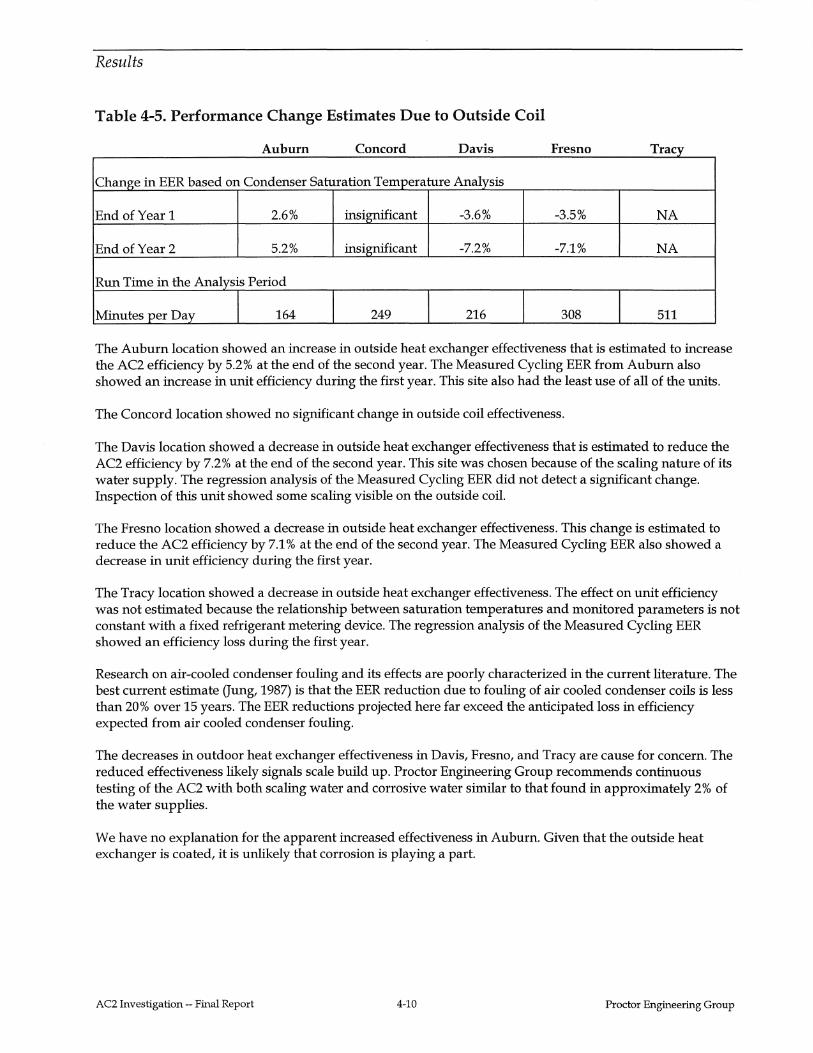
Results
Table 4-5. Performance Change Estimates Due to Outside Coil
Ab u urn c one or d D aVIS F resno T racy
Change in EER based on Condenser Saturation Temperature Analysis
EndofYear1 2.6% insignificant -3.6% -3.5% NA
End of Year 2 5.2% insignificant -7.2% -7.1% NA
Run Time in the Analysis Period
Minutes per Day 164 249 216 308 511
The Auburn location showed an increase in outside heat exchanger effectiveness that is estimated to increase the AC2 efficiency by 5.2% at the end of the second year. The Measured Cycling EER from Auburn also showed an increase in unit efficiency during the first year. This site also had the least use of all of the units.
The Concord location showed no significant change in outside coil effectiveness.
The Davis location showed a decrease in outside heat exchanger effectiveness that is estimated to reduce the AC2 efficiency by 7.2% at the end of the second year. This site was chosen because of the scaling nature of its water supply. The regression analysis of the Measured Cycling EER did not detect a significant change. Inspection of this unit showed some scaling visible on the outside coil.
The Fresno location showed a decrease in outside heat exchanger effectiveness. This change is estimated to reduce the AC2 efficiency by 7.1% at the end of the second year. The Measured Cycling EER also showed a decrease in unit efficiency during the first year.
The Tracy location showed a decrease in outside heat exchanger effectiveness. The effect on unit efficiency was not estimated because the relationship between saturation temperatures and monitored parameters is not constant with a fixed refrigerant metering device. The regression analysis of the Measured Cycling EER showed an efficiency loss during the first year.
Research on air-cooled condenser fouling and its effects are poorly characterized in the current literature. The best current estimate Gung, 1987) is that the EER reduction due to fouling of air cooled condenser coils is less than 20% over 15 years. The EER reductions projected here far exceed the anticipated loss in efficiency expected from air cooled condenser fouling.
The decreases in outdoor heat exchanger effectiveness in Davis, Fresno, and Tracy are cause for concern. The reduced effectiveness likely signals scale build up. Proctor Engineering Group recommends continuous testing of the AC2 with both scaling water and corrosive water similar to that found in approximately 2% of the water supplies.
We have no explanation for the apparent increased effectiveness in Auburn. Given that the outside heat exchanger is coated, it is unlikely that corrosion is playing a part.
AC2 Investigation - Final Report 4-10 Proctor Engineering Group
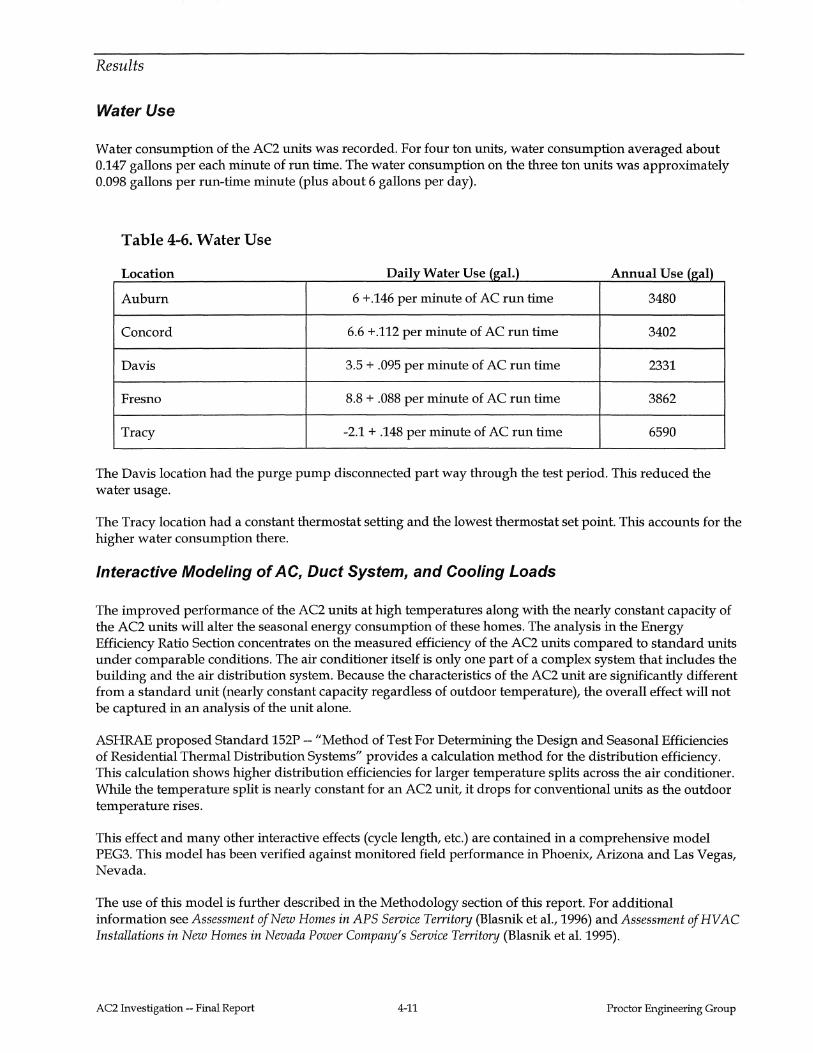
Results
Water Use
Water consumption of the AC2 units was recorded. For four ton units, water consumption averaged about 0.147 gallons per each minute of run time. The water consumption on the three ton units was approximately 0.098 gallons per run-time minute (plus about 6 gallons per day).
Table 4-6. Water Use
Location Daily Water Use (gal.) Annual Use (gal)
Auburn 6 +.146 per minute of AC run time 3480
Concord 6.6 +.112 per minute of AC run time 3402
Davis 3.5 + .095 per minute of AC run time 2331
Fresno 8.8 + .088 per minute of AC run time 3862
Tracy -2.1 + .148 per minute of AC run time 6590
The Davis location had the purge pump disconnected part way through the test period. This reduced the water usage.
The Tracy location had a constant thermostat setting and the lowest thermostat set point. This accounts for the higher water consumption there.
Interactive Modeling of AC, Duct System, and Cooling Loads
The improved performance of the AC2 units at high temperatures along with the nearly constant capacity of the AC2 units will alter the seasonal energy consumption of these homes. The analysis in the Energy Efficiency Ratio Section concentrates on the measured efficiency of the AC2 units compared to standard units under comparable conditions. The air conditioner itself is only one part of a complex system that includes the building and the air distribution system. Because the characteristics of the AC2 unit are significantly different from a standard unit (nearly constant capacity regardless of outdoor temperature), the overall effect will not be captured in an analysis of the unit alone.
ASHRAE proposed Standard 152P --"Method of Test For Determining the Design and Seasonal Efficiencies of Residential Thermal Distribution Systems" provides a calculation method for the distribution efficiency. This calculation shows higher distribution efficiencies for larger temperature splits across the air conditioner. While the temperature split is nearly constant for an AC2 unit, it drops for conventional units as the outdoor temperature rises.
This effect and many other interactive effects (cycle length, etc.) are contained in a comprehensive model PEG3. This model has been verified against monitored field performance in Phoenix, Arizona and Las Vegas, Nevada.
The use of this model is further described in the Methodology section of this report. For additional information see Assessment of New Homes in APS Service Territory (Blasnik et al., 1996) and Assessment of HV AC Installations in New Homes in Nevada Power Company's Service Territory (Blasnik et al. 1995).
AC2 Investigation-- Final Report 4-11 Proctor Engineering Group
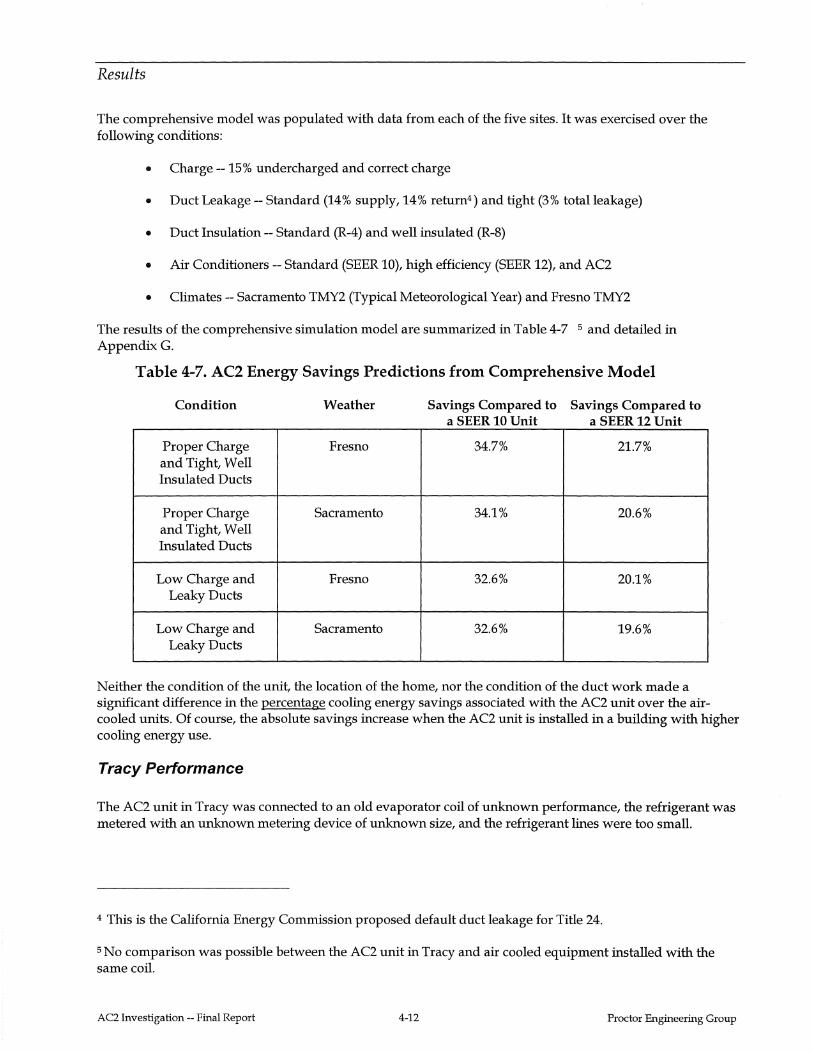
Results
The comprehensive model was populated with data from each of the five sites. It was exercised over the following conditions:
• Charge -- 15% undercharged and correct charge
• Duct Leakage-- Standard (14% supply, 14% return4 ) and tight (3% total leakage)
• Duct Insulation-- Standard (R-4) and well insulated (R-8)
• Air Conditioners-- Standard (SEER 10), high efficiency (SEER 12), and AC2
• Climates-- Sacramento TMY2 (Typical Meteorological Year) and Fresno TMY2
The results of the comprehensive simulation model are summarized in Table 4-7 5 and detailed in Appendix G.
Table 4-7. AC2 Energy Savings Predictions from Comprehensive Model
Condition
Proper Charge and Tight, Well Insulated Ducts
Proper Charge and Tight, Well Insulated Ducts
Low Charge and Leaky Ducts
Low Charge and Leaky Ducts
Weather
Fresno
Sacramento
Fresno
Sacramento
Savings Compared to a SEER 10 Unit
34.7%
34.1%
32.6%
32.6%
Savings Compared to a SEER 12 Unit
21.7%
20.6%
20.1%
19.6%
Neither the condition of the unit, the location of the home, nor the condition of the duct work made a significant difference in the percentage cooling energy savings associated with the AC2 unit over the aircooled units. Of course, the absolute savings increase when the AC2 unit is installed in a building with higher cooling energy use.
Tracy Performance
The AC2 unit in Tracy was connected to an old evaporator coil of unknown performance, the refrigerant was metered with an unknown metering device of unknown size, and the refrigerant lines were too small.
4 This is the California Energy Commission proposed default duct leakage for Title 24.
5 No comparison was possible between the AC2 unit in Tracy and air cooled equipment installed with the same coil.
AC2 Investigation-- Final Report 4-12 Proctor Engineering Group
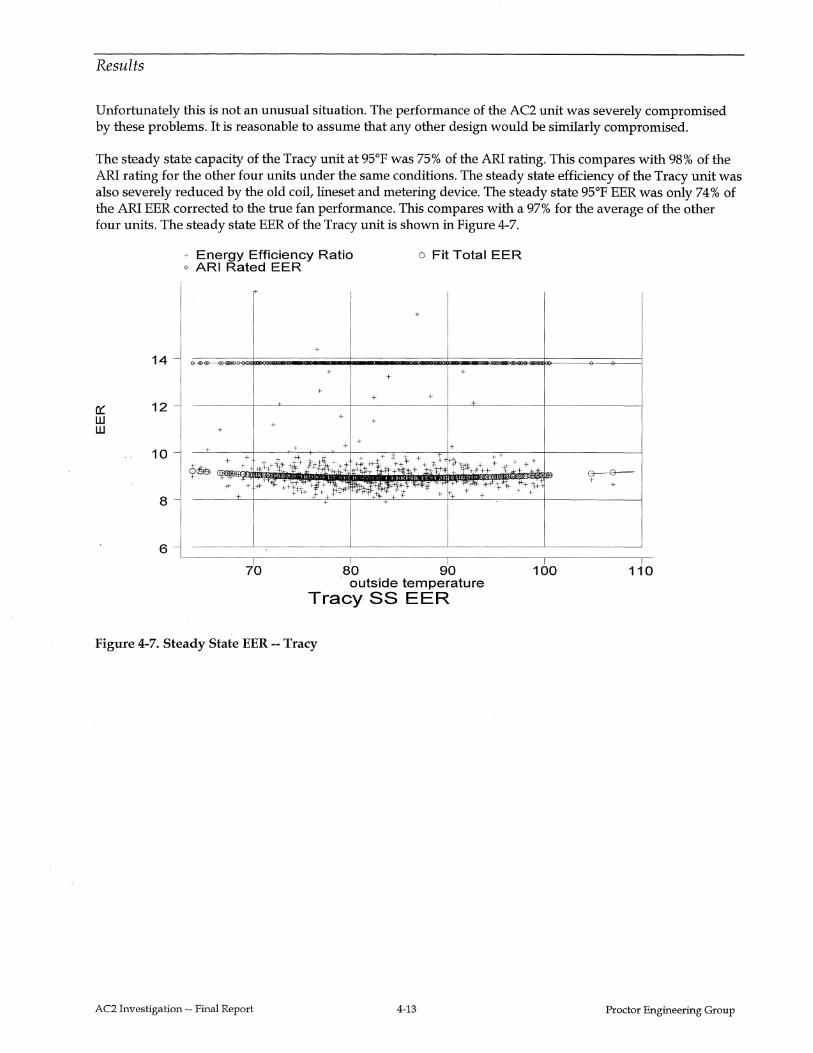
Results
Unfortunately this is not an unusual situation. The performance of the AC2 unit was severely compromised by these problems. It is reasonable to assume that any other design would be similarly compromised.
The steady state capacity of the Tracy unit at 95°F was 75% of the ARI rating. This compares with 98% of the ARI rating for the other four units under the same conditions. The steady state efficiency of the Tracy unit was also severely reduced by the old coil, lineset and metering device. The steady state 95°F EER was only 74% of the ARI EER corrected to the true fan performance. This compares with a 97% for the average of the other four units. The steady state EER of the Tracy unit is shown in Figure 4-7.
14
0:: 12 w w
10
8
6
+ Energy Efficiency Ratio o ARI Rated EER
o Fit Total EER
+
+
+ + + +
+ +
+ + + +
+ + + + + +
*t++\• .(+ 1-t.;ti..:;::t + ~k~ t + + }+.: + t+ + + + 0~ + I :4;.::~;,+ ±-~-*:~::~ j-'¥t-+-t++ f b+ o<lc +
* + * n-<f ++!v:'+(j):t'; h1fl-'1"f + -.,:- '+1-fCt""it- :++itt-+ ~'++ + + +
70 80 90 100 · outside temperature
Tracy SS EER
Figure 4-7. Steady State EER --Tracy
AC2 Investigation -- Final Report 4-13
0 0 + +
110
Proctor Engineering Group
V. CONCLUSIONS AND RECOMMENDATIONS
The AC2 system shows considerable technical merit. Proctor Engineering Group is extremely enthusiastic about the performance of these units, particularly at high temperatures. On the average, the analysis predicts a cooling kWh savings of 32% to 34% when compared to a SEER 10 and a savings of 20% to 22% savings compared to a SEER 12 air conditioner. These percentage savings are nearly independent of the duct system and building shell. Under peak conditions these units maintain a much higher efficiency than both SEER 10 and SEER 12 units. These units are particularly attractive for peak reduction.
The enthusiasm for the performance of the AC2 is tempered by three concerns. First, the quality of the product as delivered for this project was unsatisfactory. Second, the monitored data indicated a potential problem with the outside heat exchanger. The potential problem is lost efficiency due to scaling. Third, the training and factory documentation provided were insufficient to ensure proper installation and service of this equipment.
When the AC2 system has component problems corrected, an effective quality assurance system in place, and is installed by a well-trained technician following proper installation procedures, the unit should operate with a very high efficiency. The long term reliability of the AC2 system was not tested in this project. Many of the components of the AC2 unit are identical with an air-cooled system. The evaporative cooler portion of the system adds complexity and thus potential for lower reliability. This complexity is a primary reason why better training and quality assurance are important to the adoption of this technology.
The outdoor heat exchanger is the component that requires the greatest attention to long term reliability. This study did not dispel fears that the outside heat exchanger might scale over time and that the scaling could produce a significant drop in capacity and efficiency.
Conclusions
• Efficiency and Performance
The AC2 unit is extremely efficient, particularly at high outdoor temperatures. It is very well suited to the climate within PG&E' s service territory.
The AC2 is projected to save the customer 32% to 34% of their cooling energy consumption when compared to a SEER 10 air conditioner. It will save 20% to 22% when compared to a SEER 12 unit.
The AC2 has a capacity and efficiency that is virtually unaffected by outdoor temperature. Its advantage over standard air cooled units (of all efficiencies) increases with outdoor temperature. This air conditioner is particularly appropriate for peak demand reduction.
Large losses remain with the air handling system. In Fresno for example 27% of the total watt draw of the unit is inside fan power. In Auburn the power draw of the inside fan is 960 watts. On the average, steady state EER at 95°F dropped from 17.4 to 12.3 when the heat and watt draw of the inside fan is added to the outside unit performance.
AC2 Investigation-- Final Report 5-1 Proctor Engineering Group
Conclusions & Recommendations
• Reliability
The units installed in this project all had substantial problems with their initial function. These problems can be reduced with a significant quality assurance effort at the factory.
• Scaling and Water Quality
The decreases in outdoor heat exchanger effectiveness are cause for concern. The reduced effectiveness at Davis, Fresno, and Tracy likely signals scale build up. The composition of the water at each site is likely to affect the amount of scaling at that site.
• Installation Cost (present and future) and Difficulties
• Sizing
AC2 installation costs should be comparable with properly installed SEER 12 air cooled units over the long term. In new construction the only differences are the installation of the water line and drain line (approximately 1/2 hour increase in installation time). In retrofit applications the AC2 will require the installation of the water line, the drain line, and a larger suction line (also needed for many SEER 12 units). This could be as little as one hour of additional time (as it was in three of the program installations) or as great as six hours (as it was in one program installation).
Obviously the installing technician should not have to repair the unit as it is delivered from the factory. Poor quality from the factory can make proper installation very time consuming.
Air conditioners sized to meet Manual J calculated loads will produce cooling capacity in excess of the needs of the house.
The manufacturers' data for AC performance provides a good estimate for air conditioner performance as long as the results are corrected to actual fan watt draw, actual return air conditions, and cycling losses.
RTI' s suggestion that the air conditioners be sized by square footage encourages oversizing and unnecessarily increases the first cost of the air conditioner as well as of the duct system. At the same time oversizing often results in higher duct pressures, increasing the already excessive fan power draw.
• Some Keys to Success with a New Technology
To achieve a successful entrance into the market and provide reliable service, RTI must increase the effectiveness of the installation and service technician training. The AC2 technology is more complex than air-cooled systems. Correct installation and servicing require the technician to better understand the operation of the AC2 and the differences between it and air-cooled systems. Training program changes are needed to produce a smooth introduction of the AC2.
Installation technicians need hands on training on how to correctly install and service AC2 systems. Training of the owner or lead technician is insufficient to obtain proper installations.
It is critical that complete and clear documentation be provided. The installation instructions need to be written with the assumption that the installation technician did not receive any training on the AC2 system.
AC2 Investigation - Final Report 5-2 Proctor Engineering Group
Conclusions & Recommendations
Recommendations
Proctor Engineering Group recommends that:
• any PG&E promotion of the AC2 units should be tied to quality assurance at two levels: Manufacturer -product function, training, documentation, and technical support; Contractor -- certifying proper sizing, brazing, evacuation, charge, and air flow.
• the AC2 undergo continuous testing with both scaling water and corrosive water similar to that found in approximately 2% of the water supplies.
• PG&E investigate and promote lower watt draw fan/ motor/ air distribution systems with particular attention to inlet and exit conditions as well as low static pressure.
• PG&E investigate the effects of smaller refrigerant line sizes on air conditioner performance.
AC2 Investigation-- Final Report 5-3 Proctor Engineering Group
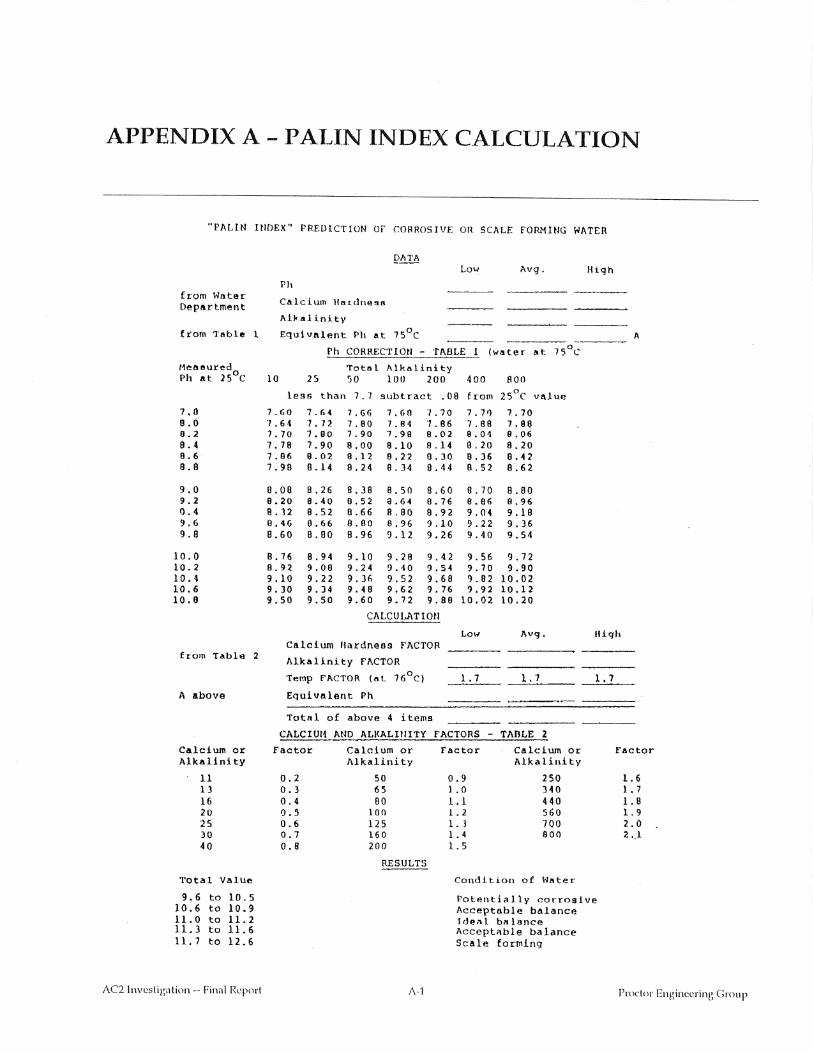
APPENDIX A - PALIN INDEX CALCULATION
"PALIN INDEX" PREDlCTION OF I":ORROSIVE OR SCALE FORMitiG WATER
from Water Department
from Table 1
l1t!!!UIUr~d0 Ph at 25 C
?,B 8.0 8.2 9.4 8.6 8.8
9.0 9.2 0.4 9.6 9.8
10.0 10.2 10.4 10.6 10.8
fro•n Table 2
A above
Calcium or Alkalinity
11 13 16 20 25 30 40
Total Value
9. 6 to 10.5 10.6 to 10.9 11.0 to 11.2 11.3 to 11.6 11.7 to 12.6
AC2 Investigation-- Final Report
Low lwg.
Ph
Calcium llauln .. so
1\llralinity
Equivalent Ph at 75°C
Ph CORRECT!Otl - TI\DLE 1 (wa~~o~ Tot11l Alkalinity
10 25 so too 200 4oo ROO
less than 7.1 subtract .08 from 25°C value 7. 60 7.64 7.70 7.78 7.86 7.99
8.00 8.20 8. 32 9.46 B. 60
8.16 8.92 9.10 9.30 9.50
7.6( '1 • '1 '-7.00 1.90 8.02 8.14
9.26 8.40 8.52 0.66 B.BO
8. 94 9,09 9.22 9.)4 9.50
7,66 7.80 7. 90 8.00 9,12 8.24
8.38 9.52 9.66 8.90 8.96
7.60 7. 84 7.98 9.10 8.22 8. 34
8,50 8.6~
B.BO 8,96 9.12
'/, 70 7.86 8.02 8.14 0.30 9.-14
8.60 8.76 8.92 9.10 9.26
9.10 9.28 9.42 9.24 9.40 9.54 9.)/; 9.52 9.68 9.48 9.62 9.76 9.60 9.72 9.88
CI\LCULATlOtl
7. ?rl 7. 88 8.01 0.20 8. )6 9.52
8. 70 8.06 9.04 9.22 9.40
9.56 9.10 9. 82 ?.92
10.02
7.70 7.88 8.06 8.20 9.42 8.62
B.BO 8.96 9.19 9. 36 9.54
9.72 9.90
10.02 10.12 10.20
Hiqh
A
Low Jlvg. lligh
Calcium Hardness FACTOR ---- ----~ ---Alkalinity FACTOR
Temp FACTOR (Ill 76°C)
Equivalent Ph
Total of above 4 items
1.1 1.1 1.7
CALCIUI1 AND ALI<ALIIII'l:Y FACTORS - TABLE 2
Factor
0.2 0.3 0.4 1).~
0.6 0.7 0.8
Calcium or 1\lkalini ty
50 65 80
100 125 160 ;!00
RESULTS
Factor
0.9 1. 0 1.1 1.2 1.3 1.4 1.5
Calcium or Alkalinity
250 :l40 440 560 700 800
Condi~ion of Water
Potentially corrosive Acceptable balance lde;,t b,otlance Acceptable balance Scale forming
Factor
1.6 )..7
1.8 1.9 2.0 2 •. 1
Proctor Engineering Group
APPENDIX B -- RECRUITMENT SURVEY, SITE
TESTING, AND DATA ACQUISITION FORM
The field site questioru1aire dish·ibuted to interested potential participants is presented in this Appendix. Also presented is the step by step procedure to test the house.
AC2 Investigation-- Final Report B-1 Proctor Engineering Group
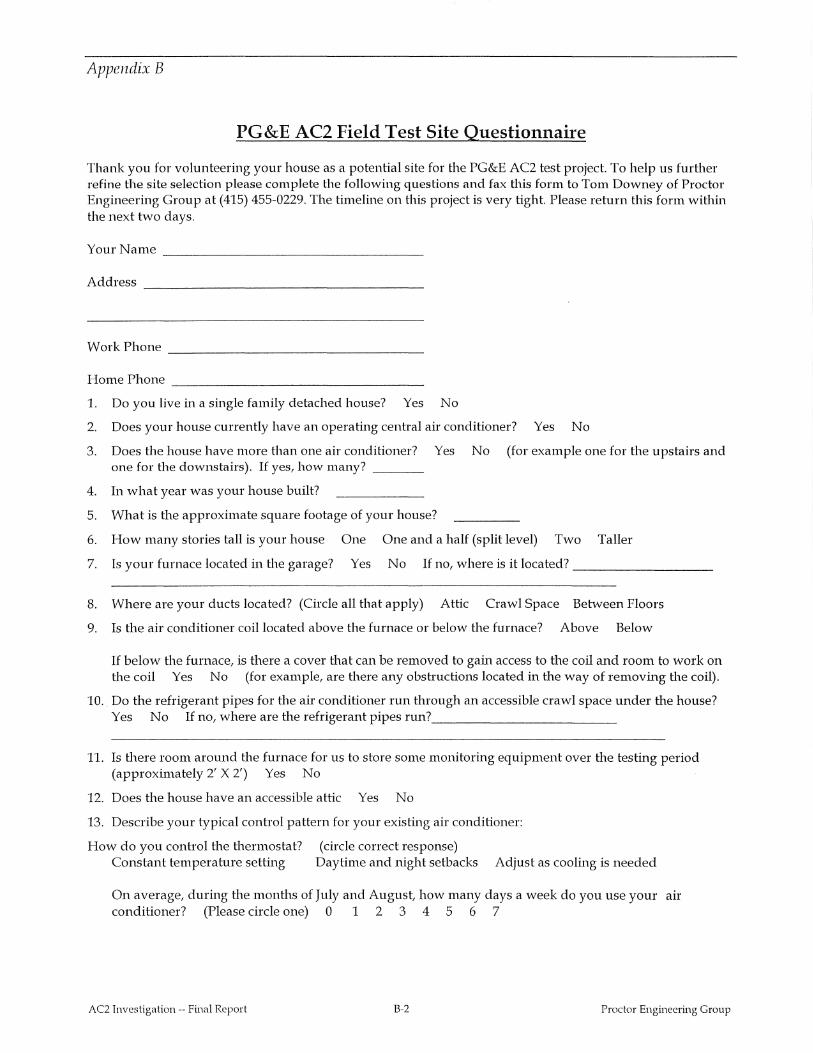
Appendix B
PG&E AC2 Field Test Site Questionnaire
Thank you for volunteering your house as a potential site for the PG&E AC2 test project. To help us further refine the site selection please complete the following questions and fax this form to Tom Downey of Proctor Engineering Group at (415) 455-0229. The timeline on this project is very tight. Please return this form within the next two days.
Your~arne ------------------------------------
Address -----------------------------------
Work Phone ----------------------------------
Horne Phone ---------------------------------
1. Do you live in a single family detached house? Yes ~o
2. Does your house currently have an operating cenh·al air conditioner? Yes ~o
3. Does the house have more than one air conditioner? Yes ~o (for example one for the upstairs and one for the downstairs). If yes, how many? ______ _
4. In what year was your house built?
5. What is the approximate square footage of your house?
6. How many stories tall is your house One One and a half (split level) Two Taller
7. Is your furnace located in the garage? Yes ~o If no, where is it located?-------------------
8. Where are your ducts located? (Circle all that apply) Attic Crawl Space Between Floors
9. Is the air conditioner coil located above the furnace or below the furnace? Above Below
If below the furnace, is there a cover tl1at can be removed to gain access to the coil and room to work on the coil Yes ~o (for example, are there any obsh·uctions located in the way of removing the coil).
10. Do the refrigerant pipes for the air conditioner run through an accessible crawl space under the house? Yes ~o If no, where are the refrigerant pipes run? ________________________ _
11. Is there room around the furnace for us to store some monitoring equipment over the testing period (approximately 2' X 2') Yes ~o
12. Does the house have an accessible attic Yes ~o
13. Describe your typical conhol pattern for your existing air conditioner:
How do you conhol the thermostat? Constant temperature setting
(circle correct response) Daytime and night setbacks Adjust as cooling is needed
On average, during the months of July and August, how many days a week do you use your air conditioner? (Please circle one) 0 1 2 3 4 5 6 7
AC2 Investigation-- Final Report B-2 Proctor Engineering Group
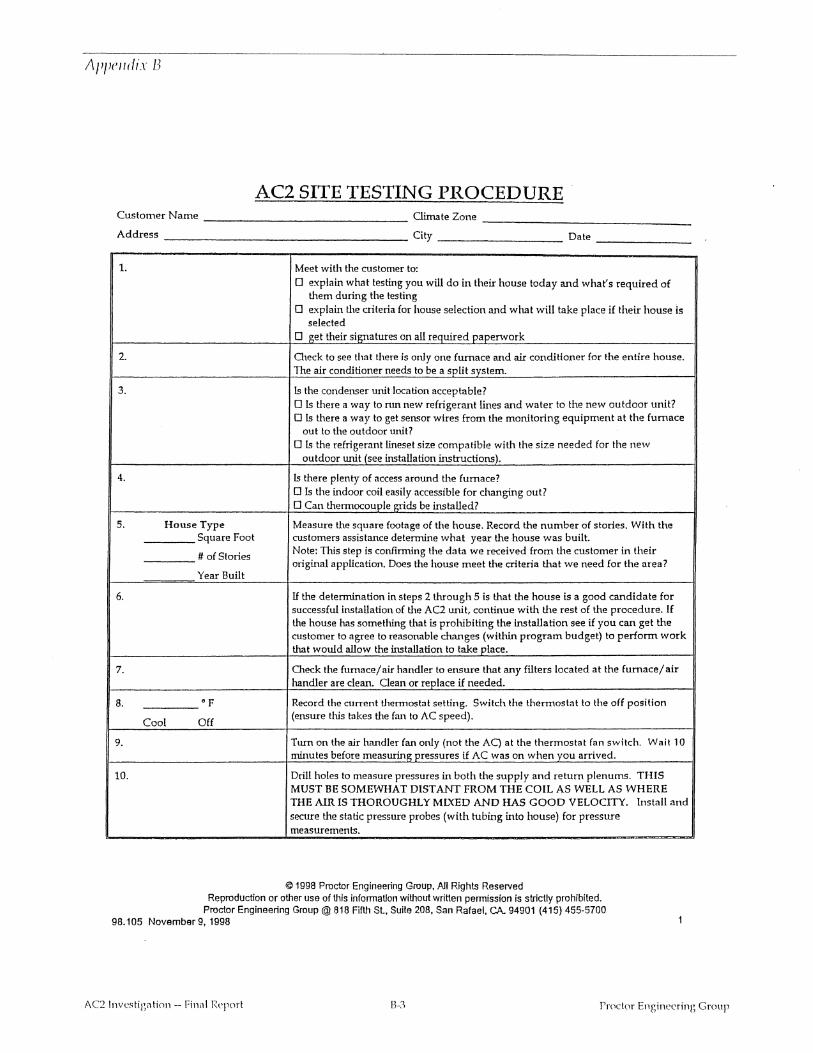
Appendix B
AC2 SITE TESTING PROCEDURE Customer Name ---------------- Oimate Zone -----------------
Address ------------------ City --------- Date -------
1. Meet with the customer to: 0 explain what testing you will do in their house today and what's required of
them during the testing 0 explain U1e criteria for house selection and what will take place if their house is
selected 0 get their signatures on all required paperwork
2. Check to see that there is only one furnace and air conditioner for the entire house. The air conditioner needs to be a split system.
3. Is the condenser unit location acceptable? 0 Is there a way to run new refrigerant lines and water to the new outdoor unit? 0 Is there a way to get sensor wires from the monitoring equipment at the furnace
out to the outdoor unit? 0 Is the refrigerant lineset size compatible with the size needed for the new
outdoor unit (see installation instructions).
4. Is there plenty of access around the furnace? 0 Is the indoor coil easily accessible for changing out? 0 Can iliermocouple grids be installed?
s. House Type Measure the square footage of the house. Record the number of stories. With the Square Foot customers assistance determine what year the house was built.
#of Stories Note: Tius step is confirming the data we received from the customer in their original application. Does the house meet the criteria that we need for the area?
Year Built
6. U the determination in steps 2 through 5 is that the house is a good candidate for successful installation of the AC2 unit, continue with the rest of the procedure. lf ilie house has something that is prohibiting the installation see if you can get the customer to agree to reasonable changes (within program budget) to perform work that would allow the installation to take place.
7. Check the furnace/ air handler to ensure that any filters located at the furnace/ air handler are clean. Clean or replace if needed.
8. •p Record the current thermostat setting. Switch the thermostat to the off position
Cool Off (ensure this takes the fan to AC speed).
9. Tum on the air handler fan only (not the Aq at the thermostat fan switch. Wait 10 minutes before measuring pressures if AC was on when you arrived.
10. Drill holes to measure pressures in both the supply and return plenums. THIS MUST BE SOMEWHAT DISTANf FROM THE COIL AS WELL AS WHERE THE AIR IS THOROUGHLY MIXED AND HAS GOOD VELOCITY. Install and secure the static pressure probes (with tubing into house) for pressure measurements.
@ 1998 Proctor Engineering Group, All Rights Reserved Reproduction or other use of this information without written permission Is strictly prohibited.
Proctor Engineering Group@ 818 Fifth Sl, Suite 208, San Rafael, CA. 94901 (415) 455-5700 98.105 November 9, 1998
AC2 Investigation-- Finn! Report B-3 Pn,clor Engineering Group
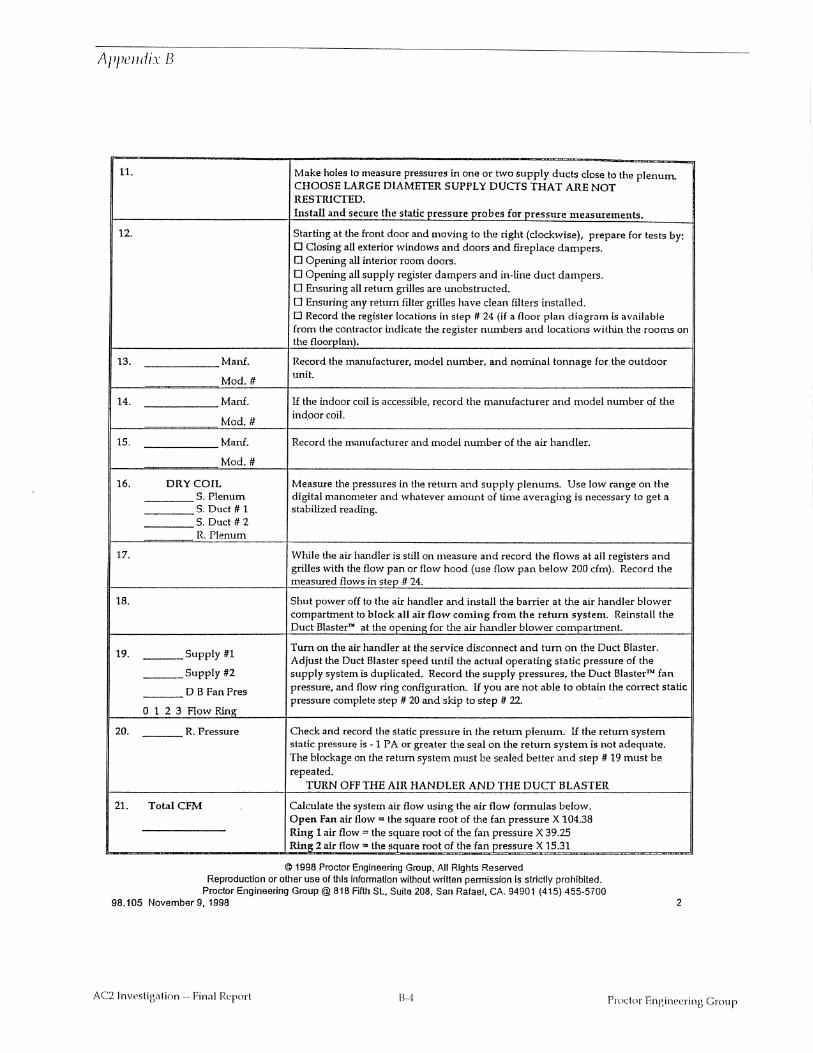
Appendix B
11. Make holes lo measure pressures in one or two supply ducts dose to the plenum. CHOOSE LARGE DlAMEfER SUPPLY DUCTS THAT ARE NOT RESTRICTED. Install and secure the static pressure probes for pressure measurements.
12. Starting at the front door and moving to the right (clockwise), prepare for tests by: 0 Closing all exterior windows and doors and fireplace dampers. 0 Opening all interior room doors. 0 Opening all supply register dampers and in-line duct dampers. 0 Ensuring all return grilles are unobstructed. 0 Ensuring any return filter grilles have clean filters installed. 0 Record the register locations in step It 24 (if a floor plan diagram is available from the contractor indicate the register numbers and locations within the rooms on the floorplan).
13. Manf. Record the manufacturer, model number, and nominal tonnage for the outdoor
Mod.# unit.
14. Man£. U the indoor coil is accessible, record the manufacturer and model number qf the
Mod.# indoor coil.
15. Man£. Record the manufacturer and model number of the air handler.
Mod.#
16. DRY COIL Measure the pressures in the return and supply plenums. Use low range on the S. Plenum digital manometer and whatever amount of time averaging is necessary to get a S. Duct# 1 stabilized reading. S. Duct# 2 R. Plenum
17. While the air handler is still on measure and record the flows at all registers and grilles with the flow pan or flow hood (use flow pan below 200 cfm). Record the measured flows in step # 24.
18. Shut power off to the air handler and install the barrier at the air handler blower compartment to block all air flow coming from the rehun system. Reinstall the Duct Blaster"' at the opening for the air handler blower compartment.
19. ___ Supply #1 Tum on the air handler at the service disconnect and tum on the Duct Blaster. Adjust the Duct Blaster speed until the actual operating static pressure of the
___ Supply #2 supply system is duplicated. Record the supply pressures, the Duct Blastern.c fan
DB Fan Pres pressure, and flow ring configuration. U you are not able to obtain the correct static --- pressure complete step # 20 and skip to step # 22. 0 1 2 3 Flow Ring
20. ---R. Pressure Check and record the static pressure in the return plenum. U the return system static pressure is -1 PA or greater the seal on the return system is not adequate. The blockage on the return system must be sealed better and step # 19 must be repeated.
TURN OFF THE AIR HANDLER AND THE DUCf BLASTER
21. Total CFI\-1 Calculate the system air flow using the air flow formulas below. Open Fan air flow = the square root of the fan pressure X 104.38 Ring 1 air flow = the square root of the fan pressure X 39.25 Ring 2 air flow = the square root of the fan _£ressure X 15.31
@ 1998 Proctor Engineering Group, All Rights Reserved Reproduction or other use of this information without written pennission is strictly prohibited.
Proctor Engineering Group@ 818 Fifth SL, Suite 208, San Rafael, CA. 94901 (415) 455-5700 98.105 November 9, 1998
AC2 Investigation-- Final Report 13-4
2
Proctor Engineering Group
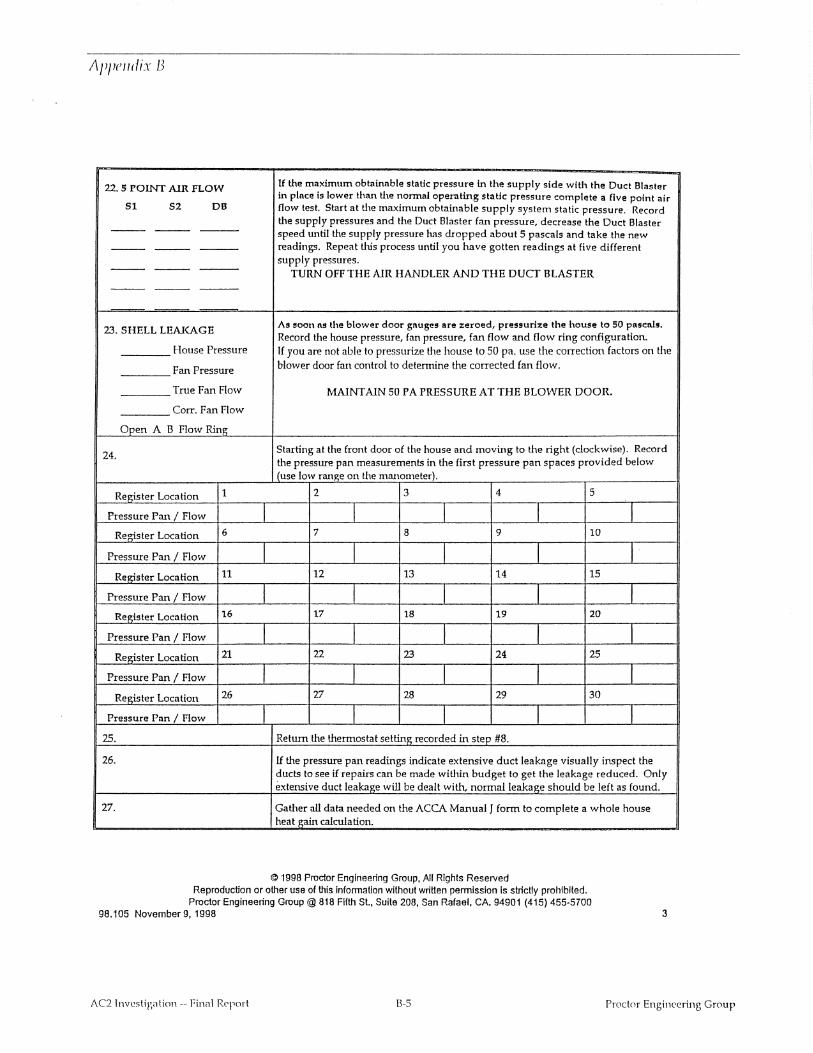
Appendix B
22. 5 POINT AIR FLOW If the maximum obtainable static pressure in the supply side with the Duct Blaster in place is lower than the normal operating static pressure complete a five point air
Sl S2 DB flow test. Start at the maximum obtainable supply system static pressure. Record the supply pressures and the Duct Blaster fan pressure, decrease the Duct Blaster --- --- --- speed until the supply pressure has dropped about 5 pascals and take the new
--- --- --- readings. Repeat this process until you have gotten readings at five different supply pressures.
--- --- --- TURN OFF THE AlR HANDLER AND THE DUCT BLASTER --- --- ---
23. SHELL LEAKAGE As soon as the blower door gauS"s are :z:eroed, pressurl:z:e the house to 50 pascals. Record the house pressure, fan pressure, fan flow and flow ring configuration.
House Pressure If you are not able to pressurize the house to 50 pa. use the correction factors on the
Fan Pressure blower door fan control to detennine the corrected fan flow.
True Fan Flow MAINTAIN 50 PA PRESSURE AT THE BLOWER DOOR.
Corr. Fan Flow
Open A B Flow Ring
24. Starting at the front door of the house and moving to the right (clockwise). Record the pressure pan measurements in the first pressure pan spaces provided below (use low range on the manometer).
Register Location 1 2 3 4 5
Pressure Pan I Flow I I I I I Register Location 6 7 8 9 10
Pressure Pan I Flow I I I I I Register Location 11 12 13 14 15
Pressure Pan I Flow J I I I I Register Locntion 16 17 18 19 20
Pressure Pan I Flow I I I I I Register Location 21 22 23 24 25
Pressure Pan I Flow I I J I I Register Location 26 27 28 29 30
Pressure Pan I Flow I I I I I 25. Return the thermostat setting recorded in step #8.
26. If the pressure pan readings indicate extensive duct leakage visually inspect the ducts to see if repairs can be made within budget to get the leakage reduced. Only extensive duct leakage will be dealt with, normal leakage should be left as found.
27. Gather all data needed on the ACCA Manual J form to complete a whole house heat gain calculation.
@ 1998 Proctor Engineering Group, All Rights Reserved Reproduction or other use of this infonnaUon without written permission is strictly prohibited.
Proctor Engineering Group@ 818 Fifth Sl, Suite 208, San Rafael, CA. 94901 (415) 455-5700 98.105 November 9, 1998
AC2 ltweslig<Jtion -- Fin<1l R('port B-5
3
Proctor Engin('l"ring Group
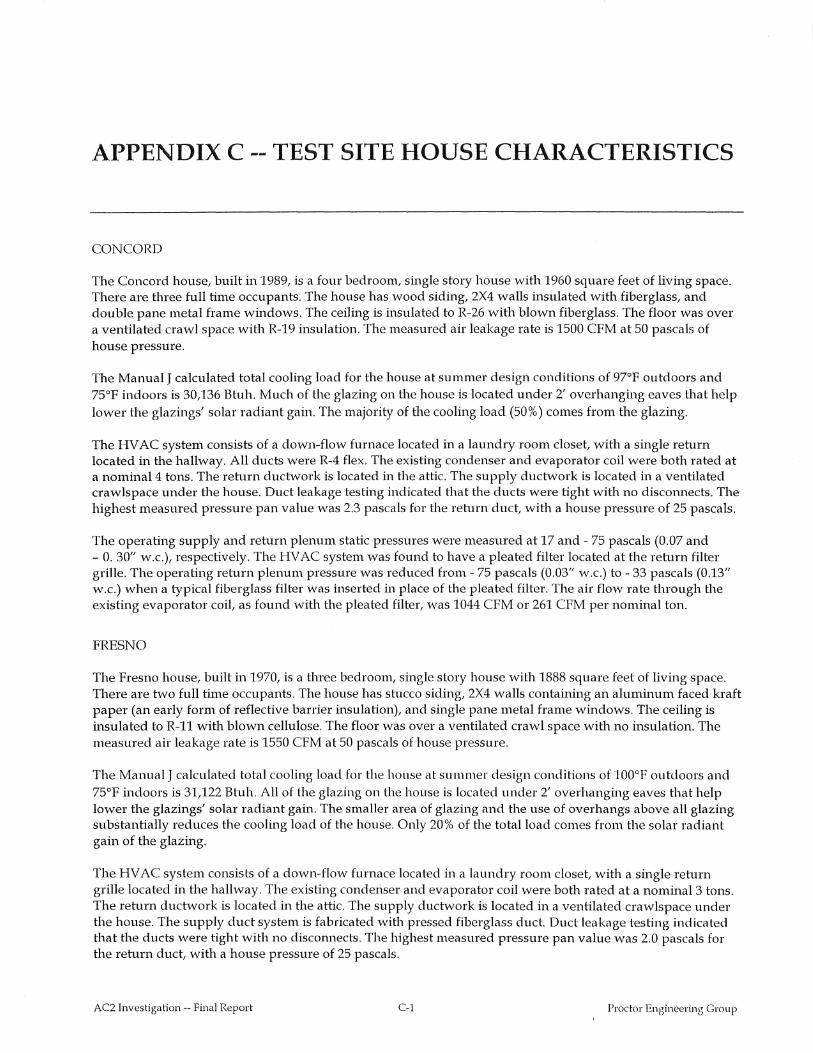
APPENDIX C --TEST SITE HOUSE CHARACTERISTICS
CONCORD
The Concord house, built in 1989, is a four bedroom, single story house with 1960 square feet of living space. There are three full time occupants. The house has wood siding, 2X4 walls insulated with fiberglass, and double pane metal frame windows. The ceiling is insulated to R-26 with blown fiberglass. The floor was over a ventilated crawl space with R-19 insulation. The measured air leakage rate is 1500 CFM at 50 pascals of house pressure.
The Manual J calculated total cooling load for the house at summer design conditions of 97°F outdoors and 75°F indoors is 30,136 Btuh. Much of the glazing on the house is located under 2' overhanging eaves that help lower the glazings' solar radiant gain. The majority of the cooling load (50%) comes from the glazing.
The HV AC system consists of a down-flow furnace located in a laundry room closet, with a single return located in the hallway. All ducts were R-4 flex. The existing condenser and evaporator coil were both rated at a nomina14 tons. The return ductwork is located in the attic. The supply ductwork is located in a ventilated crawlspace under the house. Duct leakage testing indicated that the ducts were tight with no discom1ects. The highest measured pressure pan value was 2.3 pascals for the return duct, with a house pressure of 25 pascals.
The operating supply and return plenum static pressures were measured at 17 and- 75 pascals (0.07 and - 0. 30" w.c.), respectively. The HVAC system was found to have a pleated filter located at the return filter grille. The operating return plenum pressure was reduced from- 75 pascals (0.03" w.c.) to- 33 pascals (0.13" w.c.) when a typical fiberglass filter was inserted in place of the pleated filter. The air flow rate through the existing evaporator coil, as found with the pleated filter, was 1044 CFM or 261 CFM per nominal ton.
FRESNO
The Fresno house, built in 1970, is a three bedroom, single stmy house with 1888 square feet of living space. There are two full time occupants. The house has stucco siding, 2X4 walls containing an aluminum faced kraft paper (an early form of reflective barrier insulation), and single pane metal frame windows. The ceiling is insulated to R-11 with blown cellulose. The floor was over a ventilated crawl space with no insulation. The measured air leakage rate is 1550 CFM at 50 pascals of house pressure.
The Manual J calculated total cooling load for the house at summer design conditions of 100°F outdoors and 75°F indoors is 31,122 Btuh. All of the glazing on the house is located under 2' overhanging eaves that help lower the glazings' solar radiant gain. The smaller area of glazing and the use of overhangs above all glazing substantially reduces the cooling load of the house. Only 20% of the total load comes from the solar radiant gain of the glazing.
The HV AC system consists of a down-flow furnace located in a laundry room closet, with a single return grille located in the hallway. The existing condenser and evaporator coil were both rated at a nominal3 tons. The return ductwork is located in the attic. The supply ductwork is located in a ventilated crawlspace under the house. The supply duct system is fabricated with pressed fiberglass duct. Duct leakage testing indicated that the ducts were tight with no disconnects. The highest measured pressure pan value was 2.0 pascals for the return duct, with a house pressure of 25 pascals.
AC2 Investigation-- Final Report C-1 Proctor Engineering Group
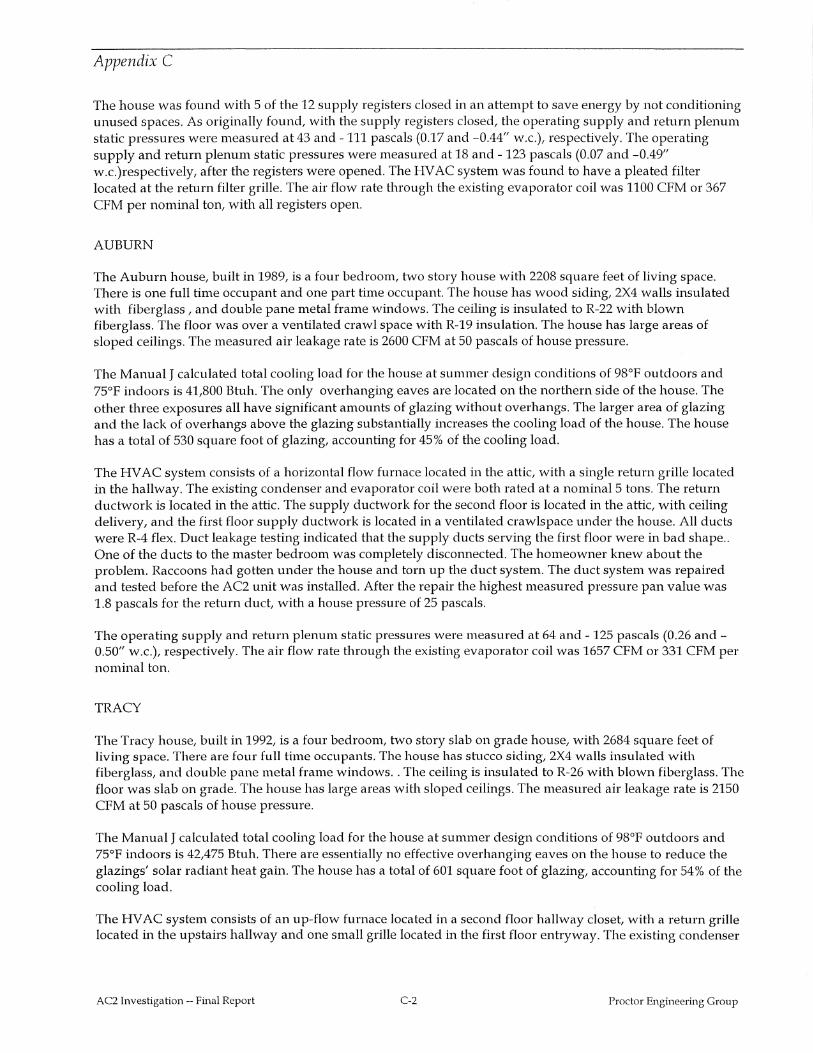
Appendix C
The house was found with 5 of the 12 supply registers closed in an attempt to save energy by not conditioning unused spaces. As originally found, with the supply registers closed, the operating supply and return plenum static pressures were measured at 43 and -111 pascals (0.17 and -0.44" w.c.), respectively. The operating supply and return plenum static pressures were measured at 18 and- 123 pascals (0.07 and -0.49" w.c.)respectively, after the registers were opened. The HVAC system was found to have a pleated filter located at the return filter grille. The air flow rate through the existing evaporator coil was 1100 CFM or 367 CFM per nominal ton, with all registers open.
AUBURN
The Auburn house, built in 1989, is a four bedroom, two story house with 2208 square feet of living space. There is one full time occupant and one part time occupant. The house has wood siding, 2X4 walls insulated with fiberglass , and double pane metal frame windows. The ceiling is insulated to R-22 with blown fiberglass. The floor was over a ventilated crawl space with R-19 insulation. The house has large areas of sloped ceilings. The measured air leakage rate is 2600 CFM at 50 pascals of house pressure.
The Manual J calculated total cooling load for the house at summer design conditions of 98°F outdoors and 75°F indoors is 41,800 Btuh. The only overhanging eaves are located on the northern side of the house. The other three exposures all have significant amounts of glazing without overhangs. The larger area of glazing and the lack of overhangs above the glazing substantially increases the cooling load of the house. The house has a total of 530 square foot of glazing, accounting for 45% of the cooling load.
The HV AC system consists of a horizontal flow furnace located in the attic, with a single return grille located in the hallway. The existing condenser and evaporator coil were both rated at a nominal5 tons. The return ductwork is located in the attic. The supply ductwork for the second floor is located in the attic, with ceiling delivery, and the first floor supply ductwork is located in a ventilated crawlspace under the house. All ducts were R-4 flex. Duct leakage testing indicated that the supply ducts serving the first floor were in bad shape .. One of the ducts to the master bedroom was completely disconnected. The homeowner knew about the problem. Raccoons had gotten under the house and torn up the duct system. The duct system was repaired and tested before the AC2 unit was installed. After the repair the highest measured pressure pan value was 1.8 pascals for the return duct, with a house pressure of 25 pascals.
The operating supply and return plenum static pressures were measured at 64 and -125 pascals (0.26 and-0.50" w.c.), respectively. The air flow rate through the existing evaporator coil was 1657 CFM or 331 CFM per nominal ton.
TRACY
The Tracy house, built in 1992, is a four bedroom, two story slab on grade house, with 2684 square feet of living space. There are four full time occupants. The house has stucco siding, 2X4 walls insulated with fiberglass, and double pane metal frame windows .. The ceiling is insulated to R-26 with blown fiberglass. The floor was slab on grade. The house has large areas with sloped ceilings. The measured air leakage rate is 2150 CFM at 50 pascals of house pressure.
The Manual J calculated total cooling load for the house at summer design conditions of 98°F outdoors and 75°F indoors is 42,475 Btuh. There are essentially no effective overhanging eaves on the house to reduce the glazings' solar radiant heat gain. The house has a total of 601 square foot of glazing, accounting for 54% of the cooling load.
The HV AC system consists of an up-flow furnace located in a second floor hallway closet, with a Ieturn grille located in the upstairs hallway and one small grille located in the first floor entryway. The existing condenser
AC2 Investigation-- Final Report C-2 Proctor Engineering Group
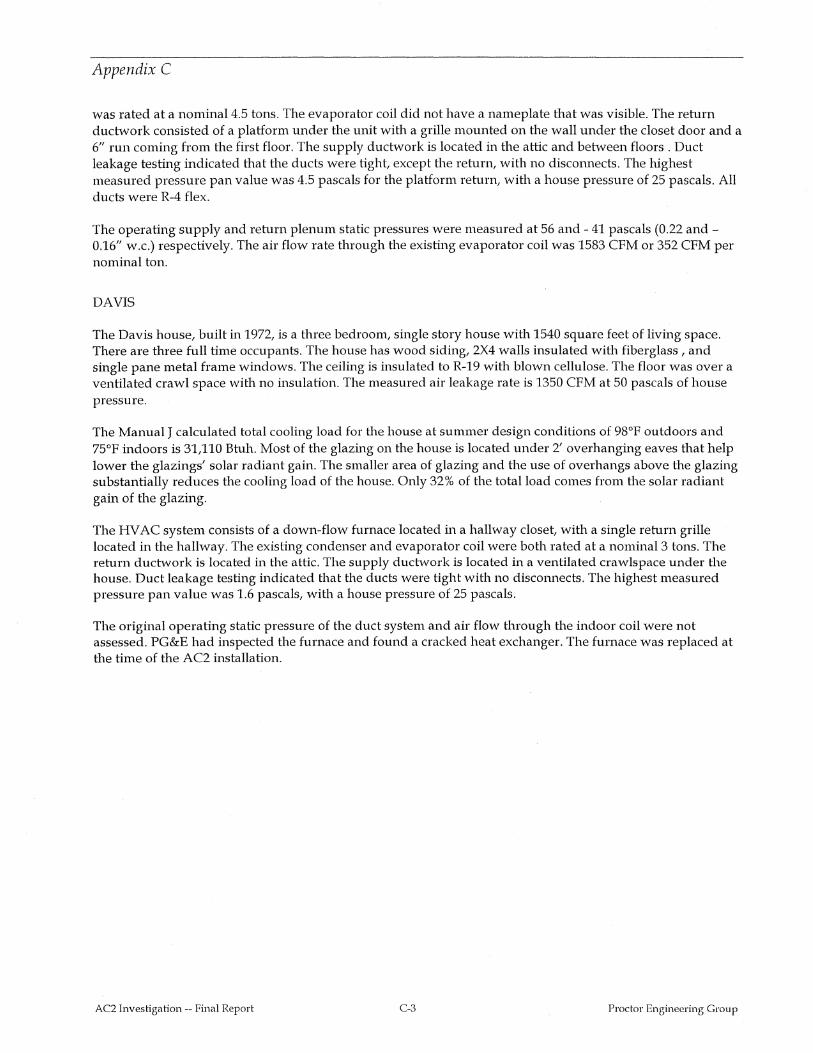
Appendix C
was rated at a nominal4.5 tons. The evaporator coil did not have a nameplate that was visible. The return ductwork consisted of a platform under the unit with a grille mounted on the wall under the closet door and a 6" run coming from the first floor. The supply ductwork is located in the attic and between floors . Duct leakage testing indicated that the ducts were tight, except the return, with no disconnects. The highest measured pressure pan value was 4.5 pascals for the platform return, with a house pressure of 25 pascals. All ducts were R-4 flex.
The operating supply and return plenum static pressures were measured at 56 and- 41 pascals (0.22 and-0.16" w.c.) respectively. The air flow rate through the existing evaporator coil was 1583 CFM or 352 CFM per nominal ton.
DAVIS
The Davis house, built in 1972, is a three bedroom, single story house with 1540 square feet of living space. There are three full time occupants. The house has wood siding, 2X4 walls insulated with fiberglass , and single pane metal frame windows. The ceiling is insulated to R-19 with blown cellulose. The floor was over a ventilated crawl space with no insulation. The measured air leakage rate is 1350 CFM at 50 pascals of house pressure.
The Manual J calculated total cooling load for the house at summer design conditions of 98°F outdoors and 75°F indoors is 31,110 Btuh. Most of the glazing on the house is located under 2' overhanging eaves that help lower the glazings' solar radiant gain. The smaller area of glazing and the use of overhangs above the glazing substantially reduces the cooling load of the house. Only 32% of the total load comes from the solar radiant gain of the glazing.
The HV AC system consists of a down-flow furnace located in a hallway closet, with a single return grille located in the hallway. The existing condenser and evaporator coil were both rated at a nominal 3 tons. The return ductwork is located in the attic. The supply ductwork is located in a ventilated crawlspace under the house. Duct leakage testing indicated that the ducts were tight with no disconnects. The highest measured pressure pan value was 1.6 pascals, with a house pressure of 25 pascals.
The original operating static pressure of the duct system and air flow through the indoor coil were not assessed. PG&E had inspected the furnace and found a cracked heat exchanger. The furnace was replaced at the time of the AC2 installation.
AC2 Investigation --Final Report C-3 Proctor Engineering Group
APPENDIX D -- EQUIPMENT SELECTION
DIFFICULTIES
The Air Conditioning Conh·actors of America (ACCA) provides ManualS, a methodology for selecting equipment to meet the load of the house based on the Manual J results and the detailed unit performance information provided by the equipment manufacturers.
This ManualS method consists of four basic steps:
1. A CFM is initially determined, based on the sensible heat ratio.
2. Initially select a specific AC unit from the manufacturer's application data based on the cooling CFM and design sensible capacity.
3. Compare the selected unit's sensible and latent capacities against the corresponding building Manual J loads. The unit is considered correct if at the design outdoor temperature, 75°F indoor dry bulb temperature, and 62°F indoor wet bulb temperature its sensible capacity is at least equal but not more than 15% greater than the sensible load, and the latent capacity is at least equal to the calculated latent load.
4A If the unit is slightly short of sensible or latent capacity, the same unit with a different blower speed is checked for compliance. If still short, the next larger sized unit is tried with the blower operating at nominal speed.
4B. If the unit sensible capacity exceeds oversize limitations the next smaller unit size is checked with nominal blower speed.
The Manual S selection method, like most selection methods, requires substantial interpretation of manufacturers' data. ManualS is hard to apply with data supplied by most manufacturers, including the limited data provided for the AC2 units.
Manufacturers' Data Refinements
As research completed by PEG has documented in "Residential Cooling Load Calculation Methods Analysis", the problems associated with manufacturers' data presents a challenge to tl1e individual contractor. As demonstrated in Table B-1, RTI is not alone in the fact that their data must be manipulated to fit ManualS requirements. Table B-1 summarizes the required steps for ManualS along with the data manipulation requirements.
AC2 Investigation- Final Report D-1 Proctor Engineering Group
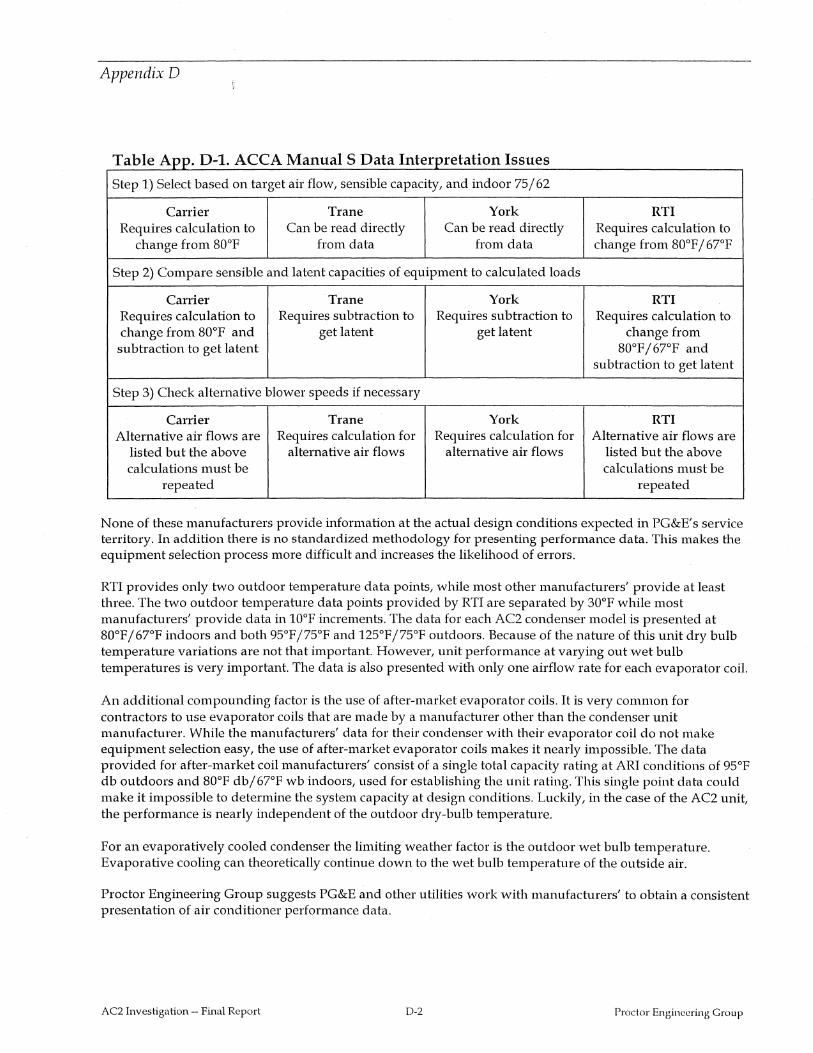
Appendix D
T bl A D 1 ACCAM lSD t It t t' I a e ~PP· - . anua a a n erpre a ton ssues
Step 1) Select based on target air flow, sensible capacity, and indoor 75 I 62
Carrier Trane York RTI Requires calculation to Can be read directly Can be read directly Requires calculation to
change from 80°F from data from data change from 80°F I 67°F
Step 2) Compare sensible and latent capacities of equipment to calculated loads
Carrier Trane York RTI Requires calculation to Requires subtraction to Requires subtraction to Requires calculation to change from 80°F and get latent get latent change from
subtraction to get latent 80°F I 67°F and subtraction to get latent
Step 3) Check alternative blower speeds if necessary
Carrier Trane York RTI Alternative air flows are Requires calculation for Requires calculation for Alternative air flows are
listed but the above alternative air flows alternative air flows listed but the above calculations must be calculations must be
repeated repeated
None of these manufacturers provide information at the actual design conditions expected in PG&E's service territory. In addition there is no standardized meU1odology for presenting performance data. This makes the equipment selection process more difficult and increases tl1e likelihood of errors.
RTI provides only two outdoor temperature data points, while most other manufacturers' provide at least three. The two outdoor temperature data points provided by RTI are separated by 30°F while most manufacturers' provide data in 10°F increments. The data for each AC2 condenser model is presented at 80°F I 67oF indoors and both 95°F I75°F and 125°F I75°F outdoors. Because of tl1e nature of this unit dry bulb temperature variations are not that important. However, unit performance at varying out wet bulb temperatures is very important. The data is also presented with only one airflow rate for each evaporator coil.
An additional compounding factor is the use of after-market evaporator coils. It is very common for conb·actors to use evaporator coils that are made by a manufacturer other than the condenser unit manufacturer. While the manufacturers' data for their condenser with their evaporator coil do not make equipment selection easy, the use of after-market evaporator coils makes it nearly impossible. The data provided for after-market coil manufacturers' consist of a single total capacity rating at ARI conditions of 95°F db outdoors and 80°F dbi67°F wb indoors, used for establishing the unit rating. This single point data could make it impossible to determine the system capacity at design conditions. Luckily, in the case of the AC2 unit, the performance is nearly independent of the outdoor dry-bulb temperature.
For an evaporatively cooled condenser the limiting weatl1er factor is the outdoor wet bulb temperature. Evaporative cooling can theoretically continue down to the wet bulb temperature of the outside air.
Proctor Engineering Group suggests PG&E and other utilities work with manufacturers' to obtain a consistent presentation of air conditioner performance data.
AC2 Investigation-- Final Report D-2 Proctor Engineering Group
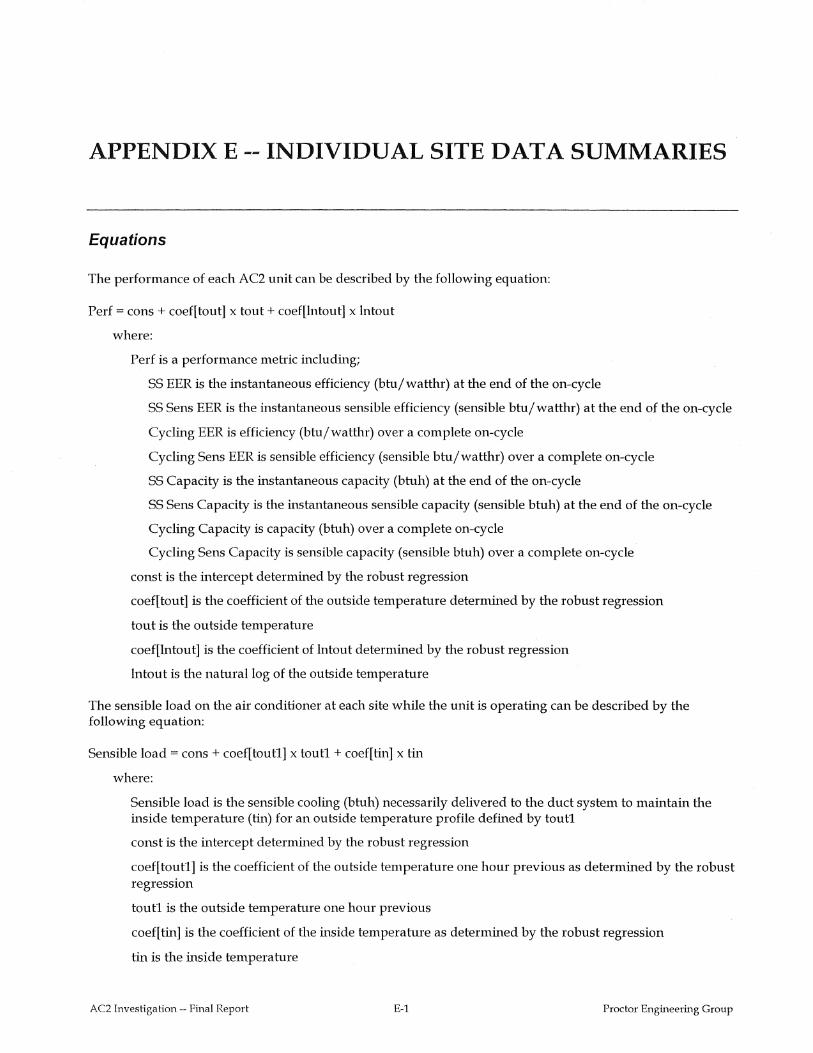
APPENDIX E --INDIVIDUAL SITE DATA SUMMARIES
Equations
The performance of each AC2 unit can be described by the following equation:
Perf= cons+ coef[tout] x tout+ coef[lntout] x lntout
where:
Perf is a performance meh·ic including;
SS EER is the instantaneous efficiency (btujwatthr) at the end of the on-cycle
SS Sens EER is the instantaneous sensible efficiency (sensible btujwatthr) at the end of the on-cycle
Cycling EER is efficiency (bhtjwatthr) over a complete on-cycle
Cycling Sens EER is sensible efficiency (sensible btujwatthr) over a complete on-cycle
SS Capacity is the instantaneous capacity (btuh) at the end of the on-cycle
SS Sens Capacity is the instantaneous sensible capacity (sensible btuh) at the end of the on-cycle
Cycling Capacity is capacity (btuh) over a complete on-cycle
Cycling Sens Capacity is sensible capacity (sensible btuh) over a complete on-cycle
const is the intercept determined by the robust regression
coef[tout] is the coefficient of the outside temperature determined by the robust regression
tout is the outside temperature
coef[lntout] is the coefficient of lntout determined by the robust regression
lntout is the natural log of the outside temperature
The sensible load on the air conditioner at each site while the unit is operating can be described by the following equation:
Sensible load= cons+ coef[tout1] x tout1 + coef[tin] x tin
where:
Sensible load is the sensible cooling (btuh) necessarily delivered to the duct system to maintain the inside temperature (tin) for an outside tempera hue profile defined by tout1
const is the intercept determined by the robust regression
coef[tout1] is the coefficient of the outside temperature one hour previous as determined by the robust regression
toutl is the outside temperature one hour previous
coef[tin] is the coefficient of the inside temperature as determined by the robust regression
tin is the inside temperature
AC2 Investigation-- Final Report E-1 Proctor Engineering Group
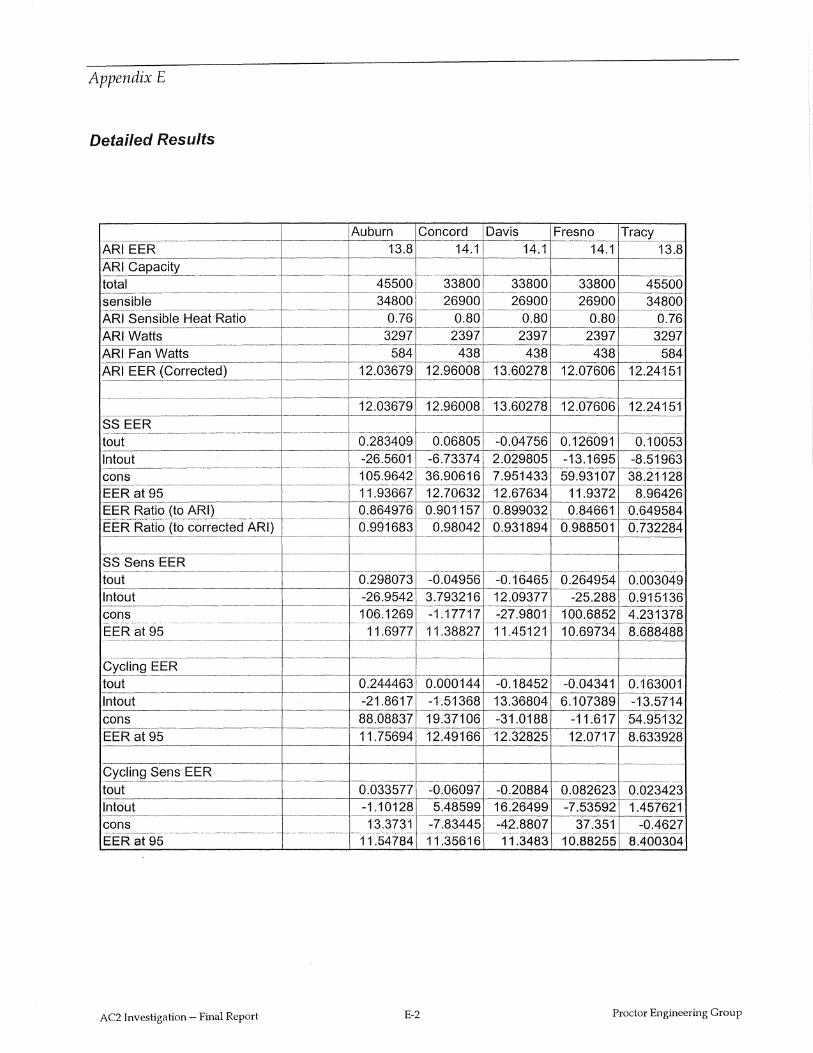
Appendix E
Detailed Results
Auburn Concord Davis Fresno Tracy ARIEER 13.8 14.1 14.1 14.1 13.8 ARI Capacity
--- r------total 45500 33800 33800 33800 45500 sensible 34800 26900 26900 26900 34800 ARI Sensible Heat Ratio 0.76 0.80 0.80 0.80 0.76 ARI Watts 3297 2397 2397 2397 3297 ARI Fan Watts 584 438 438 438 584 ARI EER (Corrected) 12.03679 12.96008 13.60278 12.07606 12.24151
12.03679 12.96008 13.60278 12.07606 12.24151 SSEER
-------- -----tout 0.283409 0.06805 -0.04756 0.126091 0.10053 lntout -26.5601 -6.73374 2.029805 -13.1695 -8.51963
--- --~------------- ----~--
cons 105.9642 36.90616 7.951433 59.93107 38.21128 EER at 95 11.93667 12.70632 12.67634 11.9372 8.96426 EER Ratio (to ARI} 0.864976 0.901157 0.899032 0.84661 0.649584
-~ ---EER Ratio (to corrected ARI) 0.991683 0.98042 0.931894 0.988501 0.732284
SS Sens EER --~-
tout 0.298073 -0.04956 -0.16465 0.264954 0.003049 lntout -26.9542 3.793216 12.09377 -25.288 0.915136 cons 106.1269 -1.17717 -27.9801 100.6852 4.231378 ~---~------~ ----------------~----·-~--~ ~---~-----1----------r--------EER at 95 11.6977 11.38827 11.45121 10.69734 8.688488
Cycling EER tout 0.244463 0.000144 -0.18452 -0.04341 0.163001 lntout -21.8617 -1.51368 13.36804 6.107389 -13.5714 cons 88.08837 19.37106 -31.0188 -11.617 54.95132 EER at 95 11.75694 12.49166 12.32825 12.0717 8.633928
Cycling Sens EER -------- -
tout 0.033577 -0.06097 -0.20884 0.082623 0.023423 lntout -1.10128 5.48599 16.26499 -7.53592 1.457621 cons 13.3731 -7.83445 -42.8807 37.351 -0.4627 ------------ ------- -~~----· ----~---
~1.3483 t---10.88255 EER at 95 11.54784 11.35616 8.400304
AC2 Investigation-- Final Report E-2 Proctor Engineering Group
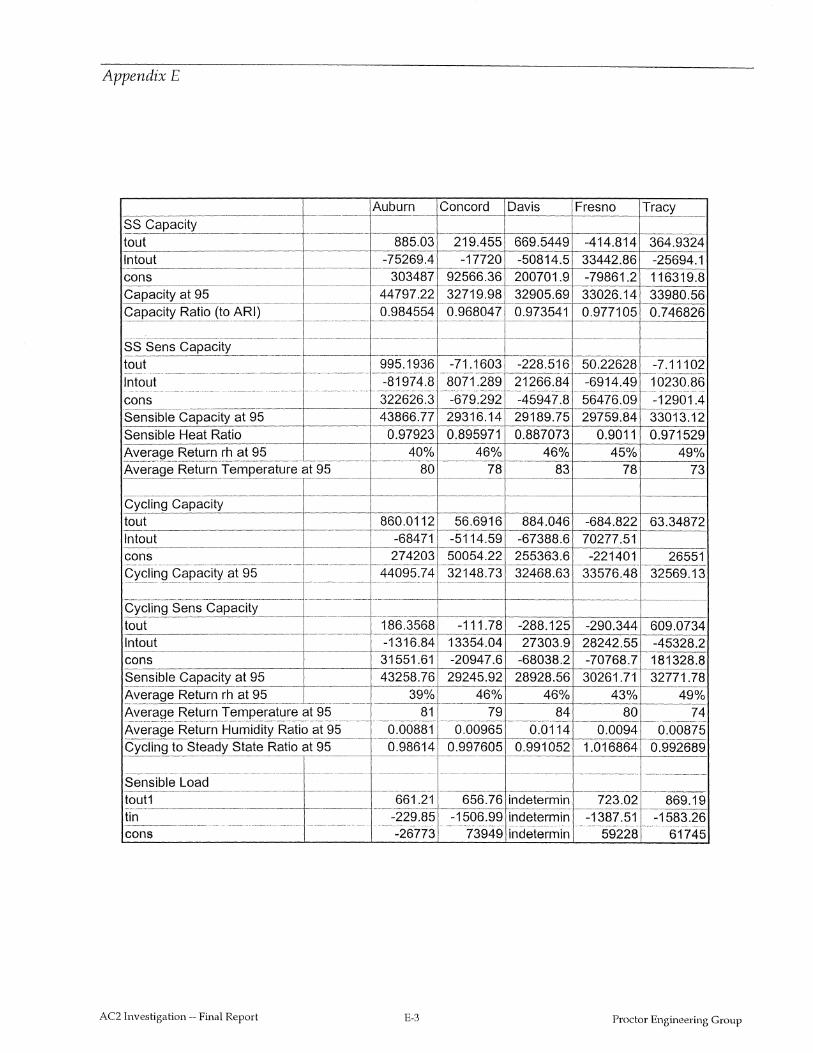
Appendix E
Auburn Concord Davis Fresno Tracy ------- -------- -~---r--- - --------ss Capacity tout _________ - ----------------885:-6:3 --219:455 -669~449 -414.814 364.9324 --------~----------------- ----------------------- - . --r-· -----lntout -75269.4 -17720 -50814.5 33442.86 -25694.1 -~~-~---------------- ---------------- -~~--------· ---- -----
cons 303487 92566.36 200701.9 -79861.2 116319.8 -----------------~--~------ -~-- --~---- r----~-------r-----------
Capacity at 95 44797.22 32719.98 32905.69 33026.14 33980.56 --c:-·-'--~--=----c:----------~-------~~- -~---c-:--------- ----~~-:-:-r----------~--
Capacity Ratio (to ARI) 0.984554 0.968047 0.973541 0.977105 0.746826 -----------------------------1--- ----- --- 1------
SS Sens Capacity --------------------------1----------l---------------- ---------------- ------tout 995.1936 -71.1603 -228.516 50.22628 -7.11102
----·------------- --- - --·----- -~---·--·- --- --·------·- -----------------
In tout -81974.8 8071.289 21266.84 -6914.49 10230.86 ·----- --·-- -·--- ------- - ---- ·---- --- ·---·---- -----
cons 322626.3 -679.292 -45947.8 56476.09 -12901.4 ----------- ~--------- -------- ------+----------1-------- ----------- -~---------- ---_S_en_s_ib_leCapacity at 95 _4_3~66.~_2_9_:3_1__6.14 29189.75 29759.84 33013.12 Sensible Heat Ratio 0.97923 0.895971 0.887073 0.9011 0.971529
-------------- -- ----------r---------+-Cycling Capacity tou( --~----------860.0112 56.6916 884.046- -684.822 63.34872
In tout -----~~------68471 -5114.59 -67388.6- 70277.51 --------------------------- -----------,----+----1------+------cons 274203 50054.22 255363.6 -221401 26551 -------------------- ------------------------------------------- --------------------~::--:-c:-1
Cycling Capacity at 95 44095.74 32148.73 32468.63 33576.48 32569.13 ------- ---------- ------ -------- -------- ---- ---------- ------ ---------------------------------- ----- --
---------------- ------------------ ------------------------------- -------- -----------Cycling Sens Capacity --------------------------------1--- ---+-----tout 186.3568 -111.78 -288.125 -290.344 609.0734 lntout ------------=-T316.84 13354.04 - 27303.9 28242.55 -45328.2
cons -~ 31551.61---20947.6 -68038.2 -70768.7 181328.8 Sensible Capacity at 95 43258.76 29245.92 28928.56 30261.71 32771.78 Average Return rh at 95 ---------t--~o/~ --46% 46% 43% -- 49% --- -------------------------~---------- -------- ----------------------------------- -------- ------
AVE:)f~~~ Bet~rii __ T~f11P_El~Cjt_ure_at -~~-- _ _ _ __ ----~1 _______ !~ ____ _13~ ---------~Q _____ ?~ Average Return Humidity Ratio at 95 0.00881 0.00965 0.0114 0.0094 0.00875 -------------- --- ----------------------------- ~------------:---~ ----------Cycling to Steady State Ratio at 95 0.98614 0.997605 0.991052 1.016864 0.992689 -"------"'---------=-------,------------~-- ----- ------
Sensible Load ----------- --------- =-=-------,-----~---------
tout1 661.21 656.76 indetermin 723.02 869.19 ------------------------ --------------- ------ ---- ------+-------- -1----+----:-=-::-:---:::-::-1 tin -229.85 -1506.99 indetermin -1387.51 -1583.26 ----------
cons -26773 73949 indetermin 59228 617 45
AC2 Investigation-- Final Report E-3 Proctor Engineering Group
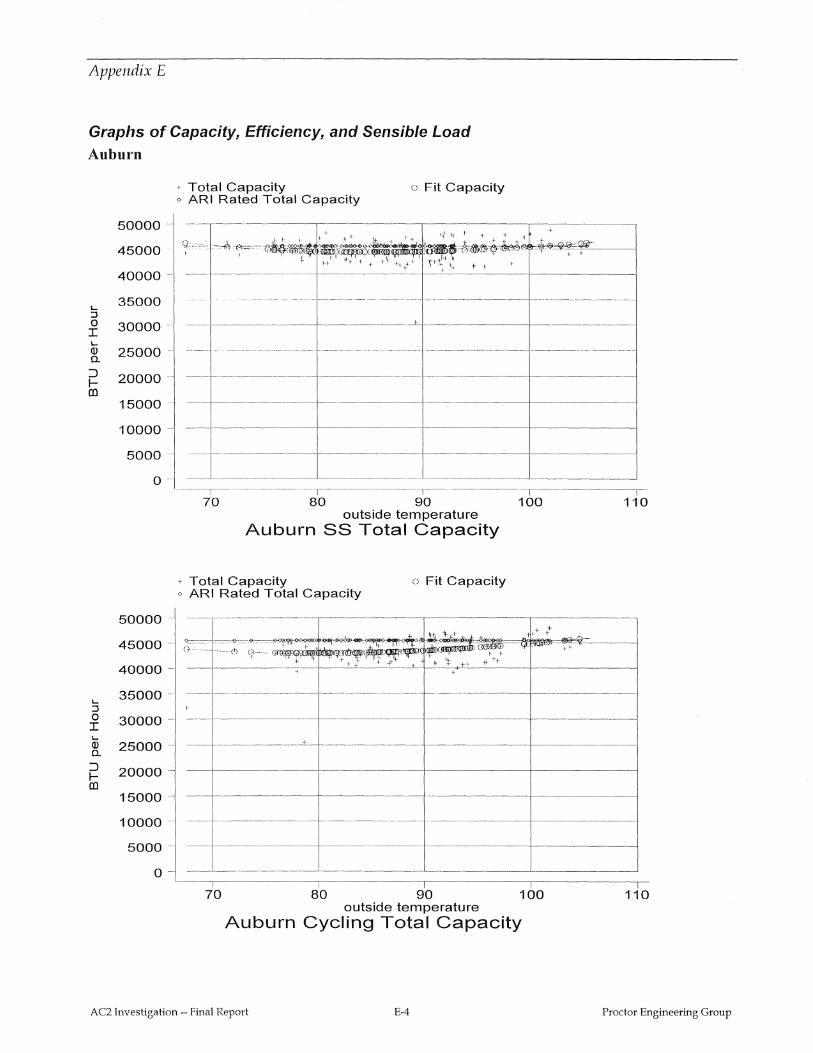
Appendix E
Graphs of Capacity, Efficiency, and Sensible Load Auburn
.... :I 0 I ..... Q) Q.
::> f-ro
..... :I 0 I ..... Q) Q.
::> fro
50000
45000
40000
35000
30000
25000
20000
15000
10000
5000
0
50000
45000
40000 -
35000
30000-
25000
20000.
15000
10000
5000-
0
' Total Capacity o Fit Capacity o ARI Rated Total Capacity
- ·-------------·-- -·---
·------·-------------+-·-·-··---------·
-. ·----·----+---------1------- -------
-·------·--·------·· ·-·- --·----- -·----··-·· ·-· --··---------+--------
·--------- , _______ __J
-·-·-T·-·· .. --·---·-·- -T---·---·-····-··----·- ·~--- ·----·----·· ··r-- -------· ~--70 80 90 1 00 11 0
outside temperature Auburn SS Total Capacity
+ Total Capacity o Fit Capacity o ARI Rated Total Capacity
-- --- -·---·--·--· --- ·---··----·-·--- .. -- --··------·-,--------
--- ·----·---------+--- ----------,----·------
-- -·---------"'-+------
-----·-----·----+---------·--·- ·-·---------·-1-----------i
----·--- ------· -- ------1-·--
-------·- .--·-·---------f---------1-------------1
_ __]___ ·-- -- ·- ····-·- ··-------- ·---·--------- -··-···----_j
----T--·----·-·---·---·--,-·---·---·-····-·----·1-----·-
70 80 90 100 outside temperature
Auburn Cycling Total Capacity
---,-110
AC2 Investigation-- Final Report E-4 Proctor Engineering Group
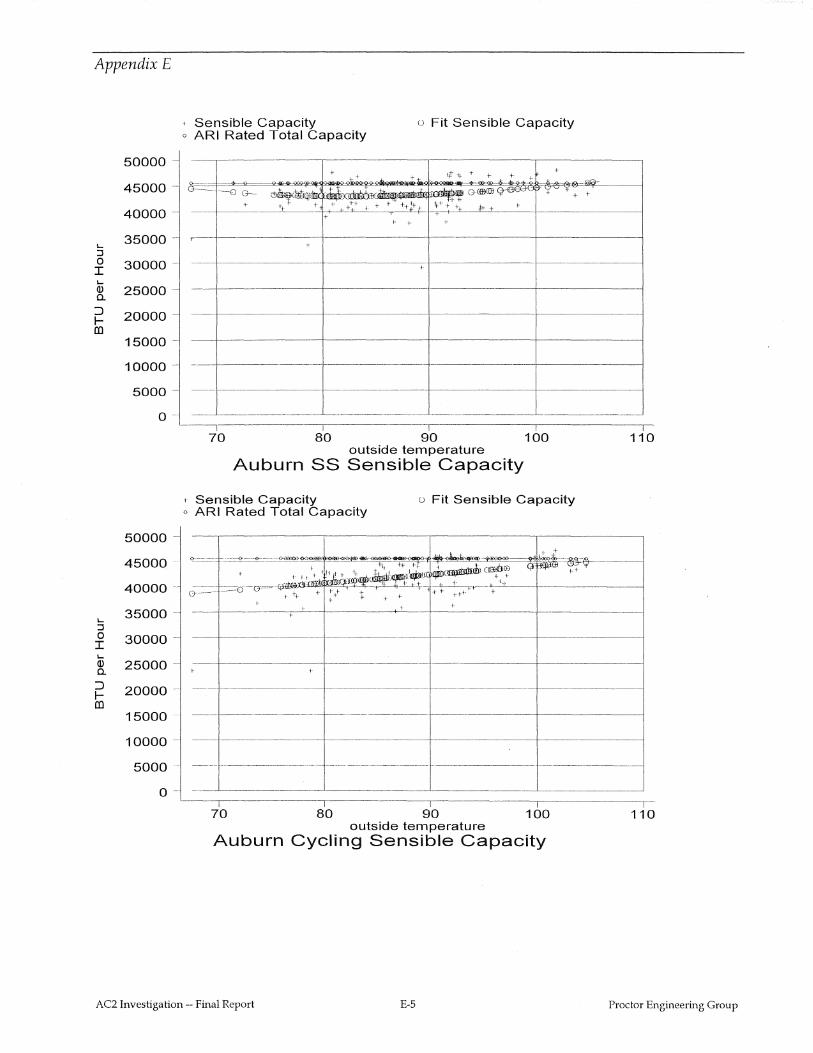
Appendix E
' Sensible Capacity o Fit Sensible Capacity o ARI Rated Total Capacity
50000 - ----- ---,---------------- --- --- ---------,-----------
45000-
40000 + 1-
I... 35000 -p-- --------------------+-~--------+-~--------
+ ::J 0 30000 I
---+-~--- ------ ------------+---------- -------------~
I... Q) 25000 0.
------t---------1---------+----------
::> 20000-f----------------- ---~-------------------1-- ------------l
(!)
15000 1---------------------t-----------t-----------i
10000- ------ - ---------- ------ ------------------i----------1
5000- 1------------- -----------------------------1--------1
0 •··
70 80 90 100 110 outside temperature
Auburn SS Sensible Capacity
1 Sensible Capacity o Fit Sensible Capacity o ARI Rated Total Capacity
50000 -------,------------,-------,
45000
40000 +
I... 35000 ------- -----------r---------------
::J 0 30000 I
--------- ---------+------ --------
I... Q) 25000 0.
------------~ --------------1
::> 20000 f----- -----------~- --- ------------------- . -r------------------
(!)
15000 ----------- ~----------· ----- ----
10000
5000
0 --~-------- ----------------- --------------'----------~ --,-----------~--------------T ----r-----~-
70 80 90 1 00 11 0 outside temperature
Auburn Cycling Sensible Capacity
AC2 Investigation-- Final Report E-5 Proctor Engineering Group
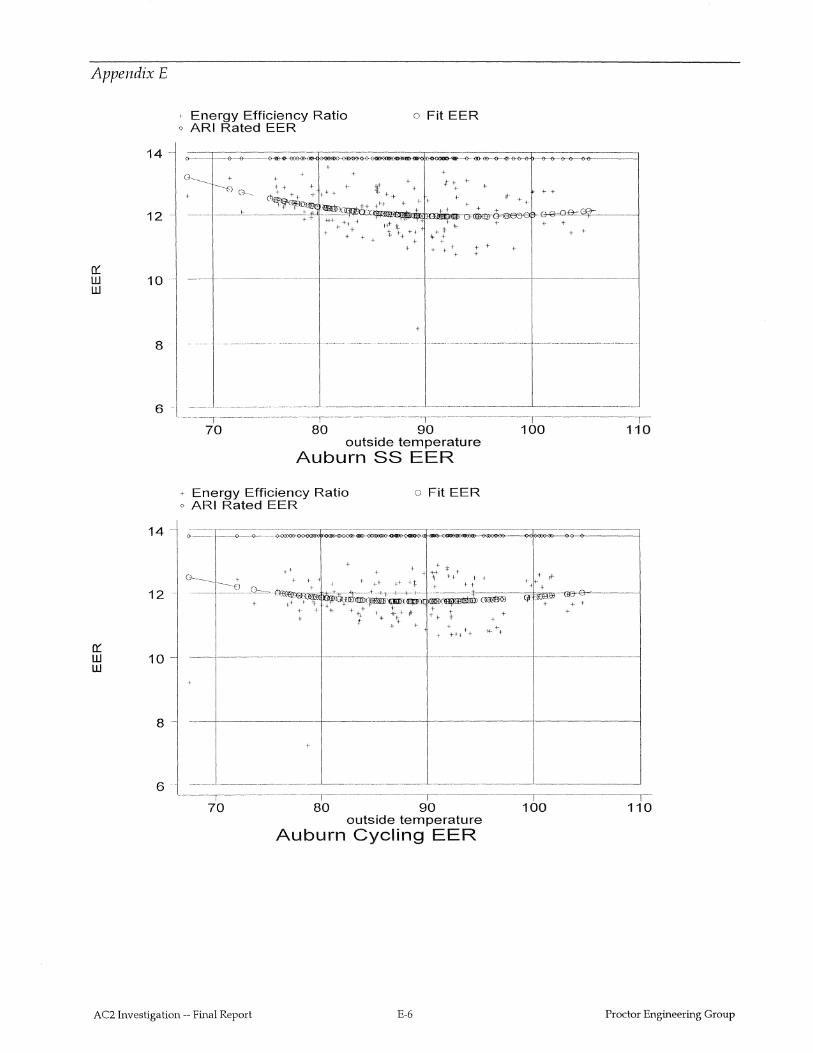
Appendix E
14
12
0:: w 10 w
8
6 -
14
12 -
0:: w 10 w
8
6
1- Energy Efficiency Ratio o ARI Rated EER
o Fit EER
+
* + + + + + +
+
- ~-------- -- -------- ----- ------ ------ ---- --~------~------- ----------------
---- -----~----------~---- ------------- ________ L__ _______ ___j
----T--~-----~---,------------, 70 80 90
outside temperature Auburn SS EER
+ Energy Efficiency Ratio o ARI Rated EER
~
f ++
---1-
o Fit EER
+ .: t + + G-
----------~~ + 1- f -1 + t+ t+ ++- -~ '+ +- +
• + 1- + .--4-~r-------+-+-,-+~+--+----
t ++ ' q:·· -;'l"'··ID~~x~ 1-<~~ .t+ ~ + +
1- + -It- + *1- + -fl- ·1- --~·-+ t * ';. + t + + * ++ + +++ +
+
+
70 80 90 outside temperature
Auburn Cycling EER
100
+ + +
p-f t
(if ~"' =: + +
100
,----110
110
AC2 Investigation- Final Report E-6 Proctor Engineering Group
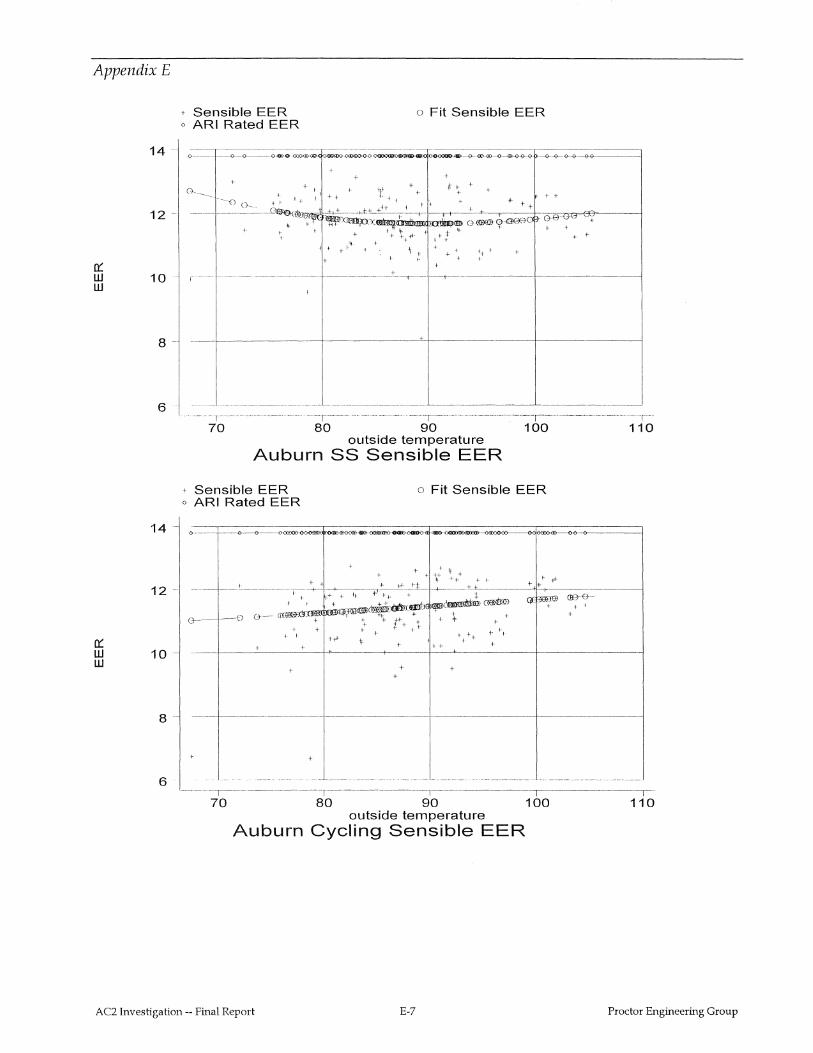
Appendix E
0::: w w
0::: w w
12 -
10-
8
6
14
12
10
8
6
+ Sensible EER o ARI Rated EER
o Fit Sensible EER
+ t + +
+ +
+
+ +
~-·~-- -~-----~---- ________ +c---,--+--------r-------+--------------1
+
---- ------------ ---------------'------------'-----------~
----·-----,-------------------- ----~~------------ ---,--------------~---,------------,--
70 80 90 100 110 outside temperature
Auburn SS Sensible EER
+ Sensible EER o Fit Sensible EER o ARI Rated EER
+ + +
+
------,-- ,------------,--------------------,----------,-70 80 90 100 110
outside temperature Auburn Cycling Sensible EER
AC2 Investigation-- Final Report E-7 Proctor Engineering Group
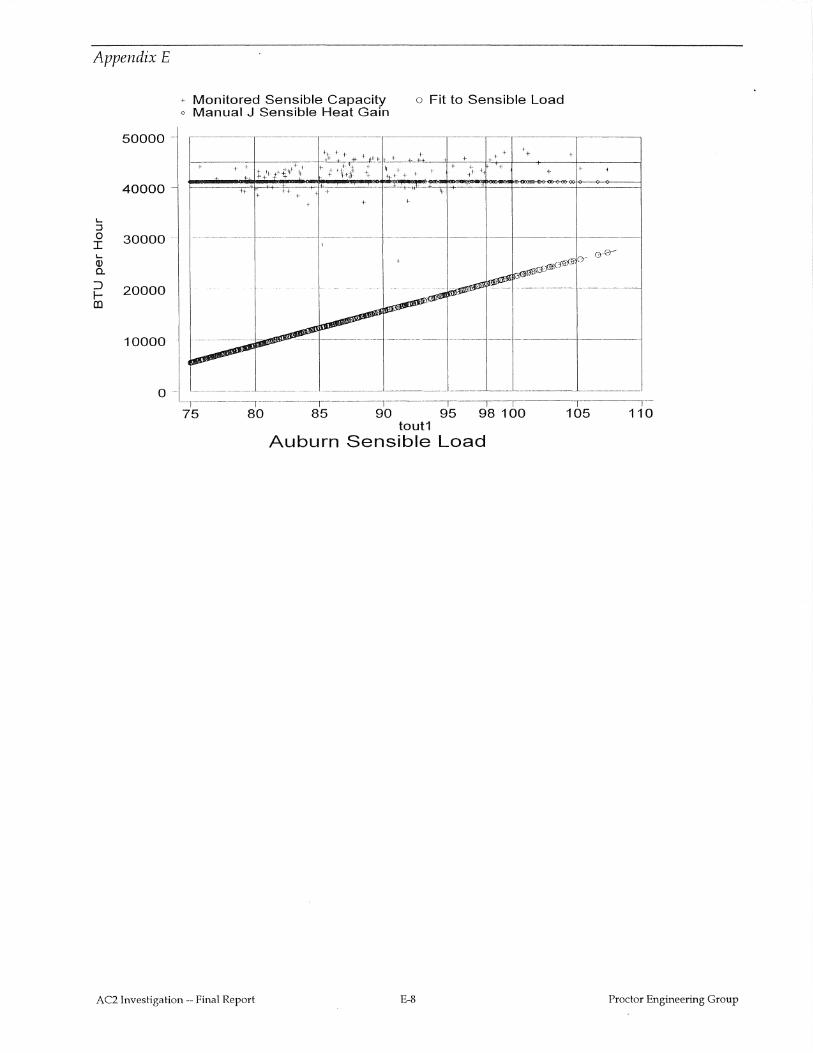
Appendix E
..... ::J 0 I ..... Q) a. :J ICO
50000
40000
30000-
20000
10000
0
+ Monitored Sensible Capacity o Manual J Sensible Heat Gain
+ +
o Fit to Sensible Load
+ + +
+
----------,----,-------,-------,----,--.------,-----. 75 80 85 90 95 98 100
tout1 Auburn Sensible Load
105 110
AC2 Investigation-- Final Report E-8 Proctor Engineering Group
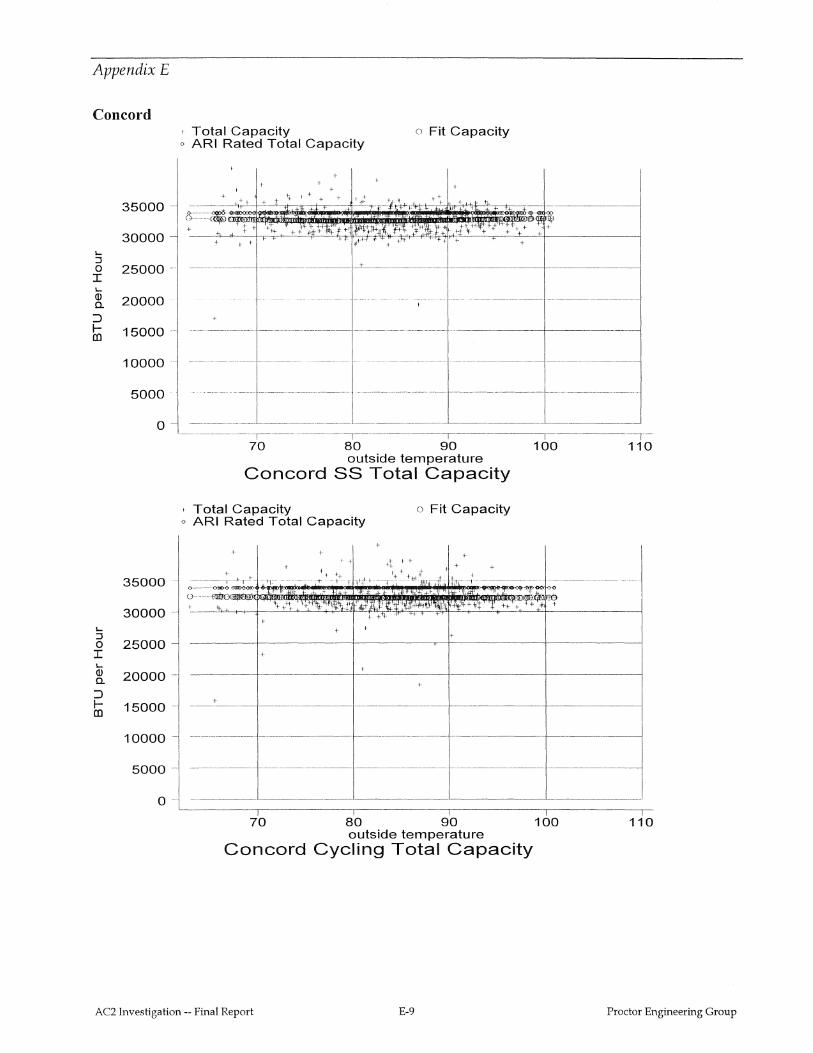
Appendix E
Concord
':J 0 I .... Q) a. :J
til
.... :J 0 I '-Q) a. :J 1-CD
35000
30000
25000-
20000
15000-
10000
5000
0
35000.
30000
25000
20000
15000
10000
5000
0
' Total Capacity o Fit Capacity o ARI Rated Total Capacity
+ + + ++ + I \- -1 + + + ~~-/
+
+ .. -b.
+
-- --· ----- ------------------------,-·--------------------------
--------------------- ---------+---------1
-----------------· -------- ----------- -----------1---~-------
- ------------------------- ----------------
---,--70 80 90 100 110
outside temperature Concord SS Total Capacity
' Total Capacity o Fit Capacity <> ARI Rated Total Capacity
+ +
+ + + +
+
+
+
+
+
--~-----·----- --~-----t----------1
70 80 90 100 outside temperature
Concord Cycling Total Capacity
110
AC2 Investigation- Final Report E-9 Proctor Engineering Group
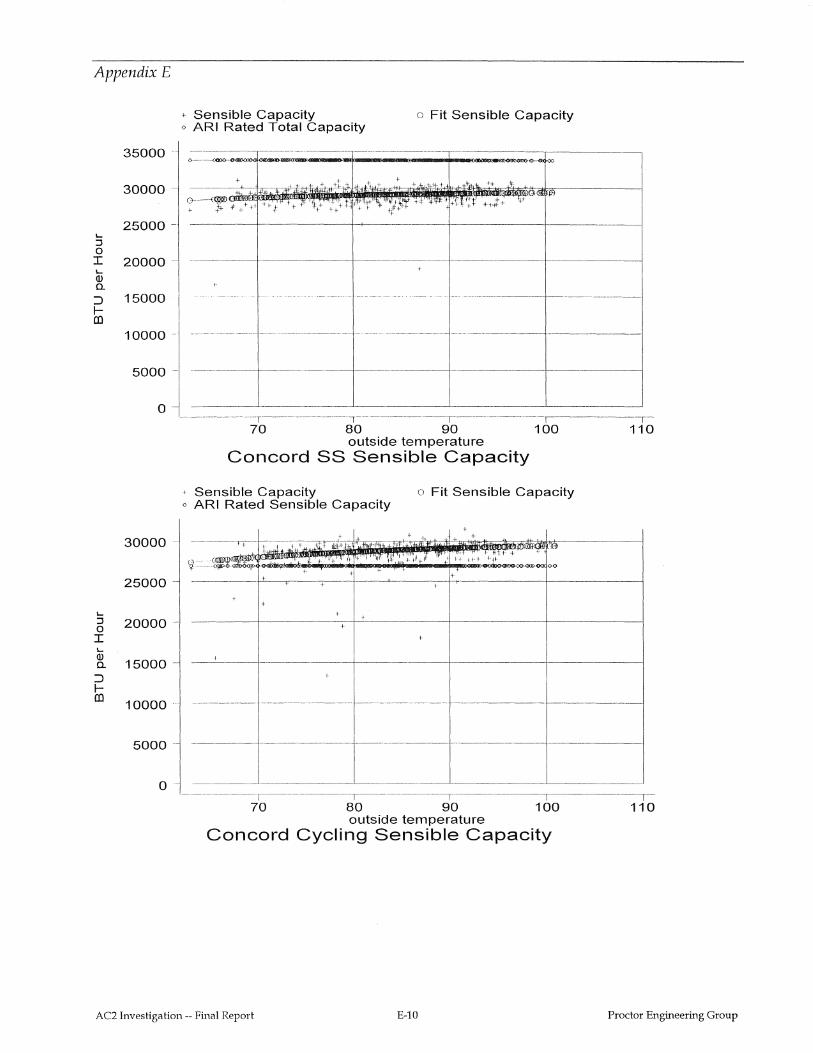
Appendix E
.... :I 0 I .... (]) a. ::J 1-ID
.... :I 0 I .... (]) a. ::J lID
35000
30000
25000-
20000
15000
10000-
5000
0
30000-
25000
20000
15000
10000
5000
o-
+ Sensible Capacity o ARI Rated Total Capacity
o Fit Sensible Capacity
()--
+ +h
~*+++ +t-_t
--·--------·------------ -------- ---------+--------1
---------,-----· I .------,-70 80 90 100 110
outside temperature Concord SS Sensible Capacity
+ Sensible Capacity o Fit Sensible Capacity o ARI Rated Sensible Capacity
+
+ + +
+
+
---------- ------------------------------!--------!
----~-------- ---------1------~-------4
70 80 90 100 outside temperature
Concord Cycling Sensible Capacity
110
AC2 Investigation- Final Report E-10 Proctor Engineering Group
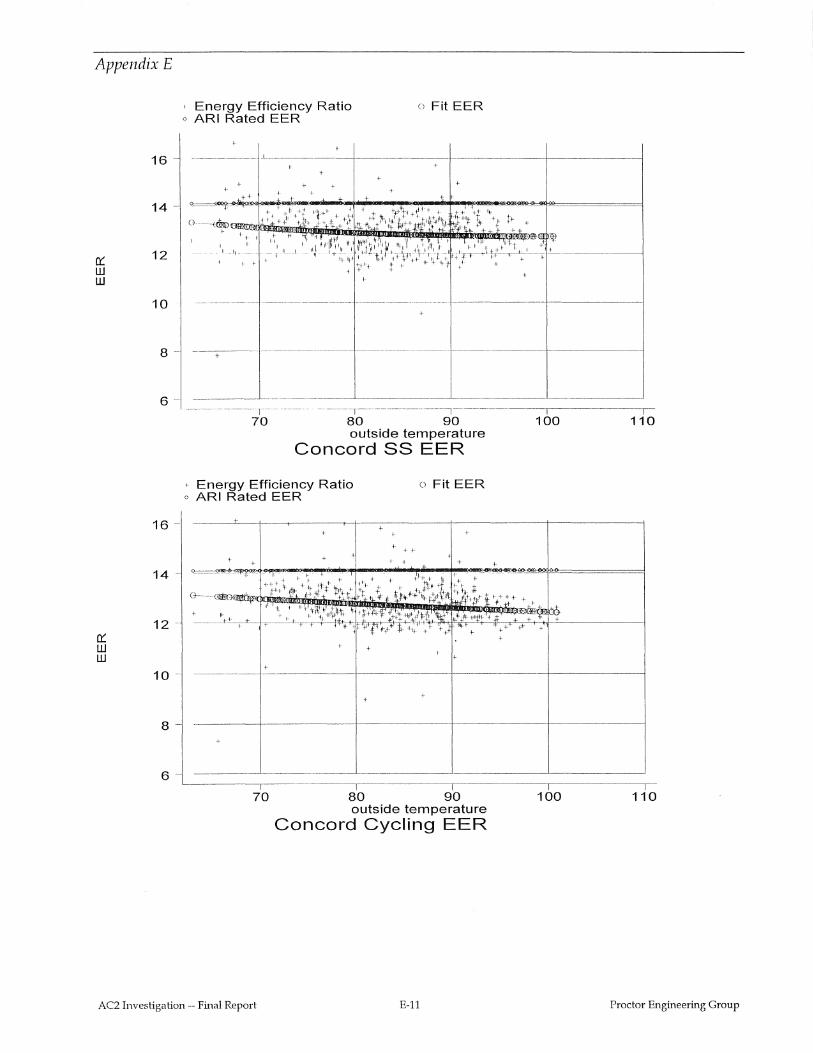
Appendix E
' Energy Efficiency Ratio o ARI Rated EER
o Fit EER
16 ----~-- j_--------+----------+---------+-----------1
0::: w w
14
12
<>
+ + + +
+ +
+ + +
+ +
+
1 0 --------------~---------------1--~~~~~-t--~~~~~---j
8
6
16-
8
6
+
+
---------r---- ------ ----,-------, 70 80 90
outside temperature Concord SS EER
+ Energy Efficiency Ratio o ARI Rated EER
o Fit EER
+
+
+
+ +
+
+
+ + -i-
1- +
+
+
70 80 90 outside temperature
Concord Cycling EER
AC2 Investigation -Final Report E-11
100 110
+
+
100 110
Proctor Engineering Group
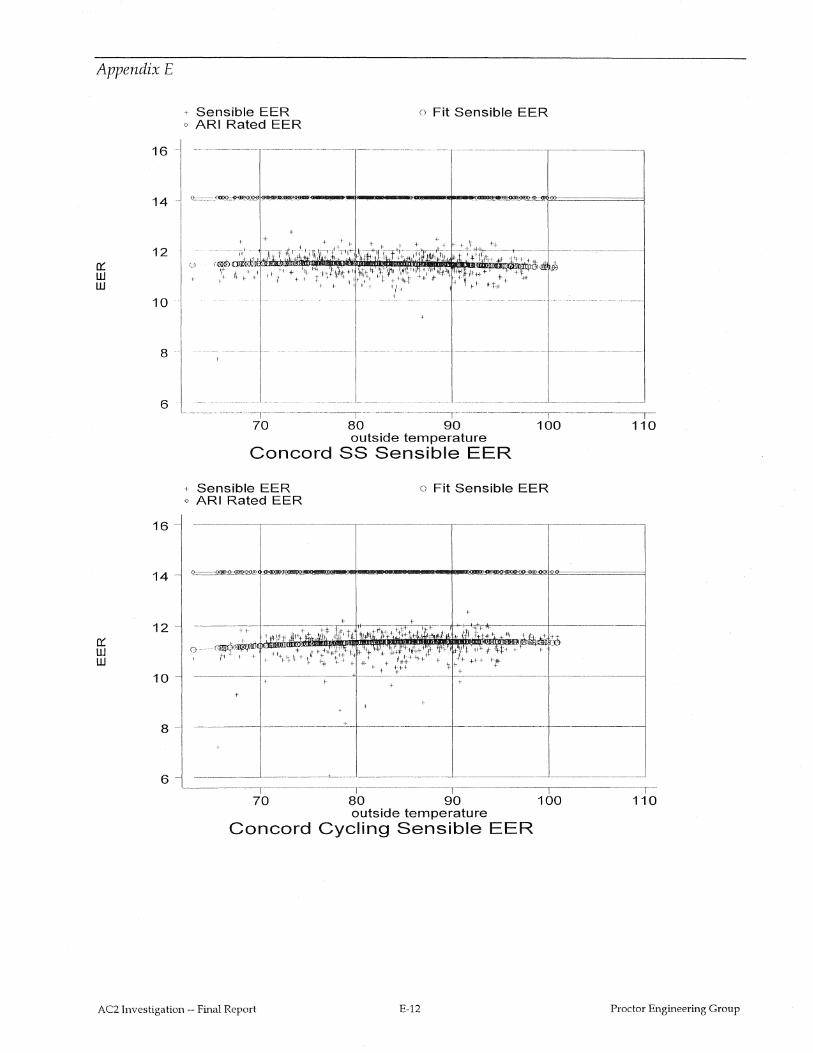
Appendix E
0:: w w
0:: w w
16
14
12
10
8
6
16
14
1 2 -
10
8 --
6
+ Sensible EER o Fit Sensible EER o ARI Rated EER
--1--II
(_:) ca®owlclJ \:_ It- 1-
I I I
I
--- --r --r - ---r - -------l-- ----
70 80 90 100 outside temperature
Concord SS Sensible EER
+ Sensible EER o Fit Sensible EER o ARI Rated EER
----------,------------
-----,------------- -~------ ---- - _____ 1 ___ __
70 80 90 100 outside temperature
Concord Cycling Sensible EER
T-11 0
AC2 Investigation-- Final Report E-12 Proctor Engineering Group
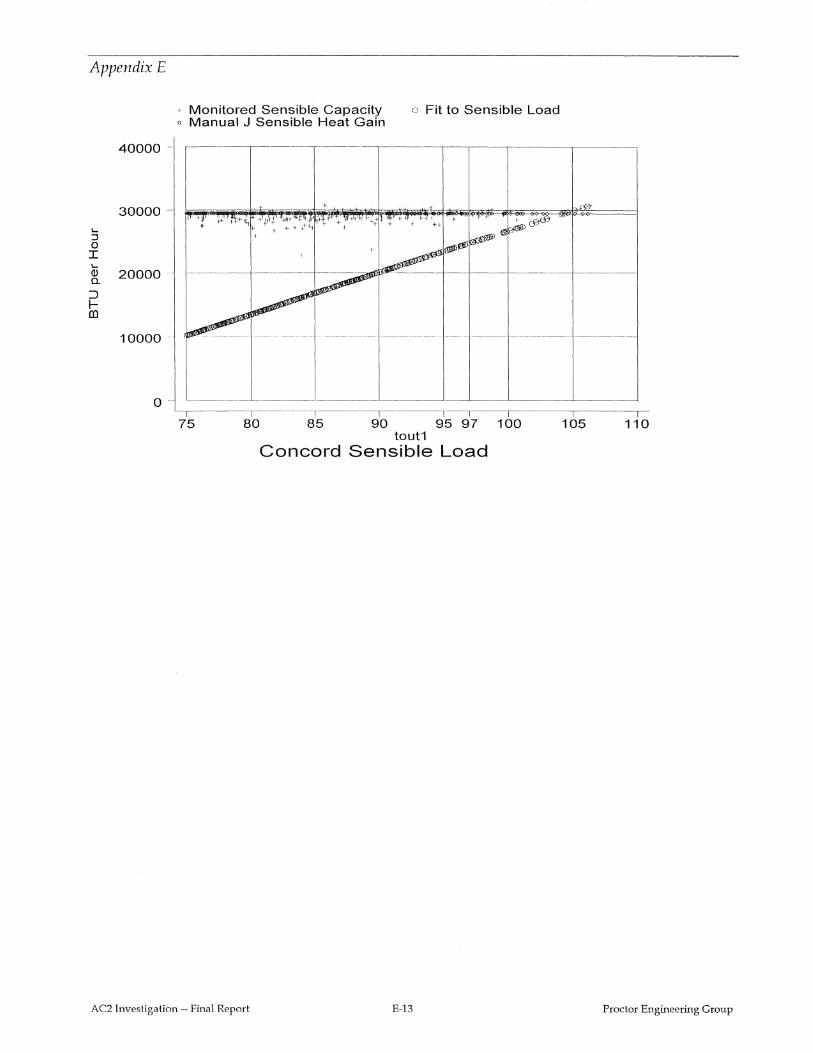
Appendix E
40000-
30000-... ::J 0 I ... Q) 20000-0..
::::> 1-(]J
10000-
+ Monitored Sensible Capacity o Manual J Sensible Heat Gain
75 80 85 90
o Fit to Sensible Load
95 97 100 tout1
Concord Sensible Load
AC2 Investigation --Final Report E-13
105 110
Proctor Engineering Group
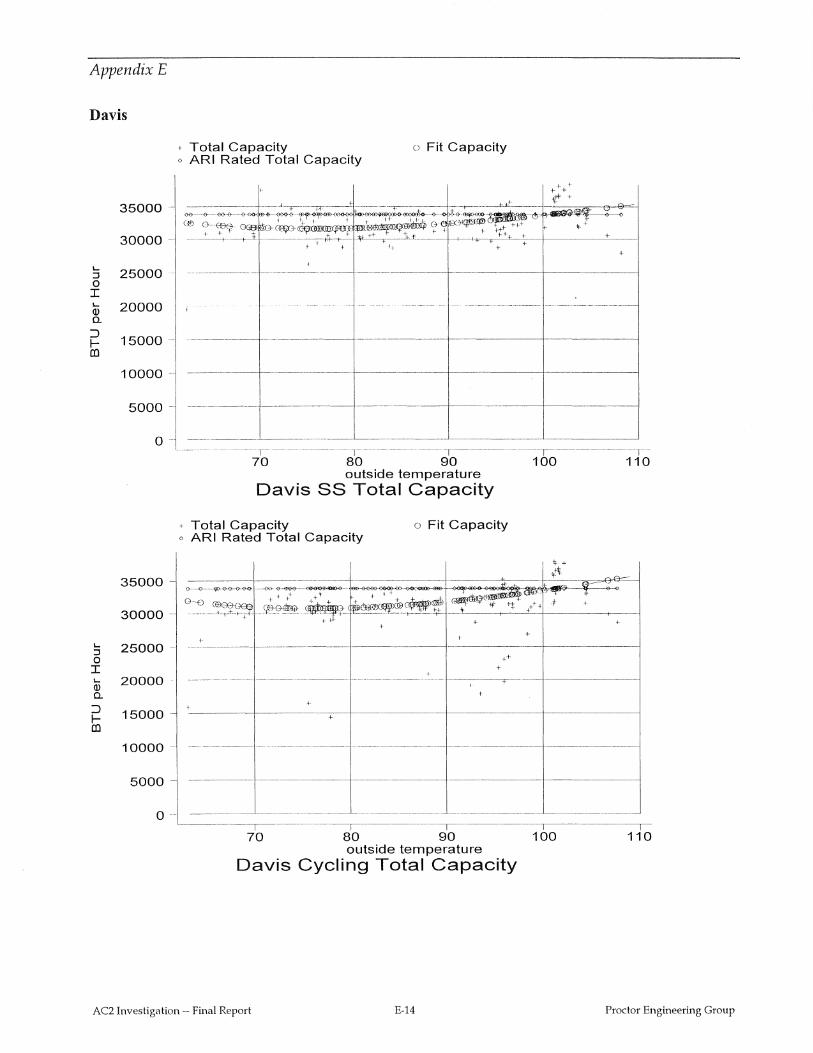
Appendix E
Davis
+ Total Capacity o Fit Capacity o ARI Rated Total Capacity
35000.
30000 t ._ +-j + +
.,
+ + + + t' +
+
+
..... ::J 0 I
25000 . -------f--·----~ --------+------+--------1
.... Q) a.
:::> ICO
.... ::J 0 I ..... Q) a.
:::> In
20000
15000.
10000
5000
0-
35000
30000-
25000-
20000
15000
5000
0 --
·--·-·--··--·-,----·-·---~·r----------,
70 80 90 outside temperature
Davis SS Total Capacity
+ Total Capacity o Fit Capacity o ARI Rated Total Capacity
+-
+
100
+
---,-110
---------~------~---1----·-----''-----+---~------1-----------j
+ +
+
--------<--·-----·---- ----------------1---------------j
70 80 90 100 outside temperature
Davis Cycling Total Capacity
110
AC2 Investigation-- Final Report E-14 Proctor Engineering Group
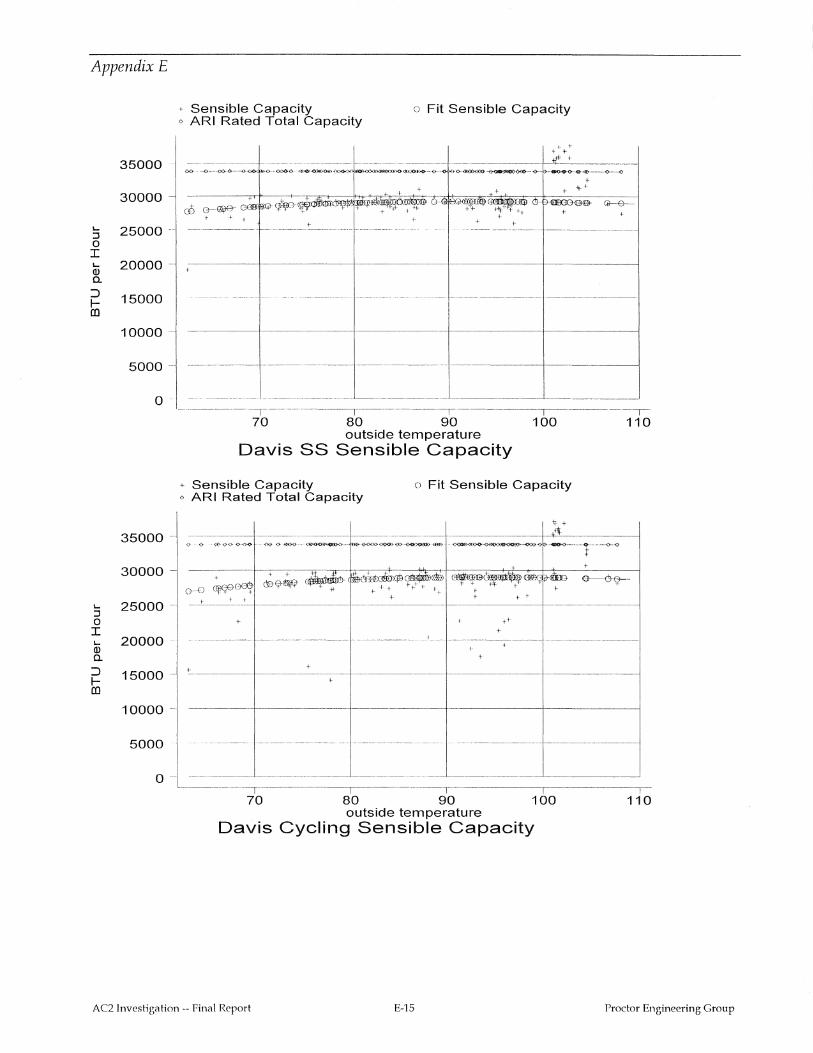
Appendix E
.... ::J 0 I .... Q) a.
::> 1-m
.... ::J 0 I .... Q) a.
::> hl
35000
30000
20000
15000
10000
5000
0 -
35000
30000
25000
20000-
15000
10000-
5000
0
+ Sensible Capacity o Fit Sensible Capacity o ARI Rated Total Capacity
+ + ~++
------~ ---------------------+---------+-"------/ oo.---o~--<X>-<)-()..()O<l&()--<l()()'()--~~ ~-<r--0>0~~4--()-....0<0'o--o~
t
+ + + + if-+
+ +1- + +i-"
+ ------- -------·--------- --·--· -·-·· --
---- - -------·-·· -------- -----·-------- ---------1------1
---------- ----------+------------1---------1--------1
--- ------------- --------------~-------- ______ __L _______ __j
--------,--- -, 70 80 90 100
outside temperature Davis SS Sensible Capacity
+ Sensible Capacity o Fit Sensible Capacity o ARI Rated Total Capacity
"'+
--, 110
-·---- --------1---------t-------f-'F-+t_,__ ____ -1 0 -·-<> ~«-o-o-<><K> --·«>- o-~---<10'~--~-0-<>0:>00Q'l>ro--~-<e:f> --()(111&«00-~-o·i>-~><>------+~
+
+ +
+ + t+-
+
+ ----------· '---f---------------
+ +
+ +
--- --·------- ----·------------ -------·-------- ----- -- -------------1-------j
~------,-------,--------,------,-------.-
70 80 90 100 outside temperature
Davis Cycling Sensible Capacity
110
AC2 Investigation-- Final Report E-15 Proctor Engineering Group
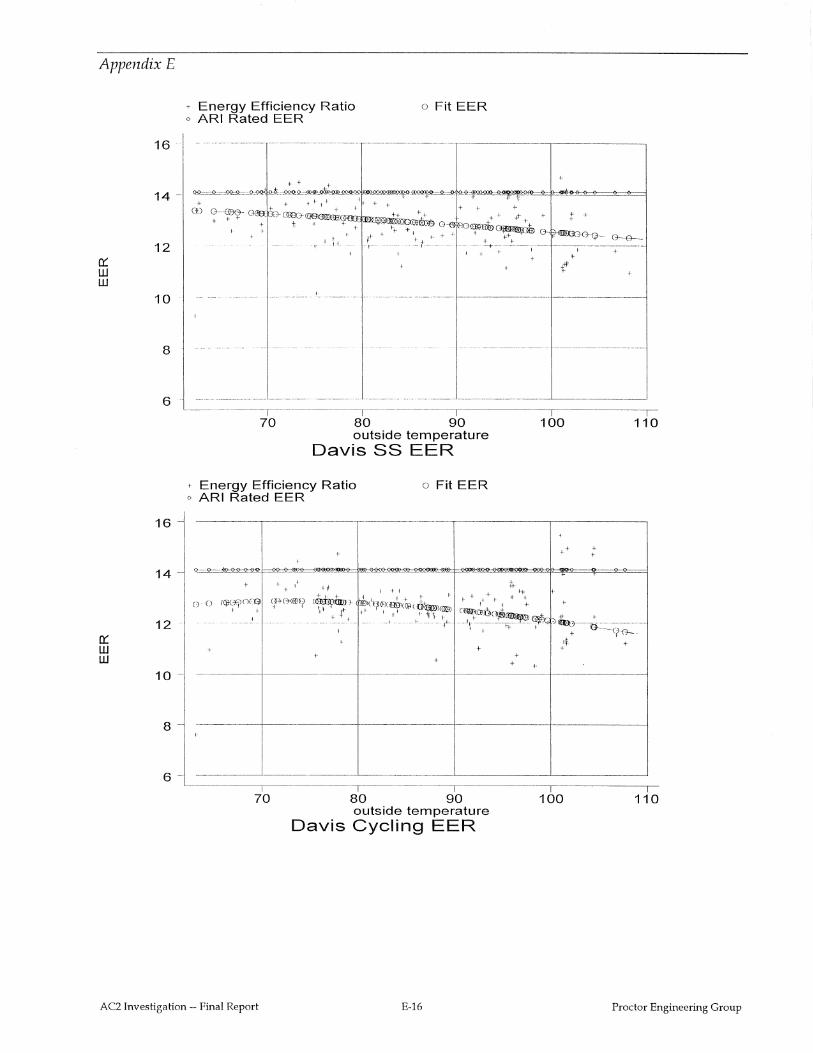
Appendix E
0::: w w
0::: w w
16
14 -
12
10
8
6
16
14
12
10
8
+ Energy Efficiency Ratio o ARI Rated EER
+ 00 G-ffie-
+ + + + +
o Fit EER
+
+
-·· -----·--- ·-· ··--·-· ---- -----·-·f--------- 1----------j
--· ------------- ----------
------~-·-- --·-· ·--·-·-- ---·--·-·--·-··-- _______ ___L ______ _
70 80 90 outside temperature
Davis SS EER
+ Energy Efficiency Ratio o ARI Rated EER
o Fit EER
+
c_ • OOG~eeeo
+ 11
()·0 CQK*flOElil ?'1-G-<lN( I f
+ +
70 80 90 outside temperature
Davis Cycling EER
100 110
+ + +
100 110
AC2 Investigation -- Final Report E-16 Proctor Engineering Group
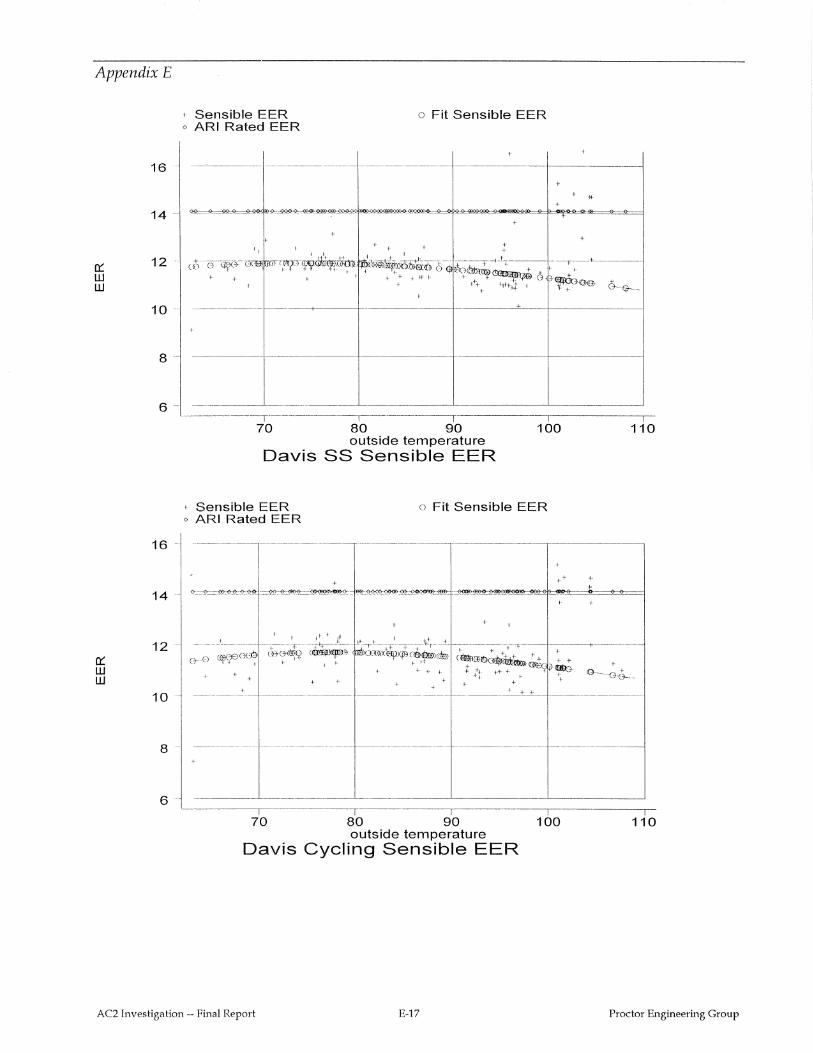
Appendix E
~ w w
~ w w
16 -
14-
12
10 -
a-
6-
16 -
14-
12 -
10
8 -
6
+ Sensible EER o Fit Sensible EER o ARI Rated EER
+
-~--- -----~--~-----------j--------+---------1
+
+ *
+ +
+
'-----~~~----,-----------,--------,---------,-------,--
70 80 90 outside temperature
Davis SS Sensible EER
100
; Sensible EER o Fit Sensible EER o ARI Rated EER
+ +
+ + 1 f
--~-~~;:;G~Eil>- ~~~'7~~'r,. :- c~'l ~~~~~~!-Jrl!i»--'_+-t---~---+-;t" + + G-CJ ~y- 1 1- + +- FF (~~.~~~ + +
+ + + ~- -t+ ++ + _......,iP~. +- ++ + + t_-1-+ +
110
____ +_1---------+~--------___+:__ ____ ~ __ +___r_+__;+c_--+-----~--~
-------- -----~-------------r------------+--·-----1
70 80 90 100 outside temperature
Davis Cycling Sensible EER
110
AC2 Investigation- Final Report E-17 Proctor Engineering Group
Appendix E
Davis Sensible Load is indeterminate from data. Thermostat adjustments are too frequent.
AC2 Investigation-- Final Report E-18 Proctor Engineering Group
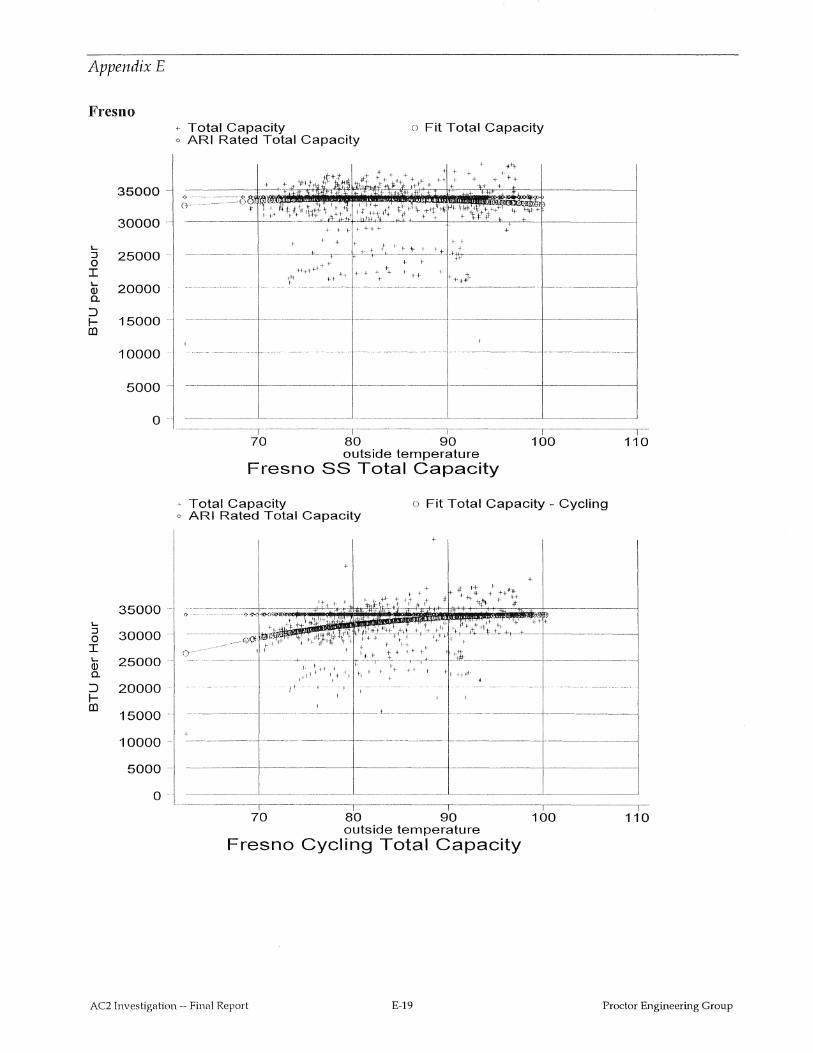
Appendix E
Fresno
35000
30000.
'-:::l 25000 0 I '- 20000 <ll 0.
:J I- 15000 m
10000
5000
0
35000 '-:::l 30000 0 I '- 25000 <ll 0.
:J 20000 I-m
15000
10000
5000
0
+ Total Capacity o Fit Total Capacity o ARI Rated Total Capacity
H--t-1 f.-·\.-~ + +-t
i;lt !--1-
··~---··-,-~--------,---~------·----~------~---··· r 70 80 90 100
outside temperature Fresno SS Total Capacity
, Total Capacity o Fit Total Capacity- Cycling o ARI Rated Total Capacity
0 ~
-----1---
_____ -:! _______ _
·~··- -~ ~-~ - --~~ ... -~ ------~-~--. -----
------- ---· -- -------------------
----~- ~--·--,-----~~---·-~-T----~---------T---·· ---- l
70 80 90 100 outside temperature
Fresno Cycling Total Capacity
110
AC2 Investigation~- Final Report E-19 Proctor Engineering Group
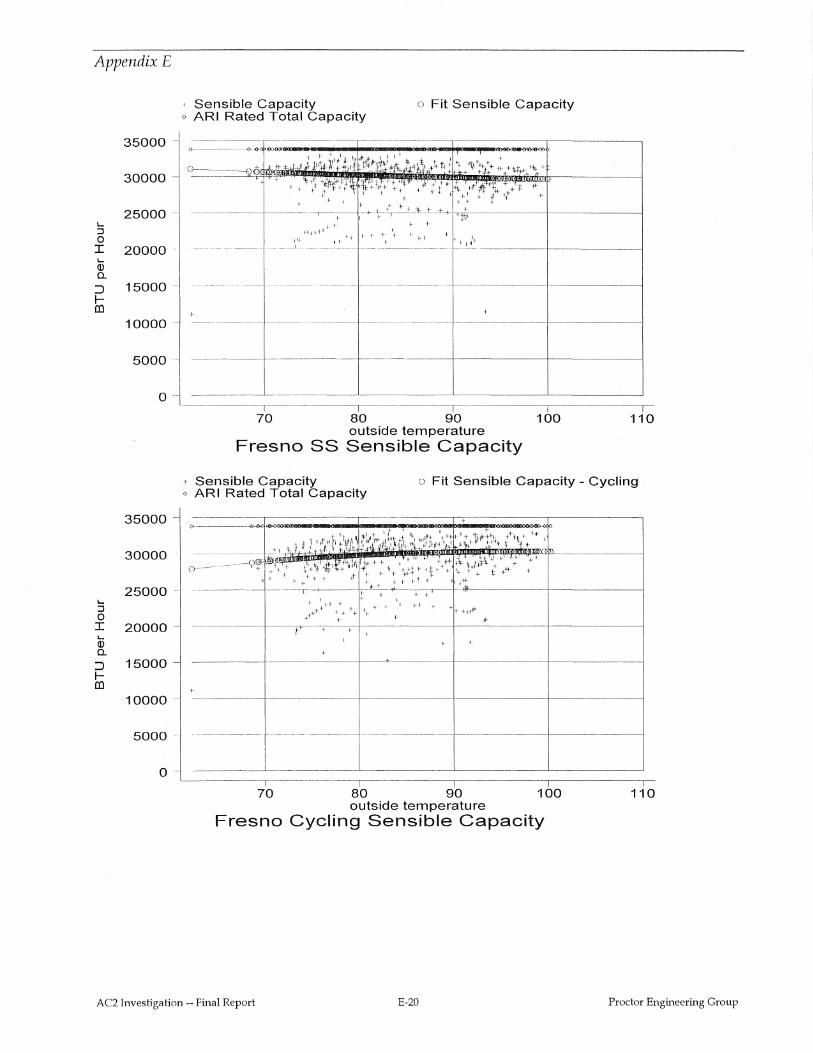
Appendix E
.... ::I 0 I .... Q) 0..
::J 1-al
.... ::I 0 I .... Q) 0..
::J 1-al
35000
30000
25000-
20000 -
15000
10000 -
5000-
0
35000
30000
20000
15000
10000
' Sensible Capacity o Fit Sensible Capacity o ARI Rated Total Capacity
+ +- t- ~· + +
!+++It -l t- + + + I· I· I· + I Jl· I- !- 1-l·lfi· ·--- -·-------------r------------1-------------i ------ ------------·-1---
----------------------------·· -1----------+:--------1
' ----------·-·-----1------------1-------+---------j
70 80 90 100 outside temperature
Fresno SS Sensible Capacity
110
+ Sensible Capacity o Fit Sensible Capacity - Cycling o ARI Rated Total Capacity
t +
+
+
5000 - --------- ----·---- ------ ----------+----------t-------1
70 80 90 100 outside temperature
Fresno Cycling Sensible Capacity
AC2 Investigation-- Final Report E-20
110
Proctor Engineering Group
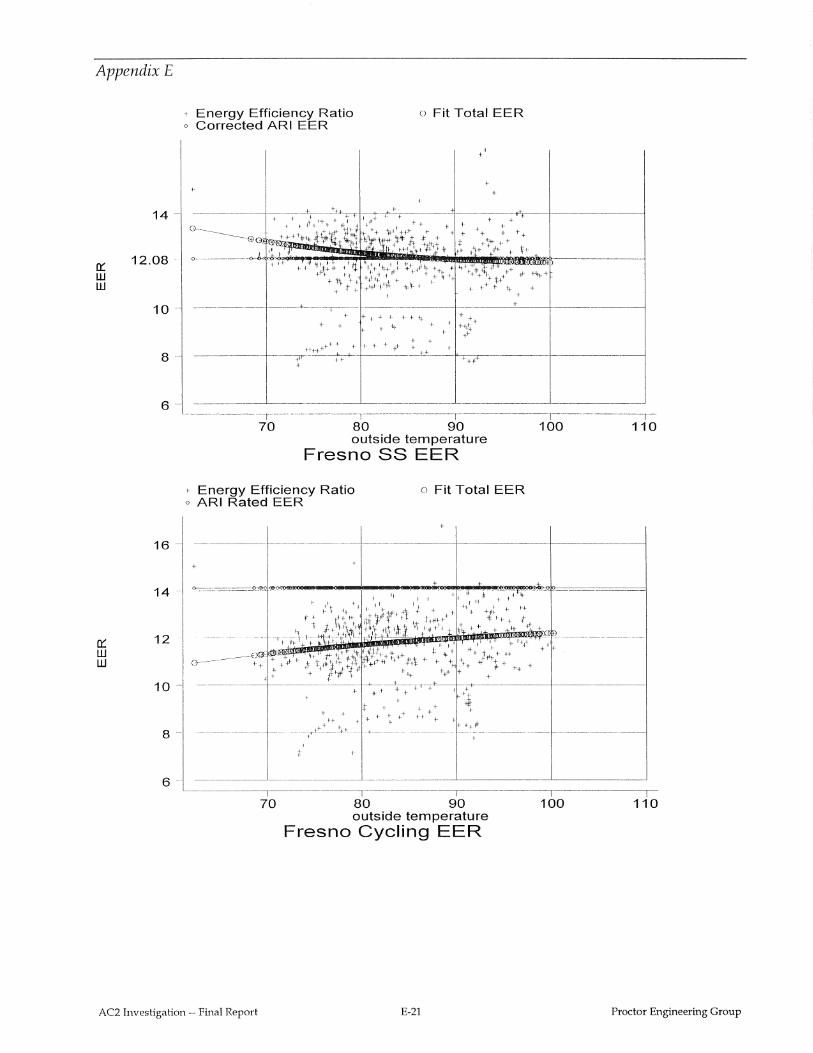
Appendix E
14
0::: 12.08 w w
10 -
8
6
16
14 ~·
0::: 12 w w
10
8-
6
+ Energy Efficiency Ratio o Corrected ARI EER
o Fit Total EER
+ +
+ H-i-t·++++ + + + + ++ + ~-+ -------------+-----.~. -~~~.7.4--~----------~----*"+~+-~r-----------~----------------~
+
~~--------,·---------1 ,-------,--70 80 90
outside temperature Fresno SS EER
• Energy Efficiency Ratio o ARI Rated EER
o Fit Total EER
+
<>.
+
+
++
70 80 90 outside temperature
Fresno Cycling EER
100
100
-------,-110
110
AC2 Investigation-- Final Report E-21 Proctor Engineering Group
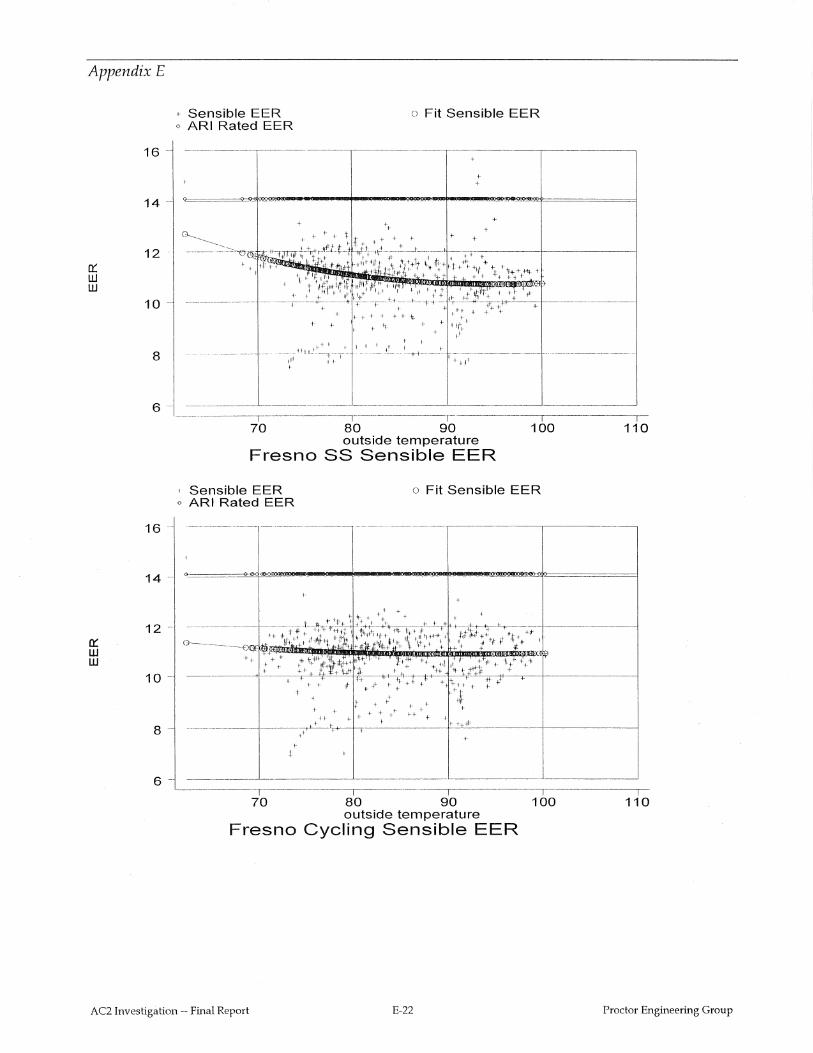
Appendix E
0:: LU LU
0:: LU LU
16
14
12 -
10 -
8
6
16
14
12 -
10
8
6-
,_ Sensible EER o Fit Sensible EER o ARI Rated EER
-----------,--------------,--------------.---·------------r-------------, +
+ +
--------,--------------,------------~------------~-------------,--
70 80 90 outside temperature
Fresno SS Sensible EER
100
' Sensible EER o Fit Sensible EER o ARI Rated EER
110
·----------- ---------~ ·---------·---~--------~-------~
+ +
+
+ + .;rIB-+ .t .+ ·+q. ++ ++ +,+++; + f +'~' t +t
: + + + -1~ + -11- + + + + ~ ++ H- + -1· + + . .ff
---------------~r--~---------~~~--------+-------t +
L_---------.-------------,---
70 80 90 100 outside temperature
Fresno Cycling Sensible EER
110
AC2 Investigation --Final Report E-22 Proctor Engineering Group
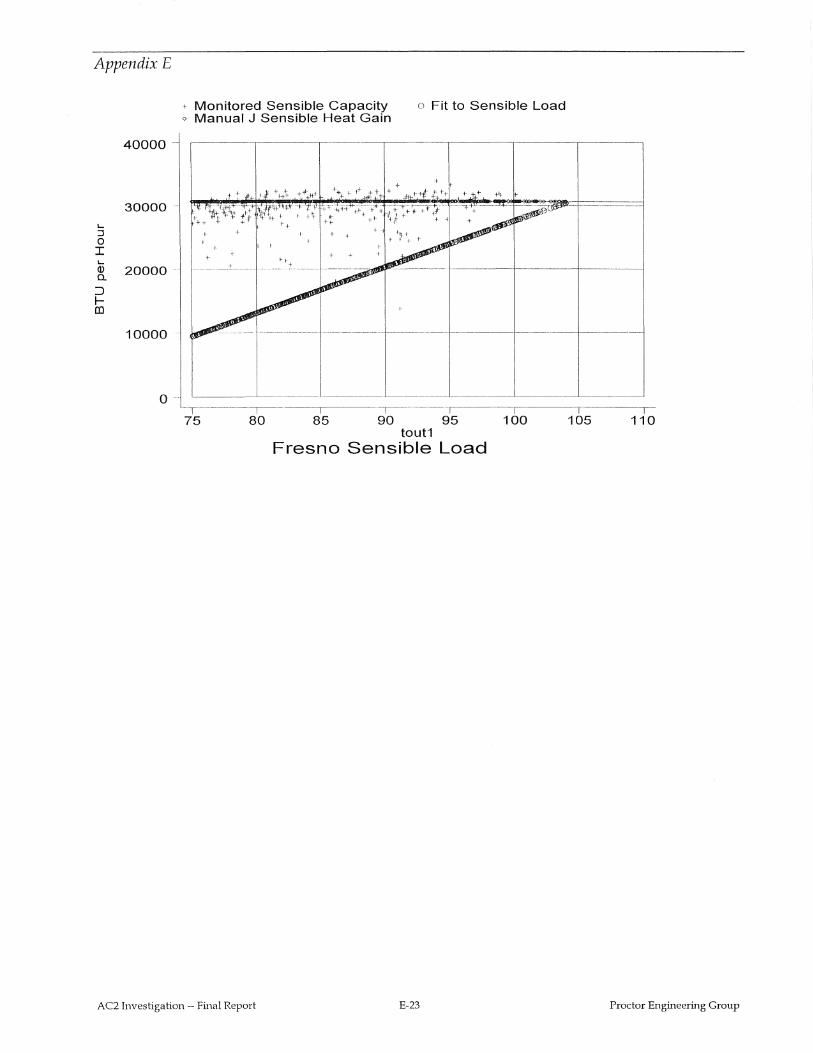
Appendix E
.... ::J 0 I .... <I) a. ::J 1-!ll
40000
30000 -
20000 --
10000 -
+ Monitored Sensible Capacity o Manual J Sensible Heat Gain
o Fit to Sensible Load
I I
+ 1-j-___ + __ -----~- _±_
75 ---,--80
,---------,----85 90 95
tout1 Fresno Sensible Load
100
AC2 Investigation-- Final Report E-23
105 110
Proctor Engineering Group
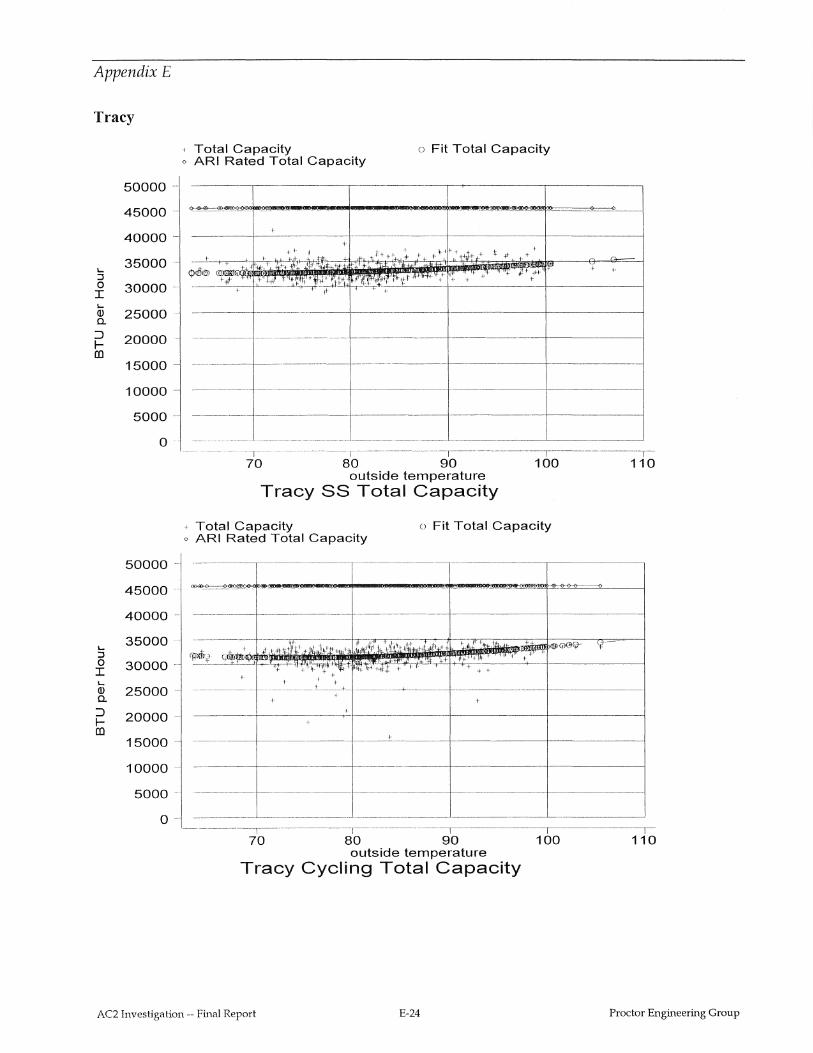
Appendix E
Tracy
,_ ::J 0 I ,_ Q) a.
:::> 1-m
,_ :::1 0 I ,_ Q) a.
:::> 1-m
50000
45000
40000
35000
30000-
25000
20000
15000
10000-
5000
o-
50000-
45000 --
40000-
35000
30000-
25000
20000
15000
10000
5000-
0
' Total Capacity o Fit Total Capacity o ARI Rated Total Capacity
+
<P<rllieJ +,H+
+
-----1-----------·~-~--------+-------+---------j
-------+---~-------~-~-------1----~--~-----~
----------~ ---~------~-__1__-----~-~_j _______ _j__ _____ ___,
------------------,----------~--~-T----------,-----
70 80 90 100 outside temperature
Tracy SS Total Capacity
+ Total Capacity o Fit Total Capacity o ARI Rated Total Capacity
+ + + -~ + :ltftt~¥+11ot +
t + + + +
+
• +
110
---~~-- f---------±------->~1----~f------+-------+-------1 +
+ + +
+
70 80 90 100 110 outside temperature
Tracy Cycling Total Capacity
AC2 Investigation-- Final Report E-24 Proctor Engineering Group
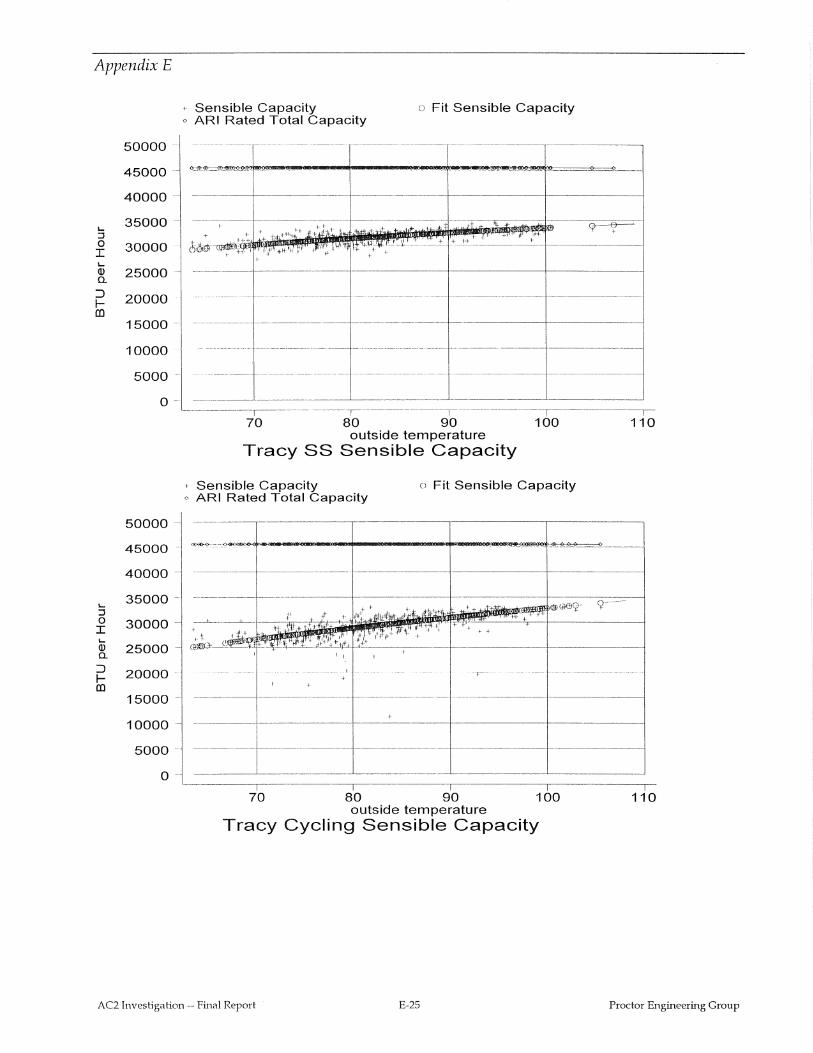
Appendix E
.... :J 0 I .... Q) 0.
~ Ill]
50000-
45000-
40000-
35000-
30000
25000 -
20000
15000-
10000
5000-
• Sensible Capacity o Fit Sensible Capacity o ARI Rated Total Capacity
----,------------~--- ------------.-------,--------~
--- --------------- ----------------+-------+-----~
-- ------------ -----------~ -------------- ----------~---------
-------
0 ------ ~-------
.... :J 0 I .... Q) 0.
~ Ill]
50000
45000
40000
35000-
30000
25000
20000-
15000
10000
5000-
0
70 80 90 100 110 outside temperature
Tracy SS Sensible Capacity
• Sensible Capacity o ARI Rated Total Capacity
o Fit Sensible Capacity
------~---------+---------j-------+----=---=-----1 """ (l!»@€!lc;t- ¥
+l + - +'
I I
-- -- ---- --------- - I
+ ---,--- - ---------- ----------------------
+
70 80 90 100 110 outside temperature
Tracy Cycling Sensible Capacity
AC2 Investigation-- Final Report E-25 Proctor Engineering Group
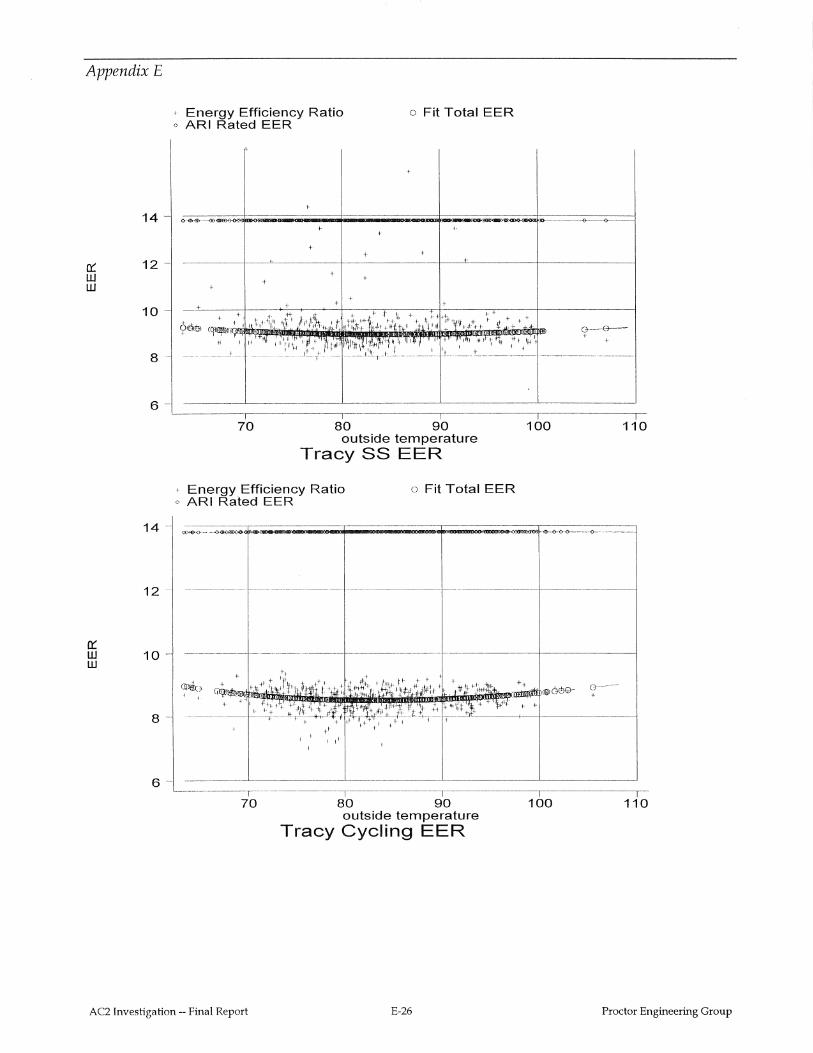
Appendix E
[( w w
[(
14
12
10
8
6
14
12 -
w 10-w
8-
6-
+ Energy Efficiency Ratio o ARI Rated EER
o Fit Total EER
+
+
+
+ +
+ +
+ + + + +
70 80 90 outside temperature
Tracy SS EER
+ Energy Efficiency Ratio o ARI Rated EER
o Fit Total EER
'---------r-
70 80 90 outside temperature
Tracy Cycling EER
AC2 Investigation-- Final Report E-26
100 110
100 110
Proctor Engineering Group
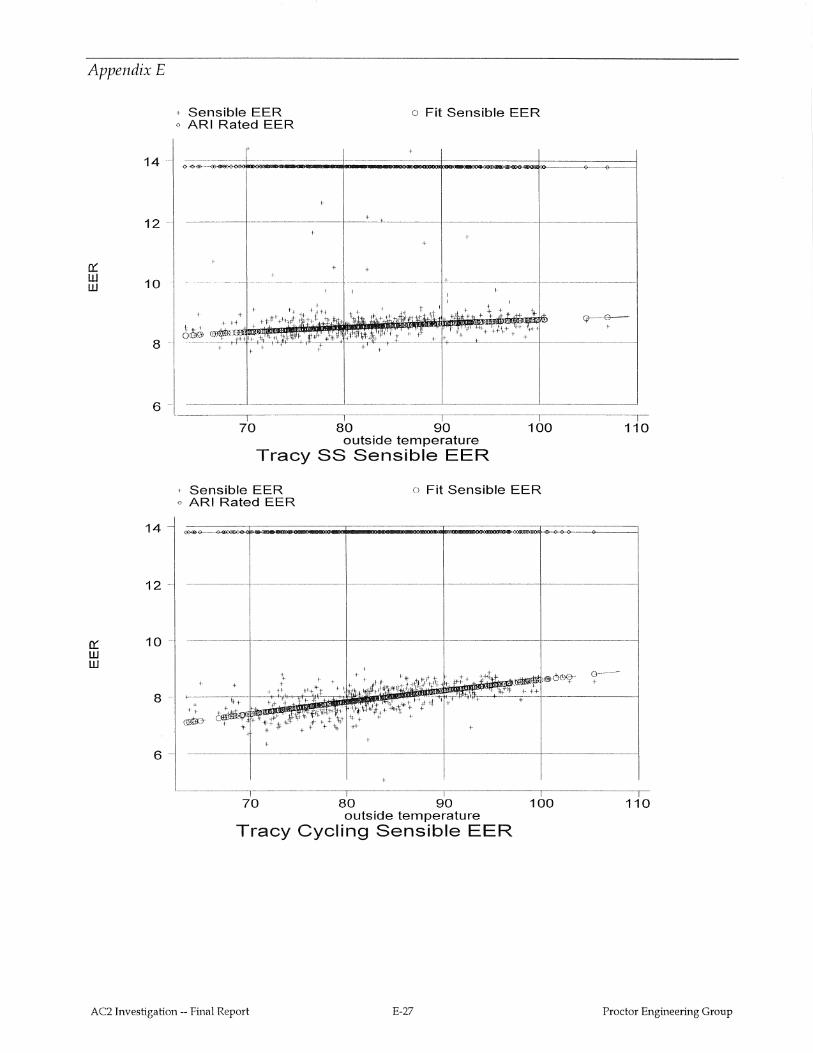
Appendix E
0:: UJ UJ
14
12
10
8 -
6 -
+ Sensible EER o Fit Sensible EER o ARI Rated EER
+
+
+
+ +
----~ --------- ---~- -------- Jc•~~-----j-------------j
Q>----+Ol--+
'------.---~~---,--------,--------,-------.-
0:: UJ UJ
14
12
10
8-
6
70 80 90 100 outside temperature
Tracy SS Sensible EER
+ Sensible EER o Fit Sensible EER o ARI Rated EER
+
+
70 80 90 100 outside temperature
Tracy Cycling Sensible EER
AC2 Investigation-- Final Report E-27
cr+
110
110
Proctor Engineering Group
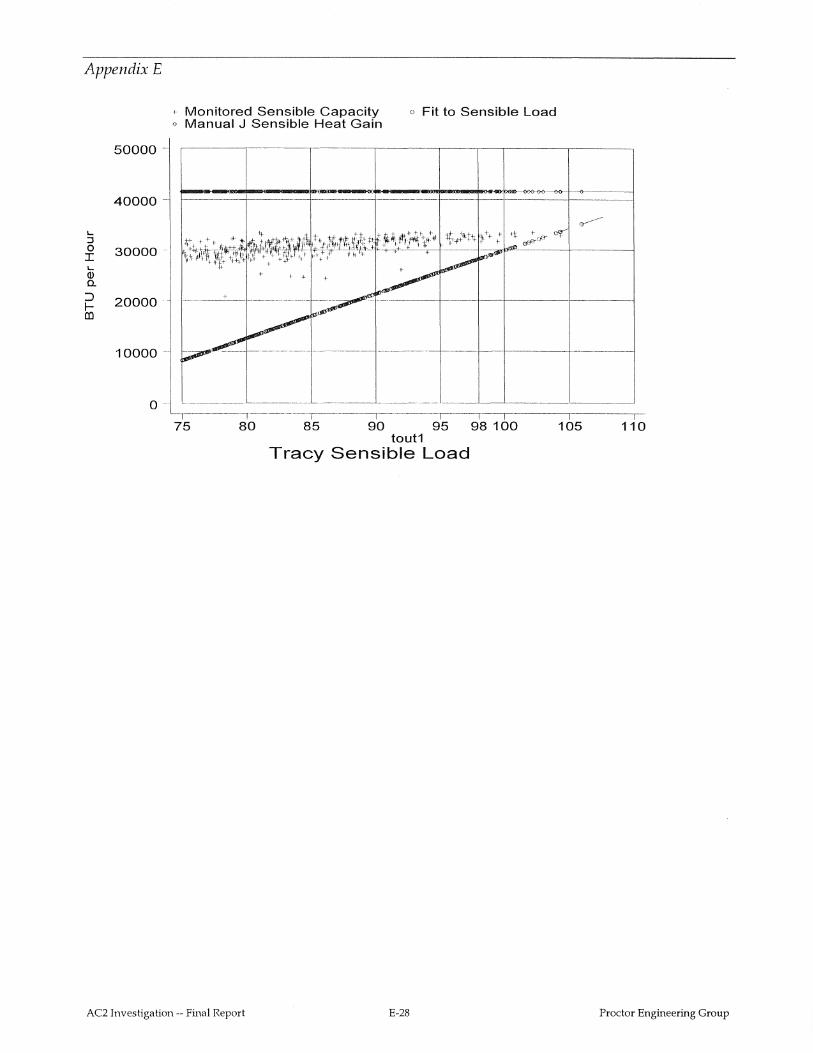
Appendix E
... :I 0 J: ... Q) a. :l
hl
50000-
40000-
30000-
20000
10000-
0 --
+ Monitored Sensible Capacity o Manual J Sensible Heat Gain
--
a Fit to Sensible Load
~
.t,+++++ -~ ~~~~1~ ,t 'JJ{.n:i~+ :~-: +"' + ~+- +t- + "'~ iJ"'il; ¥'-¥- +t,;-1\ct-t;_ !<++ +
+ + +t + <# or-""""~ r.-'* - t
I· I + +
'II~+~~'~ +,J+ 1-/t- +WI +~t 1/ ·\·/· 1Ht- +
~ ~-n-+
+ + + ~ +
+ ---
~ ~
-~ P""
- --~--- 1--
-'-------- '--- --~---
~-1 ' 75 80 85 90 95
tout1 Tracy Sensible Load
98 100 105 110
AC2 Investigation-- Final Report E-28 Proctor Engineering Group


![Hb Ac2 Parallel en[1]](https://img.pdfslide.us/doc/110x75/55cf9ddb550346d033af8df2/hb-ac2-parallel-en1.jpg)