Embed Size (px)
Citation preview
investigation of tc charlotte impacts in the townsville Area

Systems Engineering Australia Pty Ltd
Numerical Modelling and Risk Assessment ABN 65 073 544 439
7 Mercury Ct Bridgeman Downs Qld 4035 Tel: +61 7 3353-0288 Email: [email protected]
TITLE Investigation of TC Charlotte Impacts in the Townsville Area
Client Townsville City Council
Contract P/O D/217802 Name Storm Tide Support
SEA Job No. J0813 Document ID: PR001 Rev: B
Prepared by: B A Harper Approved by: B A Harper
Custodian: B A Harper Signature: Date: 05/03/2009
CONCURRENCE
Name Organisation Date Signature
REVISION HISTORY
Revision Description Date Prepared by Approved by
A Draft for initial comments 03/02/2009 B A Harper B A Harper
B Minor changes and corrections (incl tide) 05/03/2009 B A Harper B A Harper
DOCUMENT DISTRIBUTION
Release Statement Unclassified Restricted Confidential Most Confidential
Copy No. Name Organisation
01 Brian Milanovic Townsville City Council

(this page is blank)

Investigation of TC Charlotte Impacts in the Townsville Area
Storm Tide Support P/O D/217802
Townsville City Council SEA Document No. J0813-PR001B
Systems Engineering Australia Pty Ltd Date Printed 05/03/09 Page i
Table of Contents
Executive Summary ……………………………………………………….. iii
1 Introduction ..................................................................................... 1
2 Tropical Cyclone Charlotte ............................................................. 1
3 Recorded Water Levels .................................................................. 4
4 Photographic Records .................................................................... 4
5 Estimated Wave Conditions ........................................................... 8
6 Site Inspection and Surveys .......................................................... 9
7 Analysis and Interpretation .......................................................... 13
8 The Statistical Context of the TC Charlotte Event ...................... 14
9 Conclusions and Recommendations .......................................... 16
10 References .................................................................................... 17
List of Figures Figure 1 BoM satellite image of ex-TC Charlotte on 12th Jan 2009. ..................... 1
Figure 2 Synoptic development of the ex-TC Charlotte wind and pressure field. ............................................................................................................................ 2
Figure 3 BoM recorded regional wind speeds ...................................................... 3 Figure 4 Townsville tide gauge measured and predicted water levels. .............. 4 Figure 5 Selected water levels Ross Creek, Harbour and Picnic Bay. ................ 5 Figure 6 Selected beach impacts along The Strand. ............................................ 6
Figure 7 Selected beach impacts Rowes Bay and Pallerenda. ............................ 7 Figure 8 Real-time EPA waverider buoy data. ....................................................... 8 Figure 9 Waves at Stuart St headland on 16th. ..................................................... 9 Figure 10 Surveyed areas of The Strand and Rowes Bay. ................................. 10 Figure 11 Site inspections The Strand and Rowes Bay. .................................... 11
Figure 12 Site inspections Saunders Beach and Bushland Beach. .................. 12
Figure 13 Analysis of The Strand survey data. ................................................... 13
Figure 14 Cyclonic and non-cyclonic analysis for Townsville from Hardy et al. (2004) ................................................................................................................ 15
Figure 15 Comparison with cyclonic-only analysis for Townsville from GHD (2007) ................................................................................................................ 15

Investigation of TC Charlotte Impacts in the Townsville Area
Storm Tide Support P/O D/217802
Townsville City Council SEA Document No. J0813-PR001B
Systems Engineering Australia Pty Ltd Date Printed 05/03/09 Page ii
(this page is blank)
Investigation of TC Charlotte Impacts in the Townsville Area
Storm Tide Support P/O D/217802
Townsville City Council SEA Document No. J0813-PR001B
Systems Engineering Australia Pty Ltd Date Printed 05/03/09 Page iii
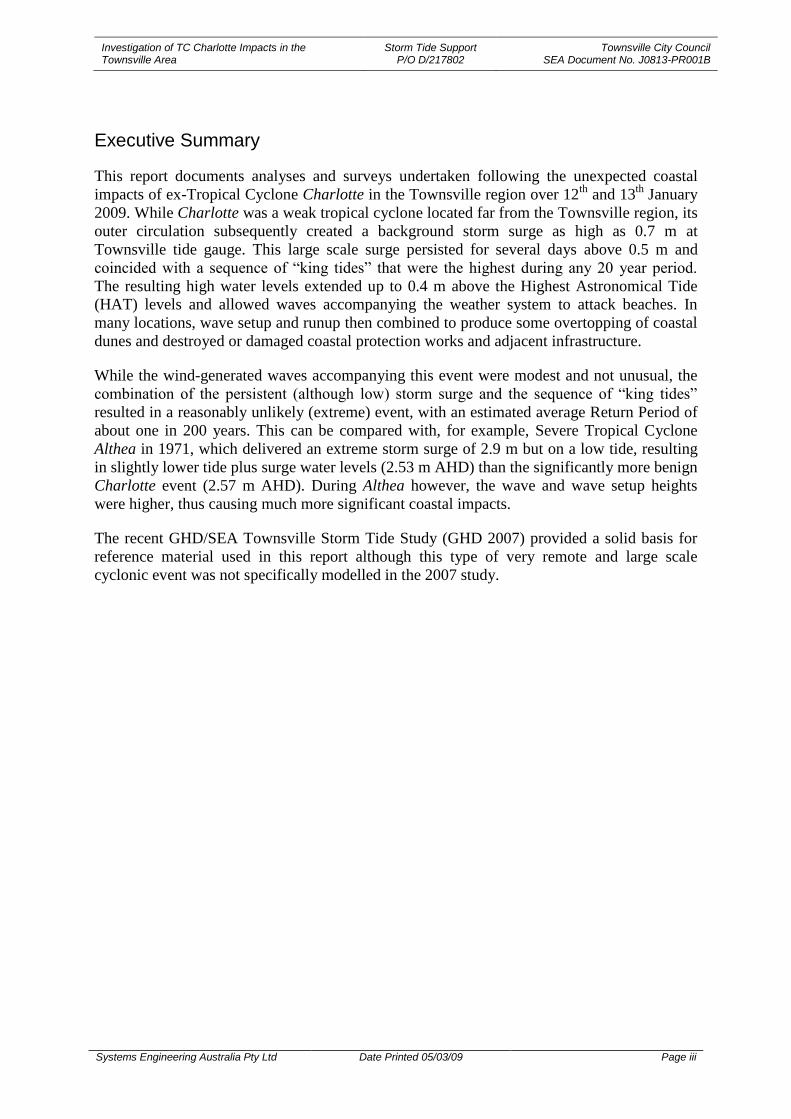
Executive Summary
This report documents analyses and surveys undertaken following the unexpected coastal
impacts of ex-Tropical Cyclone Charlotte in the Townsville region over 12th
and 13th
January
2009. While Charlotte was a weak tropical cyclone located far from the Townsville region, its
outer circulation subsequently created a background storm surge as high as 0.7 m at
Townsville tide gauge. This large scale surge persisted for several days above 0.5 m and
coincided with a sequence of “king tides” that were the highest during any 20 year period.
The resulting high water levels extended up to 0.4 m above the Highest Astronomical Tide
(HAT) levels and allowed waves accompanying the weather system to attack beaches. In
many locations, wave setup and runup then combined to produce some overtopping of coastal
dunes and destroyed or damaged coastal protection works and adjacent infrastructure.
While the wind-generated waves accompanying this event were modest and not unusual, the
combination of the persistent (although low) storm surge and the sequence of “king tides”
resulted in a reasonably unlikely (extreme) event, with an estimated average Return Period of
about one in 200 years. This can be compared with, for example, Severe Tropical Cyclone
Althea in 1971, which delivered an extreme storm surge of 2.9 m but on a low tide, resulting
in slightly lower tide plus surge water levels (2.53 m AHD) than the significantly more benign
Charlotte event (2.57 m AHD). During Althea however, the wave and wave setup heights
were higher, thus causing much more significant coastal impacts.
The recent GHD/SEA Townsville Storm Tide Study (GHD 2007) provided a solid basis for
reference material used in this report although this type of very remote and large scale
cyclonic event was not specifically modelled in the 2007 study.

Investigation of TC Charlotte Impacts in the Townsville Area
Storm Tide Support P/O D/217802
Townsville City Council SEA Document No. J0813-PR001B
Systems Engineering Australia Pty Ltd Date Printed 05/03/09 Page iv
(this page is blank)

Investigation of TC Charlotte Impacts in the Townsville Area
Storm Tide Support P/O D/217802
Townsville City Council SEA Document No. J0813-PR001B
Systems Engineering Australia Pty Ltd Date Printed 05/03/09 Page 1
1 Introduction
Townsville City Council requested an investigation into the coastal impacts associated with
TC Charlotte during the period 12th
and 13th
of January 2009 to assess the likely return period
of such an event in the context of Council’s existing storm tide planning framework. The
cyclone occurred during a period of “king tides” that reached to the Highest Astronomical
Tide (HAT) level of about 2.2 m AHD. The decaying cyclone added around a further 0.5 m in
background persistent storm surge, peaking at 0.7 m, plus strong winds created additional
wave impacts caused by breaking wave setup and runup. As a result, many low lying beach
areas experienced minor overtopping of the coastal dunes, some beaches suffered localised
erosion and/or accretion and there was widespread damage to coastal protection works and
beach access infrastructure.
In support of this review an inspection and field survey of beach erosion and debris levels was
carried out on 16th
January in association with Council surveyors.
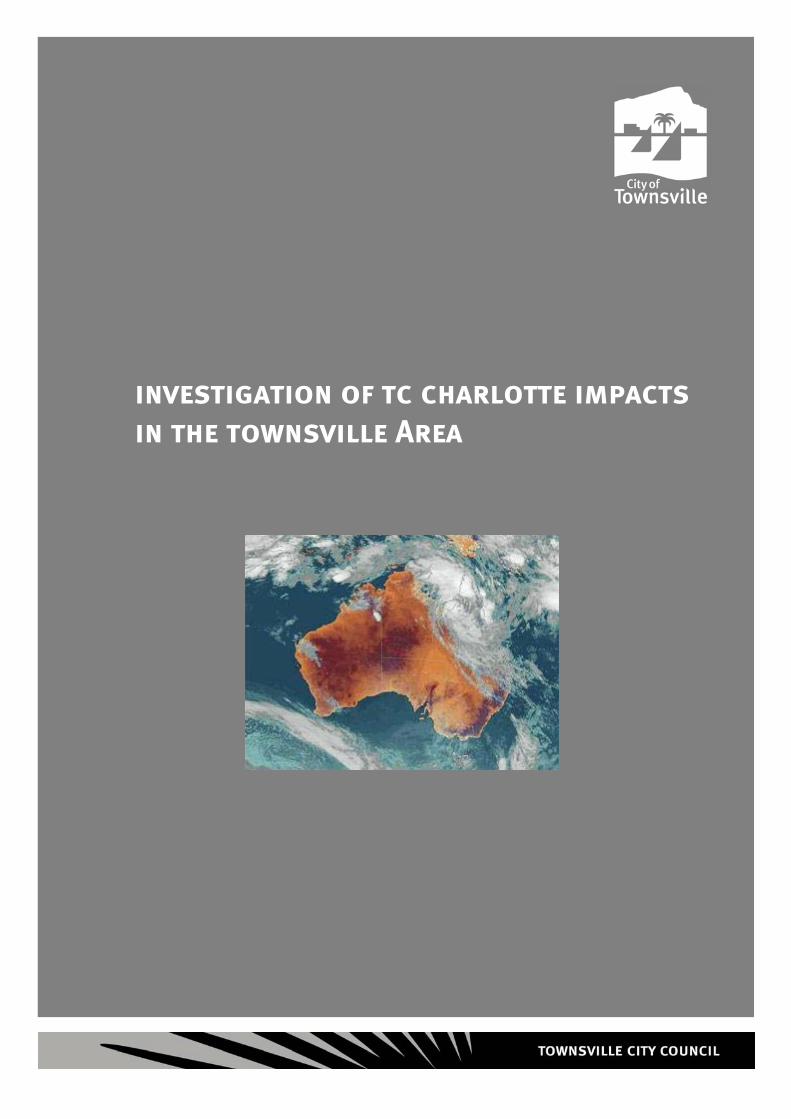
2 Tropical Cyclone Charlotte
Category 1 TC Charlotte formed in the southern Gulf of Carpentaria on 11th
January and
crossed the SE corner near Karumba on the 12th
(Figure 1). At this time there is no formal
report on the storm available from the Bureau of Meteorology (BoM), however an overview
of the large scale synoptic fields is provided in Figure 2. This shows that the storm quickly
mobilised a quite large circulation, even though it had crossed land and was attenuating. Over
the next 24 h period the circulation created strong onshore winds in the Townsville region,
veering SE on the 13th
.
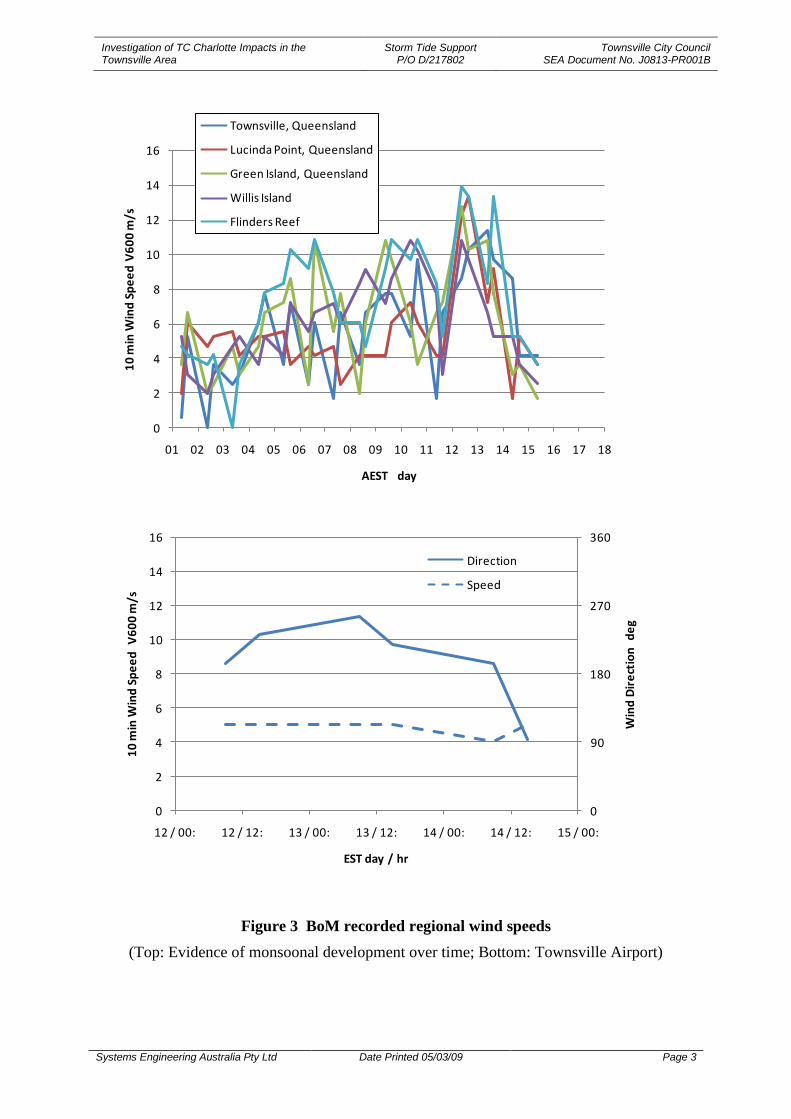
Figure 3 summarises 9am and 3pm recorded wind speeds across the region over the preceding
fortnight, showing an already active monsoonal development into which the Charlotte wind
field merged and intensified. The Townsville Airport winds on 12th
and 13th
are also detailed,
showing a strong ESE.
Figure 1 BoM satellite image of ex-TC Charlotte on 12th
Jan 2009.

Investigation of TC Charlotte Impacts in the Townsville Area
Storm Tide Support P/O D/217802
Townsville City Council SEA Document No. J0813-PR001B
Systems Engineering Australia Pty Ltd Date Printed 05/03/09 Page 2
Figure 2 Synoptic development of the ex-TC Charlotte wind and pressure field.
(Courtesy J. Callaghan).
1392726
25
96919
2322
992
12
2422
20
9962725
19
0102824
0211023
22
005 142626
500826
25
025 132524
9
9842524
12998
2523
054 29
21
057
1005
100618049
057 23
24022
28027
2726
035
82525
04762222
044 282622
2523
20
0192925
18075
2924
2321
03535
068 272421
047 3026
21
0282922007
1900727
26
24
03229
1906828
26
99812
7995
037
19
2119
2423
1501828
25016
16
2321
1003625
23
36-46KTS26 05422
21-29KTS24 05523
18-28KTS27 03324
Investigation of TC Charlotte Impacts in the Townsville Area
Storm Tide Support P/O D/217802
Townsville City Council SEA Document No. J0813-PR001B
Systems Engineering Australia Pty Ltd Date Printed 05/03/09 Page 3
Figure 3 BoM recorded regional wind speeds
(Top: Evidence of monsoonal development over time; Bottom: Townsville Airport)
0
2
4
6
8
10
12
14
16
01 02 03 04 05 06 07 08 09 10 11 12 13 14 15 16 17 18
10
min
Win
d S
pe
ed
V6
00
m/s
AEST day
Townsville, Queensland
Lucinda Point, Queensland
Green Island, Queensland
Willis Island
Flinders Reef
0
90
180
270
360
0
2
4
6
8
10
12
14
16
12 / 00: 12 / 12: 13 / 00: 13 / 12: 14 / 00: 14 / 12: 15 / 00:
Win
d D
ire
ctio
n
de
g
10
min
Win
d S
pe
ed
V
60
0 m
/s
EST day / hr
Direction
Speed

Investigation of TC Charlotte Impacts in the Townsville Area
Storm Tide Support P/O D/217802
Townsville City Council SEA Document No. J0813-PR001B
Systems Engineering Australia Pty Ltd Date Printed 05/03/09 Page 4
3 Recorded Water Levels
The Townsville Harbour tide and storm surge gauge is the principal water level reference for
this event, supplemented by surveyed debris levels and photographic evidence. Figure 4
shows gauge-measured residual water levels building from the 11th
, reaching a peak around
midday on the 13th
and then subsiding by the 15th
. During this time the predicted astronomical
tides reached their highest levels in approximately 20 years, just exceeding the nominal HAT
value of 2.2 m AHD on the 11th
, with a similar value on the 12th
, reducing to 2 m AHD on the
13th
. In association with the rising storm surge influence, the combination of predicted tide
and meteorological tide on the 13th
resulted in the highest stillwater level for this event of 2.57
m AHD at 13/01/2009 10:40 EST. The highest residual was 0.70 m at 13/01/2009 02:50 EST.
Figure 4 Townsville tide gauge measured and predicted water levels.
(Data supplied courtesy Maritime Safety Queensland includes a post event adjustment of -0.078 m)
4 Photographic Records
A large number of photographs taken during the event were made available from Council
sources (principally beach inspectors) and others, a selection of which are shown in Figure 5
through Figure 7 for illustration. The water levels, where indicated, have been inferred from
Council’s TIM system or surveyed levels. The exact timing of the images is unknown but
generally is understood to be near the time of high tide on the 13th
.
In Figure 5, the Ross Creek levels are consistent with the nearby tide gauge maximum (refer
Figure 10 also). The Picnic Bay level is slightly lower but consistent with the expected slight
tidal attenuation relative to the Harbour. The Harbour levels are considerably higher and the
ponding evident may be due to poor drainage in that vicinity or perhaps some wave setup
affecting the drain tailwater. The debris line at the car park is amongst the highest levels
found in the region, indicating added wave setup and runup at the exposed rubble-mound
revetment.
-2.0
-1.5
-1.0
-0.5
0.0
0.5
1.0
1.5
2.0
2.5
3.0
11 00:00 11 12:00 12 00:00 12 12:00 13 00:00 13 12:00 14 00:00 14 12:00 15 00:00
Wat
er
Ele
vati
on
m
AEST day hh:mm
Predicted m AHD
Measured m AHD
Residual m
HAT m AHD

Investigation of TC Charlotte Impacts in the Townsville Area
Storm Tide Support P/O D/217802
Townsville City Council SEA Document No. J0813-PR001B
Systems Engineering Australia Pty Ltd Date Printed 05/03/09 Page 5
Figure 5 Selected water levels Ross Creek, Harbour and Picnic Bay.
2.6 m
2.6 m
2.6 m
3.8 m ? 4.8 m
2.5 m
Ross Creek Ross Creek
Ross Creek Picnic Bay
Berth #1 Berth #1

Investigation of TC Charlotte Impacts in the Townsville Area
Storm Tide Support P/O D/217802
Townsville City Council SEA Document No. J0813-PR001B
Systems Engineering Australia Pty Ltd Date Printed 05/03/09 Page 6
Figure 6 Selected beach impacts along The Strand.
Rock Pool
Rock Pool
Rock Pool
Tobruk Pool
Gregory St
Stuart St
Investigation of TC Charlotte Impacts in the Townsville Area
Storm Tide Support P/O D/217802
Townsville City Council SEA Document No. J0813-PR001B
Systems Engineering Australia Pty Ltd Date Printed 05/03/09 Page 7
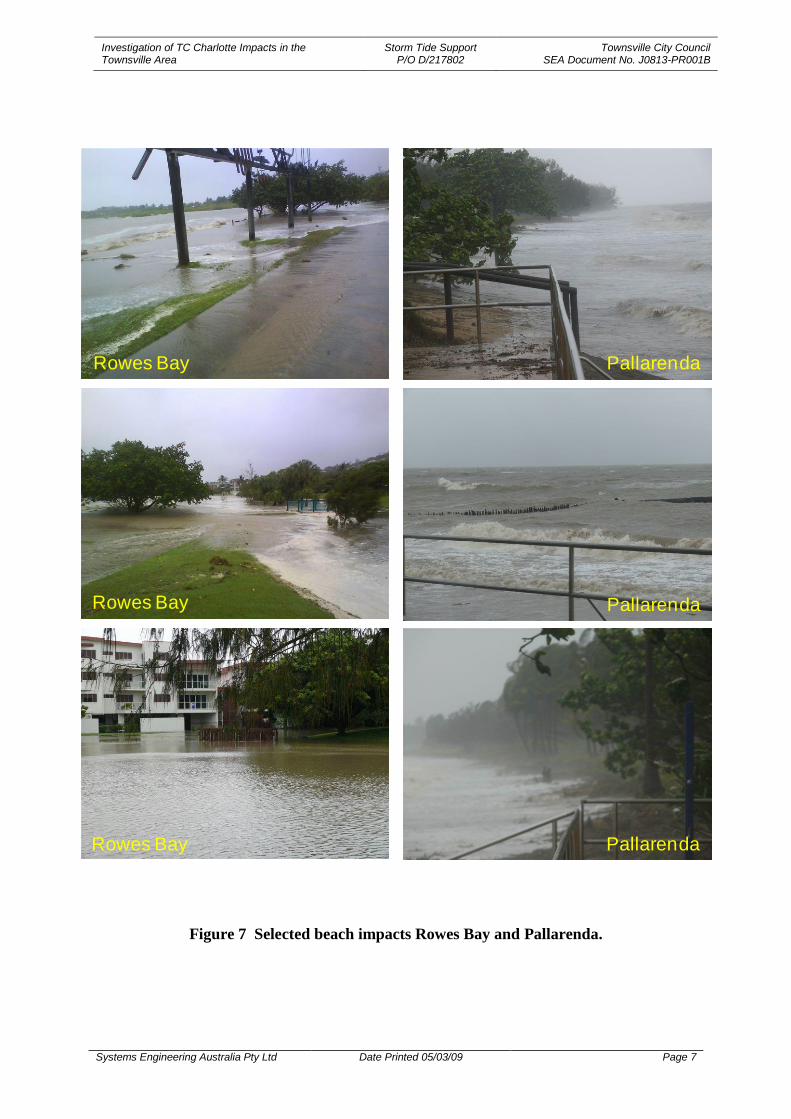
Figure 7 Selected beach impacts Rowes Bay and Pallarenda.
Rowes Bay
Rowes Bay
Rowes Bay
Pallarenda
Pallarenda
Pallarenda

Investigation of TC Charlotte Impacts in the Townsville Area
Storm Tide Support P/O D/217802
Townsville City Council SEA Document No. J0813-PR001B
Systems Engineering Australia Pty Ltd Date Printed 05/03/09 Page 8
In Figure 6, wave effects on top of the elevated levels eroded portions of the beaches, mainly
on the southern side of the revetment headlands. At the Rock Pool, wave setup and runup was
significant and dislodged some armour stone, depositing it in the enclosure. The ground levels
of the life saving club and restaurants were inundated and appear to have been the highest
stillwater levels in the area.
In Figure 7, properties near Rowes Bay / Belgian Gardens were affected and Soroptimist Park
was overtopped. The Pallarenda foreshore was also impacted (these photos apparently taken
on 14/01).
5 Estimated Wave Conditions
The EPA has a directional Waverider buoy located offshore Cape Cleveland and the real-time
data from the buoy is summarised here in Figure 8 showing significant wave heights Hs
between 3 and 3.5 m on the morning of the 13th
, with a spectral peak period of around 8 s and
zero crossing period of 5.5 to 6 s1. These values are consistent with exposed conditions
outside of Cleveland Bay.
Inside the bay there are no wave recording instruments but a photograph taken at the Stuart St
headland jetty (Figure 9) provides some insight into the nearshore conditions. Scaling from
the jetty railings suggests maximum waves possibly about 1 m to 1.5 m (Hs 0.5 to 0.75 m).
However, at least two wave directions are noticeable, one seemingly from near north and the
other more easterly than the jetty alignment of 25 degrees, which are interacting to form the
visibly higher waves.
Figure 8 Real-time EPA waverider buoy data.
1 Analysed directional wave data was unavailable from the EPA at time of writing.

Investigation of TC Charlotte Impacts in the Townsville Area
Storm Tide Support P/O D/217802
Townsville City Council SEA Document No. J0813-PR001B
Systems Engineering Australia Pty Ltd Date Printed 05/03/09 Page 9
Figure 9 Waves at Stuart St headland on 13th.
6 Site Inspection and Surveys
The site inspection confirmed widespread upper beach sand depletion (scarps plus some
exposure of geofabric), some bank erosion at revetment abutments and rock displacement,
damage to landscaping, deposition of sand in some southern corners and destruction of beach
access infrastructure.
The author met with Council surveyors on the morning of Friday 16th
January and briefed the
survey crew in locating and measuring the position of the upper beach debris line (often
marked by pumice and other flotsam), which was sometimes located amongst dune
vegetation. Any erosion scarp was also surveyed (top and bottom of bank). A series of
crossbeach profiles were also requested for more detailed future analysis. Beach slopes
adjacent the revetment walls were also surveyed. All data is held by Council.
The survey crew completed debris and scarp levelling of The Strand and Rowes Bay on the
16th
while the author inspected Saunders Beach and Bushland Beach. The survey crew
completed levelling of Pallarenda, Saunders and Bushland Beach and the beach crossections
over subsequent days.
Examples of the site inspection and survey work are given in Figure 10 through Figure 12.
Figure 10 provides a key diagram for The Strand beaches and indicates typical areas suffering
erosion (normally northern corners) or accretion (normally southern corners), consistent with
the angle of wave attack. Effects along beaches 1 through 4 were similar, with evidence of lee
sheltering from the harbour breakwater at the southern end of beach 5. Erosion occurred at the
abutment of each headland revetment as a result of concentrated wave energy and was often
greatest on the more exposed southern sides. All floating swimming enclosures appeared
undamaged, albeit clogged by seagrass flotsam and sand. The Kissing Point rock pool
suffered superficial damage and scour.
1.1m
5m AHD
approx 3m AHD

Investigation of TC Charlotte Impacts in the Townsville Area
Storm Tide Support P/O D/217802
Townsville City Council SEA Document No. J0813-PR001B
Systems Engineering Australia Pty Ltd Date Printed 05/03/09 Page 10
Figure 10 Surveyed areas of The Strand and Rowes Bay.
1
23
4
5
Rock Pool
Berth #1
Ross Creek
Gauge
accretion
erosion
1
runup damage
2
3
Exposed fabric
4
erosion
accretion
5
Investigation of TC Charlotte Impacts in the Townsville Area
Storm Tide Support P/O D/217802
Townsville City Council SEA Document No. J0813-PR001B
Systems Engineering Australia Pty Ltd Date Printed 05/03/09 Page 11
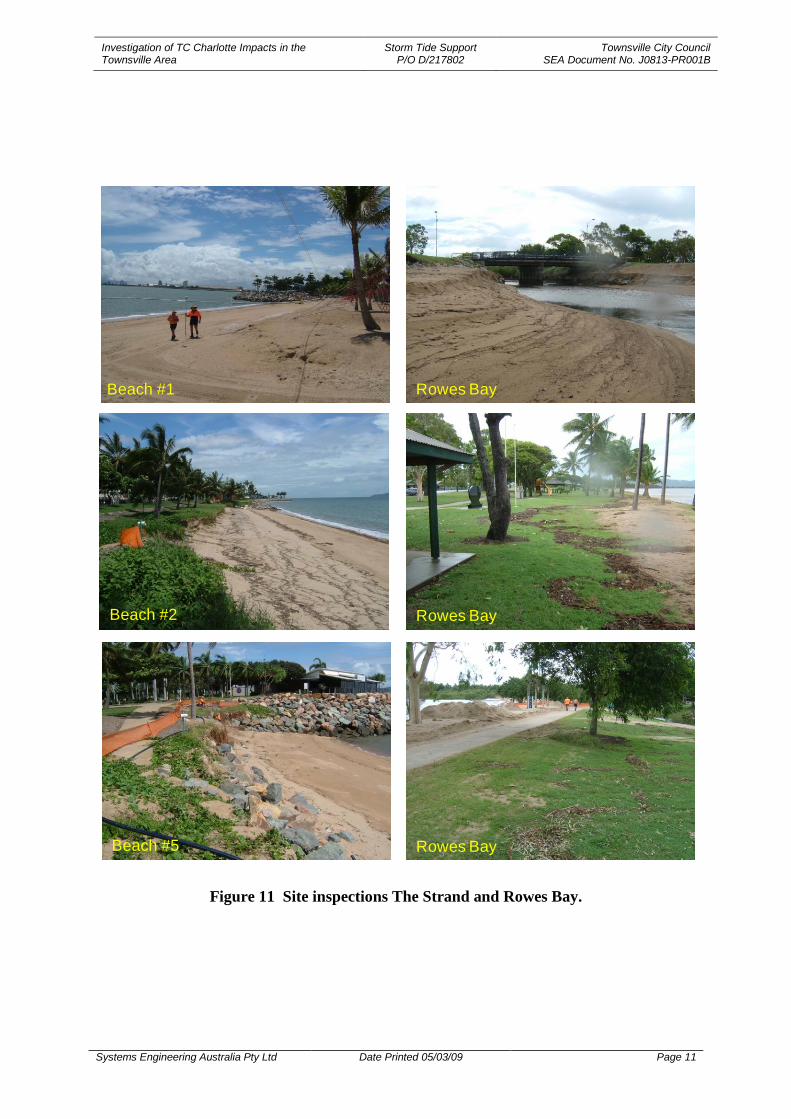
Figure 11 Site inspections The Strand and Rowes Bay.
Beach #1
Beach #2
Beach #5
Rowes Bay
Rowes Bay
Rowes Bay

Investigation of TC Charlotte Impacts in the Townsville Area
Storm Tide Support P/O D/217802
Townsville City Council SEA Document No. J0813-PR001B
Systems Engineering Australia Pty Ltd Date Printed 05/03/09 Page 12
Figure 12 Site inspections Saunders Beach and Bushland Beach.
Saunders Beach
Saunders Beach
Saunders Beach
Bushland Beach
Bushland Beach
Bushland Beach

Investigation of TC Charlotte Impacts in the Townsville Area
Storm Tide Support P/O D/217802
Townsville City Council SEA Document No. J0813-PR001B
Systems Engineering Australia Pty Ltd Date Printed 05/03/09 Page 13
Figure 11shows photographs taken on the 16th
during the site survey and inspection of The
Strand and Rowes Bay areas. Only the southern portion of Beach #5 (near Tobruk Baths)
experienced accretion, with the forebeach being loaded with about 0.3 m of sand over a
distance of 50 to 100 m. The northern end near Gregory St headland suffered bank erosion
adjacent to the revetment abutment with the loss of several established palm trees. At Rowes
Bay the southern corner near Soroptimist Park was accreted with up to 0.5 m of sand
deposited over some areas. The nearby entrance to the Lynam St drainage canal was heavily
eroded, possibly also due to streamflow, and a beachside carpark to the north was destroyed.
Beach access infrastructure between Rowes Bay and Pallarenda was mostly destroyed.
Figure 12 summarises the author’s findings at Saunders Beach and Bushland Beach. At
Saunders Beach there was evidence of dune overtopping at some locations and a beach
erosion scarp was evident that damaged beach access infrastructure. At Bushland Beach,
which is very flat, no scarp was evident but large deposits of seagrass covered the beach and
debris lines encroached onto the nearshore parklands within 50 m of some residences. The
inspection at Bushland Beach was limited to the area near the hotel/motel at the beach end of
Mount Low Parkway.
7 Analysis and Interpretation
The results of the water level and erosion survey for The Strand have been summarised in
Figure 13. The red triangles show the surveyed debris lines generated mainly by wave runup,
which are highest at the northern end of Beach #1 immediately next to the Rock Pool. Moving
south along the beaches, the debris line rises and falls slightly depending on the northern or
southern side of each headland but steadily decreases to the protected Tobruk Pool end of
Beach #5. The green dots trace the height of the toe of the beach scarp and the yellow squares
indicate the absolute height of the scarp, which was highest at the southern side of the
Gregory St headland. The solid green line shows the tide gauge peak level of 2.57 m AHD,
which correlates well with the photographic evidence in Ross Creek. The Outer Harbour site
ponding and debris levels are then shown
Figure 13 Analysis of The Strand survey data.
It is possible to infer wave setup contributions based on these levels. Firstly, the Rock Pool
stillwater debris level itself is likely a reasonable estimate of the wave setup immediately
0
1
2
3
4
5
6
0.00 0.50 1.00 1.50 2.00 2.50 3.00
Wat
er
Ele
vati
on
m
Chainage from Rock Pool km
Debris Line m AHD
Beach Cut m AHD
Beach Scarp Height m
HAT m AHD
Tide Gauge Level m AHD
Ross Creek
Berth #1 Debris
Berth #1 Ponding
Increasing wave exposure Inner Harbour
1 2 3 4 5
Wave Setup 0.7m ?
Wave Setup 1.2m ?

Investigation of TC Charlotte Impacts in the Townsville Area
Storm Tide Support P/O D/217802
Townsville City Council SEA Document No. J0813-PR001B
Systems Engineering Australia Pty Ltd Date Printed 05/03/09 Page 14
offshore. Secondly, the toe of the beach scarp might also be considered an order of magnitude
estimator of wave setup. In this case, the higher scarp toe and the Rock Pool levels are
similar, suggesting a wave setup component of the order of 0.7 m at its highest. Similarly,
taking the Berth #1 ponding level as perhaps indicative, a setup of about 1.2 m is possible at
this more exposed location.
8 The Statistical Context of the TC Charlotte Event
The recent GHD/SEA Townsville storm tide study (GHD 2007) provided a solid basis for
estimating the return period of extreme storm tide events caused by close approach tropical
cyclones. However, the weak TC Charlotte event is not fully represented in such modelling
and loosely falls into the excluded category of “long period shelf waves” as discussed in
§Section 1 of that study report. These larger scale but weaker synoptic weather patterns differ
from the severe TC scenario in that the ocean forcing is spread out over a very large area and
over an extended period of time. Although the magnitudes of the resulting storm surges are
quite small, the persistence of the small surges ensures that they will interact with several high
tide episodes and any concurrent coastal flooding events caused by stormwater runoff. In
contrast, a severe landfalling tropical cyclone is most unlikely to interact with more than one
high tide episode. In this specific case, the coexisting “king tide” sequence, where the tides
also reached their 20 year high, makes the combined event reasonably rare. Such events have
typically not been explicitly included in tropical cyclone storm tide studies because there is no
reliable database available that provides a suitable climatology and also because their impacts
are unlikely ever to be life threatening.
However, in the Queensland Climate Change Study (Hardy et al. 2004), some consideration
was given to these types of events and a specific case study was included for Townsville as an
example. An analysis was undertaken of the residual water levels from the Townsville tide
gauge over a 44 year period, specifically excluding times when tropical cyclones were known
to have been active in the area. While this would also tend to exclude events like TC
Charlotte, it remains somewhat representative of this type of phenomenon. The resulting
water levels then represented situations when “other” types of weather events had influenced
the total water level. This was then sampled in a statistical model and randomly combined
many hundreds of times with real tide records for a period of 250 years. In this way a “non-
cyclonic” tide plus surge water level return period curve was obtained, which extended from
slightly above HAT to merge with the “cyclonic” return period line at about the 200 year
return period. The “cyclonic” and “non-cyclonic” probability curves were then appropriately
merged, as shown in Figure 14 (part of §Fig 16 from Hardy et al. 2004). No wave setup
analyses are available for this situation.
In any case, the data for Charlotte can be usefully compared with the results from the GHD
study, as shown in Figure 15 for Pallarenda as an example. This shows the GHD/SEA
predicted “cyclonic only” levels and also the Hardy et al. (2004) “cyclonic only” results for
this location, which are quite similar. Overplotted on this are the various water levels for
Charlotte obtained from this investigation and the approximate intersection with “cyclonic”
return periods (open black circles). This shows that the Charlotte wave setup and storm surge
are relatively low return period events in a “cyclonic” situation, but the tide + surge and total
water levels are relatively rare even for “cyclonic” conditions, being in excess of a 200 year
average Return Period.

Investigation of TC Charlotte Impacts in the Townsville Area
Storm Tide Support P/O D/217802
Townsville City Council SEA Document No. J0813-PR001B
Systems Engineering Australia Pty Ltd Date Printed 05/03/09 Page 15
By allowing for the slight raising of the return period curves as per the Hardy et al. (2004)
analyses for “combined non-cyclonic and cyclonic”, this indicates a total water level
probability of about one in 200 years for this unusual Charlotte “pseudo-cyclonic” event.
Figure 14 Cyclonic and non-cyclonic analysis for Townsville from Hardy et al. (2004)
Figure 15 Comparison with cyclonic-only analysis for Townsville from GHD (2007)
0.0
0.5
1.0
1.5
2.0
2.5
3.0
3.5
4.0
0.0
1.0
2.0
3.0
4.0
5.0
6.0
7.0
8.0
10 100 1000
SIg
nif
icant W
ave H
eig
ht
Hs m
Wate
r Level
m
Return Period y
Total Storm Tide m AHD
Tide+Surge m AHD
Surge m MSL
Setup m
JCU MMU Tide + Surge m AHD
Charlotte Tide +Surge m AHD
Charlotte Setup m
Charlotte Total Storm Tide m AHD
Charlotte Surge m
Hs m
HAT
Pallarenda
Investigation of TC Charlotte Impacts in the Townsville Area
Storm Tide Support P/O D/217802
Townsville City Council SEA Document No. J0813-PR001B
Systems Engineering Australia Pty Ltd Date Printed 05/03/09 Page 16
9 Conclusions and Recommendations
This limited investigation of the impacts of ex-Tropical Cyclone Charlotte on the Townsville
region has highlighted the influence of the astronomical tide in modulating total storm tide
levels. Even though the storm surge from Charlotte was relatively small, its persistence over
many high tides and the coincidence of the highest tides within any 20 year period resulted in
a combined water level that is estimated to have an average return period of about one in 200
years. This places Charlotte’s impact into the “extreme event” class. The tide plus surge level
recorded at the Townsville harbour tide gauge of 2.57 m AHD just exceeded the 2.53 m AHD
level recorded during Althea in 1971, where a 2.9 m storm surge fortuitously occurred at low
tide (Harper 2001).
More detailed analyses of this event could be undertaken. In particular, the EPA directional
wave data was not available, thus limiting the interpretation of wave height, setup and runup
available from the surveyed beach levels. Also, no analysis has been done of the beach
crossections versus previous surveys and no interpretations have been made in respect of
beach slopes. Also, only The Strand survey levels have been analysed in detail, whereas
survey data is available for many other areas and may yield valuable information for
numerical model validation and the like.
It would also be instructive to make further direct comparisons with the previously
documented debris levels from TC Althea, especially the issue of wave setup along The
Strand
Investigation of TC Charlotte Impacts in the Townsville Area
Storm Tide Support P/O D/217802
Townsville City Council SEA Document No. J0813-PR001B
Systems Engineering Australia Pty Ltd Date Printed 05/03/09 Page 17
10 References
GHD (2007) Townsville-Thuringowa Storm Tide Study. Prep for Townsville and Thuringowa
City Councils in association with Systems Engineering Australia Pty Ltd. April, 210pp.
Hardy T.A., Mason L.B. and Astorquia A. 2004: Queensland climate change and community
vulnerability to tropical cyclones - ocean hazards assessment - stage 3: the frequency of
surge plus tide during tropical cyclones for selected open coast locations along the
Queensland east coast. Report prepared by James Cook University Marine Modelling
Unit, Queensland Government, June.
Harper B.A. (ed.), 2001: Queensland climate change and community vulnerability to tropical
cyclones - ocean hazards assessment - stage 1, Report prep by Systems Engineering
Australia Pty Ltd in association with James Cook University Marine Modelling Unit,
Queensland Government, March, 375pp.
11 Acknowledgements
Tidal data was supplied by Maritime Safety Queensland in a very timely way and is much
appreciated. The EPA (David Robinson and Jim Waldron) alerted the author to the later
identified need for a tide gauge offset. Special thanks to Jeff Callaghan (Retired BoM) for the
use of his synoptic summaries of ex-TC Charlotte and to Luciano Mason (Australian
Maritime College) for discussions regarding his non-cyclonic analyses from the Queensland
Climate Change study.