Embed Size (px)
Citation preview

INVESTIGATION OF OUT-OF-PLANE PROPERTIES
OF INTERLOCKING COMPRESSED
EARTH BLOCK WALLS
A Thesis
presented to
the Faculty of California Polytechnic State University,
San Luis Obispo
In Partial Fulfillment
of the Requirements for the Degree
Master of Science in Architecture with a Specialization in Architectural Engineering
by
Nicholas Anthony Herskedal
December 2012

ii
© 2012
Nicholas Anthony Herskedal
ALL RIGHTS RESERVED

iii
COMMITTEE MEMBERSHIP
TITLE: Investigation of Out-of-Plane Properties of Interlocking
Compressed Earth Block Walls
AUTHOR: Nicholas Anthony Herskedal
DATE SUBMITTED: December, 2012
COMMITTEE CHAIR: Peter Laursen Ph.D., P.E.
COMMITTEE MEMBER: Daniel Jansen Ph.D., P.E.
COMMITTEE MEMBER: Bing Qu Ph.D.

iv
ABSTRACT
Out-Of-Plane Properties Of Interlocking Compressed Earth Block Walls
Nicholas Anthony Herskedal
Interlocking compressed earth blocks (ICEBs) are cement stabilized soil blocks
that allow for dry stacked construction. The incomplete understanding of the inelastic
performance of ICEB building systems limits widespread acceptance of this structural
system in earthquake prone areas. This thesis presents results from an experimental
program designed to explore the behavior of ICEB walls, built according to current
design practice in Indonesia and Thailand, and subjected to out-of-plane loading. A total
of five reinforced and grouted ICEB walls were constructed and tested.
Results from experimentation show the current masonry design code, ACI 530,
adequately predicts the yield strength of these walls. However, ACI 530 grossly over-
predicts the ICEB wall stiffness. All tests showed flexural behavior and failure, except
for one wall. A brittle failure was observed in one wall before reaching the predicted
flexural strength, prompting a suggested maximum shear tie spacing. The testing results
provide useful data for developing analytical models that predicts the seismic behavior of
ICEB walls under out-of-plane loading.
A moment-curvature relationship was developed that accurately predicts the
behavior of these walls in the elastic range as well as the inelastic range. By comparing
the data provided by two walls of similar sizes, one including a pilaster and one without a
pilaster, insight into stiffener elements was gained. Analysis of these two walls provides
a limit on the length and height of ICEB walls without stiffener elements to prevent
significant structural damage during a seismic event. In all, conclusions based on
experimental data from ICEB out-of-plane loading tests are aimed to provide suggestions
for ICEB construction in areas of high-seismicity.
Keywords: Out-of-Plane, Interlocking Masonry, Compressed Earth Block, Dry-Stack

v
ACKNOWLEDGMENTS
This thesis would not have been possible without the technical help, support, and
manual labor of many individuals. With all of your time, this project was a complete
success.
My committee chair, Peter Laursen made this project move with ease. Thank you
for always being upbeat and ready to go to work. Your enthusiasm was a big influence in
my work. Thank you to all my advisors, Peter Laursen, Bing Qu, and Daniel Jansen. All
of your technical insight into experimentation, data gathering, and analytical processes
made this project successful, as well as useful.
Thank you to my loving parents, Erik and Barbara for your ongoing support in my
education and for always being interested in my work.
To all the family and friends who dedicated their weekends to helping make
hundreds of blocks, your efforts are greatly appreciated. To those who helped in
building, documenting, and testing each wall, it is my hope that you enjoyed watching
your work come together and get torn down as much as I did.
Thank you all.

vi
TABLE OF CONTENTS
LIST OF FIGURES ........................................................................................................... ix
LIST OF TABLES ............................................................................................................. xi
LIST OF NOMENCLATURE .......................................................................................... xii
1.0 Introduction ................................................................................................................... 1
1.1 Background .............................................................................................................. 2
1.2 Objective .................................................................................................................. 4
1.3 Organization ............................................................................................................. 5
2.0 Literature Review.......................................................................................................... 7
2.1 Compressed Earth Blocks: Rhino Blocks ................................................................ 7
2.2 Masonry Wall Design ............................................................................................. 12
2.3 Out-of-Plane Wall Testing ..................................................................................... 14
3.0 Materials ..................................................................................................................... 22
3.1 Interlocking Compressed Earth Blocks .................................................................. 22
3.1.1 Soil ............................................................................................................... 22
3.1.2 Sand .............................................................................................................. 23
3.1.3 Cement ......................................................................................................... 23
3.1.4 Material Preparation and Mixing ................................................................. 23
3.1.5 Pressing Procedure ....................................................................................... 26
3.1.6 Curing ........................................................................................................... 28
3.2 Grout ....................................................................................................................... 29
3.3 Soil-Cement Plaster ................................................................................................ 29
3.3 Material Testing and Results .................................................................................. 30
3.3.1 ICEB Compressive Strength ........................................................................ 31
3.3.2 Grout Compressive Strength ........................................................................ 32
3.3.3 ICEB Masonry Prism Compressive Strength ............................................... 33
3.3.4 Soil-Cement Compressive Strength ............................................................. 36
3.3.5 Steel Reinforcement Tensile Testing ........................................................... 37
4.0 Test Setup and Procedure ............................................................................................ 38
4.1 ICEB Construction Methods .................................................................................. 38

vii
4.1.1 Laying ICEBs ............................................................................................... 39
4.1.2 Grouting ....................................................................................................... 40
4.2 Cantilever Walls ..................................................................................................... 40
4.2.1 Wall Layout and Construction ..................................................................... 41
4.2.2 Loading Method and Instrumentation .......................................................... 43
4.2.3 Data Reduction Measures ............................................................................. 46
4.3 Full Scale Walls ...................................................................................................... 46
4.3.1 Wall Layout and Construction ..................................................................... 47
4.3.2 Loading Method and Instrumentation .......................................................... 50
4.3.3 Data Reduction Measures ............................................................................. 52
4.4 Wall Behavior Predictions ...................................................................................... 53
5.0 Experimental Results .................................................................................................. 58
5.1 Cantilever Walls ..................................................................................................... 58
5.1.1 Wall 1: Basic Wall ....................................................................................... 59
5.1.2 Wall 2: Lap-Splice Wall ............................................................................... 64
5.1.3 Wall 3: Plastered Wall .................................................................................. 66
5.1.4 Comparison .................................................................................................. 71
5.2 Full Scale Walls ...................................................................................................... 75
5.2.1 Wall 4: Full Scale Prismatic Wall ................................................................ 75
5.2.2 Wall 5: Full Scale Pilaster Wall ................................................................... 80
5.2.3 Comparison .................................................................................................. 86
6.0 Moment-Curvature and pilaster Analysis ................................................................... 87
6.1 Moment Curvature Analysis .................................................................................. 88
6.1.1 Cantilever Wall Moment-Curvature Results ................................................ 89
6.1.2 Moment-Curvature Relationship Computation ............................................ 89
6.1.3 Moment-Curvature Spreadsheet Check ....................................................... 91
6.1.4 Calculated ICEB Moment-Curvature Relationship ...................................... 93
6.1.5 Force-Displacement from Moment-Curvature ............................................. 97
6.2 Spacing Determination of Stiffening Elements .................................................... 101
6.2.1 Out-of-Plane Forces ................................................................................... 101
6.2.2 Pilaster Performance .................................................................................. 102
viii
6.2.3 Deflection Based Calculation for Pilaster Spacing .................................... 106
7.0 Conclusion and Recommendations ........................................................................... 112
7.1 Experimental Results ............................................................................................ 114
7.2 Analytical Results ................................................................................................. 116
7.3 Future Research Recommendations ..................................................................... 117
References ....................................................................................................................... 118
Appendix A ..................................................................................................................... 120
Appendix B ..................................................................................................................... 123
Appendix C ..................................................................................................................... 128

ix
LIST OF FIGURES
Figure A - ICEB block and variations ................................................................................ 8
Figure B - Amrhein and Lee Test Set-up .......................................................................... 15
Figure C - Moment Diagrams of Walls with Various End Restraints .............................. 16
Figure D - Compressed Stabilized Earth Block ................................................................ 19
Figure E - Jayasinghe and Mallawaarachchi Testing Directions ...................................... 19
Figure F – Hydraform Blocks ........................................................................................... 20
Figure G – Example of Cracking Pattern and Loading ..................................................... 21
Figure H - Soeng Thai SP3 Pulverizer .............................................................................. 23
Figure I - Drop Test .......................................................................................................... 25
Figure J - Soeng BP6 with Finished ICEB ....................................................................... 27
Figure K - Penetrometer Test ............................................................................................ 28
Figure L - Insufficient Plaster Mixture Results ................................................................ 30
Figure M - ICEB Compressive Failure ............................................................................. 32
Figure N - Grout Cylinder Compressive Test ................................................................... 33
Figure O - ICEB Prism Compressive Test ........................................................................ 34
Figure P - ICEB Compressive Stress vs. Strain ................................................................ 35
Figure Q - Cantilever Wall Layout ................................................................................... 41
Figure R - Cantilever Wall Loading and Instrumentation ................................................ 44
Figure S - Horizontal LVDTs for Block Rotations (Only One Side Shown) ................... 45
Figure T - Pinned Connections ......................................................................................... 48
Figure U - Full Scale Wall Plan and Elevations Views .................................................... 49
Figure V - Typical Pilaster Tie Installation ...................................................................... 50
Figure W - Full Scale Wall Loading and Instrumentation ................................................ 51
Figure X - Wall 1 Force Displacement Response and Strain vs. Displacement ............... 60
Figure Y - Typical Horizontal Cracking ........................................................................... 63
Figure Z - Wall 2 Force Displacement Response ............................................................. 65
Figure AA - Vertical Crack in Wall 2 ............................................................................... 65
Figure BB – Wall 2 Strain vs. Displacement .................................................................... 66
Figure CC – Wall 3 Force Displacement Response .......................................................... 69
Figure DD - Wall 3 Cracking Pattern ............................................................................... 70
Figure EE - Enveloping Comparison of Hysteretic Behavior of Cantilever Walls .......... 71
Figure FF – Experimental Moment-Curvature Envelope Curves ..................................... 73
Figure GG - Wall 4 Force-Displacement Response ......................................................... 76
Figure HH - Wall 4 Rebar Strain vs. Displacement.......................................................... 77
Figure II - Vertical Crack in Wall 4 .................................................................................. 79
Figure JJ - Wall 4 Displaced Shape .................................................................................. 79
Figure KK - Wall 5 Force Displacement Response .......................................................... 82

x
Figure LL - Wall 5 Cracks and Uplift ............................................................................... 83
Figure MM - Wall 5 Rebar Strain vs. Displacement ........................................................ 84
Figure NN - Wall 5 Displaced Shape ............................................................................... 85
Figure OO - Enveloping Comparison of Hysteretic Behavior of Full Scale Walls .......... 86
Figure PP – Strain Profile for Moment Curvature Analysis ............................................. 90
Figure QQ - Assumed Stress-Strain Plot for Steel Reinforcement ................................... 94
Figure RR - Moment-Curvature Comparison ................................................................... 95
Figure SS - Cracking Section Comparison ....................................................................... 96
Figure TT - Force-Displacement from Moment-Curvature .............................................. 98
Figure UU - Experimental vs. Moment-Curvature Force Displacement Response ........ 100
Figure VV - Full Scale Walls with Drift Limit ............................................................... 101
Figure WW - Full Scale Walls with Drift Limit ............................................................. 104
Figure XX – Tributary Area of Typical Pilaster ............................................................. 105
Figure YY - Pilaster Tributary Area and Loading .......................................................... 105
Figure ZZ - Allowable Accelerations for Pilasters ......................................................... 106
Figure AAA - Deflected Shape Comparison of Wall Panel and Horizontal Strip .......... 108
Figure BBB - Maximum Pilaster Spacing from Displacement Based Analysis ............. 111

xi
LIST OF TABLES
Table 1 - Soil Plasticity ..................................................................................................... 22
Table 2 - ICEB Mixture Material Weights ....................................................................... 24
Table 3 - ICEB Types and Weights per Block ................................................................. 26
Table 4 - Material Compressive Strengths........................................................................ 31
Table 5 - ICEB Wall Specifications .................................................................................. 38
Table 6 - ACI 530 Predictions .......................................................................................... 57
Table 7 - Wall 1 & 2 Loading Sequence........................................................................... 59
Table 8 – Cantilever Walls ACI 530 vs. Experimental Results ........................................ 62
Table 9 - Wall 3 Loading Sequence .................................................................................. 67
Table 10 - Wall 4 Loading Sequence ................................................................................ 75
Table 11 – Wall 4 ACI 530 vs. Experimental Results at Mid-Height .............................. 77
Table 12 - Wall 5 Loading Sequence ................................................................................ 81
Table 13 – Wall 5 ACI 530 vs. Experimental Results at Mid-Height .............................. 82
Table 14 – Moment-Curvature Spreadsheet Check .......................................................... 92
Table 15 - Gap Size to Added Curvature .......................................................................... 97
Table 16 – Finite Element Model Displacement Comparison ........................................ 109

xii
LIST OF NOMENCLATURE
As effective cross-sectional area of reinforcement, mm2.
Av cross-sectional area of shear reinforcement, mm2.
b width of section, mm.
c distance from the fiber of maximum compressive strain to the neutral axis, mm.
d distance from extreme compression fiber to center of tension reinforcement, mm.
db nominal diameter of reinforcement, mm.
dv actual depth of a member in direction of shear considered, mm.
Em modulus of elasticity of masonry in compression, MPa.
Es modulus of elasticity of steel, MPa.
Fp out-of-plane design force perpendicular to wall face, N/mm.
f’m specified compressive strength of masonry, MPa.
fr modulus of rupture, MPa.
fy specified yield strength of steel for reinforcement, MPa.
h effective height of wall or pilaster, mm.
I importance factor for lateral design (equal to 1.0 for this thesis).
Icr moment of inertia of cracked cross-sectional area of member, mm4.
Ig moment of inertia of gross cross-sectional area of member, mm4.
K dimension used to calculate reinforcement development, mm.
Mcr nominal cracking moment strength, N-m.
Mn nominal moment strength, N-m.
n modular ratio, Es/Em, dimensionless.
S spacing of wall stiffener elements, m.
SDS design spectral response acceleration parameter at short periods, m/s2.
Sn section modulus of the net cross-sectional area of member, mm3.
xiii
s spacing of reinforcement, mm.
Vs nominal shear strength provided by shear reinforcement, N.
W weight of structural wall, N/mm.
γ reinforcement size factor.
Δcr displacement at cracking moment, mm.
Δn displacement at nominal moment, mm.
εc masonry compressive strain, dimensionless.
εcu ultimate masonry compressive strain, dimensionless.
εo masonry compressive strain at the specified strength of masonry, dimensionless.
ρ density of material, N/m3

1.0 Introduction 1
Out-of-Plane Properties of Interlocking Compressed Earth Block Walls
1.0 INTRODUCTION
Interlocking compressed earth block (ICEB) masonry has the potential to provide
affordable construction around the world. Comprised of basic, inexpensive materials,
such as soil, the blocks can provide homes and other facilities at low cost. By creating
interlocking joints between layers of blocks, ICEBs allow for the blocks to be dry
stacked, without the need for mortar.
While dry stacked ICEBs are currently being used in structures, little is
understood about its behavior during an earthquake. Since there are many different forms
of ICEBs, research done for one type is not directly applicable to another. The
incomplete understanding of the inelastic performance of ICEB building systems limits
the wide spread acceptance of this structural system in earthquake prone areas. The
ICEBs used for this thesis are dry stacked and allow for both transverse and longitudinal
reinforcement. The ICEBs used for this thesis are currently being used in Indonesia and
Thailand, where earthquakes have the potential to cause significant damage.
Out-of-plane forces, created during an earthquake or by wind, can cause
significant damage in to a structure. However, no out-of-plane experimental research has
been completed on reinforced dry stacked ICEB walls. Therefore, it is the intent of this
thesis to provide insight into the out-of-plane behavior of dry stacked, reinforced ICEB
walls, constructed according to the current practices found in Indonesia and Thailand.

1.0 Introduction 2
Out-of-Plane Properties of Interlocking Compressed Earth Block Walls
1.1 Background
Soil has been used as a building material for thousands of years. Adobe, rammed
earth, and compressed earth masonry are examples of this building tradition in today’s
world. Using soil as the main material component of a building provides benefits such as
the use of local materials, high thermal mass values, and increased workability
(Maini,2010). The soil used in earth buildings is taken from the surrounding areas or the
excavation for the foundations (Maini, 2010). In cement stabilized earth construction,
cement use is commonly kept to 5-10% by weight (Walker, 1999). In contrast, concrete
and concrete masonry construction use anywhere from 10%-15% by volume of cement
(Portland Cement Association, 2012). By eliminating the need for heating kilns and
reducing the amount of cement, compressed earth blocks are energy efficient. ICEBs
require anywhere from 1/5 to 1/15 of energy to make when compared to fired bricks and
concrete masonry units (Maini, 2010). All of these facts about earth construction
contribute to a decreased cost of construction and an increased availability in developing
countries.
Dry stacked ICEB construction can lead to a faster construction time when
compared to other types of masonry. Dry stacking does not rely on skilled labor such as
masons. Instead, dry stacking can be done with little training and in a shorter amount of
time than with traditional mortared masonry (Maini, 2010). Some researchers suggest the
reduced need for skilled labor and the shorter construction time can reduce the cost of
labor by as much as 80% (Anand and Ramamurthy 2005).

1.0 Introduction 3
Out-of-Plane Properties of Interlocking Compressed Earth Block Walls
The materials and the forming method used in dry stacked ICEBs can have a very
low carbon footprint when compared to traditional masonry, timber, and concrete.
Depending on the location of the ICEB building, the importation of construction products
is greatly reduced. Since indigenous soil is the main ingredient in ICEBs, a majority of
supplies do not have to be shipped to the site (Maini, 2010). This reduction in
transportation decreases the fossil fuel use. ICEB structures also use very little to no
timber. Timber structures and the wooden forms used in concrete structures can lead to
significant deforestation. Even other types of earth structures such as rammed earth and
adobe construction require the use of forms during construction, using lots of wood
members that eventually go to waste (Wheeler, 2005). Depending on the surrounding
areas of the building, the wood products can end up being transported hundreds of miles
to reach the site. Without the need for timber or timber forms, compressed earth block
construction helps to limit deforestation around the world (Maini, 2010).
In developed countries, research, design, and construction improvements of
masonry buildings have lead to better performance and safety of masonry buildings
during an earthquake. However, little structural testing of dry stacked ICEB masonry has
been done, leaving the masonry form vulnerable to significant damage or failure during a
seismic event. California Polytechnic State University in San Luis Obispo (Cal Poly) has
been involved in providing information for the use of ICEB masonry since 2008. The
Engineers Without Borders chapter of Cal Poly has been working with the Center for
Vocational Building Technology (CVBT) in Thailand on improving construction with

1.0 Introduction 4
Out-of-Plane Properties of Interlocking Compressed Earth Block Walls
ICEB technology. Students from the mechanical engineering and civil engineering
departments have worked with CVBT to improve the ICEB structural building design.
Mechanical engineering students have worked with the Soeng Thai BP6 block press, the
Soeng Thai SP3 soil pulverizer, and a pocket penetrometer. All of these items are critical
to the creation of ICEB’s and in making the blocks uniform in strength. Civil
engineering students have begun to provide information on the basic properties of ICEB’s
as well as the in-plane shear wall capacities. It is the combined goal of the student efforts
at Cal Poly to provide the research and evaluation of ICEB’s as a structural system and
offer insight into a better design manual for all future ICEB buildings.
1.2 Objective
The objective of this thesis project is to test ICEB walls in order to investigate the
out-of-plane properties, performance, and failure mechanisms, as well as to use the
recorded data to accurately predict the performance of each wall.
A total of five walls were tested in under out-of-plane loading. Three, one meter
tall cantilever walls were built first. The first cantilever wall was built as a reference to
predict the behavior of the full scale walls, as well as provide the basis for comparison of
the other two cantilever walls. The second cantilever wall was designed to investigate
the influence of a steel reinforcement lap-splice. The final cantilever wall experiment
provided data used to determine the change in performance due to a plaster coating. The
two full scale walls were constructed to investigate the behavior of ICEB walls loaded
out-of-plane. By testing one full scale wall without a pilaster as well as one with a

1.0 Introduction 5
Out-of-Plane Properties of Interlocking Compressed Earth Block Walls
pilaster, a direct comparison in performance was also formed using the data from the two
full scale wall experiments. The hysteretic behavior of each wall was recorded and
compared to the ACI 530 code predicted values. The results of this investigation will be
used to create a suitable structural design for ICEB structures.
The experimental data from the experimental program also allowed for further
analysis of ICEB wall behavior. The goal of the analysis portion of this thesis is to
determine the following items:
An accurate out-of-plane behavior analysis method for ICEB walls
Maximum wall heights for individual seismic acceleration values
Maximum pilaster spacing using strength based calculations
Maximum pilaster spacing using displacement based calculations.
Furthermore, necessary recommendations for construction methods using ICEBs will be
made as seen fit through analysis of the experimental results.
1.3 Organization
Chapter 2 offers a literature review of topics relating to Compressed Earth Block
construction, testing, and results. Information regarding other types of masonry walls
tested for out-of-plane performance and the masonry code is also discussed.
Chapter 3 describes the manufacturing process for ICEBs and the individual
components for ICEB walls. Experimental material strength results are presented for
each component.

1.0 Introduction 6
Out-of-Plane Properties of Interlocking Compressed Earth Block Walls
Chapter 4 explains the wall construction and testing setup for each type of wall.
The layout and purpose of instrumentation for each wall is discussed in relation to the
overall goal of this thesis.
Chapter 5 summarizes the results from the testing. The observed behaviors from
all experiments are discussed and compared against code predictions.
Chapter 6 details the process and findings for creating an advanced method for
analyzing and designing ICEB walls for out-of-plane loading. The experimental results
are also used to develop design requirements for pilaster shear strength and spacing.
Chapter 7 provides a conclusion of all the findings from experimentation and
advancement of the analytical process for designing ICEB walls.

2.0 Literature Review 7
Out-of-Plane Properties of Interlocking Compressed Earth Block Walls
2.0 LITERATURE REVIEW
This section discusses relevant literature on the topics of compressed earth blocks,
current masonry design guides, and experimentation on out-of-plane properties of walls.
2.1 Compressed Earth Blocks: Rhino Blocks
The Center for Vocational Building Technologies (CVBT) developed a manual of
construction for ICEB buildings (Wheeler, 2005). The manual provides insight into how
the construction of ICEB buildings is currently being designed. A rhino type block is
used by the CVBT due to its ability to interlock and allow for steel reinforcement when
necessary. The blocks can be made into nine different shapes, including channel blocks
and half blocks. The rhino block dimensions in centimeters, as well as a diagram of each
block type can be found in Figure A. Foundations are prescribed for all seismic areas as
concrete footings with vertical reinforcement extending from the footing. Rebar splices
are formed by one of three methods: a 15 cm weld, bend and hook, or a set of thin wire
ties that are tightened around two overlapping bars. All vertical rebar is placed inside the
large reinforcement holes in the rhino blocks, and grout is poured in every hole. Wheeler
recommends no more than 10 layers of blocks be stacked before a grout pour takes place.
In designing ICEB buildings, it is recommended by Wheeler that no wall span be
more than 4.5 meters long without a perpendicular wall, pilaster, or other stiffening
member. This recommendation is based on knowledge that long, slender walls are
vulnerable to collapse. It is one of the goals this thesis to investigate the span limit
recommendation of the CVBT’s manual.

2.0 Literature Review 8
Out-of-Plane Properties of Interlocking Compressed Earth Block Walls
Figure A - ICEB block and variations
Source: (Wheeler, 2005)

2.0 Literature Review 9
Out-of-Plane Properties of Interlocking Compressed Earth Block Walls
Bales et al. (2009) experimentally determined the structural properties of
compressed earth blocks. The research aimed to create a consistent soil-to-water-to-
cement mixing ratio to provide sufficient strength and consistent blocks. Blocks were
made with various soil types and were allowed to cure under multiple conditions. Curing
methods included submersion in water, under a tarp, or sun dried. Researchers viewed
the effects to compressive strength, durability, and compactness.
The authors tested the block compressive strength, as well as the grouted and un-
grouted prism strength. These prisms were confined in a wooden form to simulate the
effect of confinement the blocks would have in an actual building. The average
compressive strength of the fully grouted prisms was found to be 2.58 MPa. The prism
compressive strength was found to be 0.43 for grouted prisms and 0.37 for un-grouted
prisms times the single block compressive strength to prism compressive strength. The
prisms failed by splitting down the grout plane. This failure was attributed to the
difference in compressive strength from compressed earth blocks to the grout being used
to fill them. Researchers provided detailed instructions for the forming of consistent
ICEB’s, which were to be used in this thesis.
Proto et al. (2010) wrote a construction manual that describes the manufacturing
process for ICEB’s using the Rhino blocks made from the Soeng Thai BP6. The Soeng
Thai BP6 was used by Bales et al. The goal of the manual was to provide a detailed
procedure and guidelines for making rhino blocks. First, the soil selection process was
2.0 Literature Review 10
Out-of-Plane Properties of Interlocking Compressed Earth Block Walls
established for consistent blocks. Next a block making procedure was given, involving
six steps:
Soil Preparation
Measuring
Mixing
Pressing
Curing
Testing
The most critical section of Proto et al.’s manual is the description of the water to solids
ratio for block making. It was found that the optimal moisture content for ICEB making
is 10-14%. The easiest way to determine the moisture content during the block forming
process was with a simple drop test. The soil mixture is ready to be pressed once a ball
of mixture is dropped one meter and breaks into about 4 – 6 pieces. This drop test is
shown in chapter three of this thesis under Figure I. The information presented in the
manual will be used in the mixing and pressing of the ICEB’s for this thesis.
Bland (2011) constructed walls of dry-stacking ICEB’s in order to determine the in-plane
properties of shear dominated shear walls. The same soil, press, and block properties
determined by Bales et al. were used. Three, 1.8 meter by 1.8 meter walls were
constructed and subjected to cyclic lateral loading. One wall was fully grouted without
horizontal reinforcement, one was partially grouted without horizontal reinforcement, and
one was fully grouted with horizontal reinforcement. The goal was to determine the
appropriateness of using current concrete masonry design standards for shear walls
constructed with ICEBs. In comparing the in-plane strength of the fully grouted wall

2.0 Literature Review 11
Out-of-Plane Properties of Interlocking Compressed Earth Block Walls
with the partially grouted wall, it was found that the partially grouted wall sustained
about 50% of the strength of the fully grouted wall. The study also determined that the
ACI 530-08 code predicted a shear strength that by far exceeded the experimentally
determined shear strength. The third wall was designed to explore the shear strength
contribution due to horizontal reinforcement.
As a companion thesis of Bland (2011), research was simultaneously being
conducted to determine the behavior of flexural dominated ICEB shear walls under in-
plane loads (Stirling, 2011). Stirling tested three walls: a slender wall, 1800 mm tall and
900mm wide, a 1800 mm by 1800 mm square wall with a 750mm wide flange at one end,
and another 1800 mm by 1800 mm square wall with a 900mm square opening in the
center. Stirling found that these three walls failed in flexure with tensile yielding of the
vertical rebar. This is unlike the brittle failures found by Bland (2011). All walls showed
significant differences in ductility due to varying dimensions and reinforcement.
Further analysis was performed of flexural dominated walls in order to more
accurately predict the behavior of these types of walls during an earthquake. A non-
linear lumped plasticity model and a plastic analysis model were made. Stirling
determined that the current masonry code (ACI 530-08) was able to predict the flexural
strength of the ICEB walls within an acceptable margin. The lumped plasticity model
was found to predict the strength accurately but did not provide a stiffness that was
comparable to the experimental results.

2.0 Literature Review 12
Out-of-Plane Properties of Interlocking Compressed Earth Block Walls
2.2 Masonry Wall Design
The design of masonry structures in the United States of America follows the
Building Code Requirements and Specifications for Masonry Structures (TMS 402/ACI
530/ASCE 5, 2008), with lateral force design procedures from Minimum Design Loads
for Buildings and Other Structures by the American Society of Civil Engineers (ASCE-
7). These building codes prescribe loading, analysis, design, and detailing for masonry
construction.
Results of multiple tests on simply supported walls were used to calculate strength
and deflection formulas for out-of-plane masonry walls. The code allows the use of the
principles of mechanics to determine the actual moments and deflections under different
support conditions than those found in simply supported walls. ACI 530-08 presents the
following assumptions for the design of reinforced masonry:
1. There is strain compatibility between the reinforcement, grout, and
masonry so that loads are resisted in a composite manner.
2. Strain in reinforcement and masonry shall be assumed to be directly
proportional to the distance from the neutral axis.
3. The tensile strength of masonry shall be neglected in calculating flexural
strength but shall be considered in calculating deflection.
2.0 Literature Review 13
Out-of-Plane Properties of Interlocking Compressed Earth Block Walls
4. The masonry stress shall be taken constant as 0.8 f’m over a length of 0.8
times the length from the extreme most compression fibers to the neutral
axis at the strength limit state.
The ACI 530-08 code predictions will be a reference for comparison to the
experimental behavior of the ICEB walls.
Brandow, Ekwueme, and Hart (2006) provide a detailed design guide for
reinforced masonry structures. The guide outlines the process and equations needed for
proper design of concrete masonry walls under out-of-plane loading, citing the ACI 530-
08 code as the basis for design. Using the equations included in the design guide
example, estimations of wall strength, stiffness, and cracking behavior can be made. The
process for estimating deflections under a given loading includes P-delta effects from
both self weight and additional axial loads. The out-of-plane lateral loads for pilaster
design are shown to include the effect of the wall area tributary to the pilaster. This
design assumption will be critical in developing the maximum spacing of stiffener
elements in long spanning, slender ICEB walls.
The design guide for masonry structures also provides detailed guide to the use of
moment-curvature analysis for flexurally dominated masonry members. By defining a
cross-section and the material properties, a procedure can be followed to determine the
curvature and moment at each stage of the beam’s response to loads. By defining a
stress-strain relationship for the reinforcement and the masonry and by applying the law
of static equilibrium, a moment and corresponding curvature can be calculated. The
2.0 Literature Review 14
Out-of-Plane Properties of Interlocking Compressed Earth Block Walls
member’s behavior is defined by three limit states; cracking, yield, and ultimate. The
ultimate limit state is defined to be equal to the moment when the extreme compression
fibers of the member fail due to crushing. Moment-curvature analysis and numerous
design examples will be used in this thesis for analysis of the experiments.
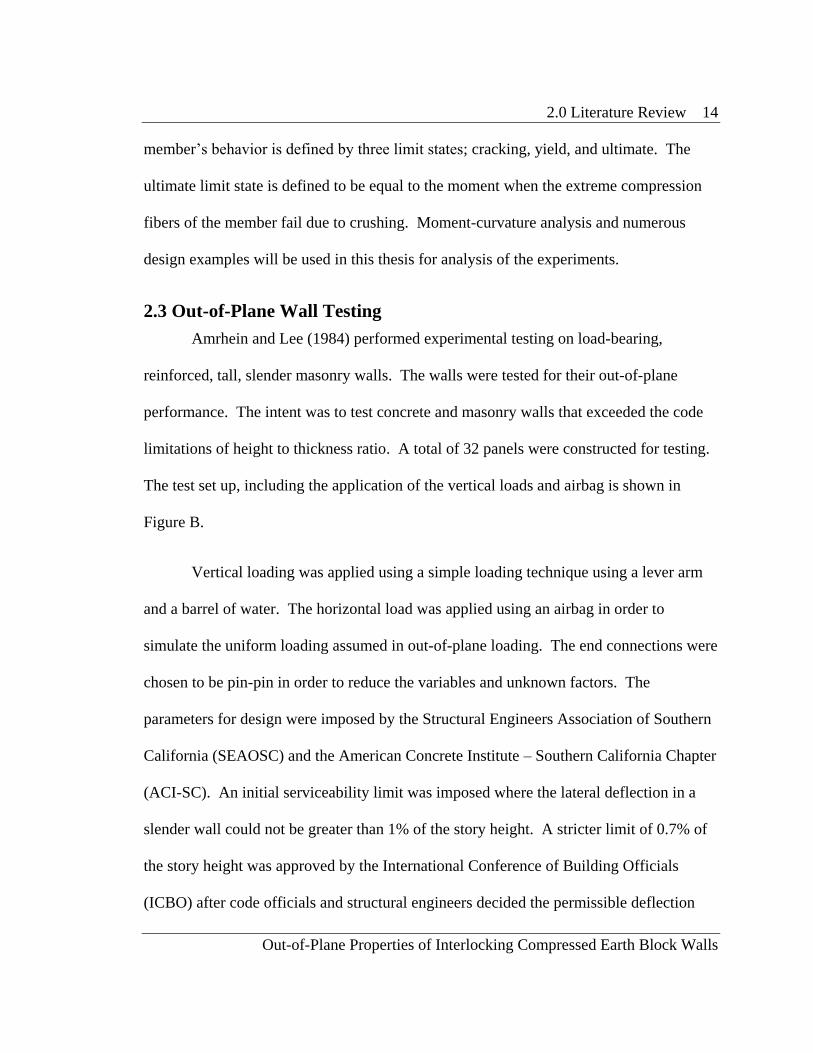
2.3 Out-of-Plane Wall Testing
Amrhein and Lee (1984) performed experimental testing on load-bearing,
reinforced, tall, slender masonry walls. The walls were tested for their out-of-plane
performance. The intent was to test concrete and masonry walls that exceeded the code
limitations of height to thickness ratio. A total of 32 panels were constructed for testing.
The test set up, including the application of the vertical loads and airbag is shown in
Figure B.
Vertical loading was applied using a simple loading technique using a lever arm
and a barrel of water. The horizontal load was applied using an airbag in order to
simulate the uniform loading assumed in out-of-plane loading. The end connections were
chosen to be pin-pin in order to reduce the variables and unknown factors. The
parameters for design were imposed by the Structural Engineers Association of Southern
California (SEAOSC) and the American Concrete Institute – Southern California Chapter
(ACI-SC). An initial serviceability limit was imposed where the lateral deflection in a
slender wall could not be greater than 1% of the story height. A stricter limit of 0.7% of
the story height was approved by the International Conference of Building Officials
(ICBO) after code officials and structural engineers decided the permissible deflection

2.0 Literature Review 15
Out-of-Plane Properties of Interlocking Compressed Earth Block Walls
should be reduced. Examples of design for slender walls under these limits are plentiful
in the report. These limits and design examples will be applied to the ICEB walls
considered for this research program.
Figure B - Amrhein and Lee Test Set-up
Source: (Amrhein and Lee, 1984)
Ismail et. al. (2011) performed out-of-plane experimentation on an unreinforced
masonry (URM) wall to study the retrofit technique of introducing post-tensioned
tendons to the core of the URM walls. A wall was built using standard clay brick and
mortar construction, 11 feet tall and 3 feet 6 inches wide. A single post-tensioning
tendon was inserted down the middle of the wall. Special consideration was taken in
determining the effective height to be used in this out-of-plane experimental research.
2.0 Literature Review 16
Out-of-Plane Properties of Interlocking Compressed Earth Block Walls
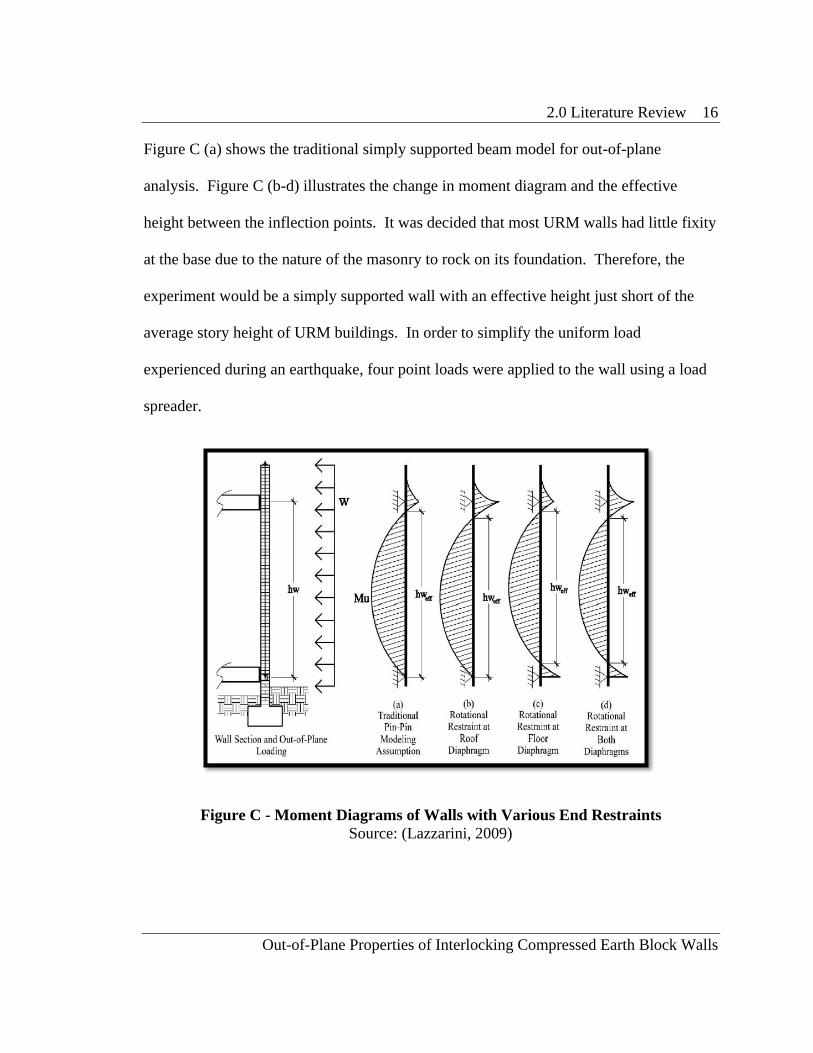
Figure C (a) shows the traditional simply supported beam model for out-of-plane
analysis. Figure C (b-d) illustrates the change in moment diagram and the effective
height between the inflection points. It was decided that most URM walls had little fixity
at the base due to the nature of the masonry to rock on its foundation. Therefore, the
experiment would be a simply supported wall with an effective height just short of the
average story height of URM buildings. In order to simplify the uniform load
experienced during an earthquake, four point loads were applied to the wall using a load
spreader.
Figure C - Moment Diagrams of Walls with Various End Restraints
Source: (Lazzarini, 2009)

2.0 Literature Review 17
Out-of-Plane Properties of Interlocking Compressed Earth Block Walls
The testing was completed in the Architectural Engineering facilities at California
Polytechnic University at San Luis Obispo, using a test setup that will be adopted for use
in this thesis.
The out-of-plane behavior of unreinforced dry-stack masonry was studied by
Vaculik, Griffith, Hogarth, and Todd (2004). A series of experiments were set up to
study the failure modes of various walls when subjected to out-of-plane loading, as well
as to quantify the behavior using airbag tests. All walls were simply supported at top and
bottom, and had small wall returns on each side, creating the existence of double
bending. It was concluded that the strength of these walls was directly proportional to the
amount of axial load applied to the wall. The cracking occurred in a fairly predictable
manner for double bending. The most regular wall was able to withstand loading
equivalent to an acceleration of 0.42 g’s. The cracking pattern will be used in this thesis
to demonstrate the cracking patterns during two-way bending. The load-displacement
behavior was studied in walls with three different aspect ratios. Each aspect ratio was
tested under three different levels of axial compression. These walls showed that dry-
stacked masonry walls all exhibited ductile behavior, where the wall gradually lost
strength once the maximum load was applied without a sudden drop in stiffness. The
ultimate strength and the amount of axial compression were found to be directly
proportional, where the strength would increase with more load.

2.0 Literature Review 18
Out-of-Plane Properties of Interlocking Compressed Earth Block Walls
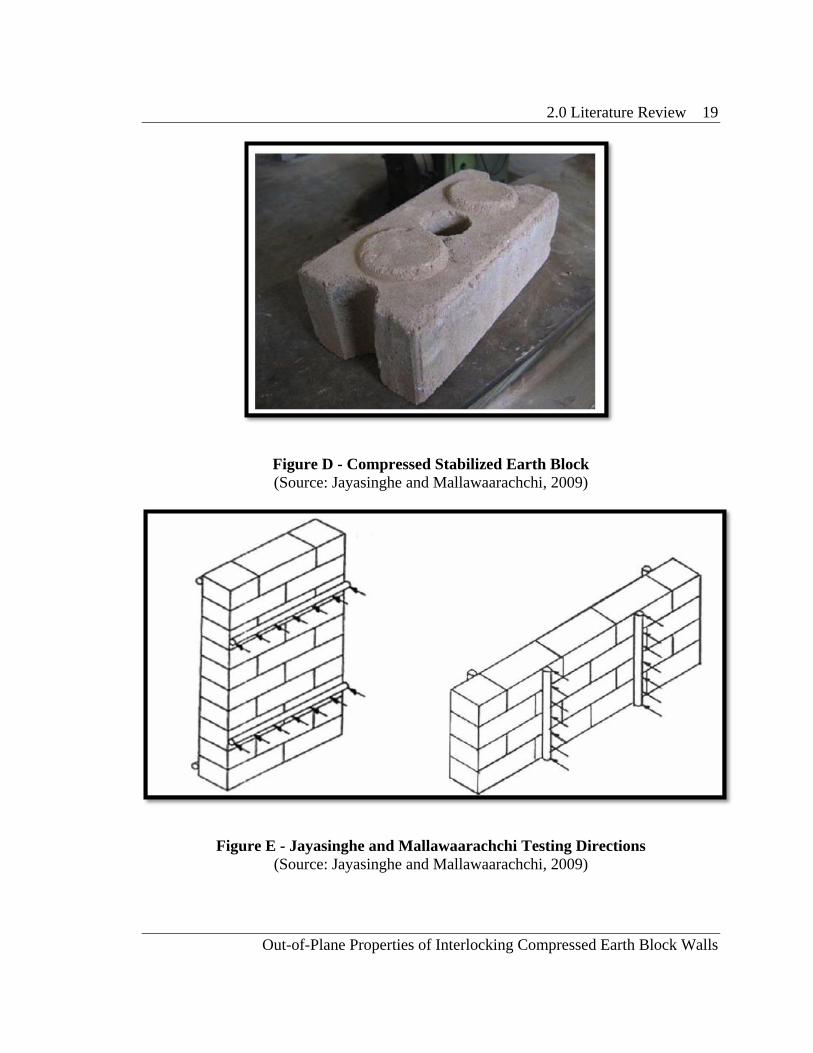
Jayasinghe and Mallawaarachchi conducted flexural strength tests of compressed
stabilized earth masonry materials. The tests were designed to measure the flexural
strength, both parallel and perpendicular to bed joints of compressed stabilized earth
bricks, blocks and rammed earth. With relevance to this thesis, the blocks used were 290
mm long x 145 mm wide x 100 mm tall. An image of the blocks used can be found in
Figure D. The blocks were bonded with a cement soil paste, meaning that there is some
bond between courses of blocks. The voids in the block were also completely filled with
a cement soil mix. None of the walls contained reinforcement.
Small wall samples were tested as shown in Figure E. The walls were able to
reach 0.262 N/mm2 as their average flexural resultant stress parallel to bed joints and
0.261 N/mm2 perpendicular to bed joints. Thusly, both flexural resultant stresses were
found to be about equal. The failure was brittle in nature and occurred when tension
cracks started to form on the back side of the walls. The results of these tests provide
insight into the flexural behavior relationship between earth block walls loaded in each
out of plane direction.
2.0 Literature Review 19
Out-of-Plane Properties of Interlocking Compressed Earth Block Walls
Figure D - Compressed Stabilized Earth Block
(Source: Jayasinghe and Mallawaarachchi, 2009)
Figure E - Jayasinghe and Mallawaarachchi Testing Directions
(Source: Jayasinghe and Mallawaarachchi, 2009)

2.0 Literature Review 20
Out-of-Plane Properties of Interlocking Compressed Earth Block Walls
The Hydraform dry-stack block system was tested by Pave (2007). A complete
testing program achieved values for compressive strength and flexural strength for the
Hydraform blocks. Hydraform blocks are solid, compressed earth blocks that do allow
for reinforcement parallel to the bed joint. The blocks form a shape that is pictured in
Figure F, where two edges of the blocks are lowered, to form a dry-stacked, interlocking
pattern. The tested compressive strength of a single Hydraform block, with a 5% cement
content was found to be 3.0 MPa. The masonry compressive strength, as determined by
prism testing was found to be 1.1 MPa for blocks with 5% cement content.
Figure F – Hydraform Blocks
(Source: Pave, 2007)
For the flexural strength tests, Pave decided to use composite beams made of
reinforced concrete and dry stacked masonry. Multiple beams with 6 mm steel bar
reinforcing were tested with different sizes and cross sections. Each beam was tested
with loading perpendicular to the bed joints of the blocks, meaning the beams were tested
across their minor axis (see Figure G). The tests showed that the concrete-masonry

2.0 Literature Review 21
Out-of-Plane Properties of Interlocking Compressed Earth Block Walls
beams were able to behave with composite action under flexural loading. A beam was
tested without concrete, as shown in Figure G, and showed excessive deflections in the
masonry. It should be noted that the Hydraform system does not have vertical grout
holes or wide horizontal grout channels to resist this out-of-plane loading. Three out of
the four beams tested did not meet the theoretical load capacity during experimentation.
However, there were instances in shear cracks that could not be investigated completely
at that time. The researchers recommended that the shear resistance of the dry-stack
system should be heavily investigated.
Figure G – Example of Cracking Pattern and Loading
(Source: Pave, 2007)

3.0 Materials 22
Out-of-Plane Properties of Interlocking Compressed Earth Block Walls
3.0 MATERIALS
This section discusses the materials used in the creation of the ICEB walls. The
discussion of relevant materials will include specifications, methods of construction, and
measured structural properties.
3.1 Interlocking Compressed Earth Blocks
Interlocking Compressed Earth Blocks used in this experimentation program were
formed using a predetermined mixture of materials based from the experiments of Bland
(2011) and Stirling (2011). The material properties, process of manufacturing, and
quality assurance of ICEB’s will be discussed in this section.
3.1.1 Soil
The soil used in the manufacturing of the ICEB blocks was obtained from a local
site and is identical to the soil used by Bland (2011) and Stirling (2011). ASTM testing
procedures were used to determine the grain size distribution and soil plasticity. Results
of ASTM D422-63 for grain size distribution showed the soil consists of approximately
21% clay particles finer than 0.002 mm (Bland, 2011). The plasticity of the soil was
found using ASTM D4318-05 (Bland, 2011). Results are shown in the table below.
Table 1 - Soil Plasticity
Source: Bland 2011
Liquid Limit (%) Plastic Limit (%) PI (%)
36 15 21

3.0 Materials 23
Out-of-Plane Properties of Interlocking Compressed Earth Block Walls
Figure H - Soeng Thai SP3
Pulverizer
3.1.2 Sand
Sand used in the ICEB mixture was a medium-fine sand for use in concrete. A
screening was used to remove any particles larger than 6 mm. Screened sand was stored
dry in a bin until ready for use.
3.1.3 Cement
Type I/II common portland cement was used in the ICEB and grout mixtures.
3.1.4 Material Preparation and Mixing
Soil was air dried and pulverized using a Soeng Thai Model SP3soil pulverizer,
pictured below. The pulverizer hammers the dried soil into grains that may only pass a
screen in the machine when smaller than 4 mm. The pulverized soil was then stored in
dry bins.

3.0 Materials 24
Out-of-Plane Properties of Interlocking Compressed Earth Block Walls
Soil, sand, and cement were mixed in batches to form eight ICEB’s at a time. The
size of batches was selected in order to provide enough time for pressing between the
addition of water and the mixture being dried out. The proportions of each material were
weighed out to the nearest 0.1 kg to the mass specified in Table 2. A variation in the
amount of water to each batch was necessary due to the difference in consistency of each
batch.
Table 2 - ICEB Mixture Material Weights
Weight (kg) % of Total
Soil 50.0 74.3
Sand 6.7 10.0
Cement 4.2 6.2
Water ~ 6.4 9.5
Total 67.3 100.0
Weighed amounts of soil, sand, and cement were first dry mixed in a portable
cement mixer. The materials were mixed until a uniform mixture had been achieved.
After mixing, the materials were placed on the concrete floor and spread out evenly for
wet mixing.
Water was added slowly to the mixture while being blended with shovels. The
cement mixer was not used due to the fact that the water saturated soil sticks to the sides
of the mixer and does not allow for a uniform blend. Since previous testing has shown
water content of each batch to vary depending on clay content, cement content, and the

3.0 Materials 25
Out-of-Plane Properties of Interlocking Compressed Earth Block Walls
temperature of the air, water was added cautiously in between “Drop Tests” to check the
performance of the batch. The details of the “Drop Test” are shown in Figure I.
Figure I - Drop Test
Source: (Proto et. al., 2010)

3.0 Materials 26
Out-of-Plane Properties of Interlocking Compressed Earth Block Walls
3.1.5 Pressing Procedure
Once an optimal mixture was obtained, the mixture was separated and weighed
into containers, each with enough mixture to make one ICEB. Depending on which type
of ICEB was desired, different amounts of mixture were weighed per block. Block types
and weights of wet mixture per block for each can be found in the table below.
Table 3 - ICEB Types and Weights per Block
Block Type Description Mixture Weight
per Block (kg)
Standard Full size, all 5 holes 8.0
Channel Full size, all 5 holes, and channel insert 7.3
Pilaster Full size, 3 holes- two end inserts were
removed, and changed bottom press plate 8.2
Half-Standard Standard block with standard divider plate 8.0
Half-Channel Channel block with channel divider plate 7.3
The press used for each block was the Soeng Thai Model BP6. This press has the
ability to construct each of the blocks needed for this thesis. For each block, the mixture
was added to the BP6 press in two stages. Pouring half the mixture into the press at a
time allowed for compaction of the mixture into the press at two stages. Without this
separation, the mixture would overflow in the press, and the lid would not completely
close. Once the mixture was in the press, the lid was closed, and the lever was pulled.
After the lever was completely pulled down, it was held there at maximum compression

3.0 Materials 27
Out-of-Plane Properties of Interlocking Compressed Earth Block Walls
for a minimum of three seconds. The lever was then released and pulled down in the
opposite direction, effectively ejecting the solid block out from the press, as shown in
Figure J.
Figure J - Soeng BP6 with Finished ICEB
At least once per batch, blocks were tested for quality of mixture and density by
the use of a pocket penetrometer (see Figure K). The test took place before ejecting the
block from out of the press. The penetrometer tests the compactness of the block
immediately after pressing. This test helped to immediately assure the quality of the
mixture and block.

3.0 Materials 28
Out-of-Plane Properties of Interlocking Compressed Earth Block Walls
Figure K - Penetrometer Test
3.1.6 Curing
After pressing, each ICEB was carefully moved indoors to an initial curing rack.
Each ICEB was allowed to cure on this rack for at least three days and watered at least
four times. This initial cure time was used to allow each block to harden enough to
significantly reduce the damage to the blocks by stacking.
Once the initial cure was completed, the blocks were moved outside and stacked
closely together 8 blocks high. The ICEB stacks were then covered with plastic tarp and
watered once a day for a minimum of 4 days. After this humid curing, the blocks were
transported to the testing lab.

3.0 Materials 29
Out-of-Plane Properties of Interlocking Compressed Earth Block Walls
3.2 Grout
Grout mixtures for ICEB construction must be workable enough to pour into the
small holes of the ICEB block. Therefore, a grout mixture with fine sands and a very
high slump was used. An effort was also made to create a grout that would closely match
the compressive strength of the ICEBs. Previous testing has shown that brittle failures
occur in prisms where the grout has a significantly higher compressive strength when
compared to ICEBs (Bales et al., 2009). For this thesis, the grout mixture was
determined by the previous work of Bland, 2011. This mixture consisted of
approximately 1:0.4:2.6:4.2 portions of portland cement to lime to water to sand; all
measured by dry volume. The sand used in grout preparation was identical to the sand
used in the ICEB construction.
Preparation of the grout consisted of dry mixing the ingredients in 15 liter
batches. The dry mixture was then added slowly to a portion of the water and mixed until
a homogeneous mixture was obtained. Water was then slowly added until a highly
workable grout was achieved.
3.3 Soil-Cement Plaster
A plaster was to be applied to one wall for testing. A sustainable and cost
effective mixture was desired using the materials that would already be on site during
construction. A suitable mixture of soil, sand, and cement was deemed to be the best
option for this experiment. Iterations of different plasters were made in order to find a
mixture that would not crack once dried, and had a compressive strength that would

3.0 Materials 30
Out-of-Plane Properties of Interlocking Compressed Earth Block Walls
significantly affect the stiffness of the ICEB wall. One of the poor plaster mix is shown
in
Figure L (a).
Figure L - Insufficient Plaster Mixture Results
The final mixture, shown in
Figure L (b) consisted of 1:6:0.25 parts of soil to sand to portland cement. The
pulverized soil and sand were identical to that used in the pressing of ICEBs.
3.4 Material Testing and Results
Compressive strength testing was performed on samples of individual ICEBs,
fully grouted prisms, grout cylinders extracted from the inside of blocks, grout cylinders
a) b)

3.0 Materials 31
Out-of-Plane Properties of Interlocking Compressed Earth Block Walls
from plastic forms, and soil-cement plaster cylinders. Table 4 summarizes the average
compressive strengths of each material.
Table 4 - Material Compressive Strengths
Material Type Number of
Samples Compressive Strength, MPa
Coefficient of
Variation
Individual ICEB 22 7.76 13.5 %
Grouted ICEB Prisms 12 2.81 10.7 %
Porous Grout
Cylinders 19 9.19 16.4 %
Non-Porous Grout
Cylinders 15 5.10 10.5 %
Soil-Cement Plaster
Cylinders 3 0.85 13.3 %
3.3.1 ICEB Compressive Strength
Individual ICEB compressive strength was determined by using a universal
compressive testing machine. The compressive strength of individual blocks is not used
in design of ICEB walls, but does insure the uniformity of each batch of blocks. The BP6
press was dismantled for use of its top and bottom plates. Using these plates in the
compressive testing of individual ICEBs was determined to be the most effective method
of testing by previous experiments (Bales et al., 2009). Testing was conducted on
standard and pilaster block types, their net areas being 39320 mm2 and 40570 mm
2,
respectively.

3.0 Materials 32
Out-of-Plane Properties of Interlocking Compressed Earth Block Walls
Failure of the individual ICEBs was a conical failure, shown in Figure M. This
failure is identical to those found in the previous experiments of Bland, 2011 and Bales et
al., 2009.
Figure M - ICEB Compressive Failure
3.3.2 Grout Compressive Strength
Grout samples were tested for each batch of grout poured. Due to the ICEB’s
inherent water absorbing properties, it was required to test grout samples that had been
poured into the blocks. Grout cylinders were carefully removed from the blocks before
testing. These samples formed in the blocks are titled porous grout cylinders. The
dimensions of the porous grout cylinders were 45 mm in diameter, and 100 mm tall, with
an area of 1590 mm2. Grout samples were also formed in plastic molds in order to test
the relative strength between these non-porous samples and the porous samples. The
dimensions of the non-porous cylinders were 76.2 mm in diameter and 152.4 mm tall,
with an area of 4560 mm2. All types of cylinders were capped with a gypsum-cement
capping agent before testing. Figure N shows a non-porous grout cylinder test.

3.0 Materials 33
Out-of-Plane Properties of Interlocking Compressed Earth Block Walls
The grout compressive strengths met the masonry code’s minimum requirement
of having a higher compressive strength than the prisms. The higher coefficient of
variation in the porous cylinders compared to the non-porous cylinders shows the
inherent variations in ICEB construction.
Figure N - Grout Cylinder Compressive Test
3.3.3 ICEB Masonry Prism Compressive Strength
Stacks of three ICEBs were subjected to compressive loading in order to
determine the masonry prism strength (f’m). The prisms were constructed with each wall,
grouted concurrently along with the walls, and allowed to cure under the same conditions
as each wall. The height to width ratio of the prisms was 2.0 and compressive strengths
were not modified for the aspect ratio. Both the top and bottom of the prisms were
capped with gypsum-cement plaster. Figure O shows the testing setup and typical failure

3.0 Materials 34
Out-of-Plane Properties of Interlocking Compressed Earth Block Walls
of ICEB prisms. Failure occurred under similar loads and strains to previous
experiments, Bland, 2011. The stress-strain plot for three prism tests can be found if
Figure P.
Figure O - ICEB Prism Compressive Test
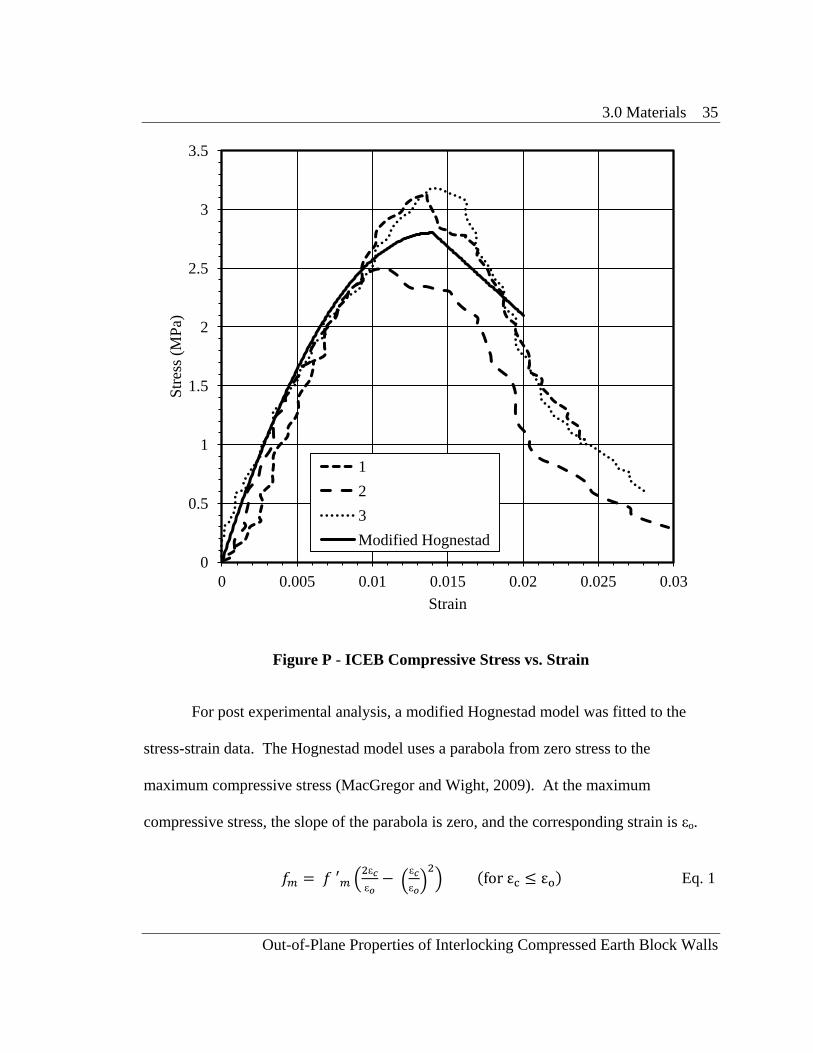
As shown on the stress-strain plot in Figure P, the strain at peak strength is at
about 0.014. When compared to ACI-530-08 peak strain values of 0.0025-0.003, the
average ICEB peak strain is much larger. The difference can largely be attributed to the
dry-stack system. Without mortar to bind the blocks together, there are inherent gaps
between the blocks, which must close before compression failure occurs.
3.0 Materials 35
Out-of-Plane Properties of Interlocking Compressed Earth Block Walls
Figure P - ICEB Compressive Stress vs. Strain
For post experimental analysis, a modified Hognestad model was fitted to the
stress-strain data. The Hognestad model uses a parabola from zero stress to the
maximum compressive stress (MacGregor and Wight, 2009). At the maximum
compressive stress, the slope of the parabola is zero, and the corresponding strain is εo.
ε
ε
ε
ε Eq. 1
0
0.5
1
1.5
2
2.5
3
3.5
0 0.005 0.01 0.015 0.02 0.025 0.03
Str
ess
(MP
a)
Strain
1
2
3
Modified Hognestad

3.0 Materials 36
Out-of-Plane Properties of Interlocking Compressed Earth Block Walls
For strains past εo, the stress degrades linearly.
Eq. 2
The final plot in Figure P used values f’m = 2.8 MPa, εo = 0.014, and εcu = 0.02.
The modulus of elasticity (E) was determined through the analysis of the stress
strain relationship using three of the prisms constructed for this thesis. From ACI 530
section 1.8.2.2.1, the modulus of elasticity can be taken as the slope between 0.05 and
0.33 of the maximum compressive strength of each prism. Using this procedure, the
average calculated modulus of elasticity was 350 MPa. This is equal to 125 f’m, which is
lower than Bland’s (2011) modulus of 137 f’m, and significantly lower than the ACI 530
approximation of 700 f’m for clay masonry. The displacement caused by the closing of
gaps at the dry-stack joints in ICEBs is responsible for the majority of difference between
the modulus of elasticity values from ACI 530 approximations and experimental results.
3.3.4 Soil-Cement Compressive Strength
Three soil-cement cylinders were tested for the compressive strength of the soil-
cement plaster. Two cylinders were formed out of the scratch coat and one was formed
out of the finish coat. The soil-cement mixture was formed in the same forms as the non-
porous grout cylinders, having an area of 4560 mm2. Once the mixture was surface
hardened, it was removed from the form in order to allow the mixture to air dry under
similar conditions to the wall coating. Each cylinder was capped with a gypsum-cement

3.0 Materials 37
Out-of-Plane Properties of Interlocking Compressed Earth Block Walls
capping agent prior to testing. It should be noted that the plaster applied to the walls
likely had a stronger compressive strength due to the high absorption rate of the ICEBs.
3.3.5 Steel Reinforcement Tensile Testing
Two sizes of steel reinforcement were used in the construction of the walls.
Multiple samples of each rebar were tested under tensile loading. The average yield
strength of the Grade 40 #3 bars, with a nominal area of 71 mm2, was 338 MPa. The
average yield strength of the Grade 60 #2 smooth bars, with a nominal area of 32 mm2,
was 435 MPa.

4.0 Test Setup and Procedure 38
Out-of-Plane Properties of Interlocking Compressed Earth Block Walls
4.0 TEST SETUP AND PROCEDURE
The ICEB wall construction methods, test setup, loading protocol, and
instrumentation are discussed in this section. Any data reduction measures are
introduced and discussed. Finally, prediction methods and calculations are also presented
in this section. Table 5 below presents an overall summary of each wall tested for this
thesis.
Table 5 - ICEB Wall Specifications
Boundary
Conditions
Added
Feature
Width
(mm)
Height
(mm) Loading
Vertical
Rebar
Horiz.
Rebar
Wall 1 Cantilever None 450 1100 Point
Load (1) #3 (4) #3
Wall 2 Cantilever Lap
Splice 450 1100
Point
Load (1) #3 (4) #3
Wall 3 Cantilever Plaster
Coating 450 1100
Point
Load (1) #3 (4) #3
Wall 4 Pin-Pin None 1050 2400 4 Point
Loads (2) #3 (6) #3
Wall 5 Pin-Pin Pilaster 1200 2400 4 Point
Loads (6) #3
(6) #3 &
#2 Ties @
400 mm
4.1 ICEB Construction Methods
All ICEB walls were constructed using methods standard to those found in
Thailand and Indonesia. A manual has been produced by the Center for Vocational
Building Technologies (CVBT) in order to standardize the construction of ICEB

4.0 Test Setup and Procedure 39
Out-of-Plane Properties of Interlocking Compressed Earth Block Walls
buildings (Wheeler, 2005). All walls were built in the fashion this manual describes as
well as current construction details.
4.1.1 Laying ICEBs
Every first course of ICEBs needed to be laid on a level surface to ensure a
straight and vertical wall. A standard mason’s mortar mix was used to create this level
surface, and to bond the blocks to the base. Blocks in the first course were laid and
leveled on a 10 mm to 20 mm thick mortar base and allowed to cure overnight. In order
for horizontal reinforcement to be placed at the base of each wall, channel blocks were
used as the first course in accordance with the CVBT manual.
Once the first layers of ICEBs were allowed to cure, additional lifts were stacked
in groups of four courses. Three courses of standard blocks were laid and leveled,
followed by one course of channel blocks. Each channel block layer included one
horizontal #3 steel reinforcement bar. The horizontal #3 bars were added in order to
simulate real life wall layouts and to ensure that the walls displace homogeneously along
the length of each wall.
Due to variance in individual block heights and the mortarless dry-stacked
system, there needed to be occasional adjustments to the vertical alignment of block
courses. Following the CVBT manual, nails of various sizes were used to lift and align
blocks. Once the finished walls were allowed to cure, each nail was removed in order to
avoid any cracking caused by these nails. The process was repeated until the desired

4.0 Test Setup and Procedure 40
Out-of-Plane Properties of Interlocking Compressed Earth Block Walls
height of each wall was met. The final course of blocks always contained channel ICEBs
in order to provide a better connection or load path.
4.1.2 Grouting
Grout lifts were no more than five courses high and always ended on a channel
block course. The grout pour was ended before the channel cavity was completely full.
In order to allow grouting at the ends of the walls, timber members wrapped in plastic
were tightened against the end of each wall with a ratchet strap system. This tightening
also kept the ICEBs from moving during the grout pour.
Due to the ICEBs natural tendency to absorb water, water was poured into the
grout holes just prior to grouting. Enough water was used to ensure that all surfaces were
damp, but not overly saturated. Since the grout was a very fluid mix, it was very easy to
pour into the grout keys and reinforcement holes. A funnel was very helpful in pouring
both the water and grout. In some instances, grout was seen slowly passing through the
larger gaps between blocks. This dripping was helpful in determining if the grout had
filled all cavities and stopped shortly after the pour.
4.2 Cantilever Walls
Three cantilever walls were constructed using the methods described in Section
4.1. These three walls were designed to be small scale, easily replicable walls that would
give information into the behavior of ICEB walls under out-of-plane loading. Along with
this basic information, additional studies were designed to observe the effects of some
common added features. Using the CVBT manual, two attributes were chosen for

4.0 Test Setup and Procedure 41
Out-of-Plane Properties of Interlocking Compressed Earth Block Walls
experimentation, a reinforcement lap splice and a soil-cement plaster coating. These
walls will hereby be referenced as Wall 1 for the basic wall, Wall 2 for the lap-splice
wall, and Wall 3 for the plastered wall. The construction and test setup of all three walls
was identical, except for the addition of each feature.
4.2.1 Wall Layout and Construction
The cantilever walls were constructed 1.1 (11 blocks) meters tall and 0.45 meters
(1.5 blocks) wide onto pre-existing concrete pads. These concrete pads were clamped to
a strong floor. Each wall was reinforced with one #3 steel rebar placed in the center
reinforcing hole. The #3 bar was epoxied into a pre-existing concrete pad using Simpson
Strong-Tie Set-XP Structural Anchoring Adhesive. Oversized holes were bored and
cleaned per the adhesive manufacturer’s recommendations.
Figure Q - Cantilever Wall Layout
Elevation Plan View

4.0 Test Setup and Procedure 42
Out-of-Plane Properties of Interlocking Compressed Earth Block Walls
ICEBs were dry-stacked per the methods described in Section 4.1. Before the
placement of the final course, the vertical rebar was bent 90 degrees. The final horizontal
reinforcement was made in a U shape in order to make sure there would be no localized
failure or slipping between the blocks at the loading point. The U shape bar spanned 300
mm across the width of the wall and had legs of 250 mm inserted into the outer
reinforcing holes.
Figure Q shows the typical layout for the cantilever walls.
Three grout lifts were poured for each wall containing the following amount of
courses per lift: 5, 4, and 2. In order to provide extra grout cover for the reinforcement,
the final pour included an overflow layer above the final course of blocks 25 to 30 mm
tall.
For Wall 2, the lap splice was added after the initial vertical reinforcement was
adhered to the concrete pad. The goal of including a lap splice was to determine whether
the current masonry code provided an adequate calculation for minimum length. Using
ACI 530 equation (2-12), the lap splice length was found to be 46 cm.
Eq. 3
where db is the bar diameter, 9.52 mm,
fy is the steel nominal yield strength, 275 MPa,
γ is the reinforcement size factor, 1.0 for a No. 3 bar,

4.0 Test Setup and Procedure 43
Out-of-Plane Properties of Interlocking Compressed Earth Block Walls
K is the minimum masonry clear cover, 70 mm,
f’m is the masonry compressive strength, 2.8 MPa.
The first rebar was doweled into the concrete pad and cut 46 cm above the top of the
concrete pad. The second #3 rebar began just above the concrete pad and was tied
against the doweled bar using thin wire ties. Courses of ICEBs were then stacked as
previously mentioned.
Wall 3 was identical to Wall 1, until the soil-cement plaster was added. Two
layers of the plaster were pressed against both front and back of the wall to get a
thickness of 20 mm on each side. Prior to adding the first layer of plaster, the ICEBs
were dampened in order to avoid rapid absorption of water. The first layer was also
scratched using standard plastering techniques in order to provide a rough surface for the
second coat to adhere to.
4.2.2 Loading Method and Instrumentation
Each wall was loaded using the same equipment. Two hollow steel rectangular
sections, each measuring 76.2 mm by 25.4 mm with a wall thickness of 6.35 mm were
attached to each wall one meter above the concrete pad. A layer of masonry mortar less
than 5 mm thick was applied to the inside face of each tube prior to being clamped to the
wall. The mortar provided a constant surface for the load to be applied against. Two 20
mm threaded rods were used to clamp the tubes to the walls. The setup is pictured in
Figure R.

4.0 Test Setup and Procedure 44
Out-of-Plane Properties of Interlocking Compressed Earth Block Walls
The steel tubes were attached to a hydraulic jack for loading. The jack had a
loading capacity of 17.8 kN and a stroke of 150 mm. The jack was connected to a strong
frame that would not displace under loads from the experimentation. Each end of the
jack was allowed to freely rotate as required during testing.
Figure R - Cantilever Wall Loading and Instrumentation
The instrumentation chosen for the cantilever walls was designed to provide data
for four quantities: load, displacements, strains, and rotations. See Figure R for
elevations of the instrumentation. A load cell was attached to the hydraulic jack. Four
laser sensors and a turn pot measured displacements along the height of the walls, as well
as any in-plane rotation at the top. These five instruments were attached to an instrument
Push
1000mm

4.0 Test Setup and Procedure 45
Out-of-Plane Properties of Interlocking Compressed Earth Block Walls
stand. Inside the wall, one strain gauge was placed on the vertical reinforcement 40 mm
above the concrete pad. For Wall 2, a strain gauge was also placed halfway up the lap
splice on the #3 rebar that was not doweled into the concrete.
On the wall, three small linear variable differential transformers (LVDTs) were
placed vertically against each side of the walls. Using small threaded rods inserted into
the walls with epoxy adhesive, these LVDTs were stacked one above the other, in order
to record the variation of displacements between blocks, see Figure S. These
measurements would ultimately record the rotation and curvature of three heights along
the walls.
Figure S - Horizontal LVDTs for Block Rotations (Only One Side Shown)

4.0 Test Setup and Procedure 46
Out-of-Plane Properties of Interlocking Compressed Earth Block Walls
4.2.3 Data Reduction Measures
Displacements measured in the cantilever walls are absolute, and require no
reduction measures. However, the three measurers at the top of the walls were checked
to see if they presented the same data. By taking the two laser sensors at the top, and
linearly interpolating to the center of the wall, the center turn pot could be checked for
accuracy.
The six LVDT outputs required an equation to change a set of displacements to a
single curvature at each height. By taking one LVDT reading and the LVDT reading at
the same height on the opposite side of the wall, with the length each LVDT was away
from the other, the following equation yields the curvature at that height of wall.
Eq. 4
where Φ is the curvature of the wall,
Δ is the change in LVDT reading (mm),
HLVDT is the height between LVDT measuring points (mm), and
WLVDT is the width between LVDT measuring points (mm).
4.3 Full Scale Walls
Two full scale walls were designed for this research in order to observe the
behavior of large walls with and without a pilaster. The first wall, the flat wall, will
hereby be called Wall 4. The second wall was built with a pilaster, and will be named
Wall 5. The CVBT manual issues a warning that no wall longer than 4.5 meters should
be constructed without a corner, interior wall connecting it, or a pilaster. One goal of

4.0 Test Setup and Procedure 47
Out-of-Plane Properties of Interlocking Compressed Earth Block Walls
these two experiments is to examine the CVBT’s estimate of 4.5 meters in relation to the
out-of-plane bending experienced during an earthquake.
4.3.1 Wall Layout and Construction
Both full scale walls were designed using typical building layouts in Thailand and
Indonesia. Although in building details, the ICEB walls often have continuous
reinforcement into a concrete footing below, in order to simplify the test and create a
determinate structure, the top and bottom connections of each wall was pinned.
A steel plate connected to a steel channel section with a pin connection was used
as the base. The steel plate was bolted to the strong floor with three 38 mm bolts. The
channel section allowed the wall to be built on top of the steel web, with the flanges
pointing up. This set up allowed the first course of blocks to be set on a mortar bed and
be surrounded by mortar (see Figure T), allowing no sliding in the channel.

4.0 Test Setup and Procedure 48
Out-of-Plane Properties of Interlocking Compressed Earth Block Walls
Figure T - Pinned Connections
A reinforced concrete beam was cast in place on the top of each wall. Two
horizontal openings allowed for a set of steel plates to be attached to the wall (see Figure
T). These plates created a pinned connection with two high strength steel tubes that
would transfer load into a strong frame about 1 meter away from the wall. At both top
and bottom of each wall, a #3 steel reinforcement was added in a U-shape from one
vertical bar to another, to ensure that the blocks would not slide at the points of highest
shear loads. Elevations of each wall showing the reinforcement layouts can be found in
Figure U.
While both walls had a pin to pin height of 2.4 meters, the width of each wall
varied slightly to accommodate symmetry. Wall 4 was 1.05 meters (3.5 blocks) wide,

4.0 Test Setup and Procedure 49
Out-of-Plane Properties of Interlocking Compressed Earth Block Walls
while Wall 5 was 1.2 meters (4 blocks) wide. The plan views and alternating courses can
be seen in Figure U, along with elevations and rebar layouts. Each wall contained five
grout pours.
Figure U - Full Scale Wall Plan and Elevations Views

4.0 Test Setup and Procedure 50
Out-of-Plane Properties of Interlocking Compressed Earth Block Walls
Pilasters in current construction details were shown to have shear reinforcement
whenever horizontal rebar was placed. In order to accommodate the #2 smooth bars that
were chosen for shear ties, openings needed to be cut into some ICEBs. A circular saw
with a masonry blade was found to be the most effective method for these cuts. Figure V
shows the cuts and layout for the shear reinforcement.
Figure V - Typical Pilaster Tie Installation
4.3.2 Loading Method and Instrumentation
During an earthquake, forces are approximately evenly distributed along the
entire area of the wall. In order to simulate this even distribution of force, a loading tree
was built to take the loading from one hydraulic jack, and distribute it evenly at four,
equidistant heights along the wall, see Figure W. By using four point loads, the stresses
and overall behavior of the wall found under uniform loading is closely replicated

4.0 Test Setup and Procedure 51
Out-of-Plane Properties of Interlocking Compressed Earth Block Walls
without the aid of an airbag. Therefore, the results of these experiments are transferable
to real world design and analysis of ICEB walls. The loading tree was designed with two
hinges to accommodate the curvature of the wall during loading.
Figure W - Full Scale Wall Loading and Instrumentation
A hydraulic jack with a loading capacity of 44.5 kN and a stroke of 203 mm was
used for both tests. It was attached with pinned connections to a strong frame and the
loading tree. The pilaster wall was loaded so that the long face of the wall was in
compression. In Figure U, the load would be coming from the bottom of the page.

4.0 Test Setup and Procedure 52
Out-of-Plane Properties of Interlocking Compressed Earth Block Walls
A total of ten LVDTs were used on Wall 4 and eleven were used on Wall 5. The
extra LVDT for Wall 5 was needed to see if the flanges of the wall were moving more or
less than the pilaster core. As Figure W shows, displacements were measured at the base,
at the top horizontally, at the top vertically, and at five different heights of each wall.
Two strain gauges were added to each wall at mid span. On Wall 4, both #3
reinforcement bars had strain gauges. On Wall 5, gauges were placed in the pilaster, one
on a compression bar and one on a tension bar.
4.3.3 Data Reduction Measures
All displacement data, except for the data from the vertical displacement
instrument at the top of the walls, will undergo two simple reduction measures in order to
obtain the correct measurements. First, assuming the top of the wall will displace more
than the base, all values will be subtracted by the displacement measured at the base. By
removing any movement at the base, the displacements along the wall will be relative to
the pinned base. Second, the average displacement of the two top horizontal
displacement sources will be subtracted using linear interpolation down along the wall
from the remaining outputs. The base and top points should be at relative zero
displacement throughout the entire test using this method.
4.0 Test Setup and Procedure 53
Out-of-Plane Properties of Interlocking Compressed Earth Block Walls
4.4 Wall Behavior Predictions
ACI 530 does require minimum properties for proper use of the design methods,
some of which were not met with the ICEBs. These include a minimum compressive
strength of 10.34 MPa, a minimum vertical reinforcing area of 0.002 multiplied by the
gross cross sectional area, and, although it is never explicitly stated that dry-stacked
masonry is not allowed in the ACI code, material and stack pattern lists do not include
dry-stacked masonry. However, since current design in the US is done according to the
ACI 530 and other similar codes elsewhere, the cracking and nominal flexural load and
displacement values were calculated with this code.
Using the Strength Design method from ACI 530, both cracking moments and
moments corresponding to the nominal flexural strength were calculated using the
following equations. To make the flexural strength calculations relevant to experimental
results, each predicted moment value was used to find the total load applied to the each
wall. For Wall 5, the full wall was used to calculate the predicted values. Also, although
there is no mortar between blocks, in order to follow the ACI 530 process, an ACI 530
standard modulus of rupture (fr ) of 0.69 MPa (Table 3.1.8.2.1) for tension normal to
the bed joints in a stack bond was used for all walls. The actual steel reinforcement
yield strength was used in all calculations. For Wall 3, the added plaster was
assumed to have the same strength as the ICEBs, and was consequently given extra
thickness, equal to the thickness of the plaster, when calculating the following
values.

4.0 Test Setup and Procedure 54
Out-of-Plane Properties of Interlocking Compressed Earth Block Walls
Eq. 5
Eq. 6
where Mcr is the cracking moment strength (N-m),
Sn is section modulus (m3),
As is the steel cross sectional area (m2),
fy is the steel yield strength (MPa),
Mn is the nominal moment strength (N-m),
d the distance from extreme compression to center of tensile area (m),
f’m is the masonry compressive strength (MPa),and
b is the width of wall (m).
Anticipated deflections corresponding to the cracking moment and yield moment
were also calculated using the equations below. Equation 7 is the standard cantilever
deflection equation for the cracking displacement. By using Equation 8 and 9, the
cantilever deflection after cracking can be found. These equations are found in the
design guide produced by the Concrete Masonry association of California and Nevada
(Brandow, Ekwueme, and Hart, 2006). For the full-scale walls, a different set of
equations must be used. By substituting Equation 10 for Equation 7, and Equation 11 for
Equation 8, the maximum deflection at the mid-height of each full-scale wall can be
predicted. The full scale wall deflection calculations were derived for simply supported
walls with four equal and equidistant point loads. For each type of wall, simply
supported and cantilever, the load, shear, and moment diagrams can be found in
Appendix C.

4.0 Test Setup and Procedure 55
Out-of-Plane Properties of Interlocking Compressed Earth Block Walls
It should be noted that these equations, derived from standard concrete and
masonry beam mechanics, may not be entirely applicable to the ICEB walls. For
instance, when looking at Equation 9, the value of the modular ratio (n) is much larger for
ICEBs than is commonly used in concrete or CMU design. Also, the assumptions in
these formulas are inherently violated due to the dry-stacking construction method.
However, these formulas must be used in order to compare the standard masonry design
methods to those which would accurately predict the behavior of ICEB walls.
Eq. 7
Eq. 8
Eq. 9
Eq. 10
Eq. 11
where Mcr is the cracking moment strength (N-m),
h is the height of the wall (m),
Em is the masonry modulus of elasticity (MPa),
Ig is the gross moment of inertia (m4),
Mn is the nominal moment strength (N-m),
Icr is the cracked moment of inertia (m4),

4.0 Test Setup and Procedure 56
Out-of-Plane Properties of Interlocking Compressed Earth Block Walls
n is the modular ratio (Es/Em),
As is the steel cross sectional area (m2),
d is the distance from extreme compression to center of tensile area (m),
c is the depth of compression zone (m),
b is the width of the member (m),
Δcr is the displacement at the cracking moment (m), and
Δn is the displacement at the nominal moment (m).
Pilasters add depth to the wall, stiffening the wall, and allow larger loads to be
applied. With this extra depth, there is a possibility for shear dominated behavior. In
order to predict the outcome of the testing of Wall 5, ACI 530 was used to determine the
maximum applied shear force before shear failure. The ACI equation for maximum shear
strength can be found in Eq. 12-14. Once the maximum shear force was acquired, it was
translated into the resulting moment at mid-height of the wall for direct comparison to the
maximum flexural strength.
Eq. 12
Eq. 13
Eq. 14
where Vn is the nominal shear strength (N),
Vnr is the nominal shear strength due to steel reinforcement (N),
Vnm is the nominal shear strength due to masonry (N),

4.0 Test Setup and Procedure 57
Out-of-Plane Properties of Interlocking Compressed Earth Block Walls
s is the spacing of the shear reinforcement ( mm),
Av is the cross sectional area of steel (mm2),
fy is the yield stress of the steel (MPa),
dv is the shear depth of the wall ( mm),
An is the net area of the member ( mm2),
f’m is the masonry compressive strength (MPa), and
need not exceed 1.0 for slender walls.
A sample calculation of Wall 1 and Wall 4, as well as shear strength calculations
for Wall 5 are provided in Appendix A. A summary of all calculated predictions is found
in Table 6.
Table 6 - ACI 530 Predictions
Wall
Number
Mcr (N-m) Fcr (N) Mn (N-m) Fn (N) Δcr (mm) Δn (mm)
Wall 1 582 582 1528 1528 4.4 14.8
Wall 2 582 582 1528 1528 4.4 14.8
Wall 3 915 915 2013 2013 3.5 9.4
Wall 4 1358 3772 3128 8689 7.9 23.0
Wall 5
Flexural
1553 4314 10440 29000 0.020 0.35
Wall 5
Shear
- - 20831 57860 - -

5.0 Experimental Results 58
Out-of-Plane Properties of Interlocking Compressed Earth Block Walls
5.0 EXPERIMENTAL RESULTS
This chapter will provide the results for each test as well as details pertaining to
the loading sequence, cracking locations, and overall performance of each wall. For each
of the five walls, a separate loading sequence was selected in order to best observe the
behavior of each at cracking and nominal strengths. Each sequence begins with target
loads until a load equal to approximately 2/3 of the nominal flexural strength. At 2/3 the
nominal flexural strength, the equivalent displacement is recorded. This displacement is
used to continue the sequence with target displacements equal to a multiplier times the
2/3 strength displacement. Each loading cycle was performed twice for each target. The
load sequence is provided for each wall under its specified section below.
5.1 Cantilever Walls
A table of all the cantilever walls and their parameters can be found in Table 5.
All cantilever wall tests were carried out successfully. However, each wall displaced
more than anticipated during the testing. In order to perform cyclic testing on the wall
(push and pull), the hydraulic jack was attached to the wall with half of its stroke
extended. This way, each loading direction could displace equal maximum amounts.
During the cyclic testing of the wall, displacements became larger than the maximum
stroke of the hydraulic jack. Once the jack could not be extended any further, the jack
was repositioned 75mm closer to the wall. Subsequently, the jack could only load the
wall in the push direction. Each load sequence table shows when the jack was moved
indicated by a “No” under the “Push and Pull” column, see Table 7.

5.0 Experimental Results 59
Out-of-Plane Properties of Interlocking Compressed Earth Block Walls
Each experiment continued the loading sequence until the hydraulic jack’s stroke
was at its maximum. The walls were found to be able to displace increasingly large
amounts past their observed maximum strength without increasing load, indicating that
the wall had yielded and the testing could be concluded.
5.1.1 Wall 1: Basic Wall
Wall 1 was used to provide a basis for all other walls in this experimental
program. The loading sequence used for Wall 1 is presented in Table 7. Note how the
loading sequence changes from target load to target displacement at a load of 1000 N.
Also, due to the aforementioned jack relocation, at 1000 N the wall was only loaded in
the push direction. The ΔN as described in Table 7 was found to be 48 mm for Wall 1.
Table 7 - Wall 1 & 2 Loading Sequence
Step Push and Pull Load (N) Displacement
1 Yes 50 -
2 Yes 100 -
3 Yes 200 -
4 Yes 400 -
5 Yes 800 -
6 Yes 1000 Δ 2/3
7 No - Δ 2/3 x 1.5 = Δn
8 No - 2 Δn
9 No - 3 Δn
10 No - 4 Δn

5.0 Experimental Results 60
Out-of-Plane Properties of Interlocking Compressed Earth Block Walls
Figure X - Wall 1 Force Displacement Response and Strain vs. Displacement
-2500
-2000
-1500
-1000
-500
0
500
1000
1500
2000
2500
-100 -75 -50 -25 0 25 50 75 100 125 150 175
Forc
e (N
)
Displacement (mm)
Pull
Push
Fn = 1720 N
Fcr = 213 N
(a)
0
2000
4000
6000
8000
10000
12000
14000
-100 -50 0 50 100 150 200
Str
ain (
Mic
ro S
trai
ns)
Displacement (mm)
Push Pull
(b)
5.0 Experimental Results 61
Out-of-Plane Properties of Interlocking Compressed Earth Block Walls
The hysteretic behavior (a) and the strain data (b) of Wall 1 is presented in Figure
X where the force represents the actuator force and the displacement is the horizontal
displacement 1000mm above the base. An enveloping curve was formed out of the peak
value for each of the push and pull cycles, see Figure EE. On the hysteresis loop there
are also distinct points of initial stiffness loss due to cracking and significant stiffness loss
due to yielding. Theses observed points of experimental cracking and nominal strengths
are also shown in the Figure as a circle and a triangle, respectively. The yielding point on
the hysteresis loop corresponds to a rebar strain value of 0.0036. This strain value is
higher than the yield strain value of 0.0017 (1700 micro strains), which shows that the
masonry failure and steel yielding did not occur simultaneously, and therefore the overall
stiffness did not decline until higher loads were induced.
It can be seen that Wall 1 exhibited stable hysteretic behavior, a large
displacement capacity, and show large amounts of pinching throughout the test. Table 8
shows the ACI code calculations accurately predicted the nominal flexural strength of
Wall 1, but the predicted displacements were significantly lower than experimentally
determined. The comparison shows that the strength design methods in the ACI translate
well to ICEB design. However, the testing of Wall 1 shows that the inherent gaps
between the ICEB courses, caused by the variance in the heights of blocks, creates a
behavior that allows for more rotation and therefore more displacement than traditional
masonry. The fact that the predicted nominal flexural strengths were surpassed for each
cantilever wall experiments could be caused by numerous variations in ICEB

5.0 Experimental Results 62
Out-of-Plane Properties of Interlocking Compressed Earth Block Walls
performance when compared to traditional masonry. Possibly the most direct variation
could be the assumption that the steel reinforcement does not undergo strain hardening.
This would cause the flexural strengths to be inaccurate in small amounts, similar to what
was observed with the cantilever experiments.
Table 8 – Cantilever Walls ACI 530 vs. Experimental Results
Mcr (N-m) Mn (N-m) Δcr (mm) Δn (mm)
Wall 1 Predicted ACI 530 582 1528 4.4 14.8
Experimental 213 1720 8.9 89.1
Wall 2 Predicted ACI 530 582 1528 4.4 14.8
Experimental 352 1660 8.3 99.4
Wall 3 Predicted ACI 530 915 2013 3.5 9.4
Experimental 797 2215 3.9 25.4
It should be noted that the values in Table 8 were determined by using the
hysteresis loops for each wall to locate points of stiffness change. The peak values for
each cycle were used to form an enveloping curve that more clearly indicates when a
change in behavior was found. The points were determined by observation using these
enveloping curves. In general, two of these points were found for each wall, indicating a
cracking point and a nominal flexural strength point.

5.0 Experimental Results 63
Out-of-Plane Properties of Interlocking Compressed Earth Block Walls
Figure Y - Typical Horizontal Cracking
Horizontal cracking in the grout cores at dry-stacked joints initiated under low
force levels, see Figure Y. The cracks were observed starting above the base layer of
ICEBs and slowly progressing up the wall above each layer of blocks. These horizontal
cracks were limited to the dry-stack joints, and through post-experimental inspection, the
grout cores in each block were found perfectly intact.

5.0 Experimental Results 64
Out-of-Plane Properties of Interlocking Compressed Earth Block Walls
5.1.2 Wall 2: Lap-Splice Wall
Wall 2 was used to observe the behavior in a lap splice at the area for highest
forces in a wall. The strength and deflection calculations were identical to Wall 1 and
therefore, the loading sequence for Wall 2 was identical to that of Wall 1 (see Table 7).
Again, the hydraulic jack was moved after the 1000 N cycles.
In comparison to the results from Wall 1, the lap splice wall behaved similarly.
Wall 2 showed a slightly higher initial stiffness compared to Wall 1, but the flexural
strength was similar in both, see Table 8. The observed experimental cracking and
nominal strengths are noted with a circle and a triangle on the hysteresis loop in Figure Z.
The hysteretic response of Wall 2 shows that the wall experienced a significant drop in
stiffness at a load of 1250 N. At this time, a large vertical crack appeared on the face of
the wall in the third course (Figure AA). This crack broke the block in half across both
the length and the depth of the block. The stiffness was later regained in the wall,
bringing the wall above the ACI determined nominal flexural strength. Similar to Wall 1,
the ACI code was able to accurately predict the nominal flexural strength, but not the
displacements. The yield force (marked as a triangle on Figure Z) was taken as the
second instance of significant stiffness loss because of this vertical crack.

5.0 Experimental Results 65
Out-of-Plane Properties of Interlocking Compressed Earth Block Walls
Figure Z - Wall 2 Force Displacement Response
Figure AA - Vertical Crack in Wall 2
-2500
-2000
-1500
-1000
-500
0
500
1000
1500
2000
2500
-100 -75 -50 -25 0 25 50 75 100 125 150 175
Forc
e (N
)
Displacement (mm)
Pull
Push
Fn = 1720 N
Fcr = 213 N

5.0 Experimental Results 66
Out-of-Plane Properties of Interlocking Compressed Earth Block Walls
The strain gauges on the steel reinforcement provided good insight into the
behavior of the lap splice in Wall 2. Figure BB plots the strain vs. the displacement in
both the starter bar (Strain at Base), doweled into the concrete footing, and the lap bar
(Strain at Mid Splice). The Strain at the Base shows the steel reinforcement at the base
was able to yield significantly, past the yield strain of 0.0017 (1700 micro strains),
indicating that the lap splice was able to transfer load adequately into the footing. The
strain a mid-splice did not yield significantly, even at high displacements.
Figure BB – Wall 2 Strain vs. Displacement
5.1.3 Wall 3: Plastered Wall
Wall 3 was designed to investigate the effect of a plaster coating on ICEB walls.
Specifically, a plaster coating was chosen to limit the blocks from rotating due to the
0
2000
4000
6000
8000
10000
12000
14000
-100 -50 0 50 100 150 200
Str
ain (
Mic
ro S
trai
ns)
Displacement (mm)
Strain at Base Strain at Mid Splice
Push Pull

5.0 Experimental Results 67
Out-of-Plane Properties of Interlocking Compressed Earth Block Walls
inherent gaps between ICEB courses. The loading sequence used for Wall 3 is presented
in Table 9. The jack relocation was able to be held off until later in the experiment for
Wall 3 due to its increased stiffness compared to Walls 1 and 2. The jack was finally
moved before the 7 Δn cycles.
Table 9 - Wall 3 Loading Sequence
Step Push and Pull Load (N) Displacement
1 Yes 100 -
2 Yes 200 -
3 Yes 400 -
4 Yes 600 -
5 Yes 1000 -
6 Yes 1300 Δ 2/3
7 Yes - Δ 2/3 x 1.5 = Δn
8 Yes - 2 Δn
9 Yes - 3 Δn
10 Yes - 4 Δn
11 Yes - 5 Δn
12 No - 7 Δn
13 No - 10 Δn
The hysteretic behavior and strain vs. displacement data of Wall 3 is presented in
Figure CC. The observed experimental cracking and nominal strengths are also shown in
the Figure again marked with a circle and a triangle, respectively. Wall 3 was similar to
Wall 1 in that it exhibited stable hysteretic behavior and shows large amounts of pinching
throughout the test. Wall 3 showed a drop in flexural strength past the 50 mm
displacement mark which coincided with plaster spalling from the ICEB wall. Past the

5.0 Experimental Results 68
Out-of-Plane Properties of Interlocking Compressed Earth Block Walls
50mm displacement, the Wall 3 plateaued at a force of 1800 N, which is similar to the
observed yield strength of Wall 1 and Wall 2. The yielding point on the hysteresis loop
corresponds to a strain value of 0.0020. This strain value is higher than the theoretical
yield strain value of 0.0017, but smaller than the Wall 1 strain of 0.0036, indicating that
the overall system was more balanced due to the added thickness of the plaster.
Table 8 shows that the ACI code calculations accurately predicted the nominal
flexural strength of Wall 3. For Wall 3, the accuracy of the displacement predictions
increased, but the cracking displacement and nominal displacement prediction errors
were still 10% and 63% lower than the actual results respectively. This can be attributed
to the plaster’s ability to prevent the large rotations between blocks that were observed in
the first two walls.
Although the cracking pattern in Wall 3 included horizontal cracks at the dry-
stack joints, similar to Wall 1 and Wall 2, the plaster created more visible cracks with
different behaviors. Figure DD shows cracking in the face of the plaster (upper picture)
that initiated before any cracks in the grout could be observed. The lower picture of
Figure DD shows a section view of Wall 3 near the end of the testing. Substantial
rotation away from the mortar bed and the plaster spalling away from the ICEB face is
shown.

5.0 Experimental Results 69
Out-of-Plane Properties of Interlocking Compressed Earth Block Walls
Figure CC – Wall 3 Force Displacement Response
-2500
-2000
-1500
-1000
-500
0
500
1000
1500
2000
2500
-100 -75 -50 -25 0 25 50 75 100 125 150 175
Forc
e (N
)
Displacement (mm)
Pull
Push Fn = 2013 N
Fcr = 915 N
0
2000
4000
6000
8000
10000
12000
14000
-100 -50 0 50 100 150 200
Str
ain (
Mic
ro S
trai
ns)
Displacement (mm)
Push Pull

5.0 Experimental Results 70
Out-of-Plane Properties of Interlocking Compressed Earth Block Walls
Figure DD - Wall 3 Cracking Pattern

5.0 Experimental Results 71
Out-of-Plane Properties of Interlocking Compressed Earth Block Walls
5.1.4 Comparison of Force-Displacement Behavior
By using the load and displacement measured at each of the targets from each of
the three hysteresis curves, an enveloping curve of each wall was created for comparison
between results, Figure EE.
Figure EE - Enveloping Comparison of Hysteretic Behavior of Cantilever Walls
The comparison in Figure EE shows a slight increase of initial stiffness in Wall 2
compared to Wall 1. Despite the difference in stiffness, the flexural strengths were
similar. Wall 3 showed a significant increase in stiffness, due to the plaster filling the
gaps between the dry-stacked joints. Wall 3 also showed a significant increase in flexural
capacity, due to the increased wall thickness provided by the plaster. Each wall
consistently exceeded the ACI predicted nominal flexural strength prior to yielding, but
-2500
-2000
-1500
-1000
-500
0
500
1000
1500
2000
2500
-100 -75 -50 -25 0 25 50 75 100 125 150 175
Forc
e (N
)
Displacement (mm) Wall 1 Wall 2 Wall 3
Pull
Push
5.0 Experimental Results 72
Out-of-Plane Properties of Interlocking Compressed Earth Block Walls
even with a plaster coating, each cantilever wall exhibited a stiffness that was far lower
than predicted.
5.1.5 Moment-Curvature Response
Understanding the behavior of each cantilever wall is aided by analyzing the
moment-curvature relationship. By using the three sets of vertical LVDTs set at different
heights along the walls, see Figure R and Figure S, a total of nine Moment-Curvature
relationships were calculated. The calculation of curvature is found in Eq. 4. The
calculated moments that correspond to each curvature were taken as the measured load
multiplied by the distance from the applied load to the mid-height between levels of
sensors. For the bottom level of LVDTs, the moment was calculated as the measured
load, multiplied by the distance from the applied load to half the height of the bottom
LVDTs.

5.0 Experimental Results 73
Out-of-Plane Properties of Interlocking Compressed Earth Block Walls
Figure FF – Experimental Moment-Curvature Envelope Curves
-2500
-2000
-1500
-1000
-500
0
500
1000
1500
2000
2500
-0.0005 -0.00025 3.9E-18 0.00025 0.0005 0.00075 0.001
Mom
ent
(N-m
)
Curvature (1/mm)
Bot. Mid. Top
Pull
Push
(a) Wall 1
-2500
-2000
-1500
-1000
-500
0
500
1000
1500
2000
2500
-0.0005 -0.00025 3.9E-18 0.00025 0.0005 0.00075 0.001
Mom
ent
(N-m
)
Curvature (1/mm)
Bot. Mid. Top
Pull
Push
(b) Wall 2
-2500
-2000
-1500
-1000
-500
0
500
1000
1500
2000
2500
-0.0005 -0.00025 3.9E-18 0.00025 0.0005 0.00075 0.001
Mom
ent
(N-m
)
Curvature (1/mm)
Bot. Mid. Top
Pull
Push
(c) Wall 3

5.0 Experimental Results 74
Out-of-Plane Properties of Interlocking Compressed Earth Block Walls
Figure FF, a), b), c) show the observed moment-curvature relationship in each
wall as recorded by each of the vertical LVDTs previously mentioned. As shown, the
results from Walls 1 and 2 are similar in nature. The relationships of Wall 2 are very
similar along the height of the wall, meaning that at each height where measured, the
moment-curvature relationship did not change. This similarity is ideal for beam
mechanics. Wall 1, however, had varying relationships along its height. For Wall 1, the
moment-curvature relationship shows that more rotation occurred at the top LVDTs when
subjected to equal moments. Wall 3 shows more strength at each curvature amplitude
than the other two walls. Again, the moment-curvature relationships varied along the
height of the wall, with the curvature concentrated at the base. More rotation at the base
is attributed to the cracking resistance achieved by the plaster.

5.0 Experimental Results 75
Out-of-Plane Properties of Interlocking Compressed Earth Block Walls
5.2 Full Scale Walls
Each of the two full scale wall tests was accomplished without error. The loading
patterns, hysteretic behaviors, observed cracking patterns, failure modes, and displaced
shapes of each wall are presented and compared in the following sections.
5.2.1 Wall 4: Full Scale Prismatic Wall
Wall 4 was designed to provide data on the performance of prismatic ICEB walls
(walls without stiffening members such as pilasters). The mid-height moment at any
given total actuator load was calculated using a simply supported beam with four equal
point loads applied, see Appendix C. The loading sequence was then calculated to best
observe the expected performance of Wall 4. This loading sequence can be found in
Table 10. For Wall 4, Δn in Table 10 was found to equal 93 mm.
Table 10 - Wall 4 Loading Sequence
Step Actuator Force
(N)
Mid-Height
Moment (N-m)
Mid- Height
Displacement
1 200 72 -
2 400 144 -
3 800 288 -
4 1500 540 -
5 2000 720 -
6 3000 1080 -
7 4000 1440 -
8 5000 1800 Δ 2/3
9 - - Δ 2/3 x 1.5 = Δn
10 - - 2 Δn

5.0 Experimental Results 76
Out-of-Plane Properties of Interlocking Compressed Earth Block Walls
Figure GG - Wall 4 Force-Displacement Response
The hysteretic behavior of Wall 4 is presented in Figure GG. The performance of
Wall 4 was similar to the previous walls, in that the ICEB wall was able to withstand
large displacements while continuing to resist load. Similar to the results from the
cantilever wall tests, Wall 4 proved to be significantly more flexible than the ACI
prediction. However, as Table 11 shows, Wall 4 was not able to meet or exceed the
predicted nominal flexural strength. An asymmetric displacement in the loading tree was
observed during the experiment and was confirmed by the displaced shape of the wall
near the end of the test (See Figure JJ). This possibly resulted in uneven loading that
0
1000
2000
3000
4000
5000
6000
7000
8000
9000
10000
0 25 50 75 100 125
To
tal
Forc
e (N
)
Displacement (mm)
Fn = 8689 N

5.0 Experimental Results 77
Out-of-Plane Properties of Interlocking Compressed Earth Block Walls
could have contributed to Wall 4 not being able to meet the predicted nominal flexural
strength.
Table 11 – Wall 4 ACI 530 vs. Experimental Results at Mid-Height
Mcr (N-m) Mn (N-m) Δcr (mm) Δn (mm)
Predicted ACI 530 1358 3128 7.9 23.0
Experimental 542.5 2940 11.7 106
Figure HH - Wall 4 Rebar Strain vs. Displacement
Wall 4 was flexure dominated, with a cracking pattern that was consistent with
that found in Wall 1 and Wall 2. Grout cracks formed in the dry-stack joint between
ICEB courses. These cracks began at the mid-height of the wall and continued to
propagate both above and below mid-height joints as the loading increased. The push
0
400
800
1200
1600
2000
0 20 40 60 80 100 120
Str
ain (
Mic
ro S
trai
ns)
Mid-Height Displacement (mm)
Left Rebar Right Rebar Yield Strain

5.0 Experimental Results 78
Out-of-Plane Properties of Interlocking Compressed Earth Block Walls
cycles were ended when a large crack created instability at the base of the wall. In the
fourth ICEB course from the base, a vertical crack split through the ICEBs, separating the
section of ICEB that was in tension from the rest of the ICEB and the grout keys. Figure
II shows this vertical crack near the end of the test. As testing continued, the steel
reinforcement inside the wall appeared to be slipping out of the bottom three courses.
Once the wall began to slide away from these bottom courses, the testing was concluded.
Analysis of the stain gauge data, Figure HH, showed that significant yielding occurred
before failure. Therefore, it can be assumed that the observed flexural resistance of the
wall would not have significantly increased had the test been continued.
The type of crack and the location of the crack indicate that the load distribution
was weighted more heavily near the base of the wall. Also, the connection between the
base and the wall was not adequate for this experiment. The crack in Figure II is located
just below the final loading point, the steel hollow steel section. This location on the wall
also was where the added U-shaped rebar, see Figure U, began. It should also be noted
that the length of vertical U-bar legs were about 38 cm, shorter than the lap splice length
determined for Wall 2. It is clear that the loading caused the two reinforcing bars to slide
past each other, instead of working together. To mitigate this problem, a concrete beam
with rebar embedded, similar to the detail used at the top of Wall 4, would have
constrained the vertical rebar from slipping and would likely have prevented this failure.

5.0 Experimental Results 79
Out-of-Plane Properties of Interlocking Compressed Earth Block Walls
Figure II - Vertical Crack in Wall 4
Figure JJ - Wall 4 Displaced Shape
0
20
40
60
80
100
120
140
160
180
0 400 800 1200 1600 2000 2400
Dis
pla
cem
ent
(m
m)
Height Along Wall (mm)
Δ = 33.5 mm Δ = 50.0 mm Δ = 64.8 mm Δ = 98.0 mm Δ = 122.0 mm Δ = 154.5 mm
Base Top

5.0 Experimental Results 80
Out-of-Plane Properties of Interlocking Compressed Earth Block Walls
The displaced shapes at the final six target displacements are shown in Figure JJ.
The curves show a generally parabolic shape in the wall up until the mid-span
displacement reached 98 mm. A comparison of the measured displacement at 400 mm
high and 2000 mm high shows that at the 98 mm and above test cycles, the wall began to
displace more at the base. Using simple beam mechanics, if the load distribution was
equal throughout the experiment, the displacement readings at 400 mm and 2000 mm
should be equal throughout the test. The final displaced shape shows the extent of the
failure at the base. As shown the displacement reading at the 400 mm height is
approximately equal to that of the 1600 mm height.
5.2.2 Wall 5: Full Scale Pilaster Wall
Wall 5 was designed to provide data on the performance of ICEB walls with a
stiffening member, a pilaster. The loading sequence found in Table 12 was calculated to
best observe the performance of Wall 5. For Wall 5, Δn in Table 12 was found to equal
16.5 mm.
Wall 5 was unable to achieve the predicted flexural strength. Again, the load
distribution from the loading tree could have contributed to this behavior. However,
another factor in the difference between the predicted nominal flexural strength and the
experimental strength is the fact that Wall 5 exhibited shear failure or lap splice failure
towards the base. As seen in Figure KK, in the excursion to a total force of 17499 N, the
stiffness begins to degrade at an increasing rate. Visual inspection showed that the
cracking started to form at a shearing force of 8.7 kN, or a total force of 17400 N, at a

5.0 Experimental Results 81
Out-of-Plane Properties of Interlocking Compressed Earth Block Walls
mid-height displacement of 10.9 mm. Significant strength degradation occurred at a total
force of 26940 N. A comparison between the actual and ACI predicted strengths and
deflections is found in Table 13.
Table 12 - Wall 5 Loading Sequence
Step Actuator Load
(N)
Mid-Height
Moment (N-m)
Mid-Height
Displacement
1 500 180 -
2 1000 360 -
3 1500 540 -
4 2000 720 -
5 3000 1080 -
6 5000 1800 -
7 8000 2880 -
8 10000 3600 -
9 12000 4320 -
10 15000 5400 -
11 17300 6228 Δ 2/3
12 - - Δ 2/3 x 1.5 = Δn
13 - - 1.5 Δn
14 - - 2 Δn
15 - - 2.5 Δn
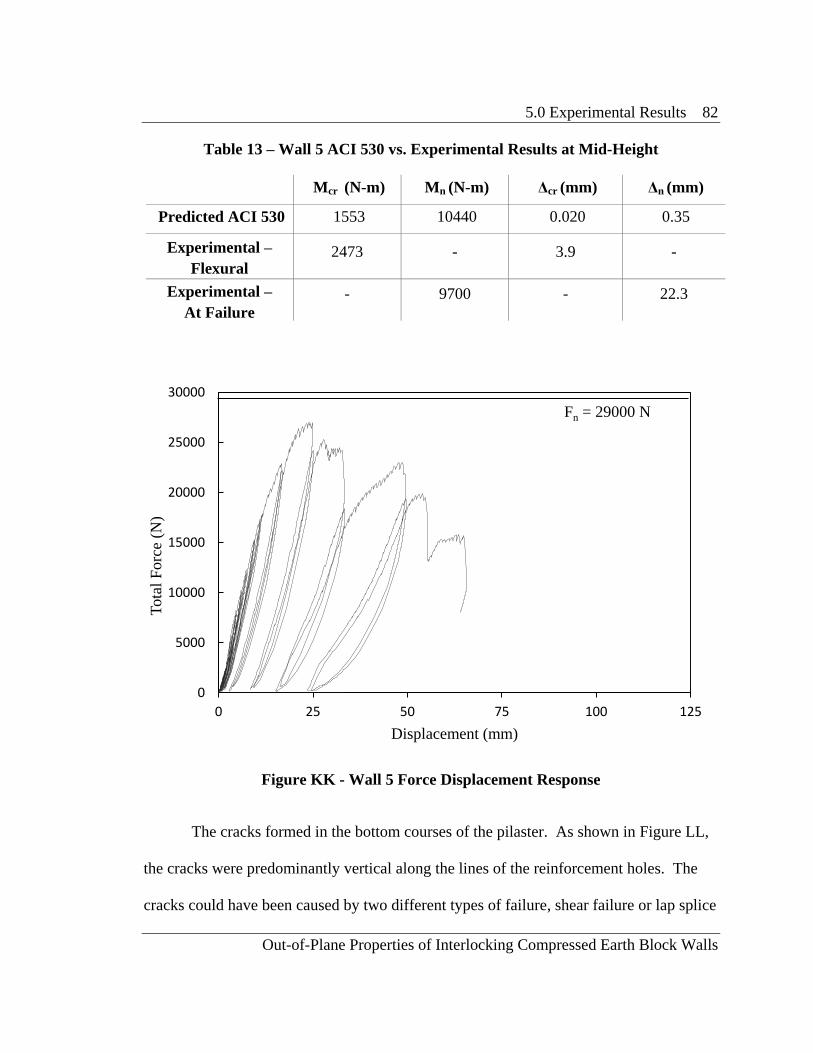
5.0 Experimental Results 82
Out-of-Plane Properties of Interlocking Compressed Earth Block Walls
Table 13 – Wall 5 ACI 530 vs. Experimental Results at Mid-Height
Mcr (N-m) Mn (N-m) Δcr (mm) Δn (mm)
Predicted ACI 530 1553 10440 0.020 0.35
Experimental –
Flexural 2473 - 3.9 -
Experimental –
At Failure
- 9700 - 22.3
Figure KK - Wall 5 Force Displacement Response
The cracks formed in the bottom courses of the pilaster. As shown in Figure LL,
the cracks were predominantly vertical along the lines of the reinforcement holes. The
cracks could have been caused by two different types of failure, shear failure or lap splice
0
5000
10000
15000
20000
25000
30000
0 25 50 75 100 125
Tota
l F
orc
e (N
)
Displacement (mm)
Fn = 29000 N

5.0 Experimental Results 83
Out-of-Plane Properties of Interlocking Compressed Earth Block Walls
failure. A shear failure could have been one type of failure most likely caused by
inadequate spacing of the reinforcement ties. The current masonry codes prescribe tie
spacing to be no more than the depth of the member. For Wall 5, the ties were spaced at
400 mm, while the depth of the pilaster was 300 mm. Therefore, the failure could have
been attributed to this difference. Another possibility is that de-bonding occurred in the
lap splice area at the bottom of the wall. A lap splice failure makes the grout core split as
the reinforcement deforms and slides against each other, eventually causing the blocks to
split as shown in Figure LL. Further research into the shear strength of ICEB walls and
lap splice behavior is necessary for further ICEB development.
Figure LL - Wall 5 Cracks and Uplift

5.0 Experimental Results 84
Out-of-Plane Properties of Interlocking Compressed Earth Block Walls
Figure MM - Wall 5 Rebar Strain vs. Displacement
Two strain gauges were placed in Wall 5 at mid-height, one on a tension rebar and
one on a compression rebar. As shown in Figure MM, the compression strain gauge
showed sporadic strains that showed no regular pattern of stress. The tension gauge did
show strains in a regular pattern. However, the strain data for the pilaster test shows that
yielding of the tension steel only just began at the point of stiffness degradation due to
cracking near the base. Since no significant yielding was observed, Wall 5 was not
flexure dominant.
Along with the cracks, uplift began between the first and second block layers.
The vertical reinforcement and surrounding grout began to separate from the first layer of
ICEBs. The uplift is shown in Figure LL. The wall began to slide away from the base,
similar to in the final pushes of Wall 4. Once the uplift created instability in the wall, the
0
400
800
1200
1600
2000
2400
0 10 20 30 40 50 60 70
Str
ain (
Mic
ro S
trai
ns)
Mid-Height Displacement (mm)
Tension Rebar Compression Rebar Yeild Strain

5.0 Experimental Results 85
Out-of-Plane Properties of Interlocking Compressed Earth Block Walls
experiment concluded. This uplift shows that the construction technique used at the base
could have been improved by restraining the rebar from lifting away from the base by
welding or other connection.
Figure NN - Wall 5 Displaced Shape
The displaced shapes for the six largest displacement excursions are shown in
Figure NN. Similar to Wall 4, a possibly uneven load distribution created asymmetric
displaced shapes. At around the Δ = 24.8 mm displaced shape, a significant difference
between the 400 mm high and 2000 mm high displacement readings begin to show. The
sliding effect due to the uplift previously mentioned subsequently created larger
displacements at the bottom.
0
10
20
30
40
50
60
70
80
90
0 400 800 1200 1600 2000 2400
Posi
tion o
n W
all
(mm
)
Displacement (mm)
Δ = 10.9 mm Δ = 16.5 mm Δ = 24.8 mm Δ = 33.0 mm Δ = 49.5 mm Δ = 66.0 mm
Base Top

5.0 Experimental Results 86
Out-of-Plane Properties of Interlocking Compressed Earth Block Walls
5.2.3 Comparison
Comparing the results from Wall 4 and Wall 5 provides insight into the
effectiveness of adding a stiffening element to a prismatic wall. Enveloping curves of
each wall’s performance are compared in Figure OO. Comparing the effective stiffness
of each wall, i.e. the slope of the line drawn from zero to the displacement at peak
strength, the pilaster is shown to increase the stiffness by over 16 times the flat wall.
Therefore, the pilaster in Wall 5 increased the out-of-plane wall stiffness significantly
and confirms the beneficial effect of using pilasters to control the out-of-plane
displacement.
Figure OO - Enveloping Comparison of Hysteretic Behavior of Full Scale Walls
0
5000
10000
15000
20000
25000
30000
0 25 50 75 100 125
Tota
l F
orc
e (N
)
Displacement (mm)
Wall 4 Wall 5
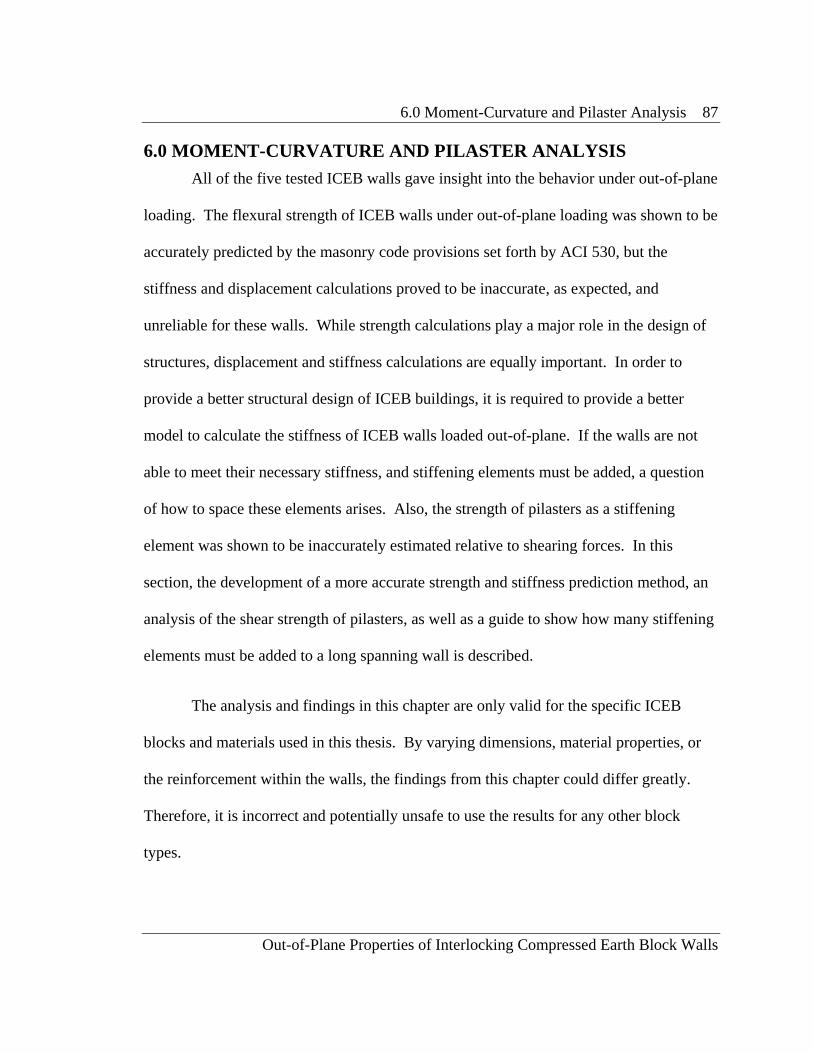
6.0 Moment-Curvature and Pilaster Analysis 87
Out-of-Plane Properties of Interlocking Compressed Earth Block Walls
6.0 MOMENT-CURVATURE AND PILASTER ANALYSIS
All of the five tested ICEB walls gave insight into the behavior under out-of-plane
loading. The flexural strength of ICEB walls under out-of-plane loading was shown to be
accurately predicted by the masonry code provisions set forth by ACI 530, but the
stiffness and displacement calculations proved to be inaccurate, as expected, and
unreliable for these walls. While strength calculations play a major role in the design of
structures, displacement and stiffness calculations are equally important. In order to
provide a better structural design of ICEB buildings, it is required to provide a better
model to calculate the stiffness of ICEB walls loaded out-of-plane. If the walls are not
able to meet their necessary stiffness, and stiffening elements must be added, a question
of how to space these elements arises. Also, the strength of pilasters as a stiffening
element was shown to be inaccurately estimated relative to shearing forces. In this
section, the development of a more accurate strength and stiffness prediction method, an
analysis of the shear strength of pilasters, as well as a guide to show how many stiffening
elements must be added to a long spanning wall is described.
The analysis and findings in this chapter are only valid for the specific ICEB
blocks and materials used in this thesis. By varying dimensions, material properties, or
the reinforcement within the walls, the findings from this chapter could differ greatly.
Therefore, it is incorrect and potentially unsafe to use the results for any other block
types.

6.0 Moment-Curvature and Pilaster Analysis 88
Out-of-Plane Properties of Interlocking Compressed Earth Block Walls
6.1 Moment Curvature Analysis
In order to design ICEB buildings, the behavior and performance of ICEB walls
during out-of-plane loading must be accurately predicted. While the results from all five
tested walls show that the nominal flexural strength can be accurately predicted using the
ACI 530 masonry code, the stiffness estimations of these walls were proven to be
significantly higher than the actual values. The out-of-plane stiffness must be correctly
calculated in order to provide a safe structural design.
A major contribution to wall failure can be the P-Delta effect. This effect
amplifies the flexural load in a wall that grows proportionally with the amount of
deflection of the wall. Gravity loading creates an additional moment in the column or
wall in addition to the lateral force causing the initial displacement. Displacements then
increase from this P-Delta effect, which creates a compounding effect. In order to keep
the P-Delta effect low, the displacement allowed in walls must be limited. ACI 530
suggests a drift limit of 0.7% in order to limit the lateral deflection to a position where the
wall returns to its original vertical position when the lateral load is removed. This 0.7%
limit will be applied to the out-of-plane ICEB walls for this thesis. The drift limit is
applied per the ACI 530 standard, to the displacement at mid-height of the wall, and is
calculated as the total height of wall multiplied by 0.007.
A more accurate prediction of deflections in a wall is achieved by understanding
and quantifying the Moment-Curvature relationship for a given wall. For any given

6.0 Moment-Curvature and Pilaster Analysis 89
Out-of-Plane Properties of Interlocking Compressed Earth Block Walls
material and cross-section, the Moment-Curvature relationship can be used to accurately
predict the force displacement response for any given loading.
6.1.1 Cantilever Wall Moment-Curvature Results
As previously discussed in Chapter 5.0, the cantilever wall tests provide insight
into the Moment-Curvature relationship for ICEB walls under out-of-plane loading. The
three Moment-Curvature relationships for Wall 1, Wall 2, and Wall 3 are shown in Figure
FF. Each plot is shown as enveloping curves for clarity. By using these relationships, a
more accurate model of force displacement for ICEB walls can be calibrated.
6.1.2 Moment-Curvature Relationship Computation
The calculation of a Moment-Curvature relationship is derived from cross-
sectional statics, see Figure PP. The strain profile of any given cross-section, under
multiple strains allows for computational analysis forming a Moment-Curvature
relationship. By using a spreadsheet program, the curvatures and corresponding
moments can be calculated for any material. The process will be discussed in this
section.

6.0 Moment-Curvature and Pilaster Analysis 90
Out-of-Plane Properties of Interlocking Compressed Earth Block Walls
Figure PP – Strain Profile for Moment Curvature Analysis
The spreadsheet used for ICEB analysis allows the user to input the material and
cross-sectional properties of the member to be analyzed. The depth of the member is the
divided into multiple slices, and the area and depth of the centroid of each slice is
calculated. For any given strain at the extreme compression fiber, an average strain is
applied through linear interpolation to each slice. Using a user-defined stress strain
relationship, the strain of each section is turned into a stress. This stress is then
multiplied by the area of the section to create a force. The forces from all these slices are
used to determine the moment by multiplying the force by the depth of centroid.
Appendix B contains sample calculations for one point on the moment-curvature
relationship.
Concurrently, a similar process is occurring for the reinforcing steel in the
member. The user inputs the steel properties and the location and size of each steel
member. A strain, stress, force, and moment are then assigned to each reinforcement bar.
As
Mi
εi σi
Φi
c

6.0 Moment-Curvature and Pilaster Analysis 91
Out-of-Plane Properties of Interlocking Compressed Earth Block Walls
The spreadsheet uses an iterative process by changing the “c” value on Figure PP so that
the sum of the axial forces is equal to the axial load applied to the member. This axial
load is also user defined. The resisting moments and corresponding curvature is recorded
for each strain step. This process is run for multiple extreme compression fiber strains to
form the Moment-Curvature relationship.
A cracking moment and curvature was calculated using Equation 5. The
curvature at the moment of cracking is calculated as the cracking moment divided by the
modulus of elasticity (E) and the gross cross sectional moment of inertia (I). Appendix B
also contains a sample calculation for this point on the moment-curvature relationship.
6.1.3 Moment-Curvature Spreadsheet Check
In order to verify the moment-curvature spreadsheet conforms to the theory set
forth by similar, previous analyses, a moment-curvature design example from Brandow,
Ekwueme, and Hart (2006) was input into the program. The moment and curvature
values given by the program were then checked against the example’s values at various
strain values for accuracy.
Example 5.2.2 and example 5.2.3 of Brandow, Ekwueme, and Hart (2006) show a
beam 32 inches deep and 7.625 inches wide fully grouted with 0.4 in2 of grade 60
reinforcement centered 28 inches down from the top of the beam. The beam is fully
grouted, the masonry compressive strength (f’m) is given as 1500 psi, and the modulus of
elasticity (E) is equal to 900f’m. The moments and curvatures are found at six different
loading patterns. These loading values are determined as at the maximum compressive

6.0 Moment-Curvature and Pilaster Analysis 92
Out-of-Plane Properties of Interlocking Compressed Earth Block Walls
strain values equal to 0.0005, 0.0015, 0.002, and 0.0025 as well at the loading that causes
cracking and then yielding in the reinforcement. The assumed stress strain relationship
for these examples is a bi-linear function where the stress linearly climbs from the origin
to f’m at a strain equal to 0.0015. The stress then declines linearly to 0.5f’m
corresponding to a strain equal 0.0025. Finally, it is assumed that the rupture stress for
cracking is set to 200 psi.
By using the moment-curvature spreadsheet developed for this thesis, the input
parameters from the examples were entered. The moment-curvature relationship was
then calculated for each of the maximum compressive strains as well as cracking and
yielding loads. Cracking and yielding loads are defined per the masonry code, as the load
that induce cracking across the section and the load that creates yielding in the extreme
tension reinforcement, respectively. Table 14 below shows the comparison between the
examples’ relationships and the relationship found by the spreadsheet program.
Table 14 – Moment-Curvature Spreadsheet Check
Strain Value or
Limit State
Brandow, Ekwueme, & Hart
(2006) Moment-Curvature Spreadsheet
Moment (k-ft) Curvature (in
-1) Moment (k-ft) Curvature (in
-1)
Cracking 21.7 0.0000092 21.7 0.0000092
0.0005 31.29 0.0000639 31.03 0.0000628
Yield 50.77 0.000103 51.03 0.000103
0.0015 53.16 0.000358 53.20 0.000357
0.002 53.43 0.000567 53.43 0.000566
0.0025 53.11 0.000716 53.13 0.000716

6.0 Moment-Curvature and Pilaster Analysis 93
Out-of-Plane Properties of Interlocking Compressed Earth Block Walls
As the results from the comparison show, the spreadsheet is able to calculate the
moment-curvature relationship accurately for a given cross-section at any load or
compressive strain value. The differences in the comparison are attributed to the two
differences in stress-strain relationships. The masonry stress in the program increases at
a faster rate than in the example problems, which is shown by the moment-curvature
values at a strain of 0.0005. The strain hardening effect of the reinforcement comes in
later for strain values of 0.002 and 0.0025. However, these effects are more accurate to
actual conditions, and are needed for this thesis.
6.1.4 Calculated ICEB Moment-Curvature Relationship
By entering the material properties of ICEBs, and the cross sectional properties of
Wall 1 and Wall 2, a Moment-Curvature relationship was calculated. The material
properties include the width, thickness, reinforcement area, reinforcement depth, and
modulus of elasticity of the masonry. For the ICEB walls, the stress-strain relationship
determined in Figure P and Equations 1 and 2 was used. Figure QQ shows the stress-
strain relationship for the vertical steel reinforcement in each ICEB wall. The
relationship used the experimentally determined yield stress of 338 MPa, with a standard
modulus of elasticity (E) of 200,000 MPa.
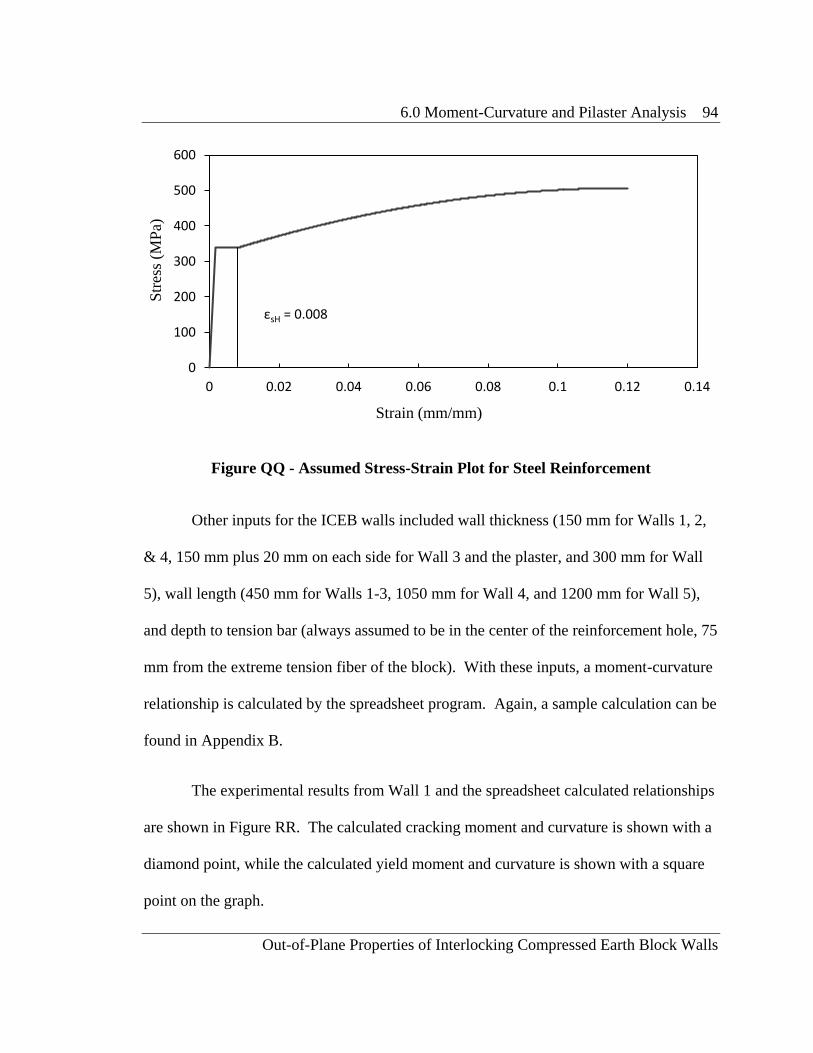
6.0 Moment-Curvature and Pilaster Analysis 94
Out-of-Plane Properties of Interlocking Compressed Earth Block Walls
Figure QQ - Assumed Stress-Strain Plot for Steel Reinforcement
Other inputs for the ICEB walls included wall thickness (150 mm for Walls 1, 2,
& 4, 150 mm plus 20 mm on each side for Wall 3 and the plaster, and 300 mm for Wall
5), wall length (450 mm for Walls 1-3, 1050 mm for Wall 4, and 1200 mm for Wall 5),
and depth to tension bar (always assumed to be in the center of the reinforcement hole, 75
mm from the extreme tension fiber of the block). With these inputs, a moment-curvature
relationship is calculated by the spreadsheet program. Again, a sample calculation can be
found in Appendix B.
The experimental results from Wall 1 and the spreadsheet calculated relationships
are shown in Figure RR. The calculated cracking moment and curvature is shown with a
diamond point, while the calculated yield moment and curvature is shown with a square
point on the graph.
0
100
200
300
400
500
600
0 0.02 0.04 0.06 0.08 0.1 0.12 0.14
Str
ess
(MP
a)
Strain (mm/mm)
εsH = 0.008

6.0 Moment-Curvature and Pilaster Analysis 95
Out-of-Plane Properties of Interlocking Compressed Earth Block Walls
Figure RR – Wall 1 Moment-Curvature Comparison
The comparison between the cantilever wall results and the initial spreadsheet
calculation shows that the ICEB walls exhibit more curvature for a given moment. It is
clear from this comparison that the ICEBs are more flexible that the moment-curvature
analysis program determines.
In order to predict a more accurate moment-curvature relationship of dry-stacked
ICEB walls for out-of-plane loading, two factors were investigated: the cracked section
properties and the dry-stack joint gaps. As illustrated in Figure SS, the section properties
0
500
1000
1500
2000
2500
0 0.0001 0.0002 0.0003 0.0004 0.0005 0.0006 0.0007 0.0008
Mom
ent
(N-m
)
Curvature (1/mm)
1-Top 1-Mid 1-Bot
Final Spreadsheet Initial Spreadsheet

6.0 Moment-Curvature and Pilaster Analysis 96
Out-of-Plane Properties of Interlocking Compressed Earth Block Walls
of the ICEB wall before cracking should not be taken from the gross section. Since the
ICEBs are dry-stacked onto each other, there is no tensile restraint provided by the
uplifting end of the blocks. In traditional mortared masonry, mortar creates a tensile
restraint throughout the entire block. For this reason, when calculating the gross moment
of inertia (Ig) and the gross section modulus (Sn), the depth of the wall is assumed to be
2/3 times the overall depth. For Wall 1 and Wall 2, this would mean the effective depth
of the wall is 100 mm, instead of 150 mm.
Figure SS - Cracking Section Comparison
Additionally, the inherent gaps in the dry-stack joints allow for more rotation of
each block, without adding more flexural restraint. By taking an estimated average gap
thickness per joint, a constant additional curvature can be added to the curvatures found
by the moment-curvature spreadsheet. A table of gap sizes for a 150 mm wide, 100 mm
tall block and the additional curvatures they bring is found in Table 15.
Only Grout
Core Resists
Cracking
Mortared
Joint and
Grout Core
Resists
Cracking Mortared
Masonry ICEB Walls
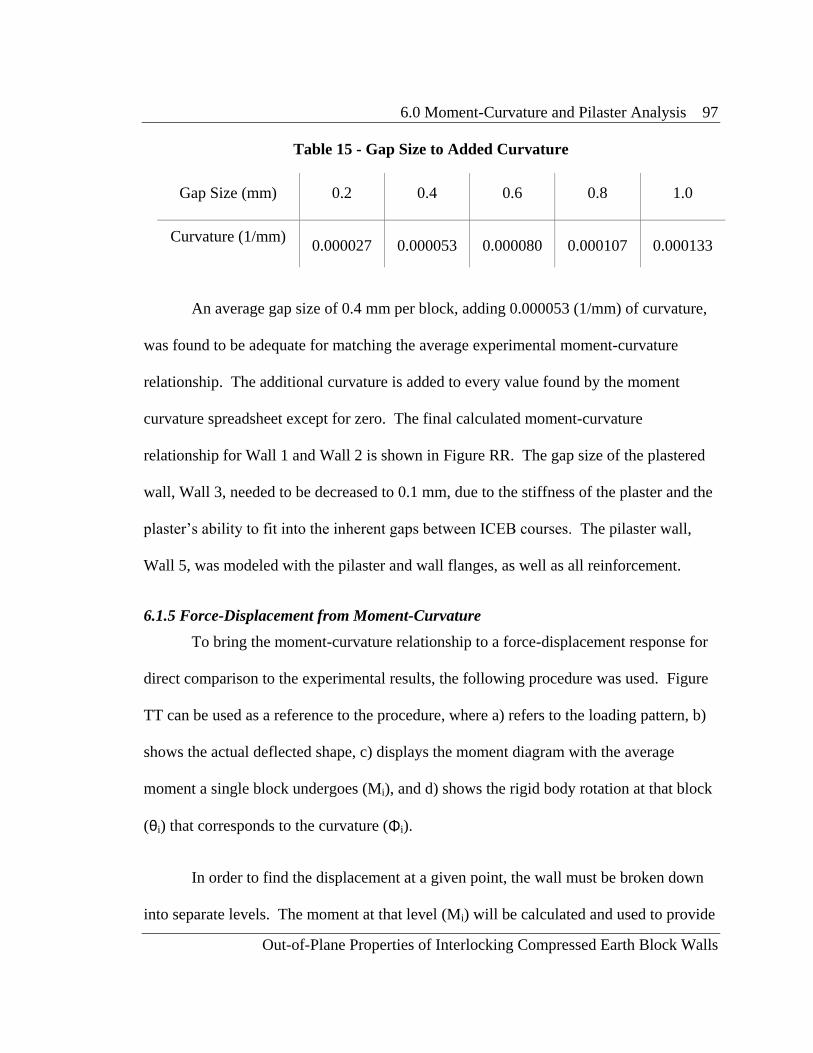
6.0 Moment-Curvature and Pilaster Analysis 97
Out-of-Plane Properties of Interlocking Compressed Earth Block Walls
Table 15 - Gap Size to Added Curvature
Gap Size (mm) 0.2 0.4 0.6 0.8 1.0
Curvature (1/mm) 0.000027 0.000053 0.000080 0.000107 0.000133
An average gap size of 0.4 mm per block, adding 0.000053 (1/mm) of curvature,
was found to be adequate for matching the average experimental moment-curvature
relationship. The additional curvature is added to every value found by the moment
curvature spreadsheet except for zero. The final calculated moment-curvature
relationship for Wall 1 and Wall 2 is shown in Figure RR. The gap size of the plastered
wall, Wall 3, needed to be decreased to 0.1 mm, due to the stiffness of the plaster and the
plaster’s ability to fit into the inherent gaps between ICEB courses. The pilaster wall,
Wall 5, was modeled with the pilaster and wall flanges, as well as all reinforcement.
6.1.5 Force-Displacement from Moment-Curvature
To bring the moment-curvature relationship to a force-displacement response for
direct comparison to the experimental results, the following procedure was used. Figure
TT can be used as a reference to the procedure, where a) refers to the loading pattern, b)
shows the actual deflected shape, c) displays the moment diagram with the average
moment a single block undergoes (Mi), and d) shows the rigid body rotation at that block
(θi) that corresponds to the curvature (Φi).
In order to find the displacement at a given point, the wall must be broken down
into separate levels. The moment at that level (Mi) will be calculated and used to provide

6.0 Moment-Curvature and Pilaster Analysis 98
Out-of-Plane Properties of Interlocking Compressed Earth Block Walls
a corresponding curvature value (Φi). For all of the tested walls, the levels were made
from each course of blocks. In this way, the cantilever walls all had 10 levels of
calculated values. Using the a load value and the distance from beam end to the centroid
of the selected block level, a moment can be calculated that equals the average moment in
that level of ICEBs.
Figure TT - Force-Displacement from Moment-Curvature
With a moment value (Mi) and the moment-curvature relationship found by the
programmed spreadsheet, a curvature value (Φi) can be found using linear interpolation
between two found points on the spreadsheet. These curvatures are turned into rotations
(θi) by multiplying them by the height (hi) of the layer they represent. In this case the
height (hi) is equal to 100 mm. Using beam mechanics, this rigid body rotation can be
translated into a displacement (Δi) measured at the end of the cantilever walls, or the
center of the simply supported, full scale walls. By summing these rigid body rotation
a) b) c) d)
hi
Δ = ΣΔi
Mi
Δi
Θi = Φi hi

6.0 Moment-Curvature and Pilaster Analysis 99
Out-of-Plane Properties of Interlocking Compressed Earth Block Walls
based displacements for each layer of ICEBs, a total displacement is found. By varying
the load, this process can be done repeatedly for each wall and recorded as a predicted
force-displacement response.
For walls with pin-pin boundary conditions, Wall 4 and Wall 5, the process is
similar. The moment diagram changes with the different loading, and in order to find the
displacement at mid-height, only half of the wall height is used when adding the rigid
body rotations because of symmetric loading.
Figure UU shows the predicted and experimentally based force-displacement
responses for all walls. Figure UU (a) graph shows the responses for the cantilever
walls, while Figure UU (b) shows the responses for the full scale walls. These plots show
close correlation between the predicted and the experimental responses. The
displacements and the flexural strengths are predicted with acceptable accuracy. This
indicates that using the moment-curvature relationship derived for ICEB walls suitably
predicts the stiffness and strength of flexure dominated ICEB walls under out-of-plane
loading.
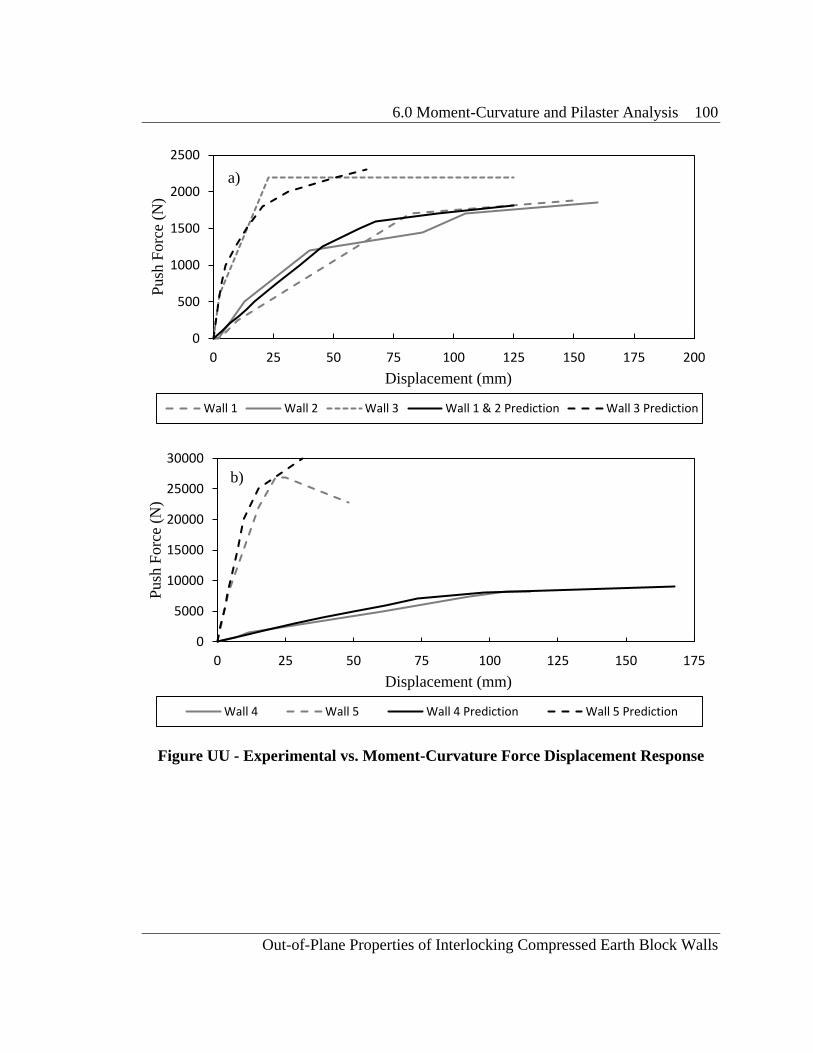
6.0 Moment-Curvature and Pilaster Analysis 100
Out-of-Plane Properties of Interlocking Compressed Earth Block Walls
Figure UU - Experimental vs. Moment-Curvature Force Displacement Response
0
500
1000
1500
2000
2500
0 25 50 75 100 125 150 175 200
Push
Forc
e (N
)
Displacement (mm)
Wall 1 Wall 2 Wall 3 Wall 1 & 2 Prediction Wall 3 Prediction
a)
0
5000
10000
15000
20000
25000
30000
0 25 50 75 100 125 150 175
Push
Forc
e (N
)
Displacement (mm)
Wall 4 Wall 5 Wall 4 Prediction Wall 5 Prediction
b)
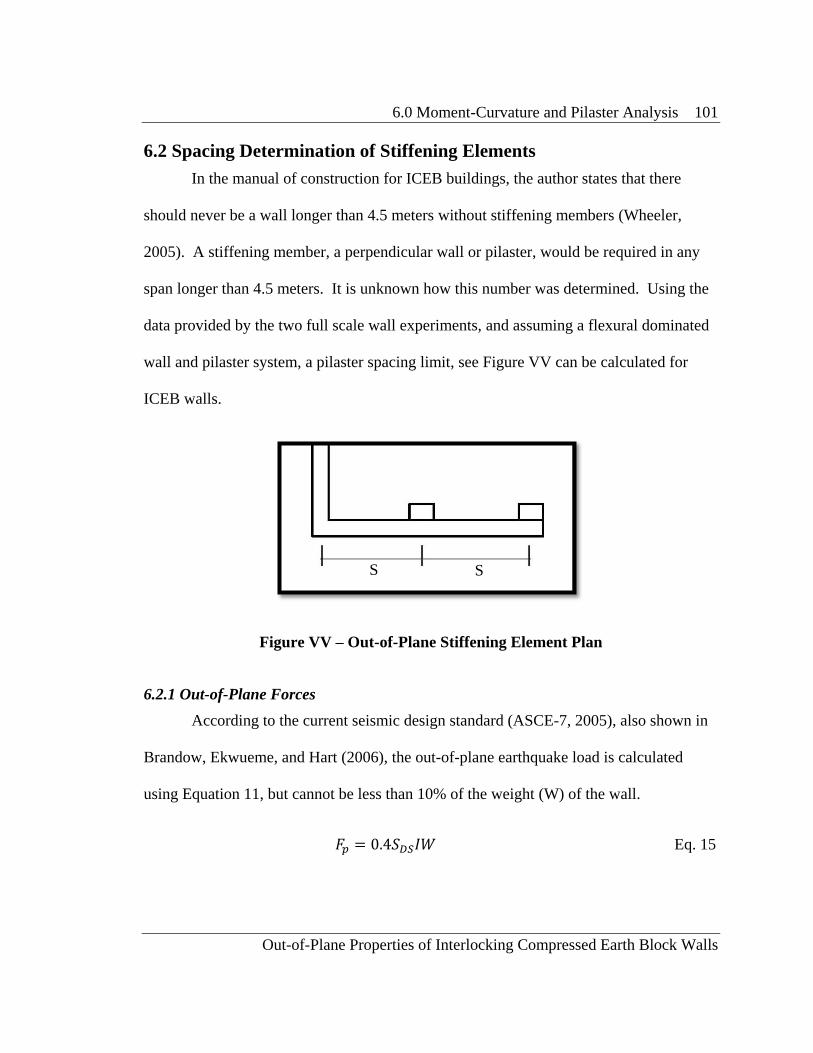
6.0 Moment-Curvature and Pilaster Analysis 101
Out-of-Plane Properties of Interlocking Compressed Earth Block Walls
6.2 Spacing Determination of Stiffening Elements
In the manual of construction for ICEB buildings, the author states that there
should never be a wall longer than 4.5 meters without stiffening members (Wheeler,
2005). A stiffening member, a perpendicular wall or pilaster, would be required in any
span longer than 4.5 meters. It is unknown how this number was determined. Using the
data provided by the two full scale wall experiments, and assuming a flexural dominated
wall and pilaster system, a pilaster spacing limit, see Figure VV can be calculated for
ICEB walls.
Figure VV – Out-of-Plane Stiffening Element Plan
6.2.1 Out-of-Plane Forces
According to the current seismic design standard (ASCE-7, 2005), also shown in
Brandow, Ekwueme, and Hart (2006), the out-of-plane earthquake load is calculated
using Equation 11, but cannot be less than 10% of the weight (W) of the wall.
Eq. 15
S S

6.0 Moment-Curvature and Pilaster Analysis 102
Out-of-Plane Properties of Interlocking Compressed Earth Block Walls
The density of fully grouted ICEBs was found to be an average of 18 kN/ m3. The
calculated load is distributed over the area of the wall. For all cases being investigated in
this thesis, the wall thickness is one block or 0.15 m thick. The average weight (W) per
area can therefore be calculated as 2.7 kN/m2. The importance factor (I) will be taken as
1.0 for the calculations in this thesis. The final values for load per area therefore depends
on the value for the design spectral response acceleration parameter at short periods (SDS),
which is a value calculated using seismic data for the location of the structure. Values
vary from location to location, therefore a range of SDS values will be included in the
spacing analysis of stiffening elements.
6.2.2 Pilaster Performance
In order to determine the spacing requirements of stiffening elements such as
pilasters, the strength of the members themselves must first be checked against the
demand. Where an intersecting wall acts as a stiffener, each intersecting wall must be
checked to ensure adequate strength. In the case of a standard, one block pilaster, like the
one built into Wall 5, analysis can be done to show that for various wall heights and
various pilaster spacing, the pilaster can perform successfully during typical earthquake
accelerations.
One or more limit states for the pilasters must be chosen to best provide a safe and
stable structure during an earthquake. The results from Wall 4 and Wall 5 (see Figure
WW) show that Wall 4 and Wall 5 could meet the deflection limit before the maximum
flexural strength is exceeded. Therefore, the calculation for allowable load on a pilaster

6.0 Moment-Curvature and Pilaster Analysis 103
Out-of-Plane Properties of Interlocking Compressed Earth Block Walls
will be based on the theoretical flexural strength and the allowable drift limit of 0.7%
from the International Conference of Building Officials (ICBO) (see Section 2.3). The
drift limit will ensure no point on the wall will be able to displace, in the out-of-plane
direction, more than 0.7% of the wall height, while the flexural strength limit will
constrain the pilaster to essentially elastic behavior.
Special consideration is needed for typical ICEB buildings due to methods of
construction. At the top of most ICEB walls, a simple concrete beam is cast on top of the
wall. Typical roofing members only connect to the ICEB at the pilasters or corners of the
walls. Because of this condition, the tributary area of the pilaster must include the top
portion of wall, between pilasters, see Figure XX. The tributary area is assumed to start
at the base, at a 45 degree angle, until the two points meet. The spacing of the pilasters
determines where the 45 degree angle lines will meet along the height of the wall, and
will vary the pattern and magnitude of the load. For analysis of the pilaster’s ability to
withstand a seismic event, the height and spacing must both be variables. Also, a fixed-
pinned support condition is assumed, removing any partial fixity the pilaster may have at
the top of the wall while assuming a fully fixed base.

6.0 Moment-Curvature and Pilaster Analysis 104
Out-of-Plane Properties of Interlocking Compressed Earth Block Walls
Figure WW - Full Scale Walls with Drift Limit
0
5000
10000
15000
20000
25000
30000
0 25 50 75 100 125
Tota
l F
orc
e (N
)
Displacement (mm)
0
5000
10000
15000
20000
25000
30000
0 25 50 75 100 125
Tota
l F
orc
e (N
)
Displacement (mm)
0.7% Drift = 16.8 mm
0.7% Drift = 16.8 mm Vn
Vn

6.0 Moment-Curvature and Pilaster Analysis 105
Out-of-Plane Properties of Interlocking Compressed Earth Block Walls
Figure XX – Tributary Area of Pilaster When H = S
Figure YY - Pilaster Tributary Area and Loading When H = S
The calculation of allowable load under the drift limit of 0.7% uses the moment-
curvature spreadsheet developed in Section 6.1 to calculate the largest acceptable SDS
value for a given wall height. The pilaster was also restricted by its flexural strength. By
using the moment-curvature relationship and the loading diagram shown in Figure YY,
an allowable SDS for each wall height is produced. Figure ZZ shows the distribution of
Tributary Area
S
H/2
H
45°
Wall Load Pilaster Load

6.0 Moment-Curvature and Pilaster Analysis 106
Out-of-Plane Properties of Interlocking Compressed Earth Block Walls
allowable SDS values for the ICEB pilaster configuration used in this thesis, at various
heights of walls at three spacing values. The spacing values used were equal to half the
height, 1.5 times the height, and equal to the height. It can be seen that in order to
achieve the drift limit or flexural strength of the pilaster, large SDS values (larger than 1.0)
must be applied. Today, ICEB walls in single story construction are typically about 2400
mm tall. Therefore, it is highly unlikely that the accelerations will be high enough to
cause flexural failure or large displacements in a pilaster of the proportions investigated
herein.
Figure ZZ - Allowable Accelerations for Pilasters
6.2.3 Deflection Based Limitation for Pilaster Spacing
As all five walls tested in this thesis has shown, the ICEB walls are much more
flexible than other types of masonry. Due to this increased flexibility, the walls would
likely meet the allowable deflection limit prior to yielding. Therefore, analysis was
0
2
4
6
8
10
12
14
2000 2200 2400 2600 2800 3000 3200
All
ow
able
SD
S (
g's
)
Wall Height (mm)
S = H S = H/2 S = 1.5H
SDS = 5.4
2400 mm

6.0 Moment-Curvature and Pilaster Analysis 107
Out-of-Plane Properties of Interlocking Compressed Earth Block Walls
performed to determine the maximum pilaster spacing in order to limit the deflections to
0.7% of the story height.
Using boundary conditions that consider the most conservative types of walls
found in typical single story construction, a simplified model for deflection can be made.
For a deflection based analysis for an ICEB wall panel, the top of the wall will remain
free, while the sides and bottom of the wall will remain fixed. The wall is loaded with a
uniform load across the entire area of the wall.
A comparison of displaced shapes between a wall and a horizontal strip is shown
in Figure AAA using a finite element analysis program. The finite element model uses
plate elements that are of a unit thickness. The pilasters on each side were modeled as an
area of double thickness. As the deflected shapes shows, the largest displacement occurs
at the top of the wall, mid-span between the two pilasters (designated by the brightest
shade of white), and is adequately matched by the horizontal strip.

6.0 Moment-Curvature and Pilaster Analysis 108
Out-of-Plane Properties of Interlocking Compressed Earth Block Walls
Figure AAA - Deflected Shape and Comparison of Wall Panel and Horizontal Strip

6.0 Moment-Curvature and Pilaster Analysis 109
Out-of-Plane Properties of Interlocking Compressed Earth Block Walls
In order to simplify the analysis of a wall in double bending as shown in the
figure below, some assumptions must be made. The finite element model was used to
check various simplified models, in order to closely match the deflection found in the
original analysis from Figure AAA . By using the computer analysis program, it was
found that in all cases where the height to spacing ratio was between 1/1 and 1/2, the
maximum displacement could be found within 25% of the displacement calculated in a
full wall model, using a model of just a horizontally spanning strip of wall of equal
stiffness. Various spacing vs. height displacements using the finite element models are
compared in Table 16. Although most cases shown in Table 16 show the strip method is
not conservative for displacement based design, this analysis method provides adequate
insight into the wall displacement between pilasters. From this analysis, in order to
calculate the maximum pilaster spacing using the 0.7% displacement limit, a beam
analysis of a horizontally spanning wall section could be used. The 0.7% displacement
limit will still be used to check the out-of-plane displacement against 0.7% of the total
wall height.
Table 16 – Finite Element Model Displacement Comparison
Aspect Ratio
(H/S)
Displacement % Difference
Full Wall Strip (L=S)
1/1 195 185.7 5.0
4/5 185 185.7 -0.4
3/5 169 185.7 -9.9
1/2 145 185.7 -22.7

6.0 Moment-Curvature and Pilaster Analysis 110
Out-of-Plane Properties of Interlocking Compressed Earth Block Walls
An assumption must be made to determine the maximum spacing of pilasters
using the model described above. It must be assumed that the moment-curvature
relationship of a horizontal strip of ICEB wall is has the same basic behavior as a vertical
strip of ICEB wall. The vertical relationship was experimentally tested during this thesis
and analytically determined in Section 6.1. By using the moment-curvature spreadsheet
for ICEB walls, and by providing the reinforcement spacing for a horizontal strip of wall,
the maximum displacement of the horizontal strip can be determined for any given load.
For the analysis of pilaster spacing, it is assumed that the end restraints of the horizontal
strip of wall are fixed. Therefore, the moment diagram embedded into the spreadsheet
was changed for this fixed-fixed support condition.
For the deflection based calculation of pilaster spacing, the height and earthquake
acceleration values are both input parameters. Heights were varied from 2200 mm to
3000 mm in 200 mm steps. Earthquake acceleration, or SDS values were varied from 0.25
to 1.5 in 0.25 increments. By running the moment-curvature spreadsheet for all
variations of the two parameters, the maximum pilaster spacing for each was found.
Results are summarized in Figure BBB.

6.0 Moment-Curvature and Pilaster Analysis 111
Out-of-Plane Properties of Interlocking Compressed Earth Block Walls
Figure BBB - Maximum Pilaster Spacing from Displacement Based Analysis
The results from the displacement based analysis show only a slight difference in
allowable spacing when varying the height. The height was varied to show that the shape
of the maximum spacing curve remains the same as the maximum displacement value
(0.7% of the height) is increased. In places of high seismicity, where SDS values are equal
to or above 0.75, the results show that a maximum spacing of 3.0 to 3.5 meters is
necessary to limit the amount of displacement experienced during out-of-plane loading.
From this analysis, it is recommended that for all ICEB structures in earthquake regions,
there is no wall spanning 3.5 meters without a stiffening element.
2
2.5
3
3.5
4
4.5
5
0.25 0.5 0.75 1 1.25 1.5
Max
imum
Spac
ing (
m)
SDS Values
H = 2200mm H = 2400mm H = 2600mm
H = 2800mm H = 3000mm

6.0 Moment-Curvature and Pilaster Analysis 112
Out-of-Plane Properties of Interlocking Compressed Earth Block Walls
6.3 Pilaster Failure
As discussed in the experimental results of the full scale pilaster wall, section
5.2.2, the pilaster was unable to meets its nominal flexural strength due to cracks forming
at the bottom courses of the wall. These cracks could have been caused from failure in
the anchorage of the reinforcement to the base, shear failure in the masonry, or a
combination of the two.
A further look into the ACI 530 will be completed in this section to compare
predicted values to experimental values. The ACI 530 equations for shear strength are
shown in Section 4.4 as Eq. 12, 13, and 14.
By using equations 12, 13, and 14, the following values for nominal shear
strength can be calculated. See Appendix A for values used in this calculation.
Vnm = 21100 N Vns = 7830 N
Comparing these values to the 13470 N of shear that was observed at the failure of Wall
5, it is clear that the ACI 530 predicted does not adequately predict the shear behavior of
an ICEB pilaster. The predicted values combine for a greater shear strength than what
was observed.
For nominal shear strength of the steel reinforcement, the ACI 530 code requires
the spacing of shear reinforcing ties to be no greater than the depth of the member. The
pilaster was 300 mm in depth, so therefore the tie spacing should have been no greater
than 300 mm. The full scale pilaster wall, Wall 5, was built with ties every 400 mm, and

6.0 Moment-Curvature and Pilaster Analysis 113
Out-of-Plane Properties of Interlocking Compressed Earth Block Walls
was consequently not up to ACI 530 standards. Since the tie spacing did not meet the
code standards, the contribution of shear strength due to the steel cannot be taken into
effect. For all future ICEB buildings, the code limit of tie spacing should be enforced, at
a minimum, in order to avoid shear dominated behavior.
With the shear strength of the masonry as the only contributor to nominal shear
strength, the ICEB pilaster should have still been able to resist more force than the results
of Wall 5 shows. Therefore, the ACI 530 calculation for masonry shear strength does not
directly apply to ICEB walls. The masonry code over-predicts the contribution of shear
strength due to the ICEB masonry. Therefore, it is a recommendation of this thesis that
more research into the shear strength of ICEB walls and pilasters is needed to make a
more accurate calculation for shear strength.
7.0 Conclusion and Recommendations 114
Out-of-Plane Properties of Interlocking Compressed Earth Block Walls
7.0 CONCLUSION AND RECOMMENDATIONS
This thesis conducted experimental and analytical research on ICEB walls. A
total of five walls were tested in order to gain data on the performance of these walls
while under out-of-plane loading. Three cantilever walls, 1100 mm tall by 450 mm wide,
and two full scale, simply supported walls, 2400 mm tall by 1050 mm and 1200 mm wide
were built. The first cantilever wall was built as a basis for the other two cantilever
walls, as well as a method to predict the behavior of the full scale walls. The second and
third cantilever walls were constructed to separately test the influence of a reinforcement
lap-splice and a thick layer of plaster. The full scale walls were constructed to determine
the difference in performance between a wall with and without a pilaster. The hysteretic
behavior of each wall was recorded and compared to the ACI 530 code predicted values.
Analysis of the data was performed in order to meet the goals assigned for this
thesis. The main goal of calculating or predicting the out-of-plane stiffness and strength
of ICEB walls was met using moment-curvature analysis specifically made for the dry-
stack construction present with ICEBs. The spacing of pilasters or other stiffening
members was calculated using the aforementioned moment-curvature analysis combined
with a drift limit set in place by the ACI 530 code.
7.1 Experimental Results
Walls 1, 2, 3, and 4 all exhibited flexural dominated behavior. The steel
reinforcement in each wall yielded before the conclusion of each experiment.

7.0 Conclusion and Recommendations 115
Out-of-Plane Properties of Interlocking Compressed Earth Block Walls
Cracking in Walls 1, 2, 3, and 4 took place in the grout cores at the dry-stack joints
between courses of ICEBs. These cracks were predominantly horizontal, straight
across the plane of the joints.
Comparing each wall’s flexural strength predictions to the experimental results
shows that the ACI 530 analysis techniques work reasonably well in determining
the out-of-plane nominal flexural strength of ICEB walls.
The ACI 530 analysis for predicting the out-of-plane stiffness of ICEB walls proved
to be unsatisfactory for each wall. The code predicted a stiffness far higher than
experimentally observed.
The dry-stack joints left gaps in some cases between the courses of ICEBs. These
gaps significantly decreased the overall stiffness of the walls.
A comparison between the performance of Wall 1 and Wall 2 suggests the ACI 530
calculation for reinforcement lap-splice length is adequately transferable to use with
ICEB walls.
Wall 3, the cantilever wall with a plaster coating showed a strength and stiffness
higher than in Wall 1. The plaster was applied into the gaps between the dry-
stacked blocks, which allowed the plaster to control the rotations of the ICEBs due
to the dry-stack joints.

7.0 Conclusion and Recommendations 116
Out-of-Plane Properties of Interlocking Compressed Earth Block Walls
Comparing the full scale walls shows a dramatic increase of stiffness when a
pilaster is added.
Wall 5, the full scale wall with a pilaster developed cracks before the steel
reinforcement could yield. The behavior of Wall 5 indicates that shear strength and
lap bar strength must go under further review.
7.2 Analytical Results
A moment-curvature program developed for use in concrete design can be used to
predict the performance of ICEB walls loaded out-of-plane.
Two additional factors were added to the moment-curvature program for ICEB
design. The first took into account the fact that the blocks were dry-stacked by
using an effective depth of wall to be half of the total depth. This property was
used to find the cracking moment and corresponding curvature. The second factor
added a constant amount of curvature by suggesting that each block was allowed to
freely rotate by a set amount due to the inherent gaps in the dry-stack joints.
The shear strength of ICEB pilasters could be lower than predicted using the ACI
530 code. It is recommended that the maximum spacing of shear reinforcement ties
be limited to 0.3 m, or, in this case, one every three block courses. More shear
reinforcement could be required.
Although the maximum spacing of pilasters in a long spanning, slender wall is
determined by the load applied and the height of the wall, for ICEB construction, it

7.0 Conclusion and Recommendations 117
Out-of-Plane Properties of Interlocking Compressed Earth Block Walls
is recommended that there is no span of wall longer than 3.5 meters without a
pilaster or other stiffening member. In locations of high seismicity, a limit of 3.0
meters may be necessary to reduce damage.
7.3 Future Research Recommendations
It is the recommendation of this thesis that the following investigations take place
to further the development of ICEBs as a structural system.
The shear capacity of columns and pilasters must be investigated for members with
varying reinforcement ratios and spacing of shear reinforcing ties. A ductile failure
of ICEB walls under out-of-plane loading is preferred for these members.
Explorations into methods to reduce the gap size at the dry-stack joints would
reduce the amount of rotation added due to these joints. A decrease in rotation
would reduce the displacement of a wall and ultimately raise the allowable load on
ICEB walls.
The connection detail at the pinned base of walls 4 & 5, for future reinforced walls,
must be analyzed for uplift and for longitudinal reinforcement movement to avoid
premature failure.

References 118
Out-of-Plane Properties of Interlocking Compressed Earth Block Walls
REFERENCES
(ACI 530, 2008). Building Code Requirements & Specification for Masonry Structures.
American Concrete Institute, Farmington Hills, MI.
(AISC 315, 2005). Steel Construction Manual, 13th
Edition. American Institute of Steel
Construction Inc. Chicago, Il.
(Anand and Ramamurthy, 2005) Anand, K.B. and K. Ramamurthy. “Development and
Performance of Interlocking-Block Masonry.” Journal of Architectural
Engineering, June (2008). Web. 10 May 2011.
(Amrhein and Lee, 1984) Amrhein, James and Donald Lee. Design of Reinforced
Masonry Tall Slender Walls. Western States Clay Products Association, San
Francisco, CA (1984). Print.
(Bales et al., 2009) Bales, Cole, Caitlin Donahue, Mark Fischer, Amos Mellbom, and
Tyler Pearson. “Interlocking Compressed Earth Blocks: From Soils to
Structures.” Senior Project, California Polytechnic University of San Luis
Obispo, (2009). Print.
(Bland, 2011) Bland, David. “In-Plane Cyclic Shear Performance of Interlocking
Compressed Earth Block Walls.” Thesis. California Polytechnic University of
San Luis Obispo, (2011). Print.
(Brandow, Ekwueme, and Hart, 2006) Brandow, Gregg, Chukwuma Ekwueme, and Gary
Hart. 2006 Design of Reinforced Masonry Structures. Concrete Masonry
Association of California and Nevada (2006). Print.
(Ismail et al., 2011) Ismail, N., D. Lazzarini, P. Laursen, and J. Ingham. “Seismic
Performance of Face Loaded Unreinforced Masonry Walls Retrofitted using Post-
Tensioning.” Australian Journal of Structural Engineering, Vol. 11 No. 3. (2011)
(Jayasinghe and Mallawaarachchi, 2009) Jayasinghe, C. and R.S. Mallawaarachchi.
“Flexural Strength of Compressed Stabilized Earth Masonry Materials.”
Materials and Design, (30) 3859-3868. Elstevier. Web. 20 September, 2011.
(Lazzarini, 2009) Lazzarini, Daniel. “Seismic Performance of Unreinforced Masonry
Walls Retrofitted with Post-Tensioning Tendons.” Thesis. California Polytechnic
University of San Luis Obispo, (2009). Print.
References 119
Out-of-Plane Properties of Interlocking Compressed Earth Block Walls
(MacGregor and Wight, 2009) James G. MacGregor and James K. Wight. Reinforced
Concrete: Mechanics and Design. Fifth ed. Upper Saddle River, NJ: Prentice
Hall
(Maini, 2010) Maini, S. “Earthen Architecture in the World,” Auroville Earth Institute.
http://www.earth-auroville.com. Web. 12 April 2011
(Memari, Grossenbacher, and Iulo, 2008) Memari, Ali M., Steve V. Grossenbacher, and
Lisa D. Iulo. “In-plane and Out-of-plane Load Testing and Evaluation of
Sustainable Masonry Walls.” Papers Read at the Architectural Engineering
Institute Conference Held at Denver, CO September 24th
to 27th
, 2008. Print.
(Pave, 2007) Pave, R.O. “Strength Evaluation of Dry-Stack Masonry.” Thesis.
University of Witwatersrand, Jahannesburg, South Africa. Retrieved from
http://wiredspace.wits.ac.za/handle/10539/5691. Web. 10 June, 2011.
(Portland Cement Association, 2012) Portland Cement Association. “Cement and
Concrete Basics.” http://www.cement.org/basics. Web. 5 June 2012.
(Proto et al., 2010) Proto, C., Sanchez, D., Rowley, K., Thompson, R. “ICEB: Design
and Construction Manual.” Senior Project. California Polytechnic University of
San Luis Obispo, California (2010). Print.
(Stirling, 2011) Stirling, Bradley. “Flexural Behavior of Interlocking Compressed Earth
Block Shear Walls Subjected to In-Plane Loading.” Thesis. California
Polytechnic University of San Luis Obispo, (2011). Print.
(Vaculik et al., 2004) Vaculik, J., M.C. Griffith, B.M.E. Hogarth, and J. Todd. “Out-of-
Plane Flexural Response Tests Using Dry-Stack Masonry.” Proceedings of a
conference held by the Australian Earthquake Engineering Society, Mt. Gambier,
South Australia, 2004. Paper 18. Print.
(Walker, 1999) Walker, P. “Bond Characteristics of Earth Block Masonry.” Journal of
Materials in Civil Engineering, 11(1999), 249-256. Print.
(Wheeler, 2005) Wheeler, Geoffrey. Interlocking Compressed Earth Blocks Volume II.
Manual of Construction. Center for Vocational Building Technology, Thailand
(2005). Print.
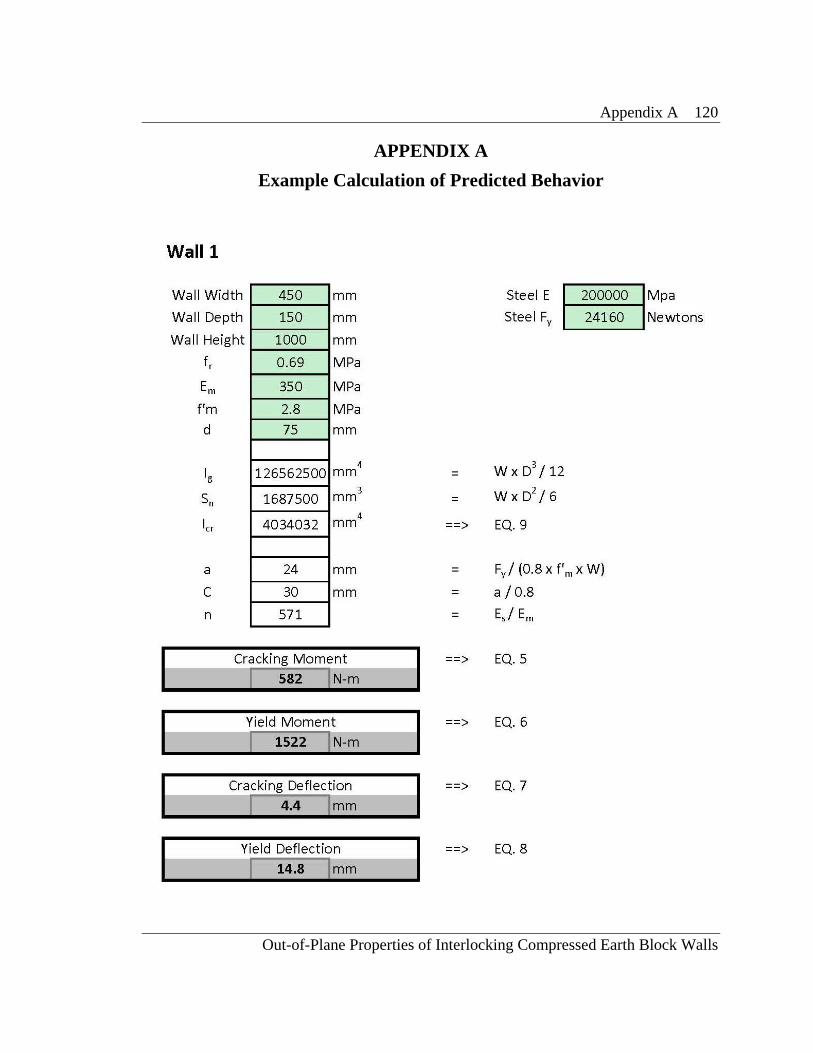
Appendix A 120
Out-of-Plane Properties of Interlocking Compressed Earth Block Walls
APPENDIX A
Example Calculation of Predicted Behavior
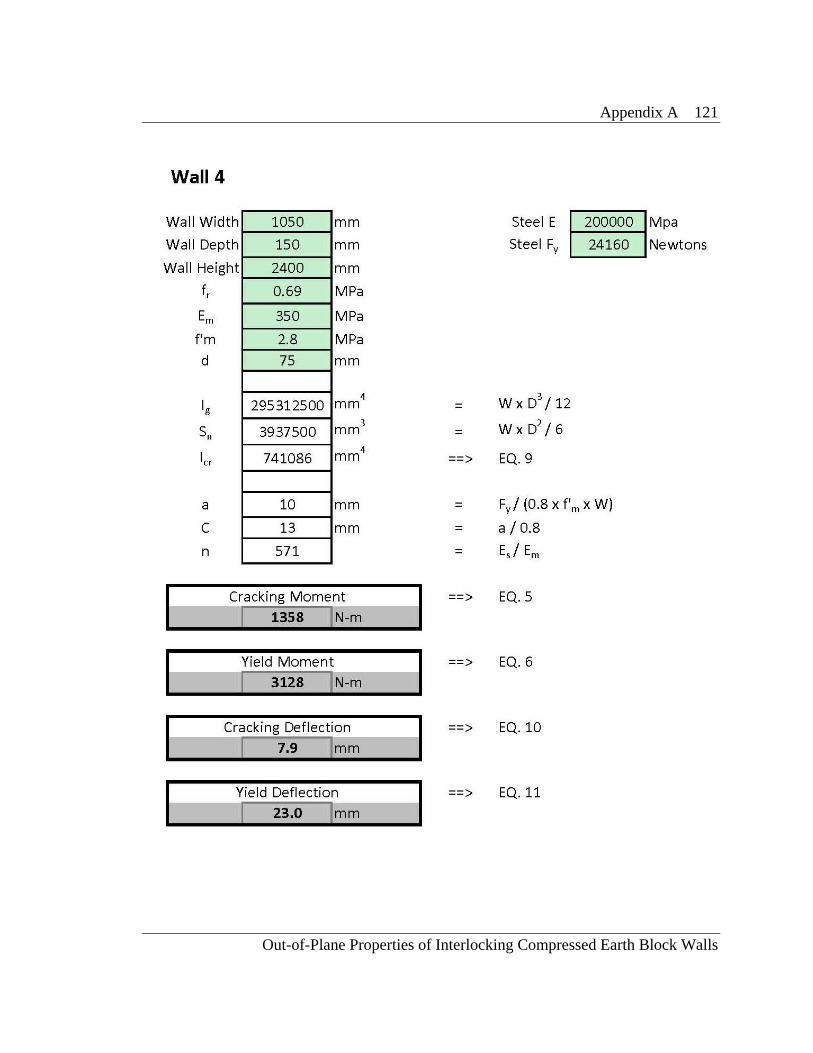
Appendix A 121
Out-of-Plane Properties of Interlocking Compressed Earth Block Walls

Appendix A 122
Out-of-Plane Properties of Interlocking Compressed Earth Block Walls

Appendix B 123
Out-of-Plane Properties of Interlocking Compressed Earth Block Walls
APPENDIX B
Example Calculation of Moment-Curvature Calculation
- Input for Wall 1 (Equal to Wall 2)

Appendix B 124
Out-of-Plane Properties of Interlocking Compressed Earth Block Walls
- Compressive Section Slice Properties and Lumped Mass Steel Properties
The thickness and area
are functions of the
amount of section cuts
prescribed in the input
section. The Y bar is the
distance from the
centroid of the section to
the extreme compression
fiber of the cross-section.
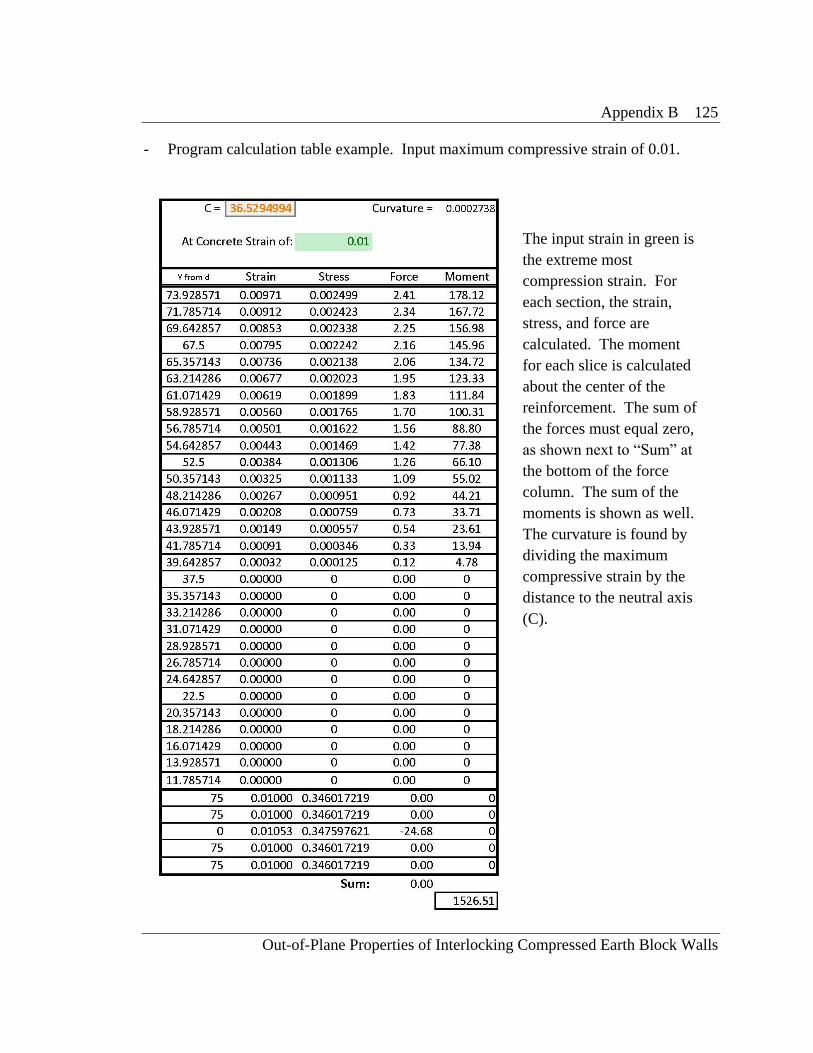
Appendix B 125
Out-of-Plane Properties of Interlocking Compressed Earth Block Walls
- Program calculation table example. Input maximum compressive strain of 0.01.
The input strain in green is
the extreme most
compression strain. For
each section, the strain,
stress, and force are
calculated. The moment
for each slice is calculated
about the center of the
reinforcement. The sum of
the forces must equal zero,
as shown next to “Sum” at
the bottom of the force
column. The sum of the
moments is shown as well.
The curvature is found by
dividing the maximum
compressive strain by the
distance to the neutral axis
(C).

Appendix B 126
Out-of-Plane Properties of Interlocking Compressed Earth Block Walls
- Program calculation table example. Steel at point of yield.
See notes on previous
page.

Appendix B 127
Out-of-Plane Properties of Interlocking Compressed Earth Block Walls
- Cracked Moment and Curvature input and calculation and ICEB gap thickness
calculation.
- Typical Output summary.
The cracking moment and
curvature values are
calculated as prescribed in
section 6.1.2.
The additional ICEB gap
thickness curvature value
is added to each curvature
calculated value, by using
two inputs: block height
and average gap thickness.
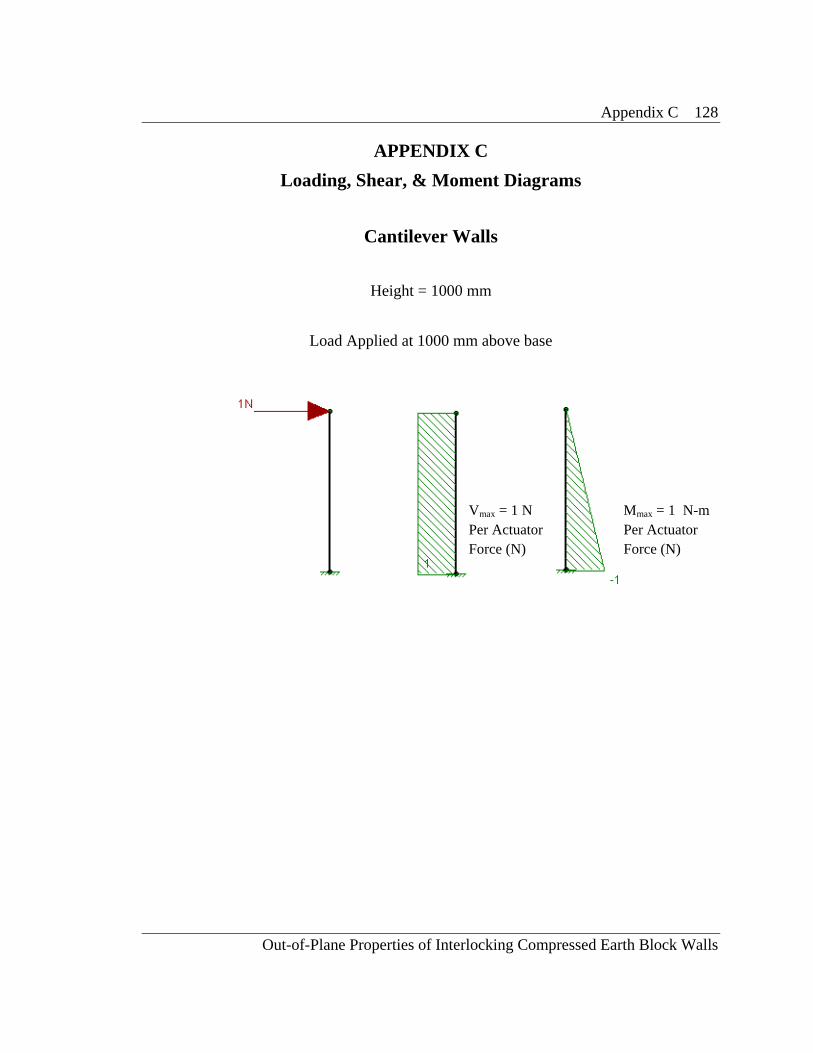
Appendix C 128
Out-of-Plane Properties of Interlocking Compressed Earth Block Walls
APPENDIX C
Loading, Shear, & Moment Diagrams
Cantilever Walls
Height = 1000 mm
Load Applied at 1000 mm above base
Mmax = 1 N-m
Per Actuator
Force (N)
Vmax = 1 N
Per Actuator
Force (N)

Appendix C 129
Out-of-Plane Properties of Interlocking Compressed Earth Block Walls
Full Scale Walls
Height = 2400 mm
Four Point Loads Applied at Equal Spacing
Mmax = 0.36 N-m
Per Actuator
Force (N)
Vmax = 0.5 N
Per Actuator
Force (N)