Embed Size (px)
Citation preview
Investigation of Methacrylic Acid at High Pressure using Neutron
Diffraction.
William G. Marshall,b Andrew J. Urquhart
c and Iain D.H. Oswald.
a*
aStrathclyde Institute of Pharmacy and Biomedical Sciences, University of Strathclyde, 161 Cathedral
Street, Glasgow, UK, G4 0RE. Tel: +441415482157. Email: [email protected]
bISIS Neutron and Muon Source, Science and Technology Facilities Council, Rutherford Appleton
Laboratory, Harwell Oxford, Didcot, Oxon, UK OX11 0QX.
cDepartment of Micro- and Nanotechnology, Building 345Ø, Ørsteds Plads, Technical University of
Denmark, 2800 Kgs. Lyngby, Denmark.
Abstract
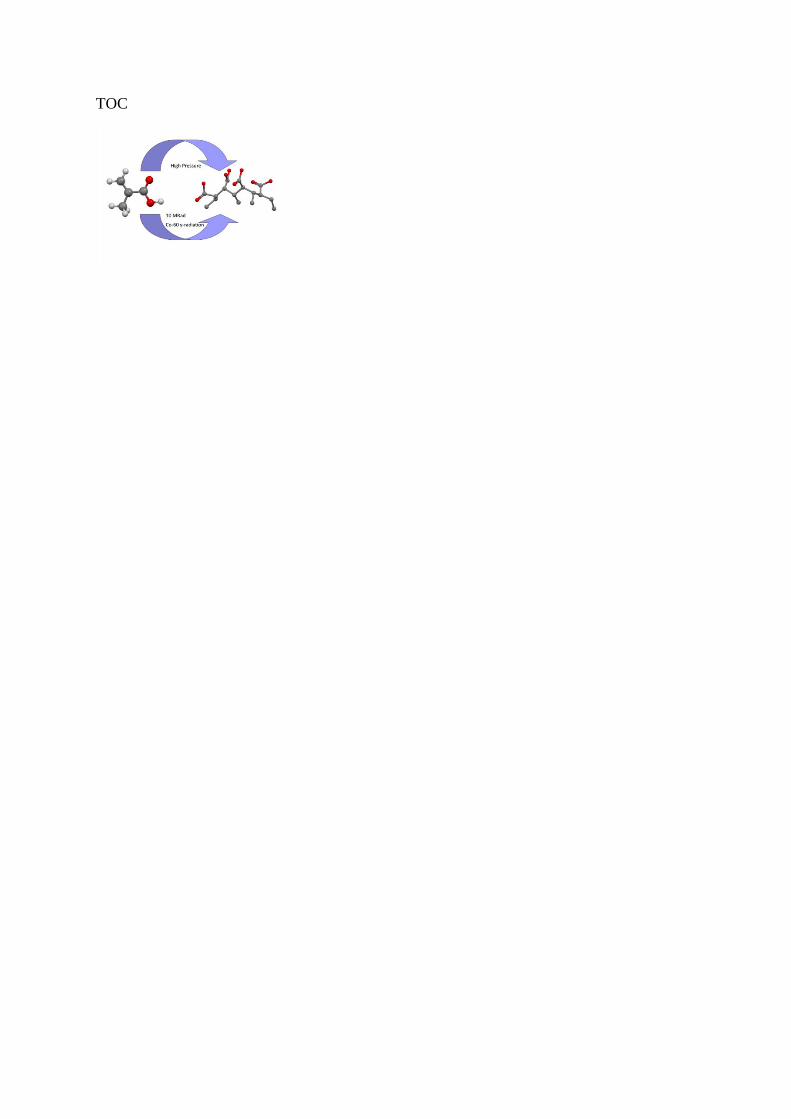
This article shows that pressure can be a low intensity route to the synthesis of
polymethacrylic acid. The exploration of perdeuterated methacrylic acid at high pressure
using neutron diffraction reveals that methacrylic acid exhibits two polymorphic phase
transformations at relatively low pressures. The first is observed at 0.39 GPa where both
phases were observed simultaneously and confirm our previous observations. This transition
is followed by a second transition at 1.3 GPa to a new polymorph that is characterised for the
first time. On increasing pressure the diffraction pattern of phase III deteriorates significantly.
On decompression phase III persists to 0.54 GPa before transformation to the ambient
pressure phase. There is significant loss of signal after decompression signifying that there
has been a loss of material through polymerisation. The orientation of the molecules in Phase
III provides insight into the possible polymerisation reaction.
Introduction
High pressure has been successfully used by a number of groups to create polymers from
monomeric species. These solid-state reactions have employed pressure alone or laser
irradiation under high pressure to achieve polymerisation.1 Polymorphism in these systems is
critical to the outcome of these reactions as the proximity of reaction centres in the crystal
structure (e.g. unsaturated bonds) will play a role in a) the ability of the polymerisation to
occur and b) the architecture or tacticity of the resulting polymer backbone. Systems that
have been investigated include ethylene2, benzene
3, co-crystalline materials such as
oxalamides and diiodobutadiyne4-5
and simple systems such as CO2.6 Further work has
extended the investigation of high-pressure polymerisation to ring systems such as L,L-
lactide7 and carnosine.
8
In this article, we continue our structural studies into the behaviour of small molecule
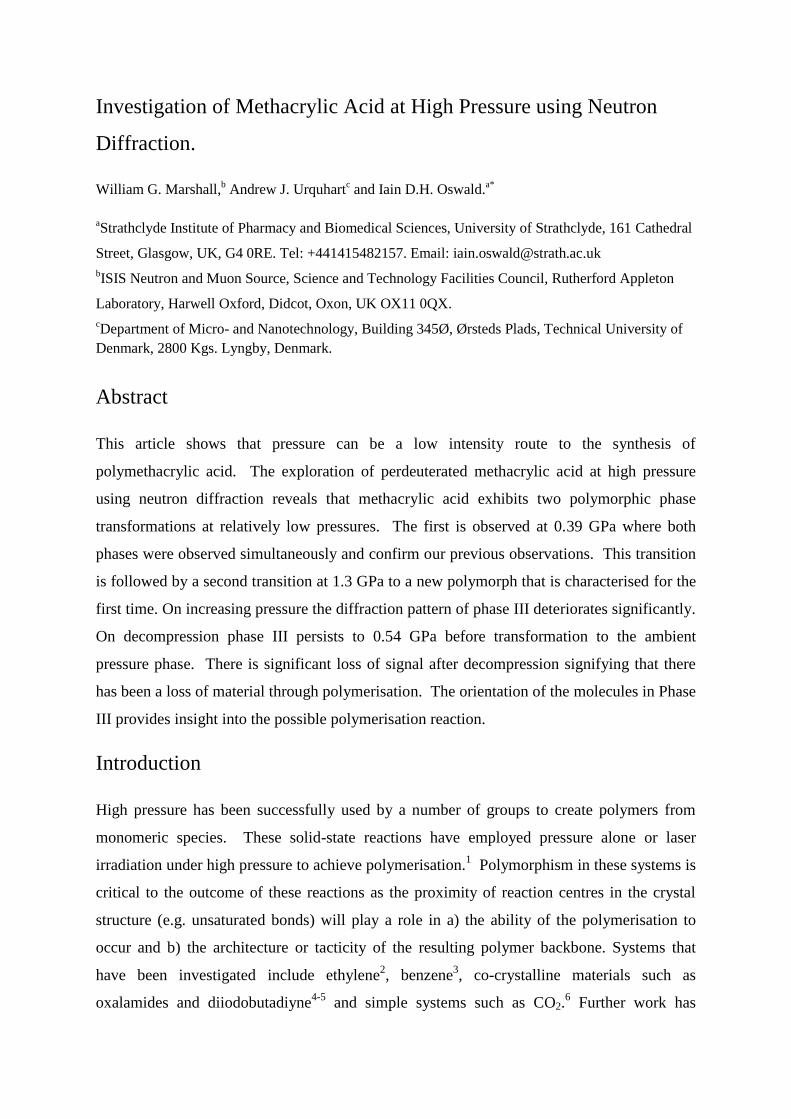
monomers by investigating the room-temperature behaviour of methacrylic acid (Scheme 1)
at high pressure using neutron diffraction. Methacrylic acid is a methylated derivative of
acrylic acid which we have previously studied.9-10
It is used as a precursor to methyl
methacrylate which forms polymethylmethacrylate (PMMA), one of the most widely used
thermoplastics in the world. Our interest in methacrylic acid is to observe the effects that the
addition of a methyl group close to the reactive moiety will have on the ability of the
compound to polymerise under pressure especially as steric effects become more important as
volume is reduced.11
We have previously investigated the structure of methacrylic acid-h6
under low temperature and high pressure conditions where we observed two different crystal
forms depending on the experimental conditions. Crystallisation of methacrylic acid via
cooling below its melting point of 287 K yielded one polymorph (Phase I). A second form
(Phase II) was isolated at high pressure (0.64 GPa with data collected at 1.5GPa) however
some initial neutron diffraction experiments suggested that further phases of methacrylic acid
existed that had not previously been isolated. Neutron diffraction is very useful for these
types of systems as our previous study of acrylic acid revealed that X-ray radiation from the
single crystal X-ray diffraction experiment may have started to cause the polymerisation;
neutrons did not have the same effect in acrylic acid allowing for a truer reflection of
structural changes occurring with respect to pressure as opposed to the probing radiation.9-10
In fact, syndiotactic polymethacrylic acid was created by irradiating a methacrylic acid
solution in 1-propanol with 10 Mrad of cobalt-60 γ-radiation therefore pressure may be an
avenue to create polymers of monomeric complexes that are difficult to create by ambient
pressure methods.12
Herein we present our work on the structural changes that occur in
methacrylic acid with respect to pressure and the subsequent polymerisation.
Scheme 1: Numbering scheme for methacrylic acid-d6
Experimental Section
Neutron Diffraction measurements
High-pressure neutron powder diffraction data were collected for methacrylic acid-d6
using the PEARL diffractometer13-14
at the UK spallation neutron source, ISIS, located at
the STFC Rutherford Appleton Laboratory. The procedures for the loading of the V3
Paris-Edinburgh press15
in the neutron experiment follow those in our previous paper on
acrylic acid-d4 and references therein.10
For this experiment zirconia-toughened alumina
anvils were used.16
The sample was first mixed with ~20% 4:1 methanol-d4:ethanol-d6
before being added dropwise using a glass capillary into a standard encapsulated null-
scattering Ti-Zr alloy gasket17
filled with loosely-packed ground silica wool, which was
used to inhibit the formation of large crystallites, and calcium fluoride as a pressure
marker.18
The methanol:ethanol mixture was used as a pressure-transmitting medium
(PTM) to provide quasi-hydrostatic conditions during the compression. Two loadings
were conducted on two separate visits to ISIS. The Time-of-flight (TOF) neutron powder
diffraction data were collected as per our previous work and analysed with Topas
Academic using a Z-matrix model parameterised in terms of the intramolecular bond
distances, angles and torsions and the molecular position and orientation.19
The starting
models were derived from our previous X-ray diffraction study.9 The DFT-optimised
structures (see below) were used to formulate restraints which were then applied to the
Rietveld refinements as described in ref 20
.
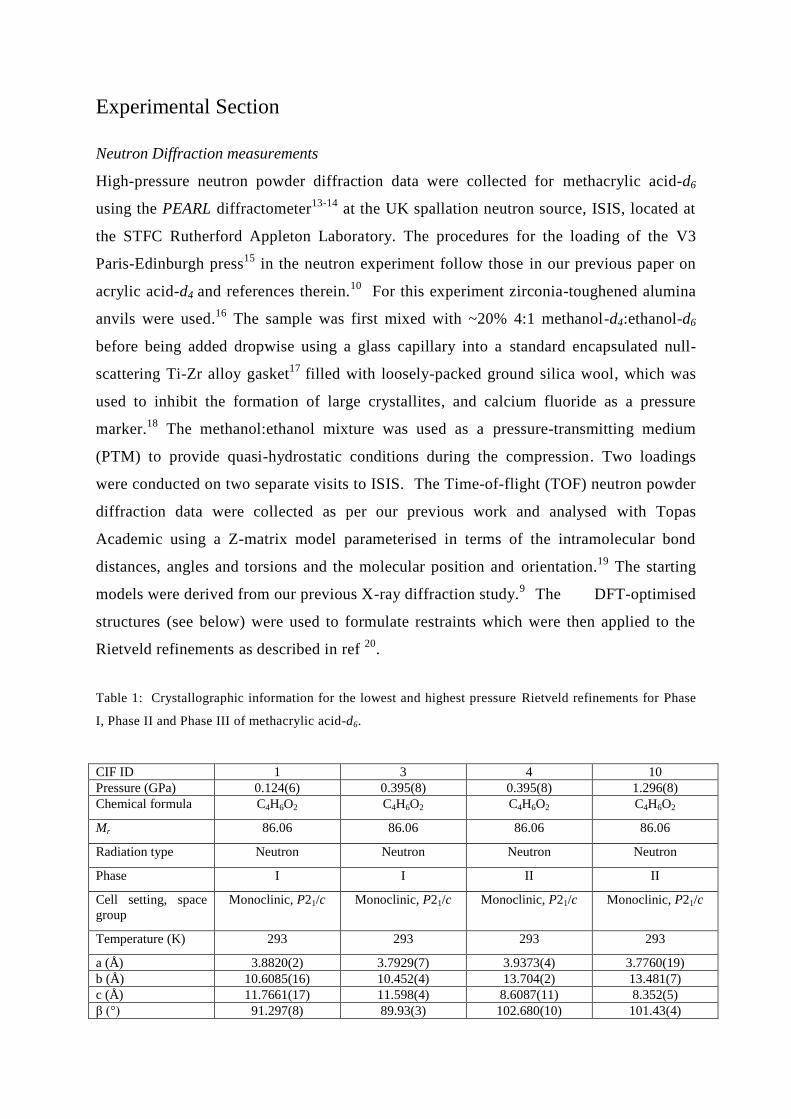
Table 1: Crystallographic information for the lowest and highest pressure Rietveld refinements for Phase
I, Phase II and Phase III of methacrylic acid-d6.
CIF ID 1 3 4 10
Pressure (GPa) 0.124(6) 0.395(8) 0.395(8) 1.296(8)
Chemical formula C4H6O2 C4H6O2 C4H6O2 C4H6O2
Mr 86.06 86.06 86.06 86.06
Radiation type Neutron Neutron Neutron Neutron
Phase I I II II
Cell setting, space
group
Monoclinic, P21/c Monoclinic, P21/c Monoclinic, P21/c Monoclinic, P21/c
Temperature (K) 293 293 293 293
a (Å) 3.8820(2) 3.7929(7) 3.9373(4) 3.7760(19)
b (Å) 10.6085(16) 10.452(4) 13.704(2) 13.481(7)
c (Å) 11.7661(17) 11.598(4) 8.6087(11) 8.352(5)
β (°) 91.297(8) 89.93(3) 102.680(10) 101.43(4)
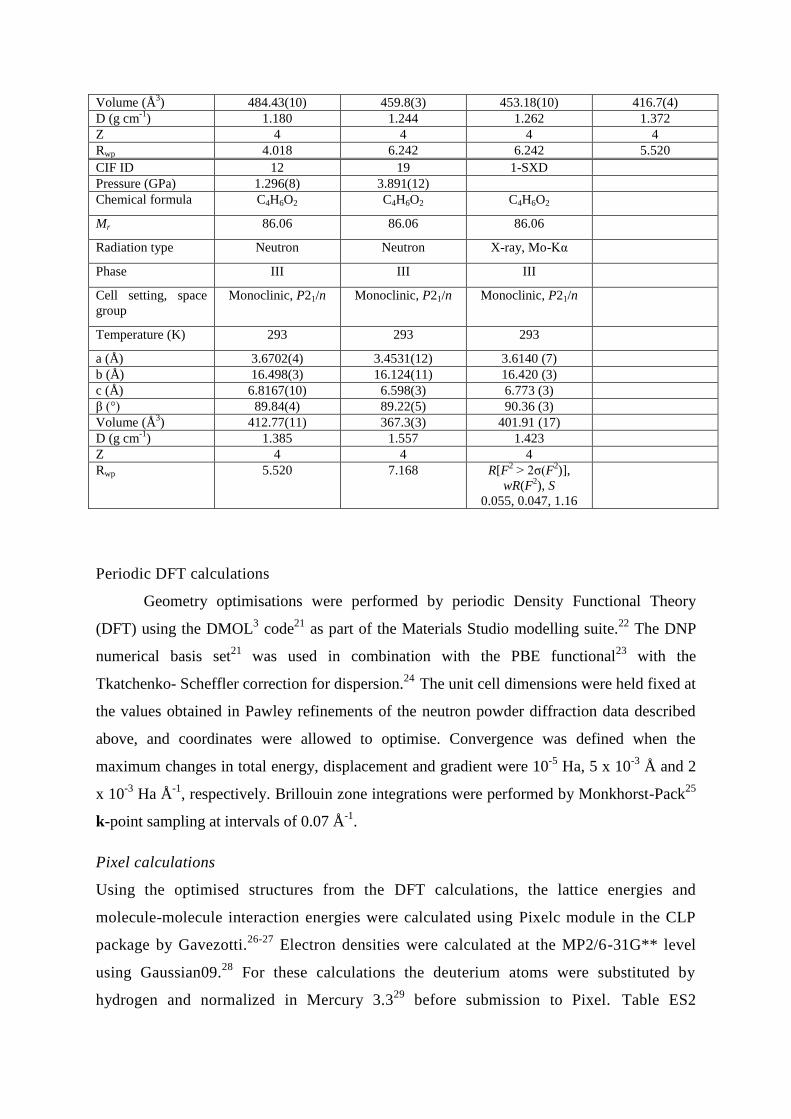
Volume (Å3) 484.43(10) 459.8(3) 453.18(10) 416.7(4)
D (g cm-1
) 1.180 1.244 1.262 1.372
Z 4 4 4 4
Rwp 4.018 6.242 6.242 5.520
CIF ID 12 19 1-SXD
Pressure (GPa) 1.296(8) 3.891(12)
Chemical formula C4H6O2 C4H6O2 C4H6O2
Mr 86.06 86.06 86.06
Radiation type Neutron Neutron X-ray, Mo-Kα
Phase III III III
Cell setting, space
group
Monoclinic, P21/n Monoclinic, P21/n Monoclinic, P21/n
Temperature (K) 293 293 293
a (Å) 3.6702(4) 3.4531(12) 3.6140 (7)
b (Å) 16.498(3) 16.124(11) 16.420 (3)
c (Å) 6.8167(10) 6.598(3) 6.773 (3)
β (°) 89.84(4) 89.22(5) 90.36 (3)
Volume (Å3) 412.77(11) 367.3(3) 401.91 (17)
D (g cm-1
) 1.385 1.557 1.423
Z 4 4 4
Rwp 5.520 7.168 R[F2 > 2σ(F
2)],
wR(F2), S
0.055, 0.047, 1.16
Periodic DFT calculations
Geometry optimisations were performed by periodic Density Functional Theory
(DFT) using the DMOL3 code
21 as part of the Materials Studio modelling suite.
22 The DNP
numerical basis set21
was used in combination with the PBE functional23
with the
Tkatchenko- Scheffler correction for dispersion.24
The unit cell dimensions were held fixed at
the values obtained in Pawley refinements of the neutron powder diffraction data described
above, and coordinates were allowed to optimise. Convergence was defined when the
maximum changes in total energy, displacement and gradient were 10-5
Ha, 5 x 10⁻³
Å and 2
x 10-3
Ha Å-1
, respectively. Brillouin zone integrations were performed by Monkhorst-Pack25
k-point sampling at intervals of 0.07 Å-1
.
Pixel calculations
Using the optimised structures from the DFT calculations, the lattice energies and
molecule-molecule interaction energies were calculated using Pixelc module in the CLP
package by Gavezotti.26-27
Electron densities were calculated at the MP2/6-31G** level
using Gaussian09.28
For these calculations the deuterium atoms were substituted by
hydrogen and normalized in Mercury 3.329
before submission to Pixel. Table ES2
provides the total lattice energy as well as the breakdown of intermolecular interactions
into Coulombic, electrostatic, dispersion and repulsion terms.
Results & discussion
The effect of pressure on methacrylic acid-d6
One aspect of our previous work that was overlooked was the fact that the conformation
of methacrylic acid changes whether it is crystallised at either low temperature or high
pressure (same polymorph). At low temperature the molecule exists in the trans
configuration, with respect to the ethylene and carbonyl moieties. Whereas if the same
polymorph is recrystallised by applying pressure the molecule adopts the cis
conformation; this is clearly indicated from the C-C bond lengths. Badawi et al. studied
the conformational changes in methacrylic acid and observed that at various levels of
theory (B3LYP/6-311G**, MP2/6-311G**) the energy difference between the cis and
trans conformers was, at most, ~3.5 kJ/mol.30
At both low temperature and under initial
high-pressure conditions methacrylic acid-d6 crystallises in Phase I, a monoclinic P21/c
with a stepped layered structure (viewed down the b-axis) where the molecules interact
through a carboxylic acid dimer interaction (Figure 1). As anticipated Pixel calculations
show that the dimer interaction is the most favourable at -60 kJ/mol with all components,
coulombic, polarisation and dispersion contributing significantly to the favourable nature
of the interaction. Note that the energies are calculated based on molecule-molecule
interactions and not just the dimer interaction hence there are other contributing features.
The next two interactions (Int. 2 and 3) are similar in energy but the contributions made
from each energetic term differs slightly (Figure 2). Interaction 2 is observed within a
staggered layer where the methylene group is in close proximity to the carbonyl groups of
the neighbouring dimer and the methyl group is situated close to the methylene group.
This is reflected in the similar energetic contributions from the coulombic and dispersive
terms. Interaction 3 is a ‘face-to-face’ interaction which leads to a large contribution from
the dispersive term. The molecules are stacked so that the carbonyl interactions are in a
parallel arrangement and are observed outside the 3.6 Å used as a cut-off by Allen et al.
in their work on carbonyl groups.31
The longer interaction length can be attributed to the
increased bulk of the methyl groups. The distribution of carbon-carbon distances in the
Cambridge Structural Database is found in Figure ES1.31
This ‘face-to-face’ interaction in
Phase I is significantly different from acrylic acid where the carbonyl groups interacted
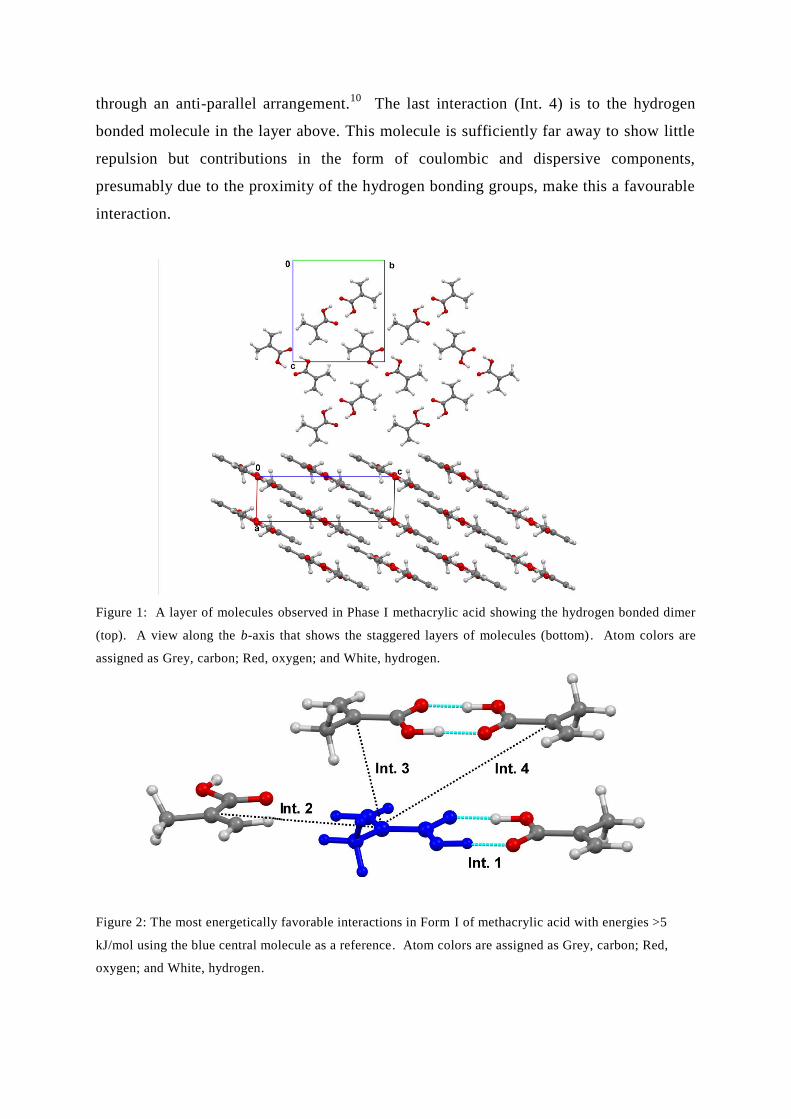
through an anti-parallel arrangement.10
The last interaction (Int. 4) is to the hydrogen
bonded molecule in the layer above. This molecule is sufficiently far away to show little
repulsion but contributions in the form of coulombic and dispersive components,
presumably due to the proximity of the hydrogen bonding groups, make this a favourable
interaction.
Figure 1: A layer of molecules observed in Phase I methacrylic acid showing the hydrogen bonded dimer
(top). A view along the b-axis that shows the staggered layers of molecules (bottom). Atom colors are
assigned as Grey, carbon; Red, oxygen; and White, hydrogen.
Figure 2: The most energetically favorable interactions in Form I of methacrylic acid with energies >5
kJ/mol using the blue central molecule as a reference. Atom colors are assigned as Grey, carbon; Red,
oxygen; and White, hydrogen.
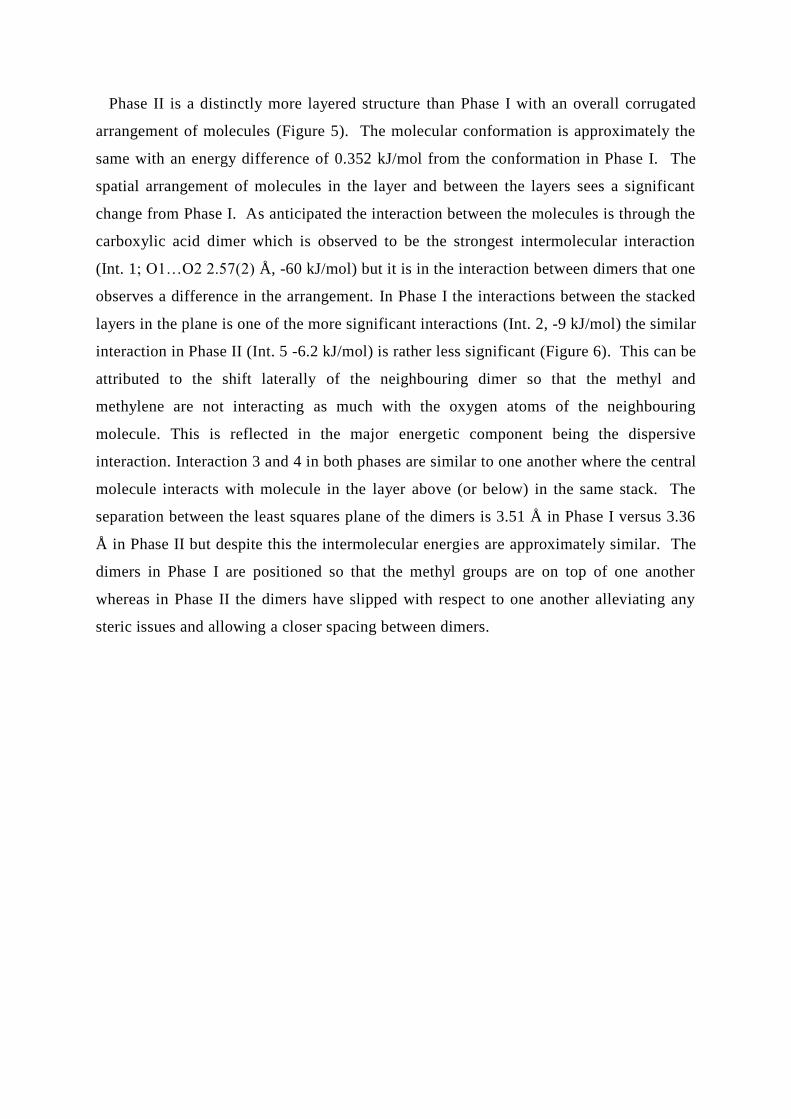
On compression to 0.39 GPa the unit cell parameters of Phase I compress by 2.3%, 1.5%
and 1.4% for the a-, b-, and c-axis, respectively, with the molecular volume reducing by
5% (Figure 3 & 4). This is a similar compression observed for acrylic acid to 0.69 GPa
(4.47%).10
At 0.39 GPa both Phase I and Phase II (identified from previous study at 0.64
GPa) were refined against the data and showed that Phase II is 1.4 % more dense. The I-
II phase transition was quite slow and had not completed by the time we increased the
pressure on the system (2hrs 40 mins; Figure ES2)); Figure ES3 shows the Rietveld fits
for both phases. The intensity of the Phase I patterns suggests that it would have
persisted for longer had we left it at this pressure but the kinetics of transformation were
not a key outcome for the experiment. As soon as pressure was increased to 0.53 GPa
any reminence of Phase I had gone. Phase II is observed at ~0.2 GPa lower than our
previous study.9 This can be accounted for by two factors i) the change in the ratio of
PTM to acid used in this study. Here we have used 20% PTM v/v as opposed to the 50%
v/v used previously9 which has altered the pressure at which the methacrylic acid is
precipitated out from solution; in this experiment it precipitated out at 0.12 GPa whereas
this occurred at 0.64 GPa in our previous study and ii) the addition of the silica glass (for
powder averaging) which provides nucleation points.
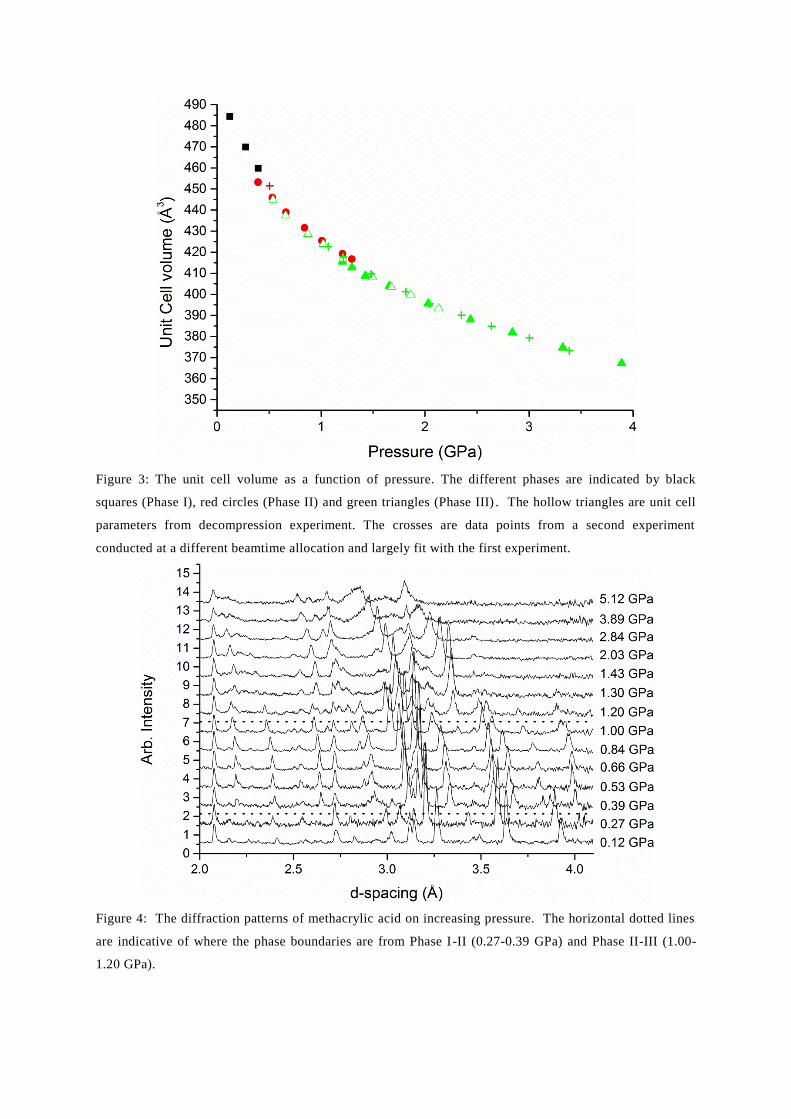
Figure 3: The unit cell volume as a function of pressure. The different phases are indicated by black
squares (Phase I), red circles (Phase II) and green triangles (Phase III) . The hollow triangles are unit cell
parameters from decompression experiment. The crosses are data points from a second experiment
conducted at a different beamtime allocation and largely fit with the first experiment.
Figure 4: The diffraction patterns of methacrylic acid on increasing pressure. The horizontal dotted lines
are indicative of where the phase boundaries are from Phase I-II (0.27-0.39 GPa) and Phase II-III (1.00-
1.20 GPa).
Phase II is a distinctly more layered structure than Phase I with an overall corrugated
arrangement of molecules (Figure 5). The molecular conformation is approximately the
same with an energy difference of 0.352 kJ/mol from the conformation in Phase I. The
spatial arrangement of molecules in the layer and between the layers sees a significant
change from Phase I. As anticipated the interaction between the molecules is through the
carboxylic acid dimer which is observed to be the strongest intermolecular interaction
(Int. 1; O1…O2 2.57(2) Å, -60 kJ/mol) but it is in the interaction between dimers that one
observes a difference in the arrangement. In Phase I the interactions between the stacked
layers in the plane is one of the more significant interactions (Int. 2, -9 kJ/mol) the similar
interaction in Phase II (Int. 5 -6.2 kJ/mol) is rather less significant (Figure 6). This can be
attributed to the shift laterally of the neighbouring dimer so that the methyl and
methylene are not interacting as much with the oxygen atoms of the neighbouring
molecule. This is reflected in the major energetic component being the dispersive
interaction. Interaction 3 and 4 in both phases are similar to one another where the central
molecule interacts with molecule in the layer above (or below) in the same stack. The
separation between the least squares plane of the dimers is 3.51 Å in Phase I versus 3.36
Å in Phase II but despite this the intermolecular energies are approximately similar. The
dimers in Phase I are positioned so that the methyl groups are on top of one another
whereas in Phase II the dimers have slipped with respect to one another alleviating any
steric issues and allowing a closer spacing between dimers.
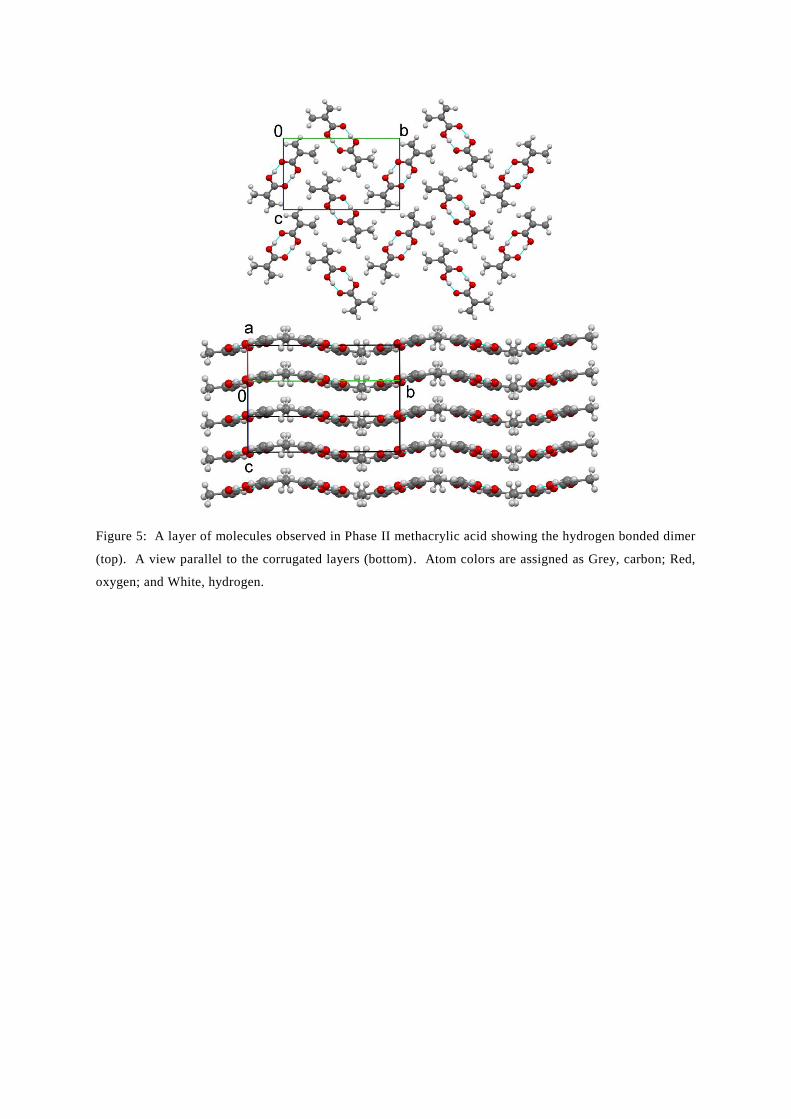
Figure 5: A layer of molecules observed in Phase II methacrylic acid showing the hydrogen bonded dimer
(top). A view parallel to the corrugated layers (bottom). Atom colors are assigned as Grey, carbon; Red,
oxygen; and White, hydrogen.
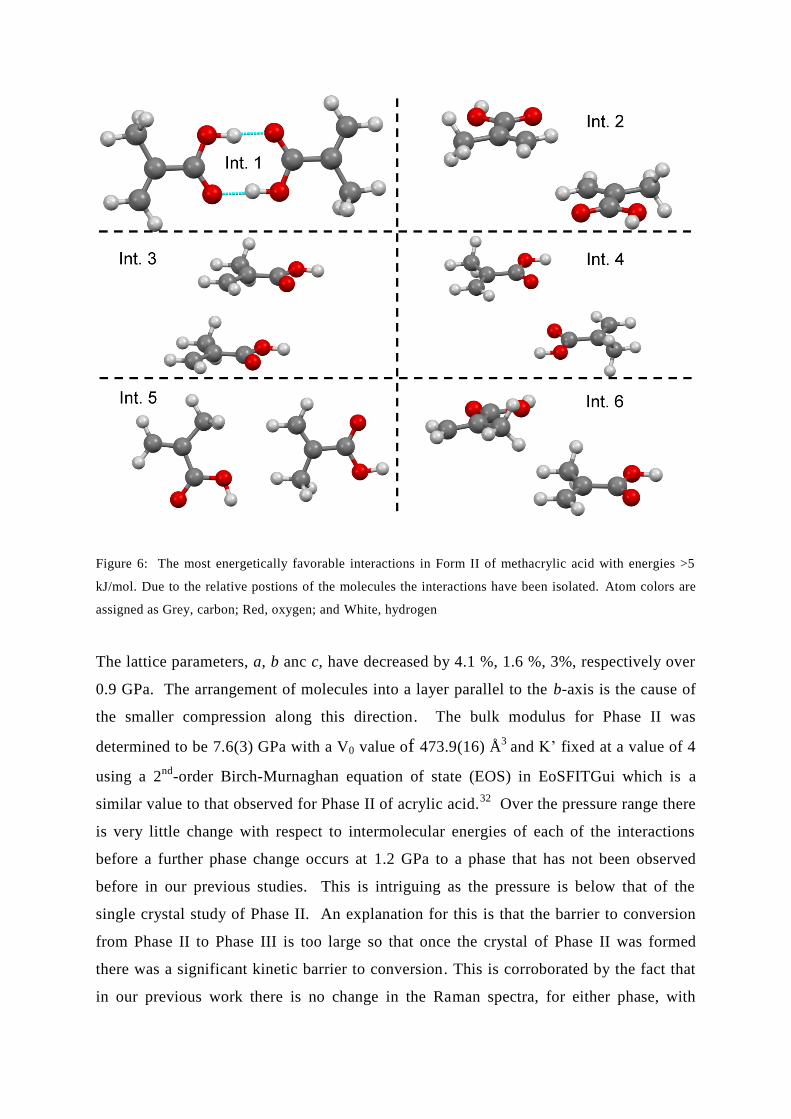
Figure 6: The most energetically favorable interactions in Form II of methacrylic acid with energies >5
kJ/mol. Due to the relative postions of the molecules the interactions have been isolated. Atom colors are
assigned as Grey, carbon; Red, oxygen; and White, hydrogen
The lattice parameters, a, b anc c, have decreased by 4.1 %, 1.6 %, 3%, respectively over
0.9 GPa. The arrangement of molecules into a layer parallel to the b-axis is the cause of
the smaller compression along this direction. The bulk modulus for Phase II was
determined to be 7.6(3) GPa with a V0 value of 473.9(16) Å3
and K’ fixed at a value of 4
using a 2nd
-order Birch-Murnaghan equation of state (EOS) in EoSFITGui which is a
similar value to that observed for Phase II of acrylic acid.32
Over the pressure range there
is very little change with respect to intermolecular energies of each of the interactions
before a further phase change occurs at 1.2 GPa to a phase that has not been observed
before in our previous studies. This is intriguing as the pressure is below that of the
single crystal study of Phase II. An explanation for this is that the barrier to conversion
from Phase II to Phase III is too large so that once the crystal of Phase II was formed
there was a significant kinetic barrier to conversion. This is corroborated by the fact that
in our previous work there is no change in the Raman spectra, for either phase, with
increasing pressure i.e. no I-II or II-III phase transitions were observed. We have
observed this in other samples, e.g. glycolide, where powdered material converts to a new
phase whilst the single crystal remains in the low pressure phase.33
Due to the sample environment and the lack of low angle reflections that are observed
the indexing of Phase III proved troublesome. To elucidate the structure of Phase III the
same solution was loaded into a DAC and compressed above 1.2 GPa to mimic the
neutron experiment. The sample was then left to anneal at approximetely 323 K for two
weeks. Over this time period a crystal of Phase III was grown that provided enough data
that could be deconvoluted from the multiple crystallites to solve and refine the new
structure. The new phase fits the neutron data very well (Figure ES2). The unit cell
parameters are a = 3.6140(7), b = 16.420(3), c = 6.773(3) Å, β = 90.36(3)°, with a
volume of 401.91(17) Å3. Phase III is observed to be in monoclinic P21/n with one
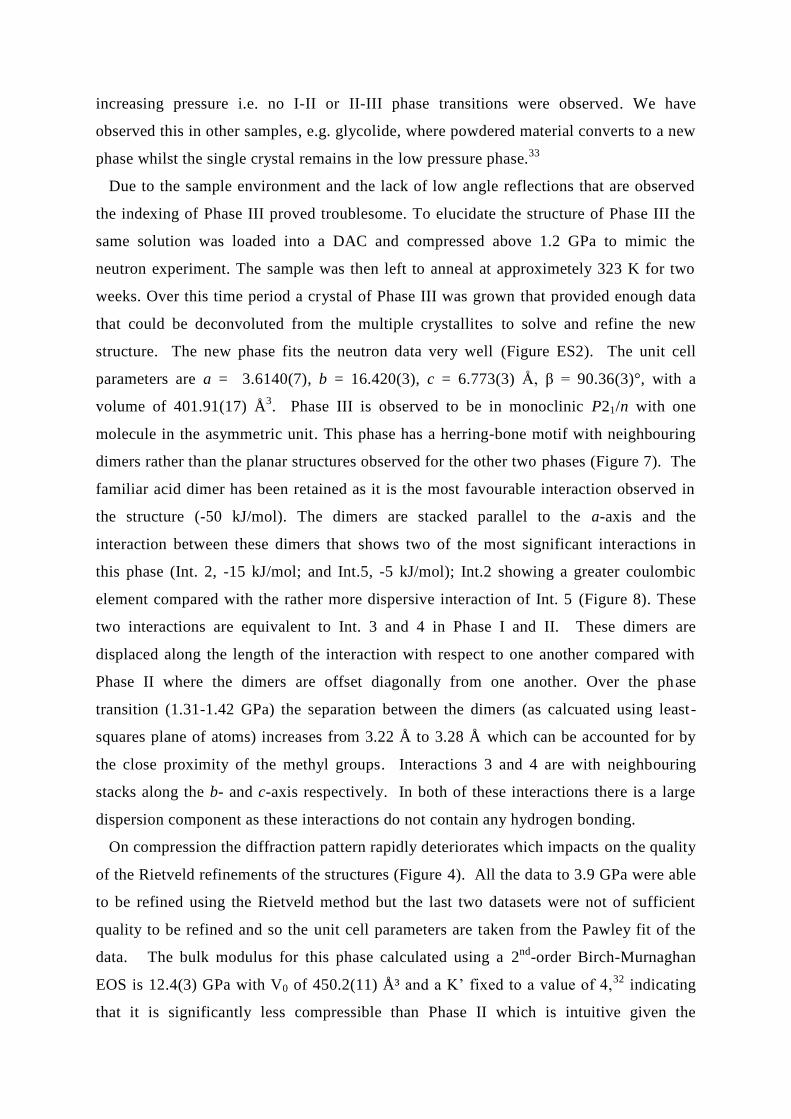
molecule in the asymmetric unit. This phase has a herring-bone motif with neighbouring
dimers rather than the planar structures observed for the other two phases (Figure 7). The
familiar acid dimer has been retained as it is the most favourable interaction observed in
the structure (-50 kJ/mol). The dimers are stacked parallel to the a-axis and the
interaction between these dimers that shows two of the most significant interactions in
this phase (Int. 2, -15 kJ/mol; and Int.5, -5 kJ/mol); Int.2 showing a greater coulombic
element compared with the rather more dispersive interaction of Int. 5 (Figure 8). These
two interactions are equivalent to Int. 3 and 4 in Phase I and II. These dimers are
displaced along the length of the interaction with respect to one another compared with
Phase II where the dimers are offset diagonally from one another. Over the phase
transition (1.31-1.42 GPa) the separation between the dimers (as calcuated using least-
squares plane of atoms) increases from 3.22 Å to 3.28 Å which can be accounted for by
the close proximity of the methyl groups. Interactions 3 and 4 are with neighbouring
stacks along the b- and c-axis respectively. In both of these interactions there is a large
dispersion component as these interactions do not contain any hydrogen bonding.
On compression the diffraction pattern rapidly deteriorates which impacts on the quality
of the Rietveld refinements of the structures (Figure 4). All the data to 3.9 GPa were able
to be refined using the Rietveld method but the last two datasets were not of sufficient
quality to be refined and so the unit cell parameters are taken from the Pawley fit of the
data. The bulk modulus for this phase calculated using a 2nd
-order Birch-Murnaghan
EOS is 12.4(3) GPa with V0 of 450.2(11) ų and a K’ fixed to a value of 4,32
indicating
that it is significantly less compressible than Phase II which is intuitive given the
observation at higher pressure.
On increasing pressure only two of the interaction show a distinct increase in the
energy, the acid dimer (Int. 1) and interaction 5 (above and below). These two terms
increase by approximately 10 kJ/mol over the course of the compression. Using the
geometry optimised values there is a 1.3% decrease in the hydrogen bond lengths from
1.42-3.89 GPa (2.581 Å O1…O2 at 1.42 GPa c.f 2.523 Å at 5.12 GPa). Whilst there is
an increase in the coulombic and polarisation terms (i.e. more favourable) these increases
are negated by the substantial rise in the repulsion term as the molecules are compressed
together. Comparing these data with that of the Cambridge Structural Database for the
distances between carbonyl carbon atoms across the dimer we see that the distances at
5.12 GPa are at the lower end of the distribution (Figure ES3) which may account for the
diffraction becoming worse due to increased repulsion. Other significant changes in
intermolecular energies is between the layers; there is a 7% reduction in the distance
between dimers as indicated by Int. 2 & 5 (from 3.270 Å at 1.43 GPa to 3.033 Å at 5.12
GPa). At 5.12 GPa Int. 5 is the most unfavourable interaction with a final energy value of
+7 kJ/mol where there has been a significant increases in the repulsive interaction. To
offset this change Int. 2 is decreasing over the course of the compression due to the
relatively small contribution of the repulsion term. The overall energy for the structure
has increased from -63 kJ/mol to -40 kJ/mol which will be a contributing factor to the
deterioration of the diffraction pattern.
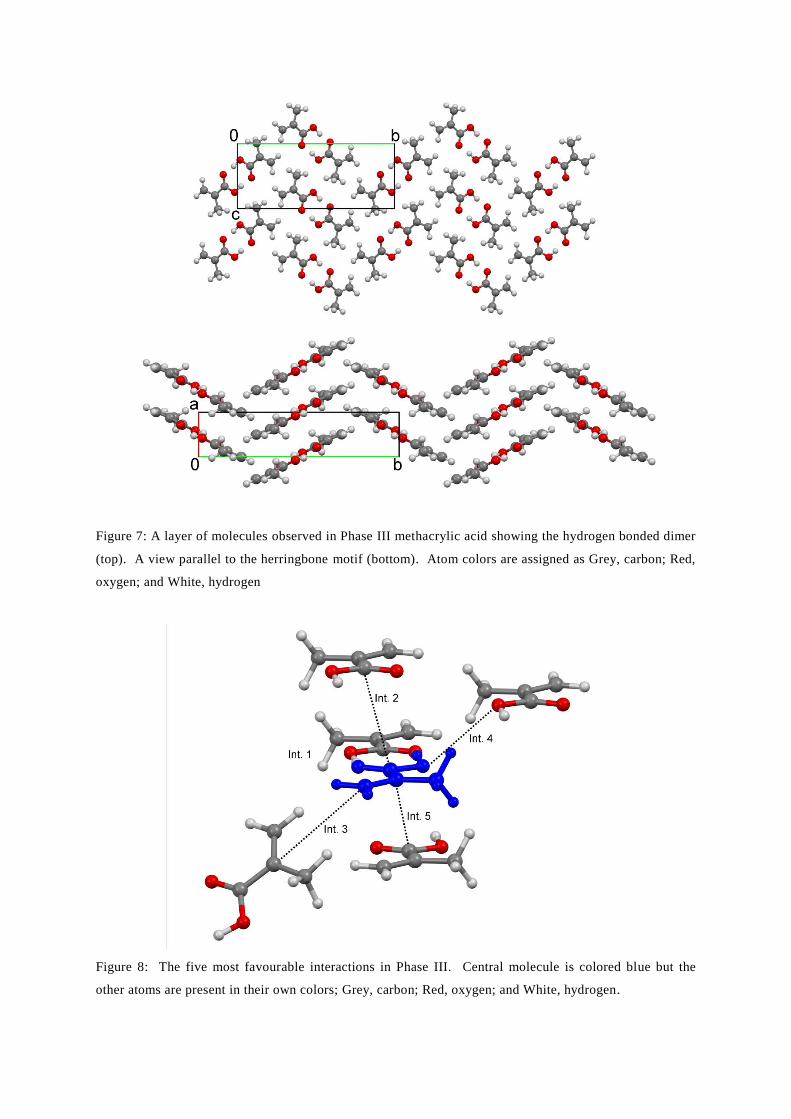
Figure 7: A layer of molecules observed in Phase III methacrylic acid showing the hydrogen bonded dimer
(top). A view parallel to the herringbone motif (bottom). Atom colors are assigned as Grey, carbon; Red,
oxygen; and White, hydrogen
Figure 8: The five most favourable interactions in Phase III. Central molecule is colored blue but the
other atoms are present in their own colors; Grey, carbon; Red, oxygen; and White, hydrogen.
At 5.08 GPa the diffraction pattern had deteriorated and so the behaviour on
decompression was explored. The release of pressure is a little less controlled but a
number of data points were collected and fitted using the Phase III unit cell parameters;
these are designated by hollow green triangles in Figure 3. On decompression Phase III
persists to 0.54 GPa before converting directly to Phase I. The Phase III pattern is
dominated by two peaks at ~3 and ~3.4 Å with an undefined number of peaks between
them. Only on decompression did the pattern resolve itself so that a number of
reflections could be observed between these two main peaks but even with these
reflections visible indexing and solution of Phase III was impossible. Phase III was only
identified via single crystal X-ray diffraction methods (Figure ES4). Rietveld refinements
of methacrylic acid-d6 after the compression was possible and showed that the proportion
of the pattern attributeable to the methacrylic acid had decreased substantially compared
with the patterns at the beginning of the experiment using the fluorite as the internal
standard (64% to 17%). There was approximately 50% by weight of material that did not
contribute to the diffraction pattern which we assume to be polymer. Previous work on
methacrylic acid-h6 produced a polymer on decompression from ~8 GPa and so it is likely
that this will have occurred in this sample too.9
Raman measurements of polymer from methacrylic acid-h6 compression
To equate this work with the literature analysis of the polymer produced from the –h6
material Raman spectroscopy was performed. A note worth mentioning at this point is
that we have been able to polymerise methacrylic acid by the sole use of pressure; it
occurs even if we pressurize without any irradiation (e.g. by laser, X-ray, neutron
radiation etc.). In previous literature by Koenig et al. they created polymethacrylic acid
via 10 Mrads of radiation using cobalt-60 γ-radiation which means that pressure is a safer
method of synthesis.12
The polymer shows a number of similar bands to those found in
the literature as shown in Figure 9 with a few notable changes that correspond to free acid
despite the polymer being left for a period of time and dried out. At 770 and 805 cm-1
there is a doublet of peaks where there is only one peak found in previous literature with
the assignment attributed to the C1-C2 stretch. The 805 cm-1
peak is at a typical range for
the free methacrylic acid liquid. Both the ambient and high-pressure polymer have a
distinct peak at ~1448 cm-1
which was assigned to the CH2 group but in addition the
pressure-induced polymer has a second peak at 1406 cm-1
(CH2 deformation) which is
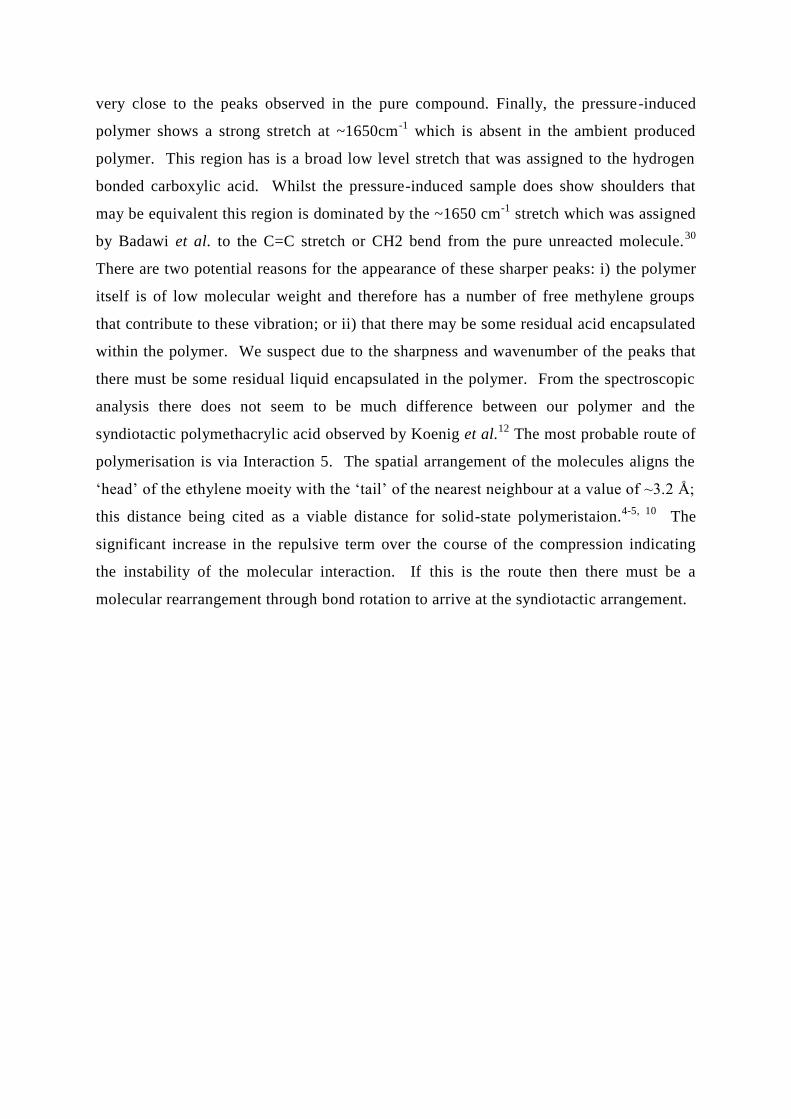
very close to the peaks observed in the pure compound. Finally, the pressure-induced
polymer shows a strong stretch at ~1650cm-1
which is absent in the ambient produced
polymer. This region has is a broad low level stretch that was assigned to the hydrogen
bonded carboxylic acid. Whilst the pressure-induced sample does show shoulders that
may be equivalent this region is dominated by the ~1650 cm-1
stretch which was assigned
by Badawi et al. to the C=C stretch or CH2 bend from the pure unreacted molecule.30
There are two potential reasons for the appearance of these sharper peaks: i) the polymer
itself is of low molecular weight and therefore has a number of free methylene groups
that contribute to these vibration; or ii) that there may be some residual acid encapsulated
within the polymer. We suspect due to the sharpness and wavenumber of the peaks that
there must be some residual liquid encapsulated in the polymer. From the spectroscopic
analysis there does not seem to be much difference between our polymer and the
syndiotactic polymethacrylic acid observed by Koenig et al.12
The most probable route of
polymerisation is via Interaction 5. The spatial arrangement of the molecules aligns the
‘head’ of the ethylene moeity with the ‘tail’ of the nearest neighbour at a value of ~3.2 Å;
this distance being cited as a viable distance for solid-state polymeristaion.4-5, 10
The
significant increase in the repulsive term over the course of the compression indicating
the instability of the molecular interaction. If this is the route then there must be a
molecular rearrangement through bond rotation to arrive at the syndiotactic arrangement.
Figure 9: A selected portion of the Raman spectra for the pressure synthesised polymer (PMAA, above)
and pure methacrylic acid (MA, bottom).
Conclusions
We have confirmed that the methacrylic acid-d6 undergoes two polymorphic transitions at
0.39 and 1.20 GPa. The first of these transitions is between two known phases but the second
transition is to a new polymorphic form that has been characterised as part of this study.
Diffraction from Phase III deteriorates rapidly but can still be refined as a molecular form.
Phase III persists on decompression to 0.54 GPa before transforming to Phase I. The
proportion of crystalline methacrylic acid as decreased substantially from 64 wt% to 17 wt%
with approximately 50% weight that is not giving rise to diffraction; we believe this to be the
polymer product. Pressure has been shown to be a novel route to the production of polymers
where other routes have used significant doses of γ-radiation.
Acknowledgements
The authors would like to thank Craig Bull for technical assistance in the preparation of this
manuscript. Experiments at the ISIS Pulsed Neutron and Muon Source were supported by a
beamtime allocation from the Science and Technology Facilities Council (RB1110228 &
RB1310267). The authors would also like to thank Ian Hutchison and Amit Delori for their
assistance on beamtime and The Leverhulme Trust for funding RPG-2012-598.
Supporting Information Available
Information relating to the experimental methods of Raman, IR, DSC and Cambridge Structural
Database searches can be found in the SI. Figures of the powder neutron diffraction, IR and DSC are
shown. Tabulated information of the full crystallographic information and Pixel energies are also
presented. This information is available free of charge via the Internet at http://pubs.acs.org.
References
1. Bini, R.; Ceppatelli, M.; Citroni, M.; Schettino, V. From Simple to Complex and Backwards. Chemical Reactions under Very High Pressure. Chem Phys 2012, 398, 262-268. 2. Chelazzi, D.; Ceppatelli, M.; Santoro, M.; Bini, R.; Schettino, V. Pressure-Induced Polymerization in Solid Ethylene. J Phys Chem B 2005, 109 (46), 21658-21663. 3. Ciabini, L.; Santoro, M.; Bini, R.; Schettino, V. High Pressure Reactivity of Solid Benzene Probed by Infrared Spectroscopy. J. Chem. Phys. 2002, 116 (7), 2928-2935. 4. Jin, H. J.; Plonka, A. M.; Parise, J. B.; Goroff, N. S. Pressure Induced Topochemical Polymerization of Diiodobutadiyne: a Single-Crystal-to-Single-Crystal Transformation. Crystengcomm 2013, 15 (16), 3106-3110. 5. Wilhelm, C.; Boyd, S. A.; Chawda, S.; Fowler, F. W.; Goroff, N. S.; Halada, G. P.; Grey, C. P.; Lauher, J. W.; Luo, L.; Martin, C. D., et al. Pressure-Induced Polymerization of Diiodobutadiyne in Assembled Cocrystals. J Am Chem Soc 2008, 130 (13), 4415-4420. 6. Santoro, M.; Gorelli, F. A.; Bini, R.; Ruocco, G.; Scandolo, S.; Crichton, W. A. Amorphous Silica-Like Carbon Dioxide. Nature 2006, 441 (7095), 857-860. 7. Ceppatelli, M.; Frediani, M.; Bini, R. High-Pressure Reactivity of L,L-Lactide. J Phys Chem B 2011, 115 (10), 2173-2184. 8. Murli, C.; Mishra, A. K.; Thomas, S.; Sharma, S. M. Ring-Opening Polymerization in Carnosine under Pressure. J Phys Chem B 2012, 116 (15), 4671-4676. 9. Oswald, I. D. H.; Urquhart, A. J. Polymorphism and Polymerisation of Acrylic and Methacrylic Acid at High Pressure. Crystengcomm 2011, 13 (14), 4503-4507. 10. Johnston, B. F.; Marshall, W. G.; Parsons, S.; Urquhart, A. J.; Oswald, I. D. H. Investigation of Acrylic Acid at High Pressure Using Neutron Diffraction. J Phys Chem B 2014, 118 (14), 4044-4051. 11. Oswald, I. D. H.; Crichton, W. A. Structural Similarities of 2-chlorophenol and 2-methylphenol. Crystengcomm 2009, 11 (3), 463-469. 12. Koenig, J. L.; Angood, A. C.; Semen, J.; Lando, J. B. Laser-excited Raman Studies of the Conformational Transition of Syndiotactic Polymethacrylic Acid in Water. J Am Chem Soc 1969, 91 (26), 7250-7254. 13. ISIS_Dedicated_Facility_for_High_Pressure_Diffraction ISIS 96-ISIS Facility Annual Report 1995–96; Rutherford Appleton Laboratory: 1996; pp 61–62. 14. ISIS_PEARL_Pressure_and_Engineering_Research_Line ISIS 97 - ISIS Facility Annual Report 1996-97; Rutherford Appleton Laboratory: 1997; pp 28-29. 15. Besson, J. M.; Nelmes, R. J.; Hamel, G.; Loveday, J. S.; Weill, G.; Hull, S. Neutron Powder Diffraction above 10-Gpa. Physica B 1992, 180, 907-910. 16. Funnell, N. P.; Marshall, W. G.; Parsons, S. Alanine at 13.6 GPa and its Pressure-Induced Amorphisation at 15 GPa. Crystengcomm 2011, 13 (19), 5841-5848. 17. Marshall, W. G.; Francis, D. J. Attainment of Near-Hydrostatic Compression Conditions using the Paris-Edinburgh Cell. J Appl Crystallogr 2002, 35, 122-125.
18. Angel, R. J. The High-Pressure, High-Temperature Equation of State of Calcium Fluoride, CaF2. J. Phys.-Condes. Matter 1993, 5 (11), L141-L144. 19. Coelho, A. TOPAS – Academic: General Profile and Structure Analysis Software for Powder Diffraction Data, Version 5; 2012. 20. Funnell, N. P.; Dawson, A.; Marshall, W. G.; Parsons, S. Destabilisation of Hydrogen Bonding and the Phase Stability of Aniline at High Pressure. Crystengcomm 2013, 15 (6), 1047-1060. 21. Delley, B. An All-Electron Numerical-Method for Solving the Local Density Functional for Polyatomic-Molecules. J Chem Phys 1990, 92 (1), 508-517. 22. Accelrys_Software_Inc, In Materials Studio Release Notes, Release 6, San Diego, 2011. 23. Perdew, J. P.; Chevary, J. A.; Vosko, S. H.; Jackson, K. A.; Pederson, M. R.; Singh, D. J.; Fiolhais, C. Atoms, Molecules, Soilds, and Surfaces- Applications of the Generalized Gradient Approximation for Exchange and Correlation. Phys Rev B Condens Matter 1992, 46 (11), 6671-6687. 24. Tkatchenko, A.; Scheffler, M. Accurate Molecular Van Der Waals Interactions from Ground-State Electron Density and Free-Atom Reference Data. Phys Rev Lett 2009, 102 (7), 073005. 25. Monkhorst, H. J.; Pack, J. D. Special Points for Brillouin-Zone Integrations. Phys Rev B 1976, 13 (12), 5188-5192. 26. Gavezzotti, A. Non-Conventional Bonding between Organic Molecules. The 'Halogen Bond' in Crystalline Systems. Mol Phys 2008, 106 (12-13), 1473-1485. 27. Gavezzotti, A. Calculation of Intermolecular Interaction Energies by Direct Numerical Integration over Electron Densities. 2. An Improved Polarization Model and the Evaluation of Dispersion and Repulsion Energies. J Phys Chem B 2003, 107 (10), 2344-2353. 28. Frisch, M. J.; Trucks, G. W.; Schlegel, H. B.; Scuseria, G. E.; Robb, M. A.; Cheeseman, J. R.; Scalmani, G.; Barone, V.; Mennucci, B.; Petersson, G. A., et al., Gaussian 09, Revision B.01. Wallingford CT, 2009. 29. Macrae, C. F.; Bruno, I. J.; Chisholm, J. A.; Edgington, P. R.; McCabe, P.; Pidcock, E.; Rodriguez-Monge, L.; Taylor, R.; van de Streek, J.; Wood, P. A. Mercury CSD 2.0 - New Features for the Visualization and Investigation of Crystal Structures. J Appl Crystallogr 2008, 41 (2), 466-470. 30. Badawi, H. M.; Al-Khaldi, M. A. A.; Al-Abbad, S. S. A.; Al-Sunaidi, Z. H. A. Rotational Barriers in Monomeric CH2CX–COOH and CH2CX–CONH2 (X is H or CH3) and Vibrational Analysis of Methacrylic Acid and Methacrylamide. Spectrochim. Acta, Part A 2007, 68 (3), 432-442. 31. Allen, F. H.; Baalham, C. A.; Lommerse, J. P. M.; Raithby, P. R. Carbonyl -Carbonyl Interactions can be Competitive with Hydrogen Bonds. Acta Crystallogr. B 1998, 54, 320-329. 32. Angel Ross, J.; Alvaro, M.; Gonzalez-Platas, J., EosFit7c and a Fortran Module (Library) for Equation of State Calculations. In Zeitschrift für Kristallographie - Crystalline Materials, 2014; Vol. 229, p 405. 33. Hutchison, I. B.; Delori, A.; Wang, X.; Kamenev, K. V.; Urquhart, A. J.; Oswald, I. D. H. Polymorphism of a Polymer Precursor: Metastable Glycolide Polymorph Recovered via Large Scale High-Pressure Experiments. Crystengcomm 2015, 17 (8), 1778-1782.

Keywords: Methacrylic acid, Pressure, Reconstructive phase transition, Polymerisation,
Pixel,
TOC


![Kinetics of esterification of methacrylic acid with a mixture of ... presence of acid catex functioning as a catalyst has been described in literature [3]. The esterification of MAC](https://img.pdfslide.us/doc/110x75/5f1d1605c1f9f0066a505b26/kinetics-of-esterification-of-methacrylic-acid-with-a-mixture-of-presence-of.jpg)